Abstract
We present a bibliometric analysis of unmanned aerial vehicle (UAV) research that replaces simple keyword filtering with a context-aware, two-tier pipeline. Records from Web of Science and Scopus (198,152 total) were harmonized and de-duplicated in three stages (DOI, normalized title, blockwise Jaro–Winkler), yielding 129,124 unique items. To separate UAV work from entomology using overlapping vocabulary (e.g., swarm), we first applied rule-based weak labels with explicit UAV and insect regex families and a UAV context rule for “swarm,” then trained an elastic-net logistic regression on TF–IDF features and tuned the decision threshold to meet a high-precision target on a held-out split. The final corpus comprises 129,099 UAV records. Beyond lexical inventories, a keyword co-occurrence timeline shows reinforcement learning increasingly aligned with path planning and collision avoidance, while constraints such as energy and communication persist. A co-authorship network reveals bridging authors that connect guidance/control, perception, and communication subfields. The results show how UAV research is organized around central scientific problems and identify persistent obstacles such as energy efficiency, communication reliability, and robust decision-making in dynamic conditions.
1. Introduction
Unmanned Aerial Vehicles (UAVs), initially designed for military and defense missions, have undergone rapid technological development in recent decades, and their applications have become increasingly widespread. Due to advances in sensor technology, artificial intelligence, and battery efficiency, UAVs are more accessible and versatile nowadays. Thus, naturally, UAVs—commonly known as drones—are now used in a number of civilian sectors, including agriculture [1,2,3], environmental monitoring [4,5,6,7], disaster management [8,9], logistics [10,11], and even entertainment [12].
With the spread of UAV use, the number of studies conducted in various fields has also increased significantly [13,14,15]. Various studies address regulatory challenges and innovative applications in topics such as the design, development, and optimization of UAV navigation systems [16,17,18]. Interdisciplinary studies also examine topics such as the social and economic impacts of UAVs [19,20,21].
Given the wide range of UAV applications, it is crucial to stay up-to-date on the latest trends and developments in the field. Therefore, an analysis of the existing literature is necessary to provide a comprehensive overview and identify key areas of focus. In this study, we perform a bibliometric analysis to map the research on UAVs. Our goal is to identify both past and emerging trends in the field and to highlight key contributors (countries, institutions, and authors). For this, the following two databases were used to extract relevant research articles: Web of Science and Scopus. Data are analyzed using the bibliometrix package in the statistical program R (version 4.3.2) [22], with the objective of understanding publication patterns, citation dynamics, and research impact. The results are presented through visualizations, such as keyword co-occurrence maps and citation trends, to offer an understanding of the UAV studies.
Understanding the development and trajectory of UAV research is crucial for several reasons: for example, to support researchers in identifying gaps in the current knowledge base or for funding agencies to prioritize investment areas. The results can also help policy-makers design regulations that promote innovation while ensuring security and privacy. In addition, this bibliometric analysis can provide directions for fundamental works and key contributors.
The paper is structured as follows: Section 2 presents a brief history of UAVs and their applications. The research questions are shown in Section 3. In Section 4, the materials and methodology are detailed, followed by the presentation of the results in Section 5, which includes publication trends, citation analysis, and collaboration patterns. Section 6 interprets the findings in the context of broader research trends and implications for future studies. Finally, in Section 7, a summary of key insights and recommendations is concluded in the field of UAVs.
2. The History of UAVs and Their Applications
The history of UAVs provides fundamental knowledge about the development of UAV technology, highlighting the most important innovations and milestones that have shaped this field. This historical context helps identify technological and research trends, illustrating shifts in focus and advancements over time. It also highlights past challenges and the innovative solutions that addressed them and provides information on current methods and technologies.
UAVs have a long history of development, reflecting important advances in both military and civilian applications. The origins of drone technology date back to World War I, when the concept of unmanned flight was first explored. The first drone was the Kettering Bug, an experimental aerial torpedo developed by the United States in 1918. Although some tests were successful, it was never used for combat purposes. Nevertheless, the Kettering Bug marked the beginning of UAVs [23,24].
During World War II, the Radioplane OQ-2 was created, which was the first mass-produced UAV [25]. It was used for target practice by the US military. This UAV can be considered an important milestone, as it demonstrated the practical application of UAVs in military training. Further advancements in drone technology were made during the Cold War era, mainly in reconnaissance missions. The Lockheed D-21 was developed in the 1960s and was one of the first high-speed, high-altitude reconnaissance drones used by the United States. The Ryan Firebee also appeared during this period and was a versatile drone used for both reconnaissance and target practice [26,27].
The modern era of UAVs began in the late 20th century, when more sophisticated and versatile models appeared. In the 1990s and early 2000s, the US expanded its drone capabilities with the development of the MQ-1 Predator. It was originally designed for reconnaissance, but later became armed with missiles [28]. The deployment of the MQ-9 Reaper marked a new level of drone warfare—it is larger and more capable than the Predator, designed for long-endurance surveillance and armed strike missions [29].
However, today UAVs can also be used for civilian purposes. Civilian applications of drone technology have grown significantly in the past two decades. UAVs have quickly become important tools in a number of civilian sectors, including agriculture, environmental monitoring, emergency response, and delivery services. In agriculture, they can be utilized for precision farming. Equipped with multispectral or hyperspectral cameras, drones enable farmers to monitor crop health, assess soil conditions, and manage irrigation with unprecedented efficiency. These UAVs can cover large areas quickly since they can provide high-resolution data that helps optimize crop yields and reduce costs. Empirical studies demonstrate that drones can greatly improve the accuracy of crop monitoring and aid in agricultural decision-making [30].
In environmental monitoring and conservation efforts, UAVs are used to survey wildlife populations, track animal migrations, and monitor deforestation and habitat destruction. The ability to capture real-time data from hard-to-reach areas makes UAVs important for researchers and conservationists. For example, drones have been used to monitor orangutan populations in Borneo, providing critical data to support conservation strategies [31].
In disaster response and management, UAVs can offer rapid assessment capabilities by delivering real-time images and data to rescue teams. They can access areas that are difficult or dangerous for humans to reach during natural disasters. In disaster response, UAVs can be quickly deployed to assess damage, locate survivors, and deliver necessary supplies, even in areas that are too dangerous or inaccessible for human rescue teams [32].
UAVs can also be used for infrastructure inspection and maintenance [33]. They can be advantageous for commercial package delivery in remote or congested urban areas where traditional delivery methods are inefficient. Recent research highlights the potential of UAVs to transform logistics by enabling faster and more flexible delivery services [34].
The film and photography industries also use UAVs. Drones equipped with high-resolution cameras can take aerial photographs that previously required expensive helicopter rentals, making aerial photography accessible to amateur filmmakers and photographers [35,36].
Overall, civilian use of UAVs continues to expand, driven by technological advances and growing recognition of their practical benefits. As the technology becomes more sophisticated, the potential applications of drones in civilian life are also likely to increase, offering innovative solutions to a number of challenges. Therefore, as UAVs are used in more and more areas, it is critical to assess the direction in which such research is heading.
3. Research Questions
In order to assess research directions regarding UAV studies, a bibliometric analysis was performed. For the analysis, the following five research questions (RQs) were formed:
- RQ1: How does the trend of UAV research studies change over the years?
- RQ2: Which countries, institutions, and authors contribute the most to the field of UAV research?
- RQ3: Which countries, institutions, and authors collaborate with each other in UAV research?
- RQ4: What main themes can be found in studies about UAVs?
- RQ5: What are the most frequent words in research about UAVs?
Answering these five research questions will help us understand the bibliometric trends in UAV research. Therefore, the purpose of these research questions is as follows: The first research question aims to examine the development of the UAV literature over the years. This will allow us to understand certain patterns in the number of UAV research studies. These temporal patterns can help us understand changes in interest and attention toward UAVs. The second research question aims to identify the geographical distribution of institutions and authors involved in UAV research. By understanding the origin of published articles, we can determine the global significance and concentration of research activities related to UAVs. Additionally, clusters of expertise and collaboration networks can also be explored in this area. With the third research question, our aim is to investigate the patterns of collaboration among countries, institutions, and authors that focus on such research. Answering this research question can facilitate knowledge exchange and the formation of research networks. Regarding the fourth research question, our goal is to identify common topics, themes, and concepts present in research papers. By examining keywords, titles, and abstracts, we can understand the range of topics discussed. This can provide information about the focus areas of the field. Finally, with regard to the fifth research question, we aim to identify the most frequent words, expressions, or terms in the studies. This answer can help in understanding the terminology used when discussing UAVs.
4. Materials and Methods
The following two subsections describe the materials and methods used in this study. In Section 4.1, the data collection as well as the preprocessing are detailed from the two scientific databases mentioned earlier. Then, in Section 4.2, the analysis of the collected records is presented.
4.1. Data Collection and Preprocessing
As mentioned in the introduction, we used two scientific databases to search for bibliographic records: Web of Science (WoS) and Scopus. Data collection took place on 28 June 2024. We used the following search terms:
“Unmanned Aerial Vehicle” OR “UAV” OR “Drone” OR
“Unmanned Aircraft System” OR “UAS” OR “Remotely Piloted Aircraft” OR
“Quadcopter” OR “Multirotor” OR “Flying Robot”
We used this query to search for titles, abstracts, author keywords, and additional keywords in both scientific databases. We did not specify a time interval. After the query, we initially found 51,997 WoS records and 146,155 Scopus records. Therefore, a total of 198,152 raw items were retrieved. These raw exports were imported into the R program using the bibliometrix package [22]. This package was chosen since it is widely used in bibliometric analysis in research [37,38,39,40,41,42,43,44,45]. Using it, a bibliometrix schema was created (i.e., fields such as TI, AB, DE/ID, SO, PY, DI, C1, TC, AU). Afterward, they were harmonized into a single data frame with snake_case names (title, abstract, keywords, source, year, doi, affiliations, citations). Titles, abstracts, and author keywords were concatenated for text mining while preserving the original fields.
As the next step, we removed duplicates in three stages. First, we merged records with the same DOI into a single representative record. Second, we performed an exact matching on the normalized titles, while keeping one record for each identical . Third, we applied blockwise fuzzy matching based on the Jaro–Winkler distance () within blocks formed by the publication year and the first k characters of (with ) [46]. We marked pairs if , with . Blocking avoids comparisons and reduces false merges. After removing duplicates, 129,124 unique records remained.
Although our explicit search terms do not include the word “swarm”, records related to insects may still be included due to the ambiguity of the word drone (male bee) in titles/abstracts and the index/author keywords provided by the database which link the word swarm to entomological items. To reliably separate UAV-related records from insect-related ones, we applied a two-stage procedure. We first constructed regular expression families that capture unambiguous contexts:
- : UAV-specific terms (e.g., drone(s), uav(s), quadrotor/quadcopter, aerial robot, formation control);
- : entomological terms (e.g., bee, honeybee, wasp, pollination).
Then, we combined the explicit and regular expression families with a UAV context rule for the word swarm () and a finely tuned classifier, removing insect-related noise while retaining articles related to UAV swarm/coordination.
- : flight- and control-related terms (e.g., flight, aerial, airborne, multi-agent, planner/controller, cooperative, communication link, antenna).
For labeling, let denote the concatenation of the title, abstract, and keywords of the record i. Weak labels were assigned as follows (Equation (1)):
This strict rule-based pre-labeling step yielded 128,148 positive (UAV) and 25 negative (insect) records, while 951 items remained unlabeled.
The unlabeled set was then resolved using a logistic regression classifier with elastic-net regularization (implemented via the glmnet package [47]). The model was trained on high-confidence weak labels with unigram TF-IDF features:
where N is the number of documents and is the document frequency of token t for document d. With sparse vectors , the optimization problem is (Equation (3))
where , , and are cross-validated (default ). Training was performed on a balanced sample for scalability, and the full corpus was scored in batches.
The decision threshold was selected to meet a predefined precision target on a held-out validation split (Equation (4)):
The final labels were assigned as . Borderline cases () were manually inspected to prevent leakage of insect-related articles and to retain relevant multi-UAV research.
Among the previously unlabeled records, the classifier identified 951 additional UAV publications. The final dataset therefore comprises 129,099 UAV-related (positive) and 25 non-UAV (negative) records, forming a reliable corpus for subsequent trend, topic, and network analyses.
In summary, the PRISMA 2020-like flow was as follows:
- 198,152 for the merged raw corpus;
- 129,124 after the de-duplication;
- 128,148 (positive), 25 (negative), and 951 (unlabeled) after the rule-based method;
- 951 were model-positive among the unlabeled records;
- 129,099 were in the final UAV dataset.
As the database indexing for the past calendar year is incomplete, the time series data for the past year are marked as partial and trends are interpreted accordingly.
4.2. Data Analysis
To understand the bibliometric trends and their evolution, we analyze the co-occurrence of keywords and co-authorship networks. Each record adds a unique set of keywords; the co-occurring pairs accumulate an edge weight, resulting in a global network. We calculated a degree-weighted score for each year.
We then extract the most important topics of each year, which reveal how methods (e.g., reinforcement learning) fit into the fundamental problems of UAVs (e.g., path planning between dynamic obstacles, collision avoidance, energy and communication constraints) and how these relationships evolve over time. To facilitate collaboration, we build an undirected co-author network from author pairs within records and identify bridging actors based on their betweenness centrality, thereby operationalizing “close alliances” and hub structures.
The performance of countries may reflect the size of their population; therefore, we report per capita indicators (using publicly available population data). The importance of a location is measured by a focus index, which represents the proportion of UAV-related articles out of all publications appearing in a location during the study period.
For the linkage analysis, only abstracts (excluding title text) were considered, and strict dictionaries were used to minimize false positives. Reinforcement learning (RL) studies were identified based on the terms “reinforcement learning” and “deep reinforcement learning”; terms consisting solely of abbreviations (e.g., PPO, DDPG, SAC) were not considered. With broader specifications (title + abstract, abbreviations allowed), the number of selected RL studies increases. This expansion slightly increases the proportion of articles dealing with communication and collaboration, but our main conclusions remain unchanged.
To avoid trivial saturation—i.e., the artificial result that the ratio will be equal if both the numerator and denominator come exclusively from the UAV-specific corpus—we determine the denominator using an external reference dataset covering all topics. Specifically, for all research areas, we obtained site-level numbers from OpenAlex [48,49]. For each venue v, and limited to the time period corresponding to our study, we calculate the estimated site focus as
This mixed-source ratio provides useful information for ranking based on UAV concentration but cannot be considered a strictly “true” ratio. The numerator comes from our cleaned WoS and Scopus UAV corpus, while the denominator uses aggregated data from OpenAlex. The figures therefore assume comparable coverage and the same publication period.
To implement this measure, we normalized the names of locations appearing in bibliographic fields (e.g., SO/SRCTITLE) and assigned them to OpenAlex source identifiers. For each mapped location, we retrieved the total number of works published on all research topics in the same year range, grouped and summed by year of publication. We linked these total numbers to the UAV-positive numbers to calculate the value. To reduce noise due to the small sample size, we limited the analysis to locations with at least 100 UAV-positive records in our corpus. When matching locations, ISSN-/eISSN-based resolution was given priority; name-based alignment with serial-level normalization (removing year or serial number markers) was only applied when ISSNs were not available, using a strict similarity threshold (Jaro–Winkler: ≥0.92). Locations where the external denominator covering all topics was smaller than our UAV count were excluded, as such inconsistencies indicate mapping errors. Thus, reflects not only UAV-related hits, but also the relative concentration of UAV-related works in the overall publication output of the website during the same years and thus serves as a normalized indicator of venue-level thematic specialization.
5. Results
5.1. RQ1: How Does the Trend of UAV Research Studies Change over the Years?
The final UAV series spans 1955–2024 (2024 is partial). The distribution of publication years is strongly skewed toward the recent past: the first quartile is 2017, the median is 2020, and the third quartile is 2022. Consequently, 58.18% of all UAV papers were published in 2020 or later, and the same 58.18% fall within the 2020–2024 window in our corpus. The annual series peaks in 2023 with 19,975 papers; 2024 contains 9540 items as indexed to our cut-off; and 2024 is explicitly marked as partial. These distributional landmarks motivate the use of robust impact summaries and a conservative interpretation of tail-year fluctuations (Figure 1).
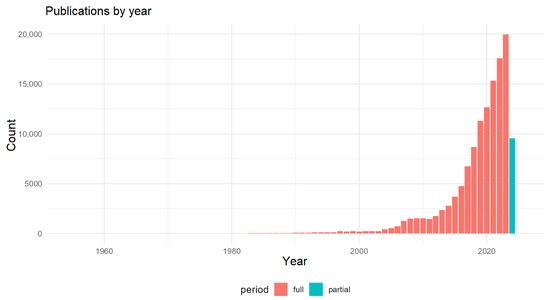
Figure 1.
Annual UAV publications (1955–2024) in the final corpus—2024 is marked as partial.
Regarding citations, the first quartile of them is in 2017, the second is in 2020, and the third is in 2022. Two structural constraints (energy and communication) are becoming increasingly important (Table 1), reflecting a shift towards endurance and network autonomy. Figure 2 visualizes this trend.

Table 1.
Energy and communication prevalence by 5-year bins in the final UAV set.
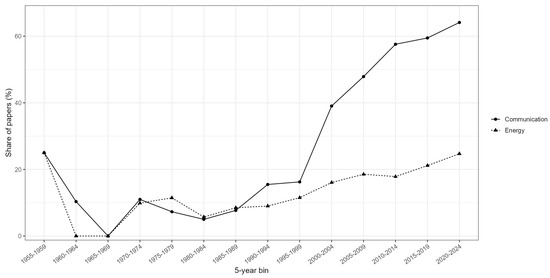
Figure 2.
Energy and communication constraints over time (5-year bins): both grow steadily, with communication reaching ∼64.1% by 2020–2024.
5.2. RQ2: Which Countries, Institutions, and Authors Contribute the Most to the Field of UAV Research?
The raw figures at country level are informative but are closely linked to population size and index coverage. To avoid conclusions based on size,
- (i)
- The volume of countries is combined with the share of multi-country publications (MCPs) as an indicator of the breadth of cooperation;
- (ii)
- The intensity per capita of countries (number of UAV articles per million inhabitants) is used;
- (iii)
- The results achieved at the institutional level are provided (with caveats regarding size).
Country-level raw aggregates are informative but conflate scientific mass with population size and indexing coverage. To separate scale from collaboration breadth, we report in-corpus UAV publication volume jointly with the share of MCPs. In practice, large systems dominate in absolute numbers, while medium-sized ecosystems often rank high in MCP-consistent strategies with outward-looking collaboration that strengthen international co-authorship beyond mere size.
To complement volume with a scale-aware indicator, we compute per capita intensity as
using the 2023 population from Our World in Data [50]. Per capita rates highlight topical focus independent of country size and frequently reorder the league table relative to raw counts. Table 2, Table 3 and Table 4 summarize the three complementary views:
Table 2.
Top 15 countries by UAV publication volume (in-corpus).
Table 3.
Top 15 countries by per capita UAV publication intensity (papers per million inhabitants, population year 2023, source: Our World in Data [50]).
Table 4.
Top 15 countries by MCP share (restricted to countries with ≥ 300 UAV papers to avoid small-denominator artifacts).
- (i)
- The top 15 by volume;
- (ii)
- The top 15 by per capita intensity;
- (iii)
- The top 15 by MCP share (restricted to countries with ≥300 UAV papers to avoid small-denominator artifacts).
Together, these tables distinguish between sheer production, willingness to cooperate internationally, and intensity of specialization.
Volume lists are dominated by large universities and laboratories, but with clear reminders about the impact of size, they are still useful for discovery. Therefore, we report the top institutions based on the number of UAV publications in the Table 5. The affiliations were parsed from the single c1 field (column in the dataset) and normalized to the parent university level where detectable (e.g., Department/School of → University).
Table 5.
Top institutions by UAV publication volume (in-corpus; names normalized).
Instead of ranking authors by name—which is sensitive to homonyms (common surnames)—we identify authors who play a bridging role in the co-author network based on their betweenness centrality. These connectors are located at interfaces where cross-domain integration occurs (control, perception, communication) and therefore better indicate integration contribution than raw numbers. The most important connecting authors are listed in Table 6.
Table 6.
Top bridging authors in the co-authorship network (betweenness centrality).
For venue discovery, we supplement the raw UAV numbers with an estimated focus index, which measures the sustained thematic emphasis. For each v output, we calculate as in Equation (5), where the numerator is the number of UAV–positive records hosted by v in our cleaned corpus, and the denominator is the OpenAlex all-topic total for v over the same years (aggregated from counts_by_year.works_count, across all document types). This definition makes the index useful for readers looking for UAV-oriented publications: higher values indicate journals or conference proceedings where UAV research constitutes a significant part of the publication’s activity. To avoid small-denominator artifacts and noisy resolutions, we
- (i)
- Restrict to venues with at least 100 UAV-positive records in our corpus;
- (ii)
- Harmonize years with the denominator;
- (iii)
- Exclude “impossible” cases (e.g., all works < UAV papers or estimated focus ).
Names are lightly normalized (ISSN-first resolution with high-threshold fuzzy fallback), and OpenAlex coverage may vary by venue and year; therefore, values should be considered as indicative. The top entries, ordered by estimated focus, are reported in Table 7.
Table 7.
Venue estimated focus: UAV share among all works indexed for the venue (OpenAlex; min. 100 UAV papers). Note: The estimated focus uses a mixed-source ratio: the numerator is the number of UAV-positive items stored by the site, while the denominator is the site’s total output for the same years from OpenAlex. In the case of drones, the ratio (51.76%) reflects the editorial scope, which goes beyond aircraft to include broader unmanned/robotic and regulatory topics, and our conservative corpus filter, which excludes borderline, non-UAV-related items. Therefore, this value should be interpreted as a high, sustained UAV ratio rather than a 100% expectation.
5.3. RQ3: Which Countries, Institutions, and Authors Collaborate with Each Other in UAV Research?
We model collaboration as a co-authorship network where nodes represent authors and edges indicate joint papers. This network naturally forms thematic communities (e.g., perception/remote sensing; guidance and control; communications and planning). Development combining these areas usually takes place through a small set of bridges: authors who publish in multiple communities, thereby connecting groups that would otherwise have weak links to each other. We identify such connectors based on their central role; the most important actors in Table 6 are precisely these cross-community nodes, where perception-in-the-loop control, communication-aware planning, and learning-based safety meet.
As an illustration, Figure 3 shows the induced subgraph of the top 20 connecting authors (according to betweenness ranking). Two communities appear (colored), with a densely connected core and a smaller satellite cluster. The edges are weighted by the number of joint publications (lighter shades = weaker connections). This visualization gives specific form to the roles of intermediaries: satellite members (e.g., Kim J.; Lee J.) are connected to the dense core through a few strong connections, while the core nodes connect otherwise separate topics. It should be noted that homonymy in the names of authors can inflate the apparent connection. Therefore, in interpreting influence in this study, we rely on network position (intermediary) rather than raw name counts.
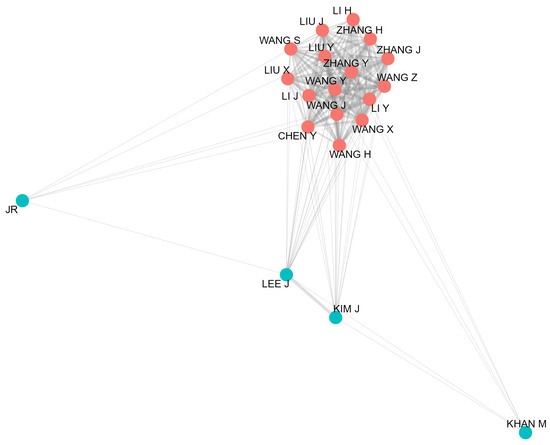
Figure 3.
Top–20 induced co-authorship subgraph (according to betweenness ranking). Node colors indicate communities; edge thickness reflects the weight of joint publications.
At the country level, MCP patterns (Table 2, Table 3 and Table 4) highlight national systems that show a high propensity for international cooperation-based UAV operations, while the per capita intensity (Table 3) reflects a size-independent focus; in the case of rankings affecting microstates or territories, the values should be interpreted with caution due to the small sample size. At the institutional level, the anchors in Table 5 support the largest clusters, and the authors forming the bridges connect these institutional communities, creating “strong alliances.” Together, these complementary perspectives provide a scaled picture of where collaborative mass and mediation are found in UAV research.
5.4. RQ4: What Main Themes Can Be Found in Studies About UAVs?
Going beyond a simple list of frequent words, we extract per-year top topics from the keyword co-occurrence network, ranking terms by the degree-augmented score. First, we remove general labels that merely repeat the query area (e.g., UAV, drone, unmanned aerial vehicle/system), then calculate the annual leaders. The resulting timeline (Figure 4) reveals two stable regularities. Communication-centric terms—most notably antennas and related link-layer vocabulary—remain highly connected across decades. This suggests that wireless connectivity is a structural requirement for both multi-UAV coordination and real-time perception/command loops. Energy-related tags do not consistently appear among the most popular terms of the year in this view, suggesting that endurance constraints are often treated as contextual requirements rather than as standalone keyword anchors.
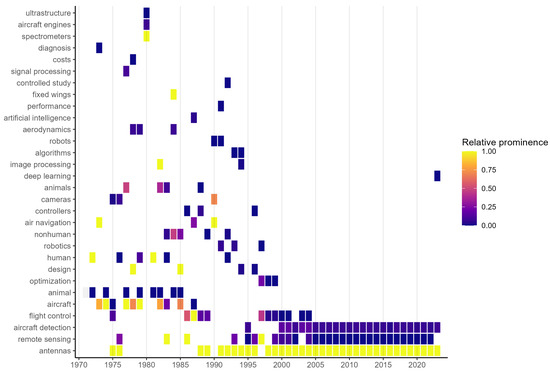
Figure 4.
Per-year top keywords (post-filter) from the co-occurrence network. Tiles show relative prominence scaled within each year (0–1). Generic base terms (e.g., UAV, drone, unmanned aerial vehicle) and non-informative words were removed to improve readability.
In order to reveal the thematic structure behind the annual keywords, we grouped the co-occurrence network of keywords using the Louvain community detection algorithm and tracked each group over time. Figure 5 summarizes the intensity of the groups and years as a heatmap, while Figure 6 shows the temporal dynamics of the groups. As can be seen, three stable, interpretable clusters emerge—communication/networking, sensing/remote sensing, and management/control/applications—which have shown significant growth over the past decade.
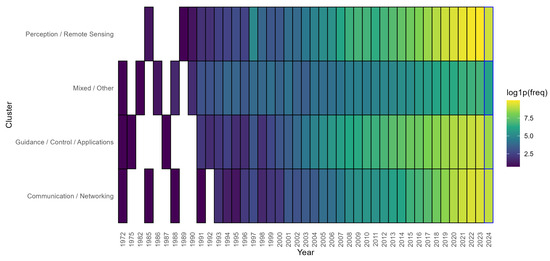
Figure 5.
Topic clusters × year heatmap (Louvain). Heatmap of aggregated keyword frequencies per cluster and year.
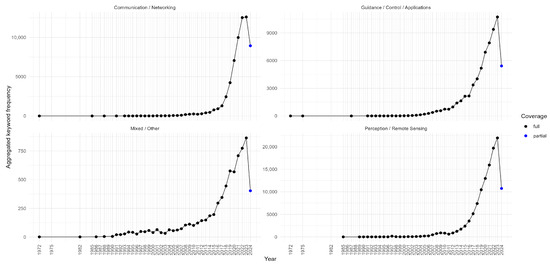
Figure 6.
Topic cluster trends (Louvain). Temporal evolution of aggregated keyword frequencies per cluster.
Despite its well-known impact, reinforcement learning rarely appears among the most frequently mentioned topics of the year. Therefore, we analyze it separately based on abstract-level joint mentions. We obtain two results. First, the problem–method pairing matrix (Table 8) shows that RL is more likely to occur together with route/path planning and collision avoidance than would be expected based on probability (PMI ≈ 1.2), i.e., RL is preferentially used in cases where uncertainty and dynamic obstacles play a central role in decision-making.
Table 8.
Problem–method pairing matrix in the final UAV set (N = 129,099) with co-occurrences and PMI.
Second, a temporal analysis of the joint mentions of RL + plan (Table 9 and Figure 7) shows that it was almost non-existent before 2010, then gradually appeared between 2015 and 2019, and visibly increased between 2020 and 2024, which is consistent with the timeline of deep RL’s application in robotics and autonomy.
Table 9.
RL + plan over time (5-year bins). Co-mentions become visible after 2010 and rise in 2020–2024.
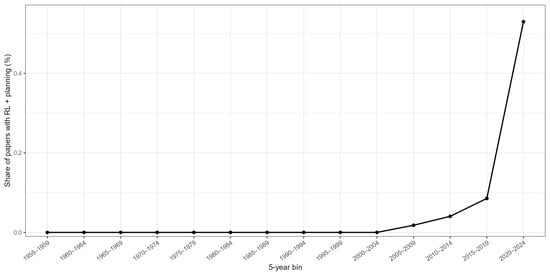
Figure 7.
RL and path/trajectory planning: co-mentions over time (5-year bins). The joint share rises after 2019.
Within the strictly defined RL subset ( = 2950), explicit references to the most important challenge categories are dominated by communication constraints (38.10%), followed by multi-agent/cooperation (25.63%) and energy constraints (14.20%), with uncertainty/POMDP (8.71%) and dynamic obstacles (4.75%) (see in Table 10). These scales are consistent with the network-level view: a communication- and control-based network under which learning-based methods are applied to manage coordination, connection reliability, and resource constraints. Complementarily, 9.67% of articles tagged with communication in the entire corpus explicitly mention multiple UAVs/cooperation, while 19.62% of articles mentioning multiple UAVs also mention communication, meaning that coordination depends on connection reliability relatively more often than vice versa.
Table 10.
RL co-mentions with challenge categories (within RL papers, N = 2950; abstract-only detection).
5.5. RQ5: What Are the Most Frequent Words in Research About UAVs?
High-frequency anchors such as unmanned aerial vehicle(s), UAV, and platform types (e.g., quadrotor) occur in multiple areas (titles, abstracts, keywords). Instead of treating these as results in themselves, we interpret them in the context of their co-occurrence (Figure 4) and based on the quantified connections above: modern, high-frequency word clusters are grouped around autonomy, with certain limitations (planning/avoidance ↔ RL; endurance ↔ energy; coordination ↔ communication).
6. Discussion
The aim of this study was to provide a reproducible, context-sensitive summary of the literature on UAVs and to answer the five guiding questions (RQ1–RQ5) with evidence that goes beyond a bibliographical listing. The dataset was created by combining exports from Web of Science and Scopus, removing duplicates with three additional matchers, and applying a two-step content filter that combines rules and a fine-tuned classifier.
Regarding RQ1, the following can be stated: The annual series (1955–2024) shows long-term growth, which accelerated after 2010, in line with the phase when low-cost sensing, embedded computing, and open-source tools reached maturity. The last calendar year of the series is marked as partial, so the changes visible on the right-hand side should be interpreted as indexing delays rather than structural declines. More informative than the single descent is the thematic connection that emerges over time: reinforcement learning appears more and more frequently on the topic timeline alongside route/path planning and collision avoidance, indicating a shift from manual control to data-driven decision-making in the face of uncertainty and dynamics. At the same time, two technical constraints—energy and communication—remain. This is consistent with the durability- and connectivity-related performance and reliability constraints faced by real-world platforms and explains why seemingly “algorithmic” developments are often developed in parallel with performance, aerial, and network architecture considerations.
In the case of RQ2, the following can be said: The aggregated data for countries by themselves are confusing, as they mix scientific output with population size and index coverage. In order to separate these effects, we examined three additional indicators together: the quantity in the corpus (who publishes the most), the MCP proportion, and the intensity per capita (who is most specialized in relation to the population). In practice, this gives a more nuanced picture: large systems dominate in absolute numbers; externally oriented systems rank high in MCP even with moderate volume; and small but specialized systems are visible in per capita values. Institutional rankings are useful for discovery, but they should be read with caution regarding size; in order to reduce the number of works originating from department-level strings, we normalized the affiliations analyzed from the single c1 field to recognizable parent universities. In the case of authors, raw name counts are unreliable in cases of homonymy, so we focus on network position: bridges with high-betweenness positions are actors who connect communities of perception, control, and communication and therefore concentrate integrative contributions. This network perspective better indicates where cross-domain synthesis actually occurs than volume alone.
The answer to RQ3 shows the following results: A coherent picture emerges at different levels. Countries with high MCP are centers of cross-border work; leading institutions form dense inter-institutional clusters; and the aforementioned integrating authors ensure shortcuts between clusters. Conceptually, these three layers form the spine from which practical advances originate: externally oriented systems challenge researchers with heterogeneous limitations and datasets; strong institutional anchors amortize infrastructure; and bridging authors transmit ideas between subfields, enabling communication-aware design, perception-aware control, and safety in learning.
Regarding RQ4, the analysis intentionally exceeds the list of frequent words and seeks to answer the question of why the expressions appear together. On the topic timeline, RL fit into design and collision avoidance precisely when platforms, simulators, and onboard computers enabled training and implementation on a large scale. Hardware and link layer terms (e.g., antennas) continue to play a central role in co-occurring networks, not as trivial terms, but as indicators that real-time operations with multiple UAVs are constrained by bandwidth and delay limitations. Specifically, in the RL articles, we quantify how the methods address the problems: multi-agent/collaboration (about a quarter of the RL articles), communication constraints (about two-thirds), and energy constraints (about one-seventh) are mentioned together in non-trivial proportions, with additional but smaller signs for uncertainty and dynamic obstacles. These proportions support the claim that the methodological boundaries of the field are more closely linked to endurance and connectivity constraints than they are to independent development.
When addressing RQ5, in simple frequency tables, synonyms for “UAV” inevitably appear, which are tautological with the search query and therefore analytically meaningless. This study reduces the weight of such tautologies and interprets common expressions through their intersections: control trigrams (sliding mode control, model predictive control) refer to robust and predictive strategies for underactuated platforms; perception/vision terms (convolutional neural network, synthetic aperture radar) denote the spine of perception; and optimization terms (particle swarm optimization, coverage/route planning) reveal how search and allocation problems are formulated. In other words, we use the conceptual surface as a structure for the scientific problem, not as an end in itself.
Finally, discovery requires not only knowing where articles related to UAVs appear, but also where the topic is concentrated. To this end, venue analysis supplements the counts in the corpus with an “estimated focus” index, which divides UAV-related articles by an external denominator based on the total output of the venue during the same period. The high-focus publications identified in this way provide useful guidance for readers who are looking for ongoing UAV-related coverage rather than occasional special issues.
Although the process was designed to be reproducible and scalable, several limitations affect the results and open up specific opportunities for future work. First, coverage is limited by the underlying bibliographic sources: Web of Science and Scopus differ in terms of journal and conference proceeding coverage, regional distribution, and update frequency. Even after harmonizing fields and removing multiple matches, gaps remain (e.g., unindexed regional conferences, workshop proceedings, or very recent items). The right margin of the time series is particularly sensitive to indexing delays; we mark the last calendar year as explicitly partial, but any short-term changes should be interpreted with caution. Second, affiliation information is parsed from a single free text field, which improves recall across export formats but inherits noise from heterogeneous author–provided strings. Normalization to parent institutions reduces this variance but cannot fully resolve ambiguous department-level labels or institutional name changes. Similarly, country detection from affiliations can misclassify border cases (multi-campus institutions, special administrative regions, etc.). Third, author-level analyses are susceptible to homonymy and name variants. We mitigate this by emphasizing network position (betweenness centrality) over raw name counts, yet betweenness centrality is still a proxy for brokerage rather than a direct measure of intellectual contribution, and it can be affected by incomplete metadata (missing co-authors, split identities). Fourth, the content filter is fine-tuned with high precision to avoid false positives. However, this design decision may under–recall borderline UAV items that use atypical terminology or metaphorical language. Similarly, co–mention indicators (e.g., reinforcement learning with energy or communication constraints) are evidence of thematic proximity, not causal deployment or performance gains. Full–text, methodological-level extraction would be necessary to determine implementation details and outcomes. Fifth, venue “estimated focus” relies on external denominators queried by programming; while this reduces bias within the corpus, it results in dependence on third-party coverage, speed limitations, and the accuracy of identifier mapping. Sixth, linguistic and domain biases remain: English-language articles, computer science and engineering venues, and open-access publications predominate over UAV application areas (e.g., law, ethics, politics), which mitigates overall ecosystem-based statements.
These limitations suggest specific next steps:
- With regard to data sources, supplementing WoS/Scopus with preprint servers (e.g., arXiv), patent databases, and regional indexes to improve early detection and geographical balance;
- Tracking versions to ensure the verifiability of dynamic updates;
- When resolving entities, using persistent identifiers (ORCID for authors, ROR/GRID for institutions) and probabilistic meaning resolution to reduce homonymy and affiliation noise;
- In terms of understanding content, if licenses allow, considering not only abstracts but also full texts, and using modern NLP (entity linking, section-sensitive relation extraction) to distinguish between mentions and methods used, as well as to quantify results (e.g., increase in endurance, delay budget), rather than just considering common mentions;
- With regard to indicators, supplementing the national indicators per capita with R&D workforce denominators (number of researchers per million people, R&D expenditure) to separate specialization from size and pairing collaboration indicators (MCP, betweenness position) with outcome-oriented proxy indicators (e.g., cross-cutting citations, articles setting benchmarks);
- For modeling, moving from static co-occurrences to dynamic theme embeddings and time-varying community detection to capture changes in problem formulation with uncertainty boundaries (e.g., transition from single-UAV control to multi-agent autonomy);
- For quality assurance, hardening the pipeline with pre–registered sensitivity analyses (e.g., varying classifier thresholds, alternative swarm/insect rule sets), human verification of boundary elements, and bootstrapped uncertainty for all key ratios;
- For knowledge transfer, presenting the analysis as an open, re-runable workflow with an easy-to-use dashboard that updates the numbers, co-occurrence rates, and location focus as new records arrive.
Collectively, these enhancements can refine attribution, improve coverage, and shift the synthesis away from related factors toward what works, when, and under what constraints—which is ultimately the most important question for the UAV community.
In summary, the field has expanded in scale and reorganized around data-driven autonomy under real-world constraints. Collaboration patterns highlight the intermediaries through whom this reorganization takes place, while thematic evidence links advances in learning and planning to persistent energy and communication bottlenecks. Methodologically, the contribution lies in a transparent pipeline that retains the swarm and coordination literature while filtering out insect-related noise, combined with scale-aware indicators that avoid overinterpretation of raw counts. Substantively, the emerging picture is one of convergence: perception, control, and communication are increasingly co-designed and progress at scale depends as much on endurance and link reliability as on algorithmic innovation.
Overall, throughout the paper we identified the following research gaps:
- Trade-offs between endurance and payload: energy constraints systematically limit real-world applications; comparative studies based on standardized mission profiles are rare.
- Communication reliability in urban/suburban environments: coordination with multiple UAVs often assumes stable connections; the number of design benchmarks that take delay/jitter into account is limited.
- Method–problem integration: RL applications focus on path/collision planning, yet standardized datasets, simulation–reality protocols, and ablation reports remain uneven.
- Evaluation standards: few cross-site, reproducible benchmarks link guidance, observation, and network constraints.
- Identity resolution in science measurement: limited use of ORCID/ROR hinders the clarification of authors/affiliations; the use of persistent identifiers would improve comparability between studies.
7. Conclusions
We presented a context-aware bibliometric synthesis of UAV research that
- (i)
- Merges Web of Science and Scopus;
- (ii)
- Removes duplicates using three complementary matchers;
- (iii)
- Filters insect-related noise while retaining UAV swarm and coordination studies through a combination of rule-based pre-labeling and a precision-tuned classifier.
Over seven decades, UAV publications show continuous growth, with an acceleration after 2010. Topic evolution indicates a shift from classical guidance toward data-driven decision-making under real-world constraints: reinforcement learning increasingly aligns with path and trajectory planning as well as collision avoidance, while energy and communication remain persistent bottlenecks. Collaboration analyses reveal high-betweenness authors bridging perception, control, and communication, and MCP/per capita indicators disentangle country-level scale from openness and specialization. Venue analysis, normalized with an external denominator (OpenAlex), identifies outlets with sustained UAV focus and offers practical guidance for literature searches.
Collectively, these components address questions RQ1–RQ5 at the level of scientific problems rather than lexical trends. The analysis highlights both areas for improvement—learning-based planning within constraints—and factors that continue to limit scalability, namely the durability and reliability of connections. Future work should (a) expand the human verification set to better quantify residual noise, (b) refine affiliation normalization, particularly in department-level domains, and (c) track updates beyond 2024 as indexing coverage matures.
Author Contributions
Conceptualization, T.G. and J.S.; methodology, T.G.; software, T.G.; validation, T.G. and J.S.; formal analysis, T.G.; investigation, T.G. and J.S.; resources, T.G.; data curation, T.G.; writing—original draft preparation, T.G. and J.S.; writing—review and editing, T.G. and J.S.; visualization, T.G.; supervision, J.S.; project administration, J.S. All authors have read and agreed to the published version of the manuscript.
Funding
This research has received no funding.
Institutional Review Board Statement
Not applicable.
Informed Consent Statement
Not applicable.
Data Availability Statement
The raw data supporting the conclusions of this article will be made available by the authors on request.
Acknowledgments
This work has been implemented by the TKP2021-NVA-10 project with the support provided by the Ministry of Culture and Innovation of Hungary from the National Research, Development and Innovation Fund, financed under the 2021 Thematic Excellence Programme funding scheme.
Conflicts of Interest
The authors declare no conflicts of interest. The funders had no role in the design of the study; in the collection, analyses, or interpretation of data; in the writing of the manuscript; or in the decision to publish the results.
Abbreviations
The following abbreviations are used in this manuscript:
| IoT | Internet of Things |
| MCP | Multiple Country Publications |
| PMI | Pointwise Mutual Information |
| RL | Reinforcement Learning |
| RQ | Research Question |
| UAS | Unmanned Aircraft System |
| UAV | Unmanned Aerial Vehicle |
References
- Tsouros, D.C.; Bibi, S.; Sarigiannidis, P.G. A review on UAV-based applications for precision agriculture. Information 2019, 10, 349. [Google Scholar] [CrossRef]
- Adão, T.; Hruška, J.; Pádua, L.; Bessa, J.; Peres, E.; Morais, R.; Sousa, J.J. Hyperspectral imaging: A review on UAV-based sensors, data processing and applications for agriculture and forestry. Remote Sens. 2017, 9, 1110. [Google Scholar] [CrossRef]
- Radoglou-Grammatikis, P.; Sarigiannidis, P.; Lagkas, T.; Moscholios, I. A compilation of UAV applications for precision agriculture. Comput. Netw. 2020, 172, 107148. [Google Scholar] [CrossRef]
- Asadzadeh, S.; de Oliveira, W.J.; de Souza Filho, C.R. UAV-based remote sensing for the petroleum industry and environmental monitoring: State-of-the-art and perspectives. J. Pet. Sci. Eng. 2022, 208, 109633. [Google Scholar] [CrossRef]
- Fascista, A. Toward integrated large-scale environmental monitoring using WSN/UAV/Crowdsensing: A review of applications, signal processing, and future perspectives. Sensors 2022, 22, 1824. [Google Scholar] [CrossRef]
- Ya’acob, N.; Zolkapli, M.; Johari, J.; Yusof, A.L.; Sarnin, S.S.; Asmadinar, A.Z. UAV environment monitoring system. In Proceedings of the 2017 International Conference on Electrical, Electronics and System Engineering (ICEESE), Kanazawa, Japan, 9–10 November 2017; pp. 105–109. [Google Scholar] [CrossRef]
- Arnold, T.; De Biasio, M.; Fritz, A.; Leitner, R. UAV-based measurement of vegetation indices for environmental monitoring. In Proceedings of the 2013 Seventh International Conference on Sensing Technology (ICST), Wellington, New Zealand, 3–5 December 2013; pp. 704–707. [Google Scholar] [CrossRef]
- Erdelj, M.; Natalizio, E.; Chowdhury, K.R.; Akyildiz, I.F. Help from the sky: Leveraging UAVs for disaster management. IEEE Pervasive Comput. 2017, 16, 24–32. [Google Scholar] [CrossRef]
- Erdelj, M.; Król, M.; Natalizio, E. Wireless sensor networks and multi-UAV systems for natural disaster management. Comput. Netw. 2017, 124, 72–86. [Google Scholar] [CrossRef]
- Song, B.D.; Park, K.; Kim, J. Persistent UAV delivery logistics: MILP formulation and efficient heuristic. Comput. Ind. Eng. 2018, 120, 418–428. [Google Scholar] [CrossRef]
- Li, Y.; Liu, M.; Jiang, D. Application of unmanned aerial vehicles in logistics: A literature review. Sustainability 2022, 14, 14473. [Google Scholar] [CrossRef]
- Kim, S.J.; Jeong, Y.; Park, S.; Ryu, K.; Oh, G. A survey of drone use for entertainment and AVR (augmented and virtual reality). In Augmented Reality and Virtual Reality: Empowering Human, Place and Business; Springer: Berlin/Heidelberg, Germany, 2018; pp. 339–352. [Google Scholar] [CrossRef]
- Fan, B.; Li, Y.; Zhang, R.; Fu, Q. Review on the technological development and application of UAV systems. Chin. J. Electron. 2020, 29, 199–207. [Google Scholar] [CrossRef]
- Stöcker, C.; Bennett, R.; Nex, F.; Gerke, M.; Zevenbergen, J. Review of the current state of UAV regulations. Remote Sens. 2017, 9, 459. [Google Scholar] [CrossRef]
- Muchiri, G.; Kimathi, S. A review of applications and potential applications of UAV. In Proceedings of the Sustainable Research and Innovation Conference, Pretoria, South Africa, 20–24 June 2022; pp. 280–283. [Google Scholar]
- Mohsan, S.A.H.; Othman, N.Q.H.; Li, Y.; Alsharif, M.H.; Khan, M.A. Unmanned aerial vehicles (UAVs): Practical aspects, applications, open challenges, security issues, and future trends. Intell. Serv. Robot. 2023, 16, 109–137. [Google Scholar] [CrossRef]
- Hentschke, M.; de Freitas, E.P. Design and implementation of a control and navigation system for a small unmanned aerial vehicle. IFAC-PapersOnLine 2016, 49, 320–324. [Google Scholar] [CrossRef]
- Kharchenko, V.; Kondratyuk, V.; Ilnytska, S.; Kutsenko, O.; Larin, V. Urgent problems of UAV navigation system development and practical implementation. In Proceedings of the 2013 IEEE 2nd International Conference Actual Problems of Unmanned Air Vehicles Developments Proceedings (APUAVD), Kyiv, Ukraine, 15–17 October 2013; pp. 157–160. [Google Scholar] [CrossRef]
- Wargo, C.; Snipes, C.; Roy, A.; Kerczewski, R. UAS industry growth: Forecasting impact on regional infrastructure, environment, and economy. In Proceedings of the 2016 IEEE/AIAA 35th Digital Avionics Systems Conference (DASC), Sacramento, CA, USA, 25–29 September 2016; pp. 1–5. [Google Scholar] [CrossRef]
- Chiang, W.C.; Li, Y.; Shang, J.; Urban, T.L. Impact of drone delivery on sustainability and cost: Realizing the UAV potential through vehicle routing optimization. Appl. Energy 2019, 242, 1164–1175. [Google Scholar] [CrossRef]
- Rao, B.; Gopi, A.G.; Maione, R. The societal impact of commercial drones. Technol. Soc. 2016, 45, 83–90. [Google Scholar] [CrossRef]
- Aria, M.; Cuccurullo, C. bibliometrix: An R-tool for comprehensive science mapping analysis. J. Inf. 2017, 11, 959–975. [Google Scholar] [CrossRef]
- Austin, R. Unmanned Aircraft Systems: UAVS Design, Development and Deployment; John Wiley & Sons: Hoboken, NJ, USA, 2011. [Google Scholar]
- Aeronautical Systems Center (US); History Office, Air Force History, & Museums Program (US). Splendid Vision, Unswerving Purpose: Developing Air Power for the United States Air Force During the First Century of Powered Flight; Wright-Patterson Air Force Base: Dayton, OH, USA, 2002.
- DT Parker. Building Victory: Aircraft Manufacturing in the Los Angeles Area in World War II; DT Parker: Santa Rosa Beach, FL, USA, 2013. [Google Scholar]
- Merlin, P. Design and development of the blackbird: Challenges and lessons learned. In Proceedings of the 47th AIAA Aerospace Sciences Meeting Including the New Horizons Forum and Aerospace Exposition, Orlando, FL, USA, 5–8 January 2009; p. 1522. [Google Scholar] [CrossRef]
- Newcome, L.R. Unmanned Aviation: A Brief History of Unmanned Aerial Vehicles; American Institute of Aeronautics and Astronautics: Reston, VA, USA, 2004. [Google Scholar]
- Singer, P.W. Wired for War: The Robotics Revolution and Conflict in the 21st Century; Penguin: London, UK, 2009. [Google Scholar]
- Gertler, J. US Unmanned Aerial Systems, 2012. Available online: https://sgp.fas.org/crs/natsec/R42136.pdf (accessed on 8 September 2025).
- Zhang, C.; Kovacs, J.M. The application of small unmanned aerial systems for precision agriculture: A review. Precis. Agric. 2012, 13, 693–712. [Google Scholar] [CrossRef]
- Koh, L.P.; Wich, S.A. Dawn of drone ecology: Low-cost autonomous aerial vehicles for conservation. Trop. Conserv. Sci. 2012, 5, 121–132. [Google Scholar] [CrossRef]
- Adams, S.M.; Friedland, C.J. A survey of unmanned aerial vehicle (UAV) usage for imagery collection in disaster research and management. In Proceedings of the 9th International Workshop on Remote Sensing for Disaster Response, Stanford, CA, USA, 15–16 September 2011; Volume 8, pp. 1–8. [Google Scholar]
- Fan, J.; Saadeghvaziri, M.A. Applications of drones in infrastructures: Challenges and opportunities. Int. J. Mech. Mechatronics Eng. 2019, 13, 649–655. [Google Scholar]
- Goodchild, A.; Toy, J. Delivery by drone: An evaluation of unmanned aerial vehicle technology in reducing CO2 emissions in the delivery service industry. Transp. Res. Part D Transp. Environ. 2018, 61, 58–67. [Google Scholar] [CrossRef]
- Galvane, Q.; Lino, C.; Christie, M.; Fleureau, J.; Servant, F.; Tariolle, F.L.; Guillotel, P. Directing cinematographic drones. ACM Trans. Graph. TOG 2018, 37, 1–18. [Google Scholar] [CrossRef]
- La Bella, L. Drones and Entertainment; The Rosen Publishing Group, Inc.: New York, NY, USA, 2016. [Google Scholar]
- Rodríguez-Soler, R.; Uribe-Toril, J.; Valenciano, J.D.P. Worldwide trends in the scientific production on rural depopulation, a bibliometric analysis using bibliometrix R-tool. Land Use Policy 2020, 97, 104787. [Google Scholar] [CrossRef]
- Rodríguez, M.S.; Ortega Alvarez, A.M.; Arango-Vasquez, L. Worldwide trends in the scientific production on soccer players market value, a bibliometric analysis using bibliometrix R-tool. Team Perform. Manag. Int. J. 2022, 28, 415–440. [Google Scholar] [CrossRef]
- Radha, L.; Arumugam, J. The research output of bibliometrics using bibliometrix R package and VOS viewer. Shanlax Int. J. Arts Sci. Humanit. 2021, 9, 44–49. [Google Scholar] [CrossRef]
- Zhao, J.; Li, M. Worldwide trends in prediabetes from 1985 to 2022: A bibliometric analysis using bibliometrix R-tool. Front. Public Health 2023, 11, 1072521. [Google Scholar] [CrossRef]
- Guzsvinecz, T.; Szelinger, A. Analyzing the Bibliometric Trends in Gamification Research Using the Bibliometrix R-Tool; IntechOpen: London, UK, 2024. [Google Scholar]
- Omotehinwa, T.O. Examining the developments in scheduling algorithms research: A bibliometric approach. Heliyon 2022, 8, e09510. [Google Scholar] [CrossRef]
- Derviş, H. Bibliometric analysis using bibliometrix an R package. J. Scientometr. Res. 2019, 8, 156–160. [Google Scholar] [CrossRef]
- Passas, I. Bibliometric Analysis: The Main Steps. Encyclopedia 2024, 4, 1014–1025. [Google Scholar] [CrossRef]
- Dæhlen, A.; Heldal, I.; Katona, J. Linking Data from Eye-Tracking and Serious Games to NDD Characteristics: A Bibliometric Study. In Proceedings of the 2024 Symposium on Eye Tracking Research and Applications, Glasgow, UK, 4–7 June 2024; pp. 1–8. [Google Scholar] [CrossRef]
- Winkler, W.E. String Comparator Metrics and Enhanced Decision Rules in the Fellegi-Sunter Model of Record Linkage. 1990. Available online: https://eric.ed.gov/?id=ED325505 (accessed on 8 September 2025).
- Hastie, T.; Qian, J. Glmnet vignette. Retrieved June 2014, 9, 1–30. [Google Scholar]
- OurResearch. OpenAlex. Open Catalog of the Global Research System. 2024. Available online: https://docs.openalex.org/ (accessed on 8 September 2025).
- Priem, J.; Piwowar, H.; Orr, R. OpenAlex: An Open Index of Scholarly Works, Authors, Venues, Institutions, and Concepts. Available online: https://openalex.org (accessed on 8 September 2025). Project Description 07. 2022..
- Our World in Data. Population (OWID Grapher Dataset); CSV Dataset; Original Source: United Nations, World Population Prospects (WPP) 2022 Revision; Global Change Data Lab: Oxford, UK, 2025. [Google Scholar]
Disclaimer/Publisher’s Note: The statements, opinions and data contained in all publications are solely those of the individual author(s) and contributor(s) and not of MDPI and/or the editor(s). MDPI and/or the editor(s) disclaim responsibility for any injury to people or property resulting from any ideas, methods, instructions or products referred to in the content. |
© 2025 by the authors. Licensee MDPI, Basel, Switzerland. This article is an open access article distributed under the terms and conditions of the Creative Commons Attribution (CC BY) license (https://creativecommons.org/licenses/by/4.0/).