Article

“I’m a Fish!”: Exploring Children’s Engagement with Human–Data Interactions in Museums

1
Luddy School of Informatics, Computing and Engineering, Indiana University Indianapolis, Indianapolis, IN 46202, USA
2
Department of Computer Science, Faculty of Computers and Information Technology, University of Tabuk, Tabuk 47512, Saudi Arabia
*
Author to whom correspondence should be addressed.
Appl. Sci. 2025, 15(21), 11304; https://doi.org/10.3390/app152111304
Submission received: 18 September 2025 / Revised: 14 October 2025 / Accepted: 16 October 2025 / Published: 22 October 2025
(This article belongs to the Special Issue Emerging Technologies in Innovative Human–Computer Interactions)

Abstract

In an increasingly data-driven world, sparking children’s curiosity for meaningful data exploration provides a powerful foundation for lifelong data literacy. Human–data interaction (HDI) offers a promising approach by making data more accessible and engaging, particularly in informal learning environments like museums. However, there is limited understanding of how children, as a distinct user group, engage with embodied, interactive data visualizations. This paper presents findings from an exploratory field study of a gesture-controlled HDI installation deployed in a large urban museum. We analyzed the interactions of over 200 children, primarily from visiting K-12 school groups, as they engaged with an HDI prototype, the data on display, and each other. Our thematic analysis reveals that children’s interactions are deeply social, playful, and imaginative, often prioritizing collaborative discovery and role-playing over direct data interpretation. Based on these observations, we present design recommendations for creating HDI installations that leverage these behaviors to foster meaningful data engagement.

1. Introduction

In today’s data-driven world, fostering data literacy in children is crucial [1]. Interactive data visualizations offer a promising avenue for engaging young audiences with data in informal learning environments like museums; however, children may struggle to engage with the data, which may be seen as overly complex [2,3,4,5,6,7]. Human–data interaction (HDI) installations are interactive displays that enable users to explore data visualizations using gestures and body movements [8,9]; they offer a unique opportunity to engage museum visitors with data [10]. By encouraging physical interaction and facilitating social interaction around the display, HDI installations can capture people’s attention and foster engagement in museums [11,12]. However, there is limited research investigating how children (in contrast to museum visitors in general) engage with each other in front of HDI installations, what types of social and embodied interaction [13,14] occur, and what could hinder their interaction with the data on display.
To address this gap, we conducted a qualitative, exploratory study with over 200 museum visitors, mostly from K-12 school groups, at a large state museum in the U.S. Midwest. Our aim was to explore how children interact socially and physically with data-centric interactive displays in a museum setting. We deployed an HDI installation prototype that allowed visitors to freely explore data visualizations using gestures and body movements (see Figure 1). Consistent with HDI practice [10], the content (datasets and data visualization) was curated to attract the attention of diverse groups of museum visitors, not just children [11,15]. Through analysis of video recordings, we identified instances where groups of K-12 children interacted with the display and explored how they engaged with the HDI installation, the data, and each other. We provide insights into children’s interactions with our HDI prototype, and discuss implications for the design of HDI installations for children.

2. Background

2.1. Embodied Interaction

Human–data interaction (HDI) builds on embodied interaction, emphasizing that physical actions and gestures are central to cognition and learning, as they help users understand abstract concepts through bodily engagement [4,13,14]. This approach is especially relevant for child-centered design, where interactive gestures like swiping or zooming make technology more accessible and encourage exploratory, playful behavior [16].
In our study, children used gestures such as swiping and zooming to explore data-centric displays, fostering collaboration and discovery among peers [17]. Such tangible interactions enabled direct engagement with the visualized data [18].
Recent research in embodied and immersive learning further supports the value of gesture-based and virtual reality (VR) environments for conceptual understanding and engagement. Johnson-Glenberg et al. demonstrated that embedding gesture and movement within mixed-reality environments helps learners externalize abstract thinking and strengthen cognitive processing, particularly in scientific domains [19]. Their later work shows that mixed-reality lessons incorporating passive haptic feedback improve long-term retention and motivation by linking perception and action [20]. Similarly, Acevedo et al. designed an immersive VR environment to teach electric-field concepts, finding that embodied motion and multisensory cues supported comprehension of complex spatial relationships [21]. Price et al. further illustrated that immersive VR systems can turn bodily movement into a reasoning tool for geometry and spatial understanding among children [22]. Many of these embodied and immersive systems rely on motion-tracking technologies such as the Microsoft Kinect [23,24], which has been widely used in cultural heritage [25,26,27] and museum settings to enable gesture-based interaction and whole-body engagement [11,12,28,29]. Together, these studies highlight how physical embodiment and immersive interaction can enhance conceptual learning and engagement, which informs our own investigation of gesture-based data exploration within a museum setting.

2.2. Human–Data Interaction (HDI)

Human–data interaction (HDI) encompasses a wide range of research topics, from personal data [30] to embodied interactions with data visualizations [9,10,31]. HDI extends beyond technical engagement with data to include how people interpret and learn from it. In educational and informal STEM settings, HDI can foster data literacy by helping users reason with and communicate data through visual and embodied experiences [11,32]. Interactive visualizations that respond to body movement make abstract information tangible, encouraging exploration and collaborative understanding [32]. These approaches align with embodied cognition and offer ways to assess learning through visitors’ dialogue and shared interpretation, connecting HDI with social and experiential learning.
In this paper, we focus on HDI involving gestures and body movements in data visualization, highlighting how such interactions support meaning-making [9] and facilitate exploration in informal learning settings like museums [10].
Two themes in HDI literature contextualize our study. First, museum visitors, often engaging in informal learning without specific goals, typically explore data visualizations organically, guided by sustained interest rather than structured tasks [10,33,34,35]. Second, the diversity of museum audiences has driven HDI work on engagement, personalization, and learning [11,15,32,36,37]. However, as Trajkova et al. [11] point out, there remains a need to specifically investigate how children (not museum visitors in general) navigate data visualizations in museums.

2.3. Public Interactive Displays

Human–data interaction (HDI) prototypes typically use interactive displays. Public interactive displays (PIDs) are ubiquitous in modern life [38], designed to be visible and accessible in public spaces such as cities, shops, and educational settings [39,40]. Unlike traditional public displays, which primarily serve a passive audience, PIDs extend engagement by allowing users in the environment to actively interact with the content [41,42]. These displays can facilitate a spectrum of engagement behaviors, ranging from passive observation to active discovery and playful exploration [42,43], and can transform public spaces into interactive learning environments [42,44].
The design of PIDs must consider various factors, such as orientation [45], content format [46], and dynamics [47], to effectively capture the attention of passers-by and encourage interaction [41,48,49]. A particularly noteworthy feature of PIDs is the “audience funnel” effect, where the design of the display gradually draws individuals closer through engaging visual and interactive elements [50,51]. Another well-documented phenomenon is the “honeypot effect”, where the activity of one user attracts others to the display, fostering spontaneous social engagement [52,53]. Such interactions often include conversations between users, which can deepen their understanding of the display content while also leading to playful behaviors [44,54].
The study in this paper is grounded in the literature on interactive displays, but specifically focuses on the children’s interactions with PIDs when the PIDs are used to display gesture-controlled data visualizations.
Prior work on public interactive displays has explored multi-user gesture interaction that enables collaboration and shared exploration [9,37]. While such approaches can foster social engagement, they often face challenges such as gesture overlap, tracking ambiguity, and unequal control among participants [11,12]. Our system supported a single user only, to maintain reliable tracking and clear interaction feedback, thereby reducing confusion during data exploration in a crowded museum setting.

2.4. Social Learning

Social learning theory emphasizes the crucial role of social interaction in the learning process. In fact, social interaction can contribute to learning through collaboration, discussion, and shared understanding [55]. Children acquire knowledge and understanding not only through direct instruction but also through observation, imitation, and collaboration with their peers [3,56,57,58]. This is particularly relevant in informal learning environments like museums, where interactive exhibits can act as catalysts for social learning by enabling children to share perspectives, guide each other, and collaboratively explore content [36]. Models like Falk and Dierking’s contextual model of learning emphasize the importance of social interaction and dialogue in meaning-making within museum settings [59]. For instance, frameworks have been developed to analyze and understand “learning talk” [32], i.e., the productive dialogue that occurs between visitors as they engage with exhibits [5,60].
In the context of our study, social learning provides a valuable lens for understanding how children engage with HDI installations. By observing and interacting with each other, children can learn how to use the interface, interpret the data, and make connections to their own experiences. While our study does not directly assess social learning outcomes, we recognize its significant influence on children’s interactions with an HDI prototype.

2.5. Children’s Experience in Museums

The study presented in this paper draws upon extensive research in museum learning, which has investigated how children explore and learn in museums for many decades [6,61,62,63,64,65]. This body of work highlights the influence of sociocultural, personal, and physical contexts on children’s learning experiences in museums [36].
The work in this paper complements this line of research (which focuses on static displays, label-based museum exhibits, and other non-data-centric displays) by specifically focusing on human–data Interaction, i.e., how children explore datasets through gesture-controlled data visualizations.
Research on children’s museum experiences highlights how interactive and immersive systems can foster a range of cognitive and social skills. Through embodied and data-driven exploration, children practice observation, reasoning, collaboration, and curiosity as they connect physical gestures to digital feedback [10]. Such experiences help them build confidence in interpreting information and develop early data-literacy abilities that complement traditional learning approaches [66].

3. Materials and Methods

3.1. Our HDI Prototype

Our HDI prototype displayed two 3D globes on a 65’’ TV. Visitors were able to see themselves on the screen through a live video feed from the tracking camera. This feature was based on HDI literature that suggests that showing real-time representation of visitors is an effective strategy for capturing and maintaining attention, particularly in crowded museum environments [11,51].

3.1.1. Data Visualization Scenarios

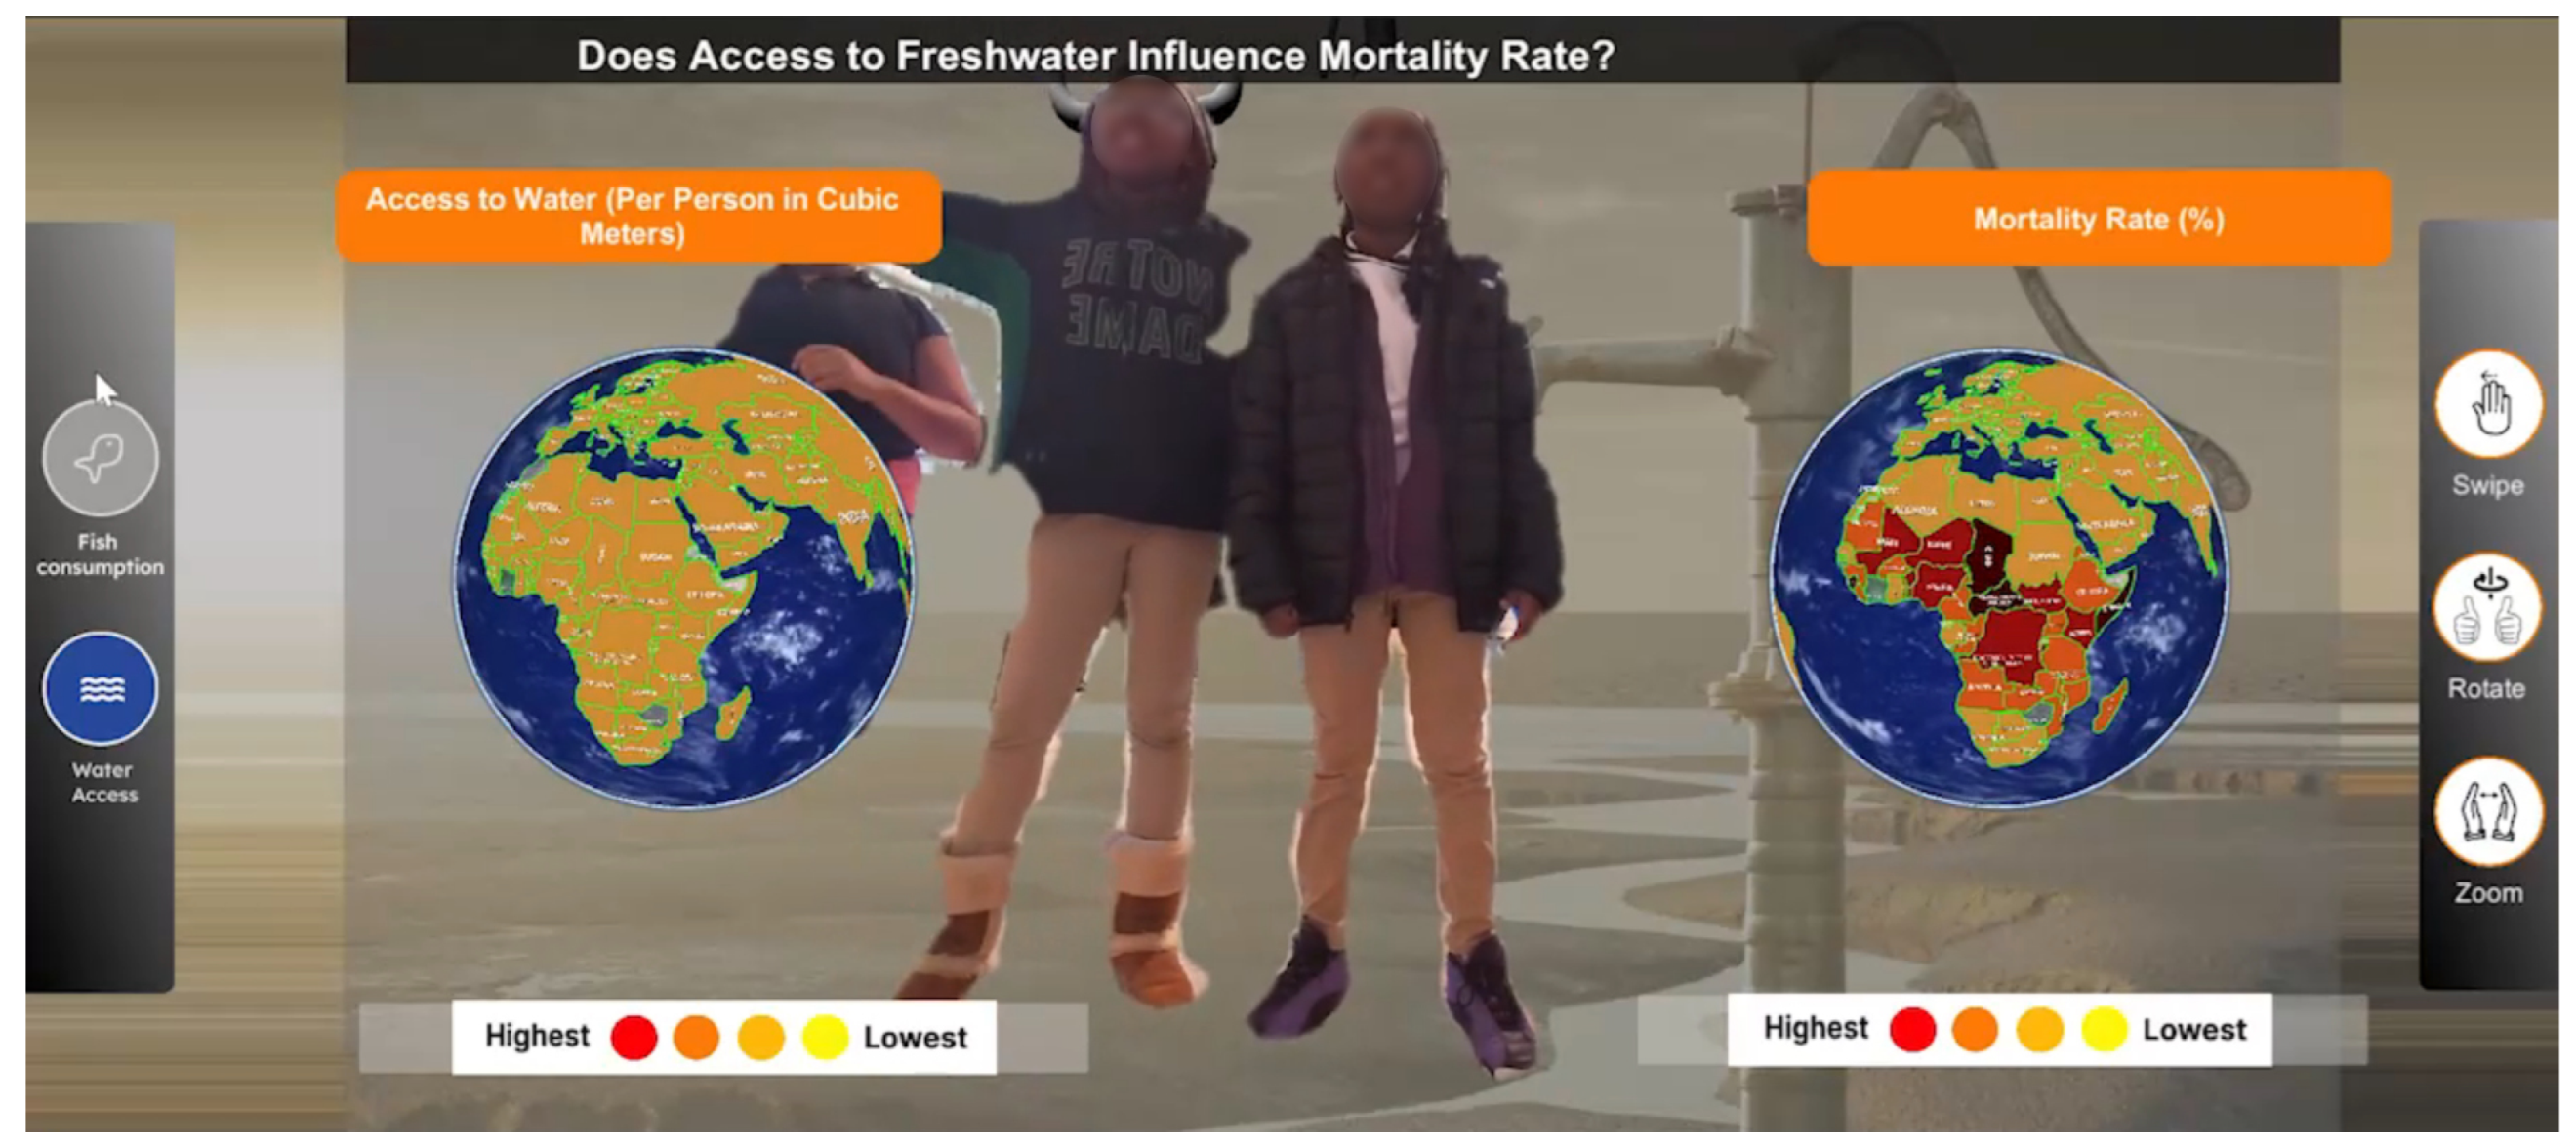
We designed two scenarios to facilitate children’s interaction with the display, each focused on exploring different datasets through interactive globes (see Figure 1).
We selected these datasets because they have already been used in HDI literature (e.g., [11,67]). While our study focuses on children’s interaction, we intentionally did not employ age-specific learning goals and chose datasets suitable for diverse museum visitors (not only children), aligning with HDI principles that museum installations should appeal to a broad audience [10]. We designed two scenarios (rather than simply using one) to improve the generalizability of our findings (with only one scenario, it would be unclear whether the observed behaviors were specific to those particular data or themes).
The system presents a key question at the top of the screen and utilizes two globes to visualize the data, each globe representing a unique dataset. A color spectrum (ranging from yellow to deep red) at the bottom of each globe reflected values in the dataset. Gesture controls allow participants to interact with the data by swiping, rotating, or zooming, with brief instructions displayed on the right side of the screen. Additionally, two data icons on the left side of the screen represent the datasets: one for fish endangerment and the other for water access. Below, we describe each scenario in detail.
1.
Fish Endangerment Scenario
In this scenario, the central question posed to participants is as follows: “Does fertilizer consumption influence the number of threatened fish species?” Two globes appear on the screen: one representing fertilizer consumption (measured in kilograms per hectare of arable land) and the other showing the number of threatened fish species. Participants were shown against an ocean-themed background. A feature of this scenario is the presence of a virtual fish above the head of the participant currently controlling the display. This fish icon visually indicates who is in charge of controlling the globe, emphasizing the connection between the physical gesture control and the digital environment.
2.
Water Access Scenario
The second scenario asks participants to explore the following question: “Does access to fresh water influence the mortality rate?” Here, the background depicts a stream, a faucet, and a water pump to reinforce the theme of water access. One globe presents data on access to fresh water (measured in cubic meters per person), while the other globe visualizes the mortality rate (as a percentage). Similar to the fish scenario, an icon (this time, a water pump) appears above the participant who is actively controlling the display, providing a visual cue as to who is interacting with the system.

3.1.2. Software Description and Content

We created the main platform for the system using Unity 3D. To enable body tracking and gesture support, we used Azure Kinect for Windows Software Development Kit (SDK) 2.0 in conjunction with the Azure Kinect camera and developed the gestural interaction system in C♯.
We modified a globe map package for Unity 3D to display the boundaries of each country along with realistic clouds. The datasets were automatically uploaded to a designated location on the map. A color gradient applied to each country reflected the values in the dataset files, with the color values normalized in the range [0–1] to create a consistent gradient scheme.
As shown in Figure 1, the display showed users against a virtual background relating to the datasets displayed on the globes. The user controlling the display had a small 3D control icon hovering above their head to indicate that the display would respond to their gestures.
Users manipulated the display through the use of specific gestures to activate certain system functions, which are shown in Table 1. These gestures were selected because they have been used in previous HDI literature, e.g., [67]. A small gesture guide is shown on the right edge of the screen.

3.1.3. Hardware Description and Setup

The system runs on an Intel® CoreTM i7-4710HQ CPU @ 2.50GHz 2501 MHz, 4 core(s), 8 logical processor(s) 16.0 GB RAM, and NVIDIA GeForce GTX 970 GPU. For the experiment described in this paper, we used Microsoft Azure Kinect.
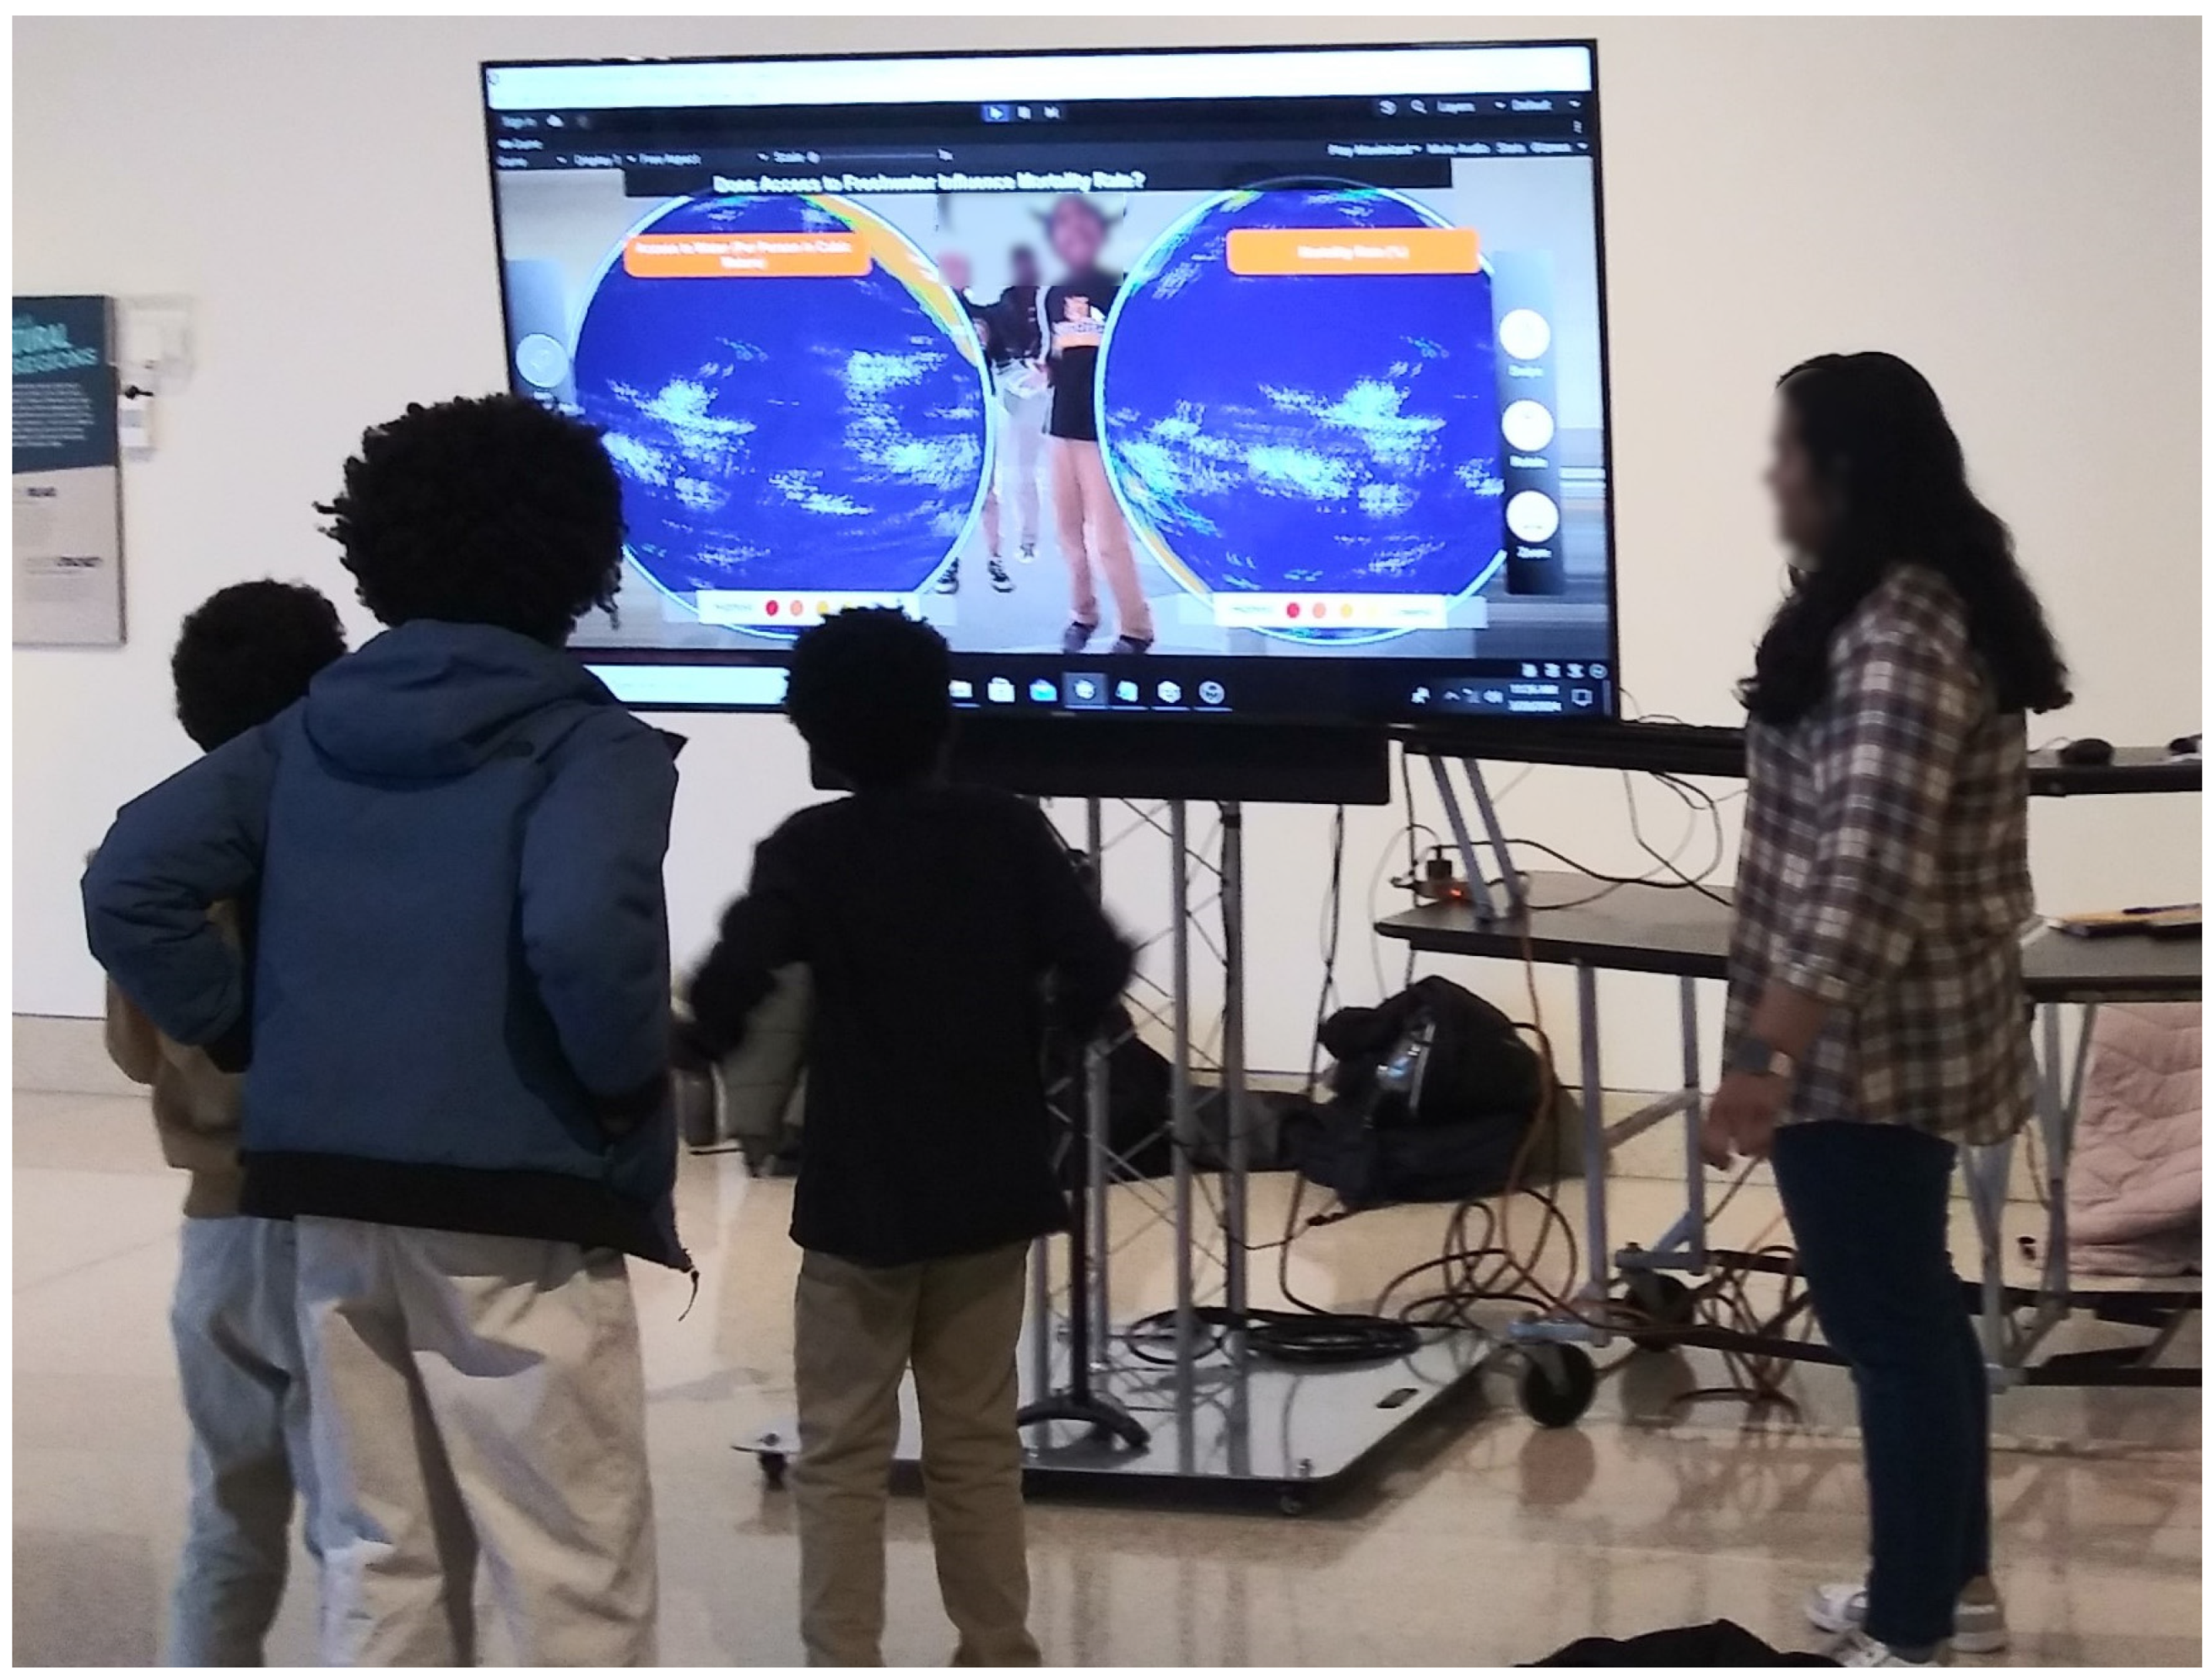
The visualization was shown on a 65“ TV screen with the Kinect camera placed directly below it, meaning that it was visible to participants. A table was placed behind the screen to hold the computer controlling the display. Researchers were standing around the display to monitor it for any glitches. When participants had questions or were not able to operate the screen, researchers tried to prompt visitors towards gestures that would allow them to interact with the display, and clarified who was in control of the display (see Figure 2).

3.2. Participants

The interactive display was set up at a large urban museum in the U.S. Midwest during weekdays in the spring.
Most children who interacted with our display were part of groups visiting the museum from local K-12 schools, rather than in smaller family units [44]. We came to this conclusion both as a result of children (and adult chaperones) wearing the same shirts with school names, as well as by verifying with a few of the chaperones that the groups were from local schools. Because of this, the ratio of children to adults was much higher than one would find with family units visiting museums [44]. Children self-selected to participate in the experiment by approaching the display at will. Through the IRB process, we obtained a waiver of consent on the basis that we were observing public behavior and wanted participants to naturally approach and leave the display without our intervention. Signs were placed around the display indicating that we were recording participants and our university affiliation. While they interacted with the display, moderators offered children guidance on how to interact with the display, and a few times asked them not to touch the Kinect sensor, but they remained respectful and encouraging the whole time. Children who asked researchers about the content of the display were told a quick summary of the topic on the screen. Adult caretakers who asked researchers about the purpose of the experiment were informed that we were investigating how children interacted with embodied museum displays.

3.3. Observations and Analysis Methods

3.3.1. Screen Captures

To capture data on participant interaction, we collected screen recordings of the computer controlling the display using open broadcaster software 32.0.1 (OBS), which did not impact system performance. These screen recordings contained camera footage of the participants with the background removed and the data visualization, showing us what the participants would have seen on the display during their interaction. However, these recordings had low sound quality, which did not allow us to understand what participants were saying.
We recorded a total of approximately 6 h of footage containing participant interaction (4 h of footage on 20 March (Wednesday), and approximately 2 h of footage on 21 March (Thursday)). The footage was divided into 12 30-min chunks, and we analyzed 6 chunks containing the most group participant interaction (4 from 20 March and 2 from 21 March). The nature of the camera footage in the screen capture with participant background cut out meant that, occasionally, participants were not visible in the footage even if they were in view of the camera. However, this footage did contain at least 200 distinct participants over the course of the observation.
One primary researcher initially watched the footage, taking notes on participants’ interaction with each other and assigning each participant a unique label. Using a thematic analysis approach [68], these notes and relevant video segments were then reviewed by a team of four researchers and relevant ones were grouped into themes.

3.3.2. Camera Footage Recordings

Additionally, we used camera footage as a complementary dataset. The camera was placed to unobtrusively record the participants’ activities and interactions within the study environment. This setup resulted in a total of 7 h 18 min of footage, which was divided into 10 separate video segments for ease of analysis.
One primary researcher was responsible for initially analyzing the recorded footage. This researcher was not the same one who initially coded the screen captures: we wanted two different, primary researchers to look at the same data from different perspectives (screen capture and camera footage). Each video segment was then reviewed and coded by a team of four researchers, with the relevant codes being systematically documented in an Excel spreadsheet, by a team of four researchers. This approach ensured consistency in the analysis process and facilitated a structured examination of the recorded interactions. Researchers marked instances of disagreement or video segments that required further discussion in the spreadsheet; all instances of disagreement were discussed and resolved during eight meetings.

3.4. Research Questions

This study adopted a qualitative and exploratory approach to investigate children’s interactions with a large, interactive data visualization screen in a museum setting. While our aim was to gain rich insights into children’s behaviors and interactions around our human–data interaction (HDI) prototype, the team of four researchers agreed to employ two guiding research questions to focus our thematic analysis:
  • RQ1. How do children interact socially and physically with data-centric interactive displays in a museum setting?
  • RQ2. What hindered children’s engagement with the data on display?
Although our study was qualitative and exploratory in nature, these research questions served as a framework for our analysis, helping us to identify key themes and patterns in the observed interactions. Within the framework provided by each research question, we then identified emergent themes from the video segments using an inductive approach, recognizing the exploratory nature of this research.

4. Results

4.1. RQ1. How Do Children Interact Socially and Physically with Data-Centric Interactive Displays in a Museum Setting?

  • Peer Instruction
Children often turned to each other for help when interacting with the display. In some cases, one child became the leader, figuring out how to interact with the display and then teaching or demonstrating to the others. The following excerpt demonstrates that this social dynamic reinforces the importance of peer learning in these contexts; each time a new child takes control, the others provide verbal and physical support, guiding and demonstrating how to interact with the display.
25:30: A moderator asks the group, “Who has the hat?”, instructing the teens on how to interact with the display. Initially confused, the group does not follow the gesture instructions.
One girl then takes the initiative, creating her own gesture by opening her arms and leading the others.
They immediately follow her cues, waving and jumping in front of the screen, experimenting with their positioning.
28:45: Another child, acting as the leader, calls to the others, “Guys, watch this!”, as he performs a swiping gesture to interact with the display.
The others mimic his actions, trying to swipe in unison. When a moderator explains that the child with the “fish on their head” is the controller, the other children actively support their peer, insisting, “Yes, you do, just swipe,” and demonstrating the gesture when their friend is unsure.
30:54: When another child receives control of the display, the group encourages him to “come closer” and “try swiping.”
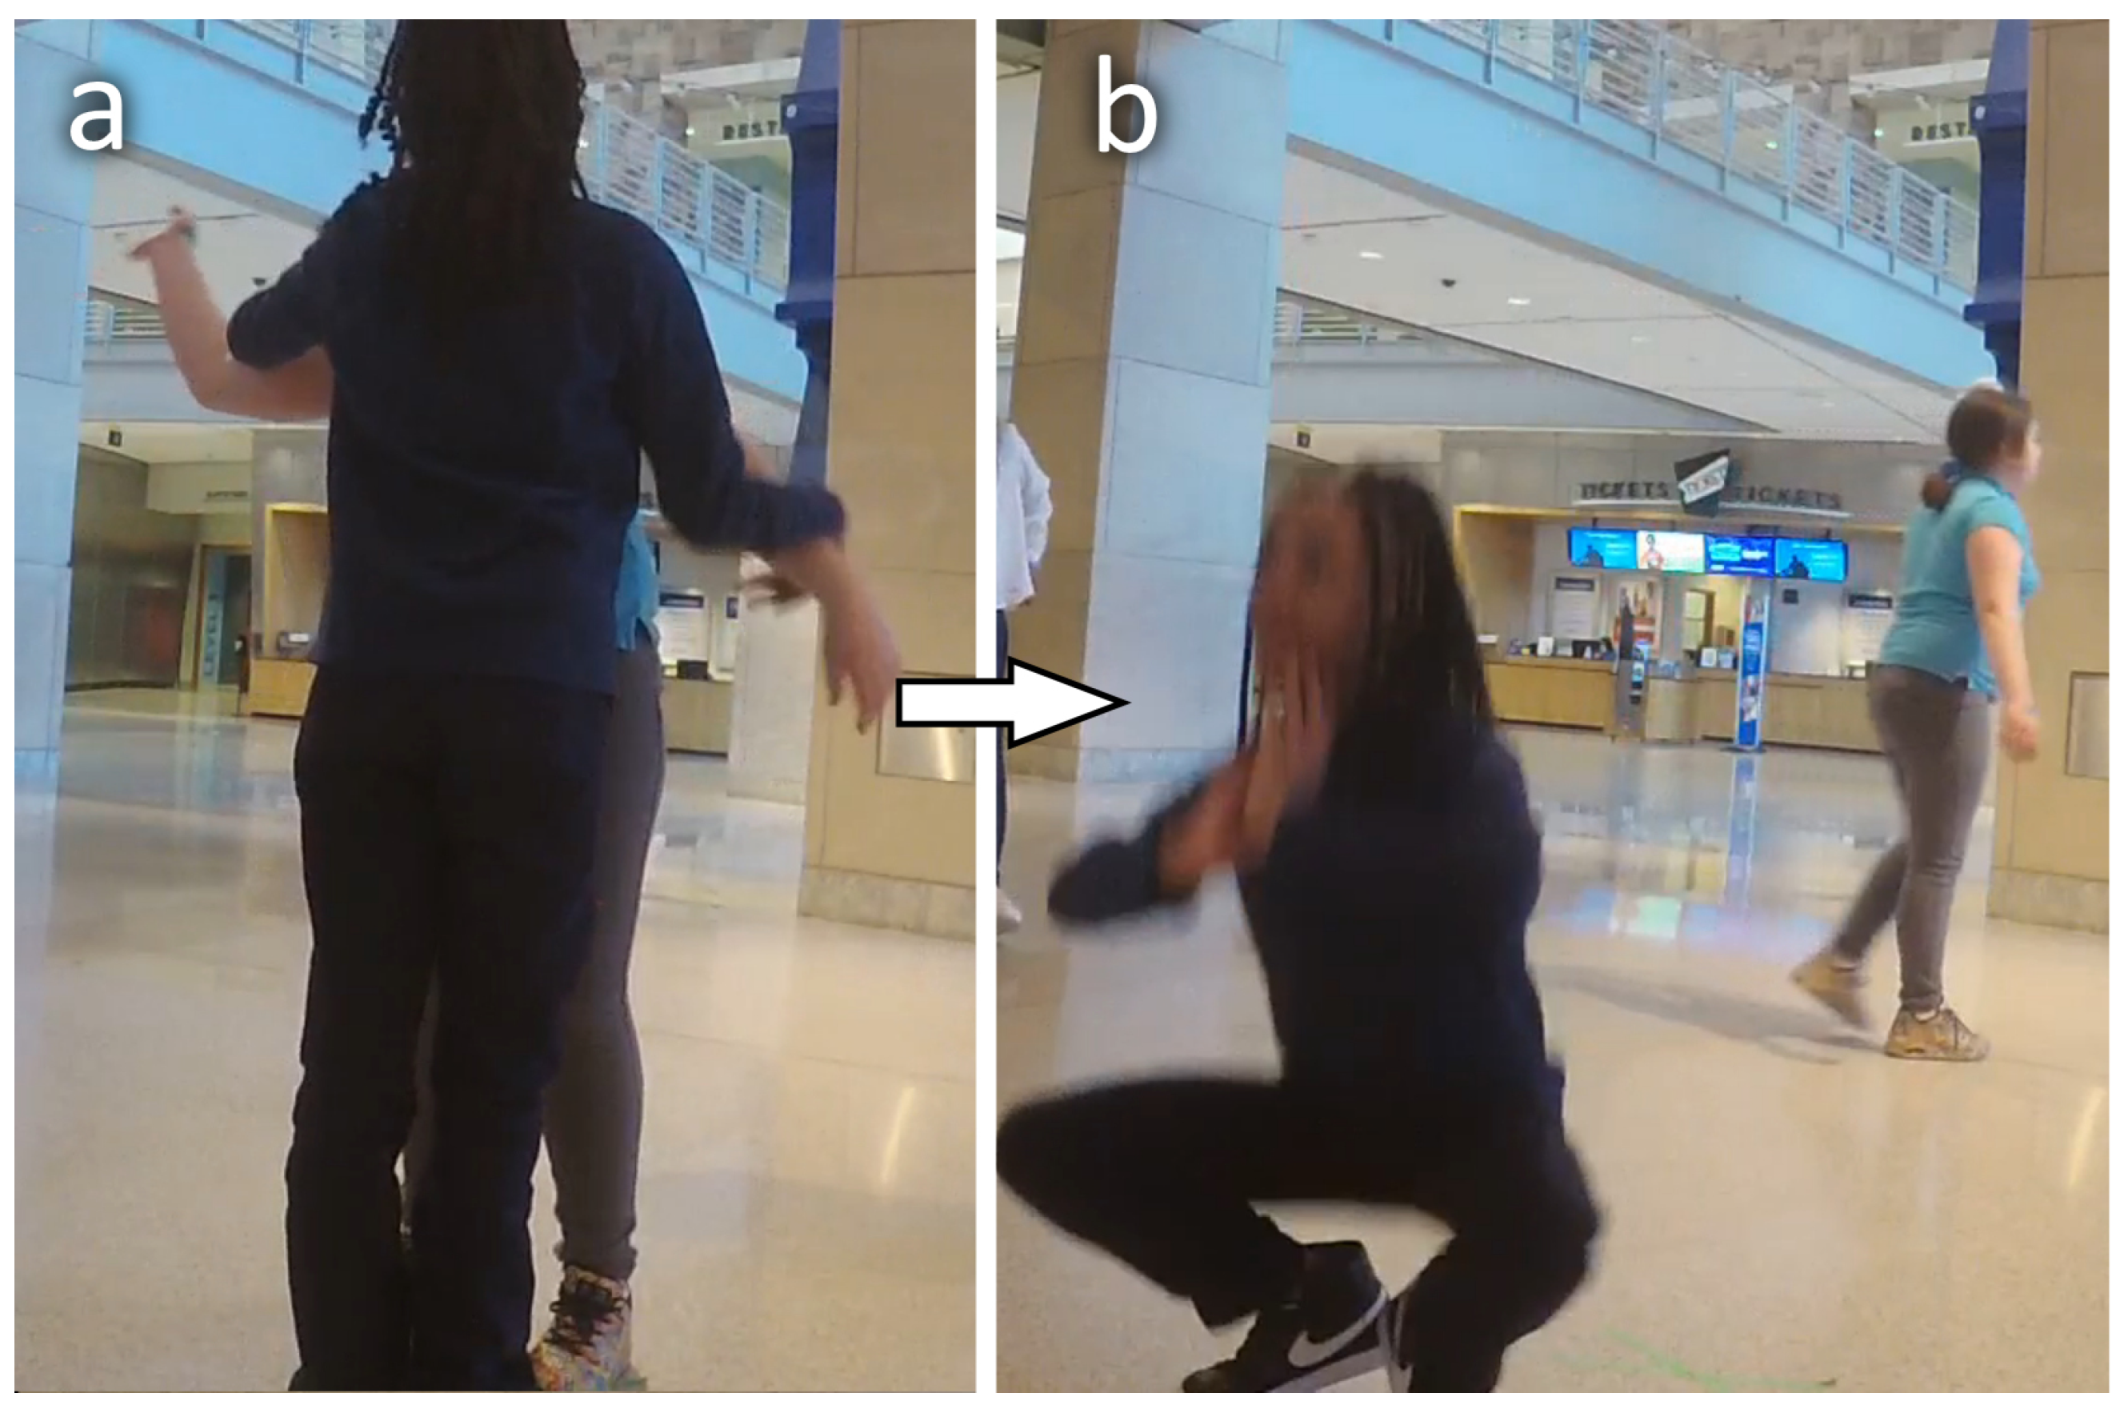
In another instance, one child who had been interacting with the display previously stood behind another who had just approached and gotten control of the display. The child behind held the one in front’s arms and was physically manipulating them to control the display, as shown in Figure 3. This was particularly interesting because it went beyond one child telling another what gestures they should do or just demonstrating them, and included one child moving another’s arms so they would perform the correct gestures.
While much peer instruction focused on navigating the interface, a particularly insightful moment occurred when one child, by pointing to the color scale and explaining the higher and lower coding to her companion (Figure 4), directly engaged in data interpretation. This highlights how peer-to-peer interactions can extend beyond physical control to attempts at understanding and discussing the visualized data.
  • Moderators and Parents’ Guidance
Because our display was still a prototype, researchers were standing nearby to help visitors navigate the interface and to mitigate technical issues. However, these researchers also took on a role as moderators who could play a pivotal role in guiding children’s interactions with the display. Their instructions, demonstrations, and adjustments to the technology ensure a smoother experience, helping children understand how to use the display and keeping interactions orderly. In the excerpt below, the interaction shows how moderators are crucial in guiding children’s use of the display. When confusion arose over control, the moderator made the instructions clearer, e.g., “The one with the fish on their head can swipe”, which helped the children understand the system and continue engaging meaningfully.
5:44: Several kids tried to take control of the display, causing confusion.
Moderator: “The one with the fish on their head can swipe.”
Kid: “Where is the fish?”
Moderator: “It switched. You’ll gesture… now it’s the fish.”
Later, as more kids approached, the moderator stepped in again to clarify:
Moderator: “Whoever has the fish is in control.”
However, in a non-experimental deployment, these moderators would not be present, so parents visiting the museum with children could play an active role in encouraging and enriching their children’s interaction with the digital display.
The excerpt below illustrates the critical role parents can play in enhancing their children’s engagement with interactive displays. The mother’s active participation helped her children navigate the controls and overcome initial confusion, thereby facilitating more productive interactions with the exhibit. Her guidance also mitigated potential conflicts between her children and other visitors, ensuring that everyone had an opportunity to engage with the display.
“1:04–6:25: A mother with two young children—Hannah, around 3–4 years old, and Iris, likely 2 years old—arrived at the display. The mother, immediately fascinated by the large screen, called out to her children, “Oh, Hannah, come here, look!” She waved at the screen and said excitedly, “Ohh, there you are. Heyyy,” as Hannah stepped in front of the screen and mimicked her gestures. The mother then asked, “What are you supposed to do? Do I spin?”
As the mother tried to figure out the controls, she started swinging her finger, mimicking a spinning action. The moderator intervened, explaining, “You can swipe.” The mother responded with, “Oh, swipe innnn,” demonstrating the action to Hannah. The moderator added, “You can also zoom in,” prompting the mother to say, “Oh, left, right. Oh, zoom in and out.” She continued to model the gestures for Hannah, who was now actively engaged with the display.
When a third child arrived and inquired, “Hey, what’s that?” while pointing at the screen, the moderator replied, “Hat.” The mother joined in, encouraging the child, “Do you want to swipe it?” As the child attempted to swipe but struggled, the moderator demonstrated, “Like that. To the right.” The mother reinforced this by saying, “There you go. See how it changed.”
Later, when Iris got too close to the camera, the mother directed her, “No touch, thank you,” and repositioned her children, saying, “Let Iris have one turn up front,” ensuring that each child had a fair chance to interact with the display. As the older sister returned to the screen, the mother reiterated, “Let’s go,” signaling the end of their session.”
  • Taking Turns
Children cooperated by trying to take turns and hand off control to each other. This type of turn-taking allowed different children to experiment with control of the display. At times, their peers stood by offering advice, while other moments saw them observing to learn the controls themselves (an example can be seen in Figure 5).
Some children took it as a cue to take turns when the system selected someone to control the display without purposeful input from the users. Once children noticed the control icon hovering over someone’s head, they would alert that person and encourage them to come into the center of the screen, with the one who had previously been in control often stepping aside to allow for this. However, we did see a few incidents in which the child who had previously been in control refused to allow a new child to take their place.
Children would verbally prompt each other with phrases like, “Back up so I can be in charge,” or “Now you try,” reflecting how these interactions promoted social skills and teamwork. In one instance, a group of five children gathered around the display. As one child took the lead by swiping the screen, the others stood behind, watching and mimicking his actions, but allowing him to maintain control.
  • Solo Interaction with the Display: One Actor and Multiple Spectators
We saw that children could be more productive in terms of learning how to control and understand the display either when on their own (before other children arrived or after they left) or were the only ones actively trying to control the display while others around them watched (though our system only supported single user interaction, multiple people could be seen on the screen). Multiple groups of children seemed to naturally organize themselves to let one person try to control the display while the others watched, though this was not a universal trend.
At one point, we saw three boys approach the display together with a few other children. Initially, they playfully interacted, danced and looked at their reflections on screen. The other children left soon after, but the three boys remained interested in the display, eventually taking turns trying to control the display one at a time while the others watched, as shown in Figure 5. During their individual time with the display, all of them made progress learning the controls with some guidance from the moderators and were able to manipulate the on-screen visualization.
  • Coordinated Team Efforts
Children exhibited a natural inclination toward social learning, often observing each other’s actions and taking turns to engage with the display, sharing their discoveries, offering suggestions, and encouraging peers to attempt different gestures. Despite the system design allowing only one person to control the display at a time, indicated by an icon hovering over the designated individual’s head, children often tried to participate collectively, following the guidance of a peer or a moderator.
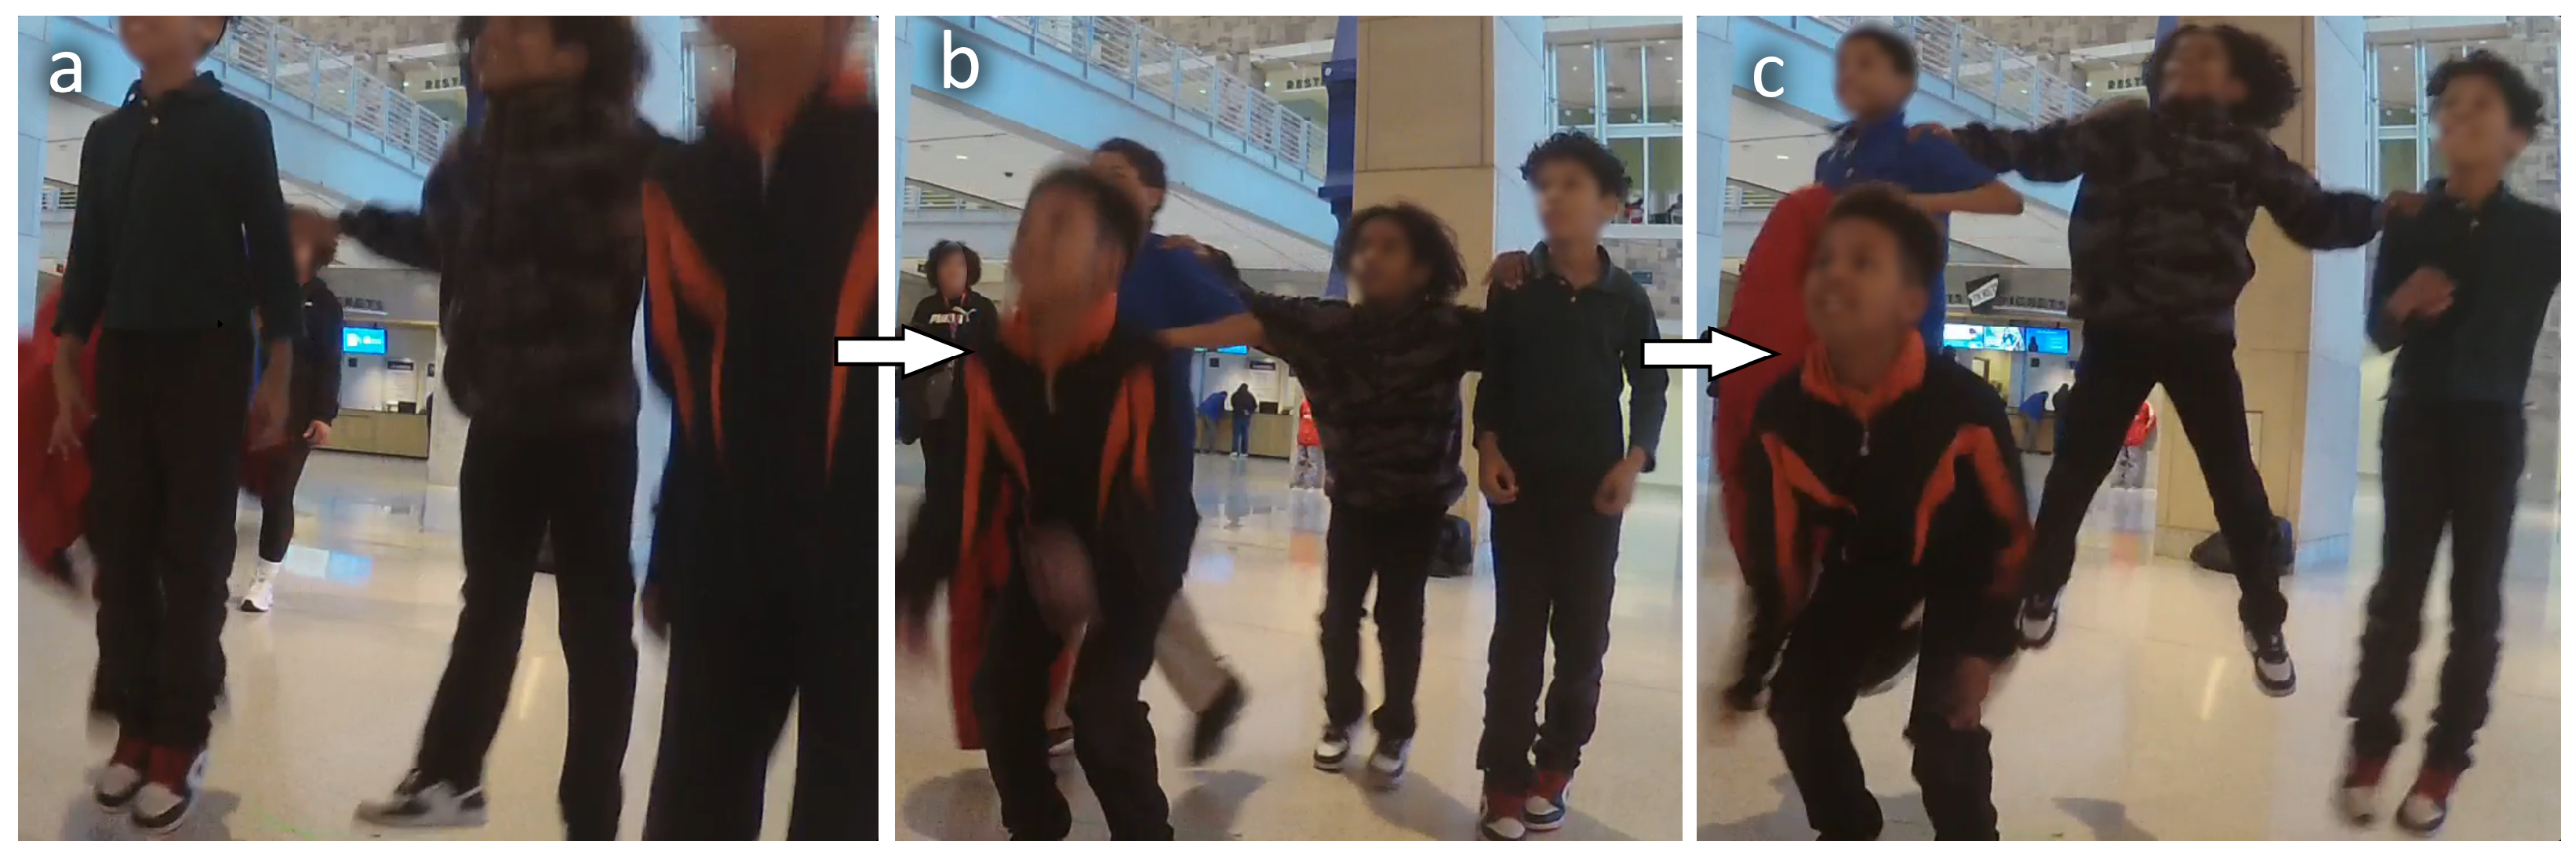
For instance, in one observation involving a group of four boys, approximately ten years old, they collectively attempted to switch datasets by jumping, though the footage did not clarify which of them had control. After about a minute of unsuccessful attempts, a chaperone intervened, instructing them, “One more jump, then we’re going inside [to rejoin the school group]”. In response, one of the boys placed his hands on two others’ shoulders and rallied the group by saying, “Everybody jump in 3, 2, 1”, resulting in a largely coordinated group jump before they left the display (Figure 6). Although their success in controlling the display was limited, this example highlights the children’s enjoyment and their collaborative efforts in engaging with the task.
  • Role-Playing and Imagination
Children frequently used the display as a platform for imaginative play, with the data’s themes directly influencing their scenarios. For instance, the underwater background for the fish endangerment dataset prompted multiple children to make gestures as if they were swimming or pretending to be fish, directly connecting their physical play to the environmental data presented. Their engagement showcased how role-playing allowed them to creatively interact with the display, adding a personal dimension to the experience. This type of imaginative engagement highlights how children make sense of the content by integrating the visualized data into their storytelling. In the following excerpt, two girls transformed the display into a weather forecast, narrating their own playful story. Such presenter roles seemed to be common choices, with a few other children trying to present the data as if they were news.
8:33: A group of older kids walks by the screen with their chaperone. One of the girls notices the display but doesn’t engage.
Another girl steps up and, seeing herself on the screen, starts walking as if on a runway.
A second girl joins her, role-playing, “Okay, guys, the forecast for today is... umm, cloudy, wet, well, not wet but... hmmm.”
They both look at the screen as she continues, “It’s cold and chilly, so kids may not be able to go outside. They might get cold and sick.”
Their chaperone calls, “Alright, girls, let’s go,” and they say goodbye, with one girl blowing kisses at the screen.
9:39: The girl turns back and blows another kiss to the camera before leaving.

4.2. RQ2. What Hindered Children’s Engagement with the Data on Display?

4.2.1. Barriers to Engaging with the Data

In several instances, a child’s actions, whether intentional or playful, disrupted others trying to engage with the visualizations or learn how to control the display. Children reacted to this interference in various ways: some tolerated it or passively observed, while others physically pushed the disruptive child out of the way. A few, frustrated by their inability to interact, would leave the display entirely.
For example, one boy repeatedly jumped in front of his peers, danced briefly, and then exited the area, only to return and repeat the behavior over a ten-minute period. He was pushed aside by other children on at least two occasions so they could interact with the display (see Figure 7). Although these interruptions were brief, their repetitive nature seemed to cause frustration among the other children.
In another case, a boy knelt directly in front of the camera, taking up a significant portion of the display’s visual field (see Figure 8). He also leaned side to side, which blocked other children from view. He retained control of the system throughout, preventing any other children from interacting with the display. One girl even stood over him and told him to move, though this did not escalate into physical conflict. He retained control of the system throughout, preventing any other children from interacting with the display and therefore from exploring the data visualizations themselves. Ultimately, the group remained clustered around the camera, and none were able to effectively engage with the display again.
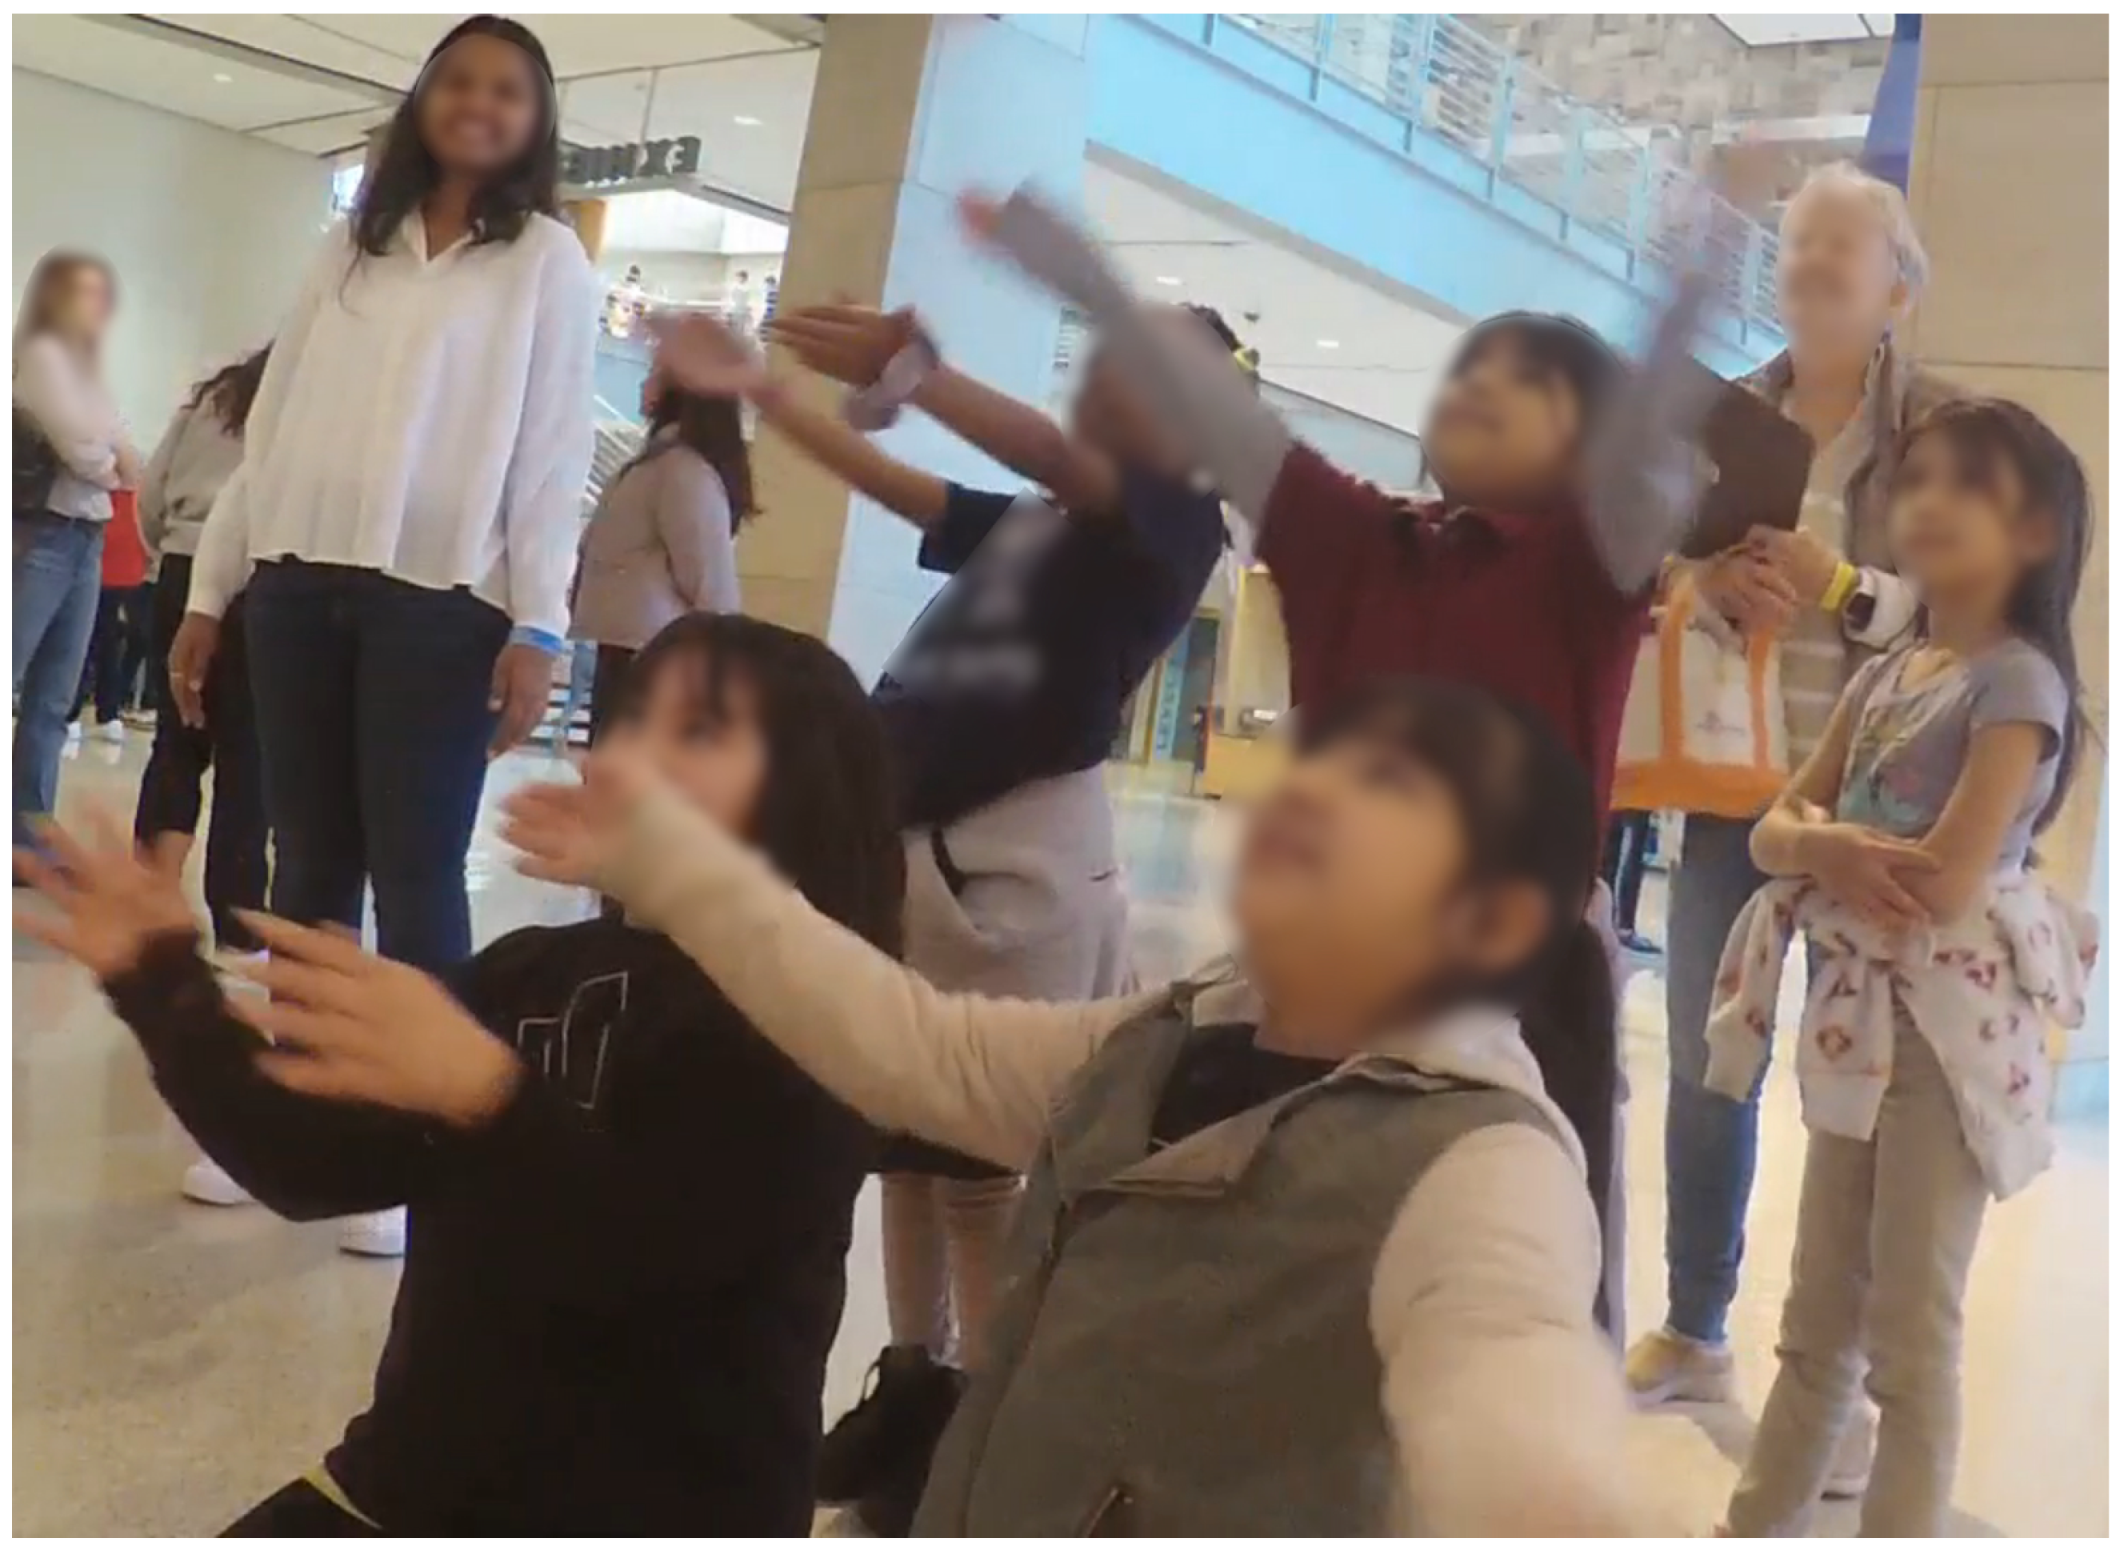
This is illustrative of a recurring issue we encountered with children clustering around the camera, usually pushing at each other to be able to see themselves on screen. A few children approached the camera and knelt down to see their faces larger on screen, and started making funny faces. Though they were amusing themselves, this prevented any of them from being able to control the display. If they were within one foot of the camera, it often also resulted in none of them being visible on the screen, as the display would default to the digital background when the camera was blocked.
The system’s design, which allowed only one child to control the display at any given time, could foster competition among the children. While competition is not uncommon in child–child interactions (as noted in [44]), this sometimes results in one child dominating the interaction, leaving others unable to participate and leading to frustration.
In one observed interaction, control shifted from a boy wearing a navy sweater to a girl in a blue polo shirt who had just approached the display. The boy then playfully but firmly blocked her attempts to move her arms and control the system, even stepping in front of her. This discouraged the girl, who walked away from the display soon after (see Figure 9).

4.2.2. Technology Does Not Respond as Expected to Gestures and Body Movements

Children were frustrated when the display did not respond as expected, which could push them away from the screen if the issue was not resolved. This is not a new finding, and it was expected, because communicating system affordances is a common challenge with embodied interaction, both with children and adults [11].
For example, in the excerpt below, one teenage visitor became frustrated after her repeated attempts to control the display met with failure. She asked for clarification on how to perform one of the control gestures and wondered if the display was broken. Notably, despite these setbacks, she was eventually able to control the display and appeared to be quite pleased when she did so: as we discussed in the previous section, moderators’ and parents’ guidance may help mitigate this problem.
Ava steps up to the display and begins using gestures, but quickly encounters difficulties. She asks, “How do you rotate the steering wheel, like this or...?”
Moderator: “Yeah, yeah, small steering wheel-like movements.”
Ava tries again but seems confused. Moderator: “You can zoom in, zoom out.”
Ava continues to struggle, and after a few failed attempts, says to the display, “What’s wrong? Stop!” She laughs, adding, “I like you right there.”
Finally, after repeated attempts, she says, “Yes, I got it. Okay,” but her frustration is evident.

4.3. An Example of Children’s Interaction with the Display

The following excerpt exemplifies dynamic interaction between two children as they explore a museum display together, highlighting the interplay between embodied movement, curiosity, social negotiation, and facilitated guidance.
An older child (7-8 years old) approaches the screen, sees her reflection, and exclaims, “Whaaaat?” She moves slowly side to side, testing the screen’s tracking.
Two women (likely moms) move closer. The child says, “Mom, I want to see what this is.” She gets closer, saying, “What’s this?” Another child (her friend) appears behind her and pushes her aside, saying, “I want to see.”
The moms tell the kids to back up.
The first child, who now has the hat with horns on the sides, says, “I’m a bull,” and they all laugh. Both kids stand in front of the screen, eyes fixed on it.
The second child says, “Why do I have the fire hydrant?” He pushes the first child again. The first child responds, “I’m the fire hydrant.”
They start jostling to get the hat. The first child says, “Switch already. How can we switch?” The second child replies, “It’s not a fire hydrant. It’s a water spell.” He points at the screen, saying, “You see that thing right here?”
The moms step in, “Don’t touch the screen.”
The second child repeats, “It’s a water spell.”
The facilitators arrive. “One at a time,” they instruct. “If you want to move the screen, you can swipe.”
The moms tell the kids, “One of you come here. One of you stay, okay? Try swiping.”
The facilitators demonstrate how to swipe.
“Jump once,” one facilitator instructs.
The first child jumps. The second child joins in, and they both start jumping. The first child counts, “1, 2, 3, and jump!” They laugh.
The moms remind them, “One at a time.”
The second child tells the first, “You get out of the way.”
The first child responds, “No, I’m a fish.”
The second child protests, “I want to be a fish. You go, go.”
The moms and facilitators repeat, “One at a time.”
The first child moves away while the second child continues. The moms show him how to use his hands to zoom in and out. “Now do this with your hands,” they say.
The second child ignores the instruction and jumps again.
The moms redirect, “Pay attention. Look, this way.”
The second child follows the hand motions, zooming in and out.
“There you go,” the moms say.
The facilitators show him how to turn the wheel, “Like driving a car.”
Everyone says, “Wow,” as they see the changes on the screen.
The moms express their delight, “Look at that.”
The child continues excitedly jumping. He jumps about 20 times.
The first child returns to the front and mimics the zooming and swiping gestures.
The moms conclude, “That’s cool.”
The group leaves.
Both children in this example engage the display through physical actions: swiping, jumping, and zooming; as the children move their bodies in response to the digital display, they are actively exploring its affordances, testing boundaries, and learning through trial and error. Furthermore, the interaction between the two children highlights a key theme in this study: the negotiation of control in shared digital spaces. Both children demonstrate a strong desire to take on specific roles within the digital environment, whether it is being a “bull” or a “fish”, but this desire leads to moments of conflict. The children push and jostle, trying to gain control of the hat or the screen’s tracking. This competitive negotiation is an important part of their learning experience, as it reflects how children assert agency and navigate shared experiences with peers.
The children’s interactions are also marked by moments of imitation and feedback. The second child closely observes the first’s actions before jumping in to replicate them. The facilitators’ and mothers’ feedback, both verbal and physical demonstrations, guides the children, but their learning is often led by their own curiosity. For instance, when the second child repeatedly jumps instead of following the mothers’ gestures, it shows a tendency to prioritize immediate physical engagement over more complex actions like zooming or turning the wheel.
Finally, the excerpt showcases how children integrate play into their interactions with the display; they engage in role-play, where virtual objects like the “bull” or “fire hydrant” take on imaginative meanings. The second child even reinterprets the “fire hydrant” as a “water spell”, further highlighting the creative ways children make sense of the digital environment. This playful engagement enriches their experience, turning what might otherwise be a simple interaction with a display into a deeper, more meaningful encounter.

5. Discussion

5.1. Implications for the Design of Human–Data Interaction (HDI) Installations “with” Children

Children’s interactions with museum exhibits differ from those of adults or mixed groups, often involving energetic, spontaneous, and highly physical engagement, including simultaneous interface use and gestural communication [2,44]. While prior research on HDI in museums has generally addressed families or undifferentiated visitors [11,37,44], groups with a high proportion of children (such as school field trips) present distinct social dynamics, with children engaging more with peers than adults [69]. This makes children an essential user group for HDI design, as their collaborative and hands-on behaviors can inform systems that foster early data literacy and can be translated to other high-energy audiences.
By actively involving children, designers can ensure that the interactive elements not only capture their attention but also intuitively guide them towards understanding and interpreting the displayed data, fostering early data literacy skills. Conducting participatory design activities that directly involve children in the design and testing of installations can reveal which gestures are intuitive and enjoyable for children [70]. For example, workshops and role-play design activities with children (e.g., as in [71]) could inform interactive and narrative elements, resulting in HDI systems that support children’s imaginative and collaborative learning.

5.2. Designing for Different Age Groups

We want to acknowledge different trends that we noticed across different age groups.
Toddlers and Preschoolers (2–4 years) are highly curious, engaging in exploratory, sensory play and mimicry-based interactions [72,73]. For instance, younger children closely observed and imitated older siblings’ engagement with the display. Designs for this age should also prioritize highly responsive visual feedback to their movements.
Early Elementary (5–7 years) children can follow simple instructions and enjoy movement-based tasks with immediate feedback [74,75]. Adult guidance is particularly effective in facilitating their participation.
Late Elementary (8–10 years) children exhibit greater independence, mastery orientation, and competitiveness [76,77]. For example, children in this age group often attempted to control the display and demonstrate their skills to other children [78].
Preteens (10–12 years) are technologically adept and look for logic and functionality in exhibits [79]. They prefer independent exploration and quickly disengage if tasks do not meet their interests.

5.3. Supporting Peer Collaboration

Children’s cognitive development benefits from both physical and social learning. Through collaboration and shared experiences, they construct understanding by discussing and clarifying concepts with peers [58]. While interacting with our HDI prototype, children frequently demonstrated gestures and gave verbal instructions to each other, enhancing comprehension and fostering shared ownership [80].
Many children engaged in group activities, such as performing gestures together and teaching peers, behaviors that promote interest in the display and socialization [29,69]. Interestingly, this peer-driven exploration occurred without adult prompting.
Thus, designers can encourage peer learning by incorporating spaces for children to share findings and by embedding collaborative features, such as assigning roles (e.g., “navigator” or “data analyst”) or requiring coordinated actions (like the waving seen in Figure 10). Activities encouraging older children to mentor younger ones can further facilitate collaborative learning. Future research should explore scaffolding strategies to support these dynamics.

5.4. Facilitating Control and Taking Turns

During our observations, we saw children at times struggle to control the display. Our system recognized gestures that required small, precise movements. Most children used large, exaggerated rotations, for example, bringing their hands from horizontal to vertical when performing our “steering wheel” gesture, which the system didn’t recognize. This highlights the need to design gestures that align with children’s natural movements.
The social interaction around the HDI display also presented challenges. Competition for control or disruptive behaviors sometimes hindered collaboration. For example, some children dominated interactions, derailing the social learning that could have occurred, while leaving others unable to participate effectively. Addressing these challenges requires design interventions, such as dynamic control mechanisms or structured prompts to guide equitable participation [42,44]. Adult intervention, such as prompting children to take turns, helped, but was not always present. In our implementation, the system switched the person in control when another child occluded the field of view of the tracking camera. Interestingly, the children seemed to take the display, switching the child who was in control, as a cue to take turns. To take advantage of this, we suggest creating a system that periodically switches who is in control when multiple people are in front of the display. We suggest using simple mental patterns such as “front-back” to designate who has control of the system [81]. One method would be to have the person closest to the camera selected as the controller, or whichever person is in a particular position in front of the display. Additionally, it may be beneficial for the display to more clearly designate who is in control through methods like outlines or more visible or explicit control icons. We believe that this would encourage the children already interacting with the display to take turns, and could encourage more reluctant children to interact if the system “chooses” them.

5.5. Preventing Overcrowding

Our camera was positioned in plain view of participants beneath the screen, and most users recognized it as the source of the live video feed. This visibility encouraged some children to repeatedly approach the camera to make their faces or bodies appear larger on the screen. One potential solution is to place a physical barrier between participants and the camera to keep them at an appropriate distance. Another potential solution would be to have an onscreen indication that users were too close to the camera and prompt them to back up. While our display already responded to close proximity by showing only the digital background when participants came too close for the Kinect camera to detect them, this mechanism proved insufficient. Children often ignored the response, especially when competing with peers to appear on screen. More dynamic feedback, such as playful animations or auditory cues when participants step back into the optimal range, could increase engagement while guiding appropriate behavior.

5.6. Supporting Play and Imagination with Data

Children approach museum exhibits eager to play, and this enthusiasm can be channeled to enhance their learning experiences [80]. It can be especially useful to help children push past the initial confusion and questions, as the fun of experimenting with the system could overcome frustration as they figure out how to control the display [11,44,54]. Playful interactions also demonstrated social learning [82]. Children engaged in role-playing activities, such as pretending to swim with the ocean-themed visualization or acting as newscasters while interpreting data. These playful scenarios allowed children to explore abstract concepts in a relatable and imaginative way, potentially deepening their understanding while building social connections [29].
However, this playfulness may mean that a traditional data interpretation approach that focuses on learning outcomes may not be best suited to children [2]. Instead, given children’s inclination towards role-playing and show and tell (as seen in both our observations and [80]), it may be more useful to help children take a perspective on the data or to see themselves inside, and communicate what they see to others [2].
In other words, playfulness can be a powerful tool for engaging children with data visualization, but designers should structure the experience in a way that connects children’s imagination to the information on display. In our study, we noticed that a properly designed icon to identify active users (in our case, a fish icon or a water pump icon displayed above the user) was sometimes the spark for children’s role play and imagination. In a broader sense, this means that data should not be presented in isolation but, rather, be embedded into a consistent visual narrative. For example, the visualization could be framed as a journey through an underwater world, with the data points representing different creatures or features of the environment. Additionally, designers should provide tools or prompts that encourage children to create their own stories based on the data. Examples could include interactive elements that allow children to manipulate the visualization to create different scenarios based on the data, or allowing children to choose a persona related to the data (e.g., a scientist, an explorer, and a creature from the visualized ecosystem) and make choices that affect the visualization based on their role and the data narrative.

6. Limitations and Future Work

A future version of the display should allow multiple children to control individual globes at the same time, promoting collaborative sense-making of different datasets. For example, having the TV screen divided in half (left and right) to allow two users to control half of the application could mitigate some of the competition for control that we observed. Additionally, the current brief instructions at the screen’s edges were likely too inconspicuous, highlighting the need to test more effective ways of communicating instructions.
The technical setup can benefit from an updated GPU. If memory clearance is not properly handled in Unity (either in the custom-made code or in the tracking libraries), leaving the system unattended for extended periods may cause performance degradation and lag. Replacing the GPU we used (GTX 970) with a more recent one, like GTX 980, may help.
During our deployment, we could not interview visitors about their learning, relying solely on observing children’s interactions. Over the course of this study, we did not prompt participants to discuss the data on screen, so we did not collect enough learning talk to conduct an analysis of learning. Future research should prioritize direct measurement of learning outcomes and ways to get children more engaged in data-related conversations, using user feedback to assess comprehension and engagement. Additionally, it could compare the learning talk facilitated by our prototype vs. the conversations that spark with different prototypes or more traditional, non-interactive installations.
Our prototype was located in a lobby setting; display placement in other exhibit halls might yield different themes. It could also be valuable to test the display in different locations, both within museums and other public spaces [51], because the context can influence user interaction.

7. Conclusions

This study examined how children interact with a large, interactive data visualization in a museum setting. We observed that children engaged with the exhibit in diverse ways, incorporating play, collaboration, and peer learning into their exploration of the data. While the gesture-based interface typical of human–data interaction (HDI) installations encouraged physical engagement and social interaction, it also presented challenges related to control and competition.
Our findings highlight the importance of designing HDI installations for children that are engaging, playful, supportive of social interaction, and foster children’s imagination and role-play.
This research contributes to HDI by showing how complex data visualizations can be presented to children in an engaging and educational way through interactive displays. By creating embodied experiences that connect abstract concepts to physical actions, we can help children relate the data to their own lives, making the learning experience more memorable. Further research is needed to explore the long-term impact of HDI installations (and the design strategies that we discuss in this paper) on children’s learning and attitudes towards data.

Author Contributions

Conceptualization, A.F., E.G.S., and F.C.; methodology, A.F., E.G.S., N.P., A.A., and F.C.; software, A.A.; formal analysis, A.F., M.T., E.G.S., N.P., and F.C.; investigation, A.F., M.T., E.G.S., N.P., and F.C.; resources, A.F. and F.C.; data curation, A.F. and E.G.S.; writing—original draft preparation, A.F. and E.G.S.; writing—review and editing, A.F., M.T., E.G.S., N.P., A.A., and F.C.; visualization, A.A., A.F., and N.P.; supervision, F.C.; project administration, A.F. and F.C.; funding acquisition, F.C. All authors have read and agreed to the published version of the manuscript.

Funding

This research was funded by the Indiana University BRIDGE grant “Facilitating Sense Making of Causation and Correlation Through Embodied Human–Data Interaction”.

Institutional Review Board Statement

The study was conducted in accordance with the Declaration of Helsinki and approved by the Institutional Review Board (IRB) of Indiana University (protocol number 1706015718, date of approval 12 September 2020).

Informed Consent Statement

This is how informed consent was collected: the study took place in a public area of the museum. A moderator informed participants that if they entered the interactive area, they would be recorded. A sign was on display at the entrance of the experimental area. Next to the sign, a study information sheet (SIS) provided details on the study and on how to be removed from the study. Parents and children were informed that the museum exhibit was being recorded for research and directed to the SIS. If children were with a parent, researchers discussed participation with both the child and parent.

Data Availability Statement

Data (video recordings) are unavailable due to privacy and IRB restrictions.

Acknowledgments

Special thanks to Aravindh Nagarajan and Sravani Muddana for their contribution to the system implementation. We would like to thank Nandini Solse, Fernando Luna, Mohini Gakiwad, Nachiketa Patel, Sharanya Pisharody, and Sriya Bandarupalli for their help with the deployment. We would also like to thank the Indiana State Museum for hosting us.

Conflicts of Interest

The authors declare no conflicts of interest.

Abbreviations

The following abbreviations are used in this manuscript:
HDIHuman–Data Interaction
PIDsPublic Interactive Displays
SDKSoftware Development Kit
IRBInstitutional Review Board

References

  1. Wolff, A.; Wermelinger, M.; Petre, M. Exploring design principles for data literacy activities to support children’s inquiries from complex data. Int. J.-Hum.-Comput. Stud. 2019, 129, 41–54. [Google Scholar] [CrossRef]
  2. Roberts, J.; Lyons, L.; Cafaro, F.; Eydt, R. Interpreting data from within: Supporting human-data interaction in museum exhibits through perspective taking. In Proceedings of the ACM International Conference Proceeding Series, Aarhus Denmark, 17–20 June 2014; Association for Computing Machinery: New York, NY, USA, 2014; pp. 7–16. [Google Scholar] [CrossRef]
  3. Rogoff, B. Apprenticeship in Thinking: Cognitive Development in Social Context; Oxford University Press: Oxford, UK, 1990. [Google Scholar]
  4. Antle, A.N. Research opportunities: Embodied child–computer interaction. Int. J.-Child-Comput. Interact. 2013, 1, 30–36. [Google Scholar] [CrossRef]
  5. Atkins, L.J.; Velez, L.; Goudy, D.; Dunbar, K.N. The unintended effects of interactive objects and labels in the science museum. Sci. Educ. 2009, 93, 161–184. [Google Scholar] [CrossRef]
  6. Andre, L.; Durksen, T.; Volman, M.L. Museums as avenues of learning for children: A decade of research. Learn. Environ. Res. 2017, 20, 47–76. [Google Scholar] [CrossRef]
  7. Eriksson, E.; Baykal, G.E.; Torgersson, O. The role of learning theory in child-computer interaction—A semi-systematic literature review. In Proceedings of the 21st Annual ACM Interaction Design and Children Conference, Braga, Portugal, 27–30 June 2022; pp. 50–68. [Google Scholar]
  8. Cafaro, F. Using embodied allegories to design gesture suites for human-data interaction. In Proceedings of the 2012 ACM Conference on Ubiquitous Computing—UbiComp’12, Pittsburgh, PA, USA, 5–8 September 2012; p. 560. [Google Scholar] [CrossRef]
  9. Elmqvist, N. Embodied human-data interaction. In Proceedings of the ACM CHI 2011 Workshop “Embodied Interaction: Theory and Practice in HCI, Vancouver, BC, Canada, 7–12 May 2011; Volume 1, pp. 104–107. [Google Scholar]
  10. Cafaro, F.; Roberts, J. Data Through Movement: Designing Embodied Human-Data Interaction for Informal Learning; Springer Nature: Berlin/Heidelberg, Germany, 2022. [Google Scholar]
  11. Trajkova, M.; Alhakamy, A.; Cafaro, F.; Mallappa, R.; Kankara, S.R. Move Your Body: Engaging Museum Visitors with Human-Data Interaction. In Proceedings of the 2020 CHI Conference on Human Factors in Computing Systems—CHI ’20, Honolulu, HI, USA, 25–30 April 2020; pp. 1–13. [Google Scholar] [CrossRef]
  12. Mishra, S.; Cafaro, F. Full body interaction beyond fun: Engaging museum visitors in human-data interaction. In Proceedings of the Twelfth International Conference on Tangible, Embedded, and Embodied Interaction, Stockholm, Sweden, 18–21 March 2018; pp. 313–319. [Google Scholar]
  13. Dourish, P. Where the Action Is; MIT Press: Cambridge, MA, USA, 2001. [Google Scholar]
  14. Hornecker, E. The role of physicality in tangible and embodied interactions. Interactions 2011, 18, 19–23. [Google Scholar] [CrossRef]
  15. Perry, D.L. What Makes Learning Fun? Principles for the Design of Intrinsically Motivating Museum Exhibits; Rowman Altamira: Lanham, MD, USA, 2012. [Google Scholar]
  16. Lindgren, R.; Tscholl, M.; Wang, S.; Johnson, E. Enhancing learning and engagement through embodied interaction within a mixed reality simulation. Comput. Educ. 2016, 95, 174–187. [Google Scholar] [CrossRef]
  17. Kostic, Z.; Dumas, C.; Pratt, S.; Beyer, J. Exploring Mid-Air Hand Interaction in Data Visualization. IEEE Trans. Vis. Comput. Graph. 2023, 30, 6347–6364. [Google Scholar] [CrossRef]
  18. Eslambolchilar, P.; Stawarz, K.; Dias, N.V.; McNarry, M.A.; Crossley, S.G.; Knowles, Z.; Mackintosh, K.A. Tangible data visualization of physical activity for children and adolescents: A qualitative study of temporal transition of experiences. Int. J.-Child-Comput. Interact. 2023, 35, 100565. [Google Scholar] [CrossRef]
  19. Johnson-Glenberg, M.C.; Megowan-Romanowicz, C. Embodied science and mixed reality: How gesture and motion capture affect physics education. Cogn. Res. Princ. Implic. 2017, 2, 24. [Google Scholar] [CrossRef] [PubMed]
  20. Johnson-Glenberg, M.C.; Yu, C.S.P.; Liu, F.; Amador, C.; Bao, Y.; Yu, S.; LiKamWa, R. Embodied mixed reality with passive haptics in STEM education: Randomized control study with chemistry titration. Front. Virtual Real. 2023, 4, 1047833. [Google Scholar] [CrossRef]
  21. Acevedo, P.; Magana, A.J.; Walsh, Y.; Will, H.; Benes, B.; Mousas, C. Embodied immersive virtual reality to enhance the conceptual understanding of charged particles: A qualitative study. Comput. Educ. X Real. 2024, 5, 100075. [Google Scholar] [CrossRef]
  22. Price, S.; Yiannoutsou, N.; Vezzoli, Y. Making the body tangible: Elementary geometry learning through VR. Digit. Exp. Math. Educ. 2020, 6, 213–232. [Google Scholar] [CrossRef]
  23. Tölgyessy, M.; Dekan, M.; Chovanec, L. Skeleton tracking accuracy and precision evaluation of kinect v1, kinect v2, and the azure kinect. Appl. Sci. 2021, 11, 5756. [Google Scholar] [CrossRef]
  24. Funken, M.; Hanne, T. Comparing Classification Algorithms to Recognize Selected Gestures Based on Microsoft Azure Kinect Joint Data. Information 2025, 16, 421. [Google Scholar] [CrossRef]
  25. Popovici, D.M.; Iordache, D.; Comes, R.; Neamțu, C.G.D.; Băutu, E. Interactive exploration of virtual heritage by means of natural gestures. Appl. Sci. 2022, 12, 4452. [Google Scholar] [CrossRef]
  26. Mendoza, M.A.D.; De La Hoz Franco, E.; Gómez, J.E.G. Technologies for the preservation of cultural heritage—A systematic review of the literature. Sustainability 2023, 15, 1059. [Google Scholar] [CrossRef]
  27. Ress, S.; Cafaro, F.; Bora, D.; Prasad, D.; Soundarajan, D. Mapping history: Orienting museum visitors across time and space. J. Comput. Cult. Herit. (JOCCH) 2018, 11, 1–25. [Google Scholar] [CrossRef]
  28. Müller, J.; Walter, R.; Bailly, G.; Nischt, M.; Alt, F. Looking Glass: A Field Study on Noticing Interactivity of a Shop Window. In Proceedings of the SIGCHI Conference on Human Factors in Computing Systems, Austin, TX, USA, 5–10 May 2012. [Google Scholar] [CrossRef]
  29. Ackad, C.; Tomitsch, M.; Kay, J. Skeletons and Silhouettes: Comparing User Representations at a Gesture-based Large Display. In Proceedings of the 2016 CHI Conference on Human Factors in Computing Systems—CHI ’16, San Jose, CA, USA, 7–12 May 2016; pp. 2343–2347. [Google Scholar] [CrossRef]
  30. Mortier, R.; Haddadi, H.; Henderson, T.; McAuley, D.; Crowcroft, J. Human-Data Interaction: The Human Face of the Data-Driven Society. 2014. Available online: https://ssrn.com/abstract=2508051 (accessed on 21 October 2025).
  31. Victorelli, E.Z.; Dos Reis, J.C.; Hornung, H.; Prado, A.B. Understanding human-data interaction: Literature review and recommendations for design. Int. J.-Hum.-Comput. Stud. 2020, 134, 13–32. [Google Scholar] [CrossRef]
  32. Roberts, J.; Lyons, L. The value of learning talk: Applying a novel dialogue scoring method to inform interaction design in an open-ended, embodied museum exhibit. Int. J.-Comput.-Support. Collab. Learn. 2017, 12, 343–376. [Google Scholar] [CrossRef]
  33. Schauble, L.; Gleason, M.; Lehrer, R.; Bartlett, K.; Petrosino, A.; Allen, A.; Clinton, K.; Ho, E.; Jones, M.; Lee, Y.S.; et al. Supporting science learning in museums. In Learning Conversations in Museums; Routledge: Oxfordshire, UK, 2003; pp. 428–455. [Google Scholar]
  34. Black, G. The Informal Museum Learning Experience. In Museums and the Challenge of Change; Routledge: Oxfordshire, UK, 2020; pp. 145–159. [Google Scholar]
  35. Roberts, J.; Lyons, L. Examining spontaneous perspective taking and fluid self-to-data relationships in informal open-ended data exploration. In Situating Data Science; Routledge: Oxfordshire, UK, 2022; pp. 32–56. [Google Scholar]
  36. Falk, J.H.; Dierking, L.D. The Museum Experience Revisited; Routledge: Oxfordshire, UK, 2016. [Google Scholar]
  37. Cafaro, F.; Panella, A.; Lyons, L.; Roberts, J.; Radinsky, J. I see you there! Developing identity-preserving embodied interaction for museum exhibits. In Proceedings of the SIGCHI Conference on Human Factors in Computing Systems, Paris, France, 27 April 2013; pp. 1911–1920. [Google Scholar] [CrossRef]
  38. Parker, C.; Tomitsch, M.; Kay, J. Does the public still look at public displays? A field observation of public displays in the wild. In Proceedings of the ACM on Interactive, Mobile, Wearable and Ubiquitous Technologies, Singapore, 8–12 October 2018; Volume 2, pp. 1–24. [Google Scholar]
  39. Parker, C.; Tomitsch, M.; Davies, N.; Valkanova, N.; Kay, J. Foundations for Designing Public Interactive Displays that Provide Value to Users. In Proceedings of the 2020 CHI Conference on Human Factors in Computing Systems—CHI ’20, Honolulu, HI, USA, 25–30 April 2020; pp. 1–12. [Google Scholar] [CrossRef]
  40. Müller, J.; Wilmsmann, D.; Exeler, J.; Buzeck, M.; Schmidt, A.; Jay, T.; Krüger, A. Display blindness: The effect of expectations on attention towards digital signage. In Pervasive Computing, Proceedings of the 7th International Conference, Pervasive 2009, Nara, Japan, 11–14 May 2009; Proceedings 7; Springer: Berlin/Heidelberg, Germany, 2009; pp. 1–8. [Google Scholar]
  41. Parra, G.; Klerkx, J.; Duval, E. Understanding Engagement with Interactive Public Displays: An Awareness Campaign in the Wild. In Proceedings of the International Symposium on Pervasive Displays—PerDis ’14, Copenhagen, Denmark, 3–4 June 2014; pp. 180–185. [Google Scholar] [CrossRef]
  42. Memarovic, N.; Langheinrich, M.; Alt, F.; Elhart, I.; Hosio, S.; Rubegni, E. Using Public Displays to Stimulate Passive Engagement, Active Engagement, and Discovery in Public Spaces. In Proceedings of the Media Architecture Biennale Conference: Participati, Aarhus, Denmark, 15–17 November 2012. [Google Scholar]
  43. Weber, D.; Voit, A.; Kollotzek, G.; van der Vekens, L.; Hepting, M.; Alt, F.; Henze, N. PD notify: Investigating personal content on public displays. In Proceedings of the Extended Abstracts of the 2018 CHI Conference on Human Factors in Computing Systems, Montreal, QC, Canada, 21–26 April 2018; pp. 1–6. [Google Scholar]
  44. Horn, M.S.; Banerjee, A.; Bar-El, D.; Wallace, I.H. Engaging families around museum exhibits: Comparing tangible and multi-touch interfaces. In Proceedings of the Interaction Design and Children Conference—IDC ’20, London, UK, 21–24 June 2020; pp. 556–566. [Google Scholar] [CrossRef]
  45. Kruger, R.; Carpendale, M. Orientation and Gesture on Horizontal Displays. In Proceedings of the UbiComp 2002 Workshop on Collaboration with Interactive Walls and Tables, Citeseer, Göteborg, Sweden, 29 September–1 October 2002. [Google Scholar]
  46. Alt, F.; Shirazi, A.S.; Kubitza, T.; Schmidt, A. Interaction techniques for creating and exchanging content with public displays. In Proceedings of the SIGCHI Conference on Human Factors in Computing Systems, Paris, France, 27 April –2 May 2013; pp. 1709–1718. [Google Scholar]
  47. Dalsgaard, P.; Dindler, C.; Halskov, K. Understanding the dynamics of engaging interaction in public spaces. In Human-Computer Interaction–INTERACT 2011, Proceedings of the 13th IFIP TC 13 International Conference, Lisbon, Portugal, 5–9 September 2011; Proceedings, Part II 13; Springer: Berlin/Heidelberg, Germany, 2011; pp. 212–229. [Google Scholar]
  48. Müller, J.; Alt, F.; Michelis, D.; Schmidt, A. Requirements and design space for interactive public displays. In Proceedings of the 18th ACM International Conference on Multimedia, Firenze, Italy, 25–29 October 2010; pp. 1285–1294. [Google Scholar]
  49. Müller, M.; Otero, N.; Milrad, M. Guiding the design and implementation of interactive public displays in educational settings. J. Comput. Educ. 2024, 11, 823–854. [Google Scholar] [CrossRef]
  50. Mai, C.; Hußmann, H. The Audience Funnel for Head Mounted Displays in Public Environments. In Proceedings of the 2018 IEEE 4th Workshop on Everyday Virtual Reality (WEVR), Virtual, 18 March 2018; Volume 5. [Google Scholar]
  51. Michelis, D.; Müller, J. The audience funnel: Observations of gesture based interaction with multiple Large Displays in a City Center. Int. J.-Hum.-Comput. Interact. 2011, 27, 562–579. [Google Scholar] [CrossRef]
  52. Brignull, H.; Rogers, Y. Enticing People to Interact with Large Public Displays in Public Spaces. In Proceedings of the Human-Computer Interaction INTERACT ’03: IFIP TC13 International Conference on Human-Computer Interaction, Zurich, Switzerland, 1–5 September 2003. [Google Scholar]
  53. Wouters, N.; Downs, J.; Harrop, M.; Cox, T.; Oliveira, E.; Webber, S.; Vetere, F.; Vande Moere, A. Uncovering the honeypot effect: How audiences engage with public interactive systems. In Proceedings of the 2016 ACM Conference on Designing Interactive Systems, Brisbane, QLD, Australia, 4–8 June 2016; pp. 5–16. [Google Scholar]
  54. Tomitsch, M.; Ackad, C.; Dawson, O.; Hespanhol, L.; Kay, J. Who cares about the content? An analysis of playful behaviour at a public display. In Proceedings of the PerDis 2014—Proceedings: 3rd ACM International Symposium on Pervasive Displays 2014. Association for Computing Machinery, Copenhagen, Denmark, 3–4 June 2014; pp. 160–165. [Google Scholar] [CrossRef]
  55. Vygotsky, L.S. Mind in Society: The Development of Higher Psychological Processes; Harvard University Press: London, UK, 1978; Volume 86. [Google Scholar]
  56. Matthews, K.E.; Andrews, V.; Adams, P. Social learning spaces and student engagement. High. Educ. Res. Dev. 2011, 30, 105–120. [Google Scholar] [CrossRef]
  57. Casey, G.; Wells, M. Remixing to design learning: Social media and peer-to-peer interaction. J. Learn. Des. 2015, 8, 38–54. [Google Scholar] [CrossRef]
  58. Cannella, G.S. Learning through social interaction: Shared cognitive experience, negotiation strategies, and joint concept construction for young children. Early Child. Res. Q. 1993, 8, 427–444. [Google Scholar] [CrossRef]
  59. Falk, J.H.; Dierking, L.D. Learning from Museums; Rowman & Littlefield: Lanham, MD, USA, 2018. [Google Scholar]
  60. Allen, S. Looking for learning in visitor talk: A methodological exploration. In Learning Conversations in Museums; Routledge: Oxfordshire, UK, 2003; pp. 265–309. [Google Scholar]
  61. Shaffer, S.E. Engaging Young Children in Museums; Routledge: Oxfordshire, UK, 2016. [Google Scholar]
  62. Willard, A.K.; Busch, J.T.; Cullum, K.A.; Letourneau, S.M.; Sobel, D.M.; Callanan, M.; Legare, C.H. Explain this, explore that: A study of parent–child interaction in a children’s museum. Child Dev. 2019, 90, e598–e617. [Google Scholar] [CrossRef]
  63. Haden, C.A.; Cohen, T.; Uttal, D.H.; Marcus, M. Building learning: Narrating experiences in a children’s museum. In Cognitive Development in Museum Settings; Routledge: Oxfordshire, UK, 2015; pp. 84–103. [Google Scholar]
  64. Anderson, D.; Piscitelli, B.; Weier, K.; Everett, M.; Tayler, C. Children’s museum experiences: Identifying powerful mediators of learning. Curator Mus. J. 2002, 45, 213–231. [Google Scholar] [CrossRef]
  65. Carr, M.; Clarkin-Phillips, J.; Soutar, B.; Clayton, L.; Wipaki, M.; Wipaki-Hawkins, R.; Cowie, B.; Gardner, S. Young children visiting museums: Exhibits, children and teachers co-author the journey. Child. Geogr. 2018, 16, 558–570. [Google Scholar] [CrossRef]
  66. Quinto Lima, S.; Buraglia, G.; Kam-Kwai, W.; Roberts, J. Data Bias Recognition in Museum Settings: Framework Development and Contributing Factors. In Proceedings of the 2025 CHI Conference on Human Factors in Computing Systems, Yokohama, Japan, 26 April–1 May 2025; pp. 1–15. [Google Scholar]
  67. Alhakamy, A.; Trajkova, M.; Cafaro, F. Show Me How You Interact, I Will Tell You What You Think: Exploring the Effect of the Interaction Style on Users’ Sensemaking about Correlation and Causation in Data. In Proceedings of the 2021 ACM Designing Interactive Systems Conference—DIS ’21, Virtual, 28 June–2 July 2021; pp. 564–575. [Google Scholar] [CrossRef]
  68. Bowman, R.; Nadal, C.; Morrissey, K.; Thieme, A.; Doherty, G. Using thematic analysis in healthcare HCI at CHI: A scoping review. In Proceedings of the 2023 CHI Conference on Human Factors in Computing Systems, Hamburg, Germany, 23–28 April 2023; pp. 1–18. [Google Scholar]
  69. Braswell, G.S. Variations in Children’s and adults’ engagement with museum artifacts. Visit. Stud. 2012, 15, 123–135. [Google Scholar] [CrossRef]
  70. Iversen, O.S.; Smith, R.C.; Dindler, C. Child as Protagonist: Expanding the Role of Children in Participatory Design. In Proceedings of the 2017 Conference on Interaction Design and Children—IDC ’17, Stanford, CA, USA, 27–30 June 2017; pp. 27–37. [Google Scholar] [CrossRef]
  71. Muravevskaia, E.; Kuriappan, B.; Markopoulos, P.; Lekshmi, S.; M, K.; Schrier, K. Exploring Empathic Design for Children Based on Role-Play Activities: Opportunities and Challenges within the Indian Context. In Proceedings of the 23rd Annual ACM Interaction Design and Children Conference—IDC ’24, Delft, The Netherlands, 17–20 June 2024; pp. 715–719. [Google Scholar] [CrossRef]
  72. O’neill, D.K.; Astington, J.W.; Flavell, J.H. Young children’s understanding of the role that sensory experiences play in knowledge acquisition. Child Dev. 1992, 63, 474–490. [Google Scholar] [CrossRef] [PubMed]
  73. Endedijk, H.M.; Meyer, M.; Bekkering, H.; Cillessen, A.; Hunnius, S. Neural mirroring and social interaction: Motor system involvement during action observation relates to early peer cooperation. Dev. Cogn. Neurosci. 2017, 24, 33–41. [Google Scholar] [CrossRef]
  74. Kosmas, P.; Zaphiris, P. Words in action: Investigating students’ language acquisition and emotional performance through embodied learning. Innov. Lang. Learn. Teach. 2020, 14, 317–332. [Google Scholar] [CrossRef]
  75. Macrine, S.L.; Fugate, J.M. Movement Matters: How Embodied Cognition Informs Teaching and Learning; MIT Press: Cambridge, MA, USA, 2022. [Google Scholar]
  76. Feltovich, P.J.; Spiro, R.J.; Coulson, R.L. Learning, teaching, and testing for complex conceptual understanding. In Test Theory for a New Generation of Tests; Routledge: Oxfordshire, UK, 2012; pp. 181–217. [Google Scholar]
  77. Bernstein, E.; Phillips, S.R.; Silverman, S. Attitudes and perceptions of middle school students toward competitive activities in physical education. J. Teach. Phys. Educ. 2011, 30, 69–83. [Google Scholar] [CrossRef]
  78. Ryan, A.M.; Shim, S.S. An exploration of young adolescents’ social achievement goals and social adjustment in middle school. J. Educ. Psychol. 2008, 100, 672. [Google Scholar] [CrossRef]
  79. Martinovic, D.; Freiman, V.; Lekule, C.S.; Yang, Y. The roles of digital literacy in social life of youth. In Encyclopedia of Information Science and Technology, 4th ed.; IGI Global: Hershey, PA, USA, 2018; pp. 2314–2325. [Google Scholar]
  80. Dooley, C.M.M.; Welch, M.M. Nature of Interactions Among Young Children and Adult Caregivers in a Children’s Museum. Early Child. Educ. J. 2014, 42, 125–132. [Google Scholar] [CrossRef]
  81. Hurtienne, J.; Israel, J.H. Image schemas and their metaphorical extensions. In Proceedings of the 1st International Conference on Tangible and Embedded Interaction—TEI ’07, Baton Rouge, LA, USA, 15–17 February 2007; ACM Press: New York, NY, USA, 2007; p. 127. [Google Scholar] [CrossRef]
  82. Follmer, S.; Raffle, H.; Go, J.; Ballagas, R.; Ishii, H. Video play: Playful interactions in video conferencing for long-distance families with young children. In Proceedings of the 9th International Conference on Interaction Design and Children, Barcelona, Spain, 9–12 June 2010; pp. 49–58. [Google Scholar]
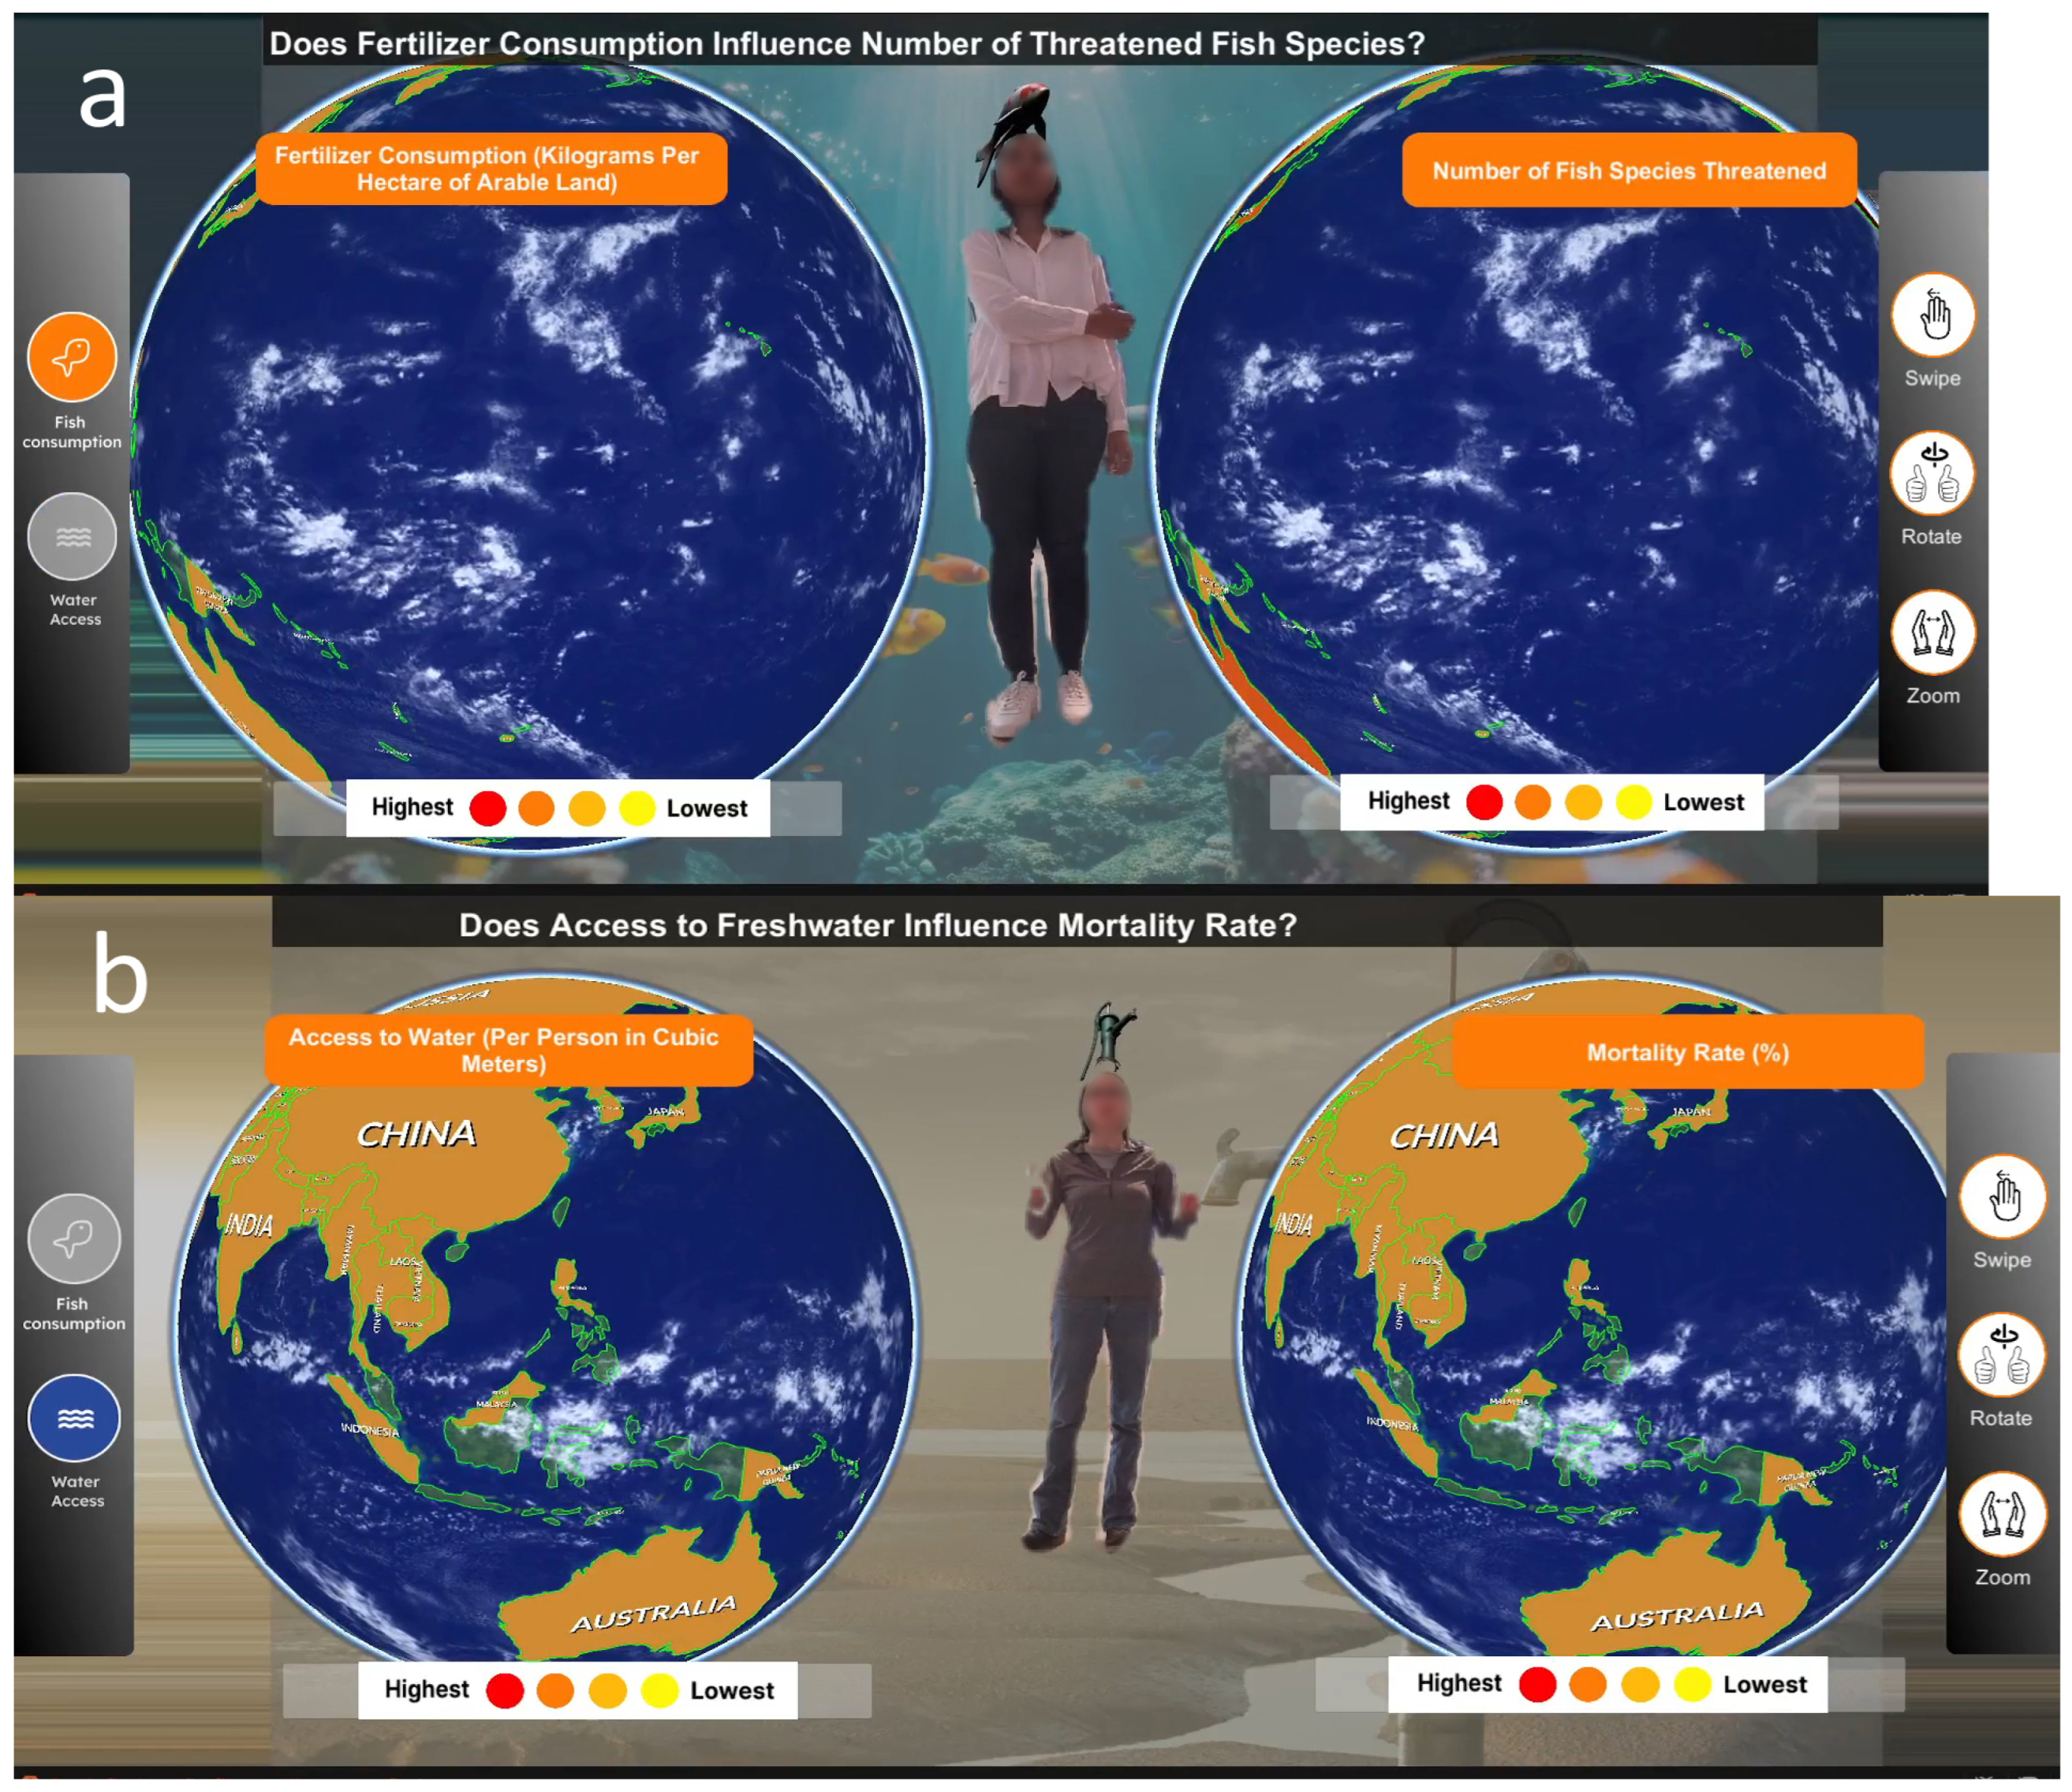
Figure 1. Screenshots of our interactive data visualization. The interactive display features two backgrounds: (a) an ocean scene for the fish endangerment scenario and (b) a desert-themed backdrop for the water access scenario.
Applsci 15 11304 g001
Figure 2. A photo of children interacting with the display. A moderator on the right in a plaid shirt is offering guidance.
Applsci 15 11304 g002
Figure 3. The boy in the brown/black hoodie has control of the display, and the boy in blue standing behind is moving his arms in a swiping motion to change the dataset (image cropped to mainly show participants).
Applsci 15 11304 g003
Figure 4. The girl on the left is explaining how to read the visualization to the girl on the right, highlighting the higher and lower color coding.
Applsci 15 11304 g004
Figure 5. Three boys who approached the display together (navy shirt, red shirt, and teal shirt) then interacted one at a time. (a): Navy shirt controls the display with red shirt visible in the background; (b): teal shirt controls the display with navy shirt and red shirt visible in the background; (c): red shirt controls the display with teal shirt visible in the background. Images are cropped to better focus on participants and represent three distinct instances of interaction. (labels for the visualization are cropped, but participants are still visible.
Applsci 15 11304 g005
Figure 6. A group of 4 boys trying to switch datasets on the display. (a): Uncoordinated individual jumping; (b): boy with his hands on the others’ shoulders says, “Everybody jumps in 3, 2, 1”; (c): a mostly coordinated group jump (arrows indicate chronological order).
Applsci 15 11304 g006
Figure 7. The boy closest to the camera repeatedly jumped in front of other children, resulting in them pushing him out of the way twice.
Applsci 15 11304 g007
Figure 8. One child kneeling in front of the camera, which takes up most of the space visible between the globes and prevents other children from being able to take control of the display.
Applsci 15 11304 g008
Figure 9. (a): Boy in navy sweater tries to stop girl in blue shirt from interacting with the display after she had gained control; (b): blue shirt leaves the display while navy sweater continues to interact. (arrows indicate chronological order).
Applsci 15 11304 g009
Figure 10. Four girls try the zoom gesture at the same time: note that the two in front are kneeling down so they can all be seen on screen.
Applsci 15 11304 g010
Table 1. Gestures used to control different system functions.
System FunctionGesture
Switch DatasetSwipe or Jump
Rotate GlobesUsing a steering wheel gesture
Zoom In or OutMoving hands closer together or farther apart
Disclaimer/Publisher’s Note: The statements, opinions and data contained in all publications are solely those of the individual author(s) and contributor(s) and not of MDPI and/or the editor(s). MDPI and/or the editor(s) disclaim responsibility for any injury to people or property resulting from any ideas, methods, instructions or products referred to in the content.