Abstract
In the “cloud–edge–end” three-tier architecture of edge computing, the cloud, edge layer, and end-device layer collaborate to enable efficient data processing and task allocation. Certain computation-intensive tasks are decomposed into subtasks at the edge layer and assigned to terminal devices for execution. However, existing research has primarily focused on resource scheduling, paying insufficient attention to the specific requirements of tasks for computing and storage resources, as well as to constructing terminal clusters tailored to the needs of different subtasks.This study proposes a multi-objective optimization-based cluster construction method to address this gap, aiming to form matched clusters for each subtask. First, this study integrates the computing and storage resources of nodes into a unified concept termed the computing power resources of terminal nodes. A computing power metric model is then designed to quantitatively evaluate the heterogeneous resources of terminals, deriving a comprehensive computing power value for each node to assess its capability. Building upon this model, this study introduces an improved NSGA-III (Non-dominated Sorting Genetic Algorithm III) clustering algorithm. This algorithm incorporates simulated annealing and adaptive genetic operations to generate the initial population and employs a differential mutation strategy in place of traditional methods, thereby enhancing optimization efficiency and solution diversity. The experimental results demonstrate that the proposed algorithm consistently outperformed the optimal baseline algorithm across most scenarios, achieving average improvements of , , , and across the four optimization objectives, respectively. A comprehensive comparative analysis against multiple benchmark algorithms further confirms the marked competitiveness of the method in multi-objective optimization. This approach enables more efficient construction of terminal clusters adapted to subtask requirements, thereby validating its efficacy and superior performance.
1. Introduction
With the rapid development of the Internet of things (IOT), 5G/6G communications, edge computing, and other technologies, the deployment scale of IOT devices continues to expand, and the amount of data generated is reaching an unprecedented level [1]. This trend of data growth poses new challenges to traditional cloud computing architectures. Although the central cloud computing model can provide substantial computing power and virtually unlimited storage resources, its limitations in latency-sensitive applications become non-negligible [2]. Additionally, the cost of data transmission and the energy required to operate cloud data centers are significant [3]. To cope with the above challenges, edge computing [4] has emerged as a distributed computing paradigm. By offloading computing tasks to the network edge infrastructure [5], system latency performance can be significantly optimized while relieving bandwidth pressure on the central network [6]. In addition, the distributed architecture improves privacy protection through localized data processing [7], better aligning with modern data regulatory requirements.
In edge computing scenarios, complex tasks are typically decomposed into parallel subtasks to enable efficient processing, as noted in [8]. The standard procedure involves terminal nodes initially offloading computational tasks to an edge server, which then decomposes them into multiple subtasks and redistributes these to terminal nodes for collaborative execution. To facilitate effective resource management and node collaboration, clustering mechanisms are widely employed. These mechanisms group nodes into clusters based on performance similarity [9], enabling nodes within each cluster to cooperate, share computing resources, and collectively complete assigned tasks [10,11]. This approach not only enhances computing resource utilization but also reduces individual node workload and shortens overall processing time.
However, existing studies predominantly assume terminal node homogeneity, whereas in reality these nodes exhibit heterogeneous computational capabilities [12,13]. Although improved meta-heuristic algorithms have been extensively applied to optimize task allocation [14,15], most focus primarily on minimizing completion time, cost, and delay. Despite this, these optimization algorithms have demonstrated effective optimization towards these objectives, significantly reducing task completion time, cost, and delay. they frequently overlook the heterogeneous computing resources required by different tasks. Although some research [16] has considered task-level resource heterogeneity, it often neglects the computational heterogeneity of the executing nodes themselves.
Therefore, to bridge the research gap mentioned above, this paper focuses on heterogeneous terminal nodes and tasks with heterogeneous demands. The main contributions of this paper are as follows:
- Aiming at the heterogeneity of terminal nodes in the edge computing environment, this paper proposes and constructs a computing power resources metric model. Normalized and unified indicators of the node’s computing power resources from the dimensions of computing resources and storage resources are used to comprehensively assess the computing power resources of nodes. Through the systematic quantification of nodes’ multi- dimensional resources characteristics, the capacity differences between different nodes in terms of overall computing power resources are accurately portrayed. This facilitates the clustering of nodes with similar computational resource profiles.
- Secondly, this paper proposes an improved algorithm based on NSGA-III (H-NSGAIII-DE). During the initialization phase, simulated annealing and adaptive genetic operations are integrated to generate an initial population with superior distribution and higher quality. During the evolutionary process, a differential mutation mechanism is introduced to effectively enhance the algorithm’s global exploration capability and convergence speed.
- Finally, the effectiveness and advantages of the proposed algorithm are verified through comparative experiments.The proposed method demonstrates comprehensive performance improvements across all optimization objectives. Specifically, it achieves an 18.07% reduction in task–resource matching deviation (average matching deviation), a 7.82% decrease in computing resources heterogeneity (average computing power resources dispersion) within clusters, a 15.25% reduction in cluster size, and a 10% decrease in server–terminals communication overhead (average distance). These results effectively validate that the proposed method constructs terminal clusters with significantly optimized configurations for task execution.
The remainder of this paper is organized as follows. The Section Related Works describes related works. The Section System Model presents the system model employed in this study. The Section Optimization Objectives and Problem Description defines the optimization objectives required for selecting the optimal clustering strategy and clarifies the problem statement of this study. The Section Improved NSGA-III Algorithm presents the algorithm used in this study. The Section Results and Discussion demonstrates the experiments and results. Finally, the Section Conclusion and Future Work concludes the paper and discusses potential directions for future research.
2. Related Works
Some studies such as task offloading and task allocation will be based on two predefined clustering models. One is assuming that the nodes are already clustered [17,18] and the other is to cluster only according to the physical distance between nodes or network topology [19,20]. In fact, the formation of clusters often involves more complex factors.
Asensio et al. [21] solves the problem of efficient device clustering in hybrid fog–cloud computing scenarios, where the authors propose a multi-objective optimization model based on mixed-integer linear programming (MILP) and derive upper and lower bounds on the number of clusters; and a heuristic algorithm combining k-means and constrained optimization is designed for the scalability problem of large-scale scenarios. However, there are still limitations in the calculation efficiency and the integration of technical and economic models in the super large-scale scenario. Chen et al. [22] uses the Leuven algorithm to cluster end-to-end devices (D2D), and the authors add a resource constraint factor to this method to regulate the size of each cluster. By calculating the modularity gain of D2D devices within a cluster, the cluster with the largest gain is selected as the final clustering scheme. Amer and Sorour [23] investigate the problem of forming clusters of extreme edge nodes to perform different subtasks at minimum cost. The authors used the result of multiplying the price of the amount of data per bit of execution and the amount of data for the subtasks as the cluster cost for forming clusters, and with the optimization objective of minimizing the cluster cost, the problem was transformed into a mixed-integer quadratic constraint programming problem, and parsing was deduced through KKT conditions and Lagrangian analysis in order to find the cluster solution with the lowest cost. The method achieves the purpose of building computing clusters for subtasks, but it does not take into account the heterogeneity of computing resources required by different subtasks. Dankolo et al. [24] proposed a hybrid FPA-TS algorithm that optimizes task scheduling in the edge–cloud continuum. However, their model operates at a coarse granularity, focusing only on edge–cloud task placement without constructing terminal clusters for subtask-specific needs. It also overlooks node-level factors like resource balance and communication overhead, which are critical for sustainable cluster performance. Predić et al. [25] proposed a VMD and attention-RNN model for cloud load forecasting, optimized via improved PSO. While achieving accurate predictions, the method only considers cloud-level metrics, ignoring edge and terminal resources in cross-layer scenarios.
In the field of wireless sensor networks, clustering is more widely applied. Most of its study focus on how to optimize the selection of cluster heads in clusters. Sheeja et al. [26], Younas and Naeem [27], and Joseph and Asaletha [28] formulated a multi-objective optimization problem targeting energy surplus, network lifetime, and average distance, which was solved using a heuristic algorithm to select an optimal set of cluster heads. Clusters were then formed by assigning nodes to the nearest cluster head. Jagadeesh and Muthulakshmi [29] employ a unified multi-objective fitness function for centralized energy-aware clustering and distributed selection of high-efficiency cluster heads. The Levy flight-enhanced multi-objective PSO algorithm substantially improves network energy efficiency and lifespan. But their clustering generally assumes that the network is isomorphic, ignoring the heterogeneity between different nodes, and the selection of nodes in the cluster according to some demand of the task is not considered in the clustering.
In summary, most of the above methods do not consider node heterogeneity during clustering and overlook the diverse computing power resource requirements of different subtasks when constructing clusters. To address these problems, this study assumes that the edge server decomposes tasks into multiple subtasks based on their computing power resources demands, dispatches these subtasks to the terminal network, and dynamically groups heterogeneous terminals into dedicated clusters, each responsible for executing subtasks with specific resource requirements.
3. System Model
3.1. Network Model
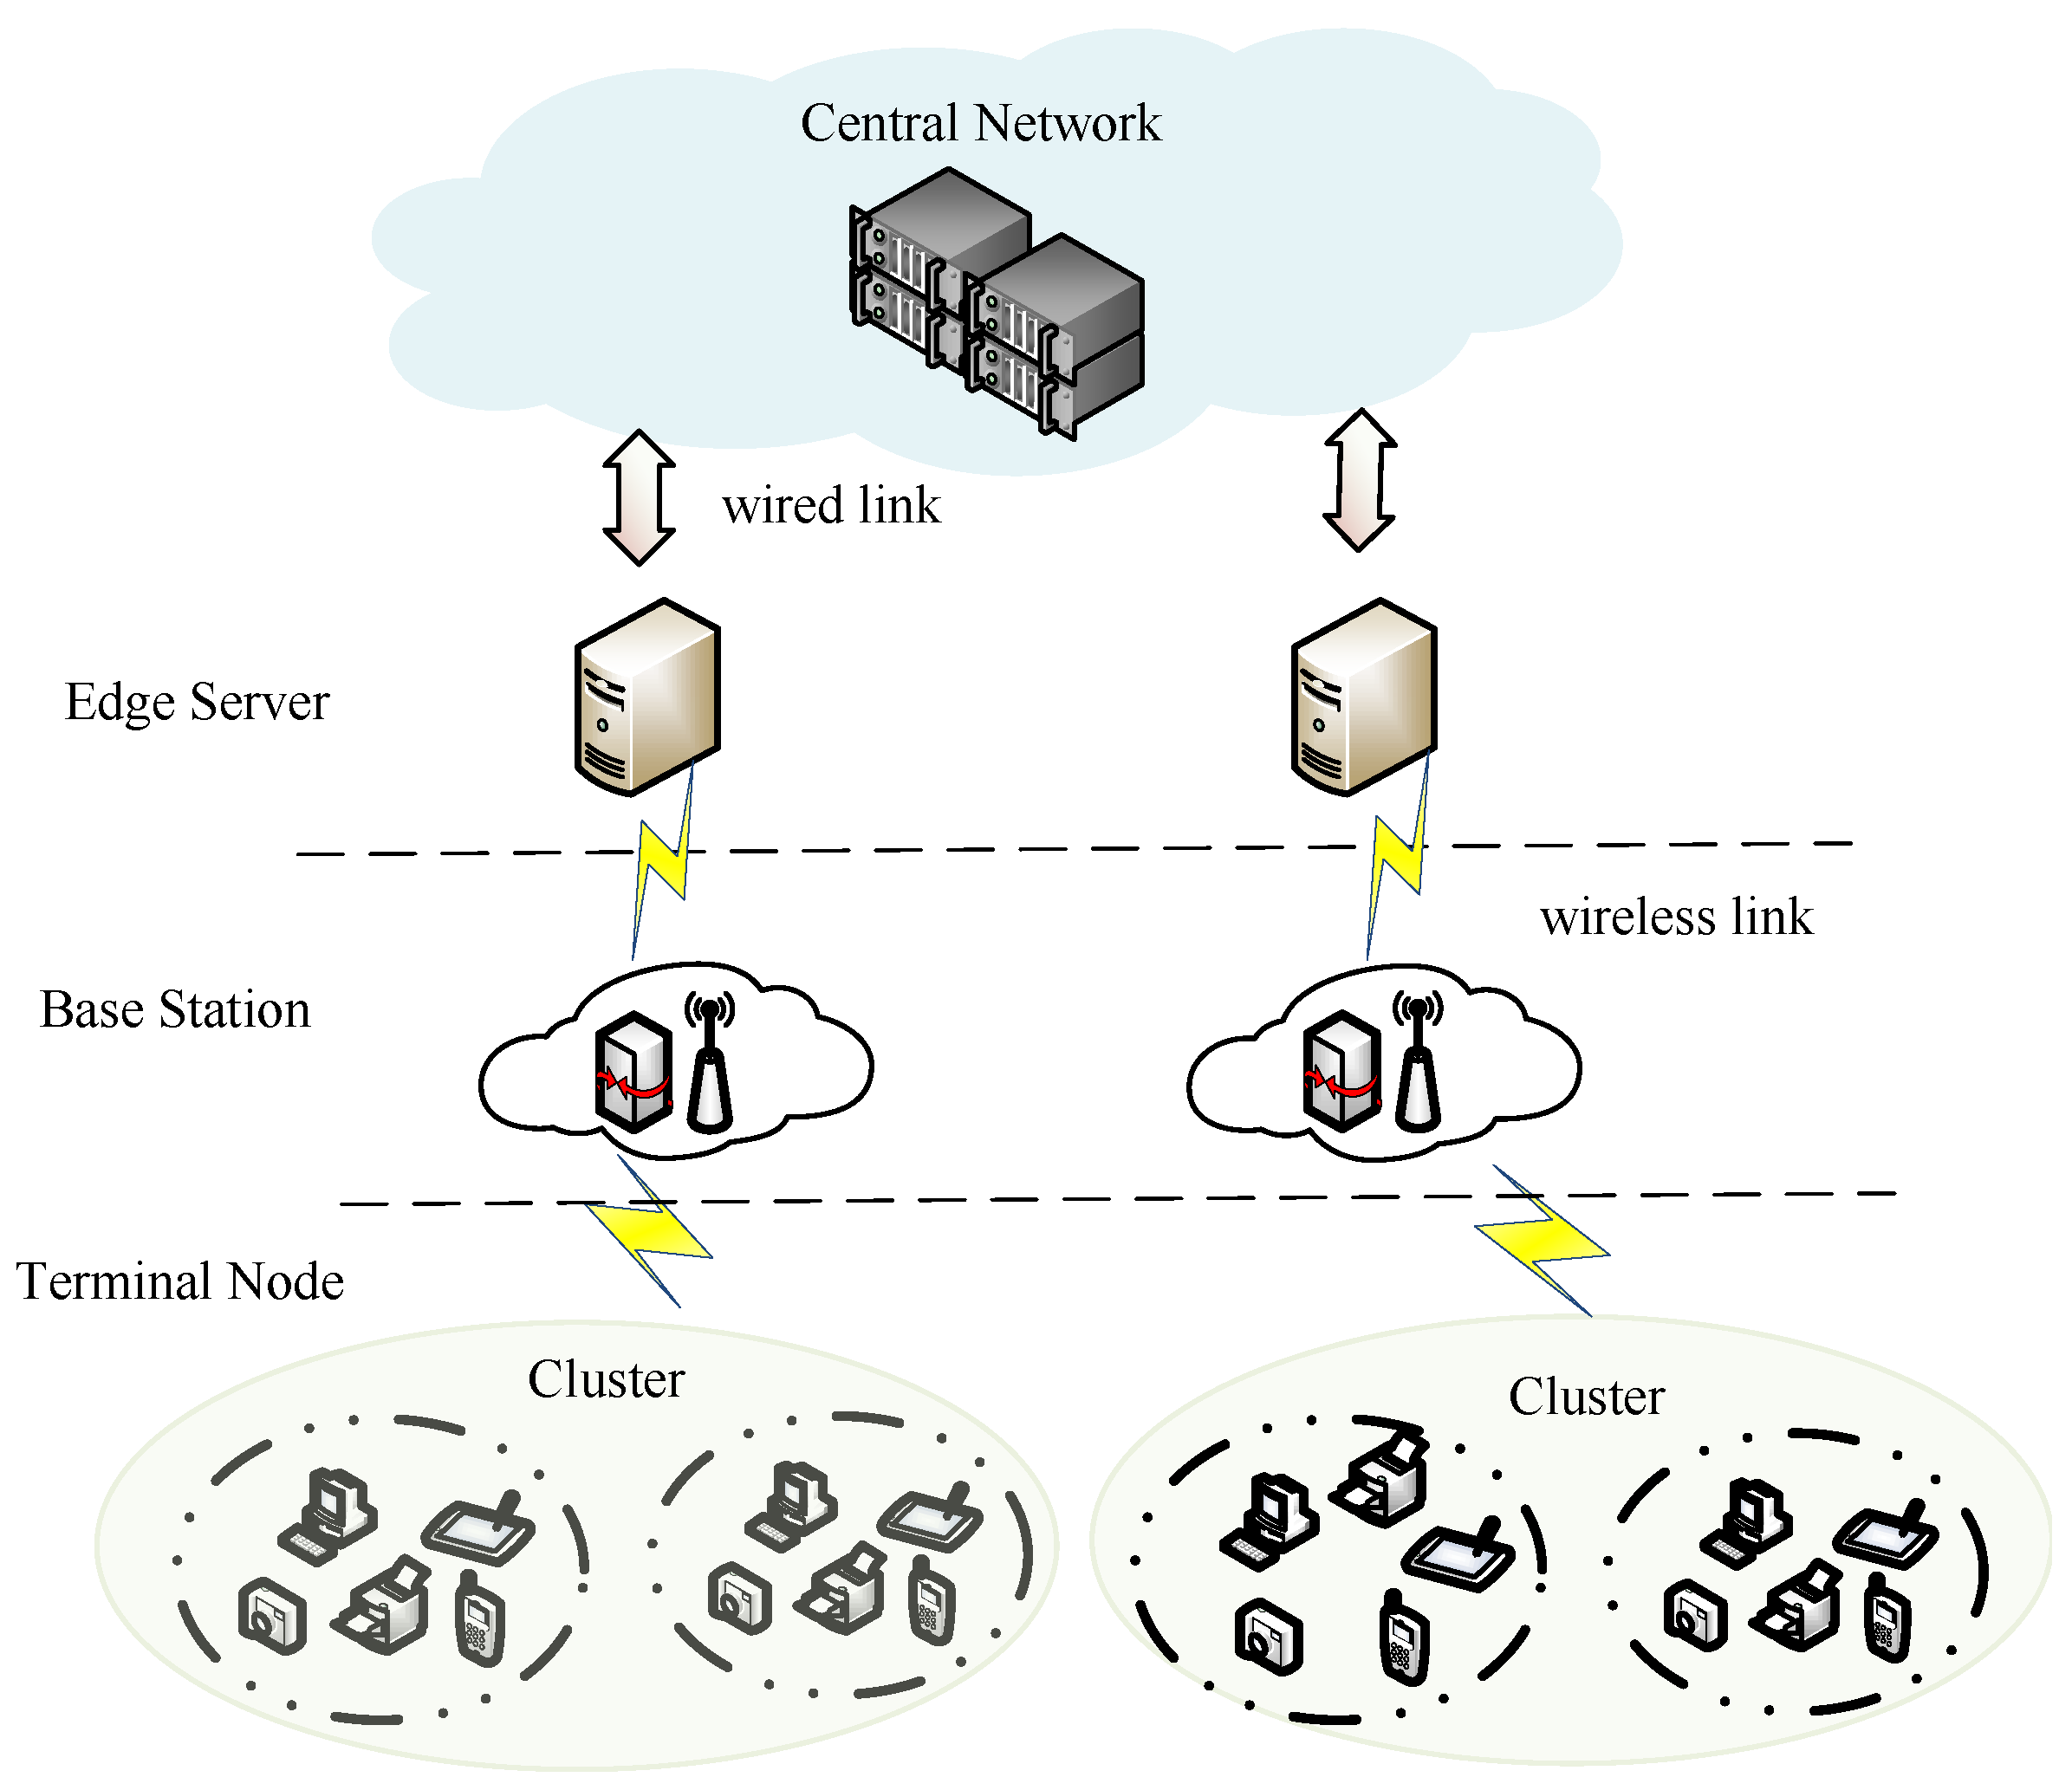
The network model of this paper is shown in Figure 1. This model consists of a central network, edge servers, base stations, and terminal nodes. The central network belongs to the cloud layer, the edge servers and the base stations belong to the edge layer, and the terminal nodes belongs to the end layer. In this model, a one-to-many mapping relationship exists between the core cloud and edge servers, and between edge servers and terminal nodes. Base stations are responsible for the allocation and management of wireless communication resources for terminal nodes. Terminal nodes access edge servers via base stations, while edge servers connect to the core cloud through high-bandwidth, low-latency wired links (such as optical fibers), thereby ensuring reliable and efficient access to central network services for all terminal devices.
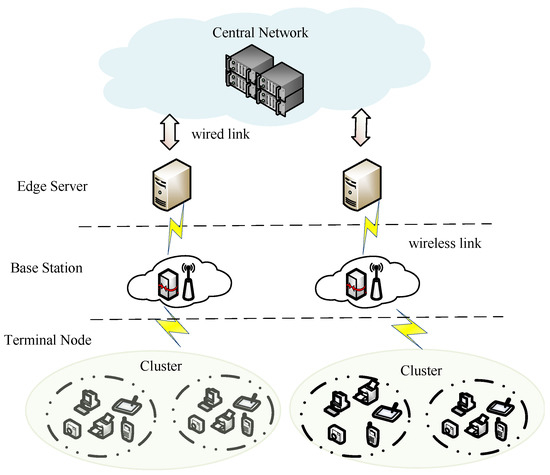
Figure 1.
Network model.
Assume there are N heterogeneous terminal nodes in the network, each defined as . represents the set of computational resource types of the node, including three categories: basic computing power, intelligent computing power, and neural computing power. denotes the amount of computing resources of the node across these resource types, and indicates its storage resources.
All these terminal nodes collectively form the terminal network . Given k subdivided subtasks, the terminal nodes are organized into k distinct clusters, with each cluster exclusively responsible for processing its corresponding specific subtask. The set of all node clusters corresponding to the subtasks collectively forms a cluster set: .
3.2. Task Model
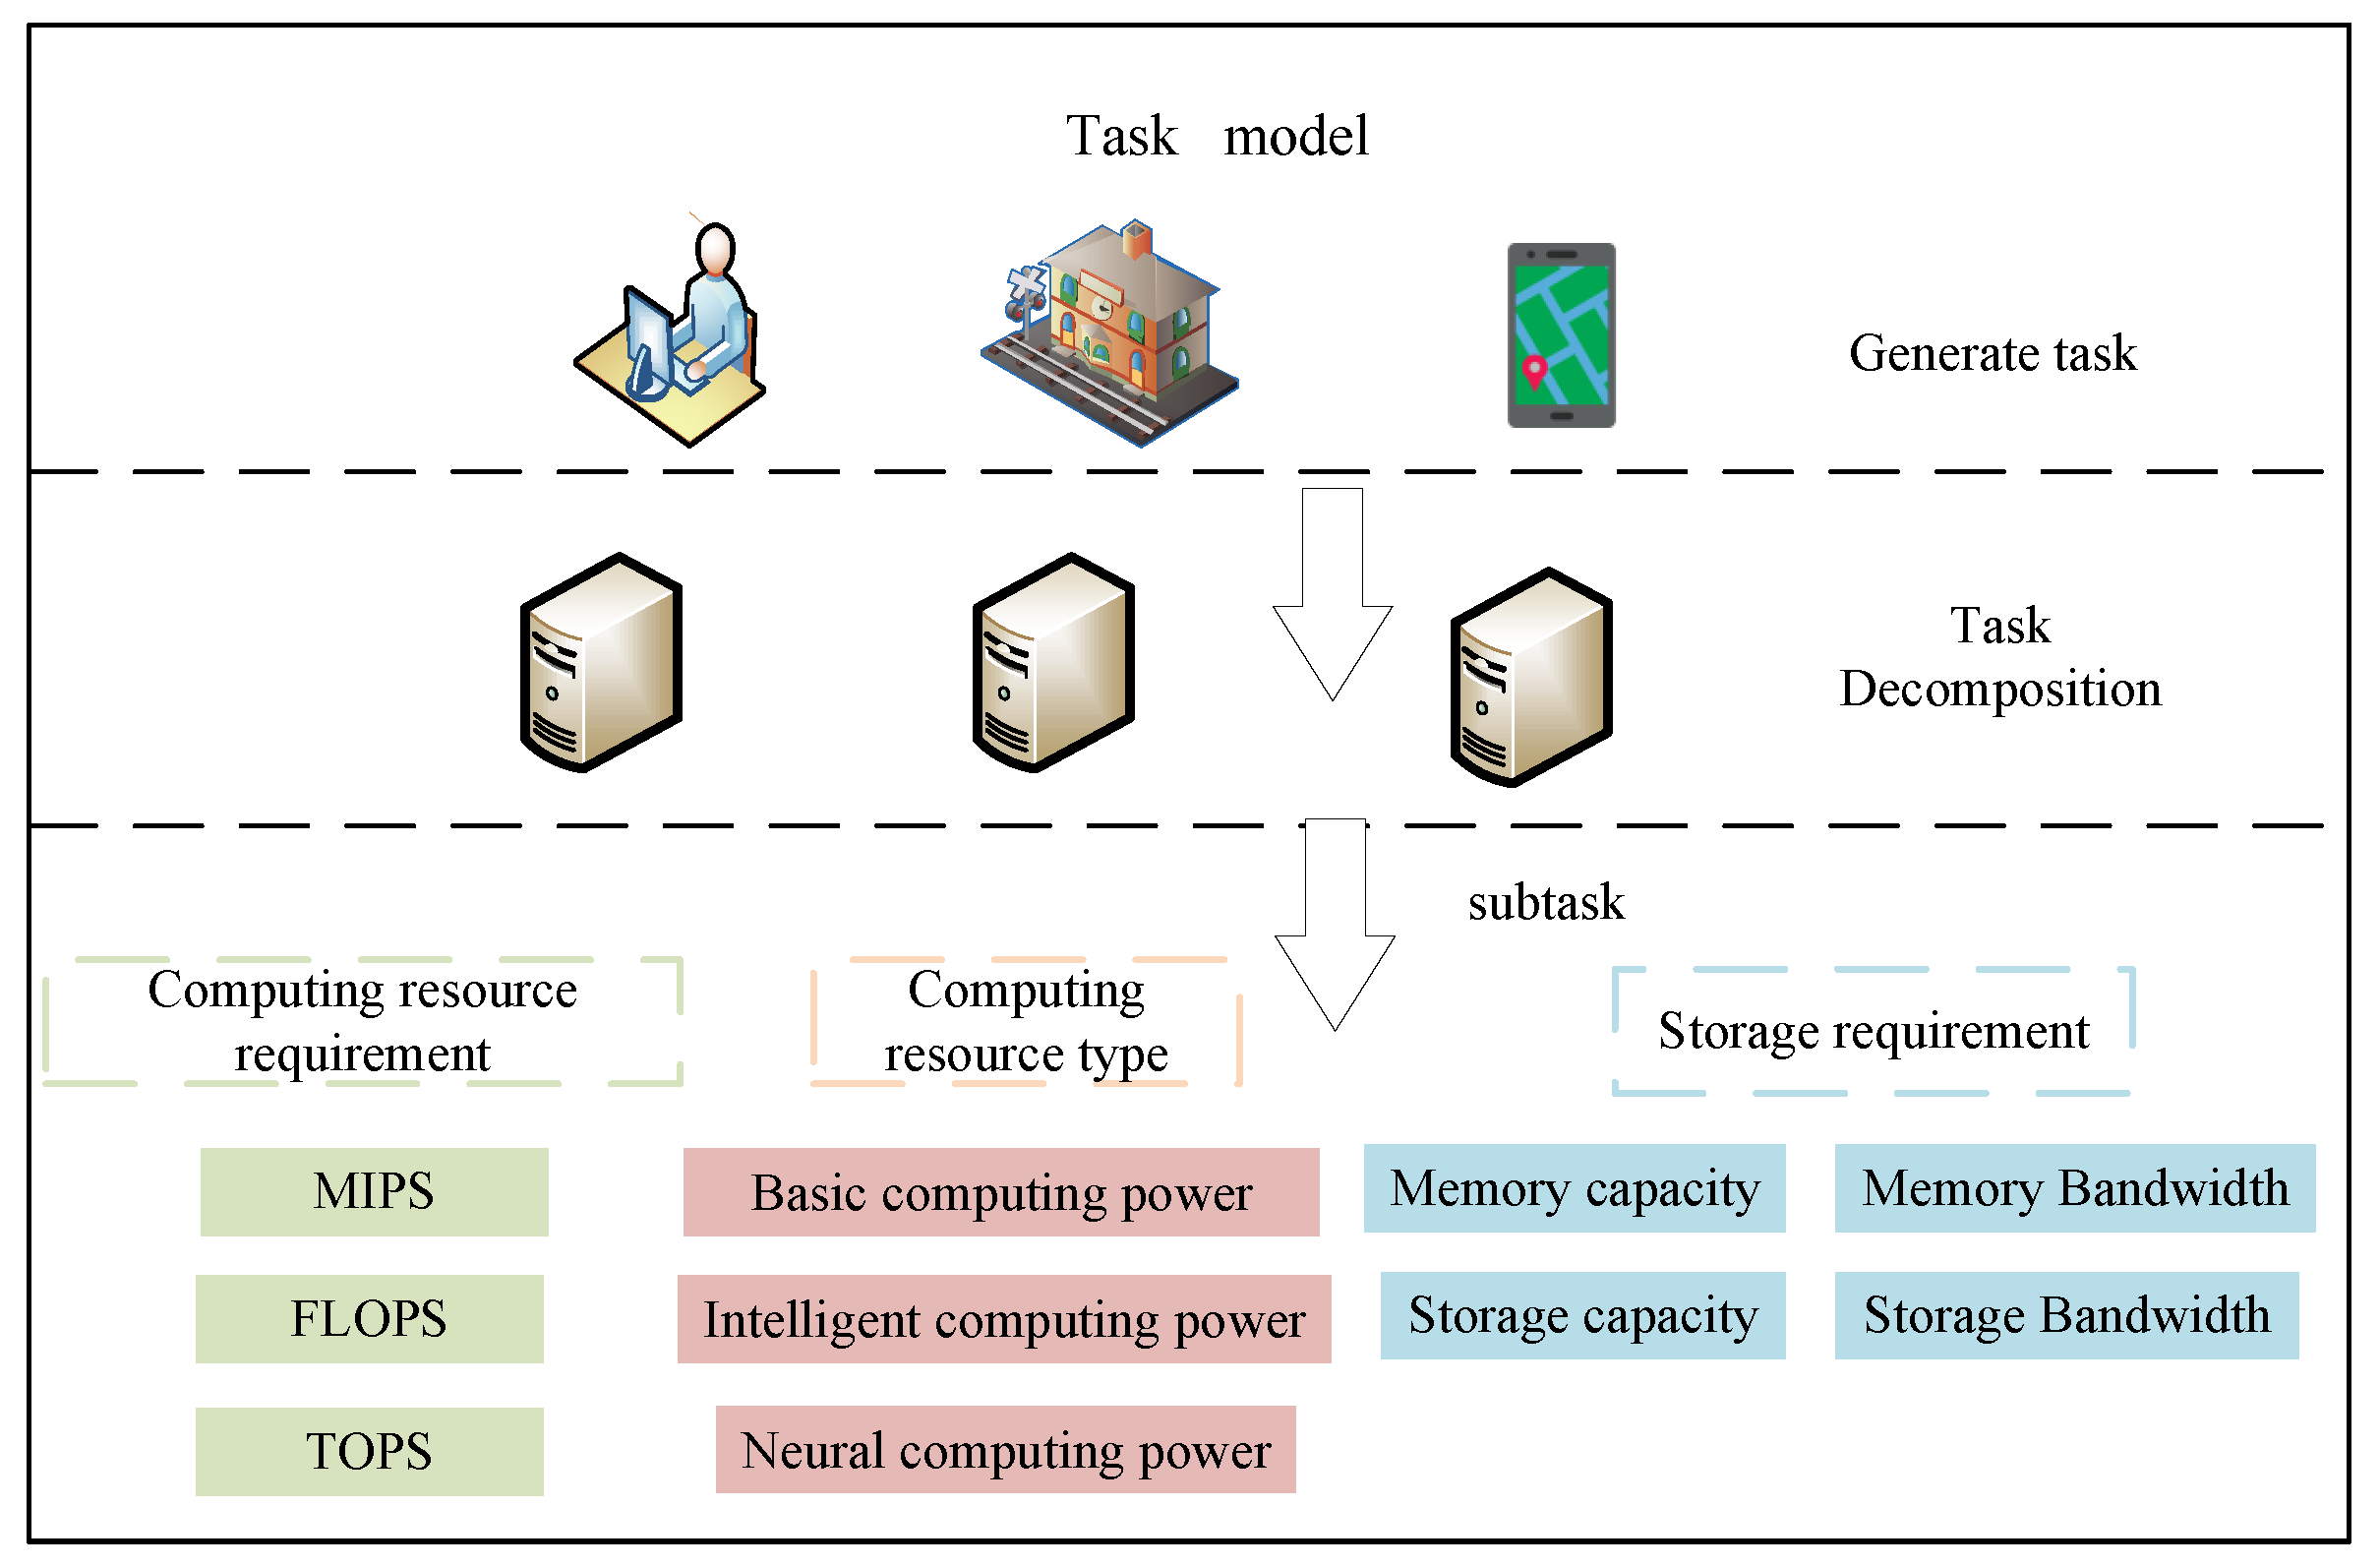
In the task model of this study, the edge server first decomposes the original task into a set of k subtasks with computing resource type constraints, based on the task’s heterogeneous computing power resource requirements. Each subtask is uniformly defined as a tuple , which includes multiple key parameters. denotes the specific type of computing resource required by the sub-task; represents the computing resource demand of the subtask for that resource type. For example, if the subtask demands intelligent computing power, its computing resource requirement may be expressed in terms of the number of floating-point operations (FLOPs) needed. indicates the storage resource requirements of the subtask. and are referred to as the computing power resource requirements of the subtask. After the task deconstruction and subtask definition, the edge server sends the partitioned subtasks to terminal nodes for execution through wireless links.
The task model is illustrated in Figure 2. The computing power resource requirements vary significantly across different subtasks, which forms the basis for adopting a heterogeneous task decomposition strategy.
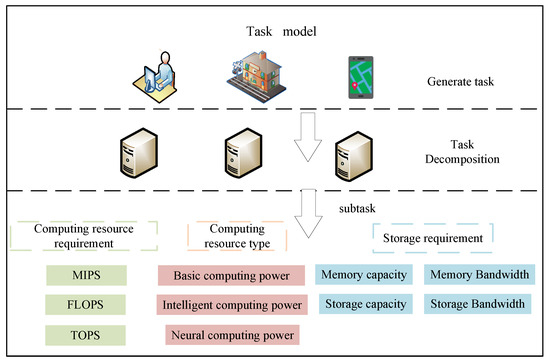
Figure 2.
Task model.
The relationship between the physical configuration (Figure 1) and the task model (Figure 2) is defined by a core mechanism of task-driven, dynamic cluster provisioning. In this framework, the abstract “subtasks” in Figure 2 are not statically assigned to pre-defined clusters in Figure 1. Instead, they are dynamically scheduled and mapped to dedicated clusters, which are provisioned on-demand based on subtask attributes such as computation type and resource requirements. This dynamic “task-cluster” mapping forms the mathematical foundation of the optimization model in Section 4, where its precise formulation is central to determining the ultimate scheduling strategy.
3.3. Computing Power Resources Metric Model
Before constructing clusters for subtasks, a unified framework is established to measure the computing resources of heterogeneous terminal nodes, ensuring the comparability of multi-dimensional computing resources across different nodes. In traditional studies, computing power is usually attributed to the computing analysis capability of a hardware device processing unit or system software platform for business or data. However, this understanding is often confined to the performance metrics of individual devices or localized systems, which fails to fully capture the multi-dimensional characteristics of computing power in distributed and heterogeneous modern computing environments. Consequently, this study evaluates a node’s computing power capacity along two core dimensions—computing and storage resources.
In the dimension of computing resources, this study mainly considers the computing resources of three typical hardware types—CPU, GPU, and NPU—categorizing them into three computing resource types: basic computing power, intelligent computing power, and neural computing power. The storage resource dimension is comprehensively measured by four indicators: memory capacity, hard disc storage capacity, memory bandwidth, and hard disc read/write speed of the terminal nodes. These indicators are shown in Table 1.

Table 1.
Indicators of computing power resources.
The comprehensive computing power of a node, which represents its overall computing power capability, can be obtained by performing a weighted summation of its multi-dimensional computing resources as expressed in Equation (1).
where , , and represent the computing resource components of a node, corresponding to the computing capacities of the CPU, GPU, and NPU—measured in MIPS, TFLOPS, and TOPS, respectively. Similarly, , , , and denote the node’s storage resource components, corresponding to memory capacity, hard disk storage capacity, memory bandwidth, and hard disc read/write speed.
The coefficients and are the weighting factors for the computing and storage resources, respectively. In this paper, the entropy weight method is adopted to determine these weights. This method assigns weights entirely based on the degree of data dispersion, without relying on subjective judgment. The rationality of the resulting weights therefore depends on the scientific soundness of the indicator system. By calculating the weights of nodes in different dimensions using the entropy weight method, the comprehensive computing power of each node can be obtained.
The weighting results of the entropy weight method depend on the degree of dispersion of the indicators, rendering them relatively sensitive to the distribution of the original data. To examine the robustness of the weights derived in this study, a systematic sensitivity analysis was conducted. Specifically, random perturbations of , , and were introduced into the original data to simulate data uncertainty, and the entropy weight method was recalculated on the generated series of perturbed datasets. Subsequently, the consistency in ranking between the perturbed weights and the original weights was assessed by calculating Spearman’s rank correlation coefficient. This coefficient serves as a key metric for evaluating weight stability, where a value closer to 1 indicates stronger robustness. The correlation coefficients for each indicator under different perturbation levels are presented in Table 2.

Table 2.
Analysis of sensitivity.
The sensitivity analysis results (presented in Table 2) demonstrate that under data perturbations of up to , all indicators maintain Spearman’s correlation coefficients above 0.9, while under perturbations, all coefficients remain above 0.95. This indicates that the relative importance ranking of the indicators is largely insensitive to data fluctuations, confirming the robustness of the entropy weight method in the context of this study.
In this study, we used the standard entropy weighting method to weight each index. For detailed calculation procedures, please refer to Appendix A. The comprehensive computing power corresponding to all nodes is denoted as .
4. Optimization Objectives and Problem Description
The target of this study is to select the most suitable cluster for a task by minimizing four key objectives: average matching deviation, average computing power resources dispersion, cluster size, and average distance. By optimizing these objectives, the study aims to enhance the compatibility between tasks and clusters; reduce resource waste and efficiency losses caused by mismatches between task requirements and node capabilities; simultaneously reduce computing power resource distribution disparities within the cluster to enhance overall resource utilization efficiency; minimize cluster size while meeting task processing requirements to reduce management costs and coordination overhead; and shorten average distance to lower data transmission latency and energy consumption.
4.1. Average Matching Deviation
Different subtasks require different computing resource types and computing resources. To compare the gap between the computing resource requirement of a subtask and the available resources in its corresponding cluster, both the resource requirement of the subtask and the relevant computing resources of the nodes within the cluster are normalized. The Min–Max normalization method is used to normalize the computing resources of the dedicated cluster and, similarly, the computing resource requirement of each subtask is normalized in Equation (2).
is the maximum value of this computing resource provided by the node in the cluster, and the matching deviation of each subtask from its corresponding candidate cluster is calculated in Equation (3).
The total computing resources of the nodes within the cluster must be greater than or equal to the computing resource requirement of the subtask to guarantee that the task can be successfully scheduled to the nodes for execution, Therefore, the constraint is given by . When the total computing resources within the cluster is closer to the task demand, the matching deviation is smaller. Assuming that there are k subtasks corresponding to k candidate clusters, the average matching deviation is calculated using Equation (4). The parameter is set to 2. A smaller deviation indicates a closer alignment between the current clustering scheme and the requirements of the subtasks.
4.2. Average Computing Power Resources Dispersion
In the previous study, the computing power resources of terminal nodes were unified to eliminate the influence of magnitude, resulting in a comprehensive computing power metric to represent each node’s capability. To construct terminal clusters with balanced distribution of computing power resources, the variance of the comprehensive computing power of nodes within a cluster is used to evaluate the cluster’s computing power resources balance, that is, the degree of dispersion of its computing power resources. A larger variance indicates a more dispersed distribution of computing power resources among nodes after clustering, whereas a smaller variance reflects a more balanced allocation.
Assume that there are n nodes in each cluster. The dispersion of the computing power resources in each cluster is shown in Equation (5).
denotes the average comprehensive computing power of each cluster. Similarly when there are multiple clusters, the average computing power resources dispersion is given by:
4.3. Cluster Size
In clustered collaborative computing architecture, cluster size is defined as the total number of nodes participating in the construction of the clusters. It is denoted by Equation (7).
where represent the number of nodes in the cluster i, and k is the number of clusters. A smaller means fewer redundant nodes participating in the computation, which can effectively avoid resource idleness and waste. However, to ensure that all subtasks’ computing requirements are met, each cluster vi must contain at least one terminal node to execute its assigned subtask. This constraint can be expressed as .
4.4. Average Distance
Under the “cloud–edge–end” collaborative computing framework, subtasks are precisely distributed to pre-selected terminal node clusters via edge servers using a distributed scheduling mechanism. This study introduces the average cluster–server distance as a key indicator to quantify the communication overhead of this distribution process. Specifically, let the coordinates of edge server s be . The coordinates of any node within the cluster are . The average Euclidean distance between the cluster and the server is defined as follows:
denotes the total number of nodes in the cluster . When there are k clusters, the average distance is shown in Equation (9).
4.5. Problem Description
Under the above system model and optimization objectives, the terminal nodes cluster problem is modeled as a multi-objective optimization problem to be solved by minimizing these four objectives. The optimization problem can be expressed in Equation (10).
In the above equation, n represents the number of nodes of cluster j. Constraint ensures that the nodes of a candidate cluster have sufficient computing resources to execute subtasks; ensures that the storage resources of the nodes in the cluster can meet the storage requirements of the subtasks; ensures non-empty clusters by constraining the minimum number of nodes per cluster; and ensures that at least one node within the cluster meets the computing resource-type requirement of the task.
To quantify the degree of violation of the above constraints, the constraint violation value [30] for each cluster is defined as follows:
In this formulation is an extremely small value smaller than 1 and is an extremely large value. The total Constraint Violation () of the clustering scheme is , where denotes the constraint violation degree of the cluster i. When is 0, the current solution is a feasible solution. The goal of this paper is to find the optimal terminal clustering scheme in the feasible solutions. Currently, multi-objective evolutionary algorithms based on non-dominated solutions have become the mainstream algorithms for solving multi-objective optimization problems. Since this study involves more than three objective functions and the solution space of the problem is more complex, NSGA-III [31]—with its mechanism of uniformly distributed reference points—enables better distribution of non-dominated solutions in high-dimensional objective spaces and more effective exploration of the solution space. Accordingly, NSGA-III is selected as the baseline algorithm and is adaptively improved to address the clustering problem presented in this paper.
5. Improved NSGA-III Algorithm
NSGA-III, as the successor to the NSGA-II(Non-dominated Sorting Genetic Algorithms II) algorithm [32], is an improved algorithm proposed for Many-objective Optimization Problems. NSGA-III introduces the concept of reference points to replace the crowding distance in NSGA-II to guide the direction of solutions, maintain population diversity, and ensure that solutions are evenly distributed across the Pareto front. The specific steps are as follows:
Generate the initial population and reference points: Reference points are generated based on the problem, and individuals are randomly generated as the initial population to participate in subsequent iterations.
Crossover and mutation to generate offspring: The initial population is subjected to crossover and mutation to generate the offspring population , where the size of equals that of . The two populations are combined to obtain the new offspring population .
Perform non-dominated sorting. Calculate the objective function values of the merged population and perform non-dominated sorting to establish a hierarchical non-dominated solution structure. During the population selection phase, all individuals in the first non-dominated layer () are prioritized for retention. Subsequently, use the reference point association strategy to select individuals with excellent distribution from the remaining frontier layers for supplementation until the predefined population size is reached. This forms the new parent population .
Perform crossover and mutation operations on the new parent population to generate the new offspring population . Merge the two populations to form the new population . Repeat the above steps until the specified number of iterations is reached.
However, the original NSGA-III algorithm tends to converge prematurely when handling terminal node clustering problems and generates a large number of solutions that do not meet the constraints in the early stages of iteration. Therefore, the improved H-NSGAIII-DE algorithm is proposed. The detailed steps of H-NSGAIII-DE are presented in the following subsections.
5.1. Population Encoding
Chromosomes are represented in various ways. For the problem addressed in this study, chromosomes are encoded using integer representation. Each chromosome characterizes a subtask-oriented clustering scheme for terminal nodes. It is defined as follows: the length of each chromosome equals the number of terminal nodes. The gene position in the chromosome, when , indicates that terminal node i belongs to cluster which performs the subtask. A gene value of 0 indicates that the node does not participate in the current clustering task. j represents the cluster number to which the subtask is mapped, and the number of clusters varies according to the number of subtasks.
5.2. Generation of Initial Populations Based on the HSAGI Strategy
This study proposes a hybrid initialization method (Hybrid SA-GA Initialization, HSAGI) that incorporates simulated annealing and adaptive genetic manipulation, with the aim of generating high-quality and diverse initial populations for the NSGA-III algorithm. The specific process is as follows.
5.2.1. Construction of Candidate Solution Pool
First, an initial pool of candidate solutions is constructed for a given optimization problem by random generation. For each candidate solution, its objective function values and constraint violation degree are calculated for subsequent screening and evaluation. In the iteration, neighborhood solutions as well as cross individuals are generated, and the optimal initial population is selected through continuous iteration.
5.2.2. Iterative Optimization Dominated by Simulated Annealing
Simulated annealing is a global optimization algorithm. Its core depends on two major strategies: new solution generation and acceptance probability. The new solution generation mechanism defines the method of exploring neighborhood solutions from the current solution. To improve the efficiency of the algorithm and ensure the quality of the solution, this study adopts the principle of local search and designs the new solution generation strategy to perform random perturbations within the neighborhood of the current solution.
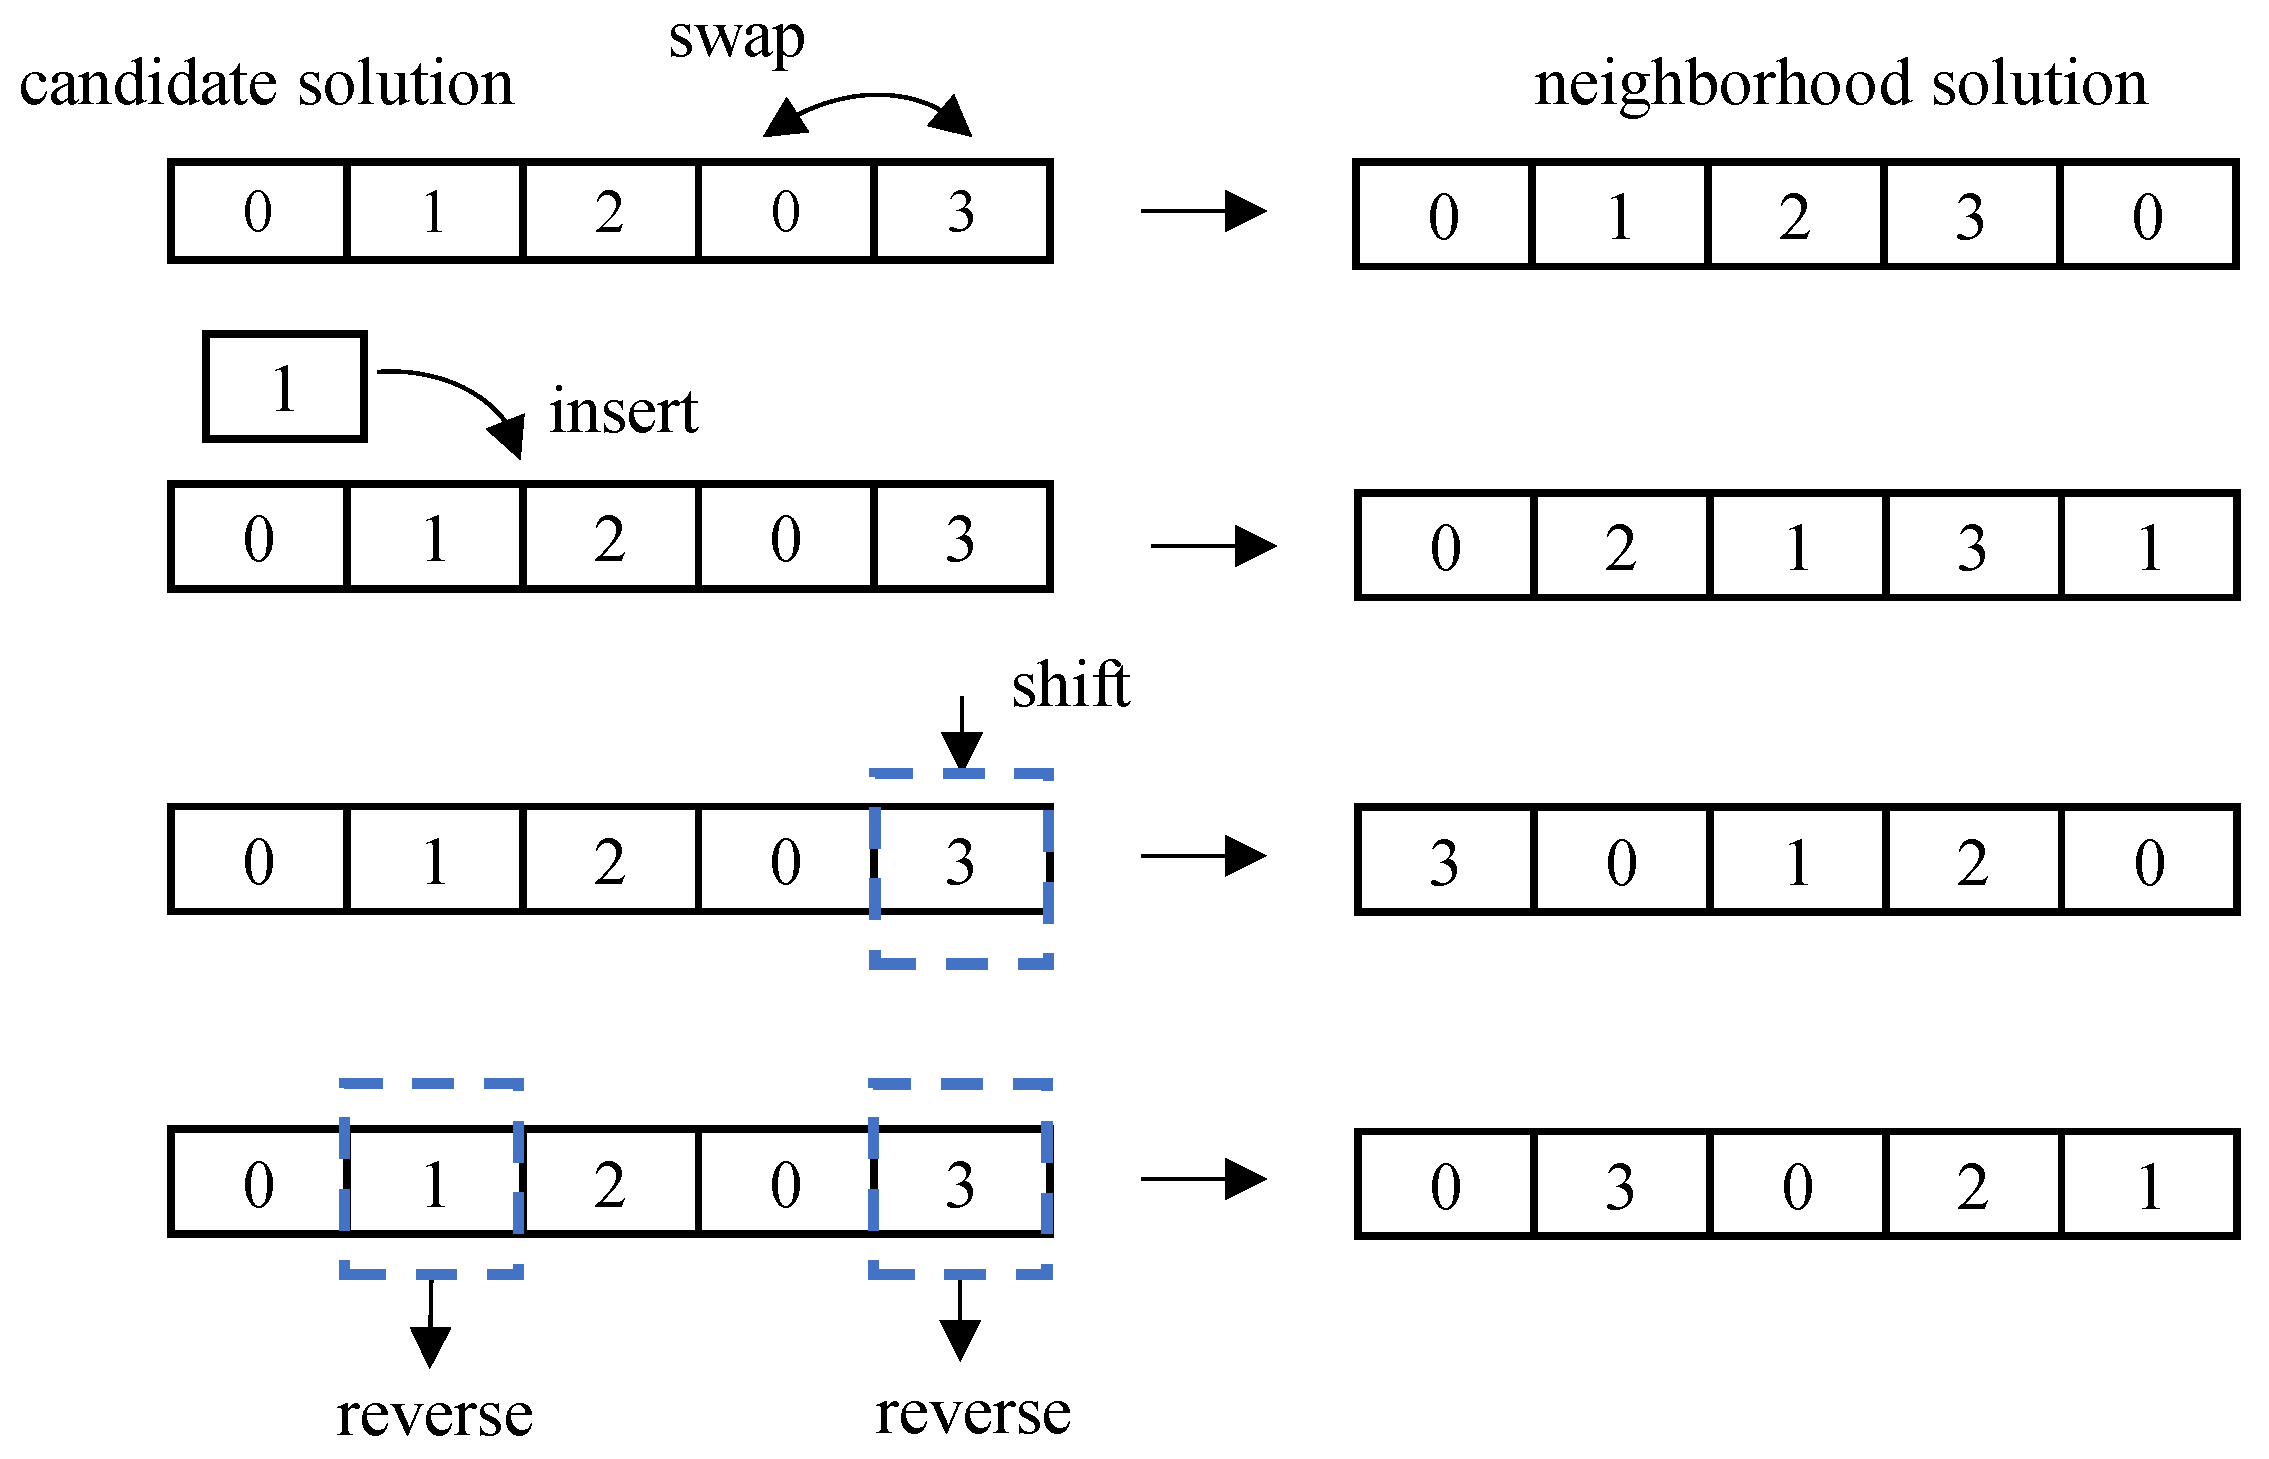
The disturbance operations swap, insert, shift, and reverse the genes of each candidate solution. Swap refers to randomly selecting two gene positions and exchanging their values; insert refers to randomly selecting a gene and inserting it into another random position; and shift refers to selecting a gene and shifting one position to the right from that gene. Reverse order is the reversal of the order of a segment of consecutive genes. The neighborhood solution generation operation is shown in Figure 3.
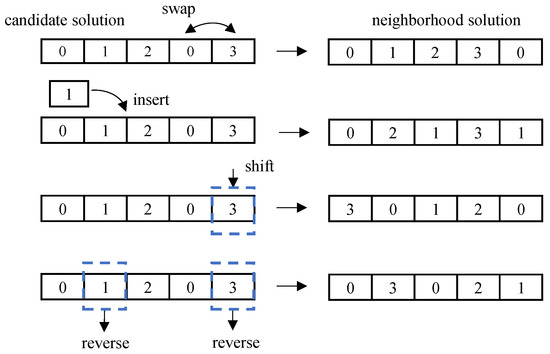
Figure 3.
Neighborhood solution generation.
Another key strategy in SA is to use the Metropolis criterion to determine whether to accept a newly generated neighborhood solution. Considering that the solutions in this study are constrained, this study adopts the dominance relationship judgment mechanism in [33] to judge the dominance relationship between the neighborhood solution and the current solution. If the neighborhood solution dominates the current solution or both are non-dominant solutions, then accept it directly; otherwise, the Metropolis criterion is used to determine whether to accept the neighborhood solution. The core of the dominance relationship judgment is based on a binary solution comparison method based on CV and the Pareto dominance principle. The specific logic is as follows:
Feasibility Priority Principle: If both solutions are feasible (), the original Pareto dominance criterion is applied: namely, if solution 1 is not inferior to solution 2 in all objective values and is strictly superior in at least one objective, then solution 1 is considered to dominate solution 2.
Dominance mechanism: In the context of mixed-feasibility solution comparison, a feasible solution () always dominates an infeasible solution ().
Comparison criterion for infeasible solutions: If both solutions are infeasible, the solution with a smaller constraint violation () value is preferred. If their values are equal, the Pareto dominance criterion is then applied for comparison.
When the neighborhood solution is dominated by the current solution, the Metropolis criterion is utilized to determine whether to accept the neighborhood solution. The neighborhood solution is accepted with a certain probability to avoid iteration getting stuck in a local optimum. The probability of accepting the neighborhood solution is given by the following equation.
is the cost difference between the current candidate solution and its generated neighborhood solution: . is the generation value of the newly generated neighborhood solution, and is the generation value of the current solution. Calculate the generation value using Equation (16). The probability of accepting the inferior solution is controlled by using the temperature parameter , which is the current temperature, and is calculated as follows: . denotes the initial temperature, which takes the value of 150 °C, g denotes the current iteration number and denotes the annealing coefficient, .
In order to generate more population individuals that meet the constraints as well as diversity, a crossover operation is introduced on top of the local search. The crossover operation here selects uniform crossover. Based on the number of feasible solutions of the initial candidate solution set individuals, the number of individuals whose initial candidate solution set accepts crossover is selected. The number of crossover individuals is shown in the following equation.
represents the proportion of feasible solutions in the candidate pool. candidate is the number of candidate solutions. The newly generated neighborhood solutions, the offspring produced by crossover operations, and the original candidate solutions textcolorgreenare collectively merged into a new candidate solution pool for subsequent iterative optimization. for subsequent iterative optimization.The iterative cycle of simulated annealing and adaptive crossover operations enables the proposed algorithm to effectively promote global convergence while maintaining solution quality and diversity.
5.2.3. Initial Population Generation
Upon completion of the iterative process, all feasible solutions satisfying the constraints are first selected from the final-generation candidate solution pool. If the number of feasible solutions exceeds the initial population size, a subset of individuals equal to the initial population size is randomly chosen from them to form the initial population. If the number of feasible solutions is insufficient, infeasible solutions with smaller constraint violation () values are selected from the candidate pool to supplement the population until the predefined initial population size is reached.
5.3. Uniform Crossover
Crossover operation is a key step in genetic algorithm. As illustrated in Figure 4, uniform crossover is chosen to perform the crossover operation on individuals in this study. Uniform crossover does not rely on a fixed crossover point; it independently determines from which parent individual each locus comes. For the gene i of the offspring , a random number between 0 and 1 is generated; if the generated random parameter is less than 0.5, the corresponding gene of the parent is selected for inheritance, otherwise the gene from is selected. Similarly, the crossover operation generates offspring , creating new individual combinations. This mechanism enhances population diversity and helps the algorithm escape local optima.

Figure 4.
Uniform crossover.
5.4. Differential Mutation
NSGA-III often uses two ways to generate mutated offspring in the mutation operation: polynomial mutation and simulated binary mutation. However, these two ways of mutation will produce offspring individuals with high similarity, and also have the problem of slow convergence speed. To address these problems, a differential mutation (DE) strategy is introduced to replace the original mutation operation. DE generates new individuals by calculating the vectorial differences between population individuals and scaling them by a scaling factor. However, since this paper employs integer encoding, the idea of Boolean differential mutation is used to cope with the lack of support for feasibility and integer constraints in the standard DE operator.
Given that the value range of each gene (dimension) is , then when there is only one subtask and the number of clusters is 1, the value space of each individual gene is only 0 and 1. The gene values do not need to be converted. When the number of clusters is greater than 1, the integer-valued genes are converted to 2-bit binary numbers. Four individuals are randomly selected from the population species noted as , , , and . For the target individual , its differential individual is generated by the following equation:
F is the scaling factor, which is regarded here as the probability of executing (14), denoting the heteroscedastic operation. ⊕ represents the XOR operation. The execution rule of ∗ is as follows: for each binary bit of each gene, generate a random number between ; if , then execute Equation (14). The opposite is not executed. The mutated binary number is converted back to an integer to obtain the final mutated individual. After generating the mutated individual, for each of its genes decide whether to replace the target individual with the value of the mutated individual based on the crossover probability .
, , and represent the values of gene j of the variant individual , the target individual , and the differential individual , respectively. denotes a random selection of genes to ensure that at least one gene is crossed over. The crossover probability generally takes a value between . The larger is, the more frequent the gene replacement is. After the above operations, the is obtained.
5.5. Selection and Niche-Preservation in H-NSGAIII-DE
During the population selection phase, the crossover population generated by uniform crossover, the mutation population produced by differential mutation, and the original population are combined to form a new composite population . Subsequently, the non-dominated sorting mechanism from reference [33] is applied to to construct a hierarchical structure of non-dominated solutions, thereby identifying multiple Pareto fronts. Subsequently, thereby identifying Pareto fronts with different priorities. Building upon this, the algorithm employs a reference point-based niche-preservation strategy for elite selection: First, the objective function values are normalized and a set of predefined reference points is generated to guide the population towards a desired distribution along the Pareto front. Next, individuals in the combined population are associated with these reference points. During the selection process, all individuals from the first non-dominated front () are prioritized for retention. If their number does not reach the predefined population size , individuals with excellent distribution are subsequently selected from the lower non-dominated fronts based on their association with reference points and niche density, until the population size is filled, ultimately forming the new parent population .
5.6. Selection of the Final Solution
The final clustering scheme is selected in the final set of solutions according to the following equation.
where is the weight factor of each optimization objective. In summary, H-NSGAIII-DE is presented in Algorithm 1.
| Algorithm 1 H-NSGAIII-DE algorithm |
|
6. Results and Discussion
To validate the performance of the proposed algorithm, the method presented herein was compared with H-NSGAIII (initialized using the HSAGI strategy), NSGA-III-DE (employing differential mutation), the original NSGA-III, NSGAIII-S-CDAS [34], and NSGAIII-MSDR [35]. This section presents the results of the experimental evaluation and provides a comparative analysis of the outcomes.
6.1. Experimental Setup
The experiments in this paper were conducted using MATLAB 2018b, with the specific experimental parameters in the Table 3.

Table 3.
Experimental parameters.
6.2. The Relationship Between the Number of Nodes and Each Objective
6.2.1. The Relationship Between the Number of Nodes and Average Computing Power Resources Dispersion
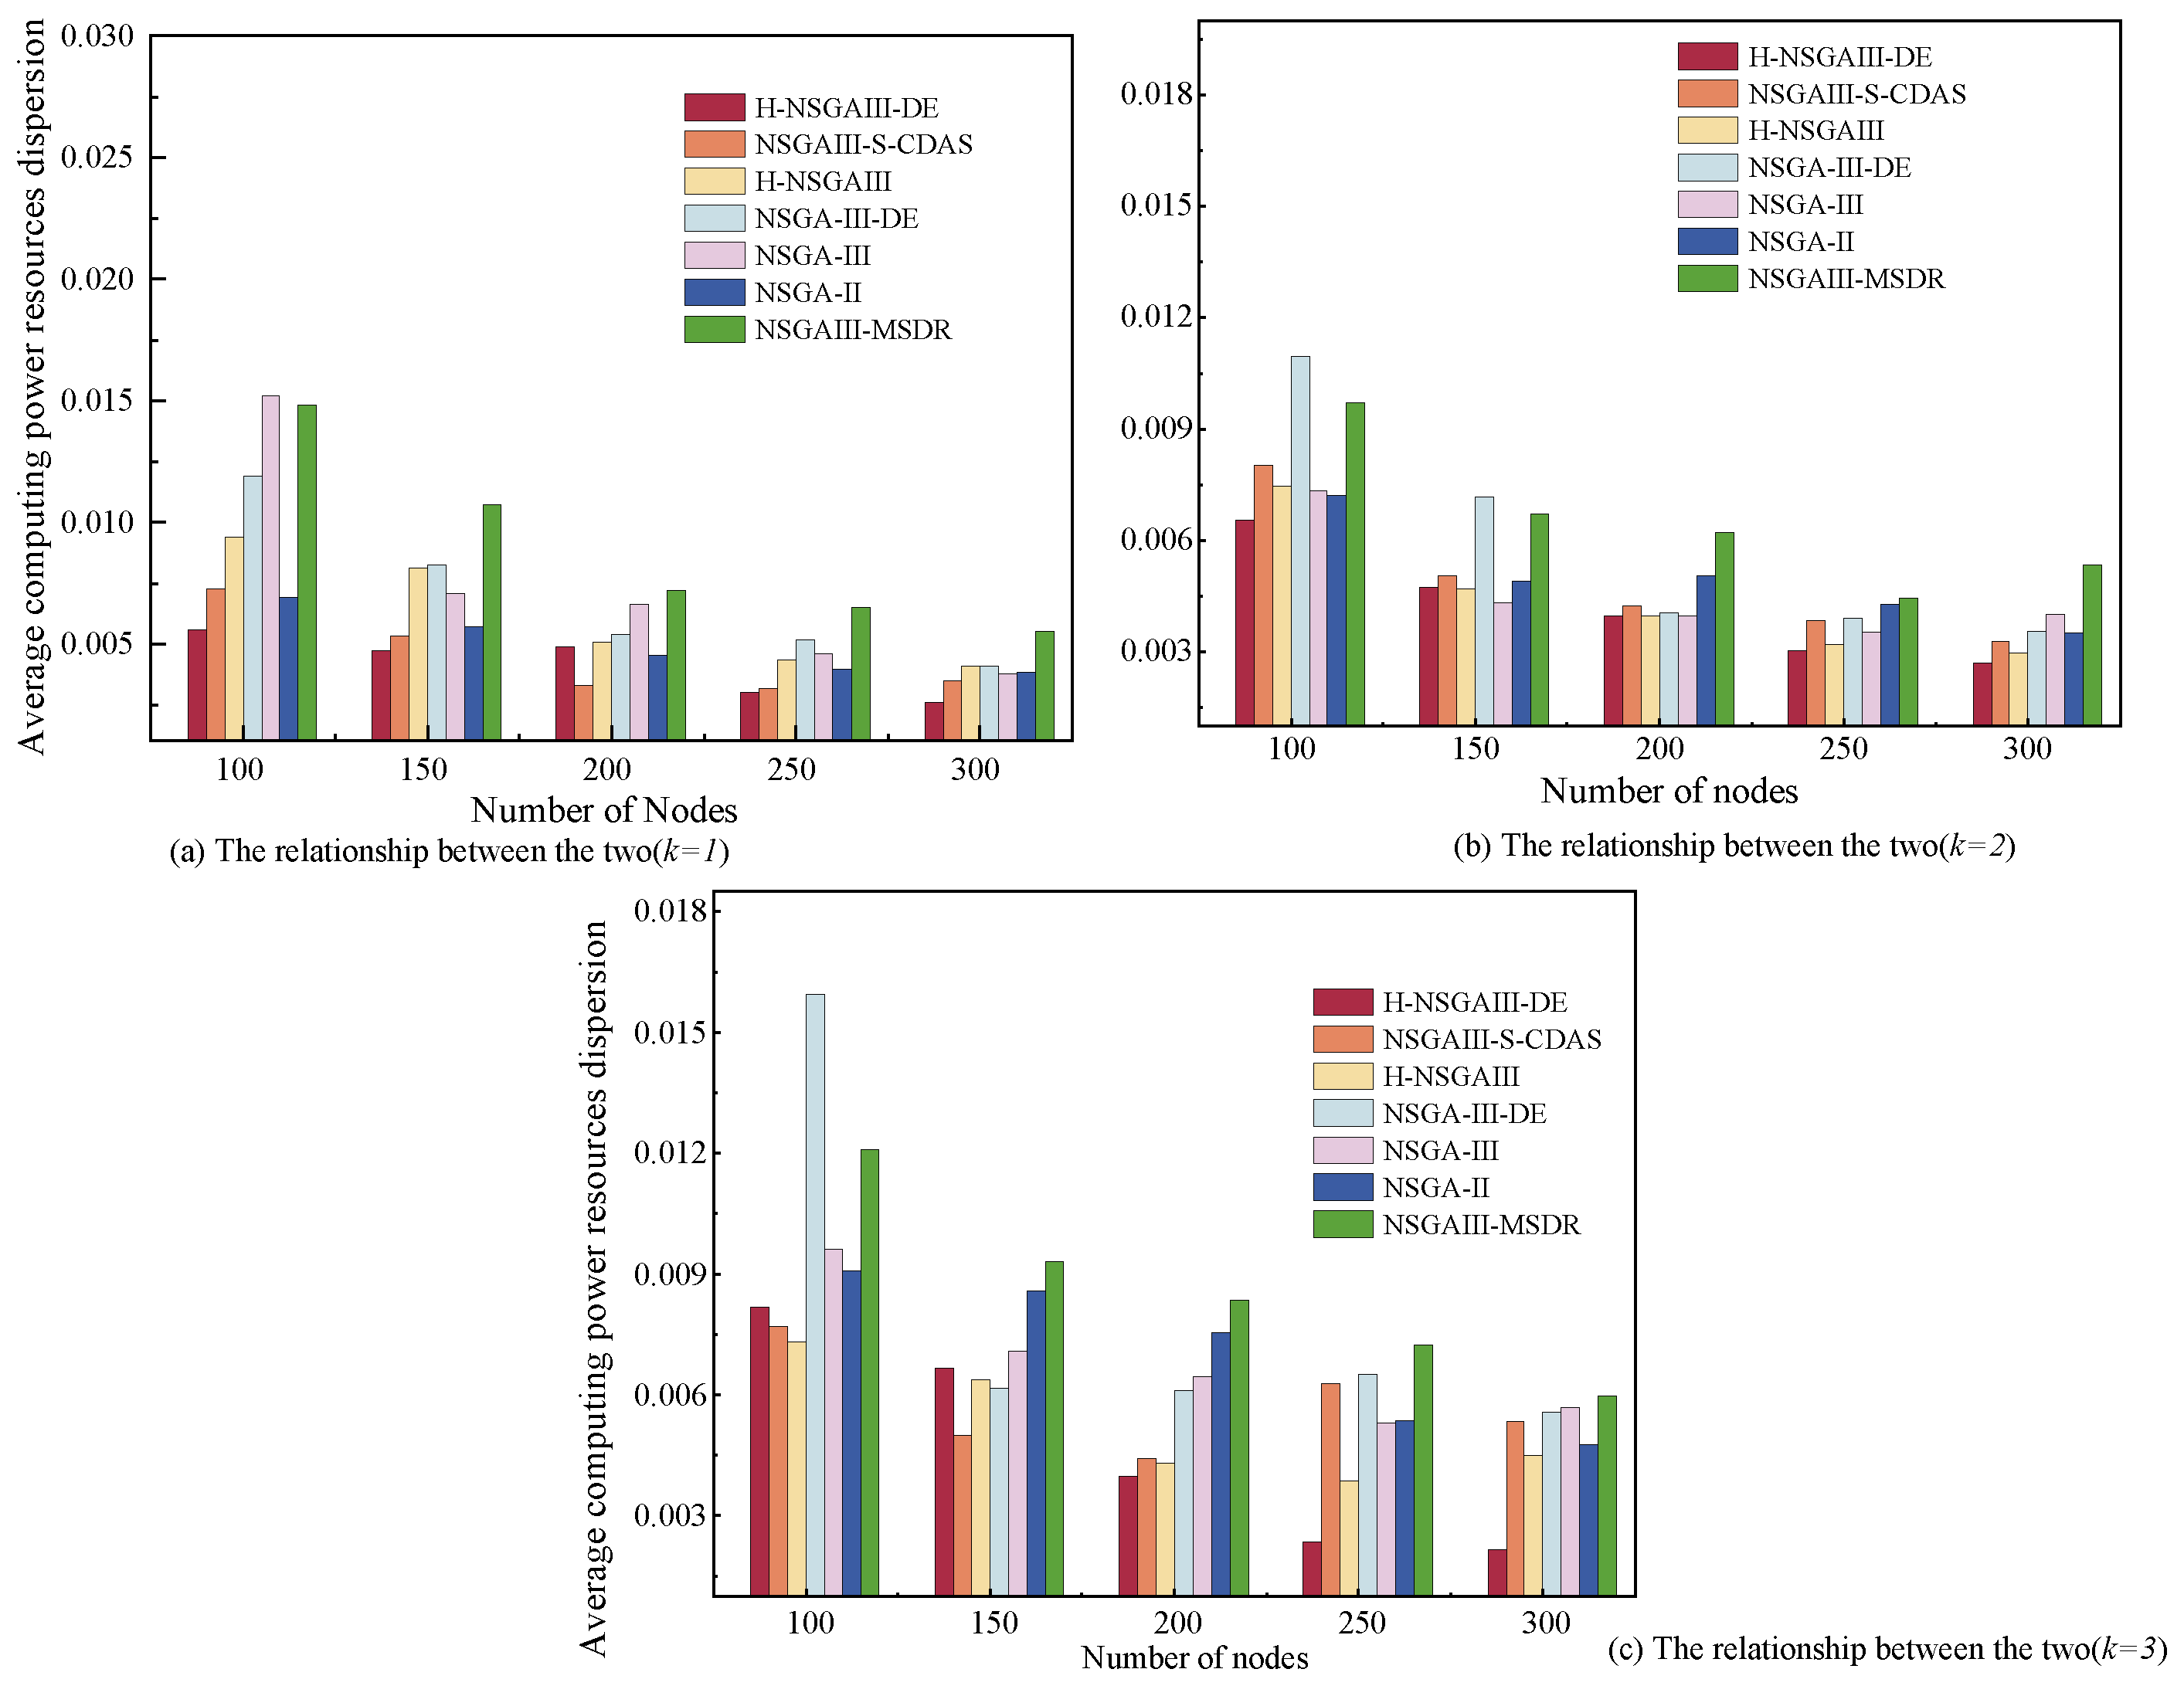
Figure 5 illustrates the variation trend in average computing power resources dispersion under different numbers of nodes (N). Its subgraphs further show the specific relationships under varying numbers of clusters (k). The results indicate that the average computing power resources dispersion is negatively correlated with N, meaning that as the node scale increases, the dispersion degree of computing resources distribution shows a significant downward trend.
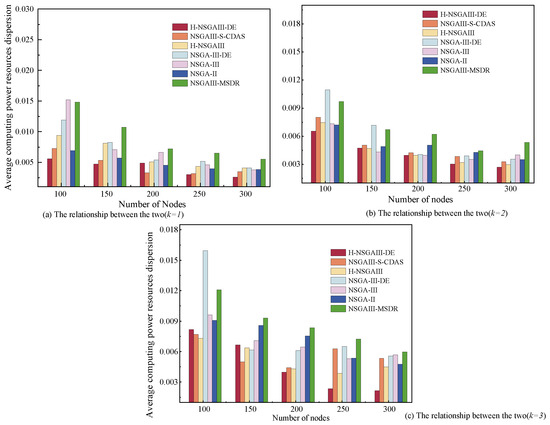
Figure 5.
Average computing power resources dispersion under different number of nodes and clusters.
This phenomenon can be attributed to the resource pooling effect brought about by node scale expansion: when a large number of heterogeneous nodes are integrated into the terminal network, the proposed algorithm can achieve more optimized node selection within the expanded resource pool. By reconstructing the computing power allocation within clusters, it promotes a more uniform distribution of computing power resources at the cluster level, thereby effectively reducing the overall average computing power resources dispersion of the system. The proposed H-NSGAIII-DE algorithm outperforms most comparative algorithms across most node scales. Although its performance falls short of some comparative algorithms when nodes are fewer than 250, H-NSGAIII-DE achieves lower average computing power resources dispersion when nodes exceed 250. This demonstrates its stronger suitability for large-scale node scenarios and its ability to construct clusters with more balanced computing power resources distribution.
6.2.2. The Relationship Between the Number of Nodes and Cluster Size
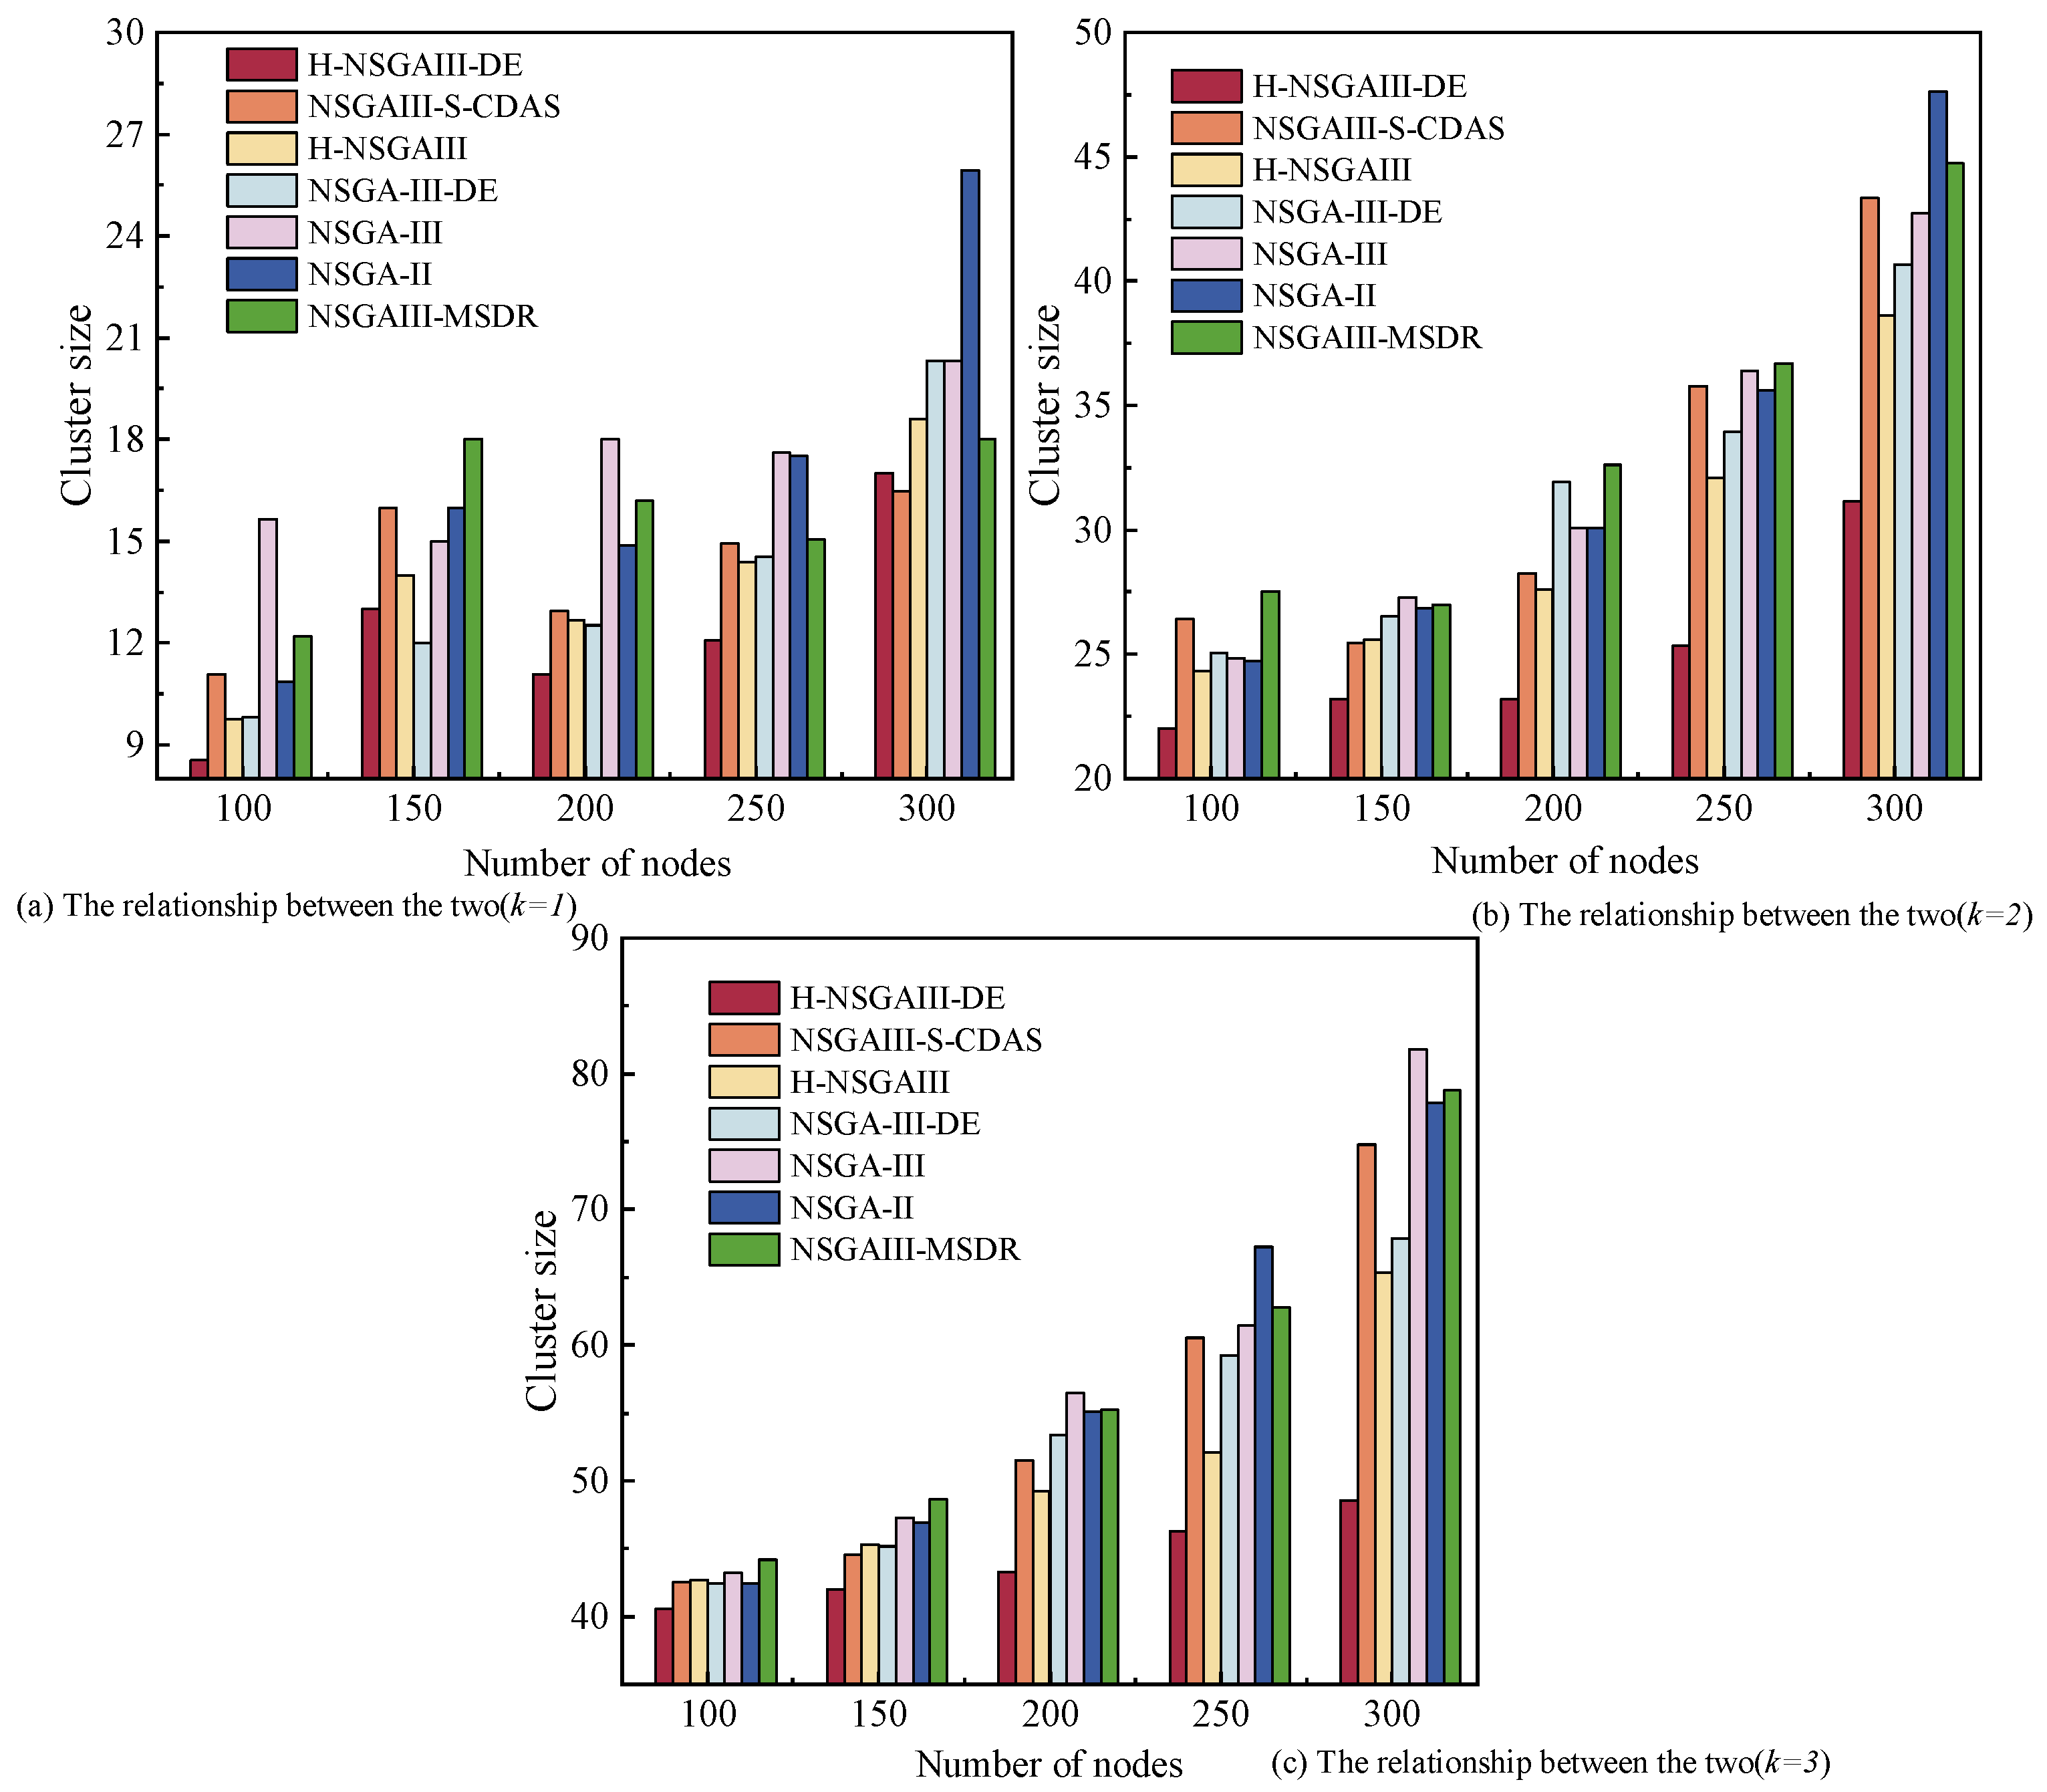
Figure 6 reflects the impact of different node numbers on the cluster size, and the subgraphs distinguish the changes under different k. Within the figure, cluster size exhibits a positive correlation with the number of nodes. As the number of nodes increases, more redundant nodes are allocated within the cluster, consequently expanding its overall scale.
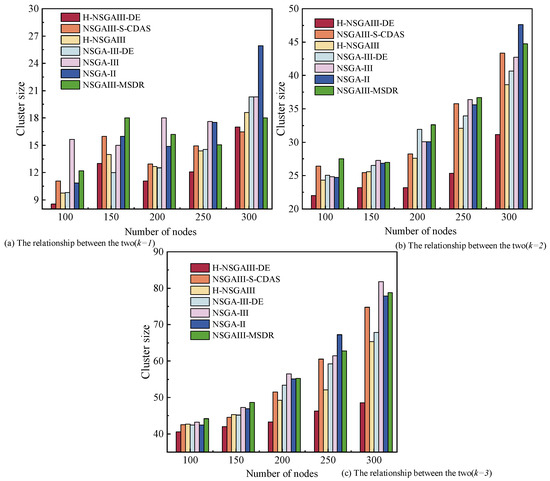
Figure 6.
Cluster size under different number of nodes and clusters.
When and , the cluster size of the proposed algorithm is slightly higher than that of NSGA-III-DE algorithm, indicating that there is some room for improvement. However, when k increases to two and three, the proposed algorithm demonstrates a marked advantage in cluster size control, with values significantly lower than the comparative algorithms. This result indicates that in scenarios with large node scales, the proposed method can more effectively reduce the number of redundant nodes. Consequently, it achieves a more compact cluster structure while maintaining system performance and improving resource utilization efficiency.
6.2.3. The Relationship Between the Number of Nodes and Average Matching Deviation
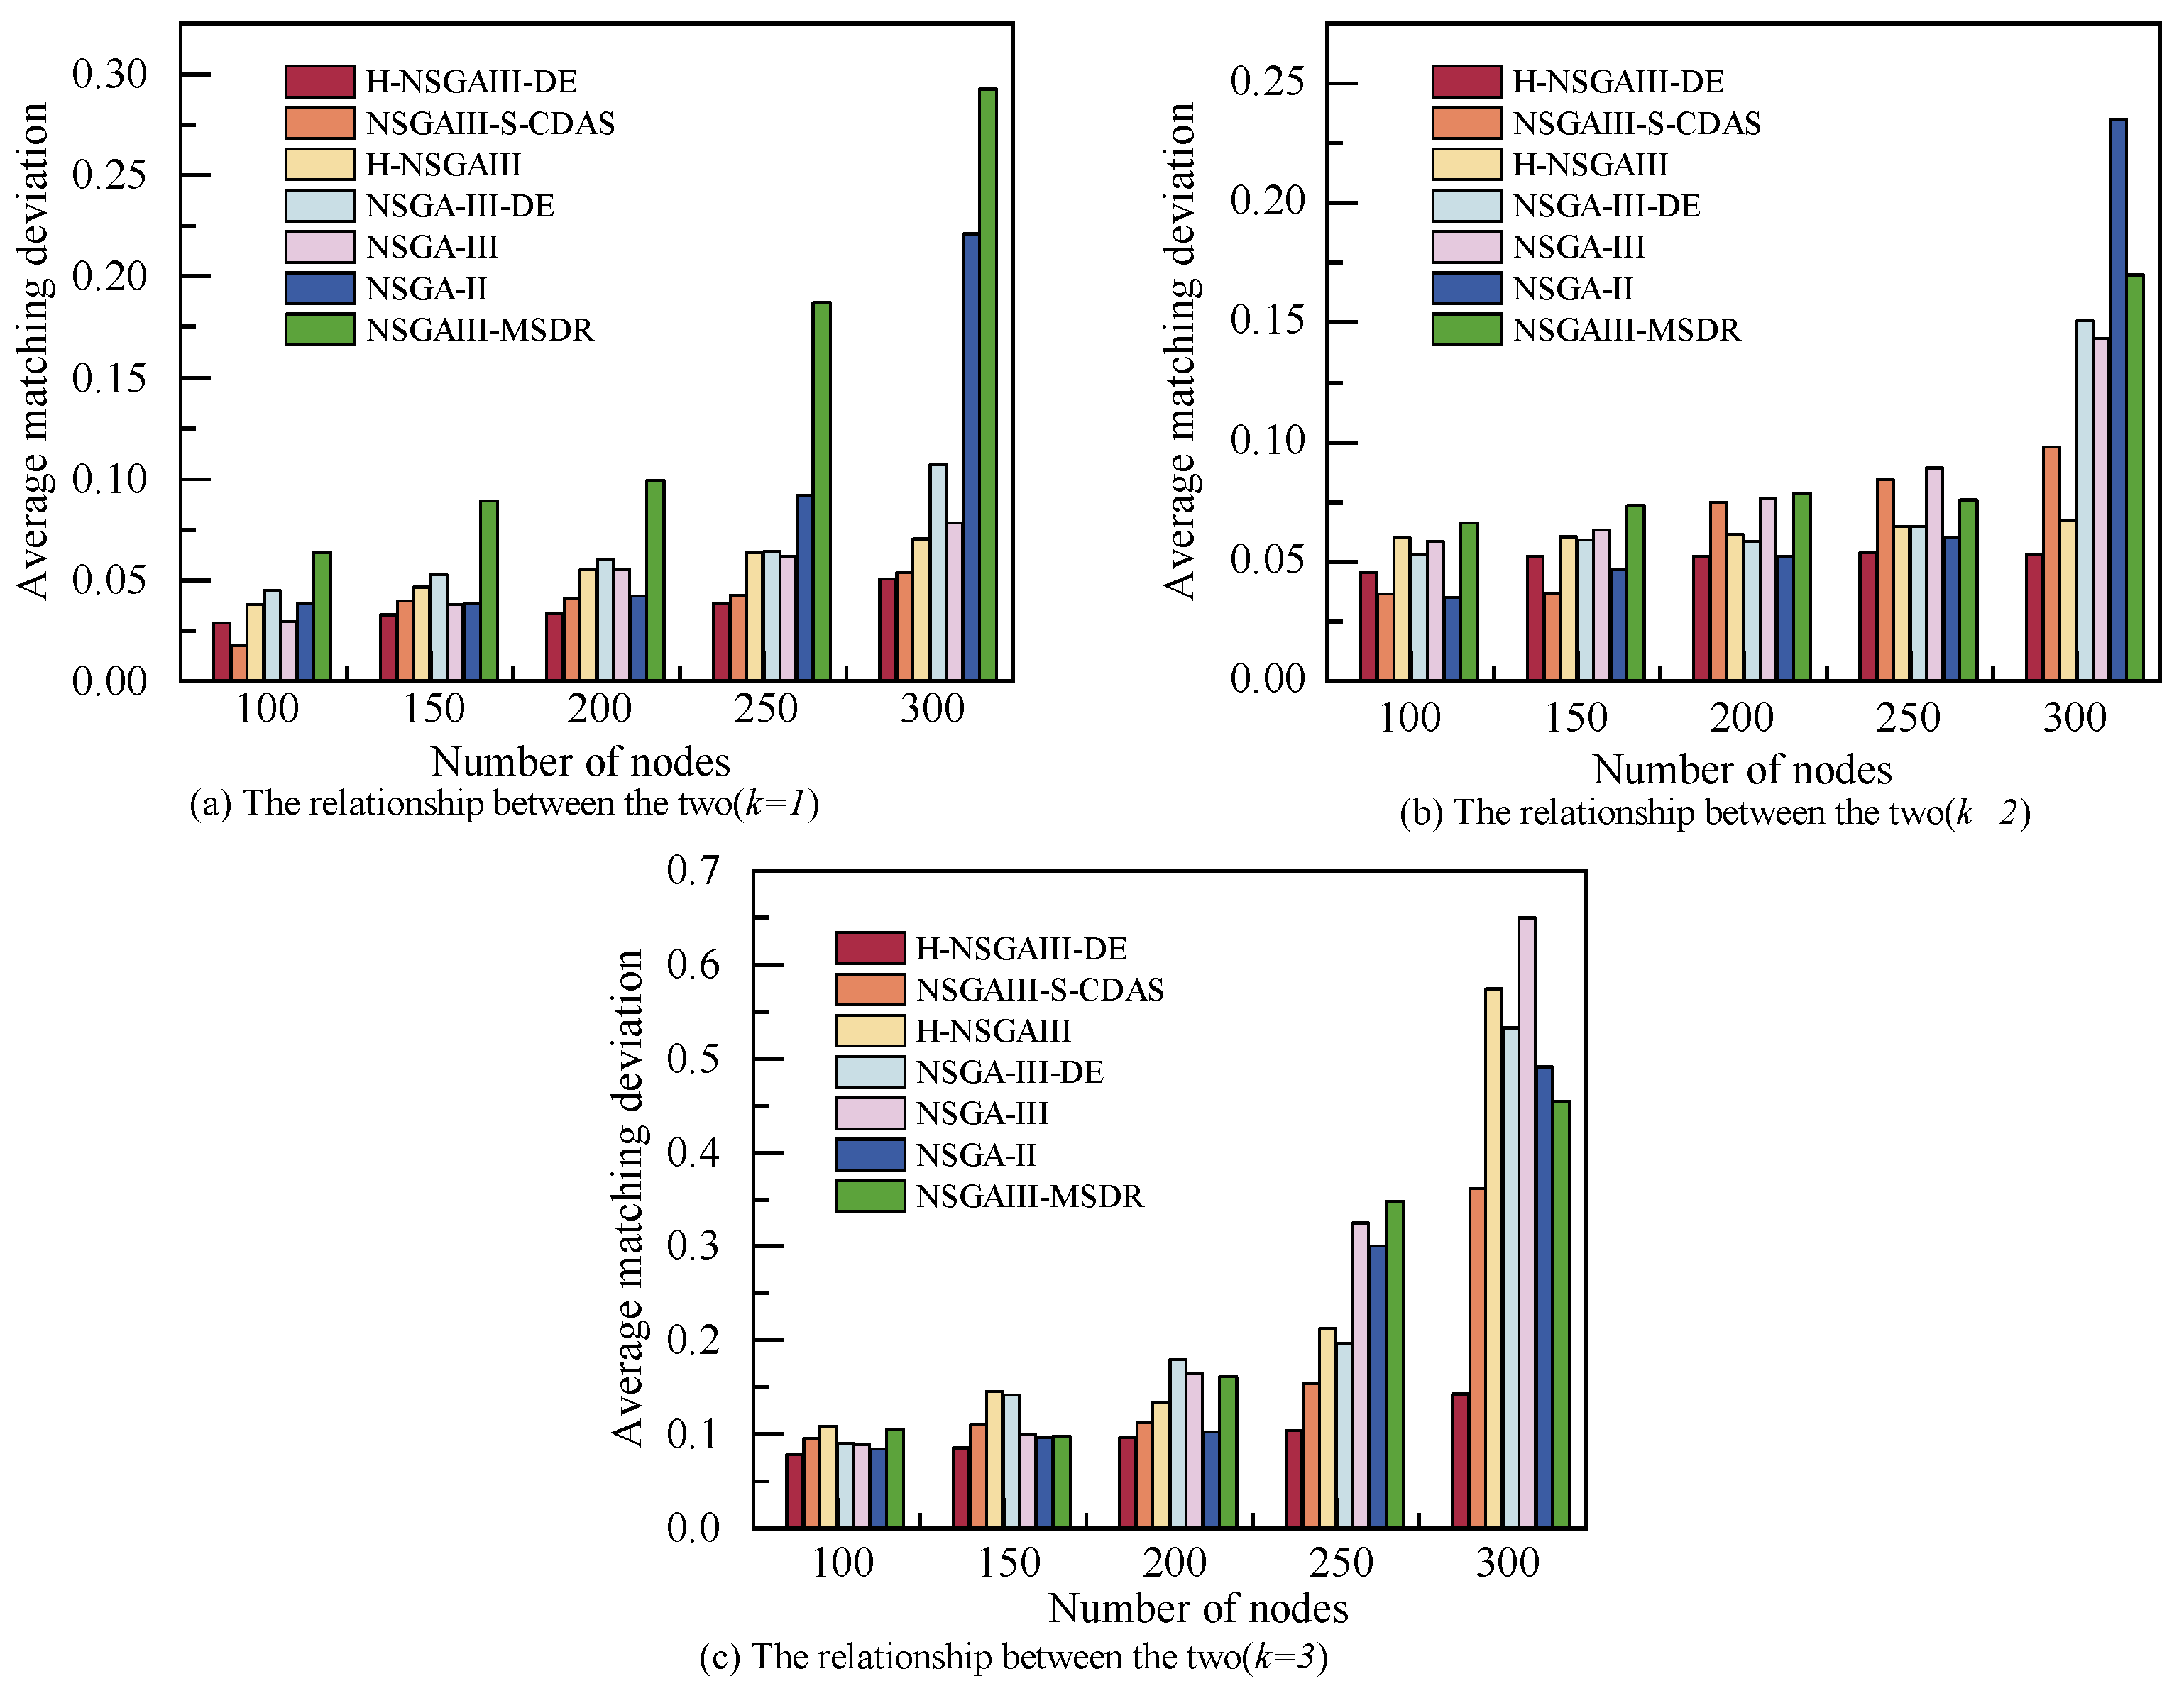
Figure 7 illustrates the relationship between terminal node scale and the system’s average matching deviation, with subgraphs providing detailed comparisons under different k. As the number of nodes increases, the expansion of cluster size and the enhancement of total computing power resources lead to a corresponding rise in the matching deviation between resources and task requirements, resulting in decreased resource utilization efficiency and computing redundancy.
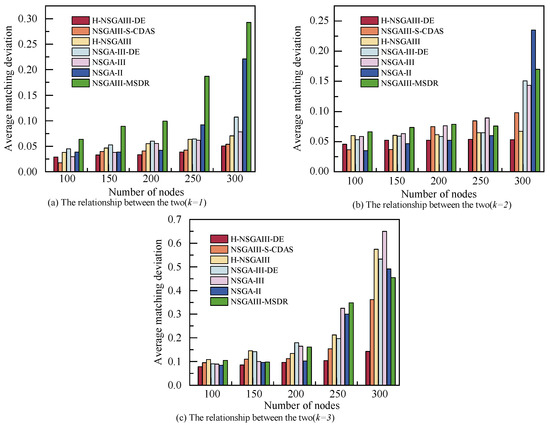
Figure 7.
Average matching deviation under different number of nodes and clusters.
When , the average matching deviation increases most significantly across all algorithms. For , with and , the average matching deviation of the proposed algorithm is marginally higher than that of NSGA-II and NSGAIII-S-CDAS, indicating potential for further improvement in resource utilization efficiency under these specific scenarios. However, in the majority of other cases, the proposed algorithm demonstrated optimal resource conservation characteristics. Its average matching deviation exhibited the smallest increase with a growing number of nodes and also recorded the lowest absolute value, effectively curbing computing power waste. The results confirm that the proposed method can significantly reduce redundant resource allocation while scaling cluster size, thereby enhancing resource utilization efficiency.
6.2.4. The Relationship Between the Number of Nodes and Average Distance
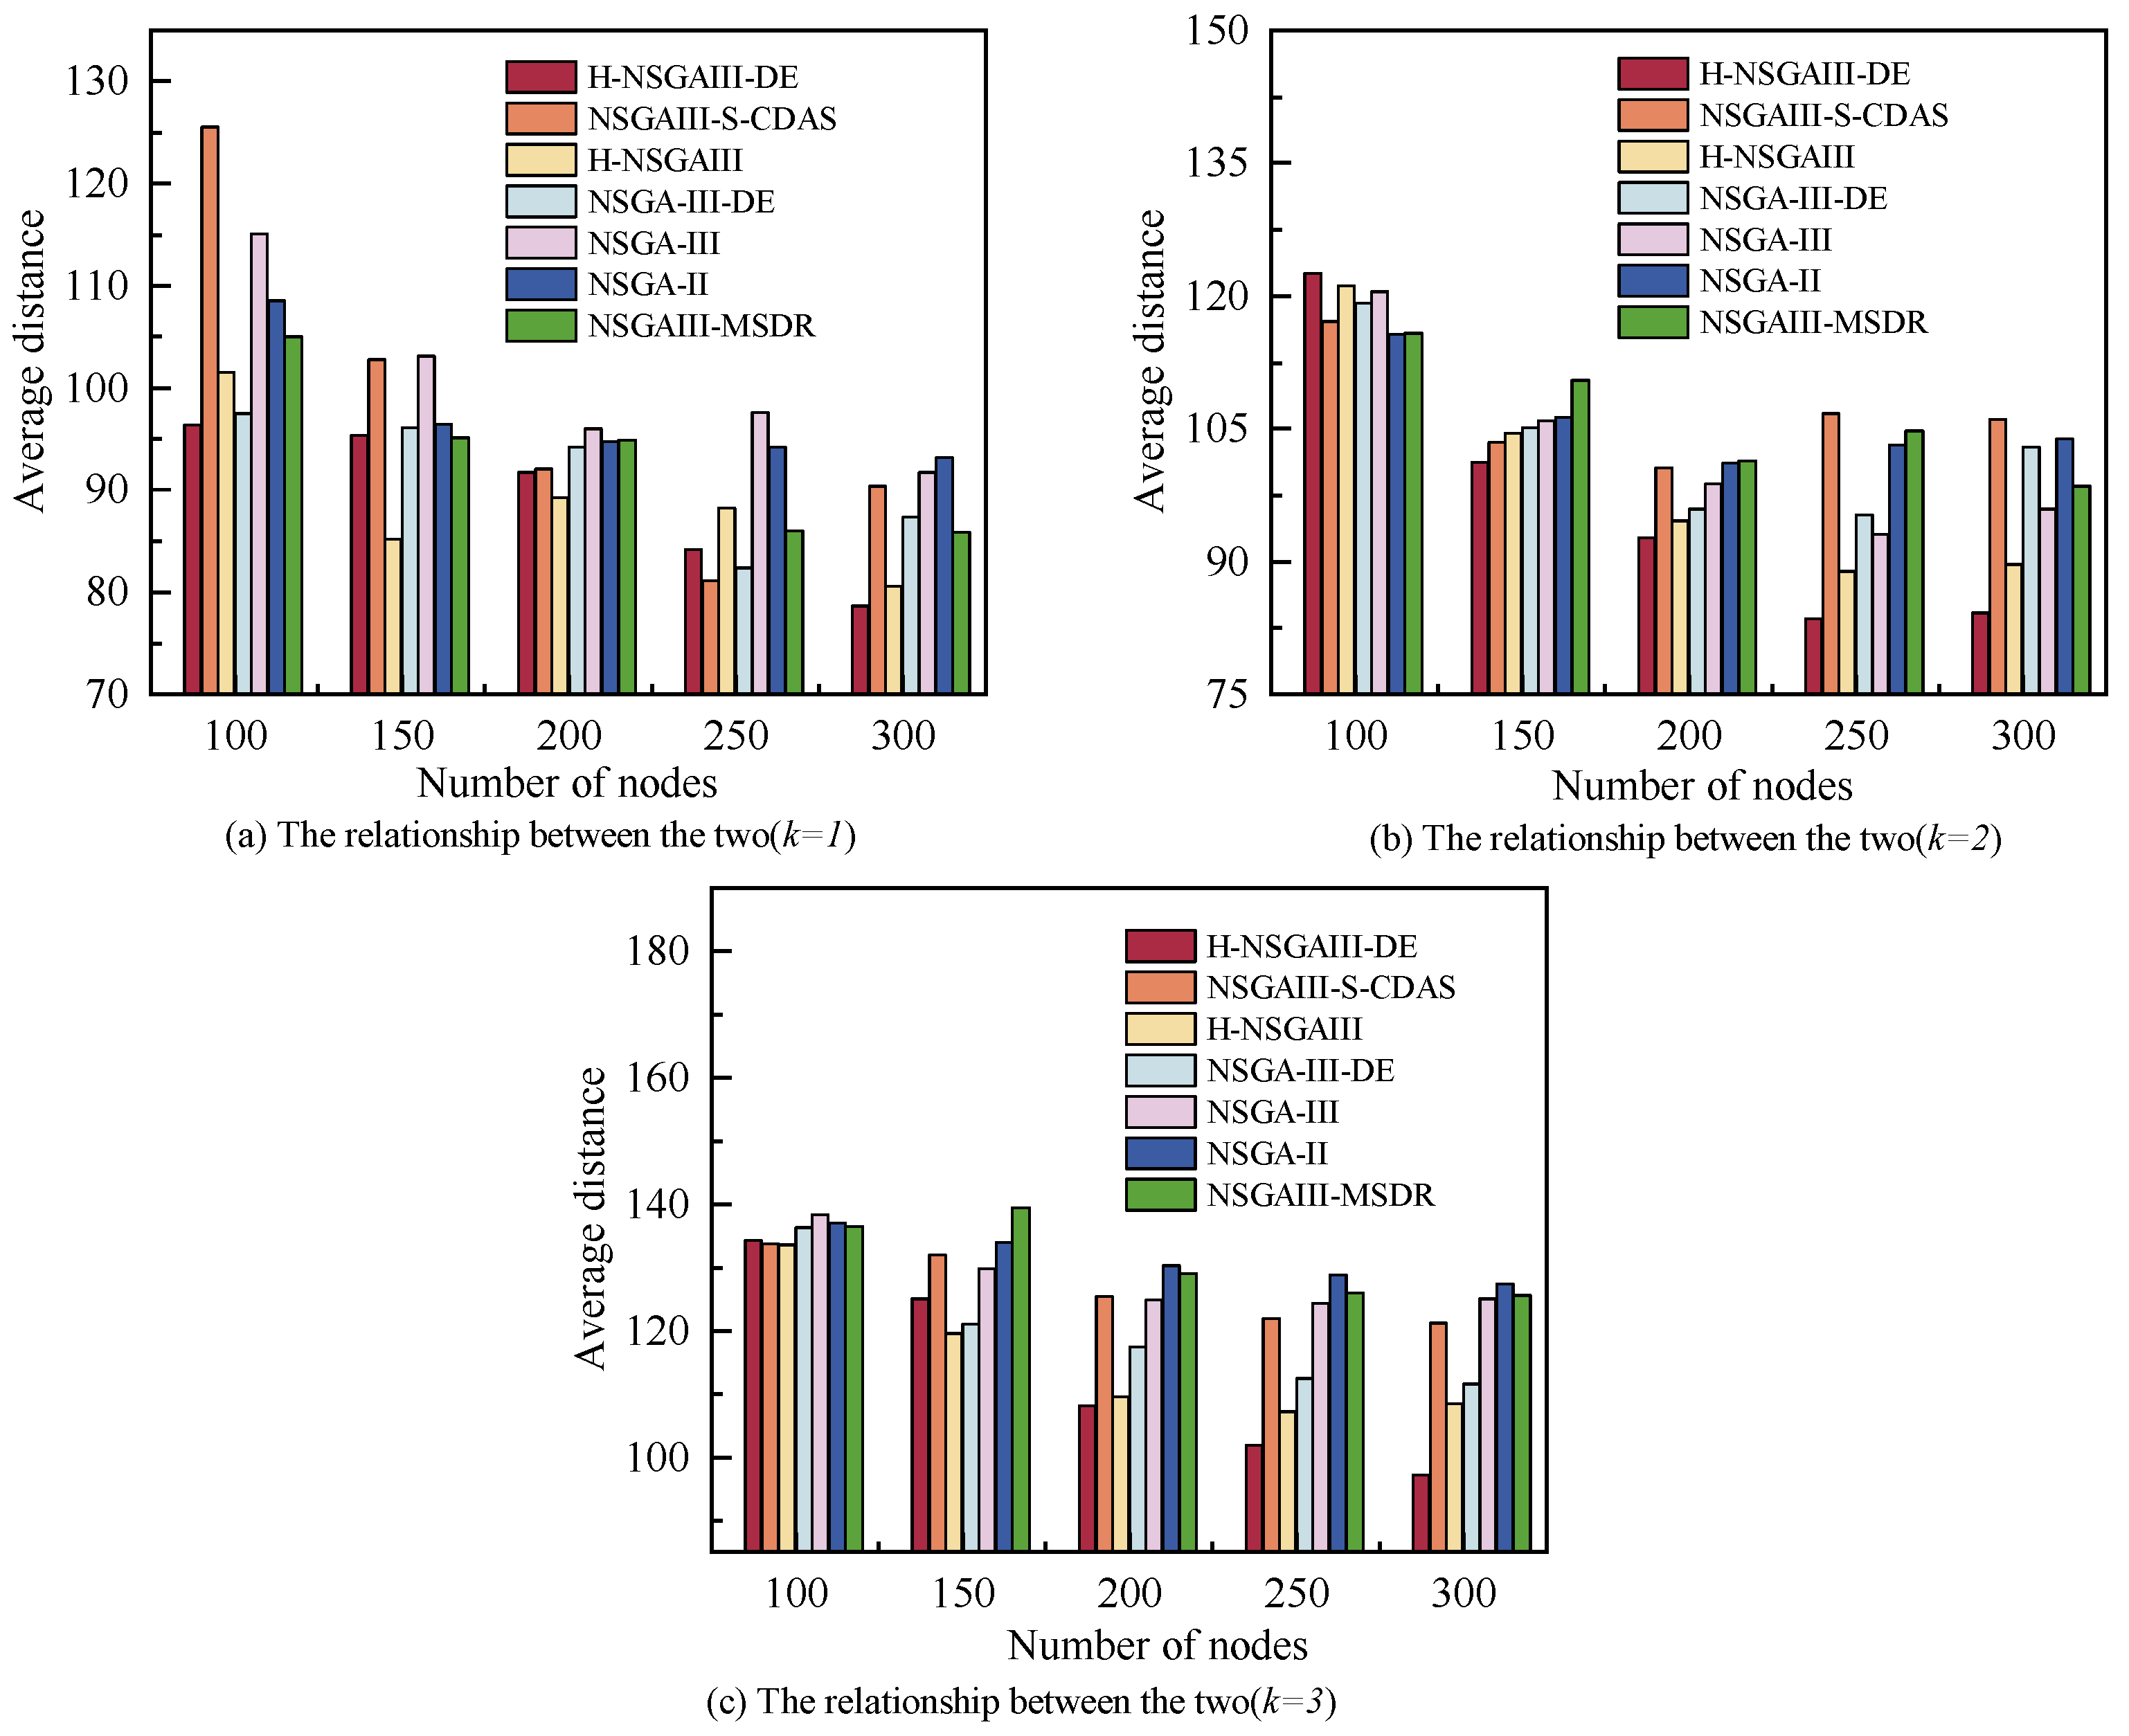
Figure 8 illustrates the relationship between terminal node scale and the system’s average distance, with subfigures reflecting variation patterns under different k. As the number of nodes increases, the average distance between clusters and base stations decreases. This trend can be attributed to the spatial optimization effect resulting from higher node density: with more available nodes, the probability of selecting closer nodes while satisfying task resource requirements increases, leading to a cluster distribution geographically nearer to the base station and thereby reducing the average distance. Overall, for most node scales and cluster configurations, the average distance achieved by the proposed algorithm is significantly lower than that of the comparative algorithms. This demonstrates that the proposed method more effectively utilizes the geographical distribution of nodes to construct clusters with lower communication overhead and more optimal topologies. This contributes to reduced transmission delays and enhances the overall responsiveness of the system.
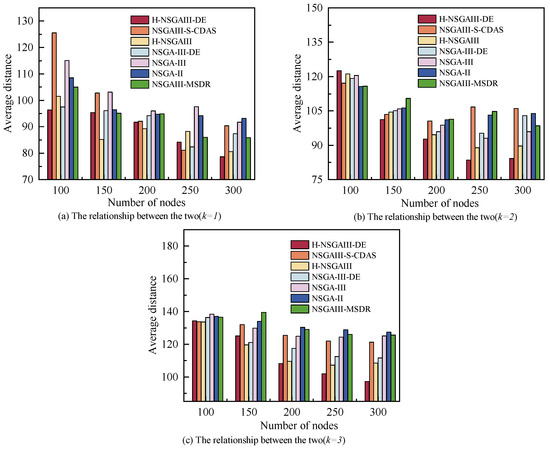
Figure 8.
Average distance under different number of nodes and clusters.
6.3. The Relationship Between the Number of Clusters and Each Objective
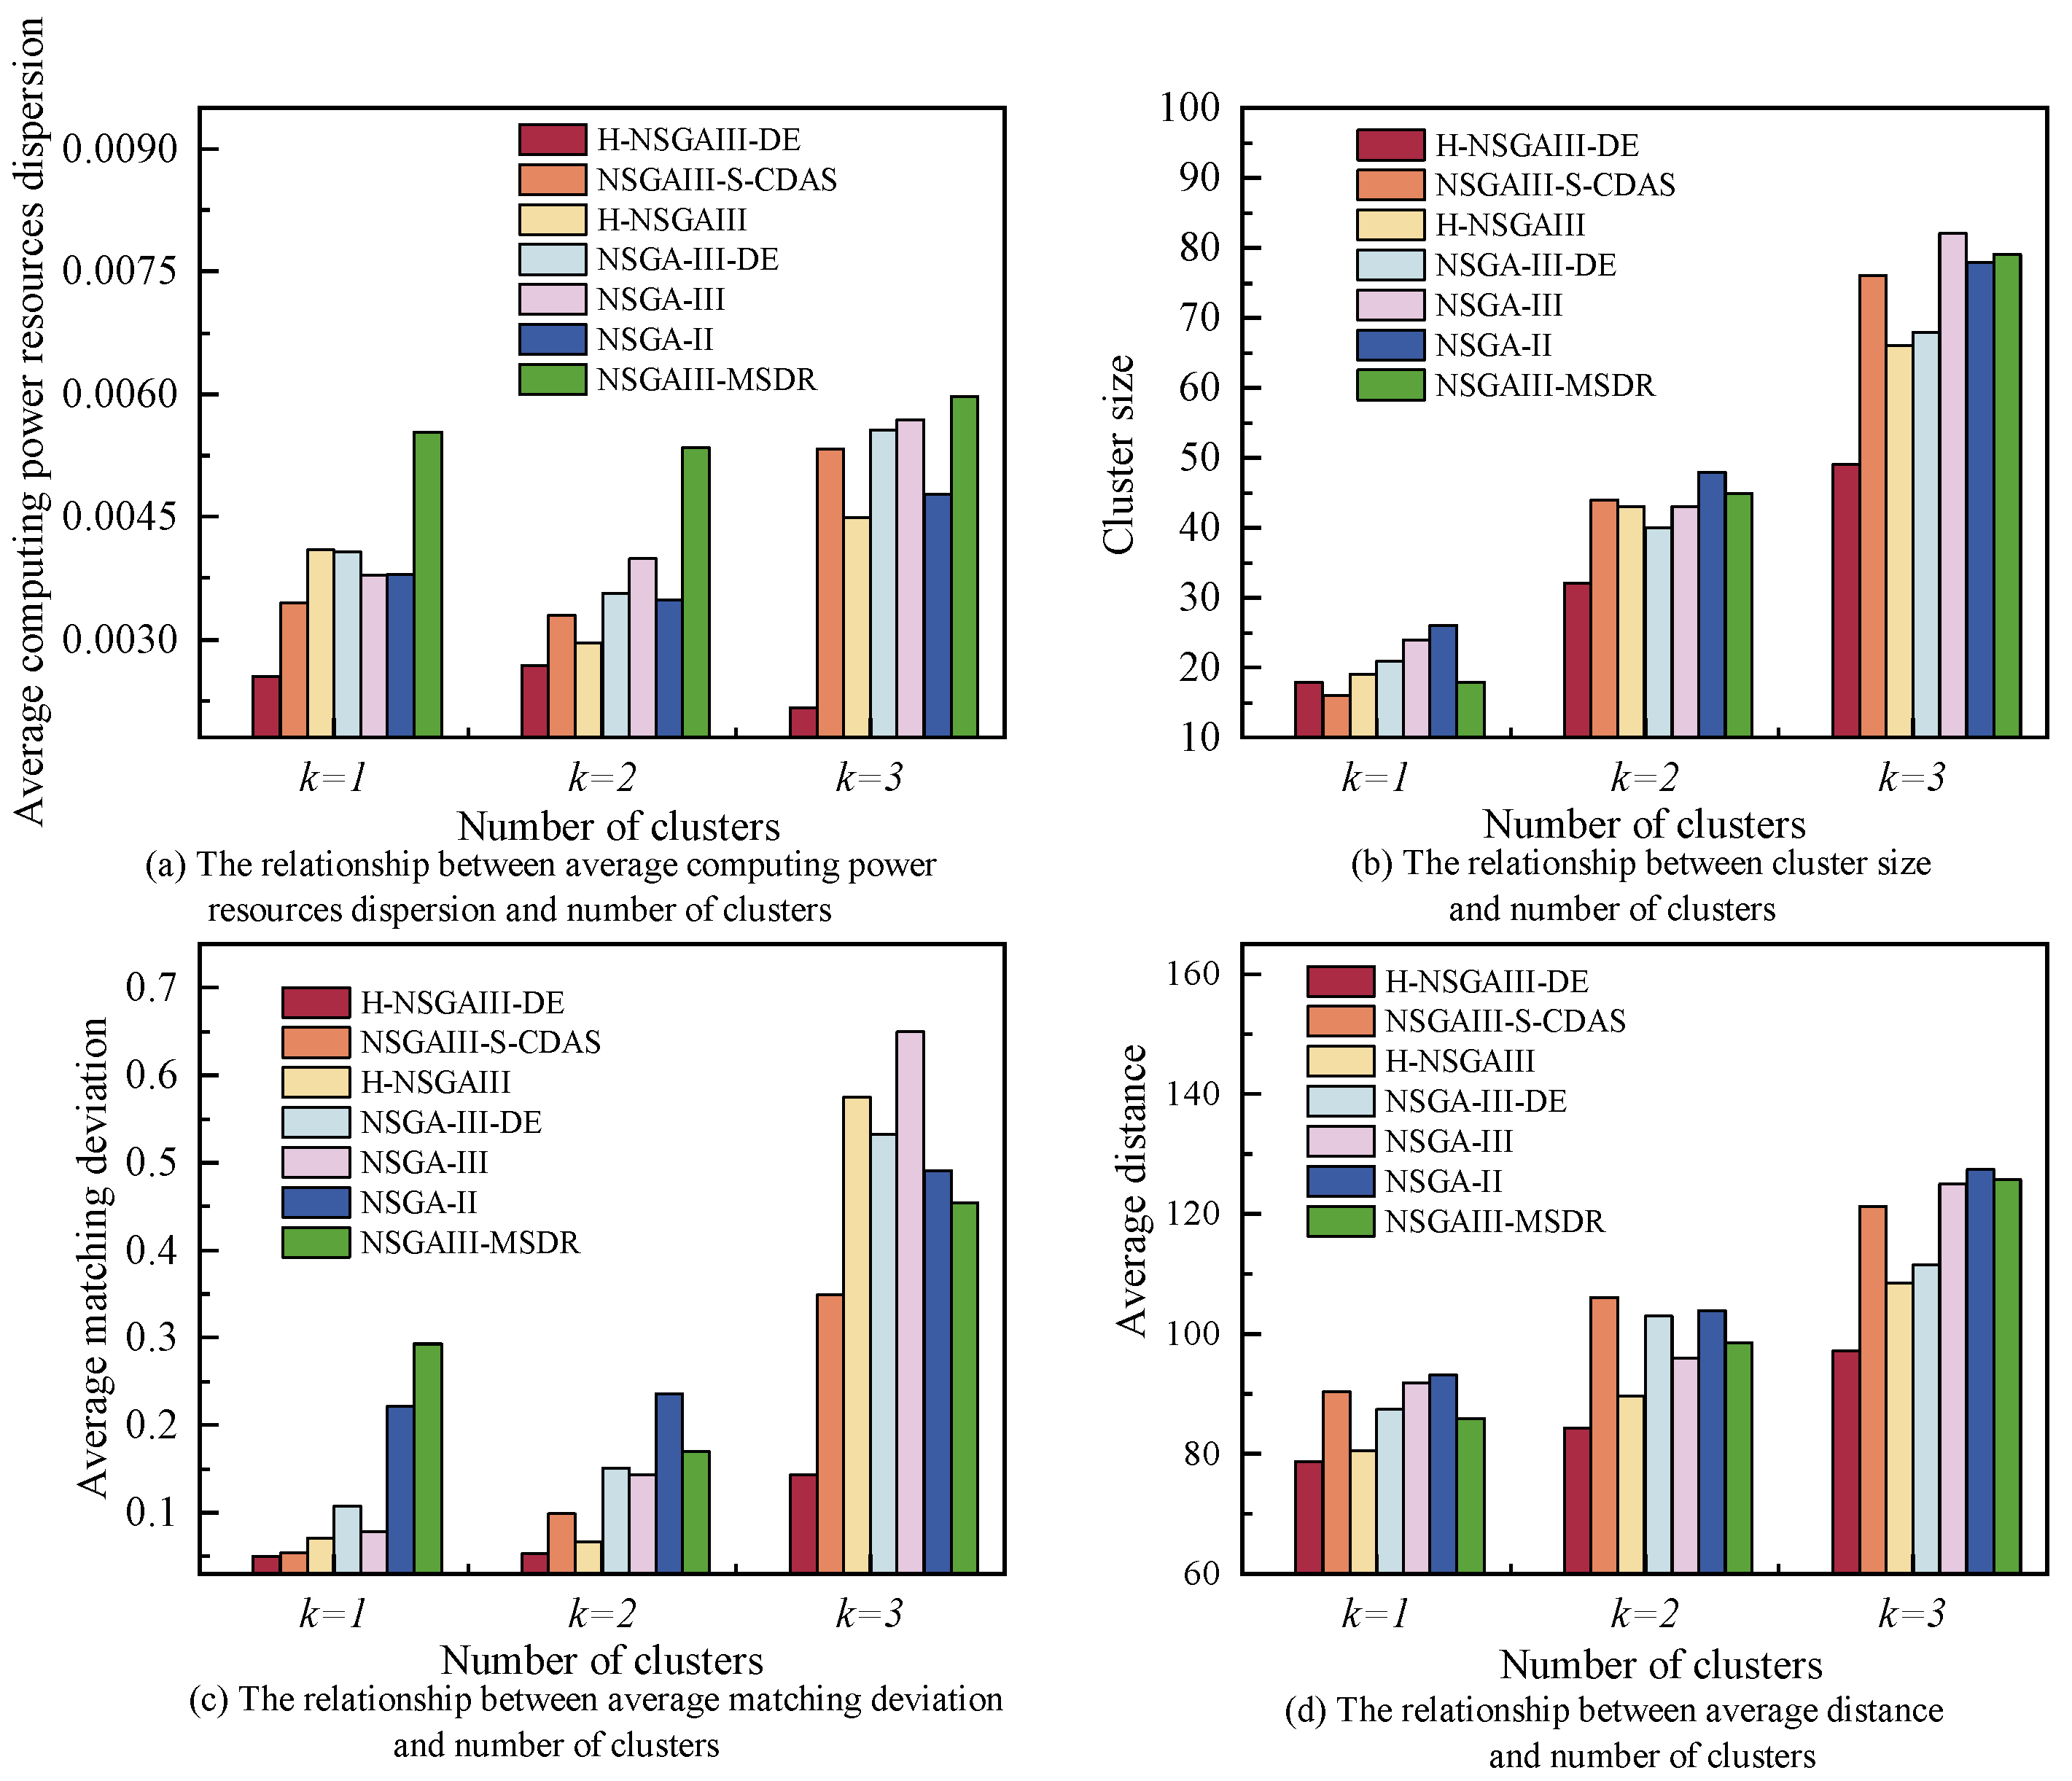
Figure 9 illustrates the trends in average computing power resources dispersion, cluster size, average matching deviation, and average distance across varying numbers of clusters under the condition of , . As evident from the graphs, each objective generally increases with the number of clusters. This occurs because different subtasks demand distinct computing power resources; when the number of clusters increases, algorithms cannot simultaneously satisfy optimal cluster configurations for all subtasks. Competition for nodes between clusters may occur, leading to subtasks being assigned to suboptimal clusters and consequently elevating the objective values. Despite the upward trend in all objective values as the number of clusters increases, the proposed algorithm consistently achieves lower values across all objectives compared to the baseline algorithms under the same number of clusters. This result robustly demonstrates that, in complex scenarios with varying k, the proposed algorithm can construct terminal clusters with higher resource-task matching, more compact structure, and lower communication overhead, significantly outperforming the comparative algorithms in overall performance.
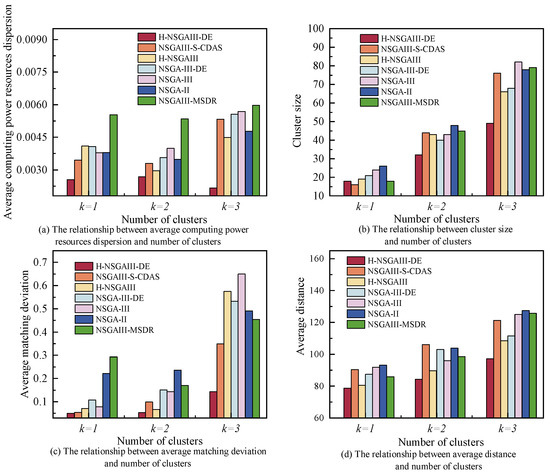
Figure 9.
The relationship between the number of clusters and each objective.
6.4. Convergence Analysis
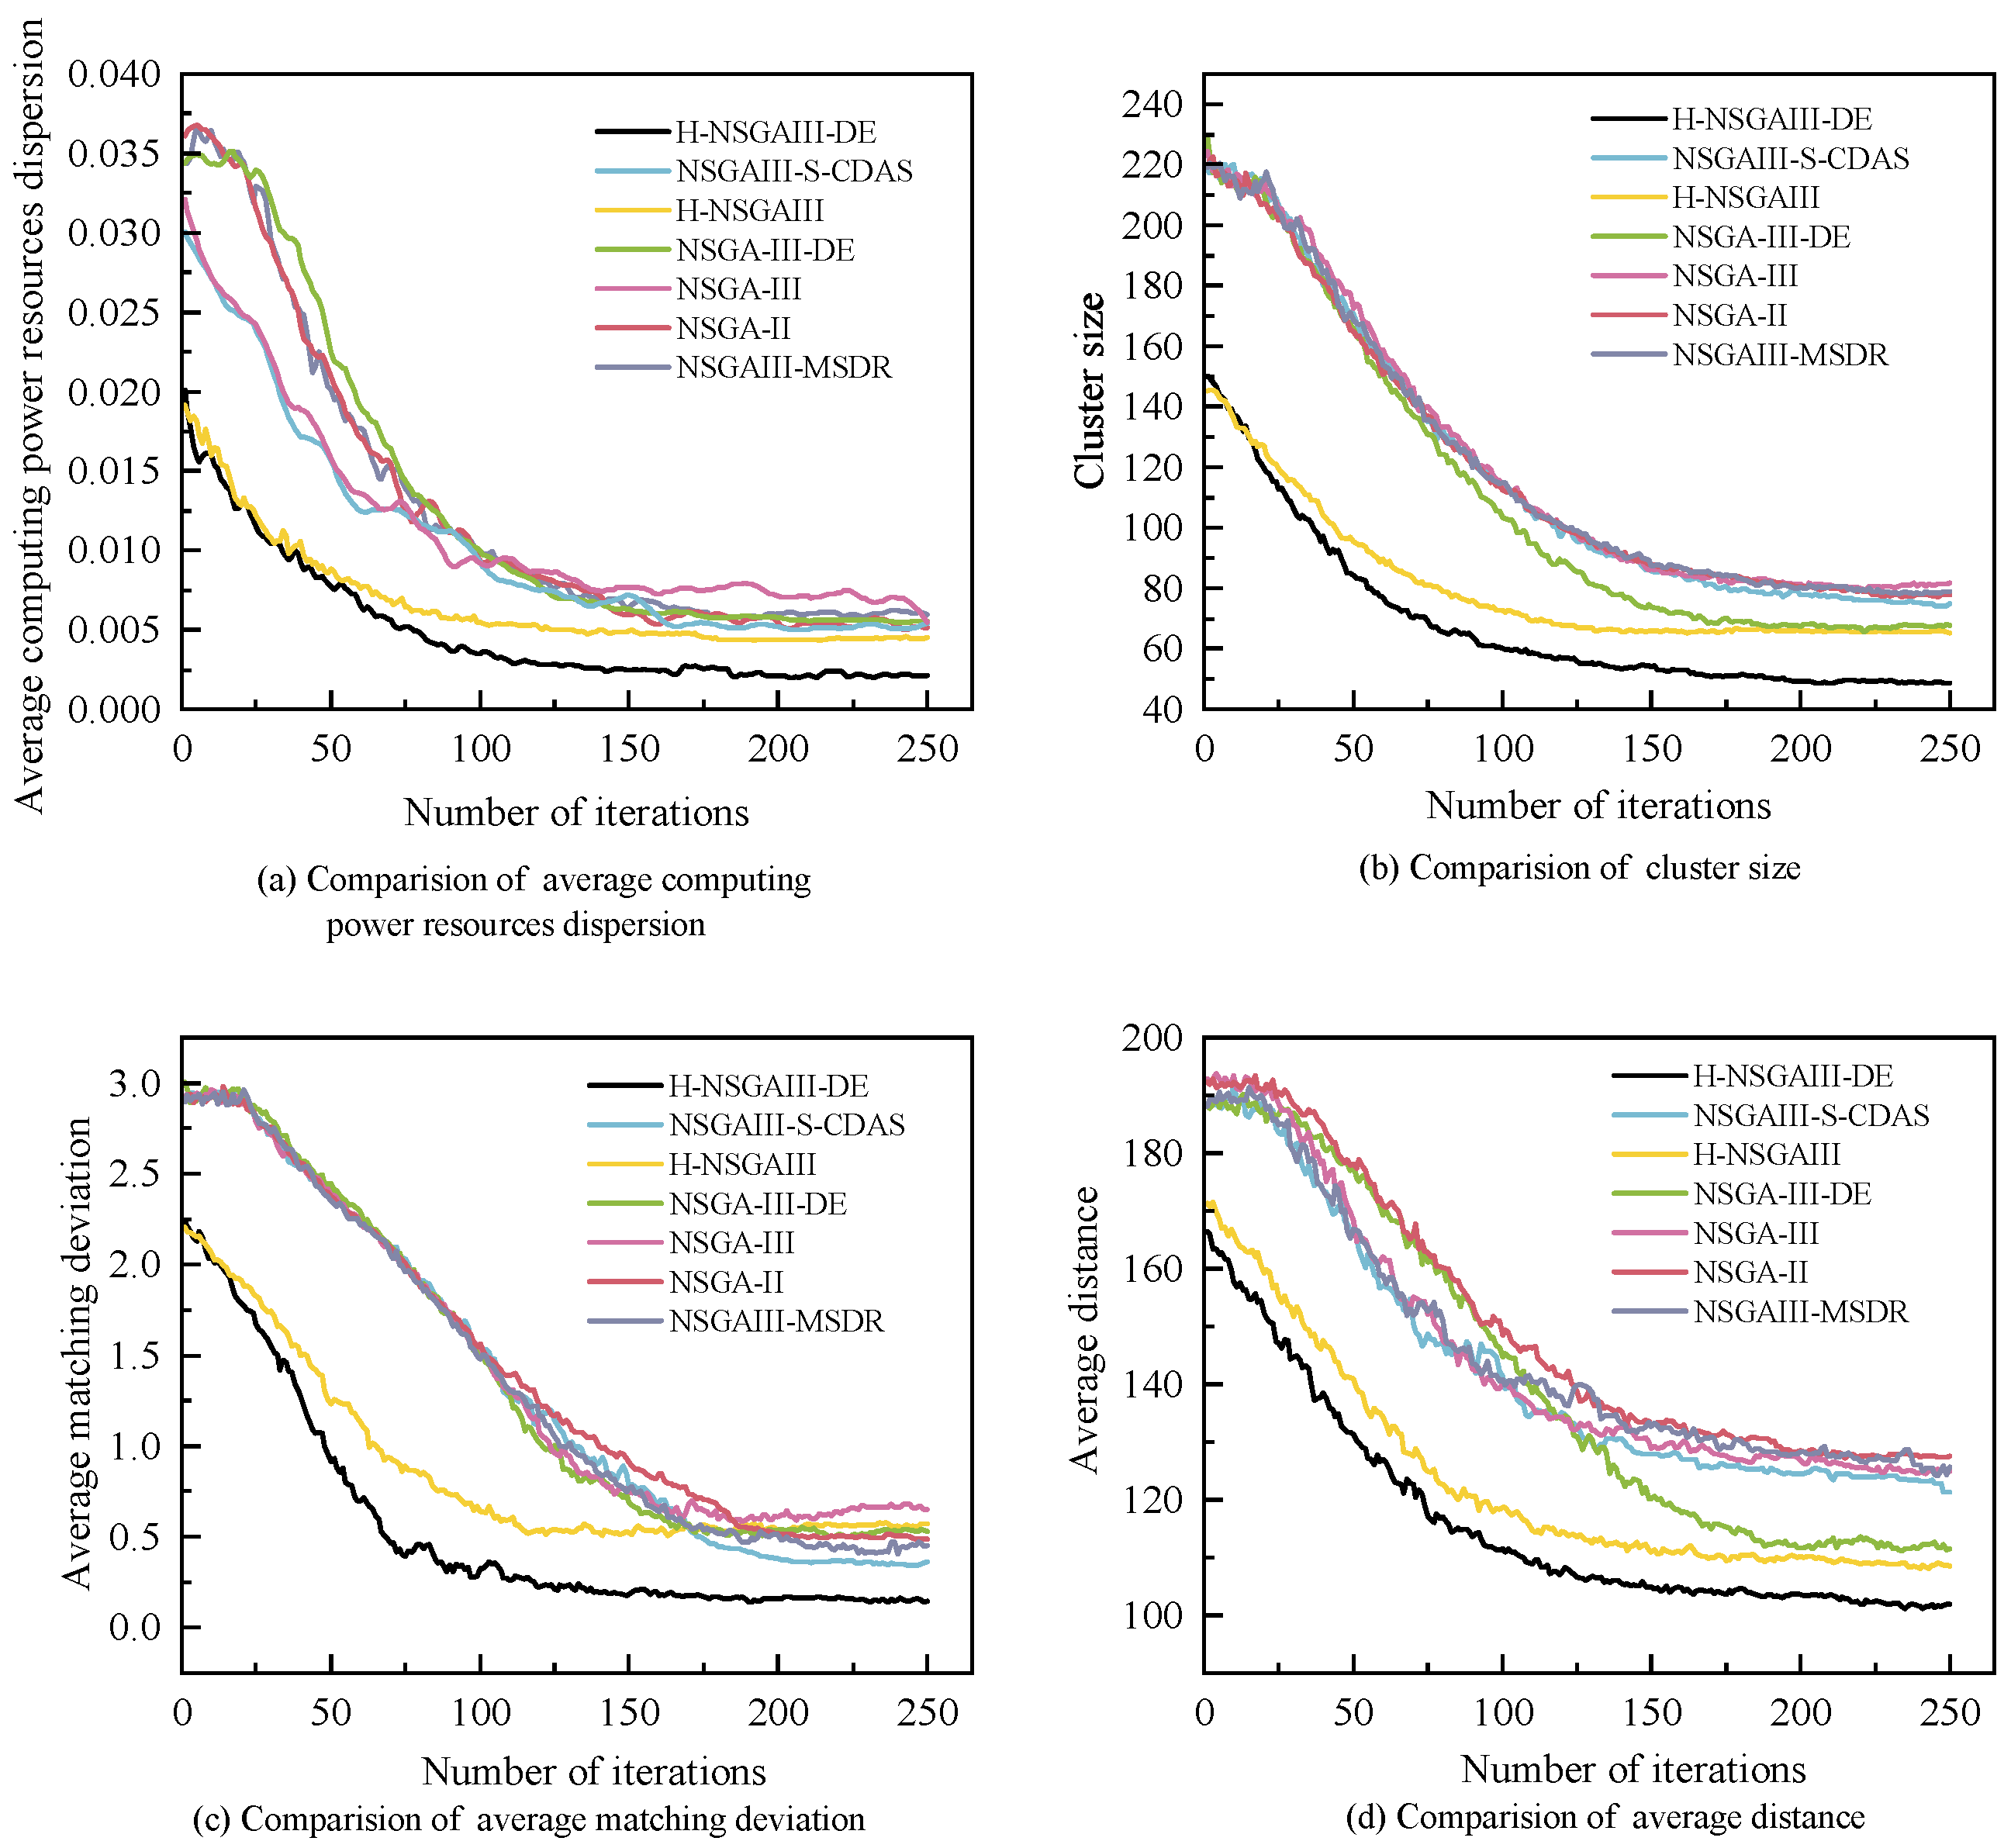
Figure 10 illustrates the relationship between the objective values and the number of iterations for all algorithms under the condition of and . The figure reveals that the convergence rates and objective values differ across algorithms.
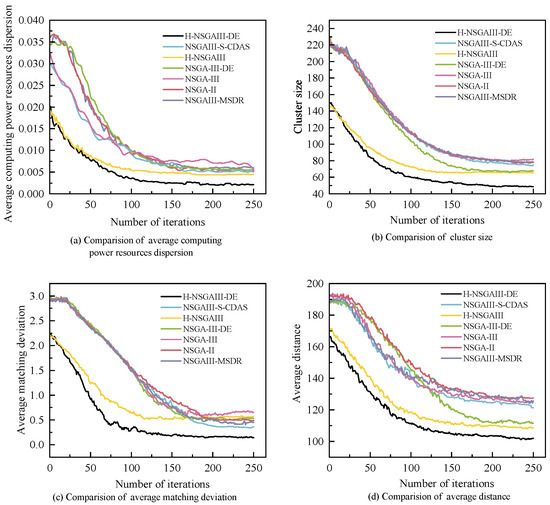
Figure 10.
Comparison of iteration curves for different objective values.
The objective values decrease as the number of iterations increases. However, H-NSGAIII-DE consistently converges more rapidly to the optimal solution. Concurrently, H-NSGAIII-DE exhibits a significantly lower initial objective value compared to other comparative algorithms. This stems from its HSAGI strategy, which selects a greater number of high-quality individuals meeting the constraints from the candidate solutions to form the initial population. Consequently, it demonstrates superior objective performance from the outset. In contrast, algorithms employing random initial population generation often produce numerous unconstrained individuals during randomization.
These unconstrained individuals lower the overall objective value of the initial population, resulting in comparatively higher initial objective values for these algorithms. Furthermore, H-NSGAIII-DE employs differential mutation to perform mutation operations on individuals. Compared to the bit mutation of the original algorithm, this generates higher-quality new solutions. These solutions can more rapidly guide the proposed algorithm towards the optimal solution region, thereby accelerating convergence speed. Results demonstrate that the improved algorithm proposed in this paper, which incorporates the HSAGI initialization strategy and the differential mutation mechanism, exhibits significant advantages in enhancing both algorithm convergence speed and the quality of initial solutions.
6.5. Performance of the Algorithm
6.5.1. Objective Performance
To further compare the performance improvements of the algorithm, two traditional algorithms, PSO and ABC, were added for comparison. Under the condition of a node scale of 300 and cluster numbers (k) set to 1, 2, and 3, respectively, the optimization results of each algorithm were recorded and analyzed in detail. Specific performance metrics are presented in Table 4. In the table, the letters A, B, C, and D correspond to the four core objective functions defined in this paper: A represents the average matching deviation, B represents the average computing power resources dispersion, C denotes the cluster size, and D signifies the average distance. For clear identification of the optimal results, the best values for each metric across different algorithms are highlighted in bold.

Table 4.
Objective functions performance (The bolded values indicate the best performance).
Analysis of the data in Table 4 reveals that the proposed H-NSGAIII-DE algorithm demonstrates significant advantages across all four evaluation metrics. Specifically, across multiple statistical dimensions—including the best, worst, and mean values, as well as the standard deviation—the proposed algorithm consistently outperforms all other compared algorithms. When k = 1 and 2, the improvement of H-NSGA-II-DE over the optimal baseline algorithm is not significant, whereas when k = 3, the proposed algorithm demonstrates superior performance across all objectives. Regarding the core metric of average matching deviation (A), H-NSGAIII-DE achieves an average improvement of compared to the second-best baseline algorithm. For the average computing resource dispersion (B), which measures resource balance, the average improvement is . In terms of optimizing cluster size (C), an improvement of is observed. Additionally, an performance gain is achieved in the average distance (D) metric, which relates to communication efficiency.
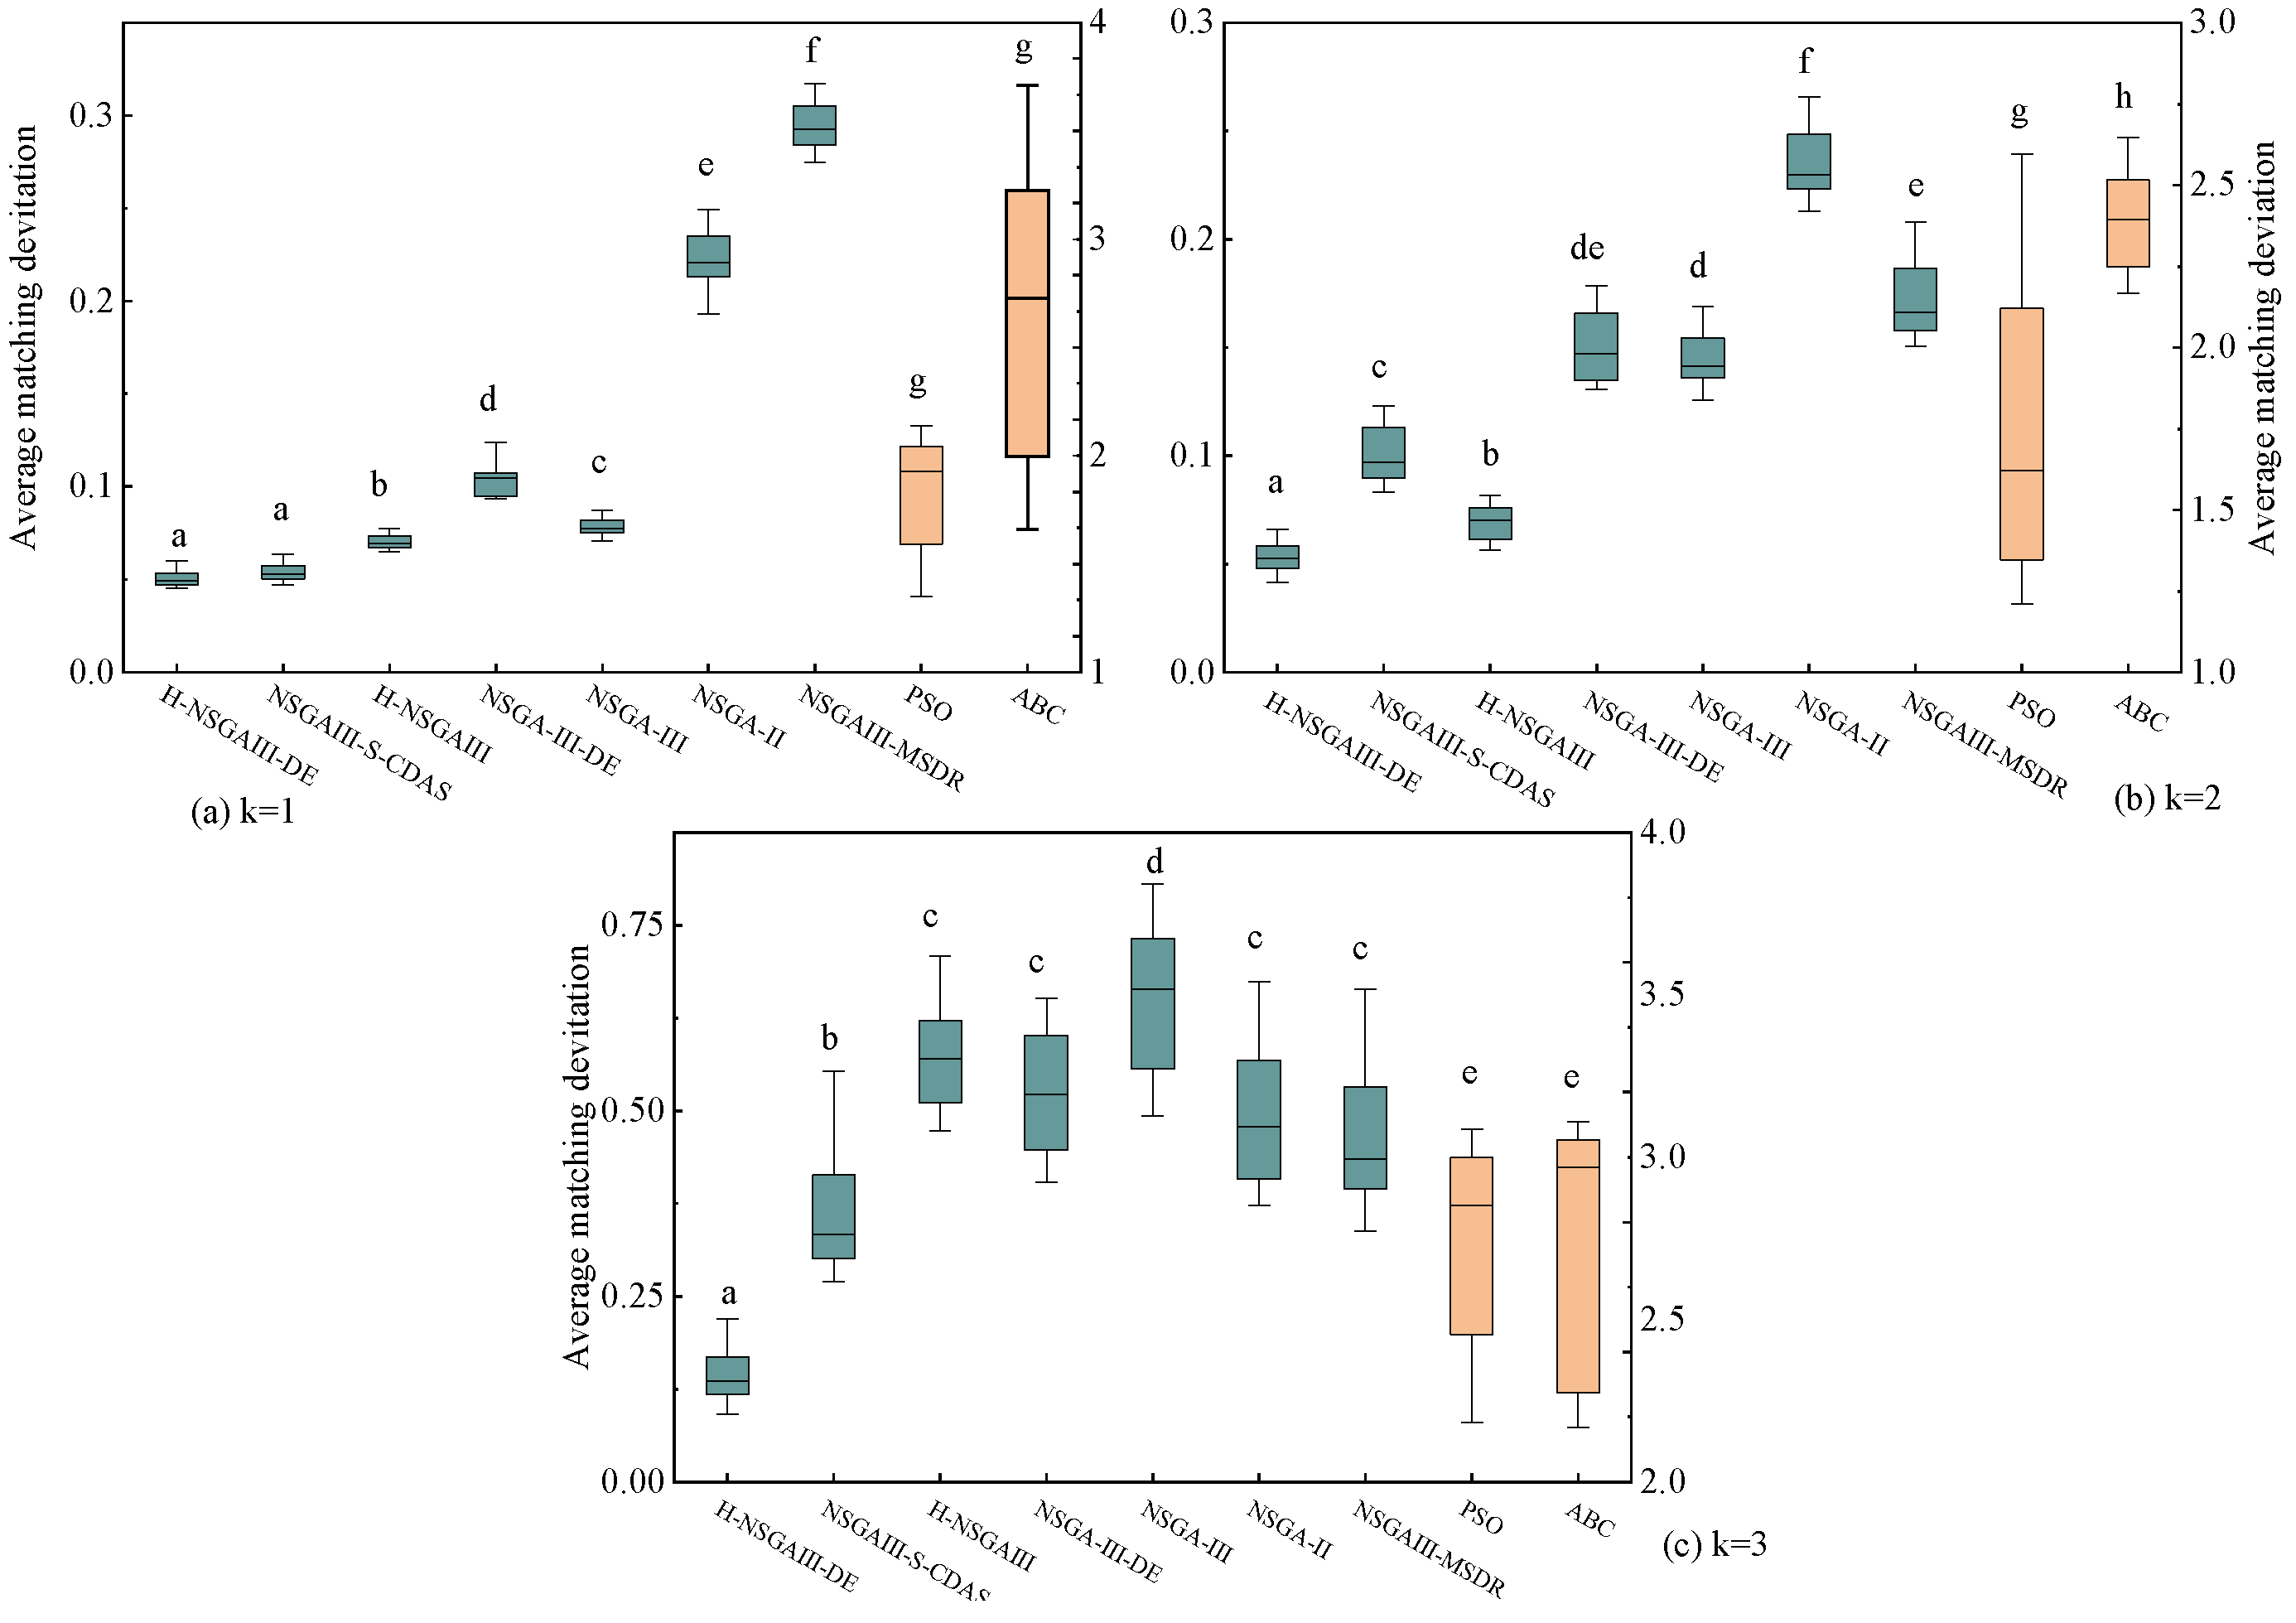
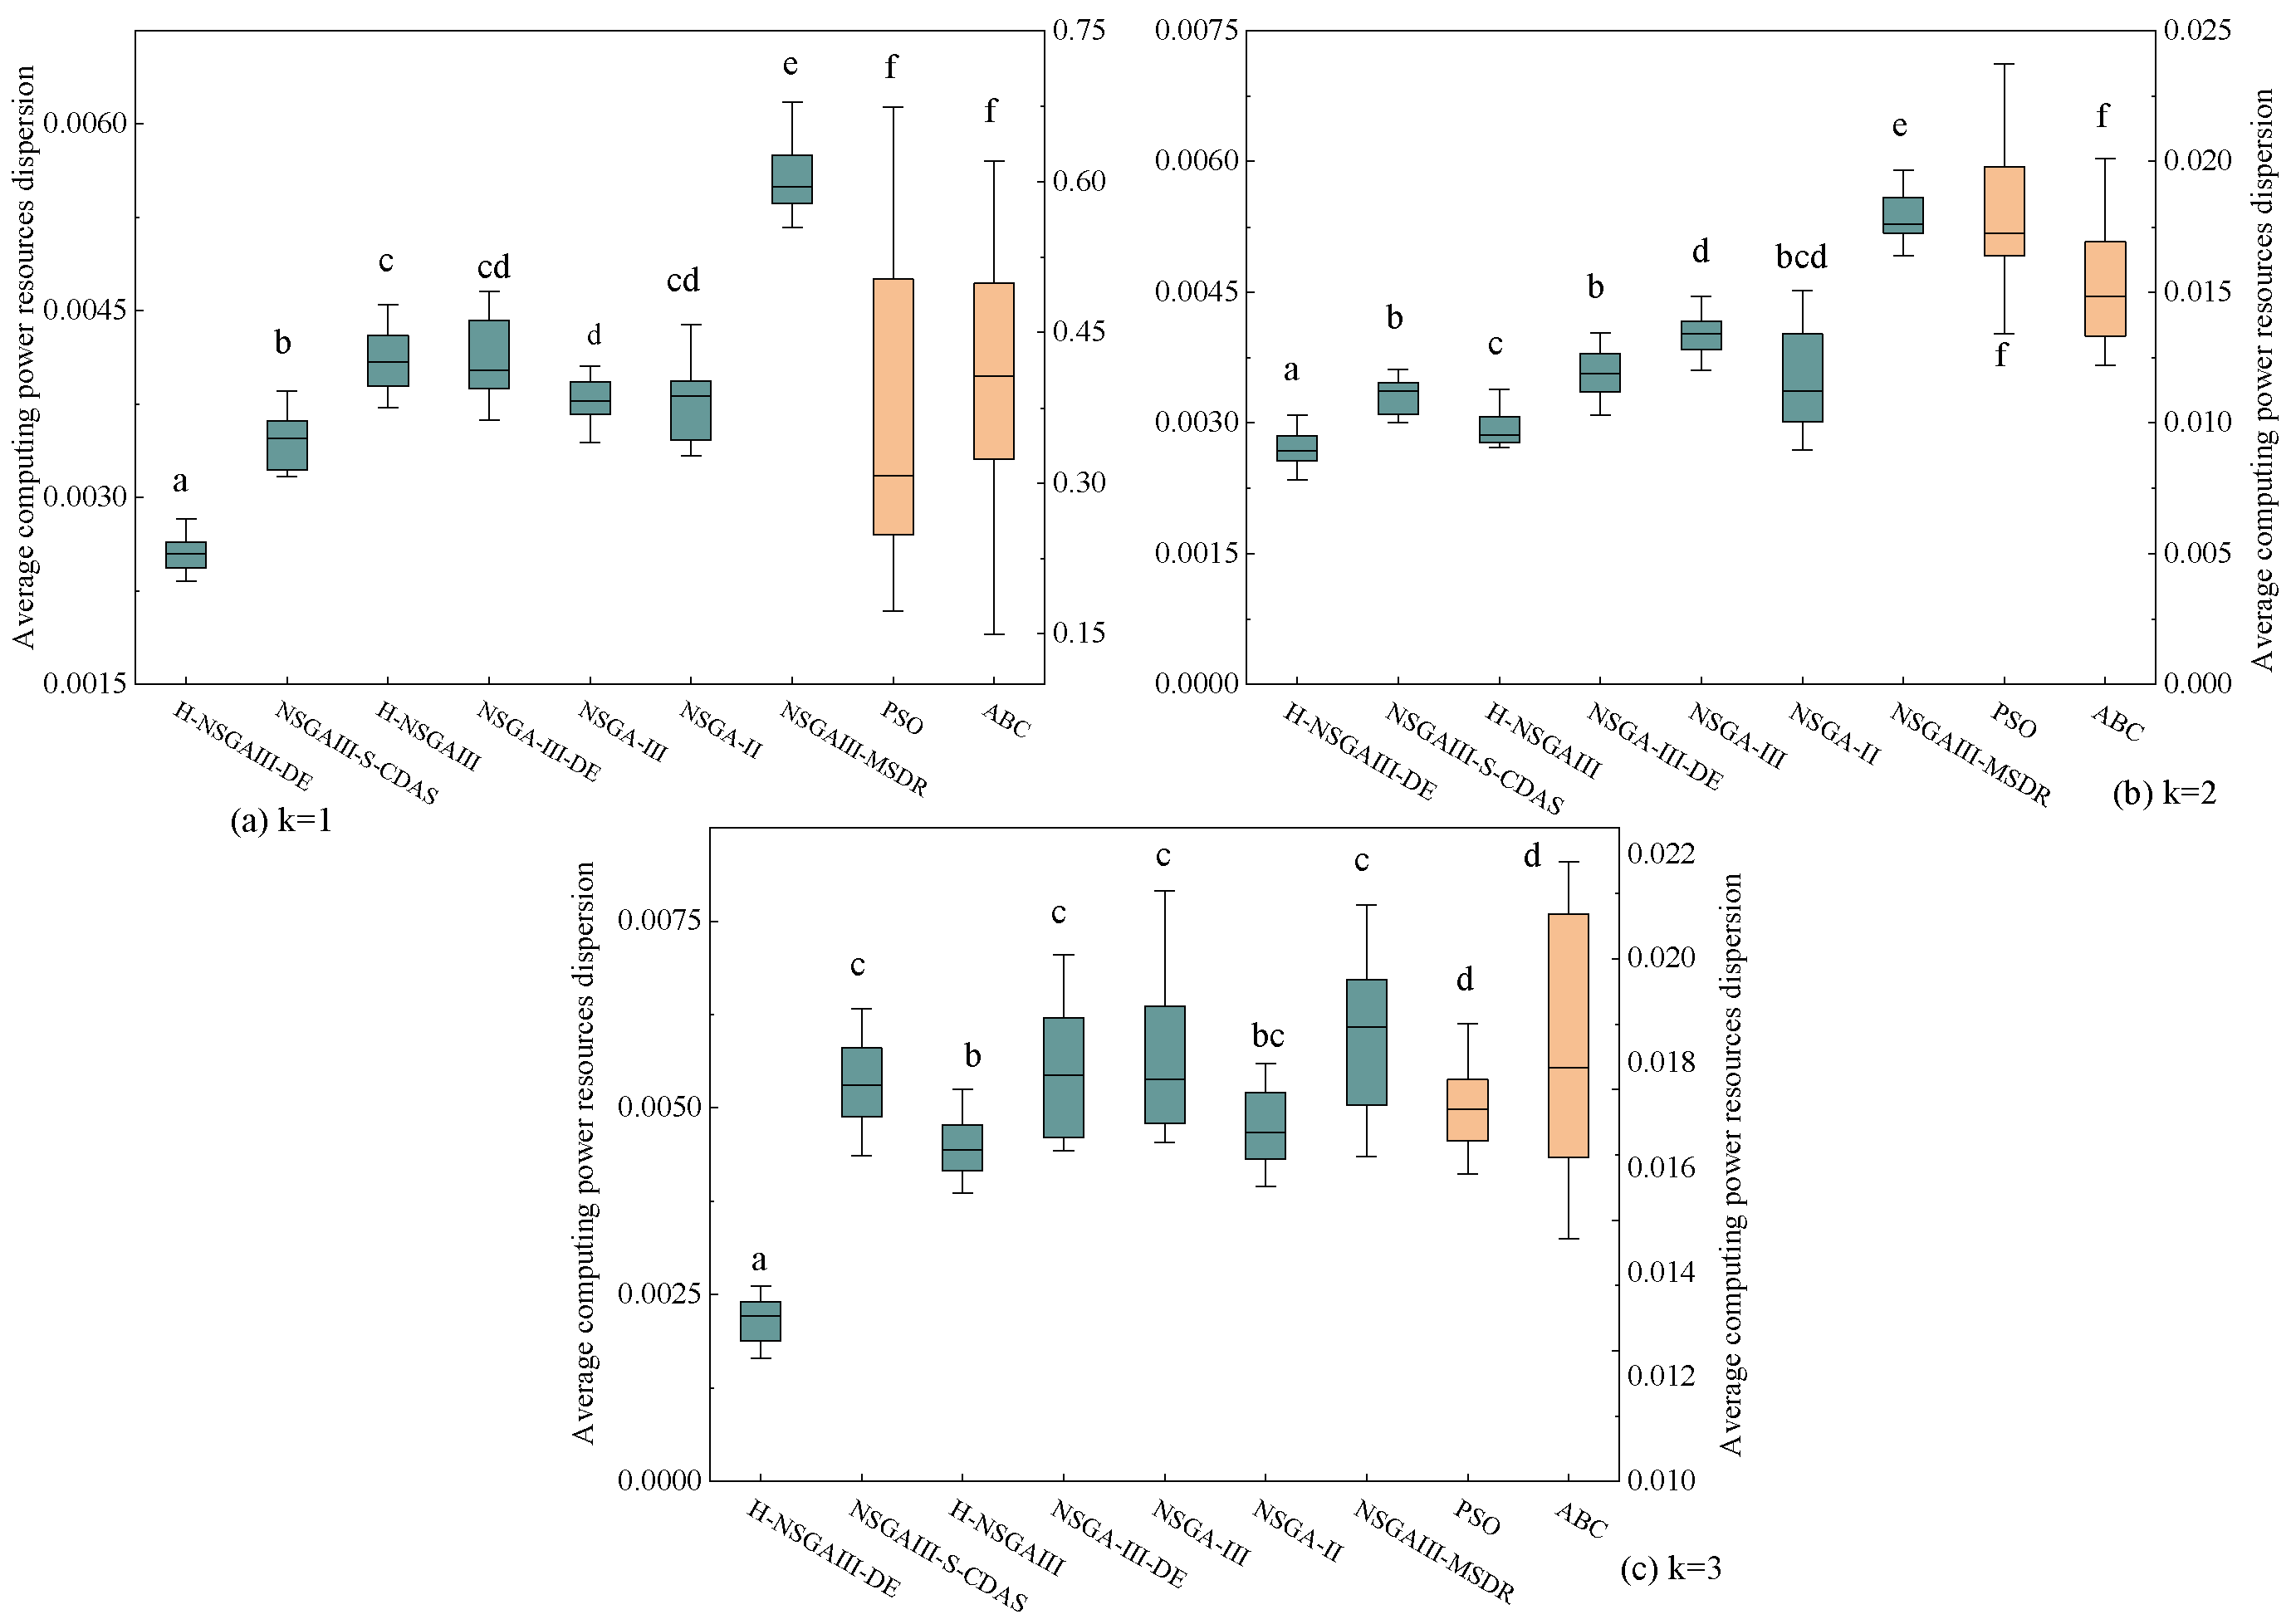
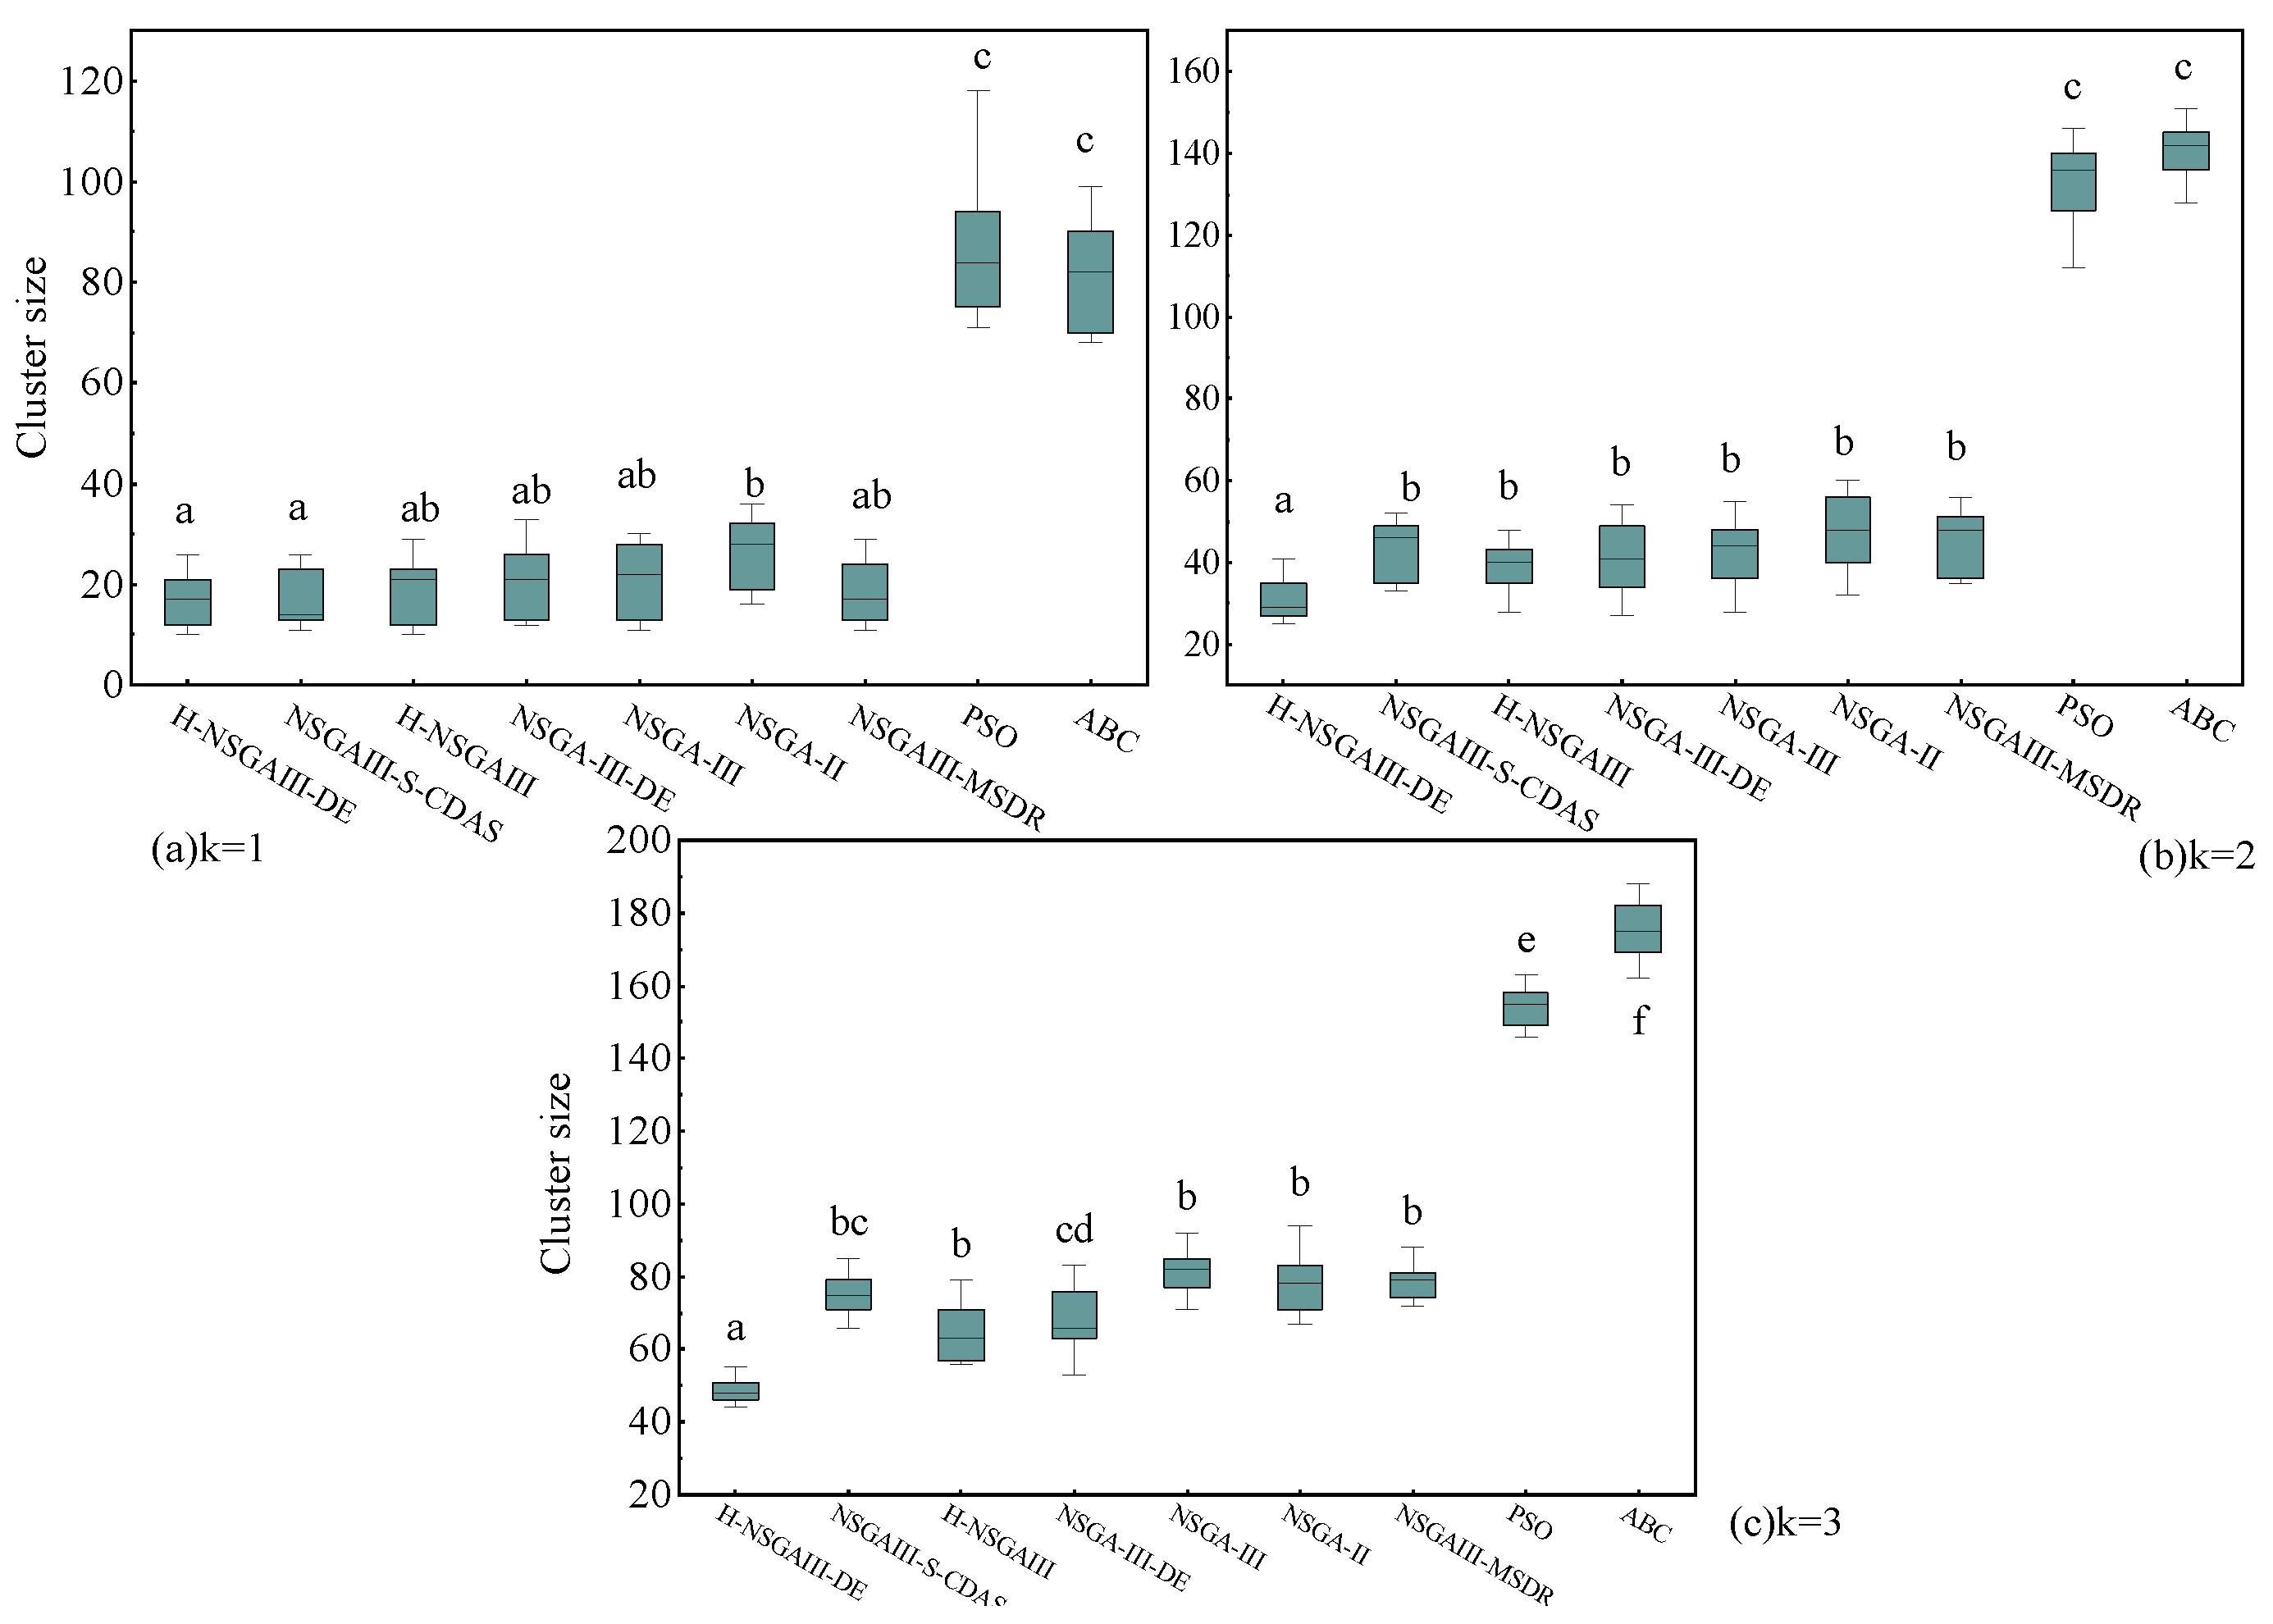
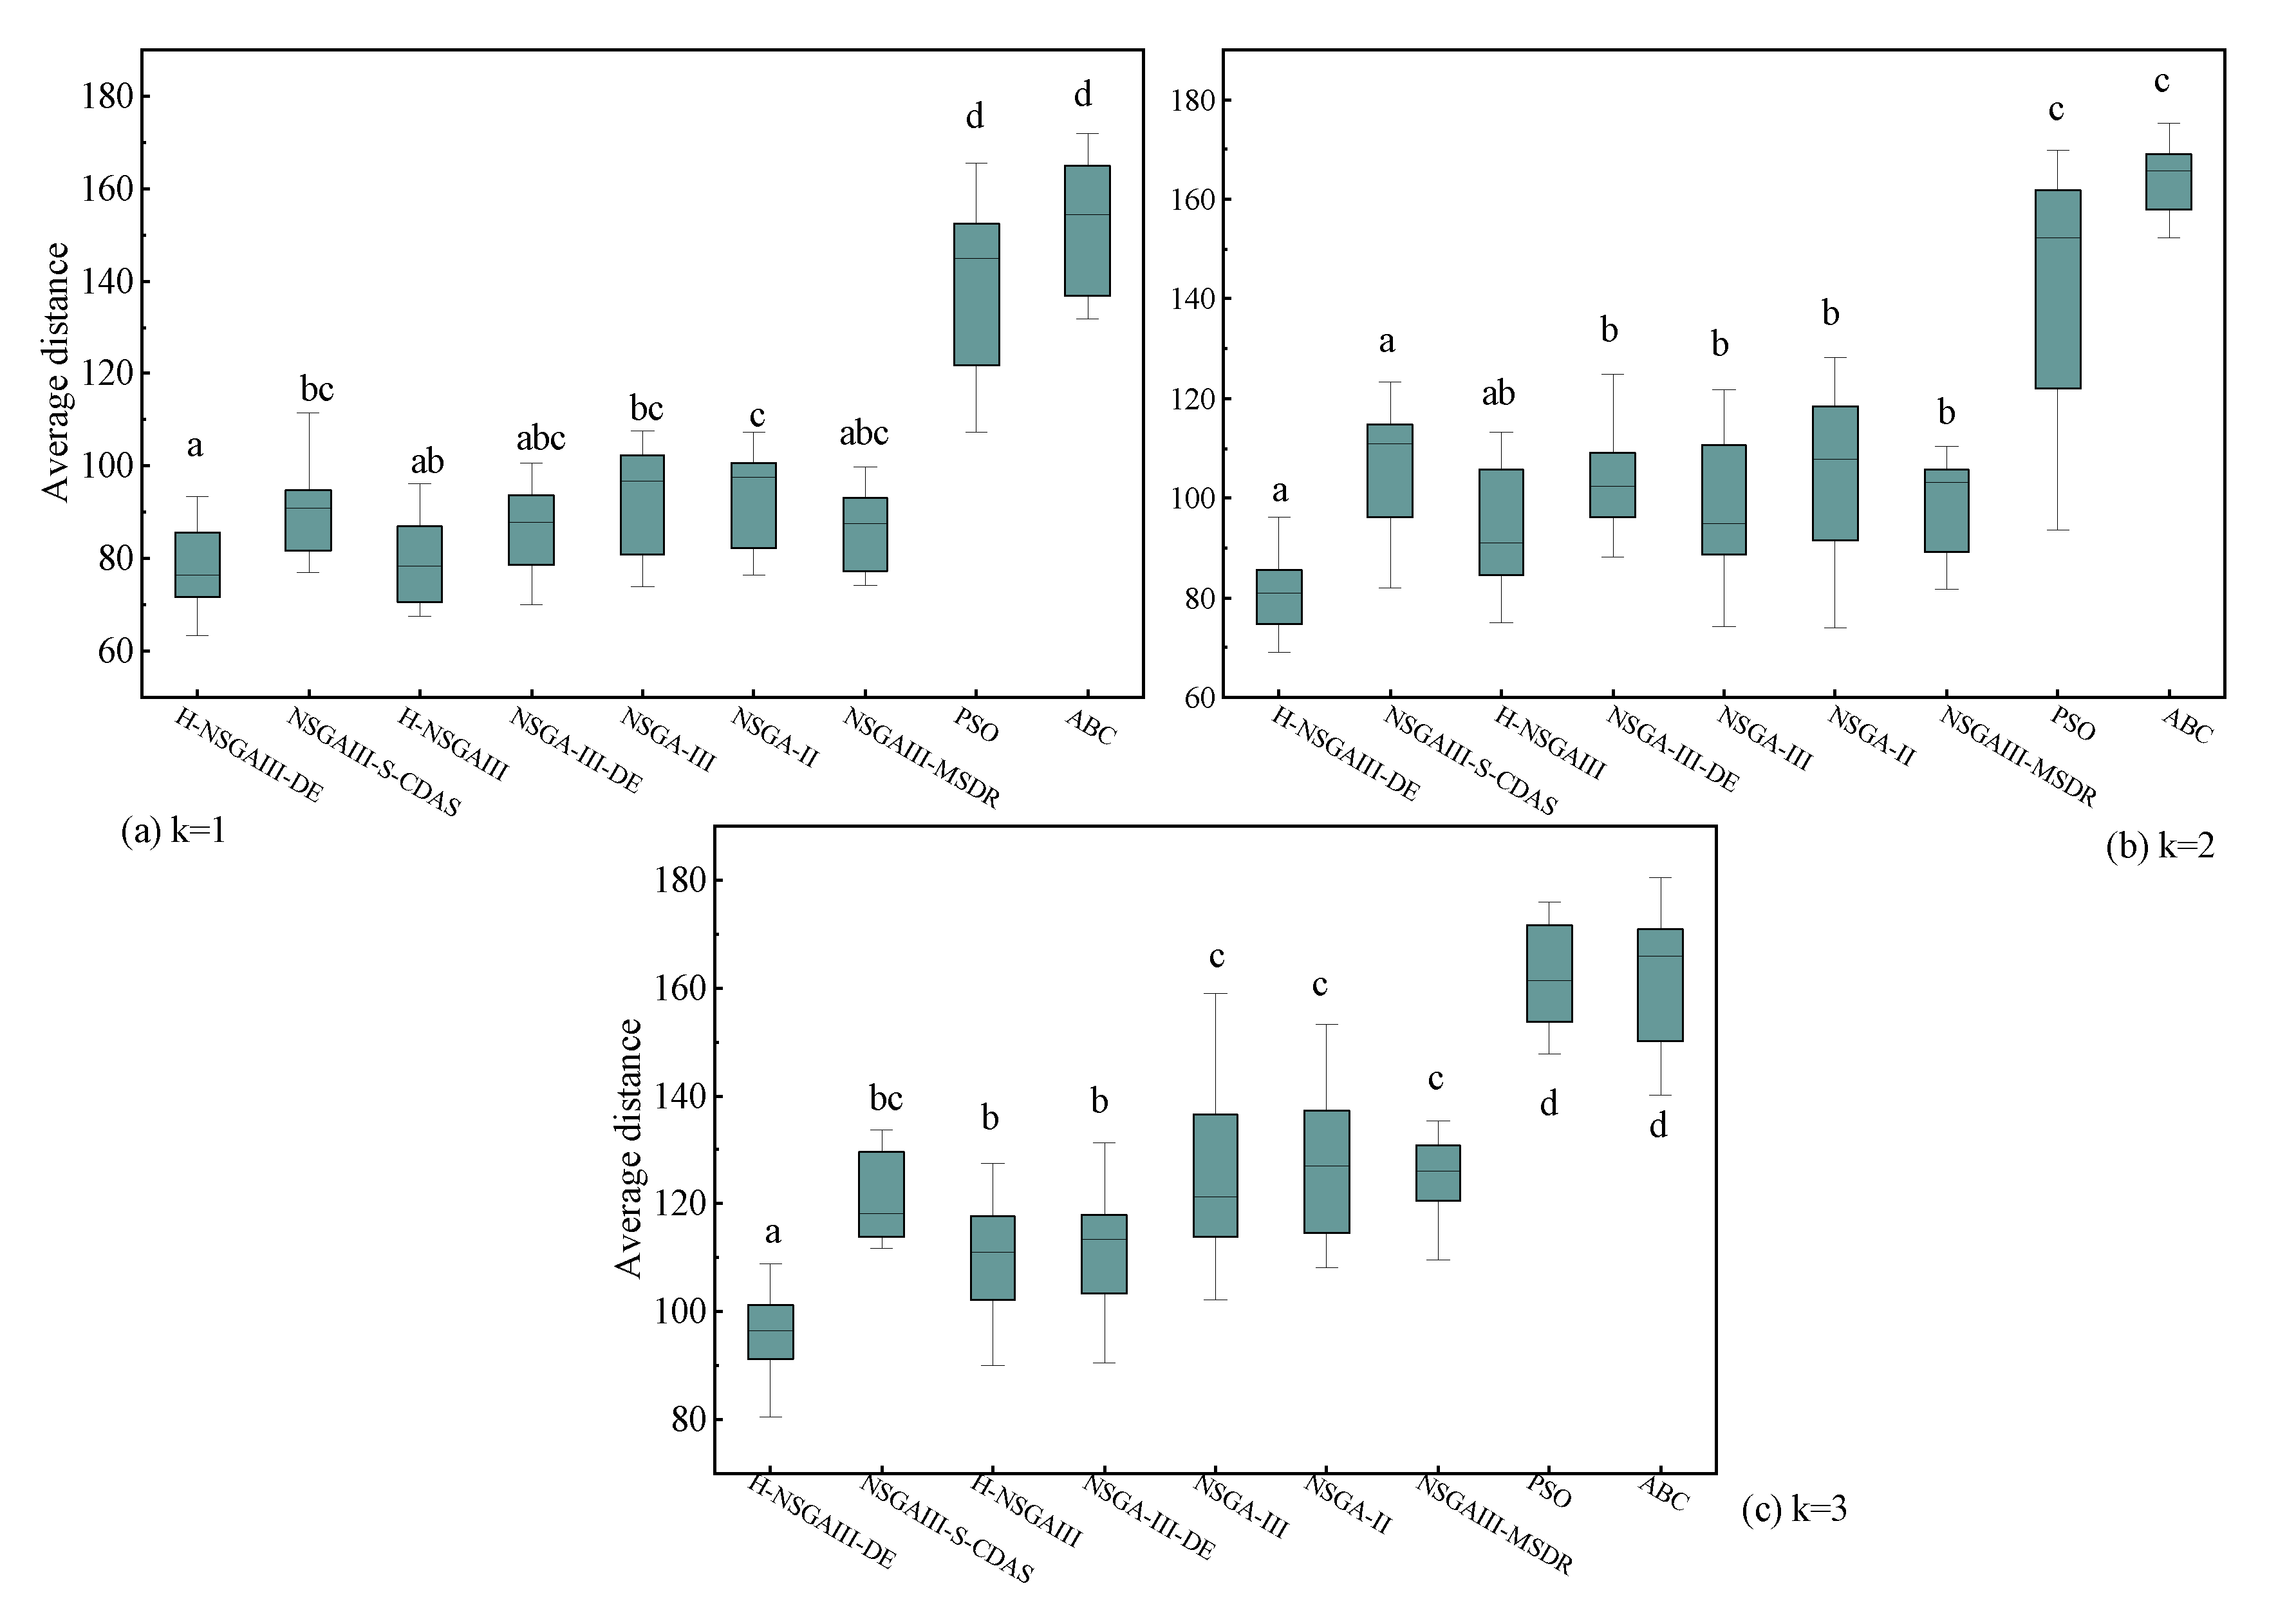
To further investigate the statistical significance of the observed performance differences, this study conducted 15 independent repeated experiments for each algorithm under the fixed condition of 300 nodes. Based on the experimental results, box plots (Figure 11, Figure 12, Figure 13 and Figure 14) are generated and supplemented with Welch’s ANOVA for statistical testing. Considering the substantial differences in the numerical ranges of the metrics across algorithms, a dual-Y-axis design was adopted in the box plots for average matching deviation (A) and average computing power resources dispersion (B) to enhance visualization and readability. Data for the PSO and ABC algorithms correspond to the right-hand axis. Letters above the box for each algorithm indicate significant grouping results. According to statistical convention, algorithms marked with the same letter do not exhibit statistically significant differences (p > 0.05), while those marked with different letters indicate statistically significant differences (p < 0.05). If a box is marked with two letters (e.g., “bc”), it indicates that the algorithm’s performance shows no significant difference from the groups marked with “b” or “c.”
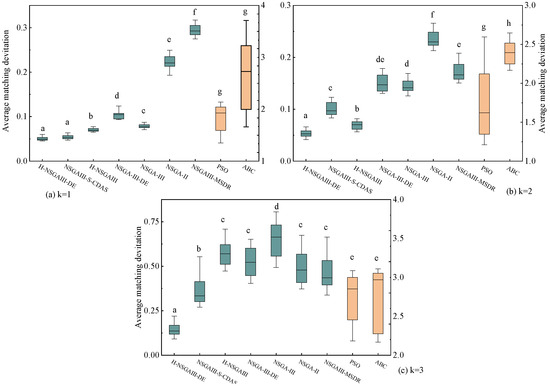
Figure 11.
Box plot of average matching deviation (Different letters indicate statistically significant differences between the two algorithm groups, while the same letter indicates no significant difference. If a group is assigned multiple letters from other groups, it signifies no significant difference with those respective groups. A unique letter for a group indicates a statistically significant difference from all other compared algorithms).
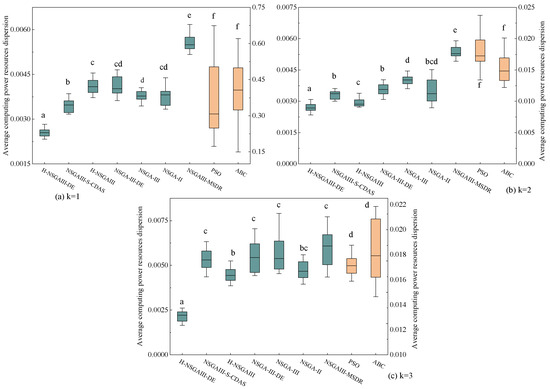
Figure 12.
Box plot of average computing power resources dispersion (Different letters indicate statistically significant differences between the two algorithm groups, while the same letter indicates no significant difference. If a group is assigned multiple letters from other groups, it signifies no significant difference with those respective groups. A unique letter for a group indicates a statistically significant difference from all other compared algorithms).
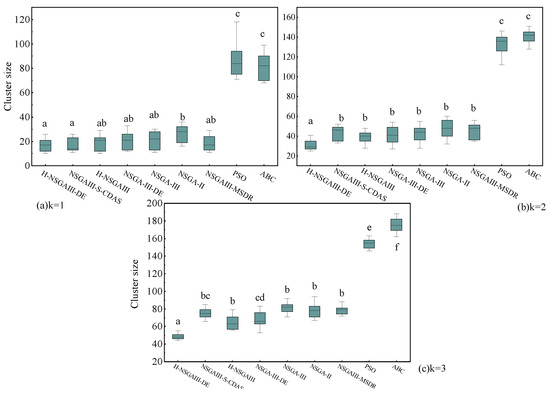
Figure 13.
Box plot of cluster size (Different letters indicate statistically significant differences between the two algorithm groups, while the same letter indicates no significant difference. If a group is assigned multiple letters from other groups, it signifies no significant difference with those respective groups. A unique letter for a group indicates a statistically significant difference from all other compared algorithms).
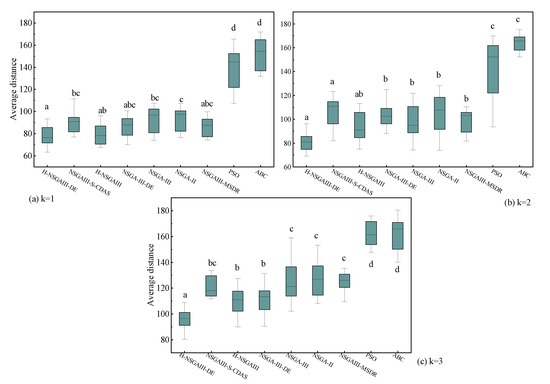
Figure 14.
Box plot of average distance (Different letters indicate statistically significant differences between the two algorithm groups, while the same letter indicates no significant difference. If a group is assigned multiple letters from other groups, it signifies no significant difference with those respective groups. A unique letter for a group indicates a statistically significant difference from all other compared algorithms).
The statistical results presented in Figure 11, Figure 12, Figure 13 and Figure 14 lead to the following conclusions: Under the specific scenario of cluster number k = 1, the improved algorithm proposed in this paper shows no statistically significant difference in the average distance (D) and average matching deviation (A) metrics compared to the current best baseline algorithm, NSGAIII-S-CDAS. However, in all other tested scenarios and metrics, the performance of the H-NSGAIII-DE algorithm consistently and stably exhibits statistically significant differences compared to the other algorithms. It is particularly noteworthy that when the cluster number increases to k = 3, the proposed algorithm demonstrates the most pronounced significant differences and the most outstanding performance advantages across all objective functions compared to the other algorithms. This series of statistical test results robustly confirms that the proposed algorithmic improvements not only yield observable performance enhancements but are also grounded in solid statistical significance, thereby validating the effectiveness and superiority of the H-NSGAIII-DE algorithm in solving this category of optimization problems.
6.5.2. Scalability Analysis
The computational complexity of the proposed H-NSGAIII-DE algorithm is characterized as follows: the HSAGI initialization phase, which employs simulated annealing, exhibits O() complexity, where M denotes the number of iterations and N represents the node count. Meanwhile, the NSGA-III selection mechanism requires O() operations for non-dominated sorting, with M indicating the number of objective functions. In contrast, the genetic operations (crossover and mutation) maintain a lower O(N) complexity.
As the system scales from 300 to several thousand nodes, the primary computational bottleneck emerges from the O() complexity components, particularly during non-dominated sorting and simulated annealing initialization. Although experimental validation in this study was conducted at a scale of 300 nodes, complexity analysis indicates that H-NSGAIII-DE possesses inherent scalability potential for large-scale IoT deployments.
To address scalability challenges in future implementations, several strategic directions may be pursued: developing hierarchical processing architectures to mitigate computational complexity, adopting distributed computing paradigms to enhance processing efficiency, and implementing approximate computation methods to balance accuracy with performance requirements. Additionally, edge computing frameworks coupled with dynamic update mechanisms present promising approaches for managing increasing node scales effectively. These identified pathways provide a structured foundation for subsequent research efforts aimed at algorithmic optimization in ultra-large-scale scenarios.
7. Conclusions and Future Work
This study has systematically investigated the dynamic cluster matching problem for subtasks under heterogeneous computing power resource demands within a “cloud–edge–end” collaborative architecture. To address the differentiated computing resource requirements of subtasks in practical edge computing scenarios, we proposed a method for constructing specialized execution clusters based on specific computing power needs, utilizing an improved NSGA-III algorithm to form terminal clusters. Through comprehensive comparative experiments, the effectiveness and advantages of the proposed algorithm have been conclusively verified. The proposed method demonstrates significant performance improvements across all optimization objectives, achieving an 18.07% reduction in task–resource matching deviation, a 7.82% decrease in computing resource heterogeneity within clusters, a 15.25% reduction in cluster size, and a 10% decrease in server–terminal communication overhead. These quantitative results confirm the method’s effectiveness in substantially mitigating resource waste, minimizing node idleness, reducing communication costs, and alleviating uneven distribution of computing power. Consequently, our approach successfully constructs terminal clusters with optimized configurations for efficient task execution.
However, this research acknowledges several important limitations that warrant further investigation. First, the proposed clustering mechanism operates primarily in a pre-deployment phase based on static resource profiles, lacking adaptability to dynamic environmental changes. The absence of real-time considerations for network fluctuations, node mobility, and instantaneous load variations may lead to suboptimal performance in volatile edge environments. Second, while effective in initial cluster formation, the method lacks a fine-grained node selection mechanism for final task deployment, resulting in cluster redundancy and inefficient resource allocation. Most notably, the current model overlooks energy consumption metrics—a critical oversight given the battery-dependent nature of most edge devices, which may lead to premature node failures in practical deployments.
Building upon these findings, future research will focus on developing a comprehensive optimization framework that bridges coarse-grained clustering with fine-grained deployment. We plan to incorporate real-time parameters including dynamic network conditions, node transmission capabilities, load balancing metrics, and crucially, energy consumption profiles. This enhanced approach will establish a two-stage optimization process enabling cross-layer optimization from resource-aware clustering to energy-efficient deployment, ultimately enhancing task completion reliability and overall system sustainability in edge computing environments.
Author Contributions
Conceptualization, J.W. and J.L.; methodology, J.W. and J.L.; software, X.C. and L.Y.; validation, J.W. and J.L.; formal analysis, X.C. and C.L.; investigation, X.C. and C.L.; resources, J.W. and L.Y.; data curation, X.C. and C.L.; writing—original draft preparation, J.L.; writing—review and editing, J.W., L.Y. and J.L.; visualization, J.L. and X.C. All authors have read and agreed to the published version of the manuscript.
Funding
This research received no external funding.
Institutional Review Board Statement
Not applicable.
Informed Consent Statement
Not applicable.
Data Availability Statement
The original contributions presented in this study are included in the article. Further inquiries can be directed to the corresponding author.
Conflicts of Interest
The authors declare no conflicts of interest.
Appendix A
Under this evaluation model, assuming that there are N terminal nodes to be measured and M evaluation indicators, the indicators are listed in Table 1.
The indicators of the nodes are normalized to eliminate the differences in scale between different dimensions. The normalized raw nodes resource matrix is established as shown in Equation (A1).
denotes the normalized data for the indicator j for terminal node i. Calculate the weight of node i on the indicator j by using Equation (A2). Calculate the entropy value of the indicator j using Equation (A3).
Finally, the corresponding weights of the nodes in each dimension are weighted and summed to obtain the comprehensive computing power of the terminal nodes as in Equation (A5).
References
- Piran, M.J.; Suh, D.Y. Learning-driven wireless communications, towards 6G. In Proceedings of the 2019 International Conference on Computing, Electronics & Communications Engineering (iCCECE), London, UK, 22–23 August 2019; pp. 219–224. [Google Scholar] [CrossRef]
- Kar, B.; Yahya, W.; Lin, Y.D.; Ali, A. Offloading using traditional optimization and machine learning in federated cloud-edge-fog systems: A survey. IEEE Commun. Surv. Tutor. 2023, 25, 1199–1226. [Google Scholar] [CrossRef]
- Sun, L.; Jiang, X.; Ren, H.; Guo, Y. Edge-cloud computing and artificial intelligence in internet of medical things: Architecture, technology and application. IEEE Access 2020, 8, 101079–101092. [Google Scholar] [CrossRef]
- Shi, W.; Cao, J.; Zhang, Q.; Li, Y.; Xu, L. Edge Computing: Vision and Challenges. IEEE Internet Things J. 2016, 3, 637–646. [Google Scholar] [CrossRef]
- Radouane, B.; Lyamine, G.; Ahmed, K.; Kamel, B. Scalable mobile computing: From cloud computing to mobile edge computing. In Proceedings of the 2022 5th International Conference on Networking, Information Systems and Security: Envisage Intelligent Systems in 5G//6G-based Interconnected Digital Worlds (NISS), Bandung, Indonesia, 30–31 March 2022; pp. 1–6. [Google Scholar] [CrossRef]
- Karami, A.; Karami, M. Edge computing in big data: Challenges and benefits. Int. J. Data Sci. Anal. 2025, 20, 6183–6226. [Google Scholar] [CrossRef]
- Li, T.; He, X.; Jiang, S.; Liu, J. A survey of privacy-preserving offloading methods in mobile-edge computing. J. Netw. Comput. Appl. 2022, 203, 103395. [Google Scholar] [CrossRef]
- Wen, J.; Yang, J.; Wang, T.; Li, Y.; Lv, Z. Energy-efficient task allocation for reliable parallel computation of cluster-based wireless sensor network in edge computing. Digit. Commun. Netw. 2023, 9, 473–482. [Google Scholar] [CrossRef]
- Gadasin, D.; Shvedov, A.; Koltsova, A. Cluster model for edge computing. In Proceedings of the 2020 International Conference on Engineering Management of Communication and Technology (EMCTECH), Vienna, Austria, 20–22 October 2020; pp. 1–4. [Google Scholar] [CrossRef]
- Yang, Z.; Yang, R.; Yu, F.R.; Li, M.; Zhang, Y.; Teng, Y. Sharded blockchain for collaborative computing in the Internet of Things: Combined of dynamic clustering and deep reinforcement learning approach. IEEE Internet Things J. 2022, 9, 16494–16509. [Google Scholar] [CrossRef]
- Bute, M.S.; Fan, P.; Liu, G.; Abbas, F.; Ding, Z. A cluster-based cooperative computation offloading scheme for C-V2X networks. Ad Hoc Netw. 2022, 132, 102862. [Google Scholar] [CrossRef]
- Cao, X.; Chen, C.; Li, S.; Lv, C.; Li, J.; Wang, J. Research on computing task scheduling method for distributed heterogeneous parallel systems. Sci. Rep. 2025, 15, 8937. [Google Scholar] [CrossRef]
- Xiao, A.; Lu, Z.; Du, X.; Wu, J.; Hung, P.C. ORHRC: Optimized recommendations of heterogeneous resource configurations in cloud-fog orchestrated computing environments. In Proceedings of the 2020 IEEE International Conference on Web Services (ICWS), Beijing, China, 19–23 October 2020; pp. 404–412. [Google Scholar] [CrossRef]
- Lian, Z.; Shu, J.; Zhang, Y.; Sun, J. Convergent grey wolf optimizer metaheuristics for scheduling crowdsourcing applications in mobile edge computing. IEEE Internet Things J. 2023, 11, 1866–1879. [Google Scholar] [CrossRef]
- Khaleel, M.I.; Safran, M.; Alfarhood, S.; Gupta, D. Combinatorial metaheuristic methods to optimize the scheduling of scientific workflows in green DVFS-enabled edge-cloud computing. Alex. Eng. J. 2024, 86, 458–470. [Google Scholar] [CrossRef]
- Satouf, A.; Hamidoğlu, A.; Gül, Ö.M.; Kuusik, A.; Durak Ata, L.; Kadry, S. Metaheuristic-based task scheduling for latency-sensitive IoT applications in edge computing. Clust. Comput. 2025, 28, 143. [Google Scholar] [CrossRef]
- Hou, W.; Wen, H.; Zhang, N.; Wu, J.; Lei, W.; Zhao, R. Incentive-driven task allocation for collaborative edge computing in industrial internet of things. IEEE Internet Things J. 2022, 9, 706–718. [Google Scholar] [CrossRef]
- Nie, Y.; Jiang, W.; Ma, G.; He, Y.; Zhao, H.; Hu, Y.; Chen, Z. Virtual Power Plant Analysis Task Offloading Strategy Based on Delay and Task Requirements in Cloud Edge Collaboration System. In Proceedings of the 2024 IEEE 7th International Electrical and Energy Conference (CIEEC), Harbin, China, 10–12 May 2024; pp. 1–5. [Google Scholar] [CrossRef]
- Naouri, A.; Wu, H.; Nouri, N.A.; Dhelim, S.; Ning, H. A novel framework for mobile-edge computing by optimizing task offloading. IEEE Internet Things J. 2021, 8, 13065–13076. [Google Scholar] [CrossRef]
- Zeng, F.; Zhang, K.; Wu, L.; Wu, J. Efficient caching in vehicular edge computing based on edge-cloud collaboration. IEEE Trans. Veh. Technol. 2023, 72, 2468–2481. [Google Scholar] [CrossRef]
- Asensio, A.; Masip-Bruin, X.; Durán, R.J.; de Miguel, I.; Ren, G.; Daijavad, S.; Jukan, A. Designing an efficient clustering strategy for combined fog-to-cloud scenarios. Future Gener. Comput. Syst. 2020, 109, 392–406. [Google Scholar] [CrossRef]
- Chen, W.; Yang, Y.; Liu, S.; Hu, W. Optimizing resource allocation for cluster D2D-assisted fog computing networks: A three-layer Stackelberg game approach. Comput. Netw. 2024, 250, 110601. [Google Scholar] [CrossRef]
- Amer, I.M.; Sorour, S. Cost-based compute cluster formation in edge computing. In Proceedings of the ICC 2022—IEEE International Conference on Communications, Seoul, Republic of Korea, 16–20 May 2022; pp. 1611–1616. [Google Scholar] [CrossRef]
- Dankolo, N.M.; Radzi, N.H.M.; Mustaffa, N.H.; Arshad, N.I.; Nasser, M.; Gabi, D.; Yusuf, M.N. Optimizing resource allocation for IoT applications in the edge cloud continuum using hybrid metaheuristic algorithms. Sci. Rep. 2025, 15, 14409. [Google Scholar] [CrossRef]
- Predić, B.; Jovanovic, L.; Simic, V.; Bacanin, N.; Zivkovic, M.; Spalevic, P.; Budimirovic, N.; Dobrojevic, M. Cloud-load forecasting via decomposition-aided attention recurrent neural network tuned by modified particle swarm optimization. Complex Intell. Syst. 2024, 10, 2249–2269. [Google Scholar] [CrossRef]
- Sheeja, R.; Iqbal, M.M.; Sivasankar, C. Multi-objective-derived energy efficient routing in wireless sensor network using adaptive black hole-tuna swarm optimization strategy. Ad Hoc Netw. 2023, 144, 103140. [Google Scholar] [CrossRef]
- Younas, I.; Naeem, A. Optimization of sensor selection problem in IoT systems using opposition-based learning in many-objective evolutionary algorithms. Comput. Electr. Eng. 2022, 97, 107625. [Google Scholar] [CrossRef]
- Joseph, A.J.; Asaletha, R. Pareto multi-objective termite colony optimization based EDT clustering for wireless chemical sensor network. Wirel. Pers. Commun. 2023, 130, 2329–2343. [Google Scholar] [CrossRef]
- Jagadeesh, S.; Muthulakshmi, I. Dynamic clustering and routing using multi-objective particle swarm optimization with Levy distribution for wireless sensor networks. Int. J. Commun. Syst. 2021, 34. [Google Scholar] [CrossRef]
- Rahimi, I.; Gandomi, A.H.; Chen, F.; Mezura-Montes, E. A review on constraint handling techniques for population-based algorithms: From single-objective to multi-objective optimization. Arch. Comput. Methods Eng. 2023, 30, 2181–2209. [Google Scholar] [CrossRef]
- Deb, K.; Jain, H. An evolutionary many-objective optimization algorithm using reference-point-based nondominated sorting approach, part I: Solving problems with box constraints. IEEE Trans. Evol. Comput. 2014, 18, 577–601. [Google Scholar] [CrossRef]
- Deb, K.; Pratap, A.; Agarwal, S.; Meyarivan, T. A fast and elitist multiobjective genetic algorithm: NSGA-II. IEEE Trans. Evol. Comput. 2002, 6, 182–197. [Google Scholar] [CrossRef]
- Deb, K. An efficient constraint handling method for genetic algorithms. Comput. Methods Appl. Mech. Eng. 2000, 186, 311–338. [Google Scholar] [CrossRef]
- Guo, Y.; Zhu, X.; Deng, J.; Li, S.; Li, H. Multi-objective planning for voltage sag compensation of sparse distribution networks with unified power quality conditioner using improved NSGA-III optimization. Energy Rep. 2022, 8, 8–17. [Google Scholar] [CrossRef]
- Dutta, S.; M, S.S.R.; Mallipeddi, R.; Das, K.N.; Lee, D.G. A mating selection based on modified strengthened dominance relation for NSGA-III. Mathematics 2021, 9, 2837. [Google Scholar] [CrossRef]
Disclaimer/Publisher’s Note: The statements, opinions and data contained in all publications are solely those of the individual author(s) and contributor(s) and not of MDPI and/or the editor(s). MDPI and/or the editor(s) disclaim responsibility for any injury to people or property resulting from any ideas, methods, instructions or products referred to in the content. |
© 2025 by the authors. Licensee MDPI, Basel, Switzerland. This article is an open access article distributed under the terms and conditions of the Creative Commons Attribution (CC BY) license (https://creativecommons.org/licenses/by/4.0/).

