1. Introduction
As a common pavement distress, rutting is formed on asphalt pavements due to repeated traffic loads acting within the wheel path. Asphalt, being an elasto-viscoplastic material, is highly susceptible to compaction and viscoplastic permanent deformation under the influence of high temperatures and external forces, leading to the formation of rutting [
1]. Rutting can lead to a reduction in the asphalt layer thickness within the wheel path, compromising the overall strength of the surface layer and the pavement structure. The occurrence of rutting on pavement can have detrimental effects on road smoothness, driving comfort, and traffic safety [
2,
3]. Furthermore, it may lead to the development of additional pavement distress, such as cracks and potholes, further compromising the integrity and performance of the pavement structure. Therefore, the accurate detection of rutting and comprehensive representation of three-dimensional (3D) attributes bear immense importance in accurately evaluating the extent of rutting development, facilitating road maintenance, and reasonably estimating the required maintenance volume.
Traditionally, rutting has been characterized using cross-sectional geometric indicators, such as maximum rut depth or rut area, which are typically measured at specific transverse intervals along the road. This method assumes that rutting is uniformly distributed within a profile, and has led to the development of various detection systems based on profile scanning. For instance, Arezoumand et al. [
4] proposed a low-cost system utilizing high-speed imaging and laser projection to extract rut boundaries and compute rut depth through clustering. Rutting depth within the range of 0.5–5.5 cm can be detected. Hong et al. [
5] used a laser line image and calculated the depth via convexity analysis. Shatnawi et al. [
6] adopted a mobile laser scanning (MLS) system to obtain rutting profiles and measure deformation depths. Ciências et al. [
7] utilized a point cloud acquired by a mobile lidar system and proposed four point-cloud aggregation methods for reconstructing the road cross-section. While these approaches are cost-effective and widely used in highway agencies, they fail to fully characterize the spatial extent and volume of rutting beyond the sampled cross-sections.
In reality, rutting is not merely a depth-oriented deformation. It is a 3D, spatially distributed phenomenon that can vary significantly in shape, extent, and severity across the full width of a lane or pavement section [
2,
8,
9]. Localized measurements based on profile slices may overlook significant features between sampling points, especially in urban roads, intersections, or curved segments where wheel paths are not strictly aligned. Recent studies have emphasized that accurate rutting evaluation requires capturing both the depth and surface characteristics of the entire pavement section [
10,
11]. This approach enables a more comprehensive understanding of rutting volume, direction, and progression. Consequently, there is a growing consensus in the pavement engineering community to shift from profile-based to full-lane, full-section (the entire transverse pavement lane width, rather than a single wheel-path track) rutting evaluation.
To support this shift, various 3D sensing technologies have been explored. LiDAR and mobile laser scanning (MLS) systems have been widely deployed to capture 3D road surface geometry. Liu et al. [
2] used LiDAR to generate elevation, slope, and slope direction feature images, enabling precise identification of rut contours. Yeganeh et al. [
12] proposed a multi-frame point-cloud stitching approach based on RGB-D sensors to reconstruct roadway surface profiles. Saad et al. [
13] used images captured by unmanned aerial vehicles (UAVs) to reconstruct 3D road surface models for manual extraction of rutting boundaries and length. However, each of these sensing approaches suffers from critical limitations. For instance, MLS and LiDAR-based systems require expensive hardware and often rely on high-precision GNSS/INS integration, making them cost-prohibitive for large-scale or routine inspections. TOF depth cameras and RGB-D sensors, while more compact, are highly sensitive to ambient light and perform poorly under intense sunlight or variable outdoor conditions. UAV-based systems typically involve complex workflows, including manual flight planning, photogrammetric reconstruction, and substantial post-processing efforts. Moreover, in fast-moving or high-traffic urban environments, ensuring repeatable and stable data acquisition remains a major technical challenge, further limiting the practicality of these methods in dynamic inspection scenarios.
Given these limitations, there is a growing demand for alternative 3D sensing solutions that offer lower cost, simpler deployment, and better adaptability to complex outdoor conditions. Structured light imaging systems, particularly those based on area-array coded light projection, have gained increasing attention in pavement inspection. These systems are compact, cost-effective, and resistant to ambient light, and they do not rely on external positioning systems. However, they typically have a limited field of view, making it impossible to capture the entire wheel-path or lane width in a single scan. As a result, full-section reconstruction requires multi-frame point-cloud registration and stitching, which introduces new technical challenges.
The biggest obstacle lies in the lack of salient features on road surfaces. Unlike indoor scenes or architectural environments where distinct edges or corners are present, pavements are largely flat and featureless. Traditional registration methods such as Iterative Closest Point (ICP) or Normal Distributions Transform (NDT) often fail under such low-texture conditions. Some studies attempt to overcome this by placing artificial markers and extracting landmarks for registration [
10], but this approach is impractical for large-scale applications and may alter the surface geometry, reducing the reliability of rut detection.
Table 1 summarizes the comparative characteristics of these methods, highlighting the motivation for developing an area-array structured-light solution capable of achieving high-resolution, full-section detection with reduced cost and equipment complexity.
To address the above challenges, this study presents an integrated framework for full-section rutting detection, which combines structured light-based data acquisition, texture-aware point-cloud registration, and robust region segmentation. High-resolution 3D data are continuously captured using an area-array structured light system, and multi-frame alignment is achieved through wavelet-based texture feature enhancement. On this basis, rutting regions are accurately segmented using an improved Random Sample Consensus—Density-Based Spatial Clustering of Applications with Noise (RANSAC-DBSCAN) algorithm. The proposed approach offers a practical, low-cost, and scalable solution for 3D pavement condition evaluation, with significant potential in maintenance and rehabilitation applications.
This work aims to deliver a practical full-section rutting evaluation workflow that integrates structured-light sensing, texture-aware registration, and robust rut-region segmentation. Our main contributions are as follows: (1) a wavelet-guided, texture-aware point-cloud registration scheme tailored for low-contrast pavements; (2) an end-to-end full-section pipeline from multi-frame acquisition to rut geometry/volume estimation; (3) a RANSAC-based surface fitting coupled with DBSCAN clustering to robustly delineate rut regions under real-world disturbances; and (4) a systematic evaluation protocol with publicizable scripts for error visualization and ablation.
The remainder of this paper is structured as follows.
Section 2 details the data acquisition and preprocessing, and introduces the registration and rutting segmentation approach. Experimental results are discussed in
Section 3, followed by conclusions in
Section 4.
2. Methodology
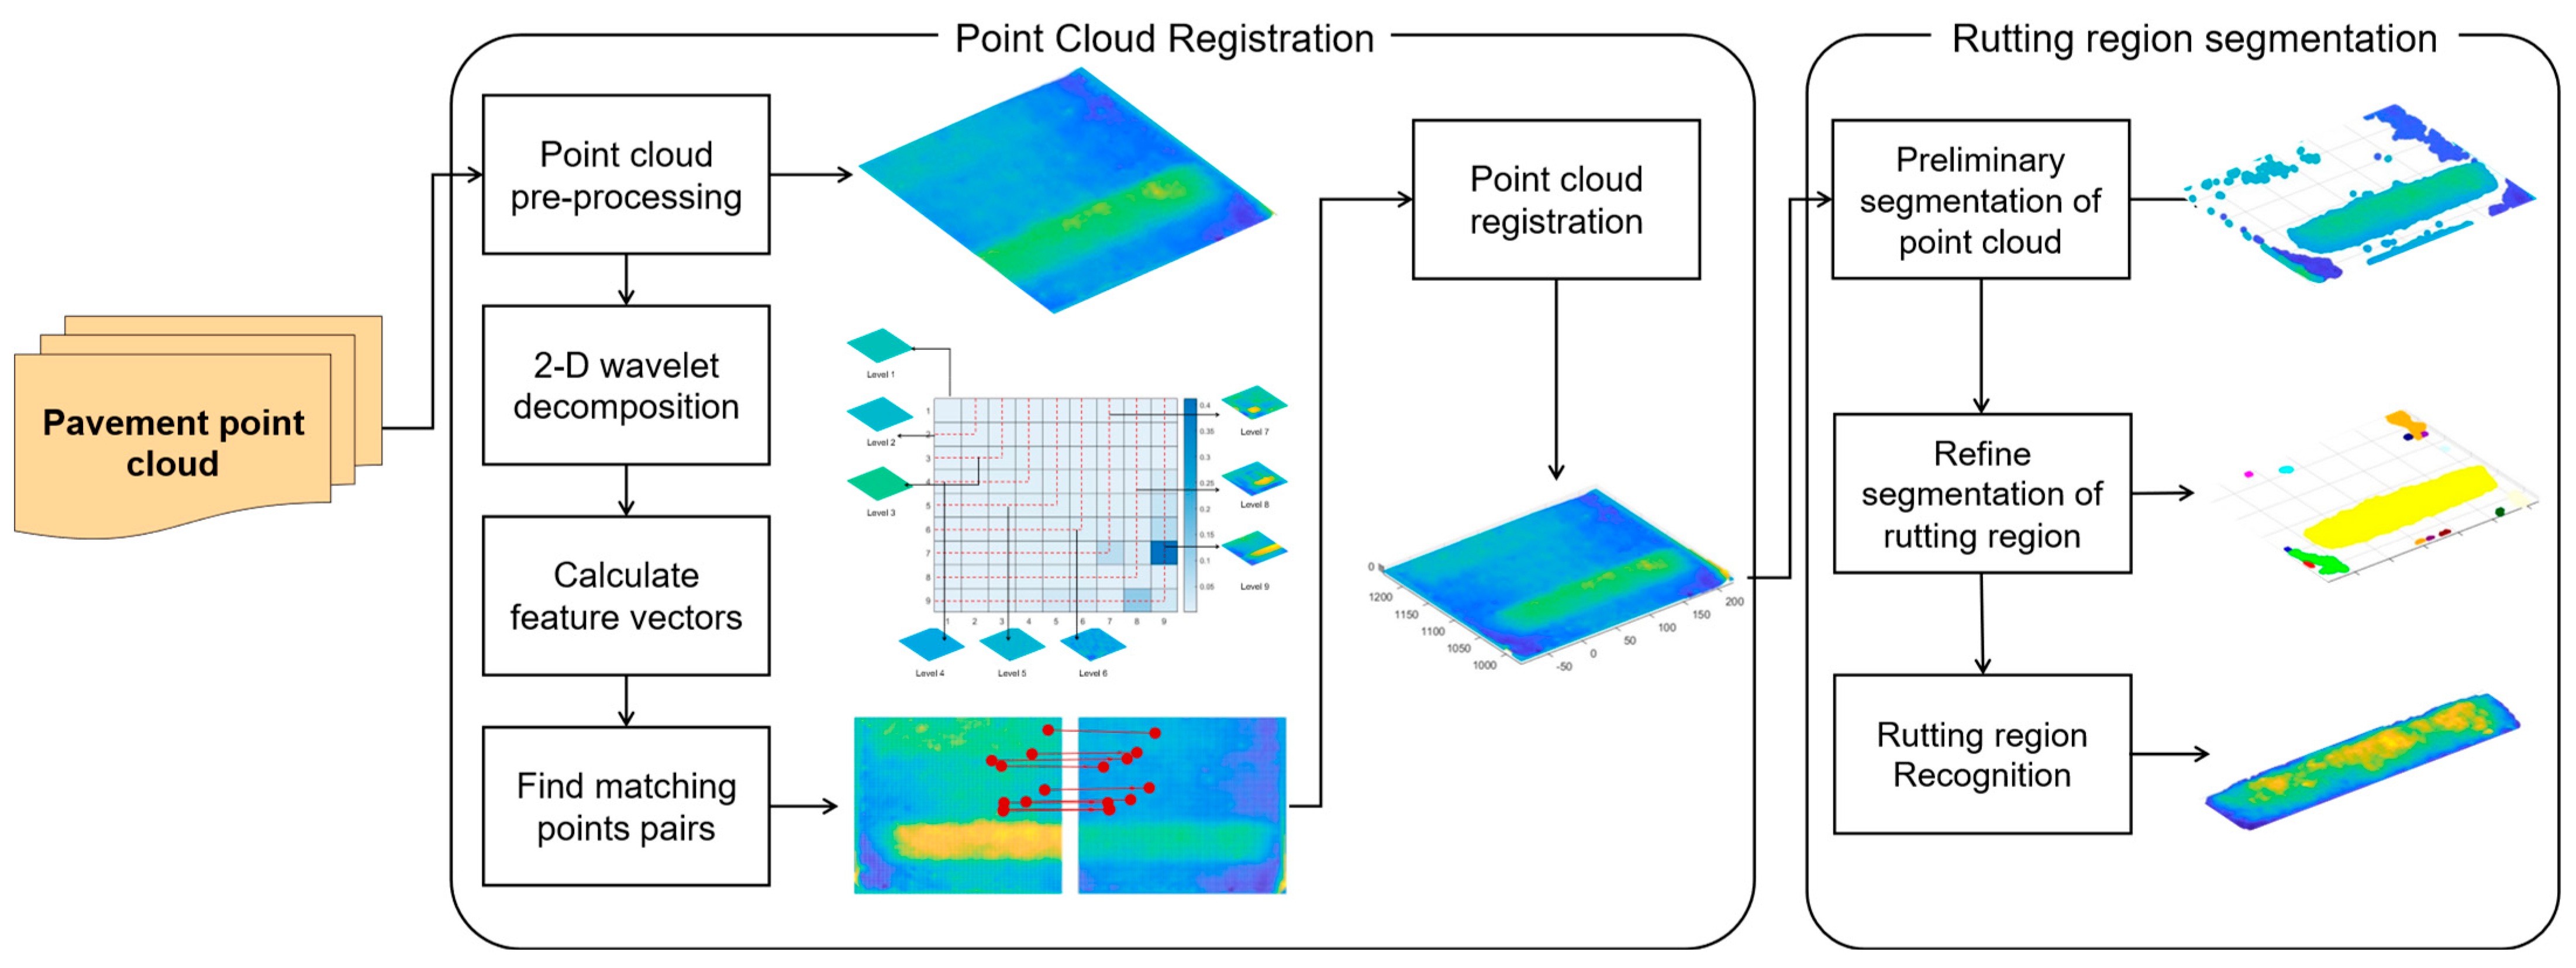
The proposed method for full-section disordered point-cloud registration and rutting region segmentation comprises seven main steps, as shown in
Figure 1. It presents the workflow of the proposed structured-light rutting-detection system, composed of three main modules: (1) point-cloud preprocessing and feature extraction, where raw pavement point-cloud frames are normalized, rasterized, and decomposed by a 2D wavelet transform to obtain multi-scale texture features; (2) point-cloud registration, which aligns adjacent frames by matching feature-vector pairs and applying closed-form SVD optimization, producing a continuous full-section 3D surface; and (3) rutting-region segmentation and recognition, where the registered surface is fitted by the improved RANSAC-DBSCAN algorithm to extract and label rut regions. The intermediate outputs of each module—feature vectors, matched correspondences, registered surfaces, and segmented rut regions—are shown on the right side of the figure.
2.1. Data Acquisition and Pre-Processing
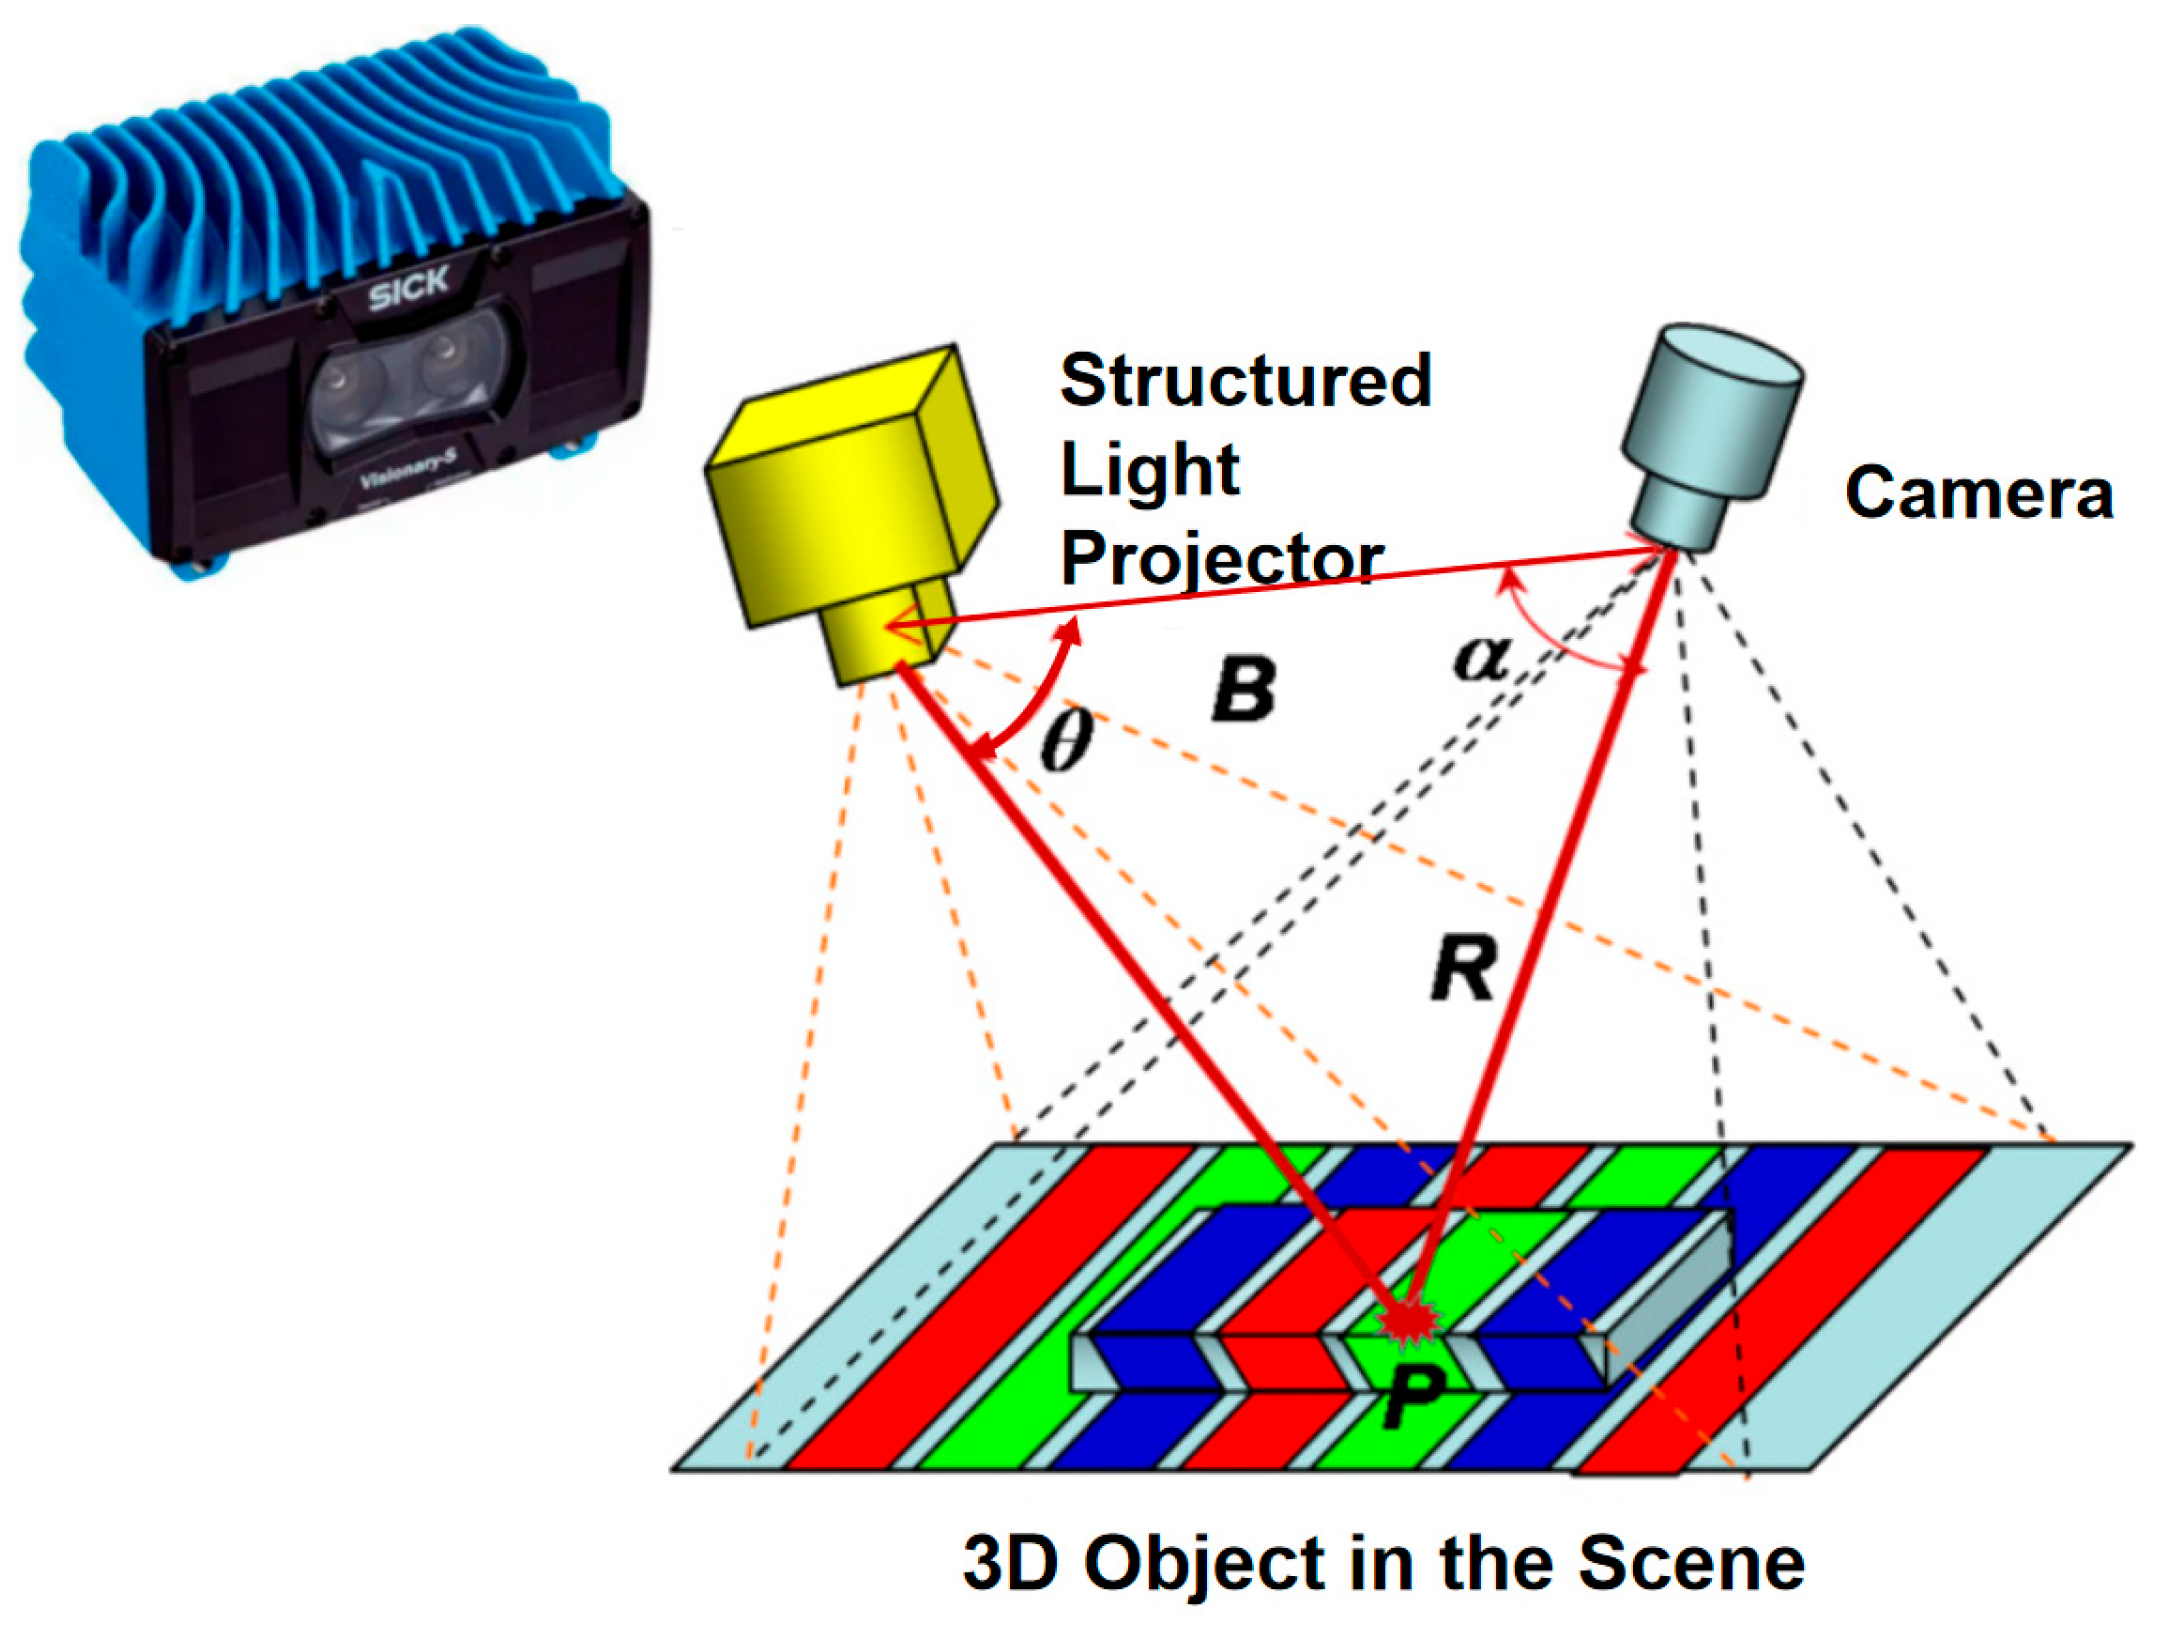
The data acquisition equipment consists of the Visionary-S camera from SICK, which is equipped with two IR (infrared radiation) cameras and one RGB camera, as shown in
Figure 2. The camera operates at a frame rate of 30 fps, allowing for the acquisition of up to 9,850,000 3D data points per second. When conducting multiple measurements or scans within a 0.5 m shooting range, the repeatability of the measurements shows a maximum difference of 0.25 mm. The acquisition methodology for pavement point-cloud data relies on the principle of area-array structured light. When black-and-white structured light patterns are projected onto an object, their deformation reflects the geometry of the surface. Elevation changes indicate depth, while discontinuities reveal physical gaps. These image features are then used to calculate the object’s position and depth, enabling accurate 3D reconstruction.
In terms of data preprocessing, the first step is to level the point cloud based on multiple linear regression. This step holds significant importance as it addresses potential challenges during data collection, wherein the camera angle of view might not be ideally perpendicular to the ground due to the presence of transverse and longitudinal slopes on the road. Additionally, the use of hand-held devices can introduce potential deviations in the camera’s orientation. Consequently, to ensure accurate and reliable results, the data pre-processing procedure aims to level the point cloud by rectifying these potential angular discrepancies and deviations caused during the data acquisition process. To address this, the z-value in the raw data is subtracted from the predicted value in the regression model, thus removing the offset of the data in the x, y plane and flattening the data for analysis in subsequent processing. The height z of the point cloud is fitted using a multiple linear regression model, represented as Equation (1):
where
,
, and
are the regression coefficients, and
is the error term.
The leveling operation is performed on the original height z according to the regression coefficient to obtain the leveled z value:
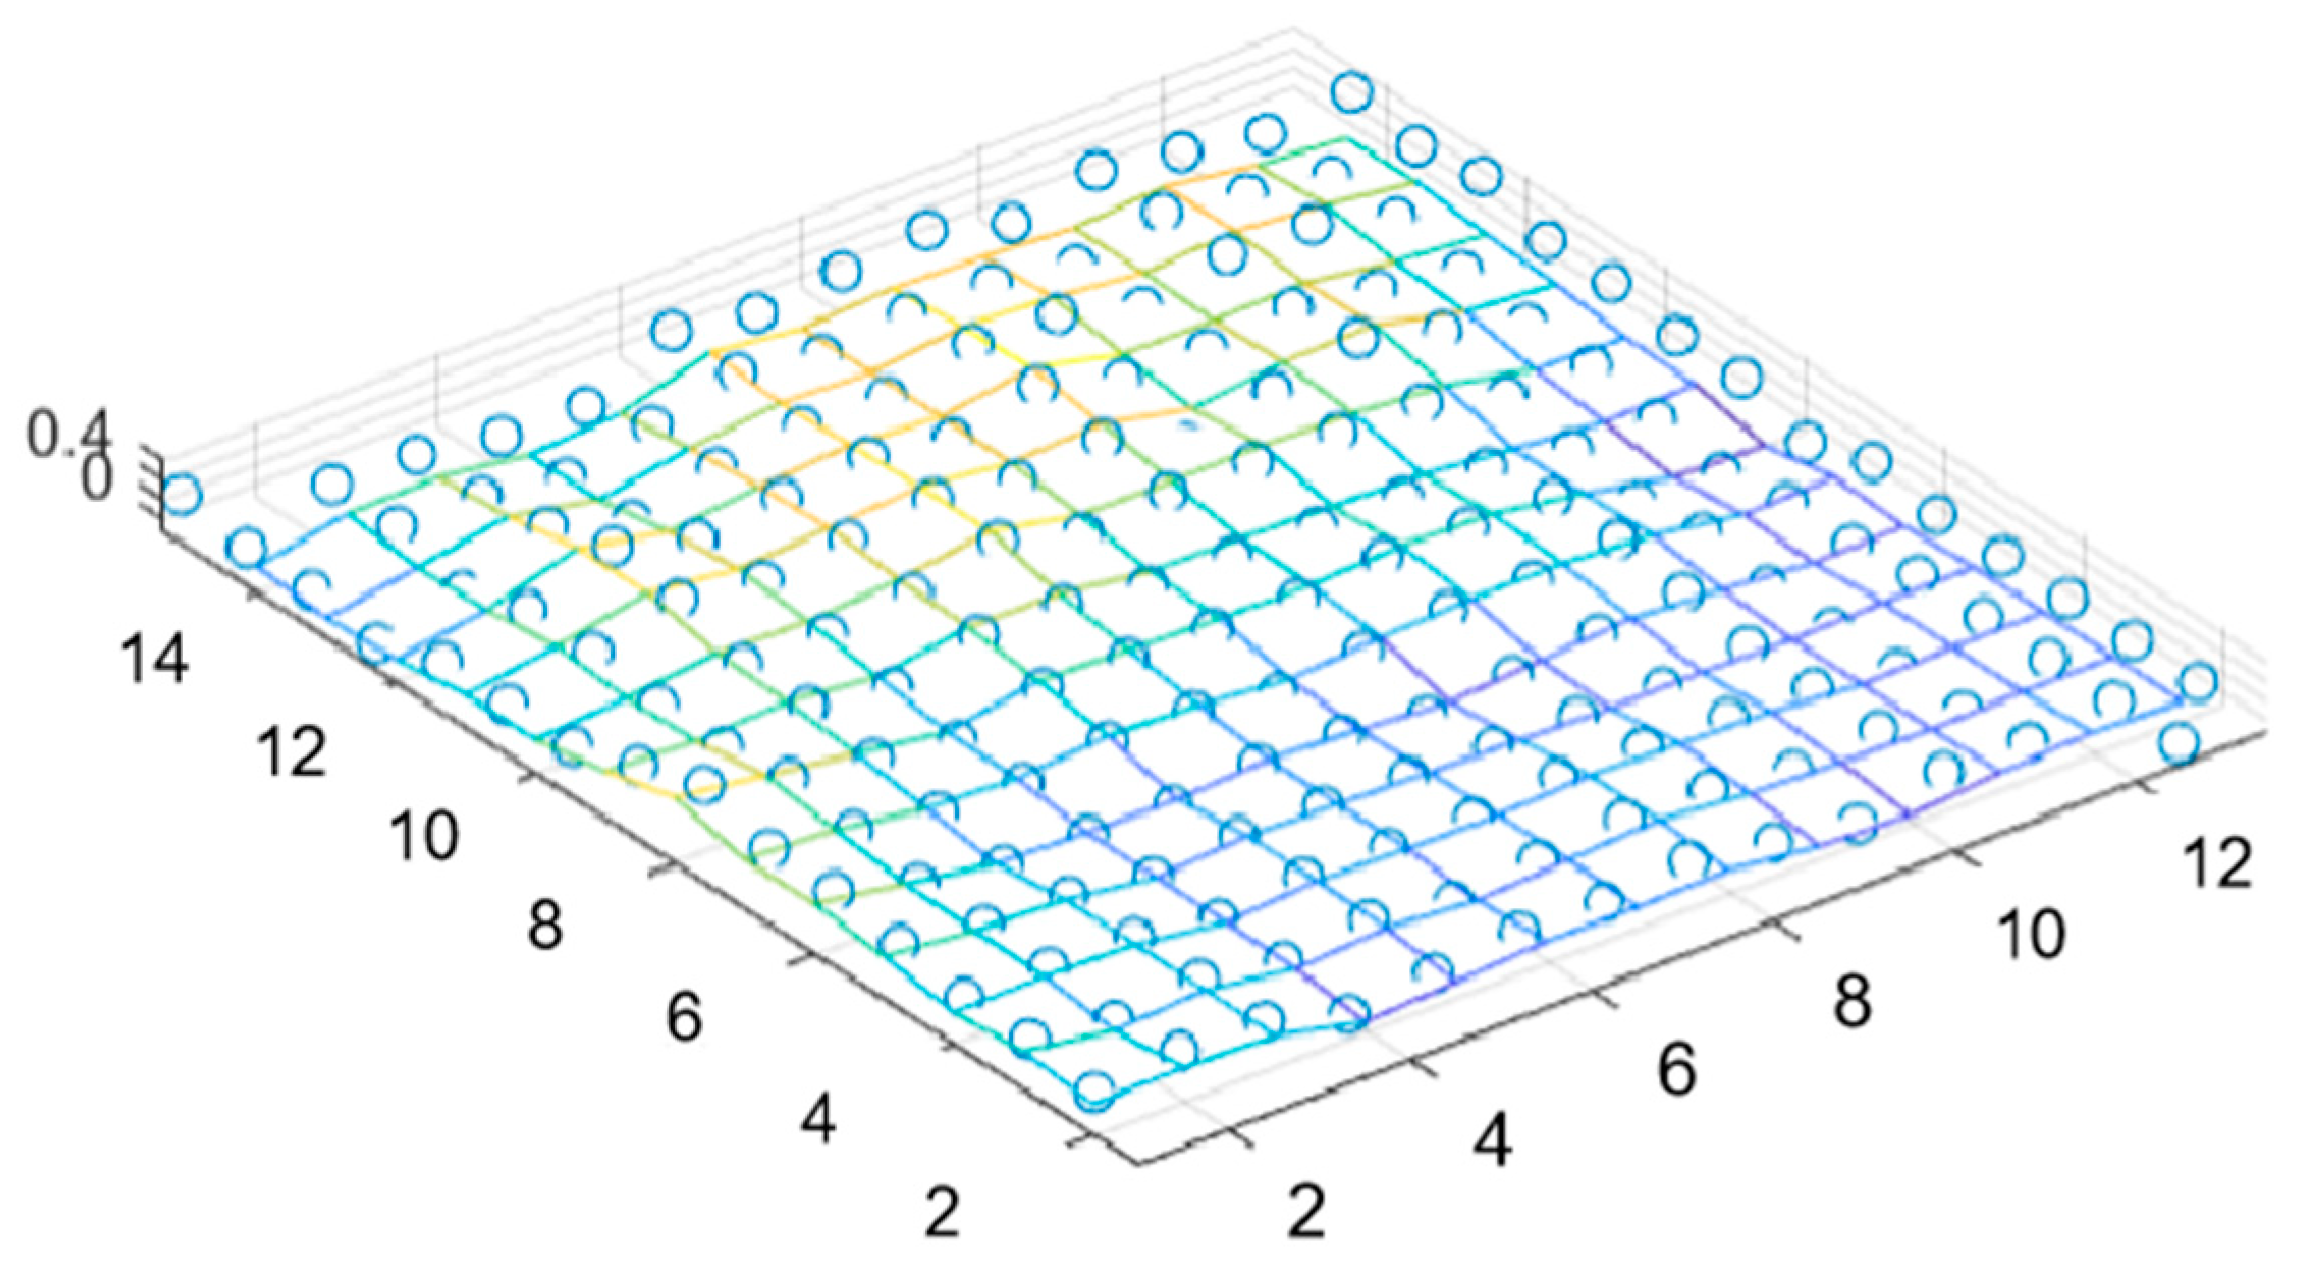
The disordered point cloud represents a non-matrixed form of data, lacking a clear description of spatial relative positions, thus rendering it unsuitable for direct application in subsequent matrix-based operations. To overcome this limitation, pre-processing is required to rasterize the disordered point cloud. Rasterization enables the mapping of point-cloud data into a regular grid space, providing a discrete representation of the point cloud. This pre-processing step facilitates feasibility and convenience for subsequent analysis and processing. To address this issue, simplification of data representation and processing can be achieved by rasterizing the point cloud and transforming it into regular grid point data. The rasterization process involves the following steps: creating a grid with intervals of coordinate 1 in the x and y directions, mapping the continuous point cloud onto the discrete grid point space, partitioning the space into a series of regular grids, performing linear interpolation on the points falling within each grid to preserve the original texture characteristics of the pavement as accurately as possible, and obtaining the representative value of the grid. In this way, the point cloud is represented as a 2D matrix, where the original x and y coordinates are the indexes of the matrix in rows and columns, and the z coordinates are the elements of the matrix.
Figure 3 shows the local effect of the point cloud after rasterization, and it can be seen that the matrix formed after rasterization is able to preserve the undulations and textures of the original point cloud.
2.2. Point-Cloud Registration Based on 2D Wavelet Decomposition and Feature Vector Similarity
Point-cloud registration aims to establish correspondences between two point clouds and perform relative coordinate transformations on matched-point pairs to achieve a unified coordinate system for point-cloud data from different positions, angles, or orientations. The Iterative Closest Point (ICP) [
15] algorithm has been widely studied as a classical point-cloud registration algorithm. However, the challenge in point-cloud registration for road scenes lies in selecting matched-point pairs. The road scene is homogeneous, which leads to a large number of potential mismatched-point pairs, making accurate registration difficult. When confronted with this challenge, traditional ICP algorithms have difficulty in guaranteeing the speed of operation and convergence to the global optimum when iteratively searching for matched-point pairs using a greedy strategy. To solve this problem, this study proposes a point-cloud registration method based on 2D wavelet decomposition to extract pavement texture features, obtain the feature vectors of the point-cloud grid, and use them as the basis for finding matched-point pairs.
2.2.1. Feature Vector Extraction Through 2D Wavelet Decomposition
The wavelet decomposition is a widely used technique for multi-scale analysis, commonly employed in texture analysis. It involves a set of selected mother wavelets and scale functions (i.e., father wavelets) after appropriate scaling and translation, serving as the basis functions. The wavelet decomposition represents a function in the time (or distance) domain as a linear combination of a series of basis functions (i.e., wavelets). The complete wavelet expansion can be expressed mathematically as follows:
where
is the parent wavelet and
is the parent wavelet, i.e., the scale function, which has been telescoped and translated into Equations (4) and (5):
The keeps the energy of the basis functions at 1.
The wavelet decomposition exhibits favorable localization properties in both the time and frequency domains, making it well-suited for approximating functions at various resolutions. At low resolution, the wavelet transform of a signal is less susceptible to noise and can capture finer local information. Conversely, at high resolution, the wavelet transform can reveal the contours of larger structures. Given that discrete point-cloud data can be treated as continuous signals, employing wavelet decomposition to process such data is theoretically viable. This approach allows for the extraction of pavement texture features. The full-wavelength pavement texture can be divided into multiple sub-scale textures by using the 2D wavelet decomposition method. Only textures with specific wavelengths are shown in each subscale. This approach allows textures with different granularities to be analyzed separately at each wavelet scale, thus accommodating multi-scale analysis [
16]. In this study, the Daubechies 4 (db4) wavelet was adopted due to its smooth shape and compact support, which provides a good trade-off between localization and frequency resolution for pavement-surface textures. The decomposition was performed up to nine levels, consistent with the texture and rutting wavelengths observed in the structured-light point clouds.
Mallat developed a highly efficient algorithm for performing the wavelet transform on discrete signals [
17]. The algorithm involves decomposing the discrete signals into an equivalent approximation signal and a detailed signal at the first level. Subsequently, the approximate signals at the first level undergo further decomposition into another set of approximation signals and detailed signals at the second level, and this process continues iteratively.
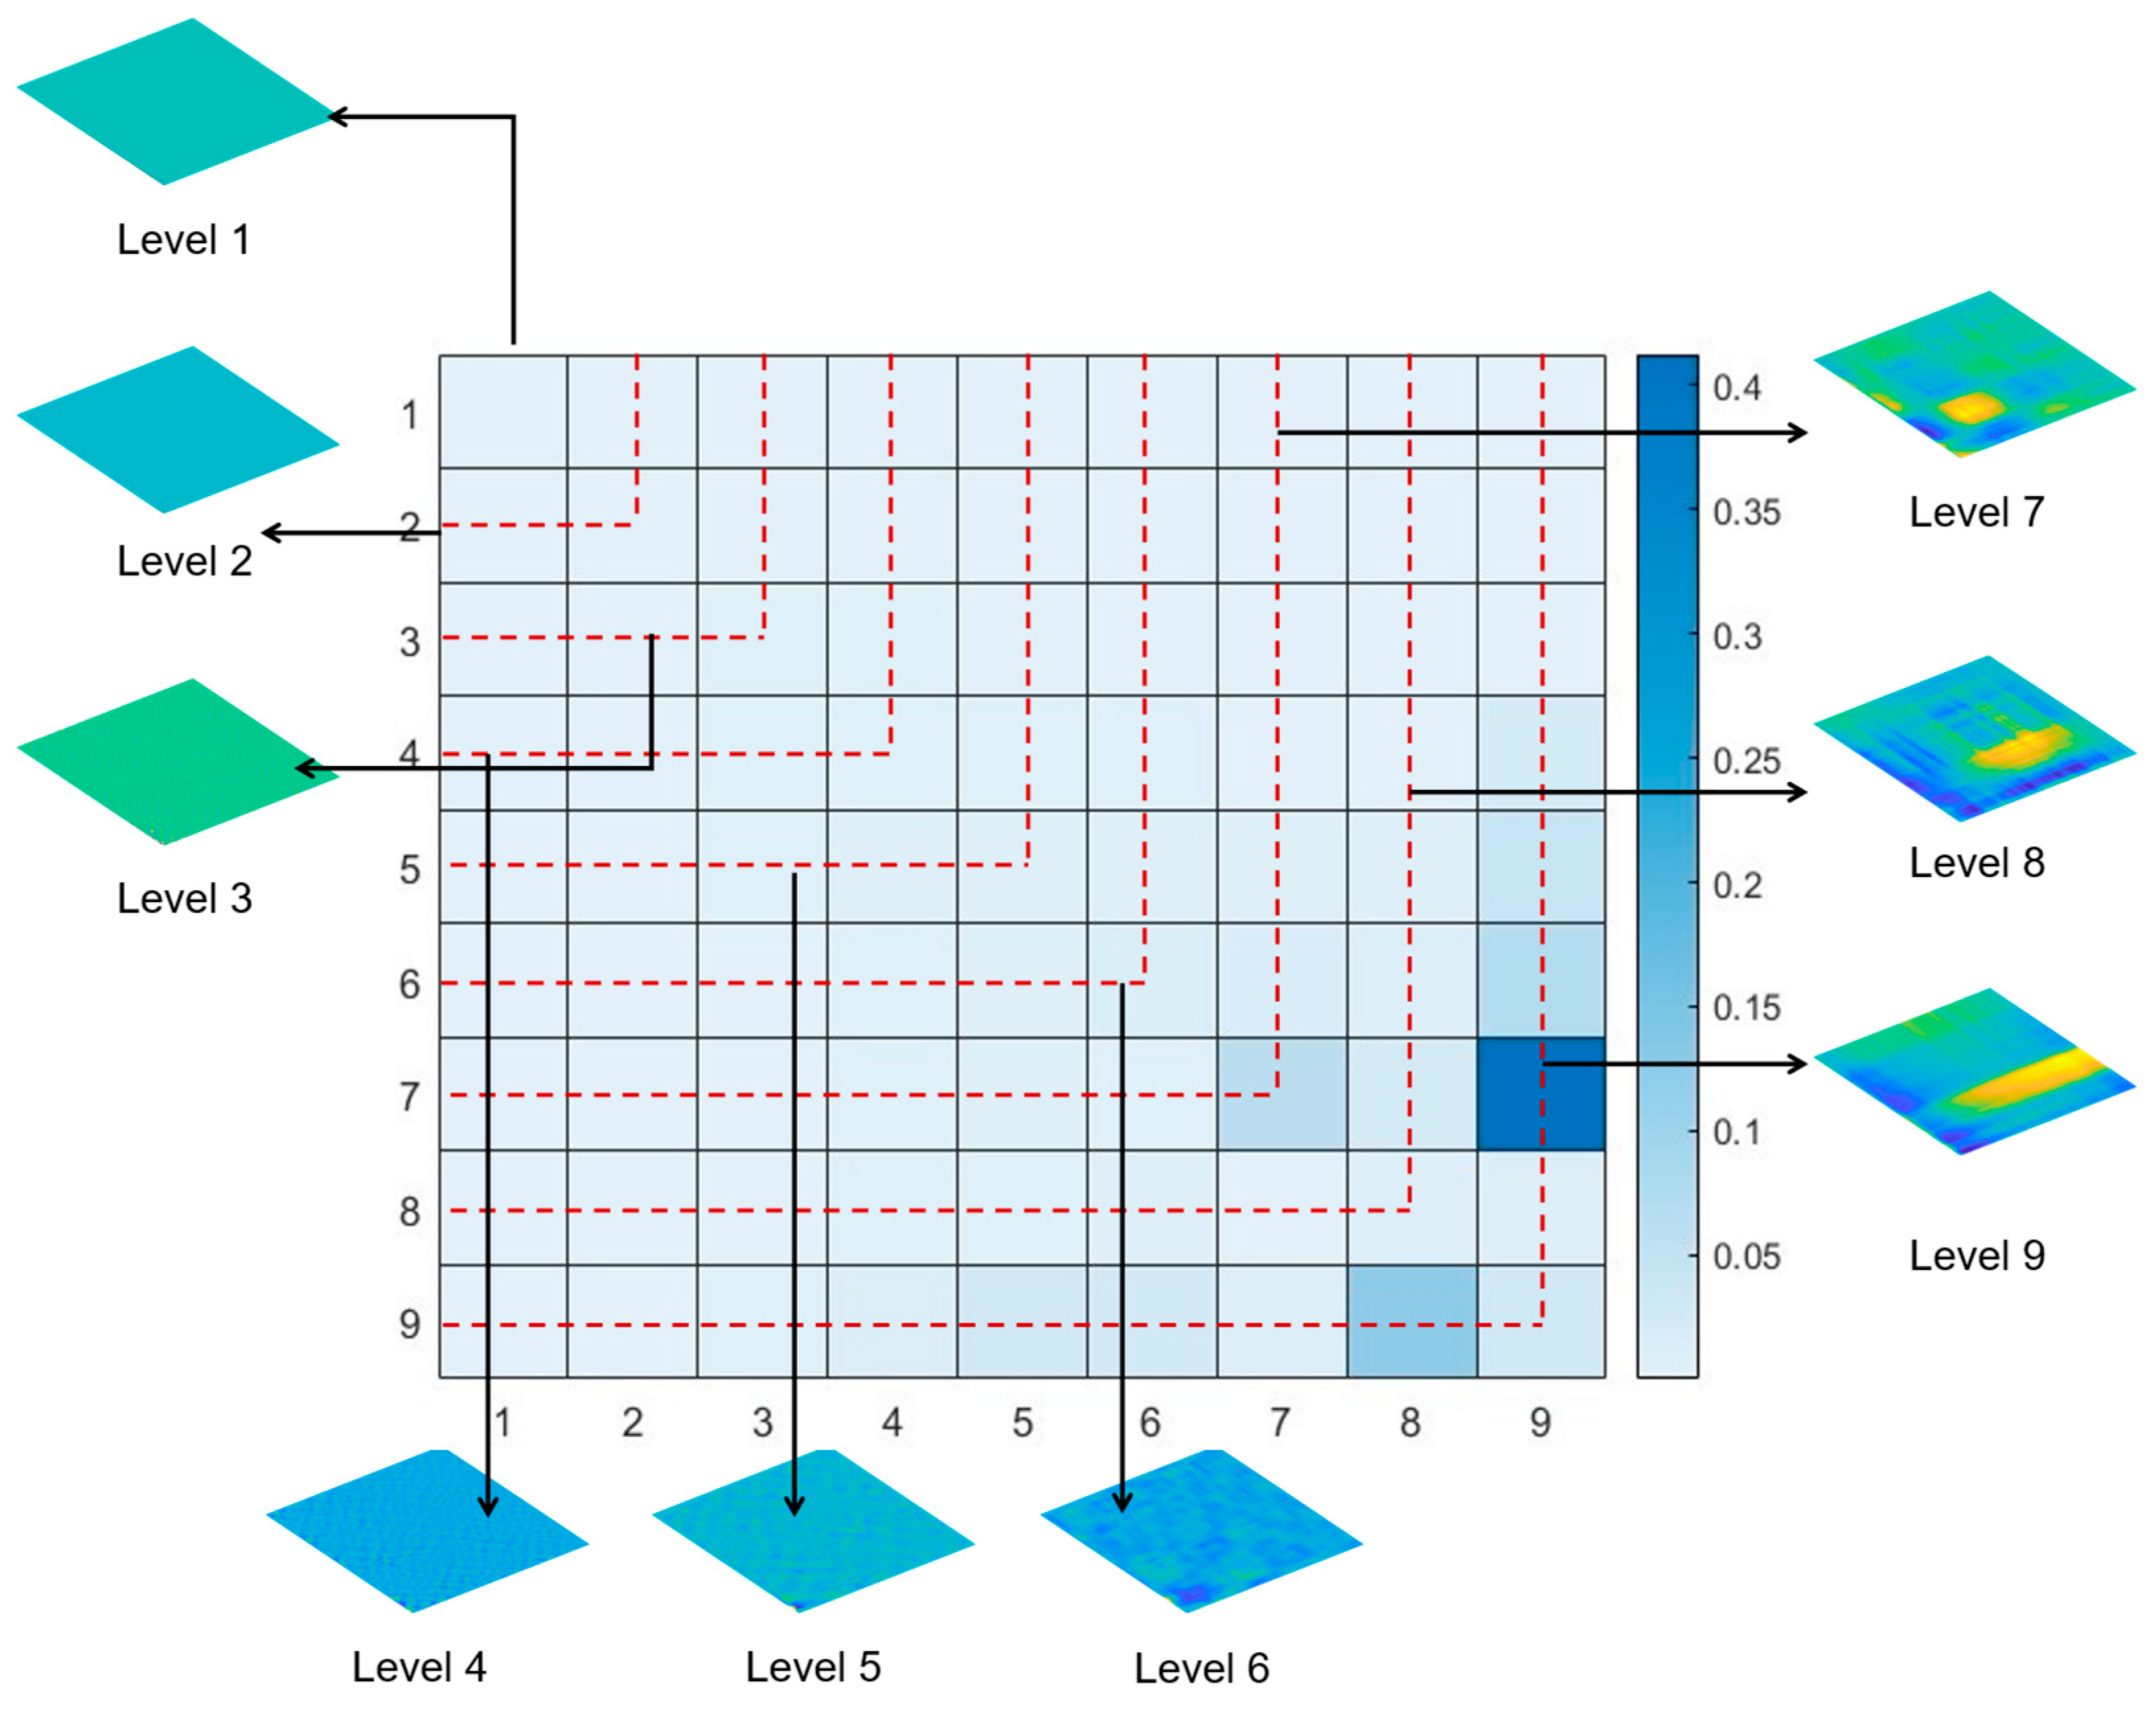
Utilizing the Matlab wavelet toolbox, the rasterized point cloud undergoes a nine-level decomposition, comprising eight detail signals and a residual signal, as observed previously. In each iteration, the highest frequency components are isolated. The 2D wavelet transform of the outcome of the rasterized data dissects the pavement texture data into nine sections along both the x and y directions, resulting in a total of 9 × 9 parts. In
Figure 4, the 2D texture levels are redefined as follows: Level 9 encompasses the ninth row and ninth column of the grid; Level 8 comprises the eighth row and eighth column, excluding the portion covered by Level 9; Level 7 encompasses the seventh row and seventh column, excluding the areas covered by Levels 8 and 9, and so on. Ultimately, each grid acquires a feature vector of size 1 × 9, with each element derived from one of the nine levels.
2.2.2. Matched Point Pairs Search Based on Feature Vector Similarity
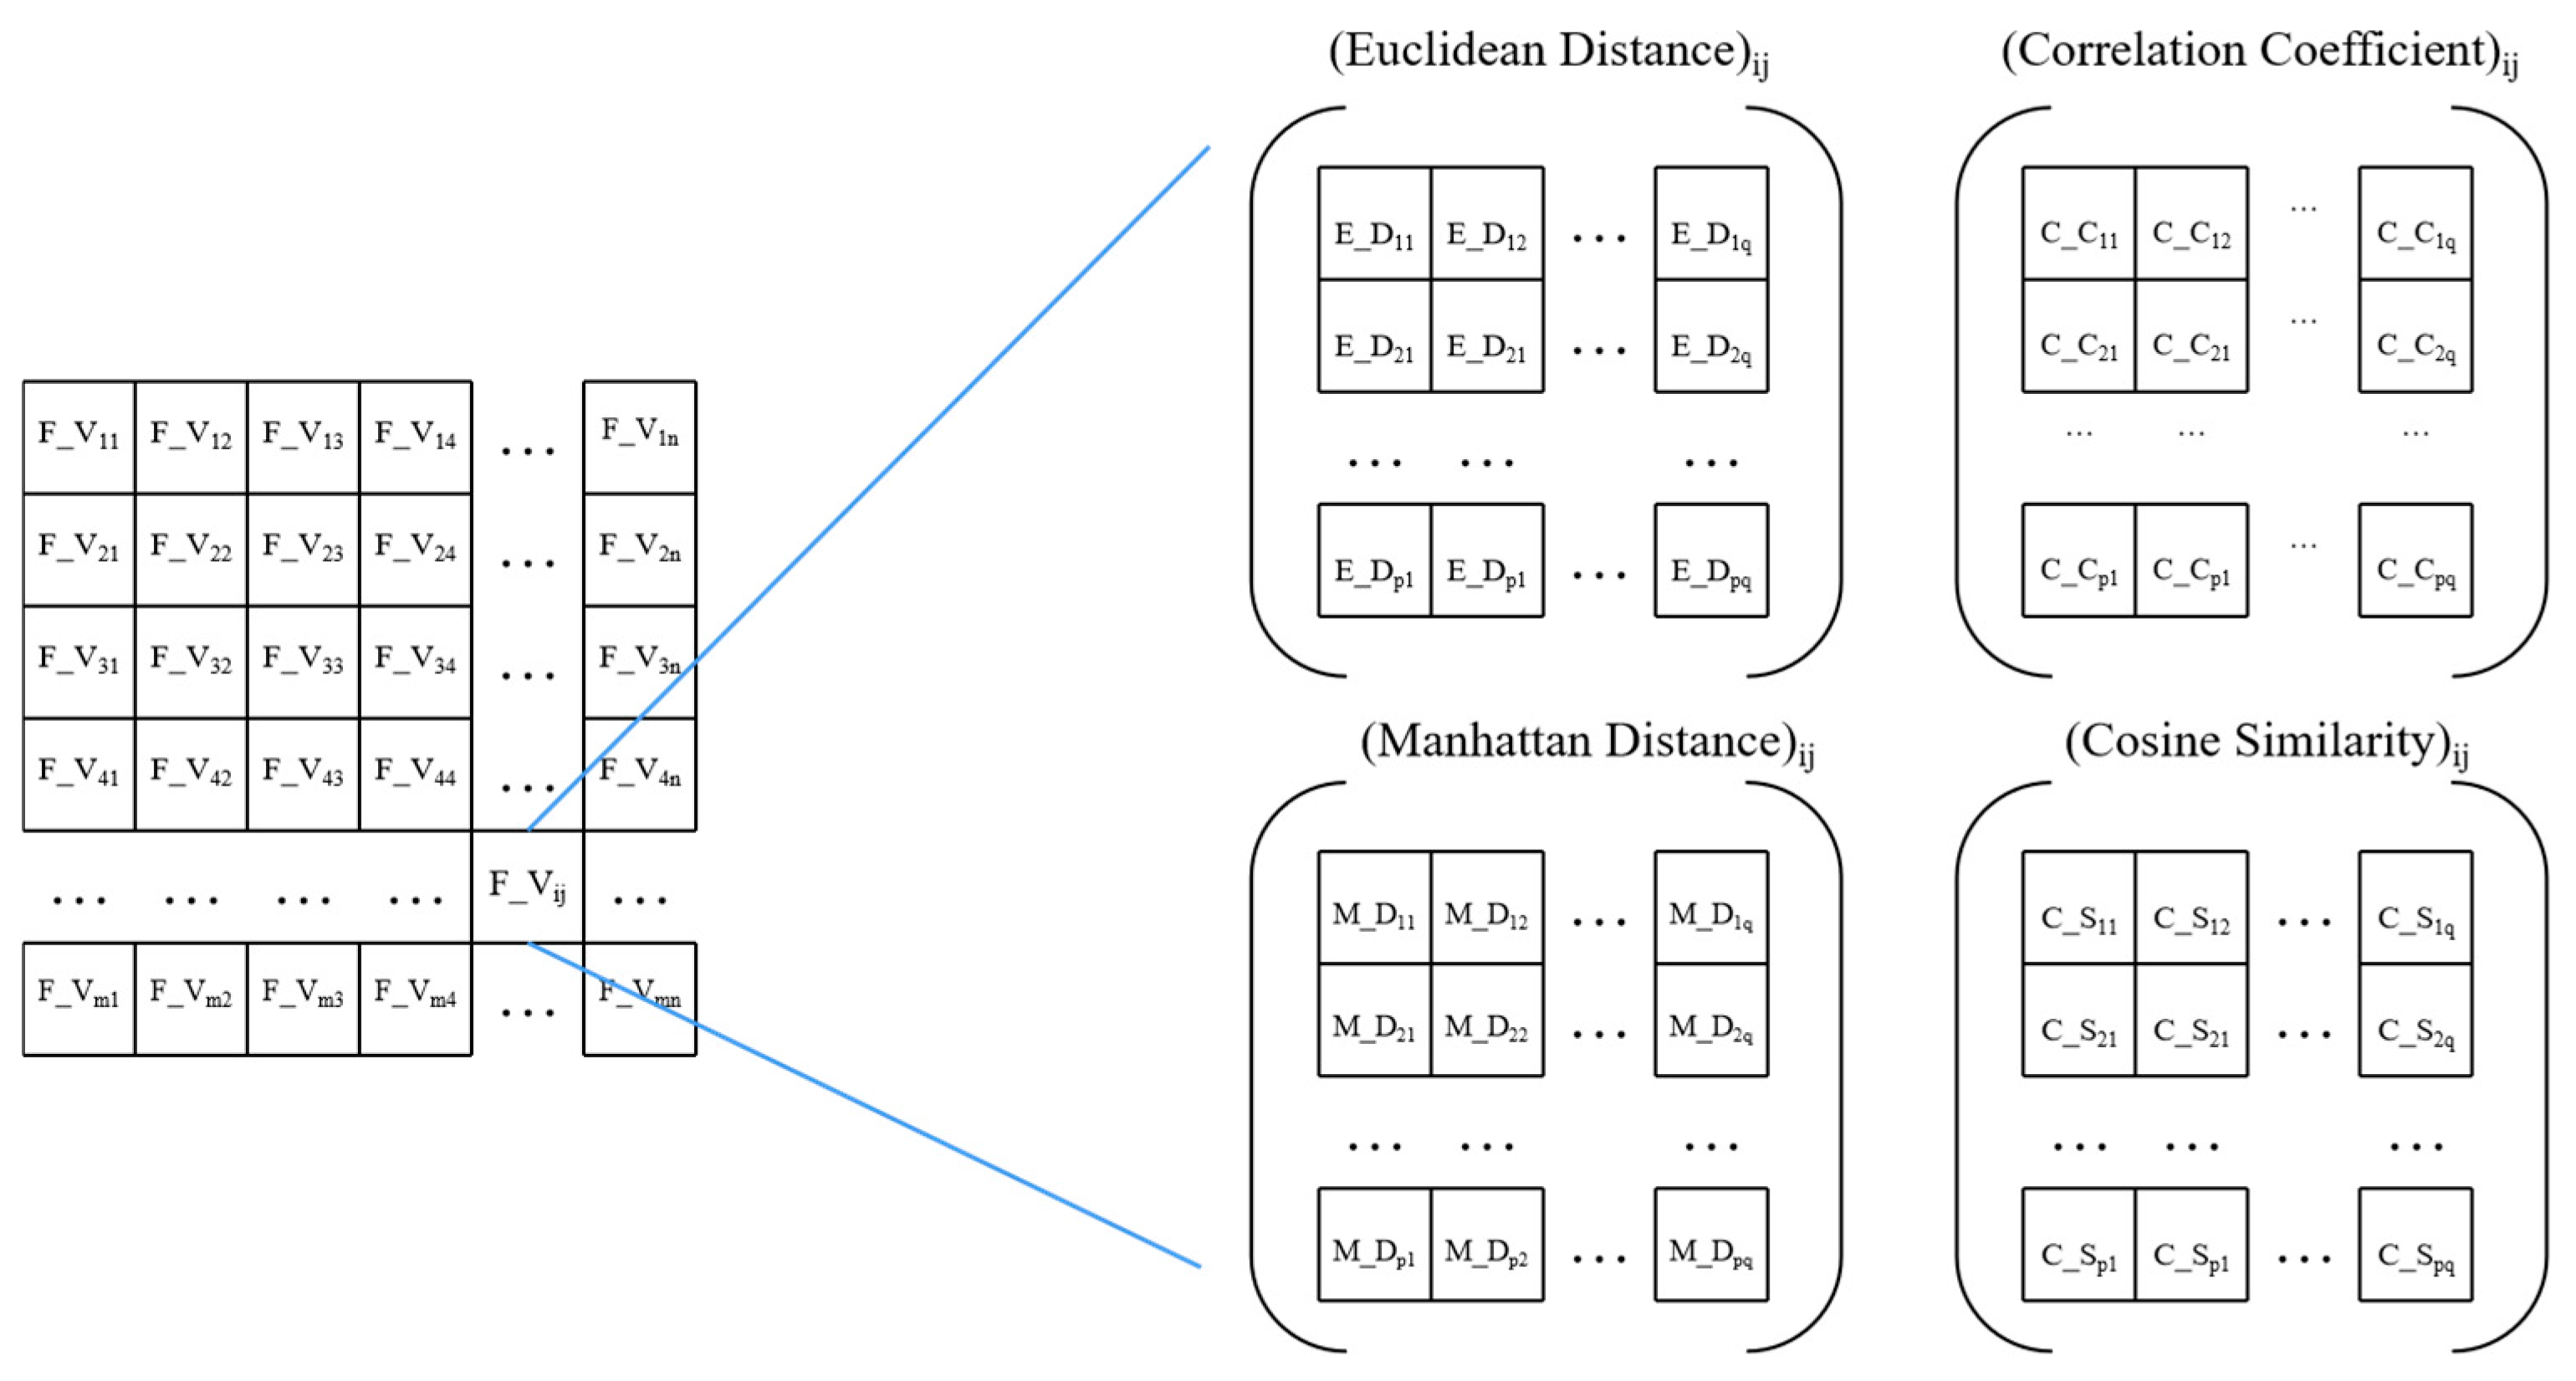
A certain overlapping region exists between two consecutively captured point clouds, and searching for matched-point pairs based on the overlapping region is the basis for point-cloud registration. The feature vector obtained by 2D wavelet decomposition reflects the texture characteristics of the partial region of the pavement, which we use as an index to find matched-point pairs, specifically expressed as follows: the points that show a certain degree of similarity in the feature vector are regarded as matched-point pairs in the point cloud of the two consecutively captured frames. In order to measure the similarity of the feature vectors, Euclidean distance, Manhattan distance, cosine similarity, and similarity coefficient are chosen as the similarity indicators in this study, and when comparing the two feature vectors exhibiting greater similarity, the trend of the four indicators is (1) Euclidean distance close to 0; (2) Manhattan distance close to 0; (3) cosine similarity close to 1; and (4) similarity coefficient close to 1, as shown in
Figure 5.
Although the similarity measures in Equations (7)–(9) show moderate correlation (
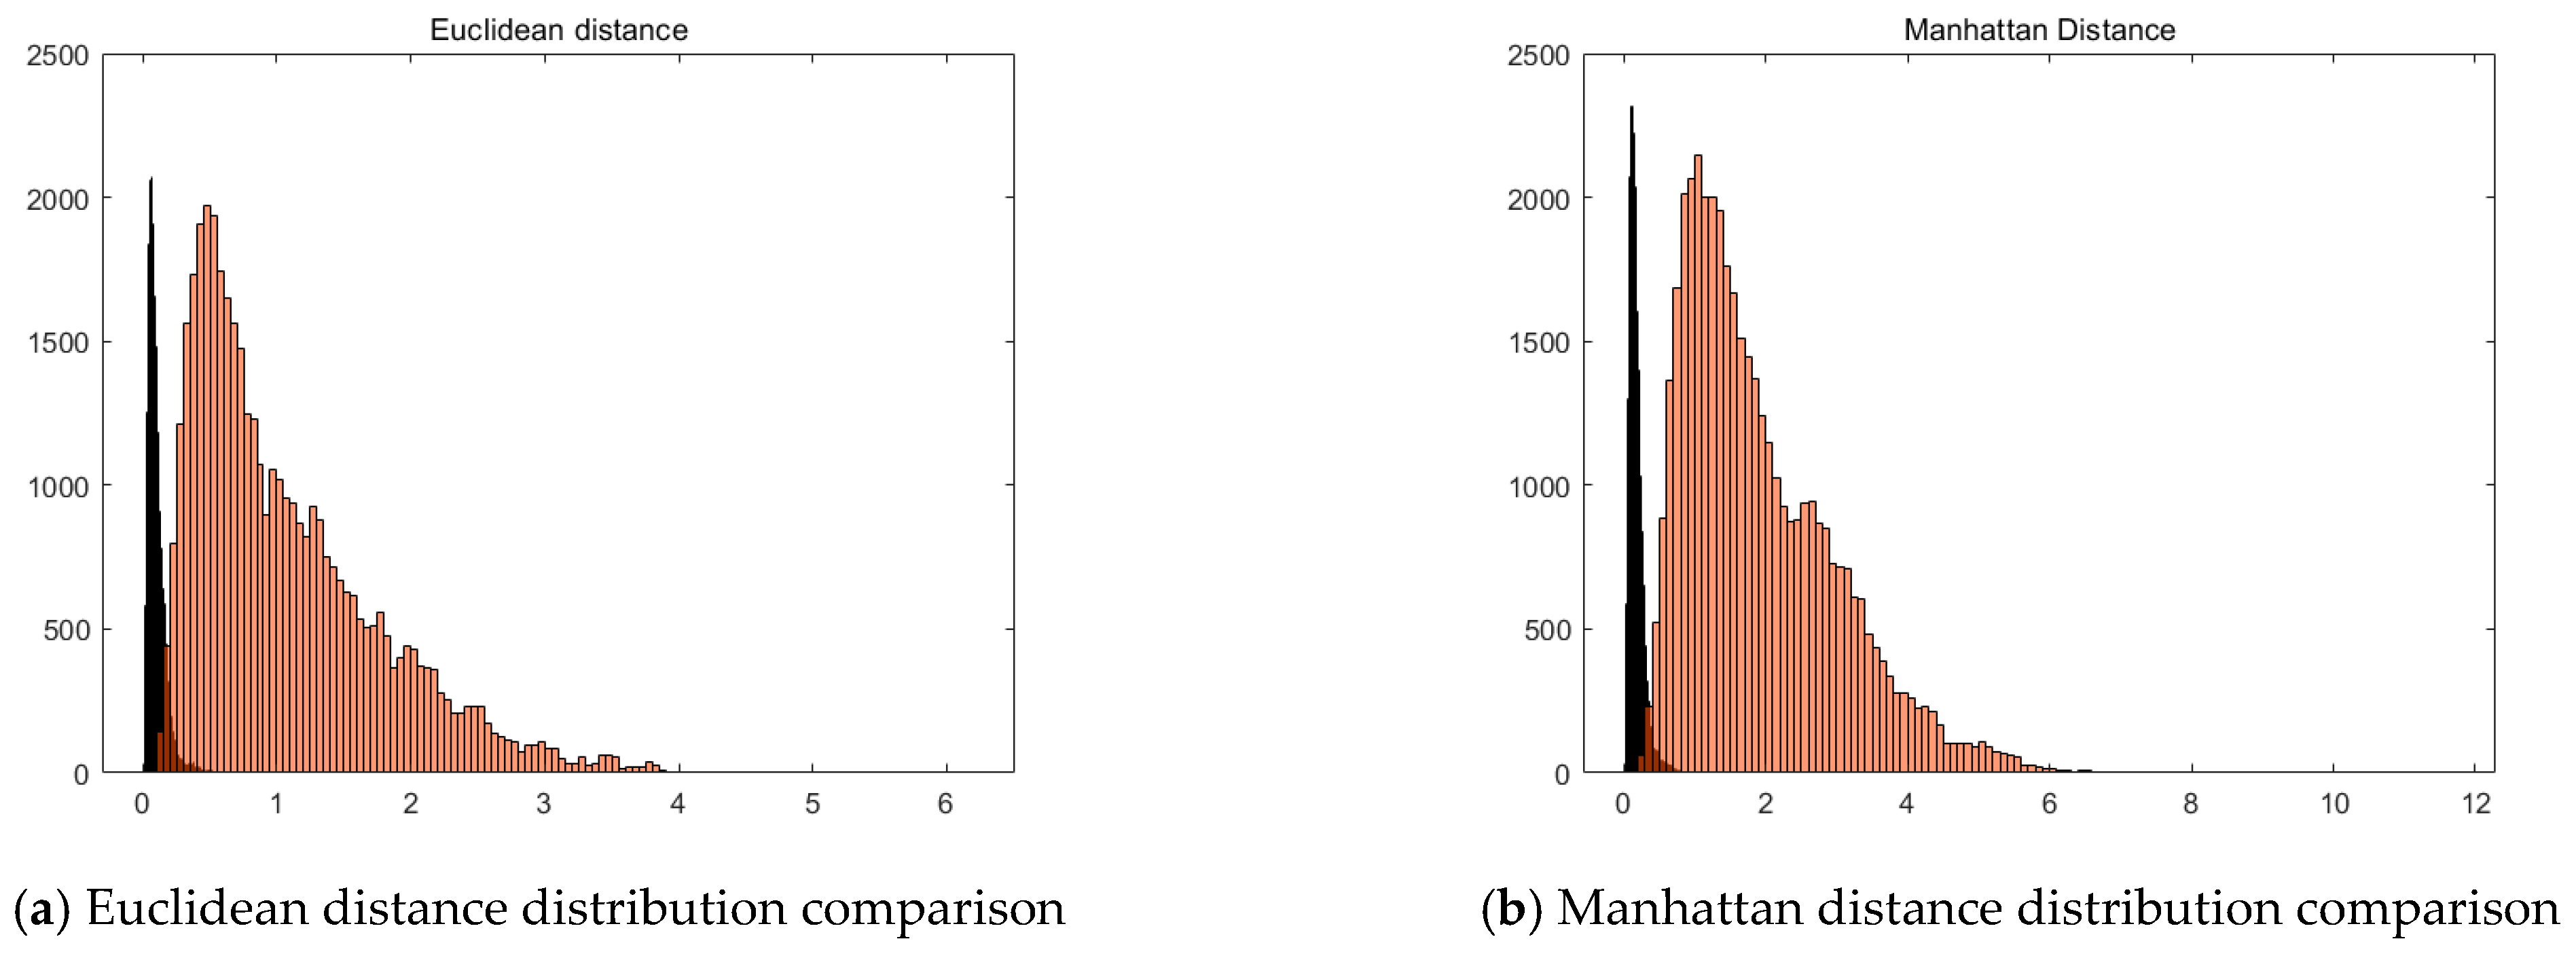
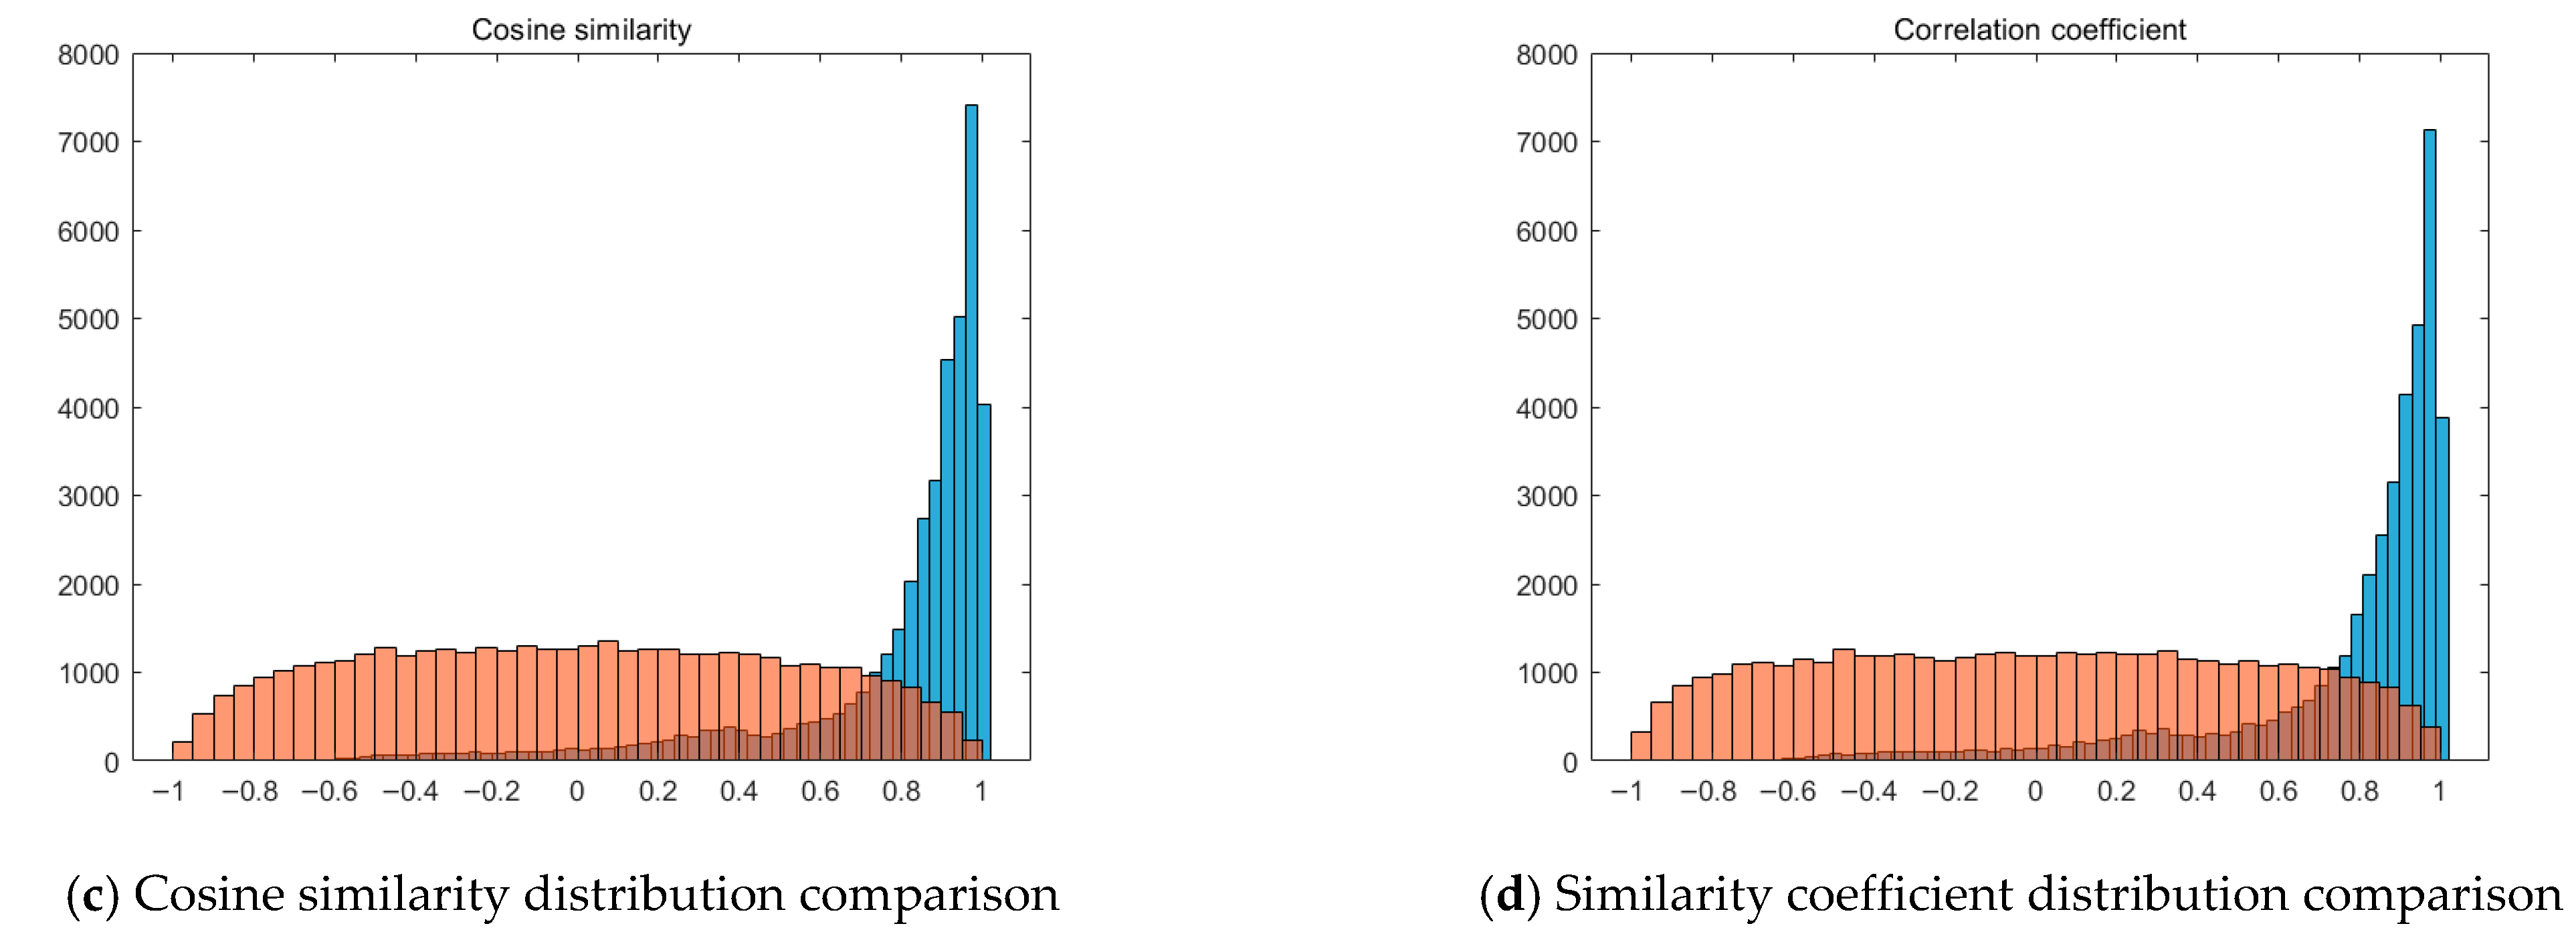
Figure 6), they capture different aspects of the feature-space relationship. Equation (7) (normalized cross-correlation) is sensitive to the relative pattern orientation and remains invariant to global intensity scaling, while Equation (8) (cosine similarity) constrains the angular consistency of texture vectors, and Equation (9) (Euclidean distance) ensures magnitude alignment. In combination, these metrics improve correspondence stability on low-texture or reflectance-varying pavement surfaces. Hence, their joint use contributes to the robustness of the proposed texture-aware registration method.
We verified the validity of similarity indicators in the following way. Two frames of the point cloud were taken continuously for the same pavement sample at different angles, and obviously, they overlapped completely, and matched-point pairs were selected at the same position of the two frames of the point cloud. As a comparison, the same number of random points were selected from both frames of the point cloud to be paired as non-matched-point pairs. The similarity between the selected matched and non-matched-point pairs was calculated, and the results are shown in
Figure 6. There are significant differences in the four indicators between matched and non-matched-point pairs. Therefore, it is reasonable to use feature vectors as the basis for similarity calculation between rasterized data to identify matched-point pairs.
2.2.3. SVD-Based Rotation and Translation Matrices Estimation
Following the above method, the matching point pairs between the two frames of the point clouds are obtained, serving as the foundation for the subsequent calculation of the rotation and translation matrices. The essence of point-cloud registration is to find the rotation and translation matrices between the source point cloud and the target point cloud. Through this matrix, the source point can be transformed into the same coordinate system as the target point cloud. This process can be expressed as Equation (10):
where
and
are a set of matching point pairs in the target and source point clouds, and
and
are the rotation and translation matrices.
The rotation and translation of the point cloud are realized in 6 degrees of freedom, including 3 translation degrees of freedom along the x, y, and z axis directions and 3 rotation degrees of freedom around the x, y, and z axis. It is remarkable that since the shooting distance of the point cloud is a fixed height from the ground, it can be considered that there is no scaling of the point cloud during the registration process, that is, the rotation and translation of the point cloud is a rigid body transformation, so the degree of freedom does not include scaling.
The fundamental challenge in ordinary point-cloud registration lies in establishing the correspondence between points in two distinct point sets, which constitutes the core issue of registration. The classical Iterative Closest Point (ICP) algorithm updates the rigid-body transformation by finding the nearest point pairs through continuous iteration, and gradually searches for the optimal relationship between the matched points, thus realizing the goal of point-cloud alignment. The choice of initial parameters and the control of the number of iterations may affect the accuracy and speed of the registration results. However, since this study finds the set of matched-point pairs by the above method, it avoids the process of iterating to find matched points in the traditional registration problem and reduces the computational complexity. Meanwhile, directly finding the matched-point pairs can avoid wrong matches and will not fall into local optimal solutions, thus obtaining more reliable registration results.
The set of matched-point pairs
and
is obtained by the previous method, where
is a matched-point pair. Calculating the optimal coordinate transformation by using the Singular Value Decomposition (SVD) method. Specifically, the process of solving the rotation and translation matrices can be described as the following equation:
The procedure for solving the rotation and translation matrices is as follows:
- (1)
Decentralization: decentralizing both the source point cloud and the target point cloud, that is, subtract the centroids of the respective point clouds, so that the centroid coordinates of the point cloud are the origin. The points after decentralization are:
where
and
are centroids of two point sets.
- (2)
Constructing covariance matrix: the source point cloud and the target point cloud after decentralizing are constructed into a covariance matrix
, which is used to estimate the rotation matrix between the two point clouds.
- (3)
Singular Value Decomposition: Singular Value Decomposition (SVD) is performed on the covariance matrix H to obtain the singular value matrix, the eigenvector matrix
of the source point cloud, and the eigenvector matrix
of the target point cloud.
- (4)
Solving the translation matrix:
- (5)
Solving the translation matrix:
2.3. Robust Pavement Rutting Region Segmentation Based on Improved RANSAC-DBSCAN Method
Following the completion of the point-cloud registration, the reconstructed pavement point cloud needs to be segmented to realize the detection and extraction of pavement rutting regions, which is a complex and critical step aiming at dividing the point cloud into different subsets, each of which represents an independent object or a specific region in the point cloud. This process usually relies on prior knowledge, such as the geometric shape of objects or regions, using limited parameters to describe the complex structure.
To effectively detect and extract rutting regions on pavements, this study proposes an improved RANSAC-DBSCAN method tailored specifically for rutting region segmentation. Unlike general-purpose segmentation methods, the proposed approach incorporates domain-specific optimizations to enhance detection accuracy in complex pavement environments.
The method consists of three main steps. First, the Random Sample Consensus (RANSAC) algorithm is employed for preliminary segmentation. By fitting a plane model to the pavement surface, RANSAC isolates the approximate locations of rutting regions, effectively distinguishing them from the surrounding intact pavement. Given the geometric characteristics of rutting, a custom plane-fitting model is introduced to enhance segmentation precision, ensuring minimal loss of relevant rutting features.
Following the initial segmentation, an improved Density-Based Spatial Clustering of Applications with Noise (DBSCAN) algorithm is applied to refine the rutting region clusters. Traditional DBSCAN is effective in clustering data points based on density variations, but for rutting detection, the standard approach may misclassify other pavement anomalies such as cracks or potholes. To address this, a feature-based filtering mechanism is integrated, leveraging geometric properties such as rutting depth, width, and continuity to improve the separation of rutting clusters from other pavement distress types.
2.3.1. Preliminary Segmentation of the Point Cloud Based on the RANSAC Algorithm
The random sampling consensus algorithm (RANSAC) was proposed by Fischler et al. [
18]. It is assumed that the point cloud contains correct data, i.e., internal points, which can be described by the model, as well as external points, i.e., abnormal data, which cannot adapt to the mathematical model. Fit the model by continuous random sampling, test the model with unselected samples, and finally remove the influence of outliers to construct a basic subset consisting of only inlier data. The key to using the RANSAC algorithm for rutting region detection is how to construct a suitable rutting model to fit the geometry of the rutting. Specifically, the steps of using the RANSAC algorithm for point-cloud segmentation in this study include the following Algorithm 1:
| Algorithm 1: RANSAC for point-cloud segmentation |
| Input: Data_points, Threshold_Distance, Max_Iterations, Stop _Threshold, Sample_Size |
| Output: Best_Plane_Params, Best_Inlier_Set, Best_Outlier_Set, Best_lnlier_Ratio |
| (1) Best_Inlier_Ratio ← []; |
| (2) Best_Plane_Params ← []; |
| (3) Best_Inlier_Set ← [] |
| (4) Best_Outlier_Set ← []; |
| (5) for i = 1 to max_Iterations do |
| (6) randomSample ← RandomlySelectPoints(Data_Points, Sample_Size) |
| (7) Plane_Params ← FitPlane(randomSample)Inlier_Set← []; |
| Note: “← []” denotes assignment or retrieval of data from the same structured-light frame set used throughout the registration process (Steps 1,2, 3, 4, 7). |
2.3.2. Refined Segmentation of Rutting Regions Based on the DBSCAN Clustering Algorithm
The DBSCAN algorithm is widely used in data processing with high attribute characteristics [
19] and can divide data with high distribution density into clusters to generate information with low distribution density [
20]. The main purpose of the algorithm is to efficiently group candidate points into core points, boundary points, and outliers by generating clusters of any shape [
21]. The basic idea of this clustering algorithm is to treat the data in the area with high data space density as belonging to the same cluster. Compared with other clustering algorithms, this algorithm has high efficiency and is suitable for data of any shape. Therefore, this study uses the DBSCAN algorithm, which can effectively separate non-rutting regions, such as other damaged and misidentified regions, from rutting regions. Specifically, the steps of the DBSCAN algorithm are as follows:
(1) Selecting the hyperparameters Eps and MinPts according to the clustering stability
The DBSCAN algorithm requires two hyperparameters: Eps and MinPts. Eps determines the neighborhood radius around each point, while MinPts specifies the minimum number of points within that neighborhood to identify a core point. Set a series of reasonable Eps and MinPts, and run the DBSCAN algorithm to calculate the silhouette coefficient of each clustering result. The closer the silhouette coefficient is to 1, the more stable the clustering result and the higher the similarity of samples within the cluster. After computing the silhouette coefficients for all candidate values of Eps and MinPts, the combination of Eps and MinPts values with the highest stability is selected. The clustering results corresponding to the optimal Eps and MinPts can obtain similar clustering structures under different sampling conditions, showing better clustering stability and significance.
(2) Randomly selecting a point X from the data.
(3) Determining whether a point is a core point: find all points whose distance from point x is less than or equal to Eps, count the number of these points. If the number of data points in the Eps range exceeds MinPts, and mark the point as a core point and assign a new cluster label. Otherwise, the point is marked as noise.
(4) If point X is a core point, retrieve all density-reachable points from point X and add them to the same cluster.
(5) Visit all neighbors of the current point (distance less than Eps), if the neighbor has not been assigned to a cluster, assign it the same cluster label as point X.
(6) If the neighbors are also core points, recursively visit their neighbors and join them in the same cluster until there are no more core points within the range of Eps.
(7) Gradually expand the cluster by repeating steps (4) and (5) for each unvisited core sample.
(8) Until all core samples have been visited and all points in the dataset have been assigned to a cluster or marked as noise, the algorithm ends.
3. Experiments and Results Analysis
3.1. Experimental Design and Data Acquisition
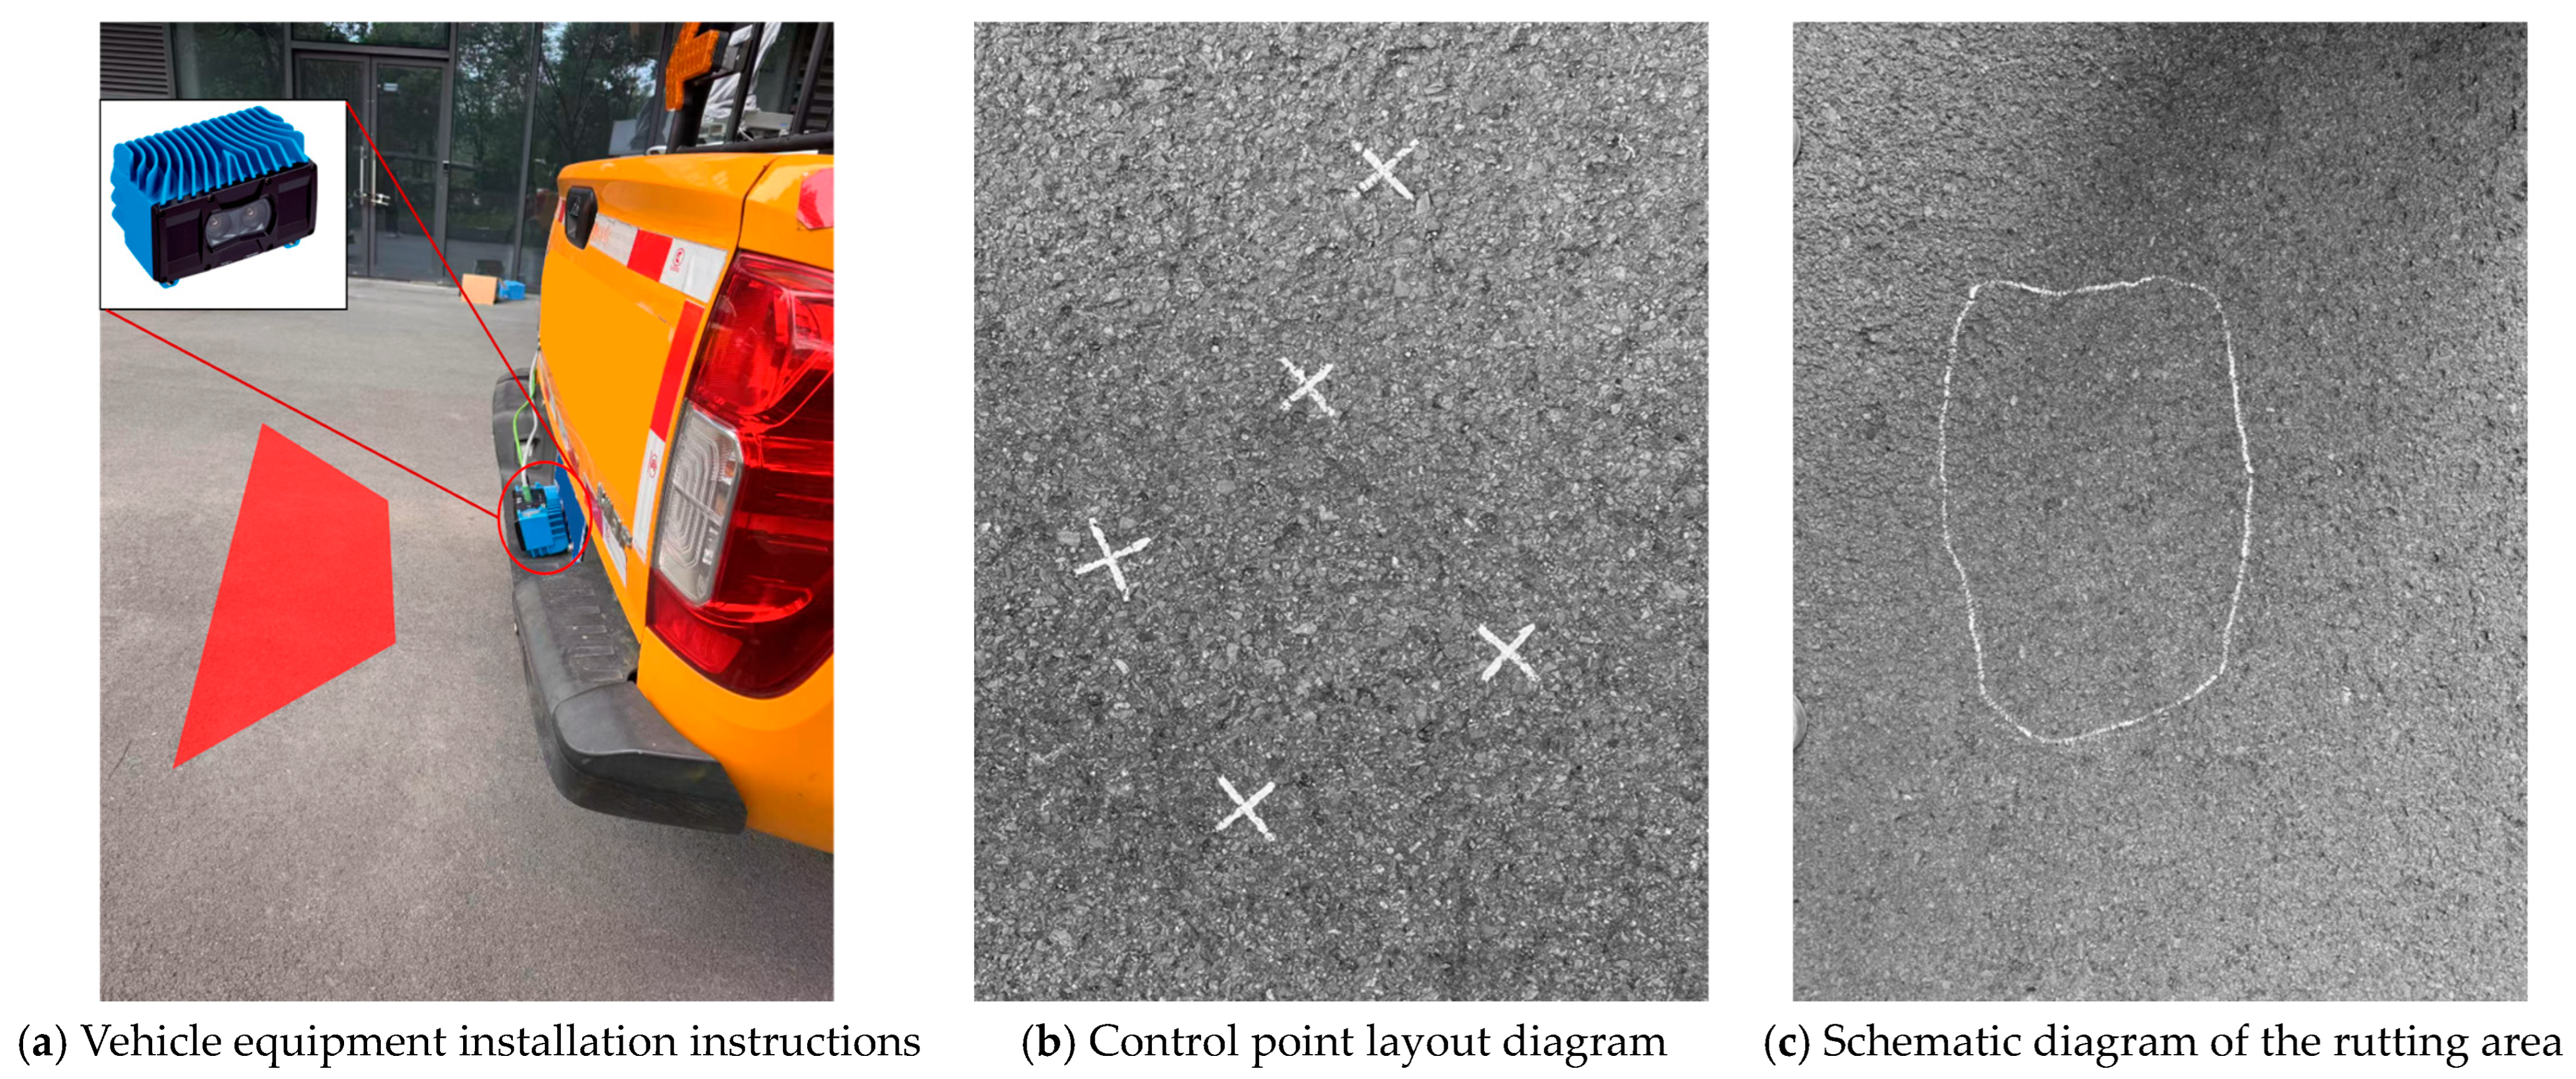
To evaluate the effectiveness and accuracy of the proposed methods in pavement reconstruction and rutting segmentation, a series of experiments was conducted, including point-cloud stitching and rutting region extraction. A key prerequisite for objective evaluation is the acquisition of accurate ground truth data, both for point-cloud registration and for rutting segmentation. To this end, manually placed cross markers and manually traced contour outlines were used to generate the corresponding reference datasets for each task. All experiments were performed on a Windows-based system using Python 3.14.0. The computational environment was equipped with an Intel Core i7 processor, 16 GB of RAM, and a dedicated NVIDIA GPU to accelerate point-cloud processing.
For the registration task, accurate correspondences between point clouds from adjacent frames are essential. In this study, we adopted a manual control point placement strategy in overlapping regions between scans. High-reflectivity markers were strategically distributed across the pavement surface to serve as reference targets. These markers produced strong intensity contrasts relative to the surrounding surface, enabling reliable detection even in visually complex conditions. Their uniform spatial distribution ensured sufficient coverage of the overlapping regions, which in turn enhanced the robustness and accuracy of the registration process.
Control point correspondences were extracted from the point-cloud data using a combination of reflectivity-based identification and manual labeling. These correspondences were then used to estimate the rigid transformation matrix between adjacent frames via the least squares method.
Similarly, ground truth for rutting segmentation was established by manually delineating the precise contours of rutting areas based on the reflective markers. This process ensured high-fidelity reference data for quantitative evaluation. The procedures for obtaining both registration and segmentation ground truth are illustrated in
Figure 7. Ground-truth rutting measurements were obtained following the standard manual rut-depth measurement procedure, with regional rut profiles measured along representative transverse sections. The reference segmentation results were further cross-verified by three experienced observers to ensure consistency and reduce annotation bias.
3.2. Evaluation of Full Road Point-Cloud Data Stitching
To validate the effectiveness of the proposed registration algorithm, a total of 102 sets of sequential pavement point clouds were collected across different surface conditions. Three representative scenarios were selected to comprehensively assess the performance of the algorithm under varying texture complexities: (1) smooth pavement, (2) manhole cover areas, and (3) marked road sections. These test cases reflect a gradient of feature richness—from feature-sparse surfaces to highly structured geometries—thereby providing a robust framework for evaluating both alignment accuracy and algorithmic robustness.
The smooth pavement represents a low-texture environment, where geometric variations are minimal and conventional registration methods typically struggle. The manhole cover area offers abundant geometric features, such as sharp corners and abrupt height changes, which are beneficial for traditional feature-based matching. The marked road section presents moderate geometric complexity and includes lane markings and reflectivity changes that contribute to registration accuracy.
Two metrics were employed to quantitatively assess registration accuracy: the point-to-point (P-P) distance, which reflects local registration precision at manually marked control points, and the point-to-plane (P-Pl) distance, which measures the deviation of a registered point from the fitted surface plane of the corresponding reference frame. The former captures micro-level alignment, while the latter reflects global surface consistency.
Two mainstream registration baselines were used for comparison: methods based on local feature description and deep learning-based registration methods. The local feature description method calculates the geometric characteristics of each point’s neighborhood to describe its local geometry, establish correspondences, and compute the transformation matrix. The FPFH (Fast Point Feature Histogram) [
22] method is chosen for this category. FPFH characterizes local features by analyzing the distribution of normal vectors and curvatures within a point’s neighborhood, offering high computational efficiency and strong noise robustness. For deep learning-based methods, the Deep Closest Point (DCP) [
23] method is selected. DCP integrates the traditional iterative closest point (ICP) algorithm with deep learning to address issues such as ICP’s susceptibility to local minima and sensitivity to initial values. By learning deep features of the point cloud, DCP establishes more robust correspondences, enabling more accurate point-cloud registration. In the experiment, the parameters for PointNet, used within DCP, are derived from pre-training on the SemanticKITTI dataset [
24].
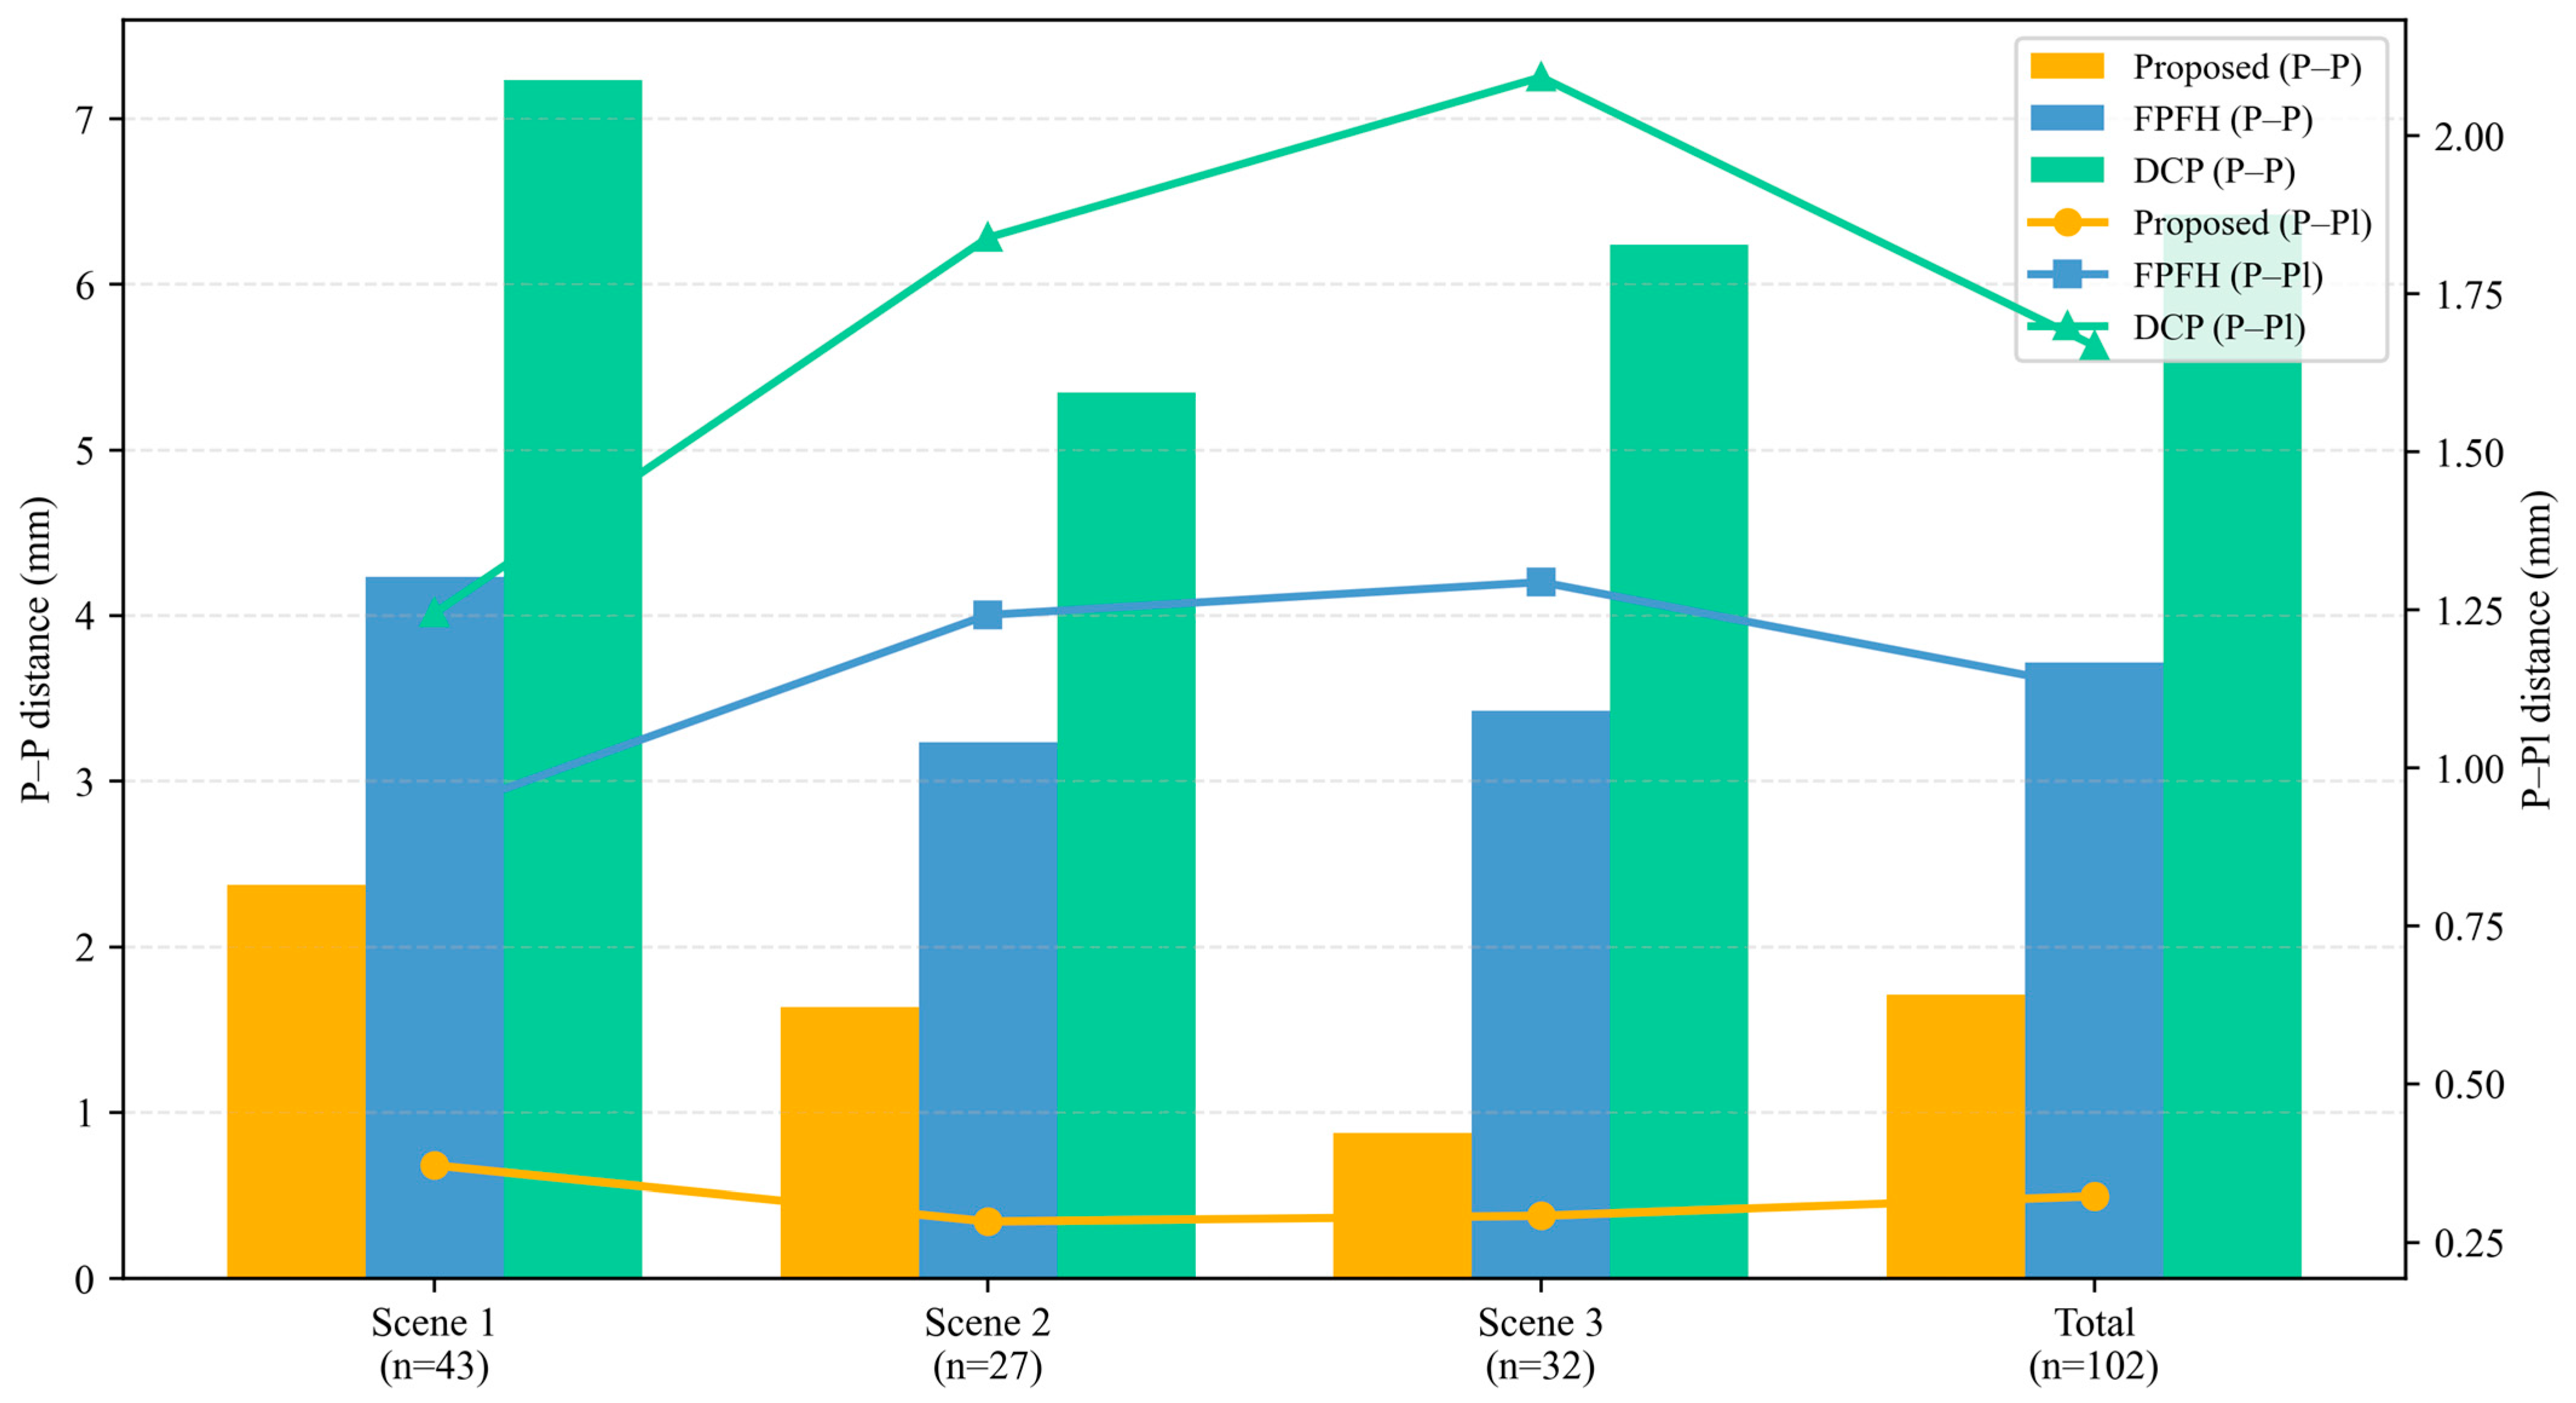
As illustrated in
Figure 8 and
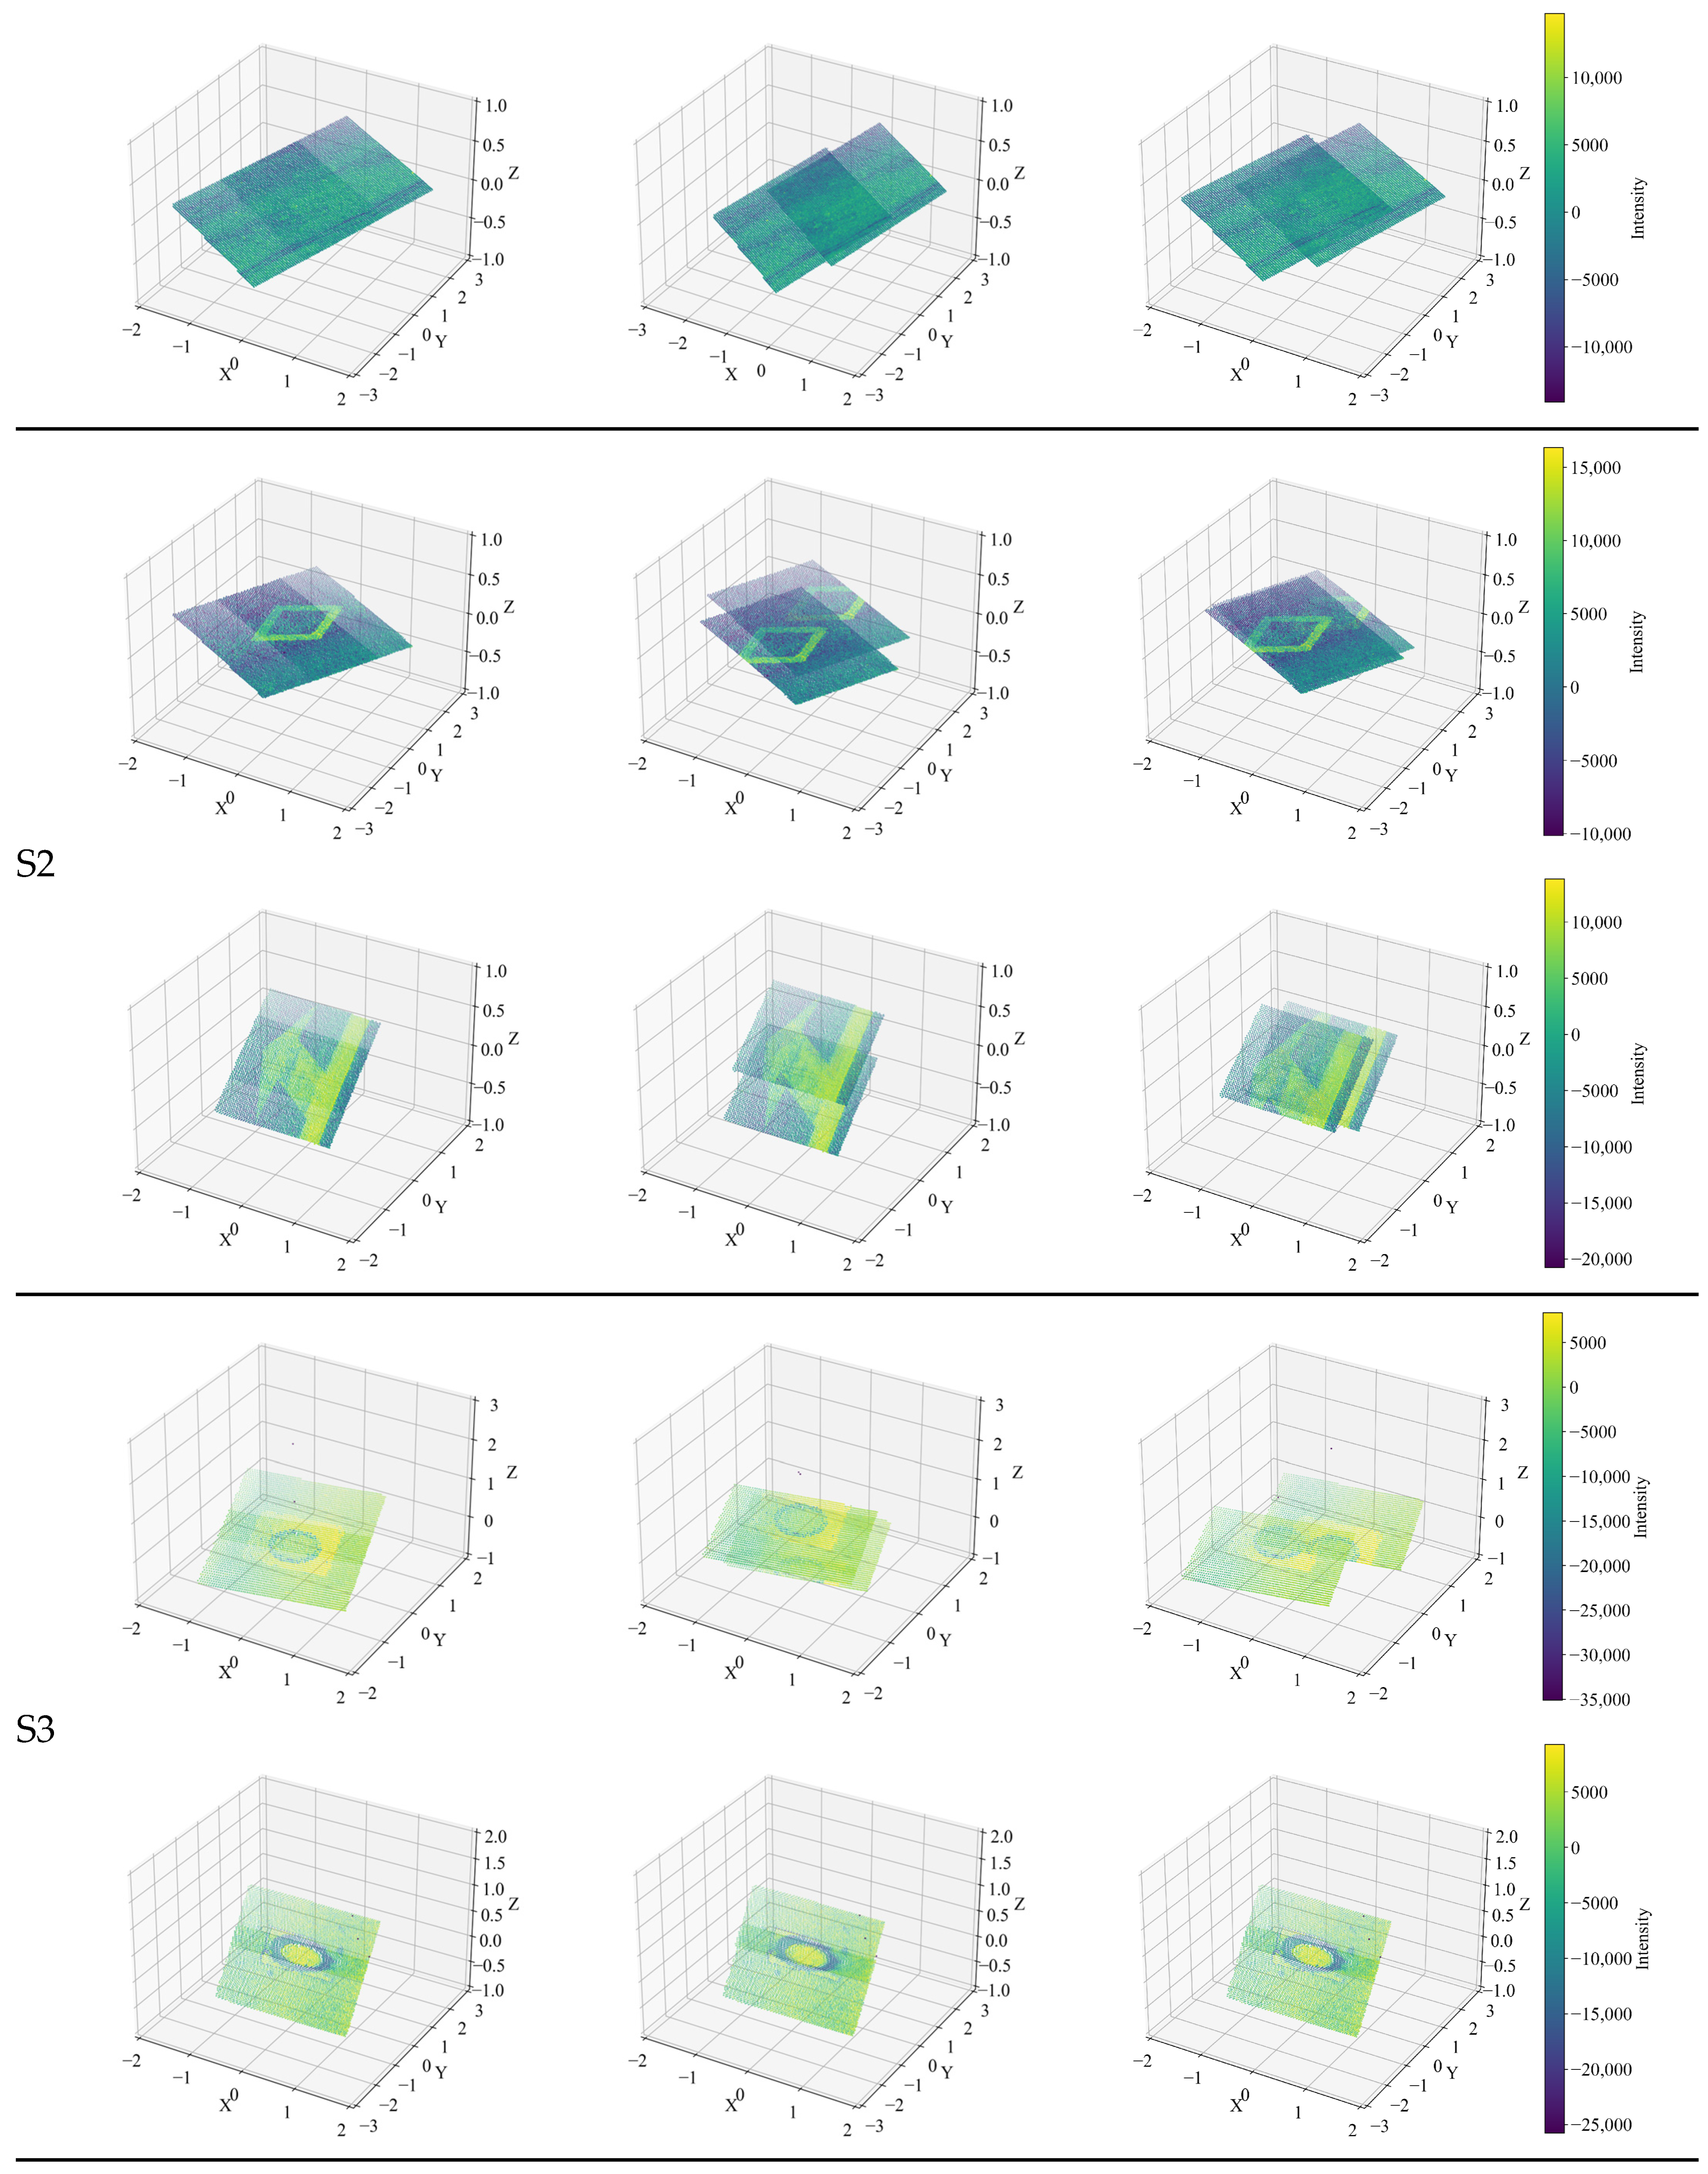
Table 2, the proposed method consistently outperforms both baselines across all test scenarios. In the smooth pavement scenario, where both FPFH and DCP exhibit significant degradation due to the absence of distinct geometric cues, the proposed method achieves a 59.98% reduction in P-Pl distance compared to FPFH and 70.20% compared to DCP. This demonstrates the value of incorporating wavelet-based texture features, which remain effective even in low-feature environments. As illustrated in
Figure 9, both point-to-point (P-P) and point-to-plane (P-Pl) registration errors consistently decrease when applying the proposed texture-aware approach. The bar-line dual-axis representation highlights that the proposed method achieves substantially lower mean P-P and P-Pl distances across all three pavement scenarios. In particular, the performance gap is most pronounced under low-texture conditions (Scene 1), where conventional descriptors (FPFH and DCP) show large deviations. These results confirm that the multi-scale wavelet features effectively enhance correspondence stability and geometric alignment accuracy.
In the manhole cover area, all methods benefit from the rich feature set, yet the proposed method still achieves the highest accuracy. Interestingly, it also exhibits greater robustness against potential false matches introduced by repetitive patterns (e.g., similar corners), which often mislead purely geometry-driven algorithms. This suggests that the integrated use of multi-scale texture and geometric context helps disambiguate confusing regions.
For the marked road section, the proposed method shows a 49.38% improvement in P-P distance over FPFH and 69.36% over DCP, highlighting its ability to leverage both reflectance and structural continuity for improved matching.
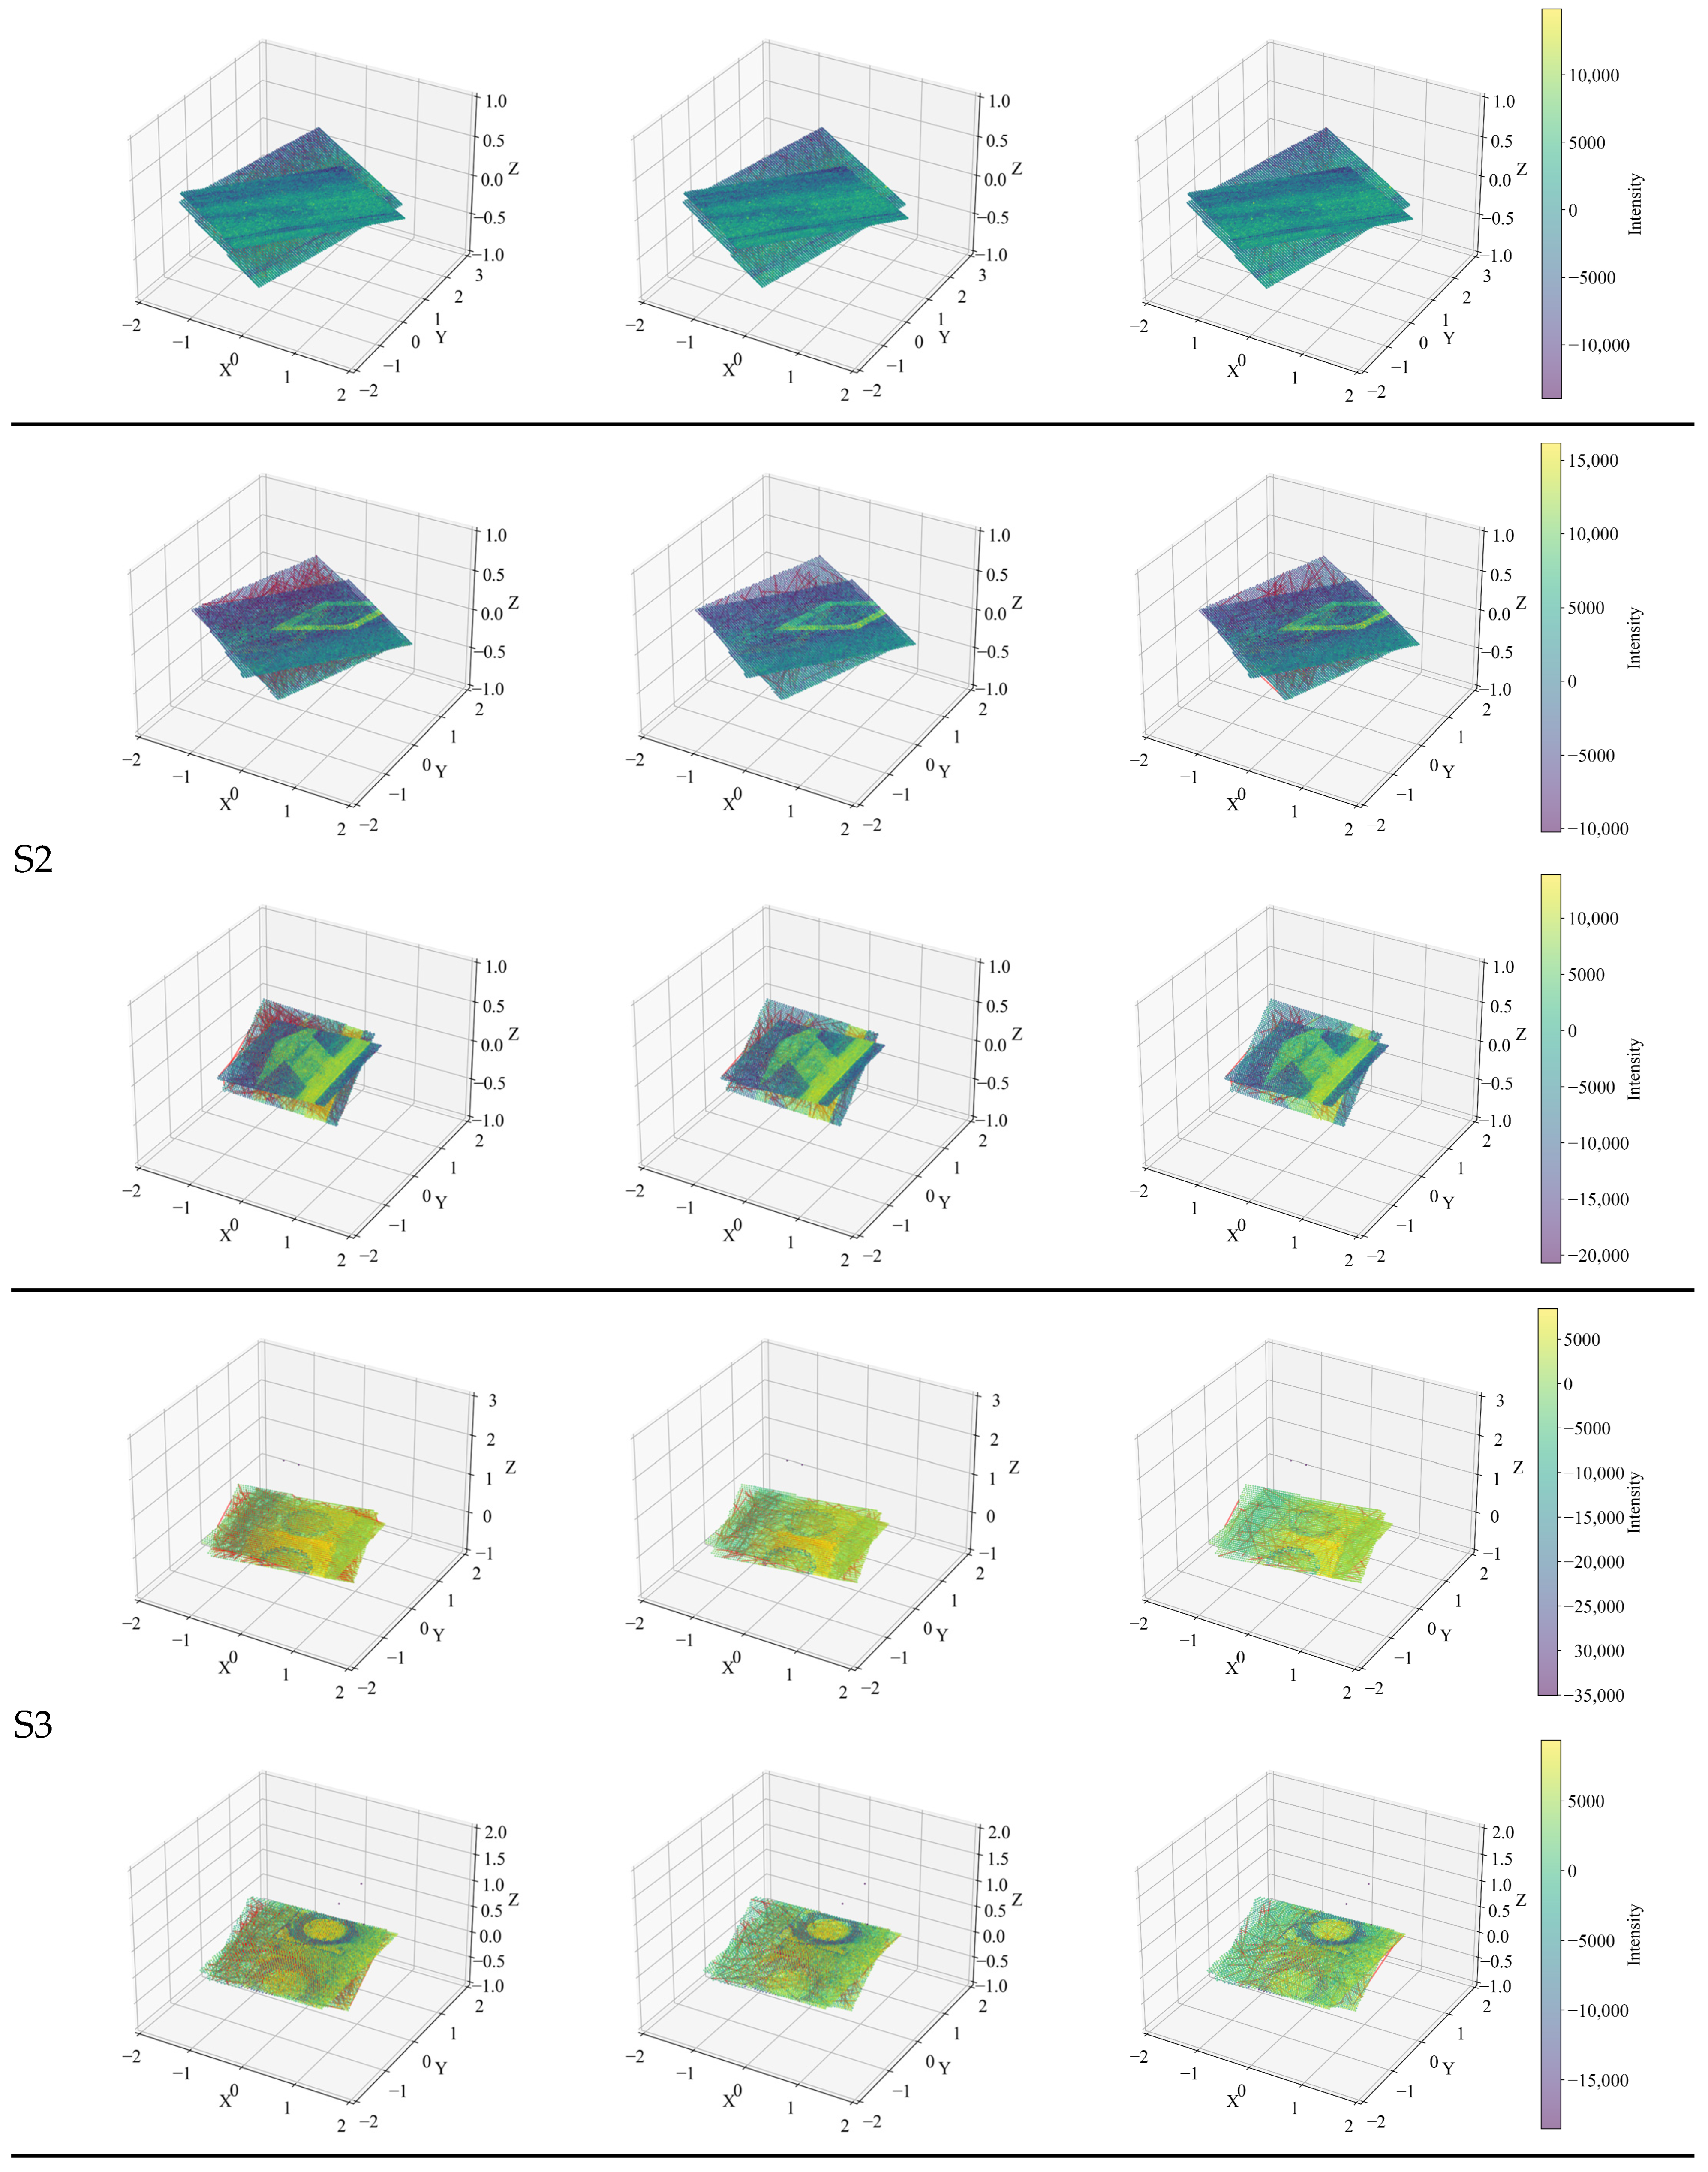
Figure 10 further visualizes the feature correspondences generated by each method. The proposed algorithm exhibits clearer, more consistent matching across all frames, particularly in low-texture areas. The continuity and spatial alignment in the resulting point cloud demonstrate the algorithm’s capability for precise, large-scale pavement reconstruction.
3.3. Evaluation of Rutting Region Segmentation
To comprehensively evaluate the performance of the proposed rutting region segmentation method, this section presents quantitative and qualitative comparisons with classical segmentation approaches. The evaluation is conducted on manually annotated rutting samples obtained from the processed structured light point-cloud datasets.
3.3.1. Evaluation Metrics
Three commonly used metrics in segmentation tasks are adopted to assess the accuracy and reliability of the proposed method: precision, recall, and F1-score. Precision reflects the proportion of correctly segmented rutting points among all the points predicted as rutting, while recall represents the proportion of correctly segmented rutting points among all the ground-truth rutting points. The F1-score, as the harmonic mean of precision and recall, is used to provide a comprehensive evaluation of segmentation performance. The metrics are computed as follows:
where TP, FP, and FN denote the number of true positives, false positives, and false negatives, respectively.
3.3.2. Baseline Methods for Comparison
To verify the effectiveness of the proposed segmentation framework based on improved RANSAC-DBSCAN, two widely used classical geometric segmentation methods are selected as baseline models. These methods are chosen not only for their prevalence in pavement surface analysis but also because their principles represent two distinct segmentation strategies.
Standard RANSAC plane fitting: This method fits a dominant plane to the pavement point cloud and detects rutting regions as deviations from the fitted surface. Its advantage lies in robustness to outliers and efficiency in modeling flat surfaces, making it suitable for identifying local deformations on the pavement.
Region Growing segmentation: This method clusters points by expanding from seed points based on smoothness constraints, such as the angle between neighboring point normals and curvature thresholds. It is effective in preserving continuous surface geometry and is sensitive to subtle local changes, which can be useful for detecting mild rutting features.
These two algorithms represent two typical strategies in point-cloud segmentation: model-based fitting (RANSAC) and region-based clustering (Region Growing). Their inclusion ensures a comprehensive and fair comparison, covering both global surface modeling and local geometric aggregation approaches.
It is noted that deep learning-based segmentation models are not considered in this study, primarily due to their reliance on large volumes of labeled training data and high computational demands. Given that rutting is a relatively rare distress type and difficult to annotate extensively, traditional methods are more suitable for this task, especially in engineering applications requiring interpretability and real-time performance.
3.3.3. Comparative Results and Analysis
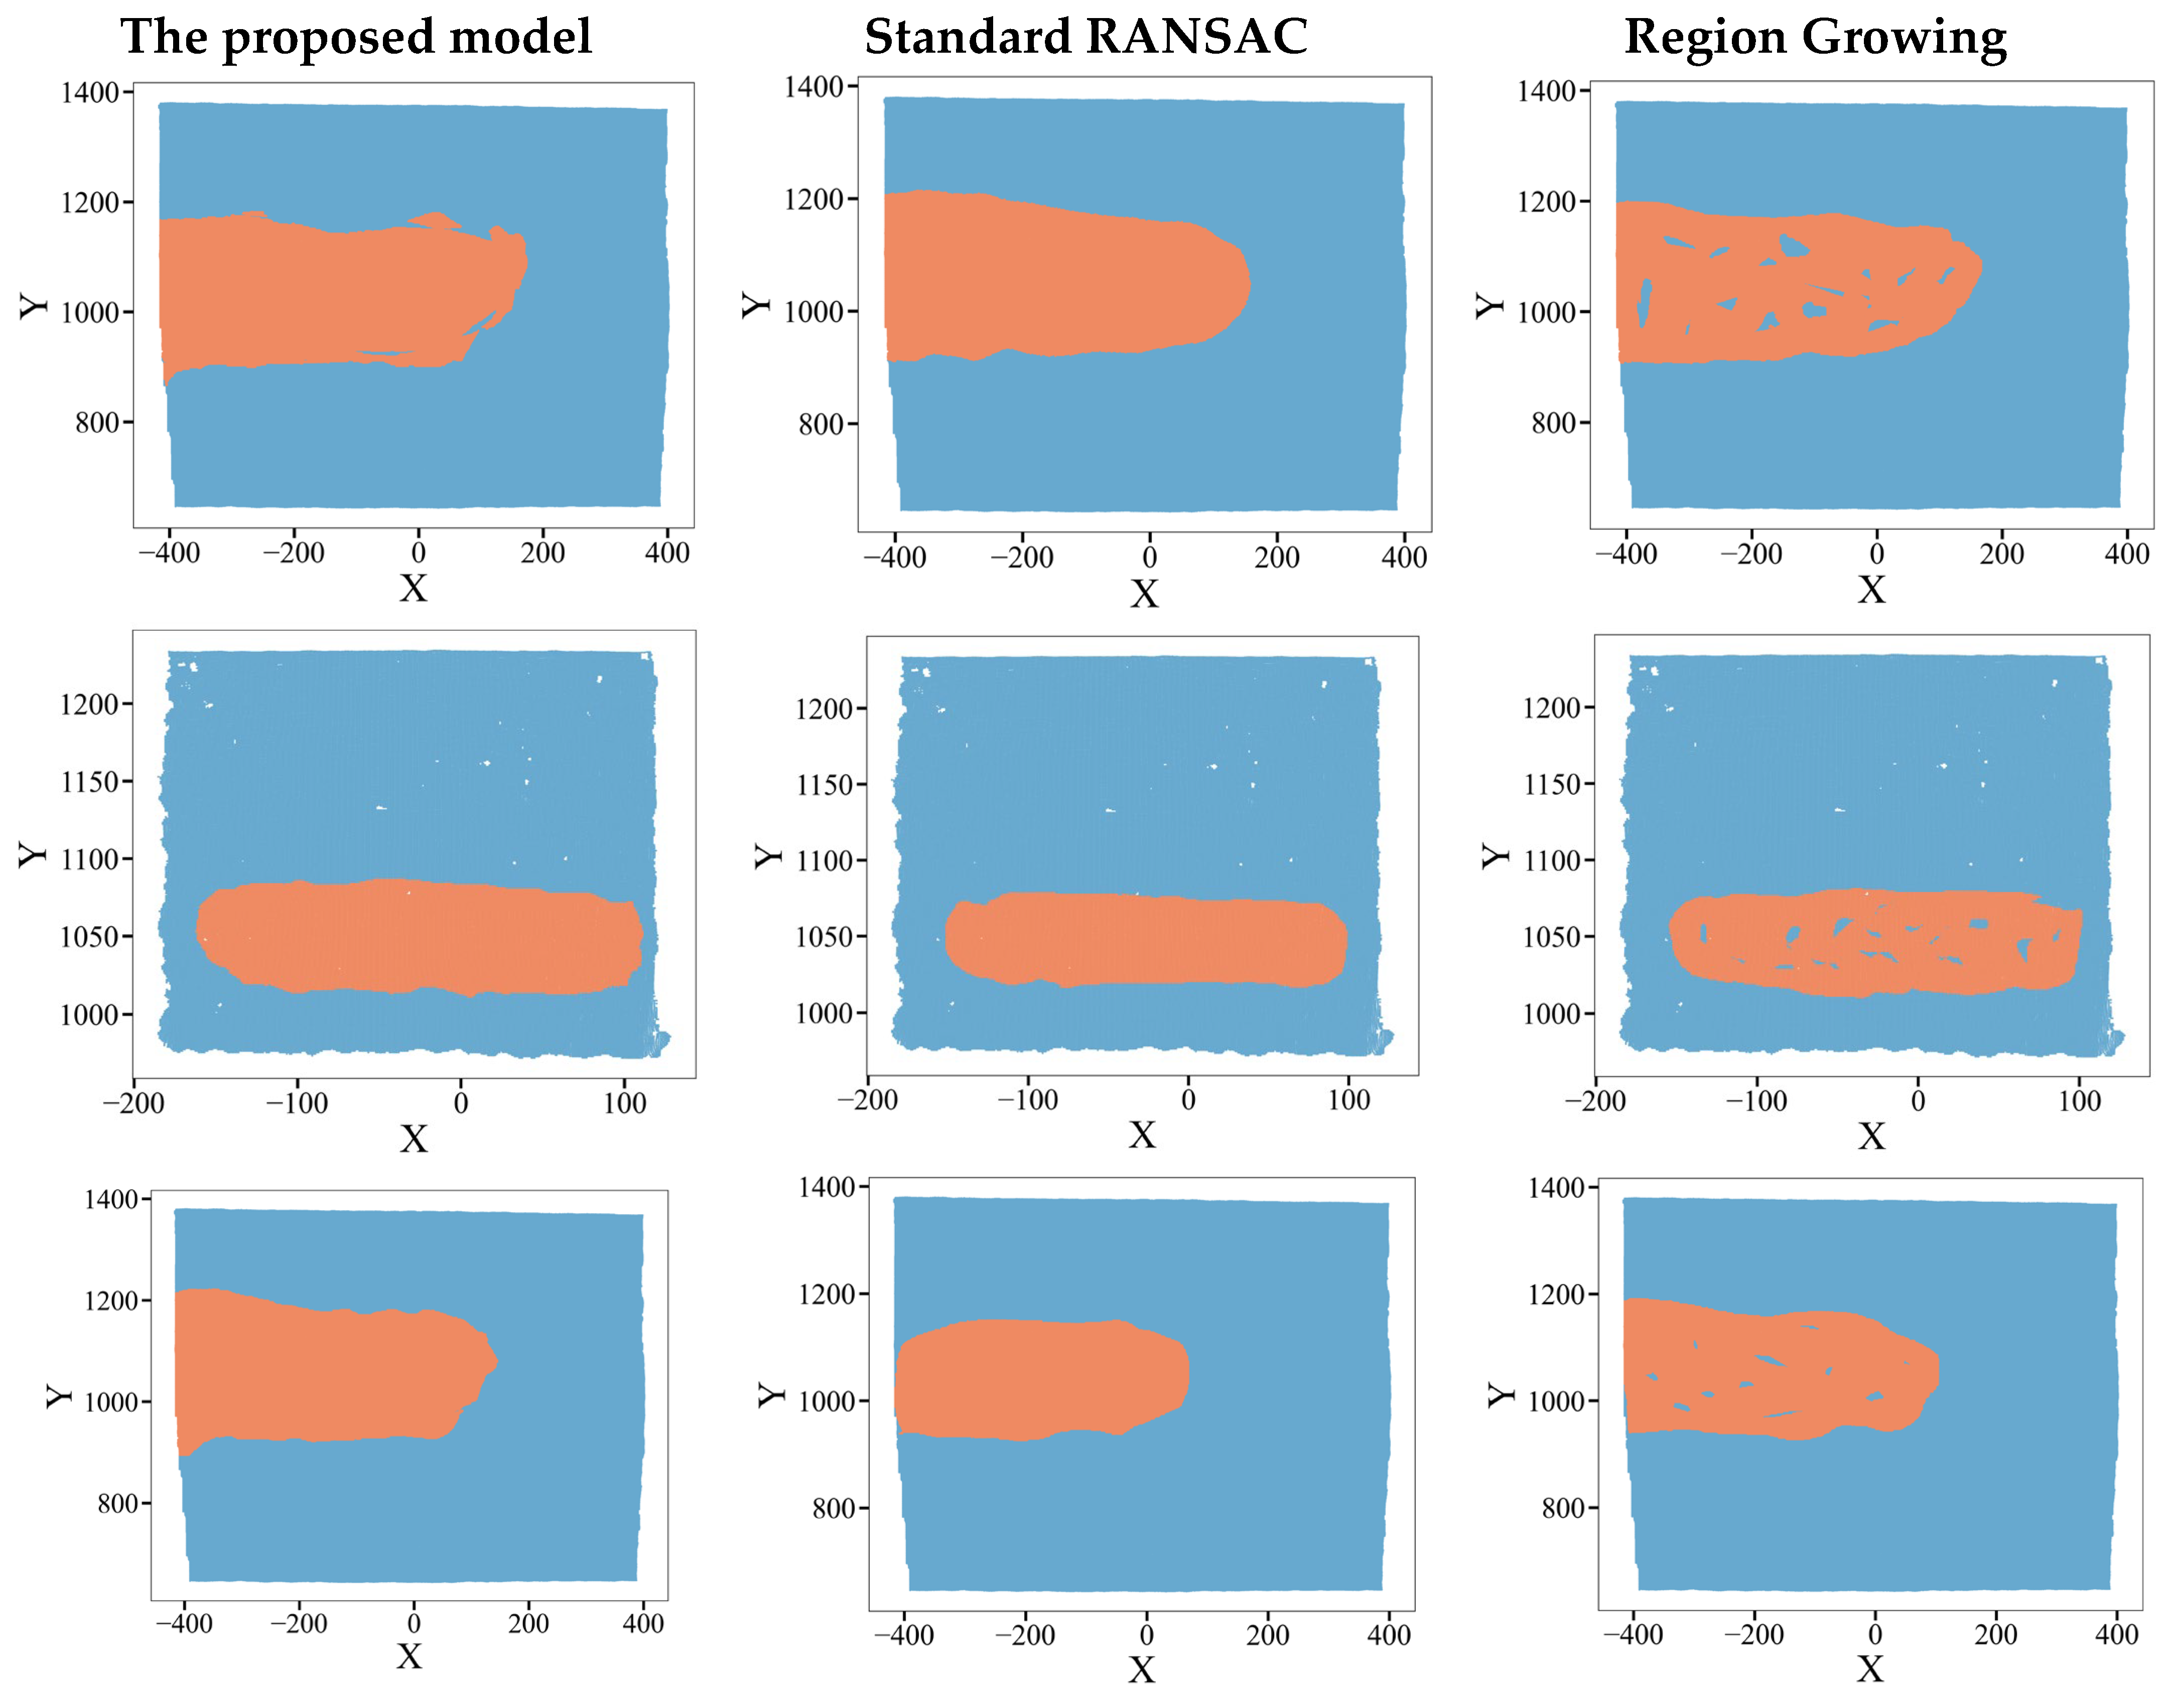
The comparative results of the three segmentation methods are illustrated in
Figure 11, which presents both visual and quantitative evaluations. As shown, the proposed method achieves significantly higher segmentation accuracy, particularly in cases of mild rutting or irregular geometries.
The quantitative performance is summarized in
Table 3, where the proposed method outperforms both baseline methods with an average F1-score improvement of approximately 15%. This improvement is attributed to two main aspects: (1) the integration of multi-scale texture information from the wavelet transform enhances the initial plane fitting accuracy, and (2) the density-aware DBSCAN clustering improves boundary preservation and reduces segmentation noise.
Visually, the proposed method produces more continuous and precise rutting boundaries. As shown in
Figure 11, Region Growing tends to over-fragment the rutting region, while standard RANSAC often oversimplifies the boundary geometry. In contrast, the proposed method yields compact and well-aligned segmentation contours that closely match the ground-truth labels.
To assess computational efficiency, we measured the average runtime of each processing stage on an Intel i7-12700 CPU (32 GB RAM). The proposed pipeline required approximately 4.8 s per full-section reconstruction, including 1.8 s for wavelet-based feature extraction, 0.9 s for SVD registration, and 2.1 s for RANSAC-DBSCAN segmentation. In comparison, the FPFH + Region Growing baseline consumed about 18.1 s, demonstrating a 3.8× speed improvement while maintaining higher accuracy. The efficiency gain results mainly from the compact multi-scale feature representation and reduced correspondence search space.
In summary, the proposed segmentation algorithm demonstrates superior performance in detecting full-section rutting under limited-data and real-time constraints, making it a practical and efficient solution for pavement maintenance and safety monitoring.
4. Conclusions
This study presents an integrated framework for full-section pavement rutting detection based on area-array structured-light sensing. The proposed methodology overcomes the long-standing challenge of insufficient surface features in pavement scenes by introducing a 2D wavelet transform for multi-scale texture extraction, enabling accurate and stable point-cloud registration even on low-texture asphalt. In addition, an improved RANSAC-DBSCAN segmentation scheme enhances the precision and robustness of rut-region delineation, forming an end-to-end workflow from acquisition to quantitative analysis.
Experimental validation on 102 multi-frame pavement point clouds confirms that the proposed approach achieves significantly higher registration accuracy than both classical local descriptors (FPFH) and deep-learning-based methods (DCP), with a 71.31% reduction in point-to-plane distance compared to FPFH and an 80.64% reduction compared to DCP. The method also maintains superior adaptability under complex surface conditions such as manhole cover regions, demonstrating its robustness and generality. From a scientific perspective, this work provides a new pathway for low-cost, marker-free 3D deformation detection, establishing a theoretical and methodological bridge between structured-light imaging and high-precision pavement evaluation. The results reveal how texture-geometry coupling through multi-scale wavelet encoding can improve correspondence stability in otherwise feature-sparse environments—an insight extendable to other infrastructure-sensing tasks.
For rutting region segmentation, the improved RANSAC-DBSCAN method outperforms standard RANSAC and Region Growing algorithms, achieving an average F1-score of 90.5%, representing a 15% improvement over baseline methods. These results confirm the method’s capacity for precise detection of spatially distributed rutting under real-world conditions. Beyond its accuracy advantages, the proposed pipeline offers practical efficiency—achieving full-section processing in under 5 s per scene, which is promising for near real-time pavement inspection.
Overall, this paper provides an efficient, scalable, and cost-effective solution for 3D pavement condition assessment. The proposed method enables accurate reconstruction and detection of full-section rutting without the need for inertial navigation or labor-intensive preprocessing. The method is currently validated under controlled low-speed acquisition environments (≤15 km/h) due to the frame rate constraints of the structured light system. High-speed data collection remains a challenge. Future work will focus on real-time deployment, extension to other pavement distresses (e.g., cracking, potholes), and integration with multi-sensor inspection platforms for large-scale intelligent road infrastructure monitoring. Integrating a higher-speed acquisition module, such as a high-frequency line-scan laser, is also needed to explored to enable the system to operate effectively at highway speeds (≥80 km/h). The current experiments were conducted under controlled illumination and stationary conditions. In field applications, extreme sunlight can reduce structured-light stripe contrast and affect texture extraction, while vehicle motion or vibration may cause frame misalignment and registration noise. Future work will also focus on enhancing system robustness through optical filtering, adaptive exposure control, and inertial-assisted motion compensation to enable reliable operation in dynamic outdoor environments.
Although this study quantitatively evaluated segmentation performance using standard confusion-matrix-based metrics (precision, recall, and F1-score), we acknowledge that such measures may not fully capture the robustness and discrimination capacity of the proposed RANSAC-DBSCAN segmentation. Future work will include more elaborate statistical evaluations, such as robustness analysis under synthetic noise perturbations, cross-scene generalization experiments, and significance testing across larger datasets. These enhancements will help to further validate the method’s reliability and applicability to diverse pavement conditions.
