Article

Biodata-Driven Knowledge Graph Recommendation System: Fusing Foot and Leg Characteristics for Personalised Shoe Recommendation

School of Industrial Design, Hubei University of Technology, Wuhan 430068, China
*
Author to whom correspondence should be addressed.
Appl. Sci. 2025, 15(20), 11281; https://doi.org/10.3390/app152011281
Submission received: 27 August 2025 / Revised: 14 October 2025 / Accepted: 18 October 2025 / Published: 21 October 2025

Featured Application

This study integrates biometric data into a footwear fitting system, addressing the issues of cold start and data sparsity in recommendation systems, and provides ergonomic shoe recommendations tailored to individual body structures. Furthermore, this study offers solutions to the following challenges: (1) Children’s Footwear Selection: Addresses the issue where shoes may be the correct size but do not match the child’s body structure. (2) Elderly Footwear Selection: Responds to changes in bone structure that occur with aging and improves the inadequacy of traditional shoe designs for the elderly. (3) Women’s Footwear: Solves the issue of adapting men’s shoe sizes for women, enhancing the overall fit and comfort. (4) Footwear for Specific Groups: Provides solutions for specific populations, such as diabetic patients and high-heel wearers, helping to reduce the risk of foot-related diseases. (5) Sports Footwear: Offers personalized footwear recommendations for specific activities, such as soccer shoes or basketball shoes, based on performance and ergonomic needs. This research presents a footwear fitting system based on foot pressure and leg shape, addressing the issue of shoes being the right size but not matching body structure. Drawing upon medical and ergonomic research, it offers new solutions for optimal shoe fitting that go beyond traditional sizing methods.

Abstract

(1) This study aims to enhance the precision of ergonomic fitting in traditional shoe size selection by integrating literature and measured biometric data. (2) A correlation table between biometric features and shoe models was established, which was then embedded into a knowledge graph (KG) for visual, accurate recommendations. The experiment employed pressure sensors and depth cameras to collect biometric data from the foot and leg, evaluating the consistency of the system’s recommendations and user satisfaction. (3) The results indicate that the biometric-driven shoe recommendation system significantly outperforms traditional size-based systems in terms of stability and satisfaction. (4) The KG framework has notably improved ergonomic adaptability in the early prototype stage, offering a viable technological approach for intelligent shoe selection and holding significant potential for further optimization.

1. Introduction

Footwear compatibility has become a central focus in biomechanics and medicine, influencing both comfort and long-term musculoskeletal health [1,2,3]. However, for consumers, the process of selecting footwear that meets the needs of diverse populations remains inadequate. Traditional shoe sizing systems are primarily based on foot length, overlooking individual variations in arch morphology, gait mechanics, and plantar pressure distribution [4,5]. Studies have shown that 83.2% of people wear improperly fitted shoes, and 55.5% of patients wear shoes with rigid, non-cushioned insoles lacking built-in arch support. Participants wearing ill-fitting shoes experience more severe heel pain, which restricts their daily activities [6]. Among school-aged children (7–12 years old) in Shanghai, the overall prevalence of flatfoot is 56.1% [7]. In healthy working adults, the prevalence rates of high-arched and flatfoot conditions are 50.8% and 34.2%, respectively [8]. Inappropriate footwear can trigger a series of biomechanical problems, such as increased knee varus torque and compensatory ankle supination, which may contribute to long-term musculoskeletal health issues [9,10,11,12,13]. Vulnerable groups such as children, the elderly, and diabetic patients face amplified risks due to structural foot variations and sensory impairments [14,15,16,17,18]. Notably, the absence of gender-specific design further complicates the issue. Women’s footwear is often derived from simple scaling of male models, failing to accommodate narrower female foot structures and the biomechanical load redistribution caused by high-heeled shoes [19].
Additionally, footwear characteristics such as material, shape, and structure are intrinsically linked to biomechanical function. The mechanical properties of shoe materials influence the progression of compensatory biomechanical responses [11]. Proper footwear selection should therefore not be based solely on aesthetics but should account for individual needs. Well-fitting shoes can have a significant impact on foot health outcomes [1]. The footwear industry is in urgent need of a multimodal recommendation system that integrates plantar pressure distribution, leg morphology, and shoe attributes. This system would optimize both anatomical and functional compatibility, overcoming the limitations of the traditional shoe sizing system and providing a more precise biomechanical framework for personalized shoe design.
Although previous studies have examined the effects of footwear on foot health, most have concentrated on a single factor, overlooking individual variations among consumers. The conventional shoe sizing system, based solely on foot length, proves inadequate in meeting the diverse needs of different populations, particularly regarding biomechanical differences such as arch shape, gait, and plantar pressure. In response, this study proposes a multimodal shoe recommendation system that integrates plantar pressure, leg characteristics, and shoe attributes. This approach overcomes the limitations of traditional sizing systems, offering more precise and personalized footwear options. The findings of this research address a technological gap in shoe design and contribute to the industry’s progression toward a more scientific and precise approach.

2. Research Background and Related Work

2.1. Cognitive Pathways in Shoe Selection

The process of shoe selection is fundamentally influenced by the user’s perceptual and emotional experiences [20]. The input methodology has transitioned from fragmented biometric data to a more comprehensive biological profile structured for knowledge graph integration: heterogeneous data, including gait, foot shape, and pressure distribution, are modeled, summarized, and linked within the graph. This creates a high-dimensional, low-redundancy individual biological profile. Using this profile, users obtain the physical attributes and behavioral data of various shoe models, incorporating market feedback. Through a process of cognitive decoding, users internalize these inputs into emotional values such as functional fit and comfort [21]. The three-dimensional decomposition of physical properties, behavioral data, and market information, coupled with the integration of biological information driven by the knowledge graph, collectively facilitates the precise output of emotional cognition, as depicted in Figure 1.

2.2. Biometric Data and the Mapping of Shoe Features

2.2.1. Deconstructing Shoe Features

The features of footwear can be classified into three categories: physical properties, behavioral data, and market information. Physical properties include the materials, structure, and shape of the footwear, with a primary focus on the intrinsic characteristics of the shoe itself. Behavioral data encompasses gait, pressure distribution, and contextual factors, emphasizing the individual’s biomechanical features, such as gait patterns and foot pressure distribution. These behavioral metrics reflect the biomechanical performance of the individual, whether in motion or at rest, and directly influence the comfort and fit of the footwear. While physical properties pertain to the hardware characteristics of the shoe, behavioral data focuses on how well the footwear accommodates the user’s dynamic movements and biomechanical needs. This classification method constitutes an original framework, developed through a comprehensive analysis of footwear adaptability and the alignment between footwear and user biomechanics. Although some aspects of behavioral data have been discussed in the literature, the classification system proposed in this study aims to provide a more precise biomechanical perspective for footwear design.
Market data was derived from the top 5 best-selling sports shoes in the outdoor category on Tmall and JD.com over the last 12 months, serving as objective samples. The reviews, sales figures, and competitor data were collected from the public rankings on these platforms, as well as reports from QuestMobile and Business Assistant. From these sources, high-frequency indicators were extracted to construct a feature-element encoding matrix (Table 1), which facilitated the mapping of feature categories to subcategories. The data was collected from January 2024 to December 2024, ensuring the reproducibility of the results.
We selected the top 5 best-selling sports shoe models from the Tmall and JD platforms as samples, representing 10 brands and 50 distinct shoe styles. The sample selection adhered to clear criteria: first, sales performance was the primary criterion, and only the top 5 best-selling models were included to ensure the sample accurately reflected the dominant market demand. Second, to maintain the focus and relevance of the analysis, only shoes from the sports and outdoor category were considered, excluding other categories that did not align with the research objectives, such as fashion or high-heeled shoes. Moreover, data was sourced exclusively from Tmall and JD, two of the leading e-commerce platforms, ensuring the representativeness and broad applicability of the dataset.
In terms of exclusion criteria, any models that did not rank among the top 5 in sales, non-sports or non-casual functional shoes, and those with incomplete data (e.g., missing reviews, sales figures, or competitor data) were excluded from the sample. These exclusion criteria guaranteed the completeness, accuracy, and market representativeness of the final dataset.
In the preprocessing phase of the text data, stopwords and unstructured information (e.g., punctuation) were removed from the reviews, and stemming techniques were applied to standardize the vocabulary. A unified word segmentation method was adopted to ensure data consistency and facilitate subsequent analysis.

2.2.2. Analysis of Biometric Data

This study investigates high arch feet, flat feet, knee valgus, and knee varus. Relevant peer-reviewed literature from the past decade was retrieved from databases such as Google Scholar and Web of Science, with data on arch types and femorotibial angles being extracted and standardized [8,9,10,11,12,13,14,15]. A dual review process was employed to ensure data quality, and a data correlation table (Table 2) was constructed, summarizing both the research findings and conclusions. Multiple rounds of review were conducted to ensure accuracy, providing a basis for future research.
The selection of biomechanical indicators is primarily based on their relevance to the functional compatibility of footwear. For instance, the correlation between plantar pressure distribution and the comfort of insoles, as well as the design of the shoe sole, has been validated through numerous clinical studies, making these factors key biomechanical indicators. These indicators were chosen not only because of their direct association with shoe comfort and long-term foot health but also due to their frequent appearance in the literature and their established role in supporting the functionality of footwear.

2.2.3. Mapping of Shoe Features and Biometric Data

Based on the information in Table 1 and Table 2, the subcategories are consolidated, and key features for each category are extracted through the coding matrix, resulting in a mapping between shoe features and biometric data (see Table 3). During the mapping process, care is taken to ensure the accurate alignment of foot-leg features with the shoe feature subcategories. This alignment is grounded in scientific evidence and industry standards, minimizing the influence of market-driven data. The mapping outcomes not only form the relational edges within the KG but also provide interpretable pathways for future recommendations and design enhancements.

2.3. Shoe Recommendation Approach Integrating Biological Data

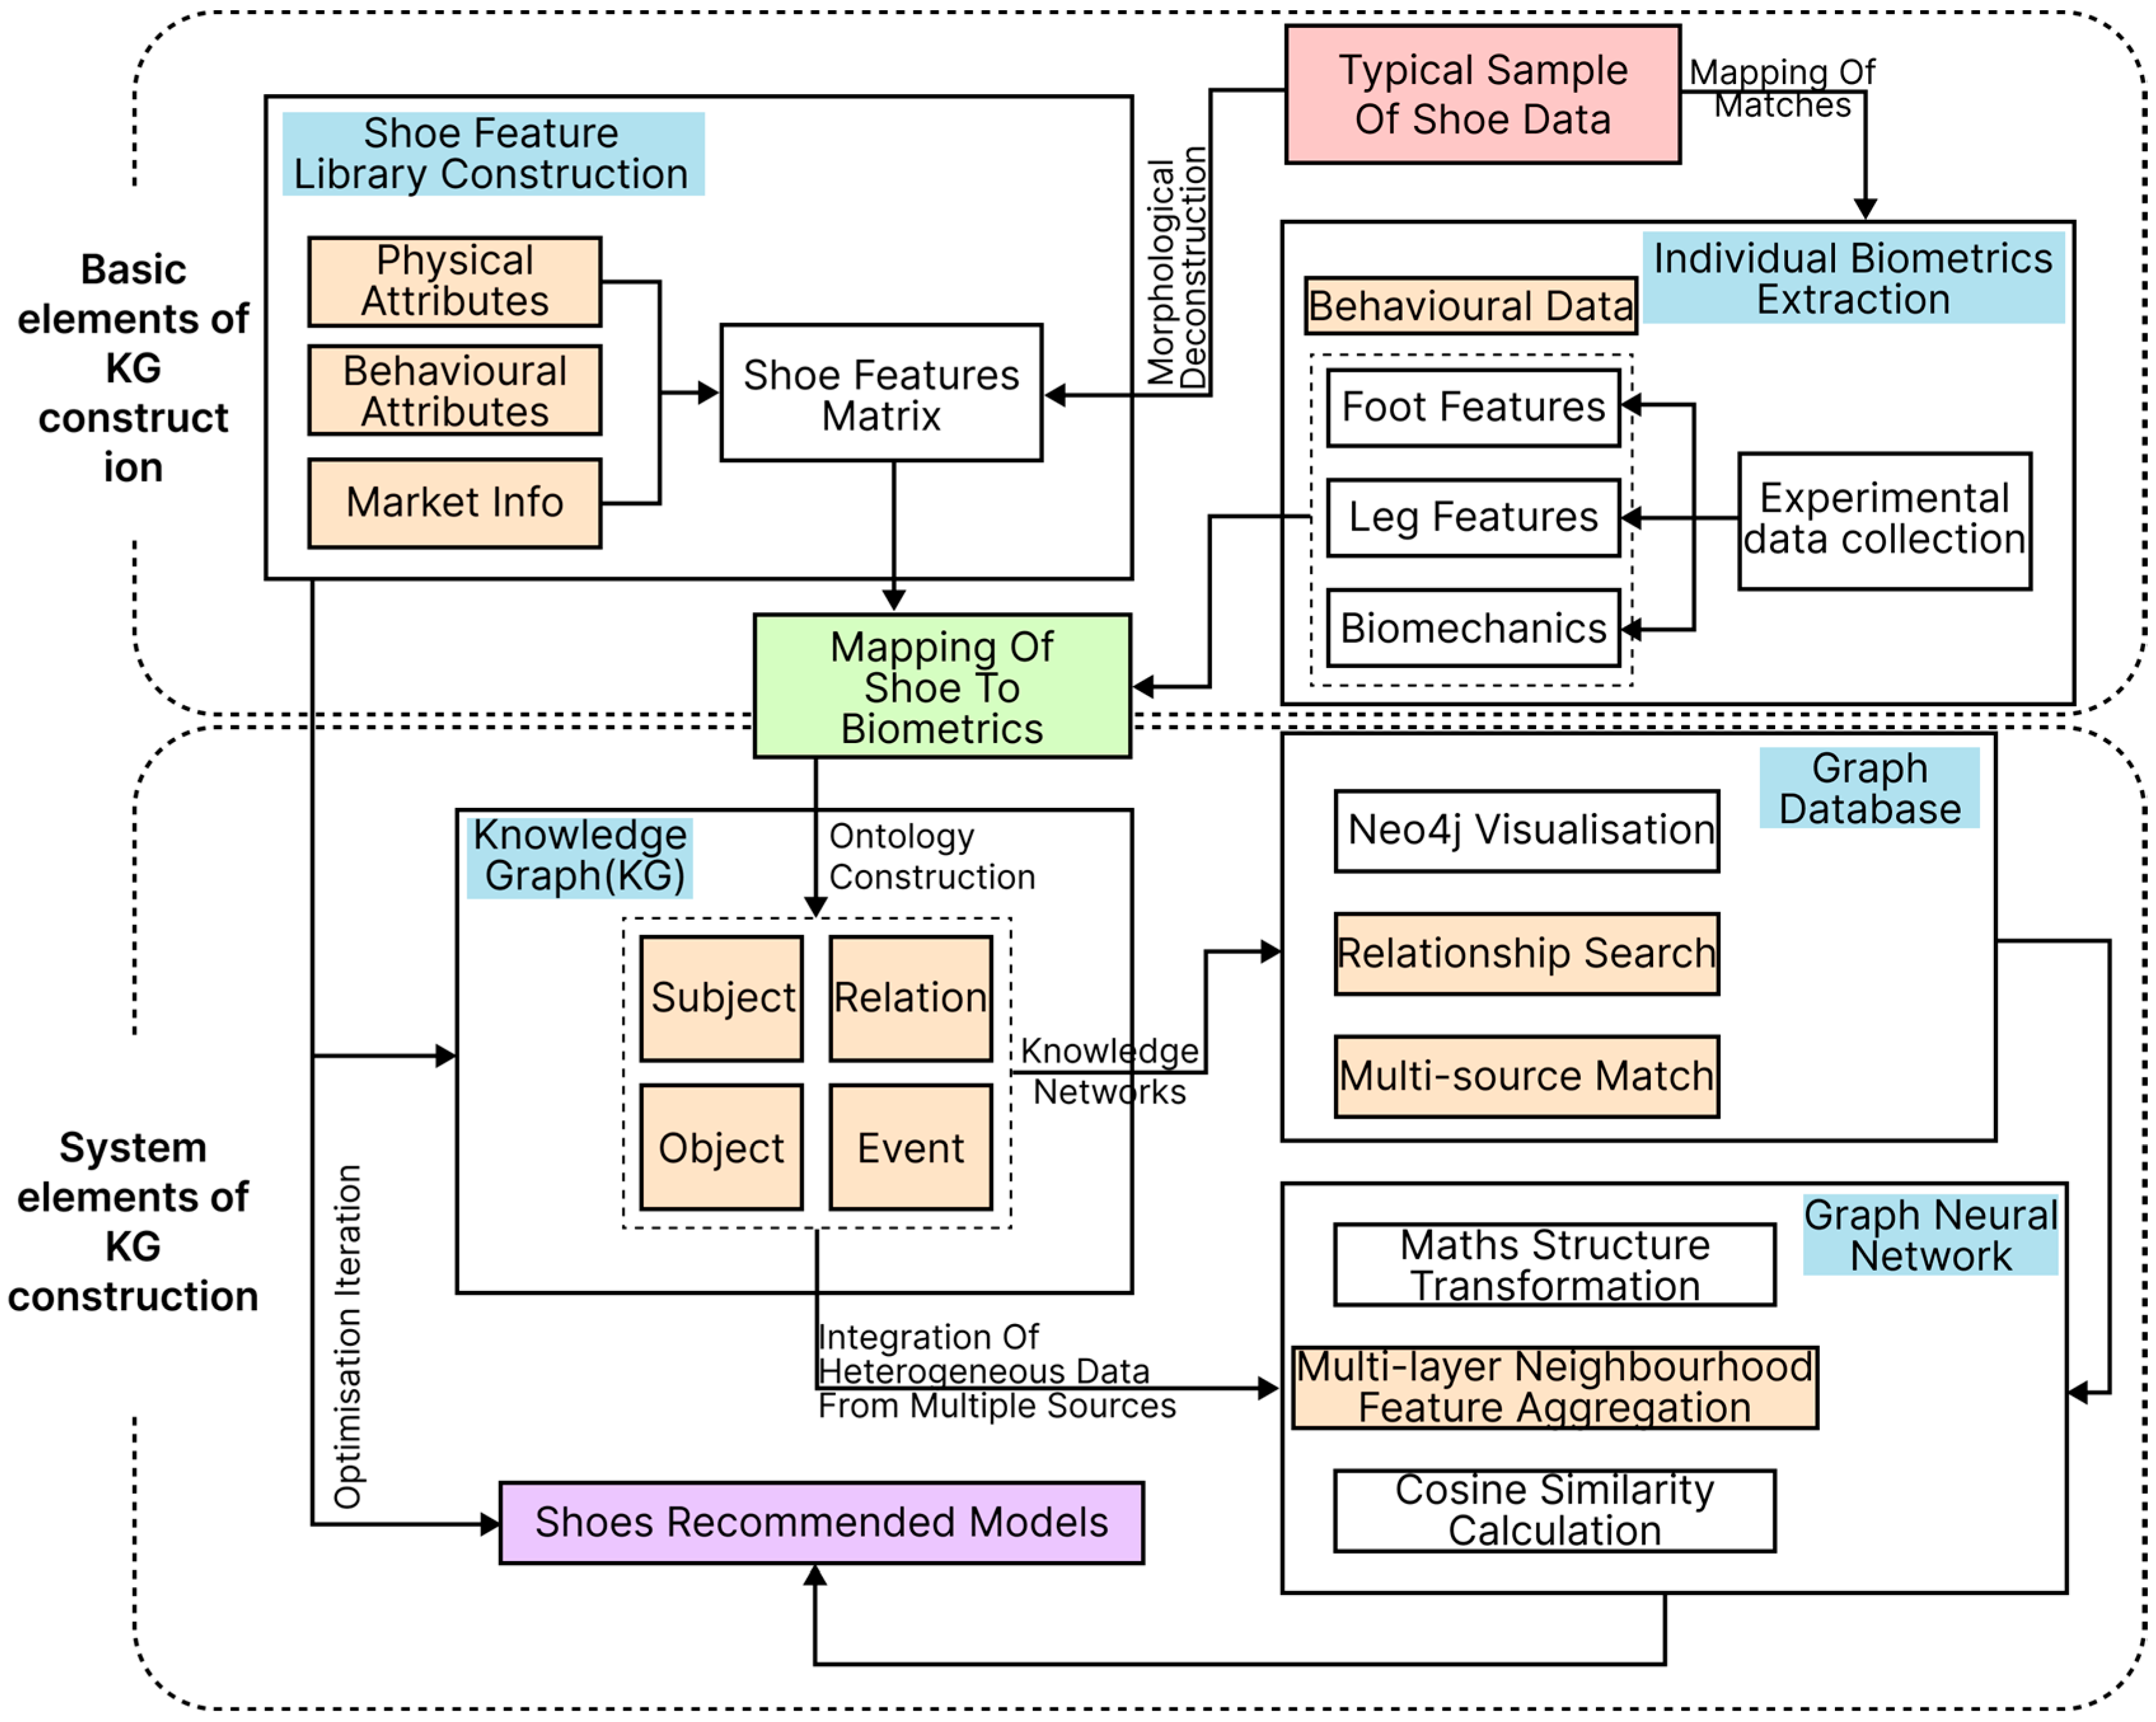
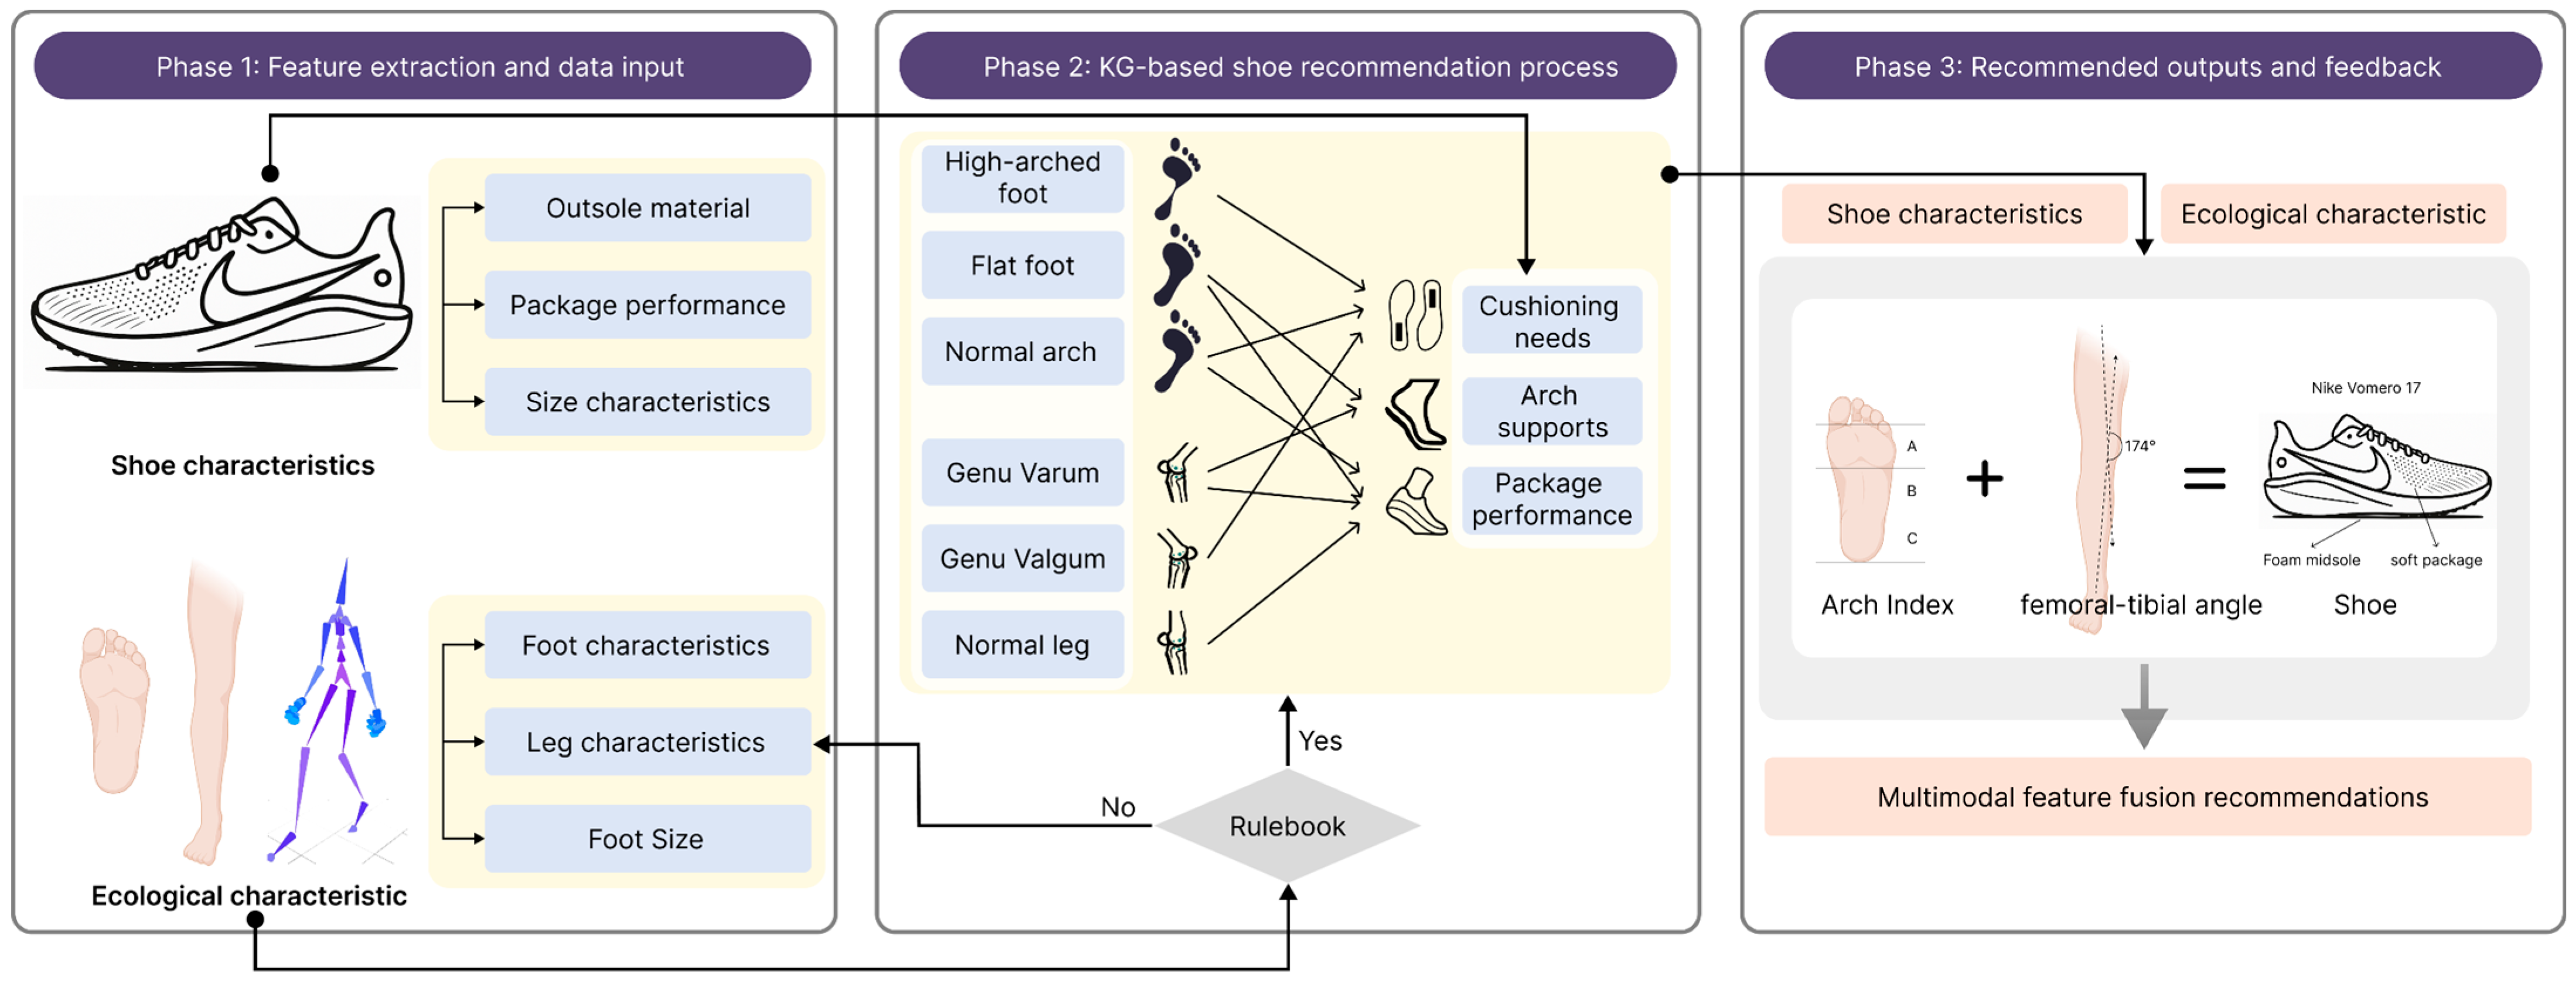
As illustrated in Figure 2, the shoe recommendation approach that integrates biological data transforms a two-dimensional matrix of correlations into a multidimensional knowledge graph to enable complex, multi-source, and heterogeneous recommendations. The purpose of constructing the knowledge graph is to convert fragmented information into a structured knowledge network, allowing machines to comprehend the semantic relationships in the real world. It integrates data from multiple heterogeneous sources, uncovers latent knowledge, and provides decision support across various domains [22,23]. In the context of shoe recommendations, this approach can dynamically connect user behavior, shoe attributes, and biomechanics, ensuring accurate recommendations.

3. Construction of a Biometric Data-Driven Footwear Recommendation System

The methods below describe the extraction, ontology construction, and integration processes enabling KG-based footwear recommendations driven by multimodal biomechanical data.
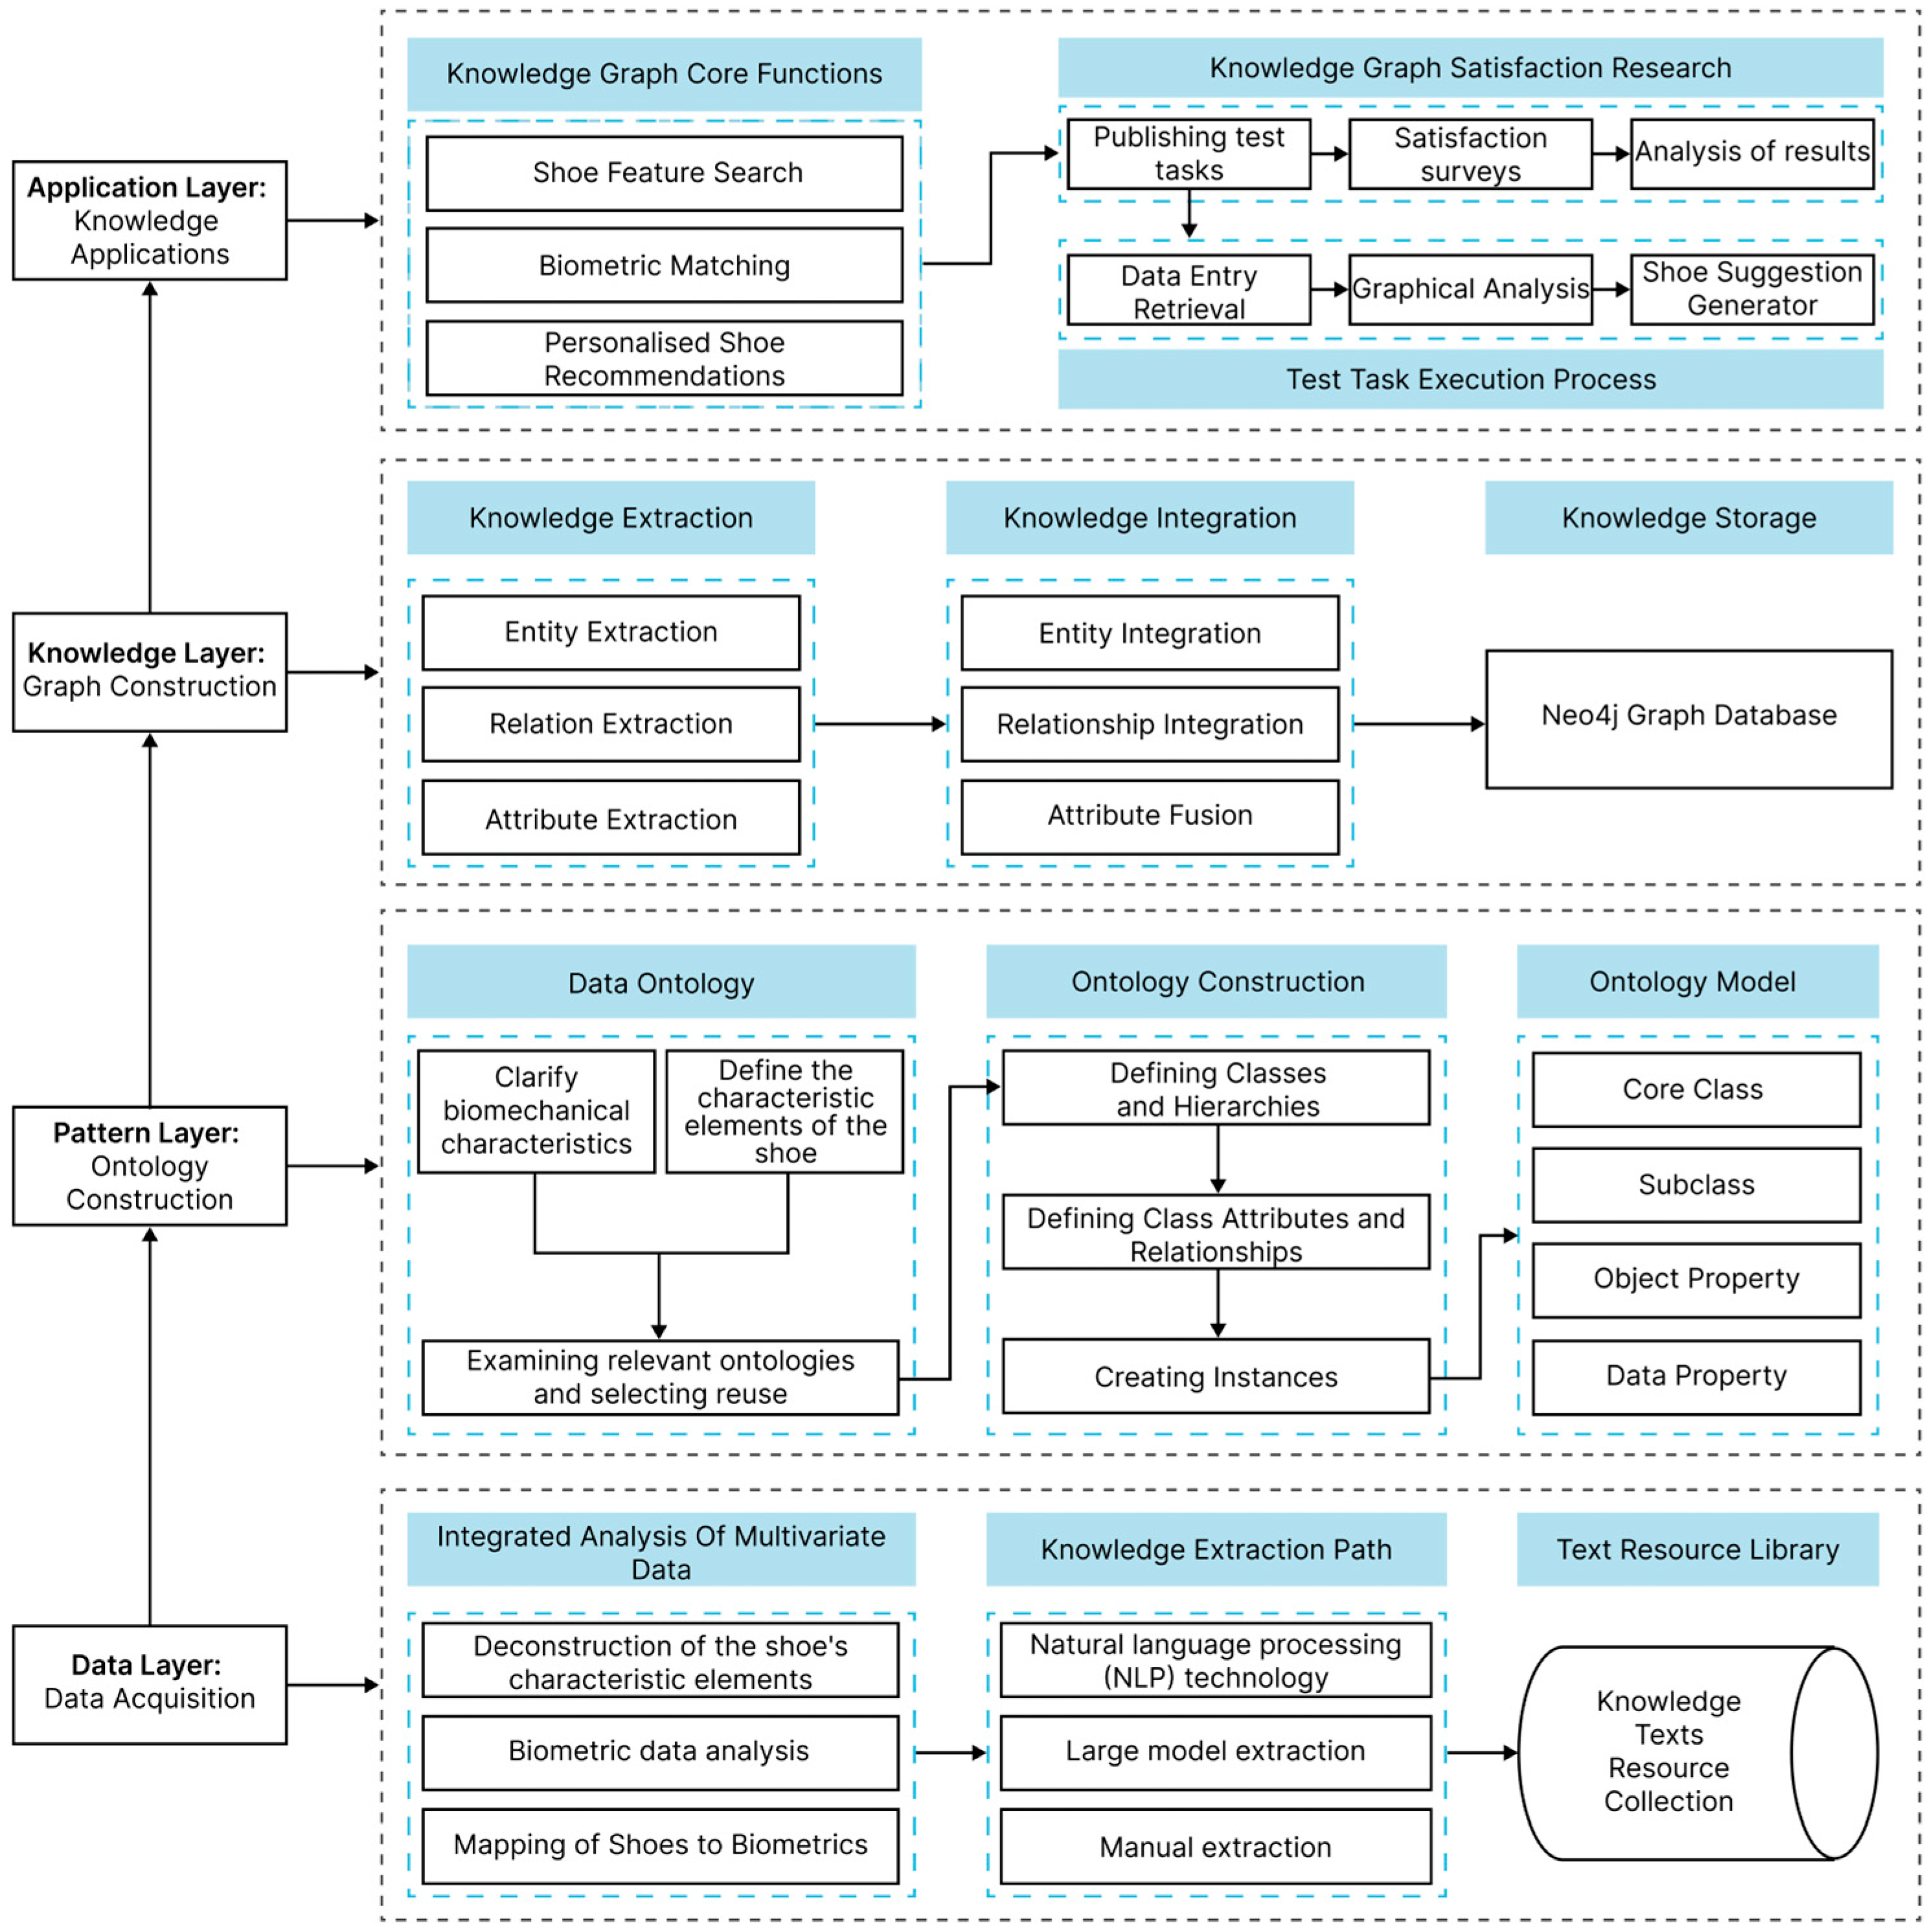
This study introduces a footwear recommendation system that integrates biomechanical data. The system’s technical architecture includes modules for processing multimodal data (MD) (such as foot pressure and gait information), matching biometric data (BD) (specifically foot and leg characteristics), and constructing a KG, as illustrated in Figure 3. To address complex task requirements, the system incorporates a knowledge graph to enhance the representational capacity and precision of the recommendations, enabling highly personalized footwear suggestions.

3.1. Extraction of Footwear Features

3.1.1. Acquisition of Core Elements

The extraction of key features from footwear is vital for both shoe design and market research, as the composition of these features varies due to multiple influencing factors. This section is based on the integration of multi-source data collected over the past year and utilizes Natural Language Processing (NLP) and KG construction methods to identify the core features and classification logic of footwear, proposing a dynamic extraction framework. Detailed information regarding the sources of market data, product descriptions, and biomechanical reference data is provided in Section 2.2.1 and Section 2.2.2.

3.1.2. Technical Approaches to Feature Extraction

NLP and KG are two fundamental technologies within artificial intelligence. NLP enables semantic understanding and generation through basic tasks such as tokenization and pre-trained language models, which are commonly used in systems like question-answering systems [24]. Knowledge Graphs construct a knowledge network around entity-relationship triplets, supporting a variety of applications [25]. The integration of these technologies is reflected in NLP’s ability to extract entity-relationship knowledge that enriches the knowledge graph, while the knowledge graph injects domain-specific knowledge to enhance the NLP model’s performance. Hugging Face Transformers and Neo4j are used to support the practical application of both technologies.

3.2. Construction of the Biometric Data-Driven Footwear Recommendation Knowledge Graph

3.2.1. Pathway for Building the Footwear Recommendation Knowledge Graph

The construction of the KG comprises four layers: data layer, pattern layer, knowledge layer, and application layer [26]. The process for building the KG is shown in Figure 4. The first step is the development of the data layer, which involves basic tasks such as tokenization, entity recognition, and syntactic analysis, coupled with pre-trained language models to achieve semantic understanding and generation. The survey data is then organized into “subject-predicate-object” triplets. The second step is to build the pattern layer, which involves developing the ontology for the graph. In this study, the core idea of ontology development is to design it through a biometric data-driven approach. The third step is the development of the knowledge layer, which includes knowledge extraction and graph visualization. The final step is to build the application layer, focusing on evaluating the functionality of the KG. We evaluated the advantages and disadvantages of the graph through task tests and satisfaction surveys, and ultimately proposed areas for improvement.

3.2.2. NLP-Based Footwear Information Extraction

This study extracts information from official footwear brand websites and converts unstructured textual data into structured information, providing a data foundation for KG-based recommendations. The research process includes: pre-processing and simplifying text, recognizing and extracting key entities, identifying relationships between entities, extracting event elements, identifying features through attribute extraction, and labeling semantic roles to clarify the role of each entity.

3.2.3. Ontology Construction for Footwear Recommendation KG

In the construction of the knowledge graph for shoe recommendation, NLP is first employed to extract entity information from text data, such as shoe descriptions, user reviews, and other relevant sources. This includes details about shoe style, material, intended usage scenarios, and their interrelationships, such as “suitable for pairing” and “commonly used for.” Additionally, individual biomechanical features, such as arch type and leg shape, are extracted from medical literature and sports science texts, along with the relationships between these features and shoe characteristics, such as “suitable for” and “should avoid.”
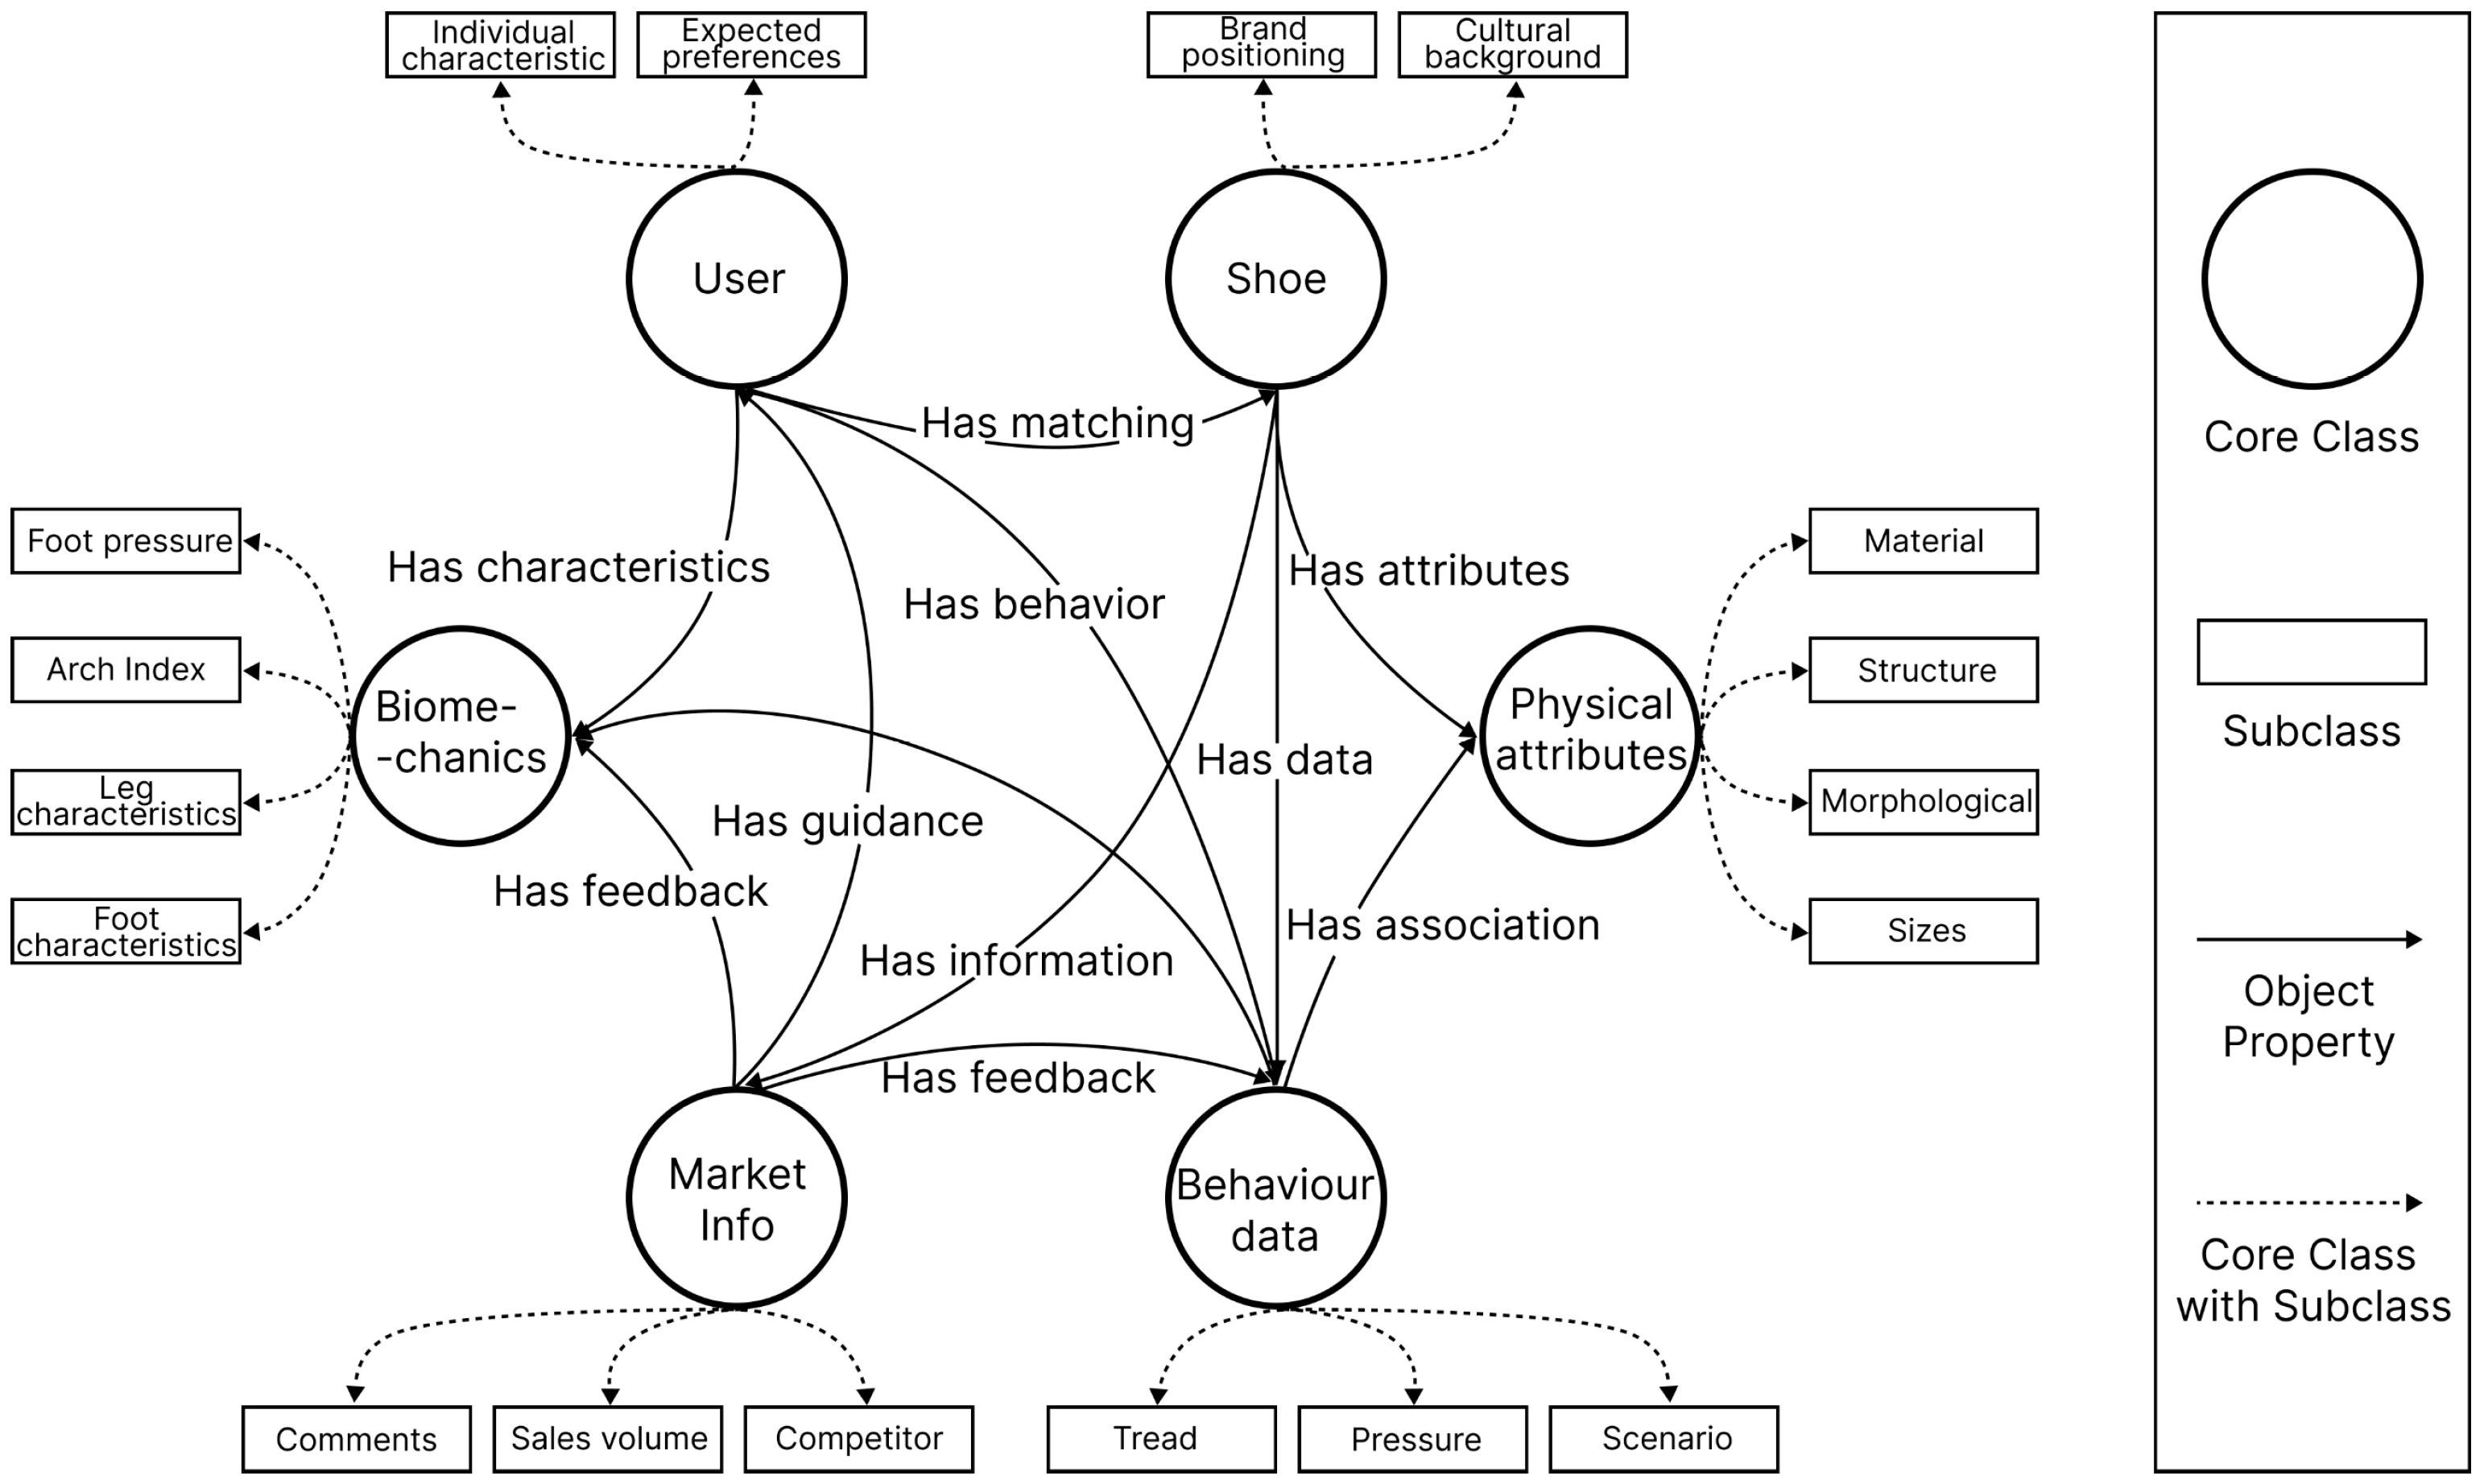
Within the Neo4j graph database, we define multiple classes for the shoe recommendation KG, including “Shoe”, “Material”, “Structure”, “Arch Index”, and “Femoral Angle”, among others. Each class is assigned a unique identifier through a URI naming convention. For instance, an instance of the “Shoe” class, such as “Air Jordan”, is identified by a URI like /shoes/Nike/AirJordan. The relationships between classes, such as “Has_matching”, “Has_guidance”, and “Has_characteristics”, also follow consistent URI naming rules to ensure clear and consistent semantics of the relationships, as shown in Figure 5.
To ensure compatibility with existing standards, we referenced existing ontologies and product classification standards related to footwear, such as Schema.org and FOAF, for semantic alignment. This approach allows for better data exchange and semantic interoperability with other platforms. For example, we adapted the “Shoe” entity definition from Schema.org, extending it to include biomechanical features like arch type and gait.
Next, specific instance data extracted from text, such as the “Air Jordan” shoe under the “Nike” brand and its suitability for “sports” scenarios, as well as individual biomechanical feature data like “normal arch” and “external rotation gait,” is imported into the Neo4j graph database for storage, forming the instances of the KG. By utilizing Cypher query language and the semantic information in the ontology, we enable intelligent shoe recommendations. For example, when a user inputs a request like “red Nike shoes suitable for running for high arches,” the system can quickly and accurately recommend shoes that meet the criteria based on the instance data in the KG.

3.2.4. Ontology and Graph Database Mapping

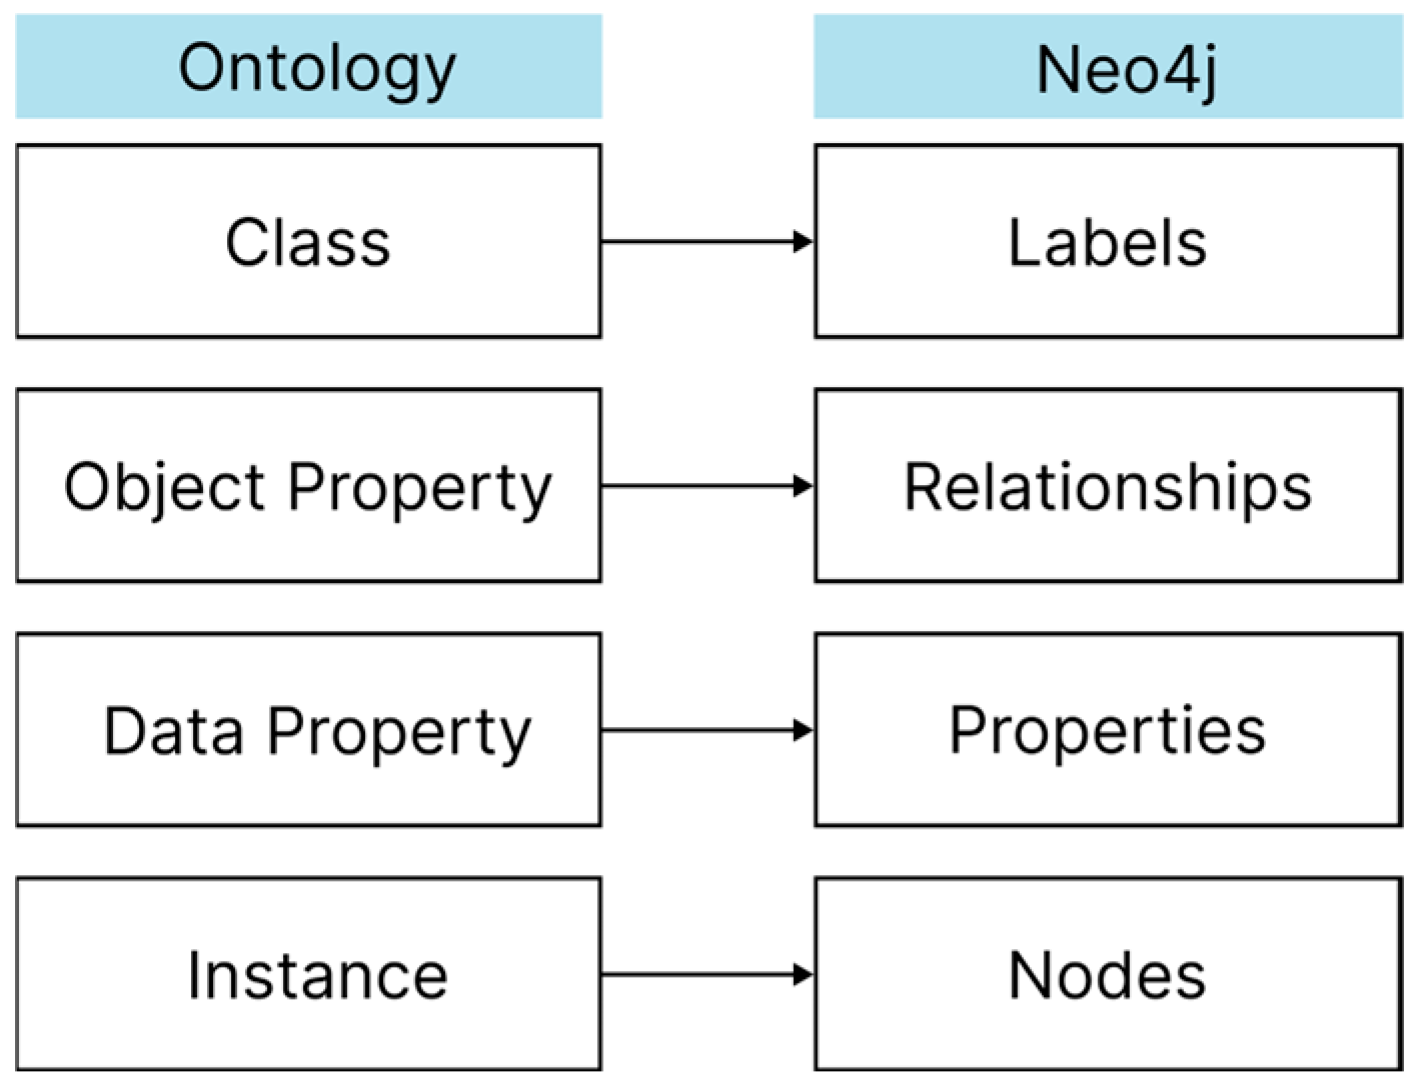
The Neo4j graph database consists of four elements: labels, nodes, relationships, and properties. In the mapping process, classes are mapped to labels, instances to nodes, object properties to relationships, and data properties to properties. This establishes a clear correspondence between the ontology schema and the graph data model [26], as shown in Figure 6.

3.2.5. Neo4j-Based KG Visualization

Using the Neo4j Browser and the py2neo plugin, the data is loaded into Python 3.11 and converted into the appropriate programming format. Python commands are utilized to dynamically import both entities and relationships. This import process is performed in two stages: importing entities and importing relationships.
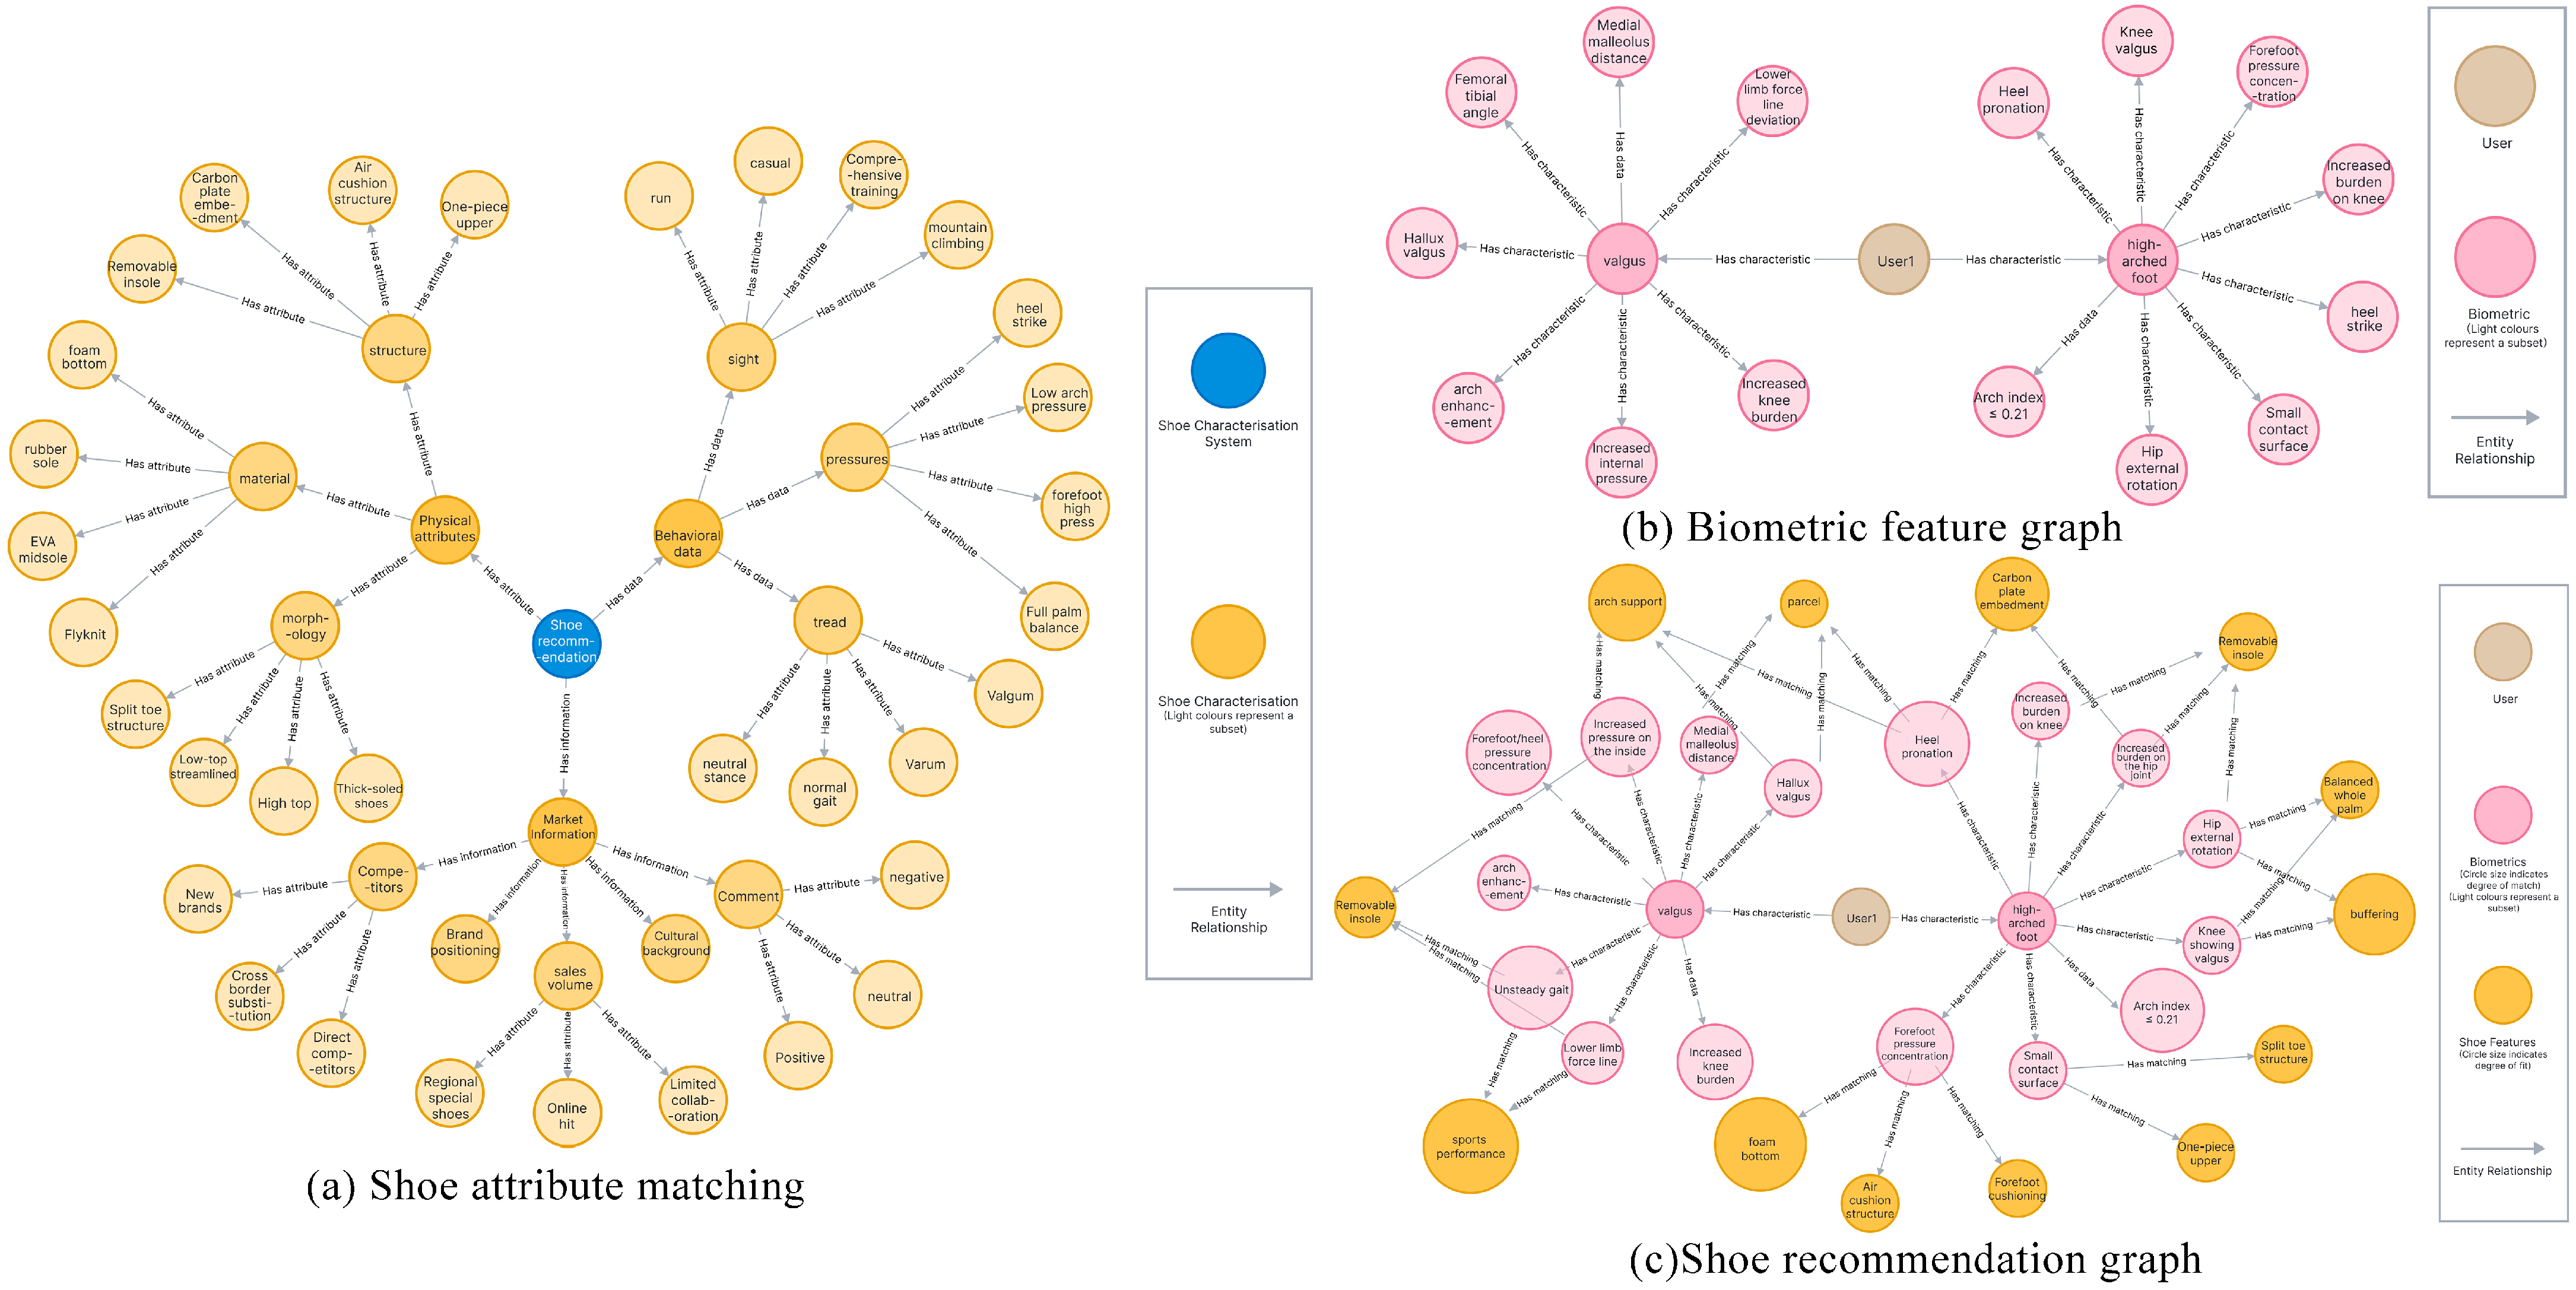
The visualization-based recommendation system in this study, which is built upon a KG, consists of three core stages that complete a decision-making loop. In each stage, visualization serves not only to present the data structure but also to aid in understanding and validating the accuracy and effectiveness of the knowledge graph.
The first stage centers on a data-driven shoe attribute matching mechanism, as illustrated in Figure 7a. The system creates a shoe product ontology, converting shoe design parameters into structured semantic features. These features are then combined with a personalized biometric data graph to generate dynamic constraints. The goal of visualization at this stage is to help both users and designers understand the relationship between shoe attributes and biomechanical characteristics. It also serves to verify the accuracy of the cross-domain mapping between the biometric data space and the product feature space. Figure 7a demonstrates how the attribute matching process works through the visualization interface, assisting users in identifying shoe attributes that comply with ergonomic adaptation principles.
The second stage leverages the biomechanical feature data collection and analysis module. The system utilizes multi-modal sensors to gather foot or leg parameters from users, constructing a personalized biometric feature graph, as shown in Figure 7b. The visualization goal at this stage is to illustrate the compatibility between the user’s biomechanical data and shoe attributes, helping verify the validity of the data and the degree of personalization in the recommendations. Through Figure 7b, users can visually assess how well they align with the recommended shoes, which helps them better understand the biomechanical rationale behind the recommendation.
The third stage integrates multi-source heterogeneous user-shoe data to generate a personalized and feasible shoe recommendation plan, as shown in Figure 7c. At this stage, the knowledge graph visualization not only displays the recommendation results but also highlights the collaborative effects of biomechanical principles, product design knowledge, and market dynamic data. The visualization aims to help users comprehend the underlying logic of the recommendation system, ensuring the scientific integrity of multi-source data integration and enhancing the interpretability of the recommendations. Figure 7c illustrates how the integration and collaboration of multi-source heterogeneous data are visualized, supporting the verification of the accuracy and reliability of the recommendations.

4. Results and Discussion on the Practical Application

4.1. Questionnaire Collection and Participant Selection

This study tests the research hypothesis using a combination of experimental data and survey results. Conducted from 19 February 2025 to 8 April 2025, a total of 351 valid questionnaires were collected both online and offline. These questionnaires aimed to identify the main concerns of participants during the shoe selection process, providing insights into common challenges and pain points that users face when choosing footwear. Based on this data, the research team selected 12 participants aged 22–26, who met specific criteria, for a more in-depth experimental comparison.
The questionnaire was designed to assess three key areas: background information, shoe selection behaviors and perceptions of current issues, and the acceptance of shoe recommendation systems. Specifically, the questionnaire collected basic information such as gender, age, and foot shape, while also exploring issues related to the adaptability of existing shoe size recommendation systems (e.g., whether shoes often fail to meet individual foot characteristics). Additionally, the questionnaire gauged users’ acceptance of biometric data-driven recommendation systems (e.g., whether participants believe an intelligent recommendation system based on foot and leg characteristics can significantly improve shoe selection accuracy). This data will be used to analyze the differences and advantages of traditional shoe size recommendation methods compared to biometric data-driven approaches.
The central hypothesis of this study is: the shoe recommendation method based on biometric data outperforms the traditional approach and more effectively satisfies users’ personalized needs for compatibility and comfort, taking into account variations in foot and leg types.

4.1.1. Questionnaire Results

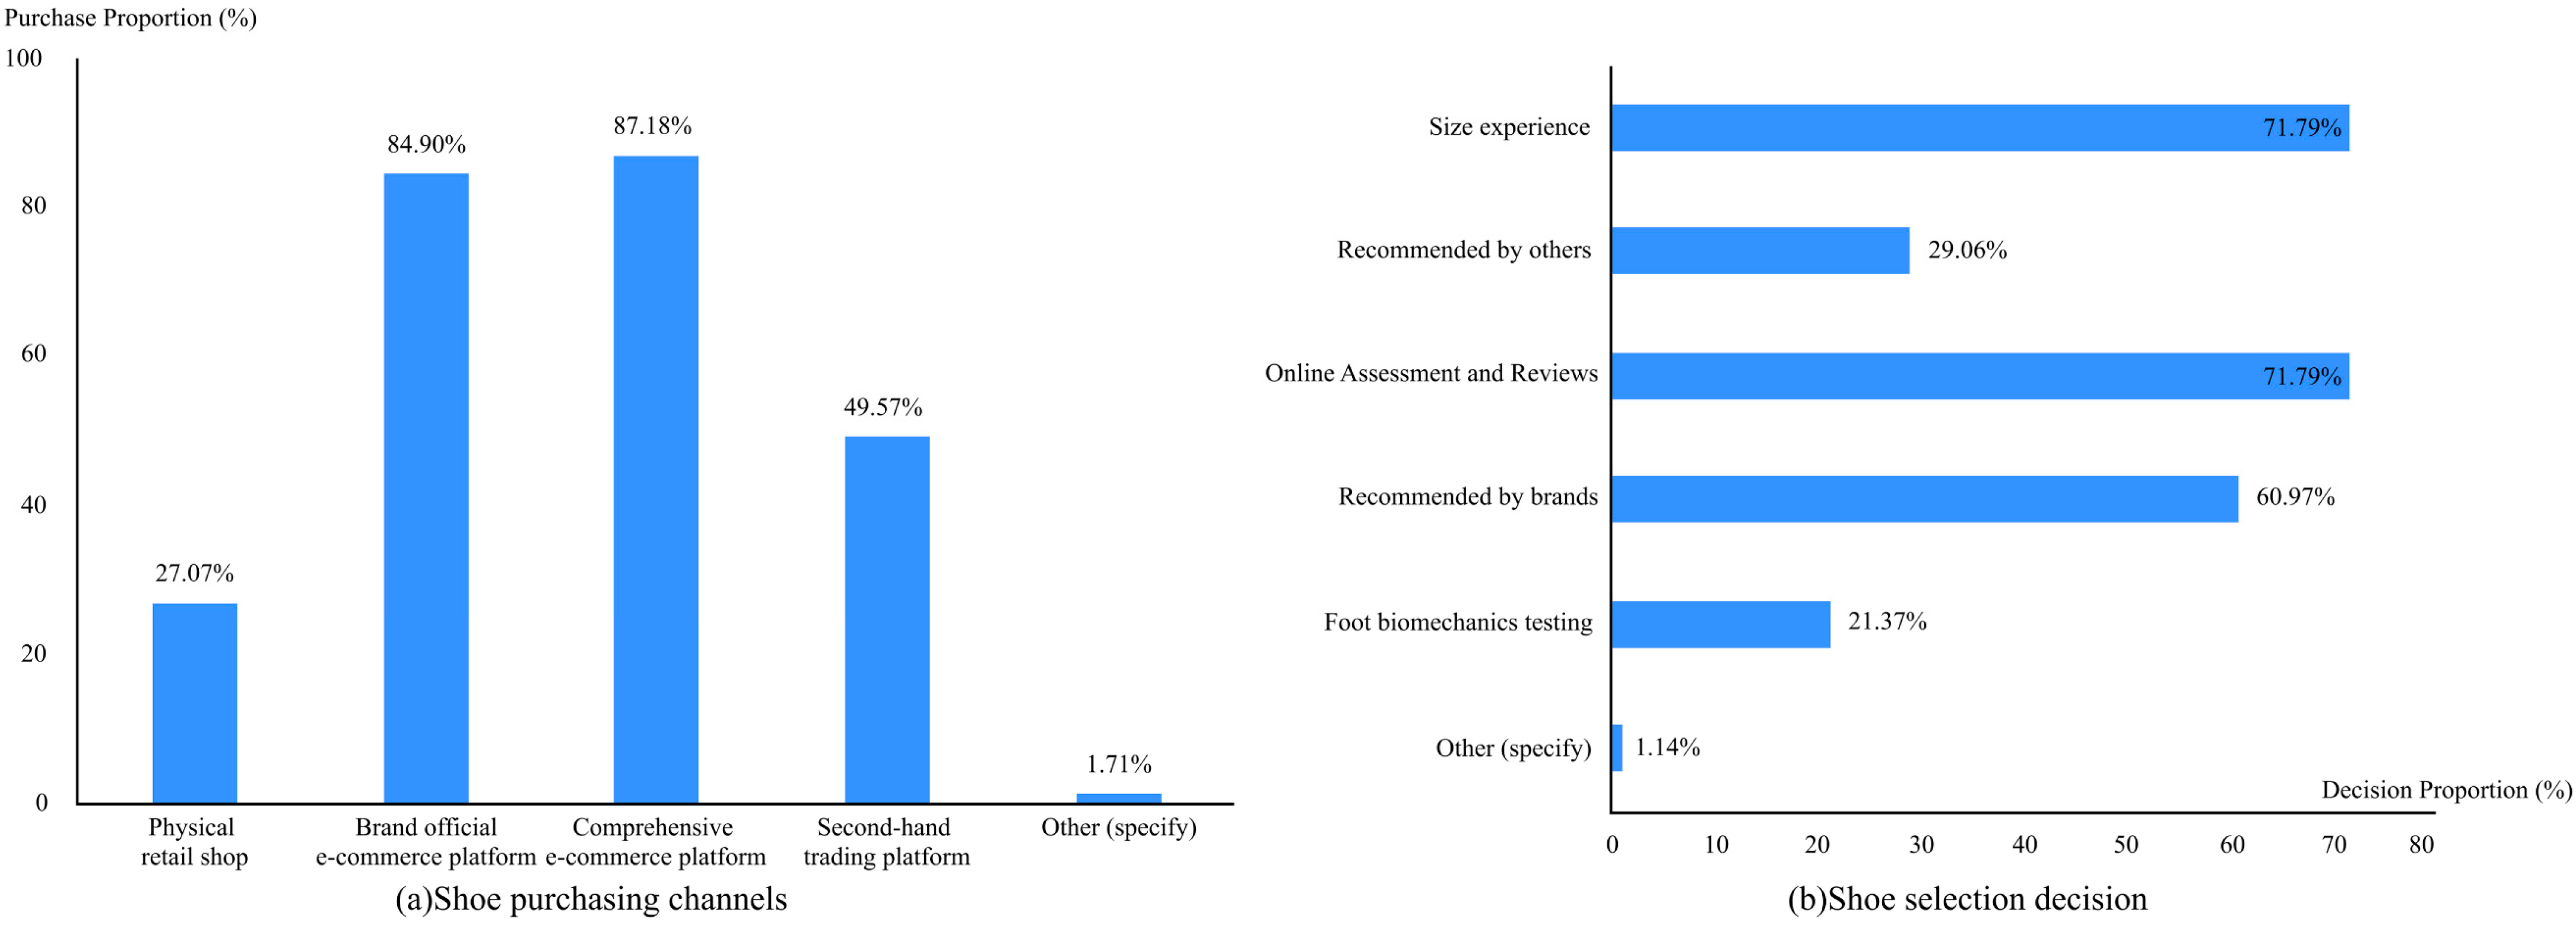
Analyzing the dimensions, we observe that: in the demographic background, gender distribution is balanced, with a wide age range, primarily concentrated between 25–34 years old. Foot type distribution shows that 51.14% have normal feet, 24.5% have high arches, and 22.79% have flat feet. Most participants purchased shoes online, with 84.9% choosing brand official e-commerce platforms and 87.18% using comprehensive e-commerce platforms; only 27.07% bought shoes in physical stores, as shown in Figure 8a. Regarding decision-making in shoe selection, 71.79% relied on personal size experience and online reviews, 60.97% followed brand recommendations, but only 21.37% opted for foot biomechanics testing, as shown in Figure 8b. The reliability of the questionnaire showed a Cronbach’s alpha coefficient of 0.875, indicating good reliability [27]. Factor analysis suitability tests revealed a KMO value of 0.897, and Bartlett’s test of sphericity was significant with p < 0.001, confirming the suitability of the data for factor analysis [28]. Analysis using a five-point Likert scale showed that respondents were moderately dissatisfied with traditional shoe size methods, and more likely to agree that discomfort caused by foot or leg characteristics after selecting shoes was a common issue. The majority of respondents also expressed a preference for a personalized shoe recommendation system that incorporates foot and leg pressure, preferring body compatibility as the basis for shoe selection decisions.

4.1.2. Participant Selection

In accordance with the principles of scientific validity, ethics, and operability, and adhering to the established inclusion and exclusion criteria, 12 participants (8 males and 4 females) were selected for this study. The selection criteria included: participants who experienced clear fitting issues during the shoe selection process, such as mismatches between foot shape and shoe design, or instances where the shoe size appeared to fit but caused discomfort. Additionally, participants were required to have healthy feet, with no history of major foot diseases or injuries, and to demonstrate a positive attitude toward participation, following all experimental instructions and completing subsequent comparative tasks. Detailed information is provided in Table 4.
All participants were adults with full civil capacity, who provided informed consent before joining the study by signing a written consent form. This consent form outlined the study’s purpose, procedures, potential risks and benefits, the intended use of collected data, and the right to withdraw from the study at any time, ensuring both scientific rigor and ethical compliance throughout the research.
It is important to note that, while the sample of 12 participants offers initial data for validating the experimental design, the sample size is very small, and the findings should only be considered as preliminary evidence for concept validation, not as broadly generalizable results. The primary purpose of sampling these 12 participants was to evaluate the feasibility and potential effectiveness of the bio-data-driven shoe recommendation system in the shoe selection process. Future studies should replicate this experiment with a larger sample to further confirm these initial findings.

4.2. Application Testing of the Recommendation System

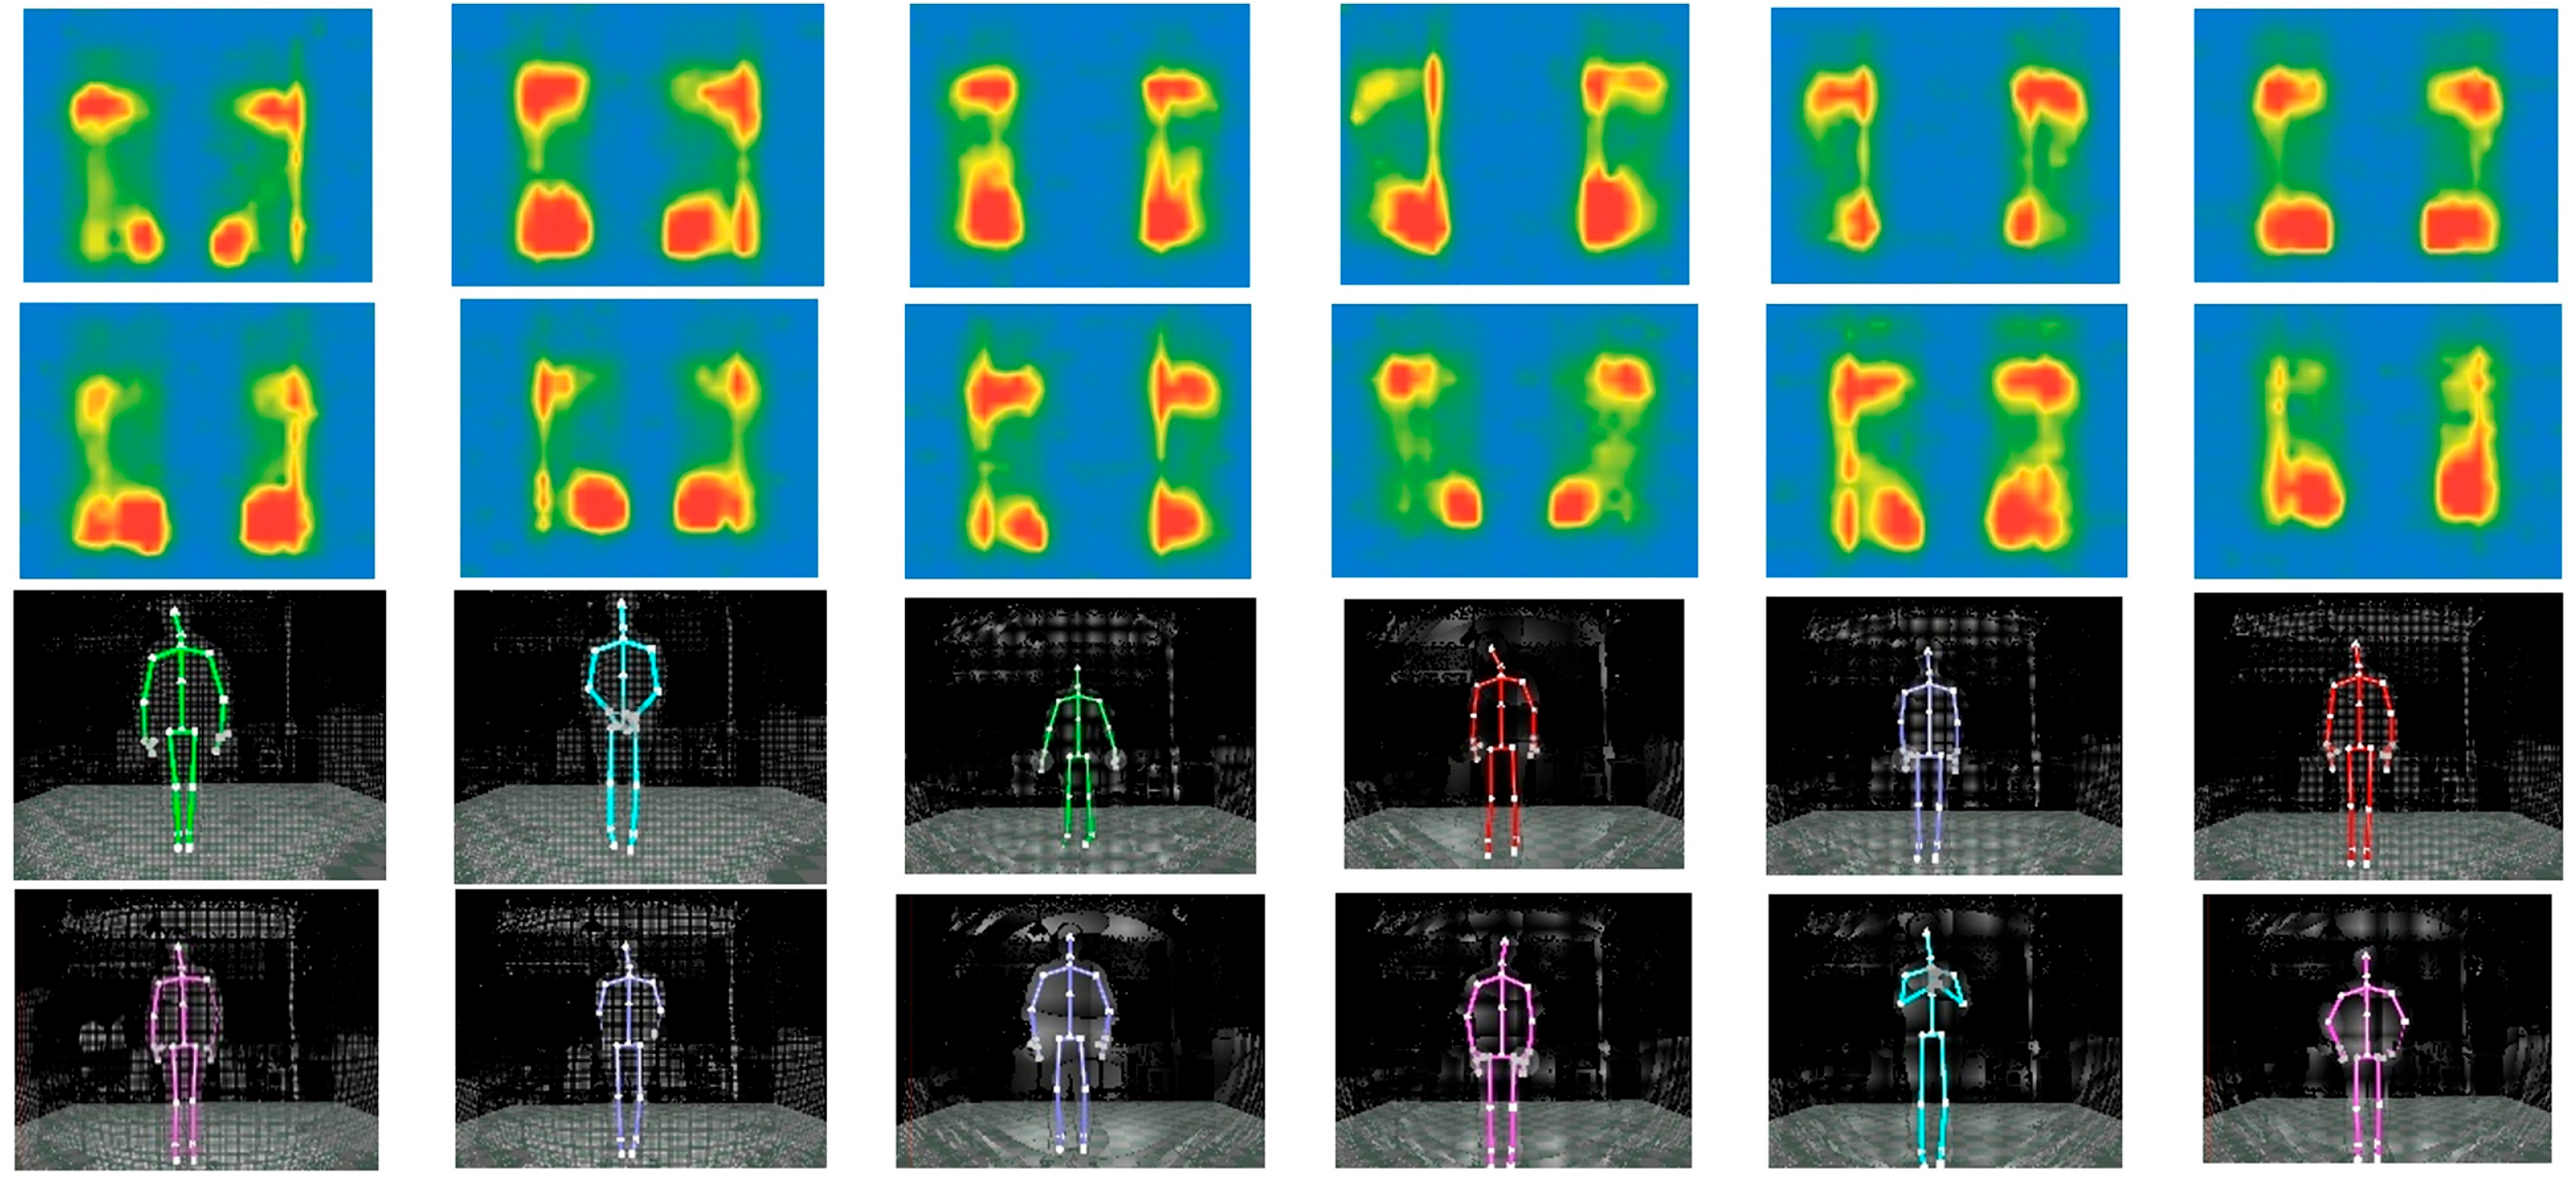
This study employs a cross-experimental design to evaluate the effectiveness of a foot recommendation strategy. Twelve participants were tested sequentially under two conditions: one based on foot and leg shape features (experimental group) and the other based on traditional shoe size recommendations (control group). During the experiment, a Kingfar pressure measurement device with a sampling frequency of 8Hz was used to collect foot pressure data. Additionally, a Kinect v2 depth sensor (depth resolution: 512 × 424) was utilized to capture the participants’ three-dimensional lower limb shape features [29], as shown in Figure 9a,b. Data from both the pressure device and Kinect sensor were collected and calibrated in real-time using the ErgoLAB 3.0 ergonomic platform and Kinect SDK 2.0.
The calibration procedure for the pressure measurement device involved multi-point calibration in both static and dynamic conditions to ensure measurement accuracy and consistency. The Kinect sensor was calibrated using a spatial calibration board to enhance the accuracy and reliability of the three-dimensional data. All participants completed standardized tests under both experimental conditions (Figure 9c), with the test order randomized to mitigate potential learning and sequence effects.

4.2.1. Experiment Acquisition and Analysis of Biometric Data

The arch index and femorotibial angle are crucial indicators for assessing the structure and function of the lower limbs. The arch index is used to evaluate the shape of the foot arch, with the normal range typically between 0.21 and 0.26. This value reflects the height and flexibility of the arch; an excessively high value may indicate a high-arched foot, while a low value could suggest flat feet [30]. The femorotibial angle is used to assess the alignment of the knee joint, with a normal range typically between 174° and 179°, reflecting the angle between the femur and tibia. A larger femorotibial angle may indicate knee varus (O-shaped legs), while a smaller angle may suggest knee valgus (X-shaped legs) [31].
This study collected key experimental data through multimodal biomechanical analysis. The results from foot pressure tests revealed distinct pressure patterns in the subjects during static standing. After preprocessing with the ErgoLAB 3.0 platform, the arch index was calculated using the footprint area ratio algorithm, based on the foot pressure data. The formula is as follows:
Arch   Index = A midfoot A forefoot + A rearfoot × 100 %
where
Amidfoot: Contact area of the midfoot region, which spans from the navicular to the cuboid bones.
Aforefoot: Contact area of the forefoot region, which includes the metatarsals and phalanges, mainly responsible for providing propulsion and flexibility.
Arearfoot: Contact area of the rearfoot region, including the talus and calcaneus, which are essential components of the ankle joint.
For lower limb morphology analysis, a three-dimensional skeletal model was reconstructed using the Kinect SDK 2.0 to measure the femorotibial angle on the coronal plane. This angle is defined as the angle between the mechanical axis of the distal femur and the mechanical axis of the proximal tibia. Data collection is illustrated in Figure 10.
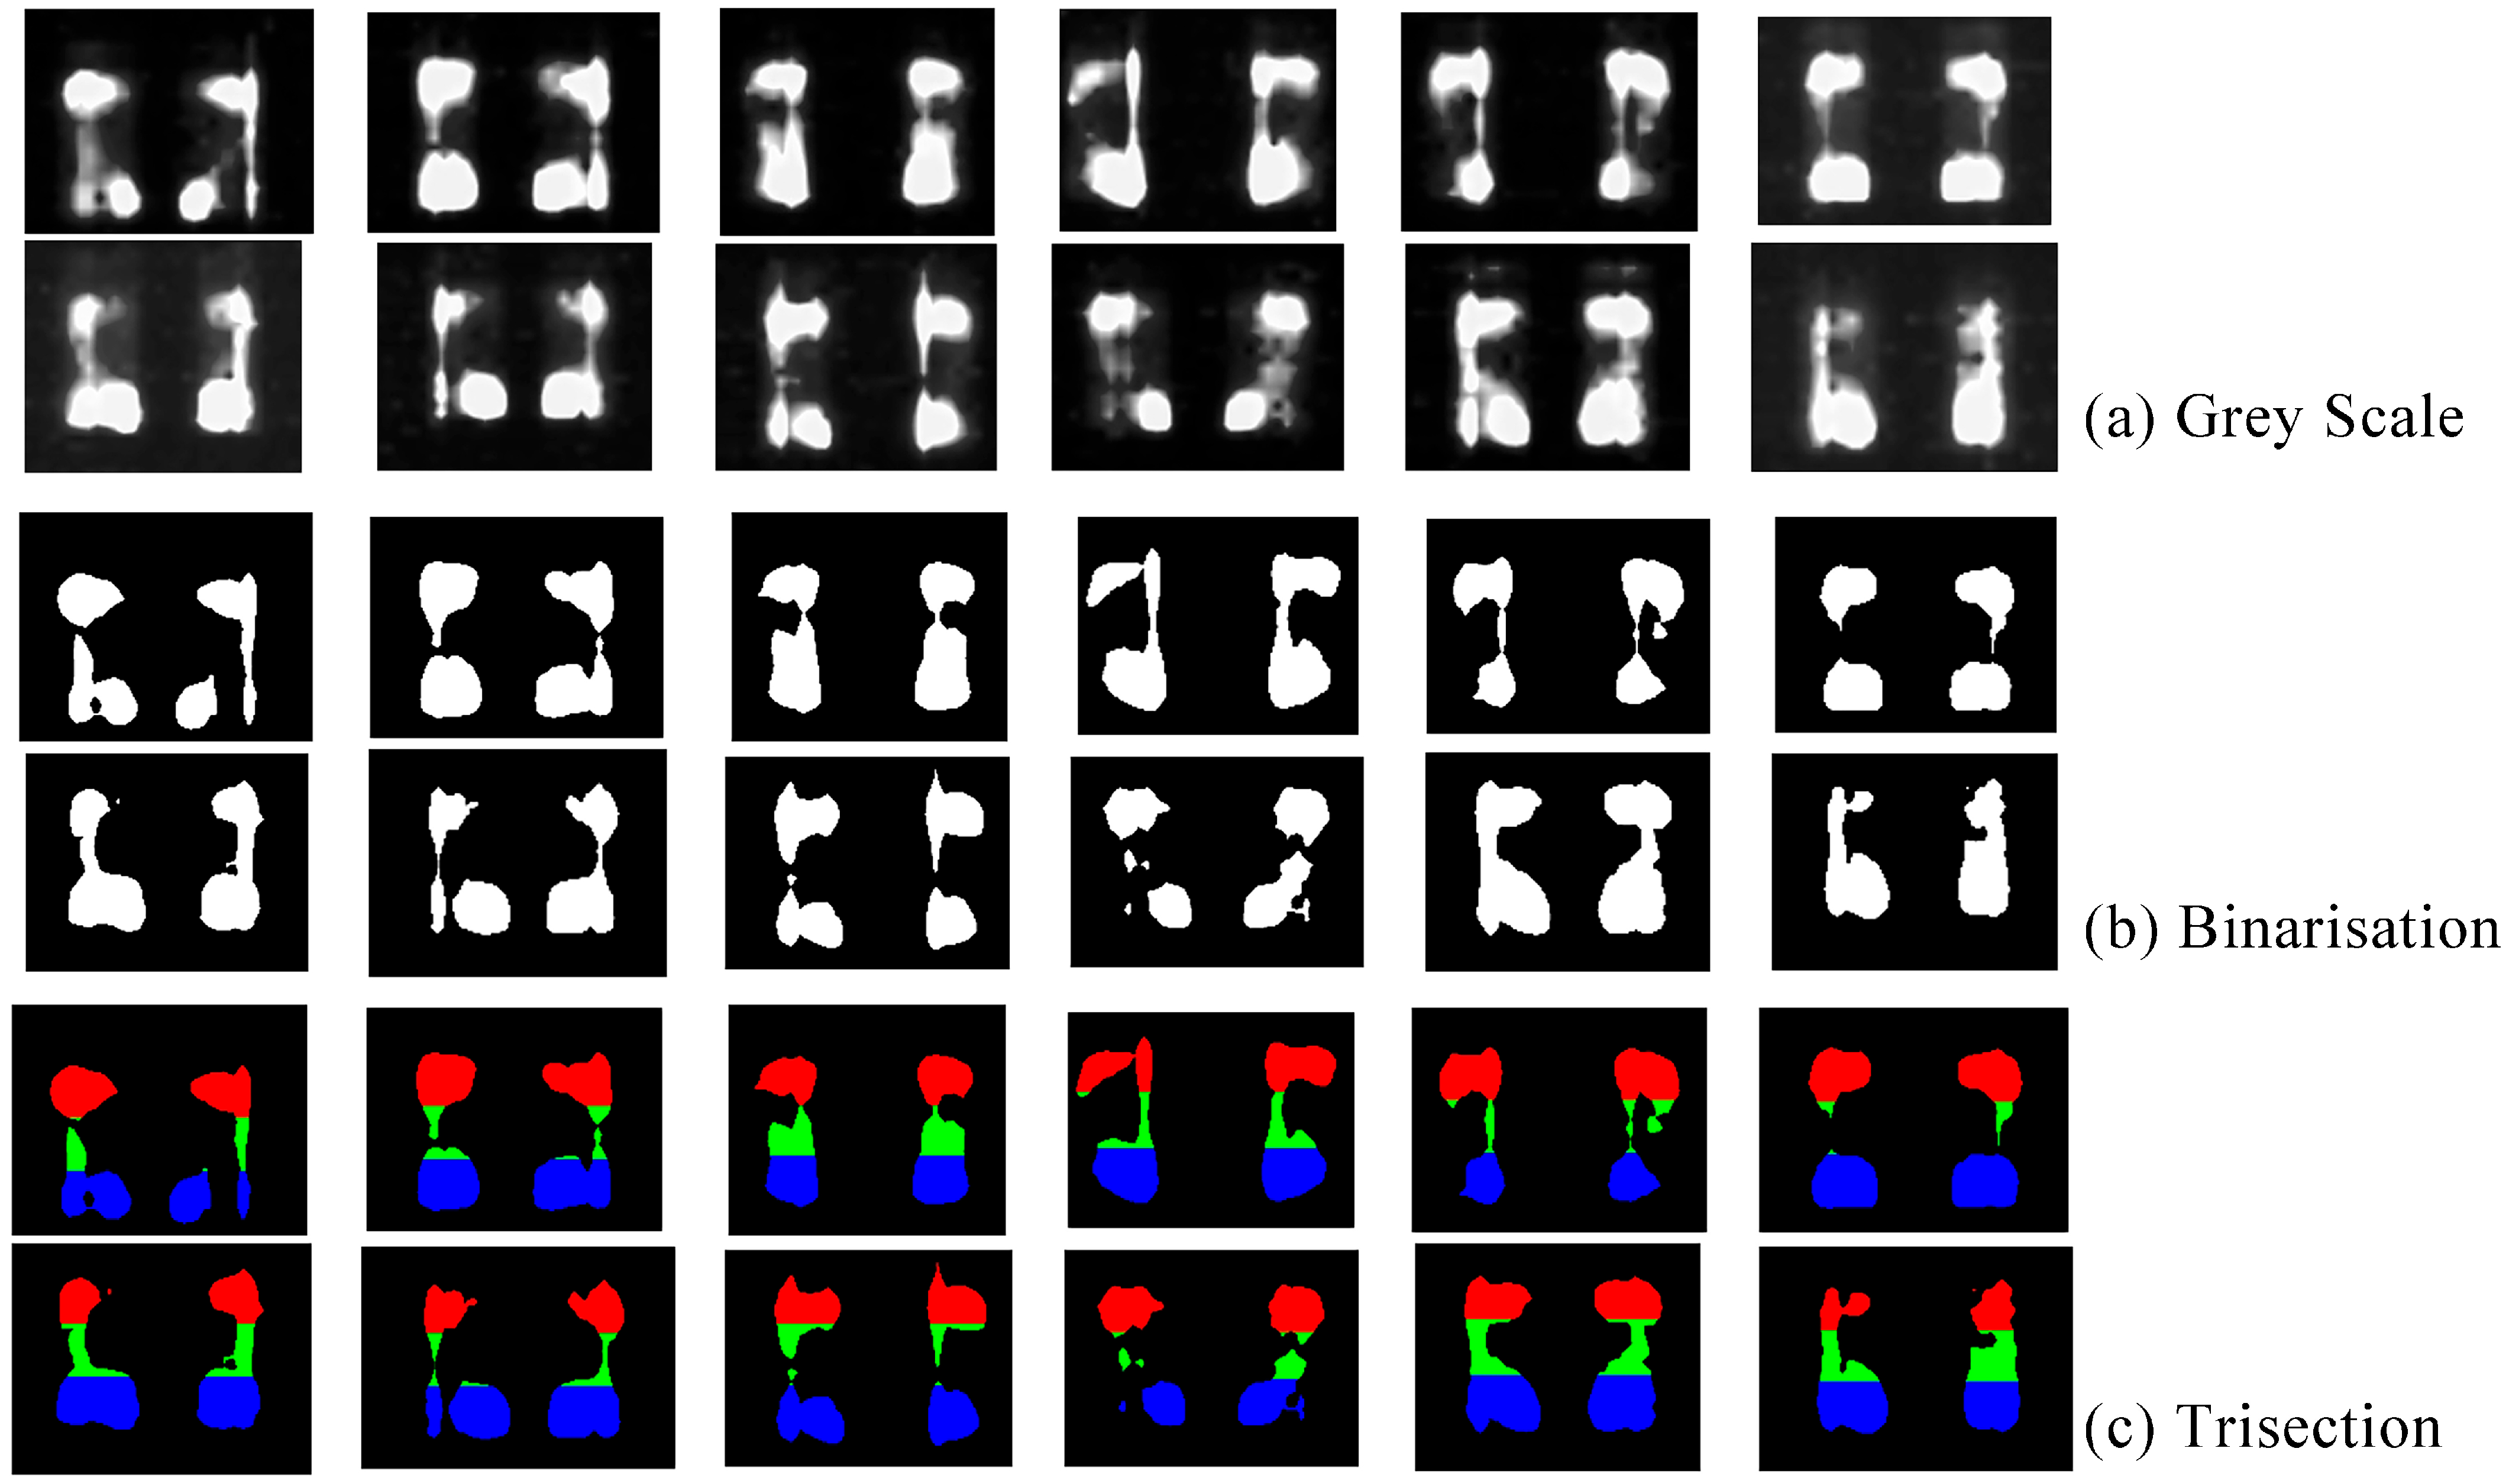
The arch index demonstrates comparable reliability to other arch height measurements, with the footprint area ratio algorithm selected for its simplicity. The foot length, excluding the toes, is divided into three equal sections: A for the forefoot, B for the midfoot, and C for the rearfoot. The arch index is calculated by dividing the midfoot area (B) by the total footprint area (i.e., arch index = B/[A + B + C]) [32], as shown in Figure 11a. This process for calculating the arch index consists of three steps. First, the foot pressure map is converted to a grayscale image and binarized using Otsu’s thresholding method to extract the pressure areas, as shown in Figure 12a,b. Second, each foot is divided into the forefoot, midfoot, and rearfoot sections, as illustrated in Figure 12c. Finally, the pixel area for each section is calculated, and the arch index is derived, with results presented in Table 5.
In three-dimensional Euclidean space, the femoral-tibial angle (FTA) is defined as the angle between the projection of the femoral mechanical axis direction vector (vf) and the tibial mechanical axis direction vector (vt) on the coronal plane [31]. The mathematical expression is given by:
FTA   =   arccos v f · v t v f · v t
where
vf: the femoral mechanical axis direction vector, defined as the unit vector from the center of the femoral head to the center of the knee joint (the midpoint of the femoral intercondylar notch).
vt: the tibial mechanical axis direction vector, defined as the unit vector from the geometric center of the proximal tibial plateau to the center of the ankle joint (the midpoint of the medial and lateral malleolus), independent of the medullary cavity’s morphology.
‖⋅‖: denotes the vector magnitude operator.
arccos: inverse cosine function.
This formula is based on the cosine theorem in vector space. The core principle is to quantify the spatial relationship between the two axes by utilizing the geometric properties of the vector dot product. The numerator vf⋅vt represents the correlation of the projections between the two vectors, and its value is equivalent to ‖vf‖⋅‖vt‖⋅cosθ. The denominator, ‖vf‖⋅‖vt‖, is a normalization factor that eliminates the effect of vector length differences on the angle calculation. The inverse cosine function (arccos) then maps the normalized scalar value to an angle.
In this study, the range of the FTA computed using the three-dimensional vector projection method is confined to [0°, 180°], which is determined by the mathematical properties of the inverse cosine function. However, the “apparent angle” (e.g., 181°) reported in traditional clinical measurements arises from the geometric projection properties of two-dimensional X-ray images. When the femoral and tibial axes are significantly misaligned medially in the coronal plane, the extension lines of these axes outside the projection plane create a virtual intersection, resulting in an extrapolated angle. This discrepancy stems from differences in the definitions of measurement rather than a computational error. The FTA was computed by extracting the coordinates of the hip, knee, and bare joints, with the results shown in Table 5.

4.2.2. Biometric Data-Driven Shoe Recommendation Process and Results

Based on the results outlined above, we quantitatively evaluated the biomechanical characteristics of the foot and lower limb, classifying 12 subjects systematically. The foot arch index analysis revealed that 9 subjects were diagnosed with high arches (foot arch index ≤ 0.21), 2 subjects with flat feet (foot arch index ≥ 0.26), and 1 subject fell within the normal range (0.21–0.26). In the lower limb alignment evaluation, which involved measuring the FTA, the results showed that 3 subjects exhibited knee varus (FTA > 179°), 4 subjects had knee valgus (FTA < 174°), and 5 subjects had a normal physiological leg angle (FTA 174°–179°).
We constructed a biometric data-driven KG using the Neo4j graph database. A dynamic Cypher query strategy was employed to map each subject’s biometric parameters (e.g., arch index, FTA) to standardized entities within the KG. The KG was visualized through a directed layout, illustrating the biomechanical relationships between foot arch, knee joint, and shoe features. The KG recommendation path is shown in Figure 13, where shoe attributes are matched with biometric data to generate personalized recommendations. Due to the large-scale nature of the shoe database construction, the initial system architecture focused on recommending shoe features. To further validate the system’s effectiveness, we selected specific shoes for the experimental group based on their features, enabling experimental verification.

4.2.3. Shoe Recommendation Results Analysis

Based on the biometric features of the subjects, the experimental shoe set is selected by matching shoe characteristics with the subjects’ biometric profiles, as shown in Table 6. Currently, the system is in the lightweight phase, and the integration of multi-source data remains limited, primarily drawing from official brand websites such as Nike, Adidas, Asics, and Brooks. As a result, the recommendation system currently operates on a 1-to-1 basis, where each specific shoe feature corresponds to a single recommended shoe for the experimental group. Moving forward, the system will undergo upgrades to support a 1-to-many recommendation model. Specifically, the system will incorporate collaborative filtering algorithms, leveraging user purchase history and behavioral data to generate a recommendation list containing multiple shoes. This will allow for more personalized shoe recommendations tailored to each user.
Additionally, future versions of the system will feature dynamic learning based on user preferences. By analyzing user feedback—such as preferences or aversions toward specific shoes—the recommendation model will be continuously optimized. This will enable the system to provide a more accurate range of shoe options that align with both users’ biometric characteristics and their personal preferences, improving the accuracy of recommendations and enhancing user satisfaction.
Regarding the database, we plan to expand the data sources by integrating a broader variety of shoe brands and types. This will include acquiring comprehensive market data from various e-commerce platforms, such as Amazon and JD.com, as well as incorporating user preference data from diverse regional markets. This expansion will help diversify the database and enable the recommendation system to better cater to the varied demands of different market segments.
To achieve this goal, we expect to complete the optimization of the system architecture and the expansion of the database within the next 12 to 18 months. In subsequent versions, we will gradually incorporate collaborative filtering and user preference learning capabilities. This technological advancement will significantly enhance the system’s flexibility and adaptability, enabling it to perform more effectively across diverse markets and meet the growing demand for personalized recommendations.
The control group shoes were selected through a standardized process, using the subjects’ most recent self-purchased shoes as a baseline, thus eliminating potential biases introduced by brand preferences or purchase channels. The recommendation results are presented in Table 7.
The experimental design followed a randomized, double-blind, crossover control trial. Participants wore shoes from both the experimental and control groups in succession, each for a 15 min standardized gait task. The tasks included walking on flat ground, climbing stairs, and other combined movements. A minimum 48 h interval was maintained between tests to prevent fatigue effects. Upon completion of the trial, a double-blind subjective evaluation was conducted using a seven-point Likert scale, which had been validated for reliability and consistency. The evaluation assessed various biomechanical perception metrics, including stability and overall satisfaction.
To evaluate the differences in shoe recommendation effectiveness between the experimental and control groups, this study utilized IBM SPSS Statistics 27 software for data analysis. Initially, descriptive statistics were performed on the stability and satisfaction scores of the two groups to understand the basic distribution of the data. Subsequently, independent samples t-tests were conducted to compare the scores of the experimental and control groups, assessing the statistical significance of the recommendation system’s performance. A significance level of α = 0.05 was applied, meaning that a P-value less than 0.05 was considered statistically significant. Additionally, normality tests were carried out on the scores to ensure that the data met the assumptions required for t-testing.
This study employed a controlled experiment (n = 12 in both the experimental and control groups) to assess the superiority of the bio-data-driven KG recommendation system in the dimension of subjective perception. The analysis revealed significant differences in both stability and satisfaction between the two groups. The experimental group reported significantly higher stability (5.92 ± 0.79) and satisfaction (6.42 ± 0.67) scores compared to the control group (3.83 ± 0.72 and 3.67 ± 0.89, respectively). The independent samples t-test showed statistically significant differences for both stability (p < 0.001) and satisfaction (p < 0.001), and these differences remained significant after Bonferroni correction. In terms of effect size, the Cohen’s d for stability was 2.71, indicating a large effect, while the Cohen’s d for satisfaction was 3.51, also indicating a large effect. These findings demonstrate that the bio-data-driven KG recommendation system provides a statistically significant and practically valuable improvement over traditional size-matching methods, particularly in terms of biomechanical compatibility.
To further validate the superiority of the data-driven KG recommendation system in terms of subjective perception, this study also analyzed users’ comfort and fit perceptions. The differences in comfort ratings between the experimental and control groups indicate that the KG recommendation system significantly enhances user comfort and shoe fit. After using the KG recommendation system, users were more likely to choose shoes that aligned with their individual biomechanical characteristics, which significantly increased the satisfaction ratings of the recommendation system (experimental group satisfaction rating: 6.42 ± 0.67 vs. control group: 3.67 ± 0.89).
In addition to significant differences in stability and satisfaction, the experimental group also demonstrated superior performance in other biomechanical indicators compared to the control group. For instance, after using the KG recommendation system, the experimental group exhibited a marked improvement in the plantar pressure distribution of the footwear. This result aligns with the findings of previous studies (Menz et al., 2021), which indicate that appropriate footwear recommendations can significantly enhance plantar pressure distribution and improve foot comfort [33]. Furthermore, Cheng et al. (2022) highlighted that optimizing arch support design can effectively reduce pressure in the forefoot, further confirming the efficacy of the KG recommendation system [34]. Users in the experimental group reported reduced forefoot pressure in the KG-recommended footwear, particularly in the medial forefoot.
Regarding user feedback, the experimental group demonstrated higher satisfaction with the recommendation system. According to post-assessment evaluations, 8 out of 12 participants (67%) reported that the shoes recommended by the KG system offered better comfort and more suitable shoe choices. This feedback is corroborated by biomechanical data. For instance, the 9 participants reported reduced pressure in the forefoot area and felt less discomfort during walking and running. Additionally, 7 participants indicated that the shoes recommended by the KG system helped alleviate knee discomfort, particularly during prolonged standing.
Biomechanically, the differences in features between the experimental and control groups reinforce the effectiveness of the KG recommendation system. Notably, users with higher arches in the experimental group experienced a significant reduction in forefoot pressure, which is consistent with Cheng et al. (2022)’s findings on footwear with arch support [34]. Through the integration of arch index and insole design within the KG model, the experimental results further validate the accuracy of the KG recommendation system. Additionally, the observed reduction in knee varus moment corresponds with specific design features, such as insole cushioning and arch support, found in the KG-recommended footwear. These biomechanical improvements are consistent with established principles in the literature [35,36], reinforcing the scientific foundation of the KG recommendation system in footwear design and showcasing its potential for personalized footwear recommendations.
However, this study does have certain limitations, particularly regarding sampling selection bias and the control of blinding in experiments. Firstly, although the sampling process was random, the participants’ age and activity levels predominantly ranged from 22 to 26 years, which may limit the generalizability of the findings, especially in terms of applicability to other age groups or individuals with varying activity levels. Secondly, despite efforts to minimize the influence of confounding variables, selection bias could still potentially affect the results. For example, the participants may be biased towards those with higher physical activity levels or greater biomechanical demands, which could influence the broader applicability of the results. Additionally, this study failed to implement full experimental blinding, and the researchers may have unintentionally influenced the interpretation of the data during the collection and analysis phases. Therefore, future research should strengthen blinding procedures, expand the sample size to include participants from diverse age groups and activity levels, and consider other factors that might affect the effectiveness of the recommendation system, in order to validate the universality and reliability of the KG-based recommendation system.
By analyzing users’ biomechanical data, the KG recommendation system can dynamically adjust its recommendation criteria. For example, when the system detects a high arch, it prioritizes recommending shoes with enhanced arch support, optimizing the recommendation process. The system also adjusts the comfort ratings of the recommended shoes based on real-time data, improving the accuracy of the match. Through continuous feedback on users’ foot characteristics and performance, the KG model can iteratively improve recommendation accuracy and user satisfaction, thus verifying the effectiveness of bio-data-driven personalized recommendation systems.

5. Conclusions

This study introduces a biometric data-driven KG framework for personalized shoe recommendations. Its innovation lies in combining biometric features, such as the arch index and tibiofemoral angle, with ergonomic design principles, thereby overcoming the limitations of traditional size-based fitting systems. The system employs multi-modal data integration, initially utilizing a natural language processing framework alongside a domain expert knowledge base to extract relevant entities such as biometric attributes and shoe models from various sources. A multi-layer semantic matrix is then constructed to form the KG recommendation system. The system further integrates pressure sensors and 3D skeletal capture devices to collect real-time biomechanical data, which is mapped to KG nodes for generating personalized recommendations. Additionally, a hybrid collaborative filtering mechanism is utilized to optimize the recommendation process across multiple dimensions. Results from a double-blind controlled experiment show that the experimental group significantly outperforms the control group in terms of stability, satisfaction, and other key metrics, validating the superior ergonomic fitting performance of this system.
There are several directions for improvement in this research. First, the database architecture is limited, with weak integration of heterogeneous data sources. Future work will involve reconstructing the database to support multi-dimensional data fusion and dynamic updates, enhancing both the data ecosystem’s integrity and scalability. Second, the recommendation model currently serves as a lightweight prototype, and its adaptation to various biometric features requires further optimization. We plan to perform transfer learning experiments using open-source bioinformatics databases to develop an intelligent recommendation system that incorporates dynamic feedback based on biological markers. Third, the sample used for validation may be subject to bias, and future research will incorporate large-scale, multi-center, longitudinal cohort data from multiple regions. Stratified sampling and adversarial training strategies will be employed to increase the model’s robustness and generalizability.

Author Contributions

Conceptualization, H.Z. and X.L.; methodology, H.Z.; software, H.Z.; validation, H.Z.; formal analysis, H.Z. and X.L.; investigation, H.Z.; resources, H.Z.; data curation, H.Z.; writing—original draft preparation, H.Z.; writing—review and editing, H.Z.; visualization, H.Z.; supervision, H.Z. and X.L.; project administration, H.Z.; funding acquisition, H.Z. and X.L. All authors have read and agreed to the published version of the manuscript.

Funding

This research was funded by Humanities and Social Science Fund of Ministry of Education of China, grant number 24YJAZH070.

Institutional Review Board Statement

The study was conducted in accordance with the Declaration of Helsinki, and approved by the Ethics Committee of Hubei University of Technology (protocol code HBUT20250024 and date of 19 February 2025).

Informed Consent Statement

Informed consent was obtained from all subjects involved in the study.

Data Availability Statement

The original contributions presented in the study are included in the article; further inquiries can be directed to the corresponding author.

Acknowledgments

We thank all participants for their contributions to this study and sincerely appreciate the guidance and supervision, as well as the advice and assistance, provided by Xiaoying Li.

Conflicts of Interest

The authors declare no conflicts of interest.

Abbreviations

The following abbreviations are used in this manuscript:
KGKnowledge graph
MDMultimodal Data
BDBiometric Data
NLPNatural Language Processing
AIArch Index
FTAFemoral Tibial Angle

References

  1. Tedeschi, R.; Giorgi, F.; Donati, D. Footwear and Foot Health: Unveiling the Role of Proper Shoe Fit in Preventing Podiatric Issues and Enhancing Well-Being. Appl. Sci. 2024, 14, 9938. [Google Scholar] [CrossRef]
  2. Murley, G.S.; Landorf, K.B.; Menz, H.B.; Bird, A.R. Effect of foot posture, foot orthoses and footwear on lower limb muscle activity during walking and running: A systematic review. Gait Posture 2009, 29, 172–187. [Google Scholar] [CrossRef]
  3. Buldt, A.K.; Menz, H.B. Incorrectly fitted footwear, foot pain and foot disorders: A systematic search and narrative review of the literature. J. Foot Ankle Res. 2018, 11, 43. [Google Scholar] [CrossRef] [PubMed]
  4. Boppana, A.; Anderson, A.P. Dynamic foot morphology explained through 4D scanning and shape modeling. J. Biomech. 2021, 122, 110465. [Google Scholar] [CrossRef] [PubMed]
  5. Luximon, A.; Jiang, L.; Luximon, Y. Sizing and grading methods with consideration of footwear styles. Int. J. Ind. Erg. 2020, 78, 102960. [Google Scholar] [CrossRef]
  6. Umar, H.; Idrees, W.; Umar, W.; Khalil, A.; Rizvi, Z.A. Impact of routine footwear on foot health: A study on plantar fasciitis. J. Fam. Med. Prim. Care 2022, 11, 3851. [Google Scholar] [CrossRef]
  7. Zhong, Y.; Lü, J.; Chen, T.; Jiang, F.; Chen, J.; Chen, S. Assessment of plantar arch index and prevalence of fiat feet in 3 226 school-age children in Shanghai. Chin. J. Sch. Health 2020, 41, 1328–1361, 1364. [Google Scholar]
  8. Inamdar, P.; Fatnani, D.; Rajiwate, F.; Shaikh, B.; Deshpande, B.; Shaikh, S.; Ranka, B.; Dhansay, S. Prevalence of flat foot and high arched foot in normal working individuals using footprint method. Int. J. Physiother. Res. 2018, 6, 2754–2758. [Google Scholar] [CrossRef]
  9. Woźniacka, R.; Oleksy, Ł.; Jankowicz-Szymańska, A.; Mika, A.; Kielnar, R.; Stolarczyk, A. The association between high-arched feet, plantar pressure distribution and body posture in young women. Sci. Rep. 2019, 9, 17187. [Google Scholar] [CrossRef]
  10. Chen, Y.T.; Zhu, J.D.; Chern, J.S. Dynamic and Static Balance in Persons with Different Arch Height and Impacts of an Arch Support. In Proceedings of the 2016 IEEE 16th International Conference on Bioinformatics and Bioengineering (BIBE), Taichung, Taiwan, 31 October–2 November 2016; pp. 282–285. [Google Scholar]
  11. Madzhi, N.K.; Mhd Nor, A.A.B.M.; Abdullah, N.E. Preliminary Investigation on the Effect of Speed Variation to Pressure Distribution for Flat, Medium and High Foot Arch. In Proceedings of the 2018 4th International Conference on Electrical, Electronics and System Engineering (ICEESE), Kuala Lumpur, Malaysia, 8–9 November 2018; pp. 6–11. [Google Scholar]
  12. Norton, A.A.; Callaghan, J.J.; Amendola, A.; Phisitkul, P.; Wongsak, S.; Liu, S.S.; Fruehling-Wall, C. Correlation of Knee and Hindfoot Deformities in Advanced Knee OA: Compensatory Hindfoot Alignment and Where It Occurs. Clin. Orthop. Relat. Res. 2015, 473, 166–174. [Google Scholar] [CrossRef]
  13. Güven, E.; Çıtaker, S.; Alsancak, S. The effect of orthotics on plantar pressure in children with infantile tibia vara (Blount’s disease). Sci. Rep. 2023, 13, 2875. [Google Scholar] [CrossRef]
  14. Wang, Y.; Jiang, H.; Yu, L.; Gao, Z.; Liu, W.; Mei, Q.; Gu, Y. Understanding the Role of Children’s Footwear on Children’s Feet and Gait Development: A Systematic Scoping Review. Healthcare 2023, 11, 1418. [Google Scholar] [CrossRef] [PubMed]
  15. Puszczalowska-Lizis, E.; Zarzyczna, P.; Mikulakova, W.; Migala, M.; Jandzis, S. Influence of footwear fitting on feet morphology in 9 year old girls. BMC Pediatr. 2020, 20, 349. [Google Scholar] [CrossRef]
  16. Kwan, R.L.C.; Zheng, Y.P.; Cheing, G.L.Y. The effect of aging on the biomechanical properties of plantar soft tissues. Clin. Biomech. 2010, 25, 601–605. [Google Scholar] [CrossRef]
  17. Jellema, A.H.; Huysmans, T.; Hartholt, K.; van der Cammen, T.J.M. Shoe design for older adults: Evidence from a systematic review on the elements of optimal footwear. Maturitas 2019, 127, 64–81. [Google Scholar] [CrossRef]
  18. Roberts, R.H.R.; Davies-Jones, G.R.; Brock, J.; Satheesh, V.; Robertson, G.A. Surgical management of the diabetic foot: The current evidence. World J. Orthop. 2024, 15, 404–417. [Google Scholar] [CrossRef]
  19. Rasmussen, S.; Wilkes, B.; Poulton, L.; Roser, M.; Draper, S.; Creer, A.; Standifird, T. Effect of Sex-Specific Running Shoes on Female Recreational Runners. Appl. Sci. 2022, 12, 7537. [Google Scholar] [CrossRef]
  20. Balaji, M.S.; Raghavan, S.; Jha, S. Role of tactile and visual inputs in product evaluation: A multisensory perspective. Asia Pac. J. Mark. Logist. 2011, 23, 513–530. [Google Scholar] [CrossRef]
  21. Loriette, C.; Amengual, J.L.; Ben Hamed, S. Beyond the brain-computer interface: Decoding brain activity as a tool to understand neuronal mechanisms subtending cognition and behavior. Front. Neurosci. 2022, 16, 811736. [Google Scholar] [CrossRef]
  22. Yan, C.; Fang, X.; Huang, X.; Guo, C.; Wu, J. A solution and practice for combining multi-source heterogeneous data to construct enterprise knowledge graph. Front. Big Data 2023, 6, 1278153. [Google Scholar] [CrossRef]
  23. Peng, Q.; Cai, Y.; Liu, J.; Zou, Q.; Chen, X.; Zhong, Z.; Wang, Z.; Xie, J.; Cai, Y.; Li, Q. Integration of Multi-Source Medical Data for Medical Diagnosis Question Answering. IEEE Trans. Med. Imaging 2025, 44, 1373–1385. [Google Scholar] [CrossRef] [PubMed]
  24. Zhou, M.; Duan, N.; Liu, S.; Shum, H.Y. Progress in Neural NLP: Modeling, Learning, and Reasoning. Engineering 2020, 6, 275–290. [Google Scholar] [CrossRef]
  25. Chen, X.; Jia, S.; Xiang, Y. A review: Knowledge reasoning over knowledge graph. Expert. Syst. Appl. 2020, 141, 112948. [Google Scholar] [CrossRef]
  26. Li, X.; Wang, X.; Li, G. Aging-Friendly Design Research: Knowledge Graph Construction for Elderly Advantage Applications. Appl. Sci. 2025, 15, 2848. [Google Scholar] [CrossRef]
  27. Bujang, M.A.; Omar, E.D.; Baharum, N.A. A Review on Sample Size Determination for Cronbach’s Alpha Test: A Simple Guide for Researchers. Malays. J. Med. Sci. 2018, 25, 85–99. [Google Scholar] [CrossRef]
  28. Nkansah, B.K. On the Kaiser-Meier-Olkin’s measure of sampling adequacy. Math. Theory Model. 2018, 8, 52–76. [Google Scholar]
  29. Tsang, N.W.H.; Lam, K.Y.; Qureshi, U.M.; Ng, J.K.Y.; Papavasileiou, I.; Han, S. Indoor activity tracking for elderly using intelligent sensors. In Intelligent Data Sensing and Processing for Health and Well-Being Applications; Academic Press: Cambridge, MA, USA, 2018; pp. 197–222. [Google Scholar]
  30. Keatsamarn, T.; Visitsattapongse, S.; Pintavirooj, C.; Aoyama, H. Optical-based foot plantar pressure measurement with application in human postural balance, gait and recognition analysis. In Proceedings of the 2020 6th International Conference on Engineering, Applied Sciences and Technology (ICEAST), Chiang Mai, Thailand, 1–4 July 2020; IEEE: New York, NY, USA, 2020; pp. 1–4. [Google Scholar]
  31. Paley, D. Principles of Deformity Correction; Springer: Berlin/Heidelberg, Germany, 2014. [Google Scholar]
  32. Murley, G.S.; Menz, H.B.; Landorf, K.B. A protocol for classifying normal- and flat-arched foot posture for research studies using clinical and radiographic measurements. J. Foot Ankle Res. 2009, 2, 22. [Google Scholar] [CrossRef]
  33. Menz, H.B.; Bonanno, D.R. Footwear comfort: A systematic search and narrative synthesis of the literature. J. Foot Ankle Res. 2021, 14, 63. [Google Scholar] [CrossRef]
  34. Cheng, J.; Zeng, Q.; Lai, J.; Zhang, X. Effects of arch support doses on the center of pressure and pressure distribution of running using statistical parametric mapping. Front. Bioeng. Biotechnol. 2022, 10, 1051747. [Google Scholar] [CrossRef]
  35. Xing, F.; Lu, B.; Kuang, M.; Wang, Y.; Zhao, Y.L.; Zhao, J.; Sun, L.; Wang, Y.; Ma, J.X.; Ma, X.L. A systematic review and meta-analysis into the effect of lateral wedge arch support insoles for reducing knee joint load in patients with medial knee osteoarthritis. Medicine 2017, 96, e7168. [Google Scholar] [CrossRef]
  36. Zeighami, A.; Dumas, R.; Aissaoui, R. Knee loading in OA subjects is correlated to flexion and adduction moments and to contact point locations. Sci. Rep. 2021, 11, 8594. [Google Scholar] [CrossRef] [PubMed]
Figure 1. The footwear selection process, based on user needs, provides personalized recommendations by integrating footwear characteristics, user behavioral data, and market insights. Throughout this process, a knowledge graph is progressively developed and refined to enhance the accuracy and relevance of the recommendations.
Applsci 15 11281 g001
Figure 2. Technical Framework for Footwear Recommendation Based on Biometric Data.
Applsci 15 11281 g002
Figure 3. Recommender System Technical Architecture.
Applsci 15 11281 g003
Figure 4. The Path to Constructing a KG for Shoe Recommendations.
Applsci 15 11281 g004
Figure 5. Ontology Construction of KG for Shoe Recommendation.
Applsci 15 11281 g005
Figure 6. Ontology and Neo4j Mapping Relationships.
Applsci 15 11281 g006
Figure 7. KG-based Recommender System.
Applsci 15 11281 g007
Figure 8. Questionnaire results.
Applsci 15 11281 g008
Figure 9. Experimental Equipment and Participants.
Applsci 15 11281 g009
Figure 10. Plantar Pressure and Skeletal Line Acquisition.
Applsci 15 11281 g010
Figure 11. Footprint Area Ratio and Femoral-tibial Angle.
Applsci 15 11281 g011
Figure 12. Foot Pressure Mapping: (a) Grey Scale. (b) Binarisation. (c) Trisection.
Applsci 15 11281 g012
Figure 13. Shoe Recommendation Process Based on Biological Data.
Applsci 15 11281 g013
Table 1. Deconstruction and Encoding Matrix of Footwear Feature Elements.
Feature
Classification
FeatureSerial Number
1234
Physical
Attributes
Materials L1Foam soleRubber soleEVA midsoleFlyknit
Structure L2One-piece upperAir cushion structureCarbon plate embeddedRemovable insole
Morphology L3Ankle-high shoesLow-top streamlinedThick-soled popsSplit-toe construction
Behavioral DataGait patterns L4Normal gaitKnee VarusKnee ValgusNeutral gait
Plantar pressure L5Forefoot high pressureHeel high pressureLow arch pressureBalanced whole palm
Usage scenarios L6CasualRunningHikingComprehensive training
Market
Information
User reviews L7PositiveNeutralNegativeWait and see
Sales figures L8Online pop-upsRegional special shoesLimited editionRegular style
Competing products L9Direct competitorCross-border substitutionNew brandsTraditional upgrade
Table 2. Mapping Table of Biometric Feature Data.
User FeaturesExperimental DataFoot FeaturesLeg Features
High-arched footArch index ≤ 0.21Focused forefoot/heel pressure
Smaller contact surface
Heel pronation
Increased burden on knee and hip joints
Knee shows valgus and hip external rotation
Flat footArch index ≥ 0.26Increased pressure on mid-foot
Larger contact surface
Forefoot pronation
Increased burden on knee and hip joints
Knee shows Varus and hip internal rotation
Normal archArch index between 0.21–0.26Even pressure distributionStraight legs and stable gait
Genu varumDistance between inside of both knees > 30 mm
Femoral-tibial angle > 179°
Foot eversion
Arch collapse
Increased lateral plantar pressure
Increased burden on the lateral aspect of the knee
Lower limb force lines shifted outwards
Unstable gait
Genu valgumDistance between medial ankle bones > 30 mm
Femoral-tibial angle < 174°
Foot pronation
Arch increase
Increased medial plantar pressure
Increased burden on the medial aspect of the knee
Lower limb force lines shifted inwards
Unstable gait
Table 3. Mapping of Footwear Design Elements to Biometric Data.
User FeaturesFoot FeaturesLeg Features
High-arched footFocused forefoot/heel pressure ↔ L1(1), L2(2), L5(1)
Smaller contact surface ↔ L2(1), L3(4)
Heel pronation ↔ L2(3), L4(2), L5(3)
Increased burden on knee and hip joints ↔ L2(3), L6(3)
Knee shows valgus and hip external rotation ↔ L4(3), L5(2), L6(3)
Flat footIncreased pressure on mid-foot ↔ L1(3), L2(3)
Larger contact surface ↔ L3(3), L1(2)
Forefoot pronation ↔ L3(1), L2(4)
Increased burden on knee and hip joints ↔ L2(4), L5(3)
Knee shows Varus and hip internal rotation ↔ L4(2), L5(3), L6(4)
Normal archEven pressure distribution ↔ L5(4)Straight legs and stable gait ↔ L3(2), L5(4)
Genu varumFoot eversion ↔ L4(3), L5(4)
Arch collapse ↔ L2(4), L3(2)
Increased lateral plantar pressure ↔ L5(1), L2(2)
Increased burden on the lateral aspect of the knee ↔ L4(3), L5(4)
Lower limb force lines shifted outwards ↔ L6(3), L2(2)
Unstable gait ↔ L6(4), L2(4)
Genu valgumFoot pronation ↔ L4(2), L5(3)
Arch increase ↔ L1(3), L2(3)
Increased medial plantar pressure ↔ L5(3), L2(4)
Increased burden on the medial aspect of the knee ↔ L4(2), L5(3)
Lower limb force lines shifted inwards ↔ L6(4), L2(4)
Unstable gait ↔ L6(4), L2(4)
Table 4. Basic Information About the Participants.
GenderNumberAgeEducation Level
Male822~26Master’s degree
Female422~25Master’s degree
Table 5. Arch Index (AI) and Femoral Tibial Angle (FTA) Results.
Participants123456789101112
Left Foot AI0.1190.1880.2740.2140.1570.0950.0670.0330.2560.0770.1490.125
Right Foot AI0.1150.1970.2630.2170.1230.1380.1630.0650.3290.1240.1810.088
Left Leg FTA182°178°179°181°178°179°181°177°173°179°172°173°
Right Leg FTA180°175°179°180°177°179°182°173°171°179°173°173°
Table 6. Biodata-Driven KG Shoe Recommendation Results (Experimental group).
ParticipantsRecommended ShoesReason for Recommendation
1Nike Air Max 270Featuring a foam sole and air cushion construction with a low-top shape
2Nike ZoomX VaporflyCombines a foam sole, air cushion construction, carbon plate technology
3Asics Gel-Nimbus 23EVA midsole and rubber sole provide comfort and abrasion resistance
4Adidas Ultraboost 22Streamlined low-top design combined with air-cushioned construction
5Nike ZoomX VaporflySame as 2
6Nike ZoomX VaporflySame as 2
7Nike Air Max 1Low-top design with foam sole and air cushion construction
8Nike Air Zoom PegasusFoam sole, air cushion construction and removable insole
9Brooks Glycerin 19Features a combination of EVA midsole and rubber sole
10Nike ZoomX VaporflySame as 2
11Nike Air Zoom PegasusSame as 8
12Nike Air Zoom PegasusSame as 8
Table 7. Shoe Recommendation Results Based on User Preferences (Control group).
ParticipantsRecommended ShoesParticipantsRecommended Shoes
1New Balance NB 3277Timberland Motion6
2ERKE high-top boardshorts8Skechers D’Lites1
3Superstar Shoes9Balenciaga3xl
4Air Force 110Air Jordan 1
5ERKE boardshorts11Nike Vomero17
6Air Jordan 112Air Force 1
Disclaimer/Publisher’s Note: The statements, opinions and data contained in all publications are solely those of the individual author(s) and contributor(s) and not of MDPI and/or the editor(s). MDPI and/or the editor(s) disclaim responsibility for any injury to people or property resulting from any ideas, methods, instructions or products referred to in the content.