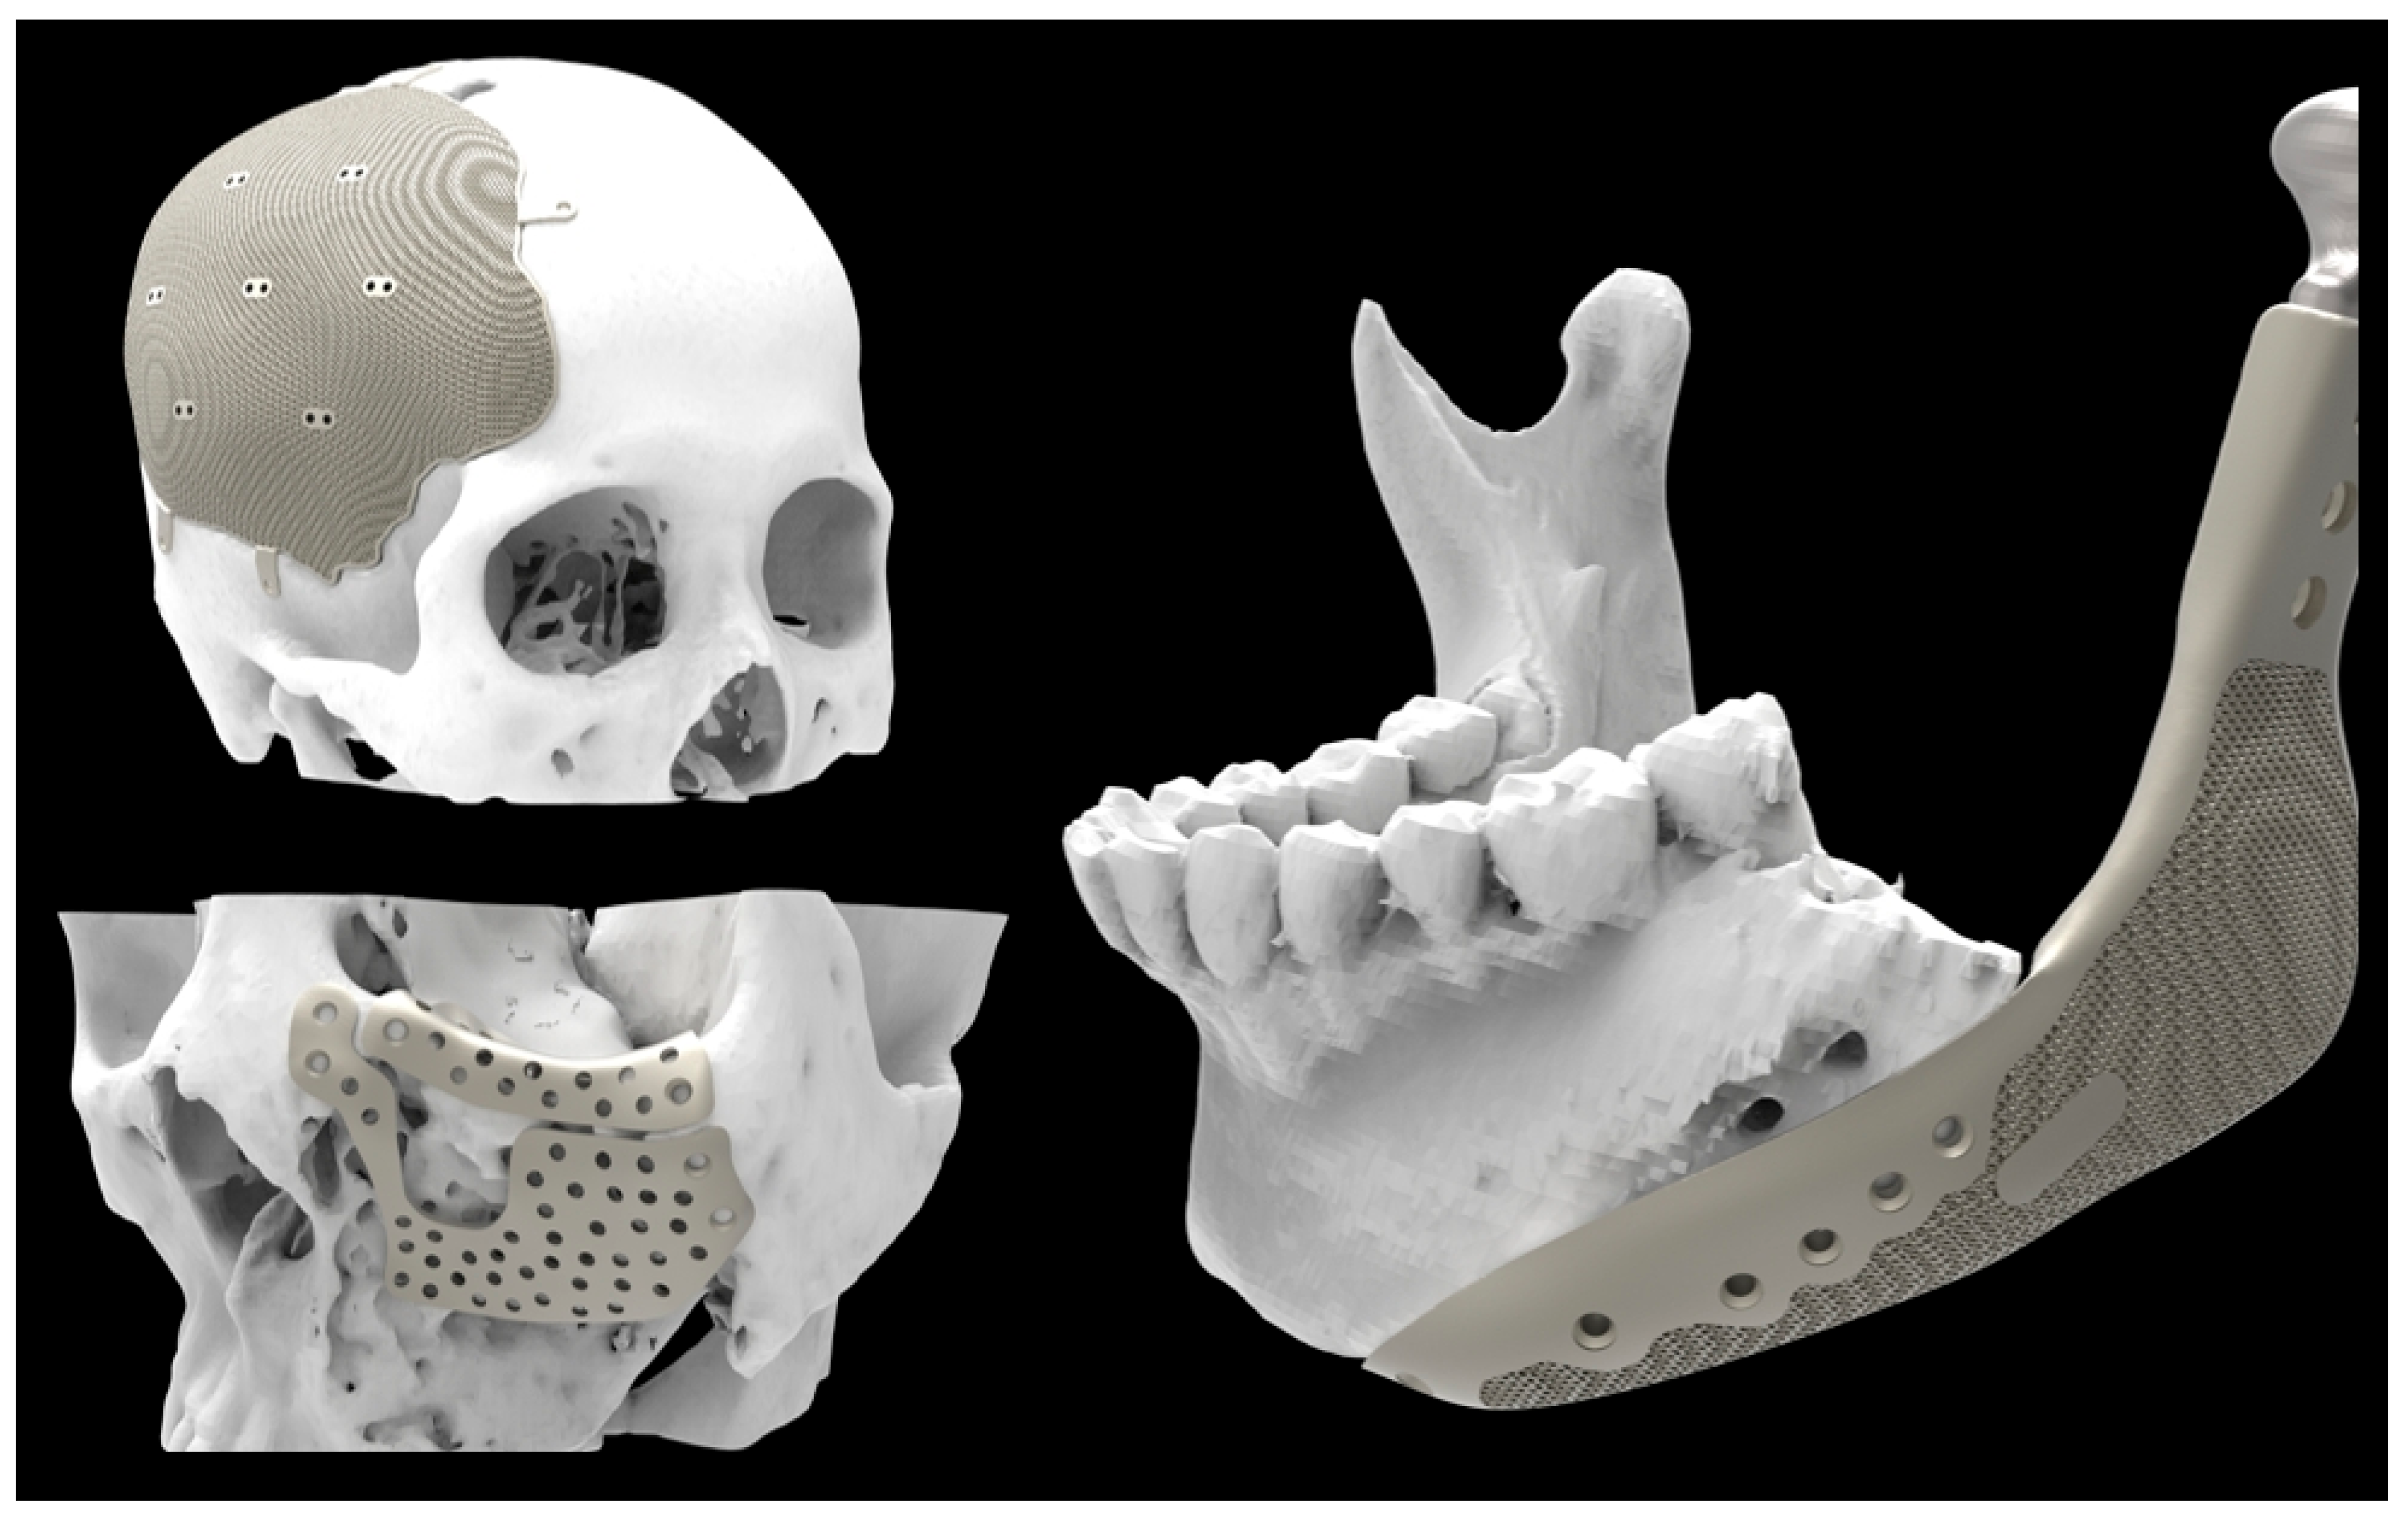
1. Introduction
Personalized medicine is becoming increasingly important in modern healthcare, and in line with this trend, three-dimensional (3D) printing technology has driven remarkable advances in patient-specific medical treatments. This technology enables the fabrication of highly customized implants that precisely match the patient’s anatomical structures, thereby improving surgical success rates and reducing recovery time [
1]. Among the various materials employed in 3D-printed medical devices, titanium has attracted significant attention due to its excellent mechanical strength, lightweight properties, and outstanding biocompatibility. These characteristics make titanium implants particularly advantageous in craniomaxillofacial reconstruction and orthopedic applications, where both durability and biological compatibility are critical factors [
2,
3].
With the increasing use of 3D-printed titanium implants, new challenges have emerged in radiotherapy planning, particularly regarding the accurate evaluation of radiation dose distribution in the presence of metallic implants. Patients with craniomaxillofacial tumors often require radiotherapy after implant placement, which complicates treatment planning. Titanium implants can significantly alter radiation absorption and scattering patterns in the surrounding tissues, making it essential to optimize dose calculation to ensure effective treatment while minimizing unintended side effects. Considering the growing adoption of 3D-printed titanium implants in clinical practice, further research is required to address these challenges and improve the accuracy of radiotherapy planning.
Radiotherapy planning primarily relies on computed tomography (CT) imaging, where the Hounsfield Unit (HU) serves as a crucial indicator of tissue density and radiation attenuation. In most cases, CT scans for radiotherapy are performed with an X-ray tube voltage of 120 kV, providing an optimal balance between image quality and accurate tissue density representation [
4,
5]. However, metallic implants, particularly titanium-based implants, often introduce severe artifacts in CT images, thereby complicating dose calculation.
These artifacts mainly arise from the beam hardening effect, in which the preferential absorption of low-energy photons alters the X-ray spectrum, and they are accompanied by scattering effects that produce streak artifacts [
6]. Such phenomena systematically shift HU values away from their true tissue-equivalent values, potentially leading to dose calculation errors that exceed clinically acceptable limits [
7,
8,
9].
Various strategies have been investigated to minimize HU distortion caused by metallic implants. Afifi et al. (2020) examined the effects of CT X-ray tube voltage and current variations on relative electron density (RED) and HU conversion curves, demonstrating that these parameters significantly influence dose calculation in radiotherapy [
10]. Similarly, Davis et al. (2017) emphasized the importance of optimizing CT protocols to improve image quality and ensure accurate dose delivery, thereby enhancing patient safety and treatment efficacy [
11]. These findings highlight the critical role of HU accuracy in radiotherapy planning and underscore the need for further research on HU distortion induced by implants.
Several approaches have been developed to reduce HU inaccuracies. One widely adopted method is the use of metal artifact reduction (MAR) algorithms, which mitigate implant-related artifacts in CT images and improve HU accuracy [
12]. Studies have reported that MAR techniques can decrease artifact severity by 48–79%, thereby enhancing dose calculation in radiotherapy [
13]. However, Gao et al. (2018) noted that although MAR algorithms effectively reduce metal-induced artifacts, they do not fully compensate for beam hardening effects in high-density metallic implants, leading to persistent HU distortions that can still affect dose calculation [
14].
Another strategy involves the use of dual-energy CT (DECT), which acquires separate datasets at two different X-ray tube voltages (e.g., 80 kV and 140 kV) and combines them to provide a more accurate analysis of material composition. DECT has been shown to improve material differentiation and minimize beam hardening effects, thereby enhancing HU accuracy [
15]. King et al. (2022) demonstrated that although DECT improves artifact reduction, it does not completely eliminate HU distortions in complex implant structures, particularly those based on titanium [
16].
Calibration curve methods, which adjust HU values based on specific materials and tube voltages, have also been employed to further improve the accuracy of dose calculation [
17]. Although calibration-based corrections are widely used, their accuracy depends on the reference dataset and the specific implant materials, thus requiring additional validation in clinical settings [
18]. These existing approaches demonstrate that achieving accurate HU values in CT-based radiotherapy planning remains a significant challenge.
Despite these advances, research on how these techniques apply to 3D-printed mesh implants remains limited. Titanium mesh implants are increasingly used in clinical practice due to their ability to enhance osseointegration while reducing overall material density [
19]. However, their impact on CT-based HU distortion and dose calculation has not been thoroughly investigated. Because the mesh structure differs from solid titanium in terms of density and X-ray attenuation, further exploration of its implications for radiotherapy planning is warranted [
20].
The purpose of this study is to quantitatively evaluate the impact of different implant materials on HU distortion in CT images and to analyze how these distortions affect dose calculation in radiotherapy. Specifically, the degree of HU distortion among solid titanium (Ti-solid), titanium mesh (Ti-mesh), and polyetheretherketone (PEEK) implants is compared to assess material-dependent variations that may underlie potential dose calculation errors. The findings of this study are expected to contribute to improved radiotherapy planning for patients with metallic implants, ultimately enhancing treatment precision and accuracy.
This study contributes to the field by systematically comparing PEEK, 3D-printed Ti-mesh, and solid Ti implants under extended-CT conditions, incorporating iMAR correction and dual-energy acquisition. Unlike prior studies that focused on a single material or imaging parameter, this work comprehensively quantifies HU distortion and dosimetric discrepancies among multiple clinically relevant materials.
2. Materials and Methods
2.1. Phantom Preparation
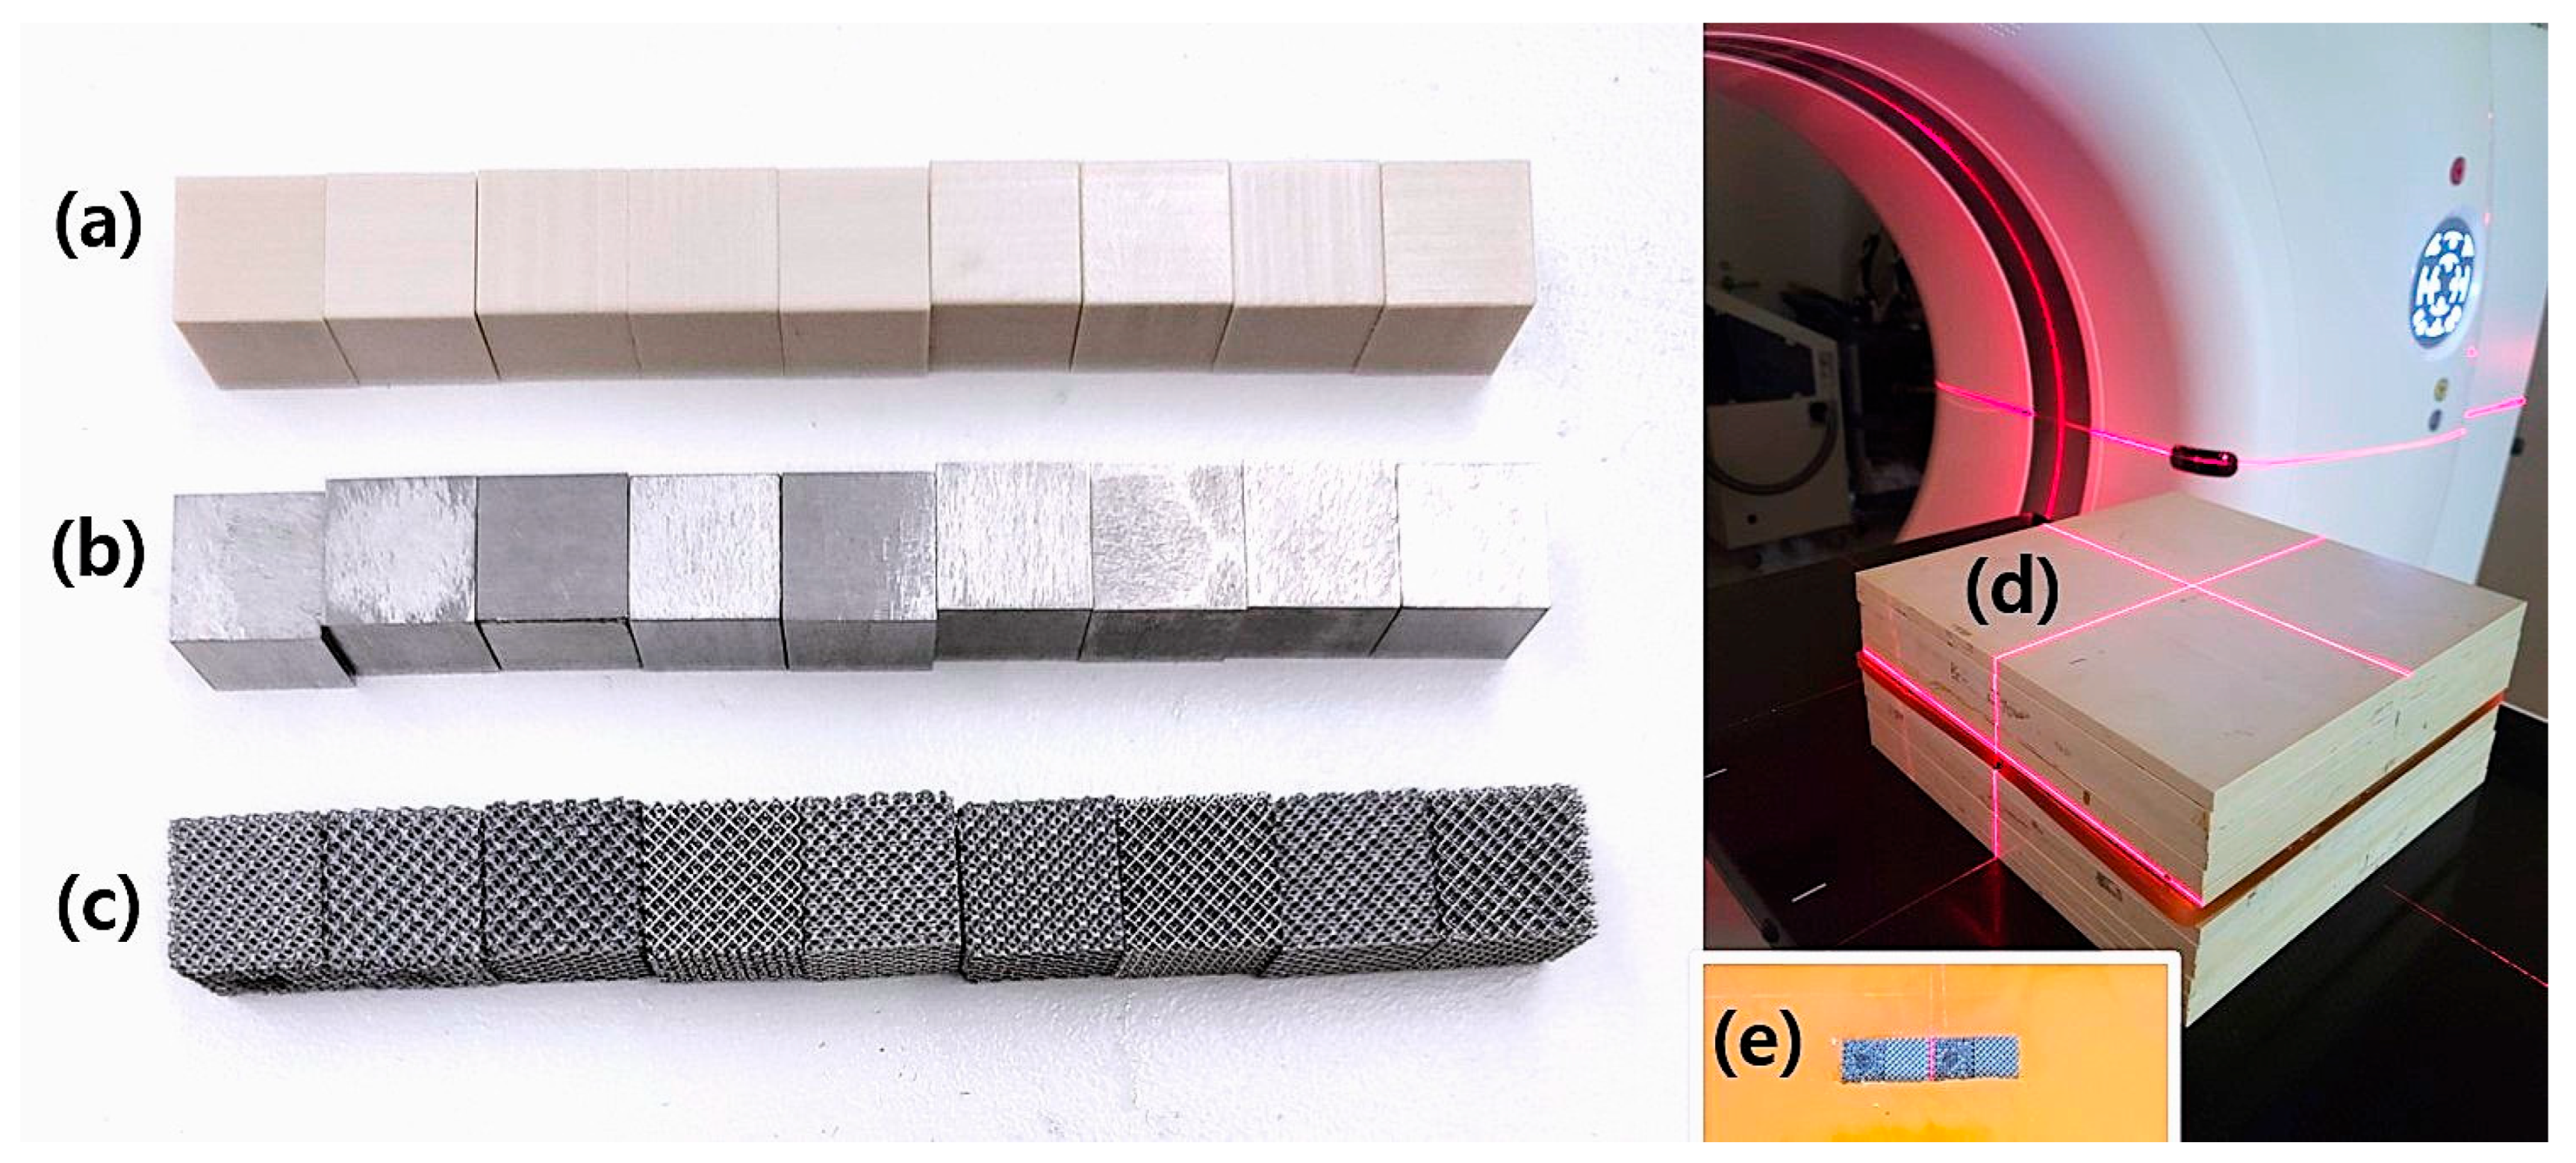
To evaluate the effects of different materials on radiotherapy planning, three cubic phantoms of PEEK, Ti-solid, and Ti-mesh were fabricated, each with a size of 1 cm
3. Although the 1 cm
3 cubic phantom differs morphologically from clinical implants, this standardized geometric configuration allows for a controlled comparison of HU distortion patterns across materials. The selected size provides a sufficient number of voxels for HU measurement while maintaining experimental reproducibility and eliminating confounding factors related to implant geometry [
21]. This standardized approach is essential for accurate inter-material comparisons and is widely recognized in radiotherapy research methodologies [
22,
23]. Moreover, this dimension is suitable for observing the beam hardening effect, a fundamental physical phenomenon governed by the Beer–Lambert law, which predictably scales with implant size [
24].
These materials were selected to represent the spectrum of implant options encountered in clinical radiotherapy: PEEK as a radiation-transparent polymer alternative, Ti-solid as the conventional standard for metallic implants, and Ti-mesh as a novel 3D printing technology designed to reduce artifact formation while enhancing osseointegration.
The PEEK phantom was fabricated from a biocompatible polymer commonly used in medical applications. This material complied with ASTM 2026 standards and had a density of 1.3 g/cm
3 [
25]. To ensure uniformity, the cubes were precisely manufactured using computer-aided design and manufacturing (CAD/CAM) processes.
The Ti-solid phantom was obtained as a prefabricated titanium cube with a measured density of 4.5 g/cm3, closely representing commercially pure titanium used in medical applications (theoretical density: 4.51 g/cm3). Unlike Ti-mesh, the Ti-solid material was not 3D-printed but was procured as a finished product for experimental use.
The Ti-mesh phantom was fabricated from Ti6Al4V-ELI (Grade 23) titanium alloy, which is widely used in medical implants and complies with ASTM F136 and F3001-14 standards [
26,
27]. The mesh structure was produced using selective laser melting (SLM), with pore sizes ranging from 750 to 850 µm. This design was optimized to enhance osseointegration and mechanical stability. The mesh geometry was modeled and printed using Magics 24.01 software (Materialise NV, Leuven, Belgium). Each phantom was fabricated to enable quantitative analysis of HU distortion patterns specific to the material, and this standardized approach allowed systematic evaluation of beam hardening effects and the effectiveness of artifact reduction techniques.
2.2. CT Scanning and CT Calculation Table Generation
CT scans were performed using a simulation CT scanner specifically designed for radiotherapy planning (SOMATOM Definition AS, Siemens Healthineers, Forchheim, Germany). To ensure reproducible imaging conditions across all measurements, the following parameters were standardized: convolution kernel H40s (selected for optimal soft tissue–bone contrast), tube current 323 mA, rotation time 1.0 s, image matrix size 512 × 512, and slice thickness 1 mm.
For the experimental setup (
Figure 1), six 1 cm-thick solid water phantoms were placed as the base layer, and a 1 cm-thick bolus containing a 1 cm × 4 cm rectangular cavity was positioned above them. Three 1 cm
3 material cubes (PEEK, Ti-solid, and Ti-mesh) were linearly arranged along the anterior–posterior axis within this cavity. To ensure consistent geometric positioning across all scans, the isocenter was aligned with the center of the material arrangement.
To evaluate energy-dependent HU variations, CT images were acquired at two tube voltage conditions (120 kV and 140 kV) using the same tube current. All images were stored in 16-bit integer format (−32,768 to +32,767), and two HU scales were used in clinical practice. The standard HU scale (approximately −1024 to +3071) is sufficient for representing typical soft tissues and bony structures, whereas the extended HU mode allows representation beyond this range, up to tens of thousands of HU, enabling accurate depiction of high-density materials such as titanium without saturation [
28,
29]. In addition, to mitigate image distortions caused by metallic artifacts, the iterative Metal Artifact Reduction (iMAR) algorithm was applied during image reconstruction [
8,
30].
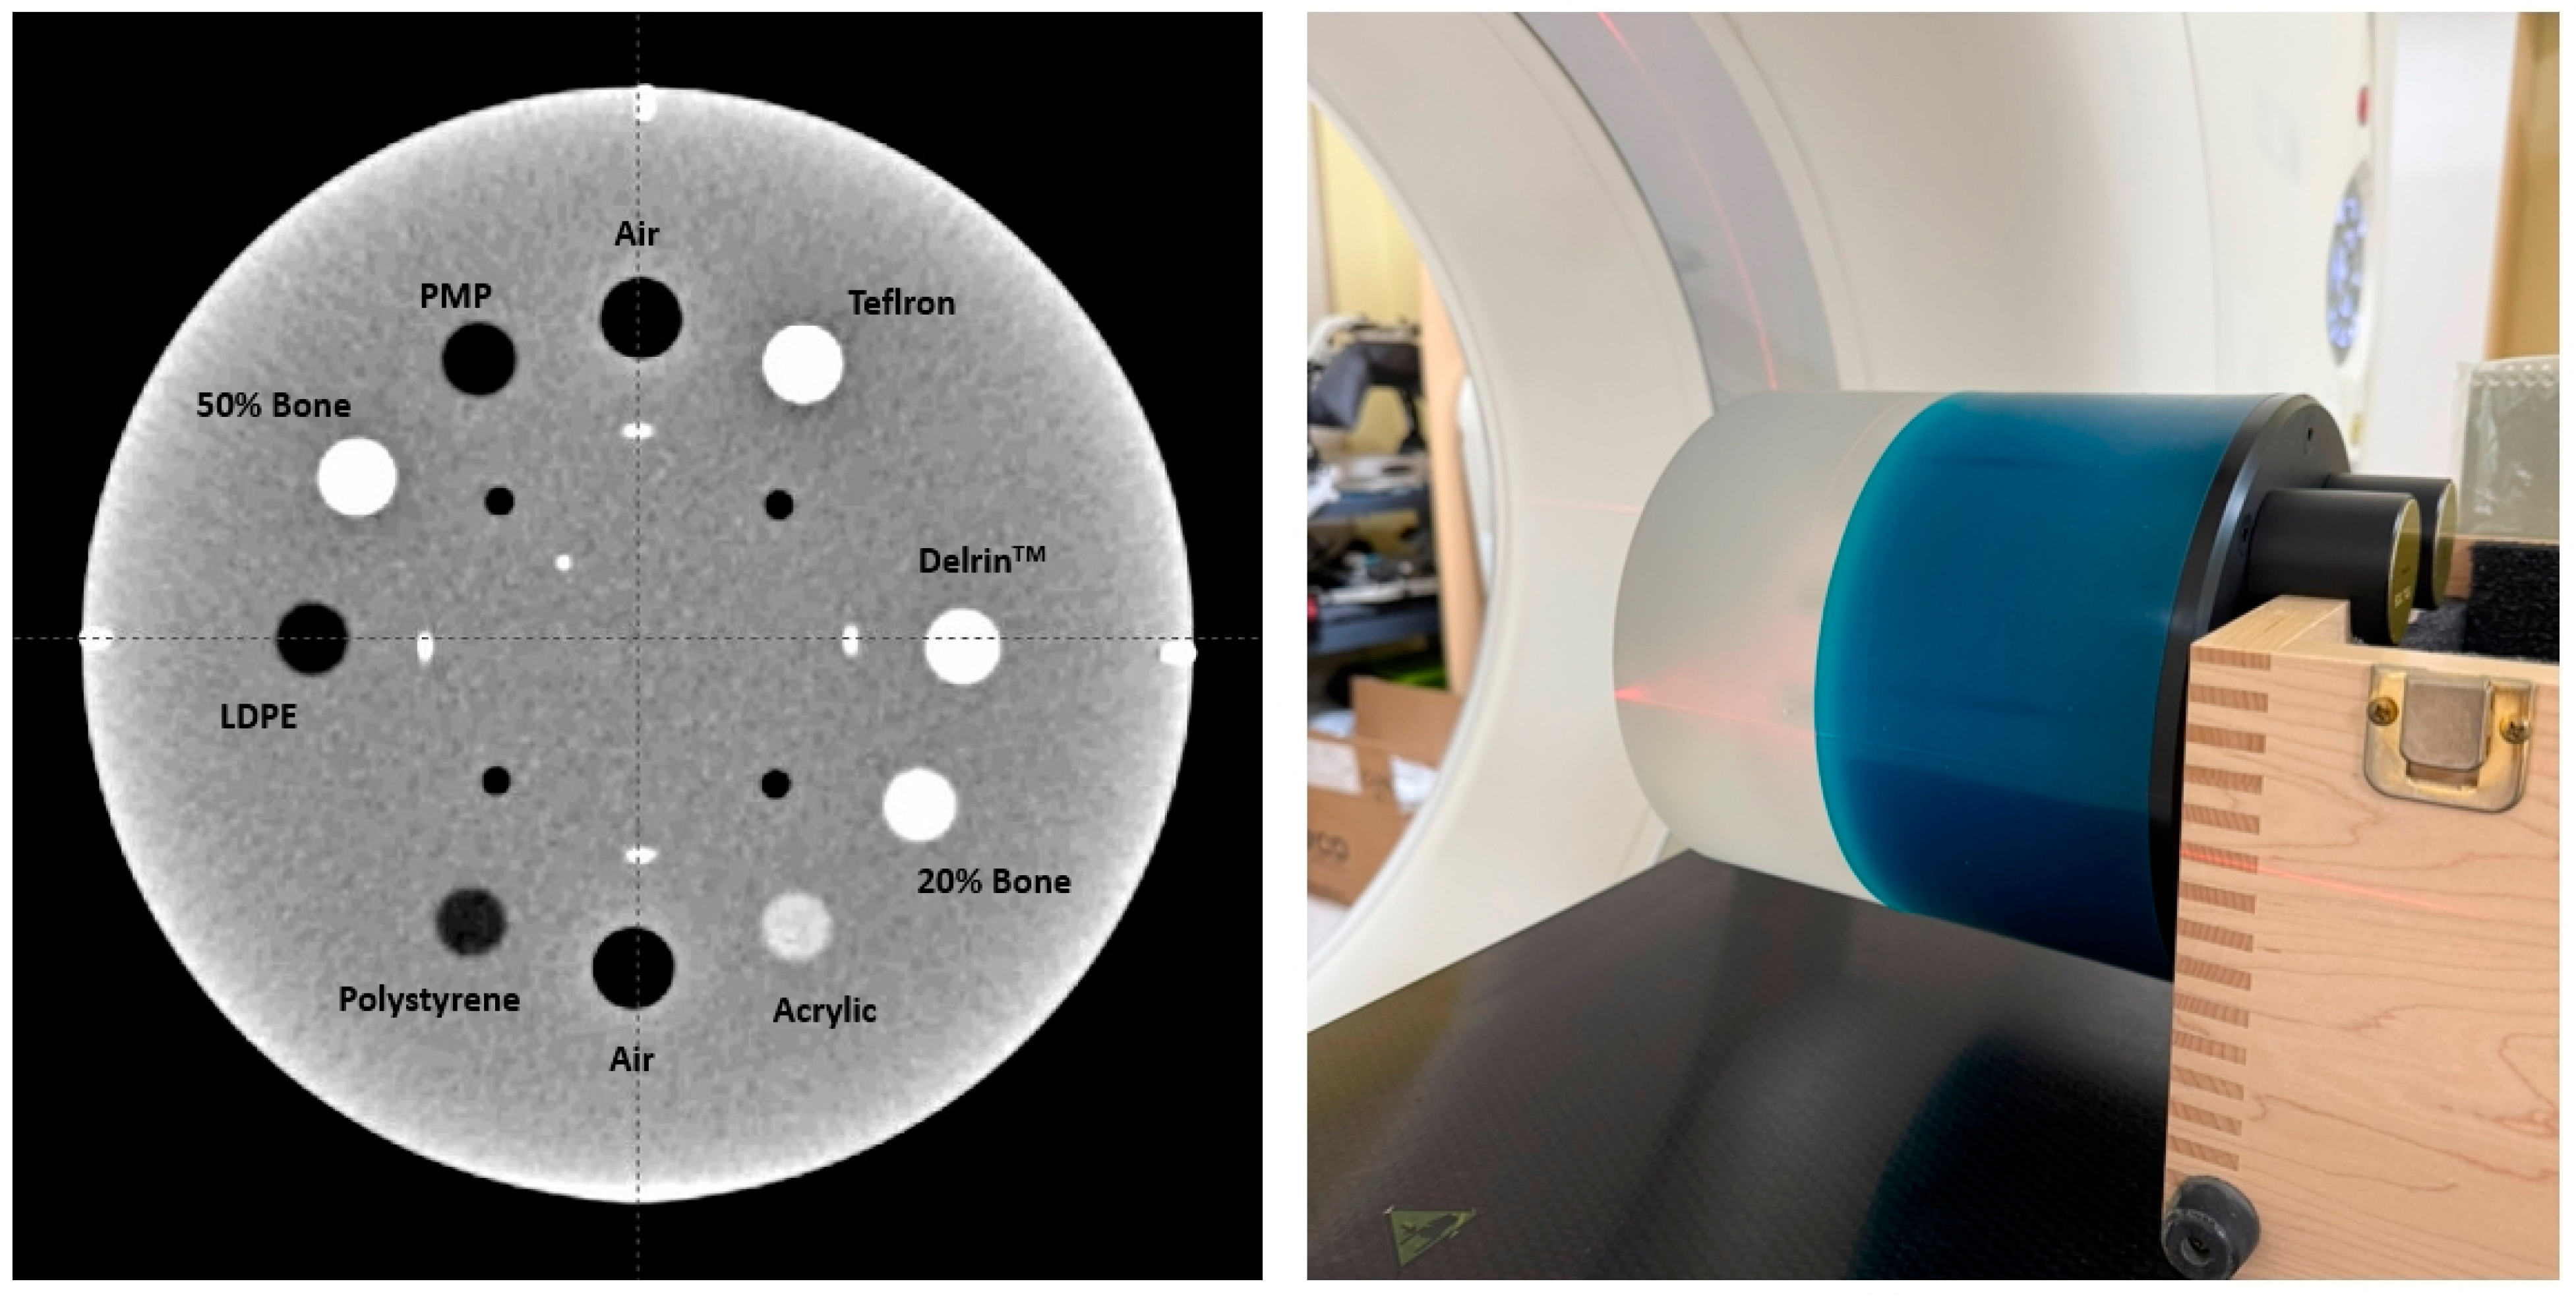
To generate CT calculation tables for 120 kV (16-bit CT) and 140 kV (16-bit CT), the Catphan-604 phantom was scanned (
Figure 2) [
31]. HU values were measured from various density inserts to construct calibration curves that convert HU values into electron density. This step ensured accurate dose calculation for radiotherapy planning. In addition, CT images of carbon, aluminum, and titanium cubes were acquired, and their specific HU values were incorporated into the CT calculation tables to further improve the accuracy of material-dependent dose calculation [
32].
2.3. Radiotherapy Planning
CT images of the phantoms were imported into the Eclipse v15.7 radiotherapy treatment planning system (Varian Medical Systems, Palo Alto, CA, USA), and two different treatment plans were established. A Volumetric Modulated Arc Therapy (VMAT) plan was created to evaluate the effects under a rotational irradiation environment similar to clinical treatment conditions. In the VMAT plan, a planning target volume (PTV) was defined posterior to the central cube with dimensions of 2 cm in depth, 9 cm laterally, and 5 cm vertically, with the isocenter placed at the center of the PTV. This configuration simulated radiotherapy delivery to tissues located posterior to metallic implants in actual clinical practice. To reflect clinical constraints, additional structures representing organs at risk (OARs) were placed on the left, right, and posterior sides of the PTV.
The VMAT plan consisted of dual arcs, each rotating approximately 358° in clockwise and counterclockwise directions. This design allowed for a comprehensive evaluation of the impact of metallic artifacts on dose calculation under complex dose distributions and multi-angle irradiation. A prescription dose of 200 cGy was uniformly delivered to the isocenter located at the center of the PTV.
In all plans, dose calculations were performed using the 120 kV and 140 kV CT calculation tables with a 6 MV photon beam. The Acuros XB algorithm (version 15.7) in Eclipse was employed for dose computation, with the density of Ti-solid explicitly assigned as titanium to more accurately model the complex scattering phenomena around metallic implants. The collimator angle was set to 30°/330°, and the couch angle was fixed at 0°.
2.4. Dose Verification and Gamma Analysis
For each material type (PEEK, Ti-solid, and Ti-mesh), five repeated measurements were performed, one per day over five consecutive days, to ensure reproducibility. To further enhance measurement consistency and reduce operator bias, two medical physicists alternated in setting up the measurements.
Dose measurements were performed using the Matrixx FFF system (IBA Dosimetry, Louvain-la-Neuve, Belgium). This system consists of 1020 ionization chambers, each with a volume of 0.032 cm3, arranged in a 32 × 32 grid with a detector spacing of 7.6 mm, enabling high-resolution dose measurements. The total measurement area was 24.4 × 24.4 cm2. All measurements were subjected to daily quality assurance in accordance with AAPM TG-142 guidelines, including checks of dose linearity and consistency.
Dose accuracy was evaluated using gamma analysis according to the recommendations of AAPM TG-218. The evaluation criterion was set to 3%/3 mm, and the myQA software (version 2018; IBA Dosimetry, Schwarzenbruck, Germany) was used for analysis. Gamma evaluation was performed with global normalization and a 10% dose threshold, and the clinical acceptance criterion was defined as a gamma pass rate of ≥95%. For each condition, five repeated measurements were summarized as the mean, standard deviation, and range. In addition, a 95% confidence interval (95% CI) was calculated for the gamma pass rate to assess measurement reliability. To quantitatively compare differences between materials, effect sizes (Hedges’ g) were calculated and interpreted as small (g ≈ 0.2), medium (g ≈ 0.5), or large (g ≥ 0.8). Group differences were interpreted by considering these statistical indicators together with the clinical acceptance criterion.
2.5. Image Analysis
CT artifact analysis was performed by dividing the measurement region into the internal cube region (1 cm3) and the surrounding regions of interest (ROIs). ROIs were defined at standardized positions anterior, posterior, left, and right to each phantom cube, with an area of 3 × 3 cm2.
HU profiles were measured along both the X-axis (depth direction) and the Y-axis (lateral direction) through the isocenter, sampled at 1 mm intervals from the entrance surface (0 cm) to a depth of 12.5 cm. Image noise was quantified as the standard deviation of HU values within a homogeneous ROI, and the signal-to-noise ratio (SNR) was calculated as SNR = mean HU/background standard deviation.
3. Results
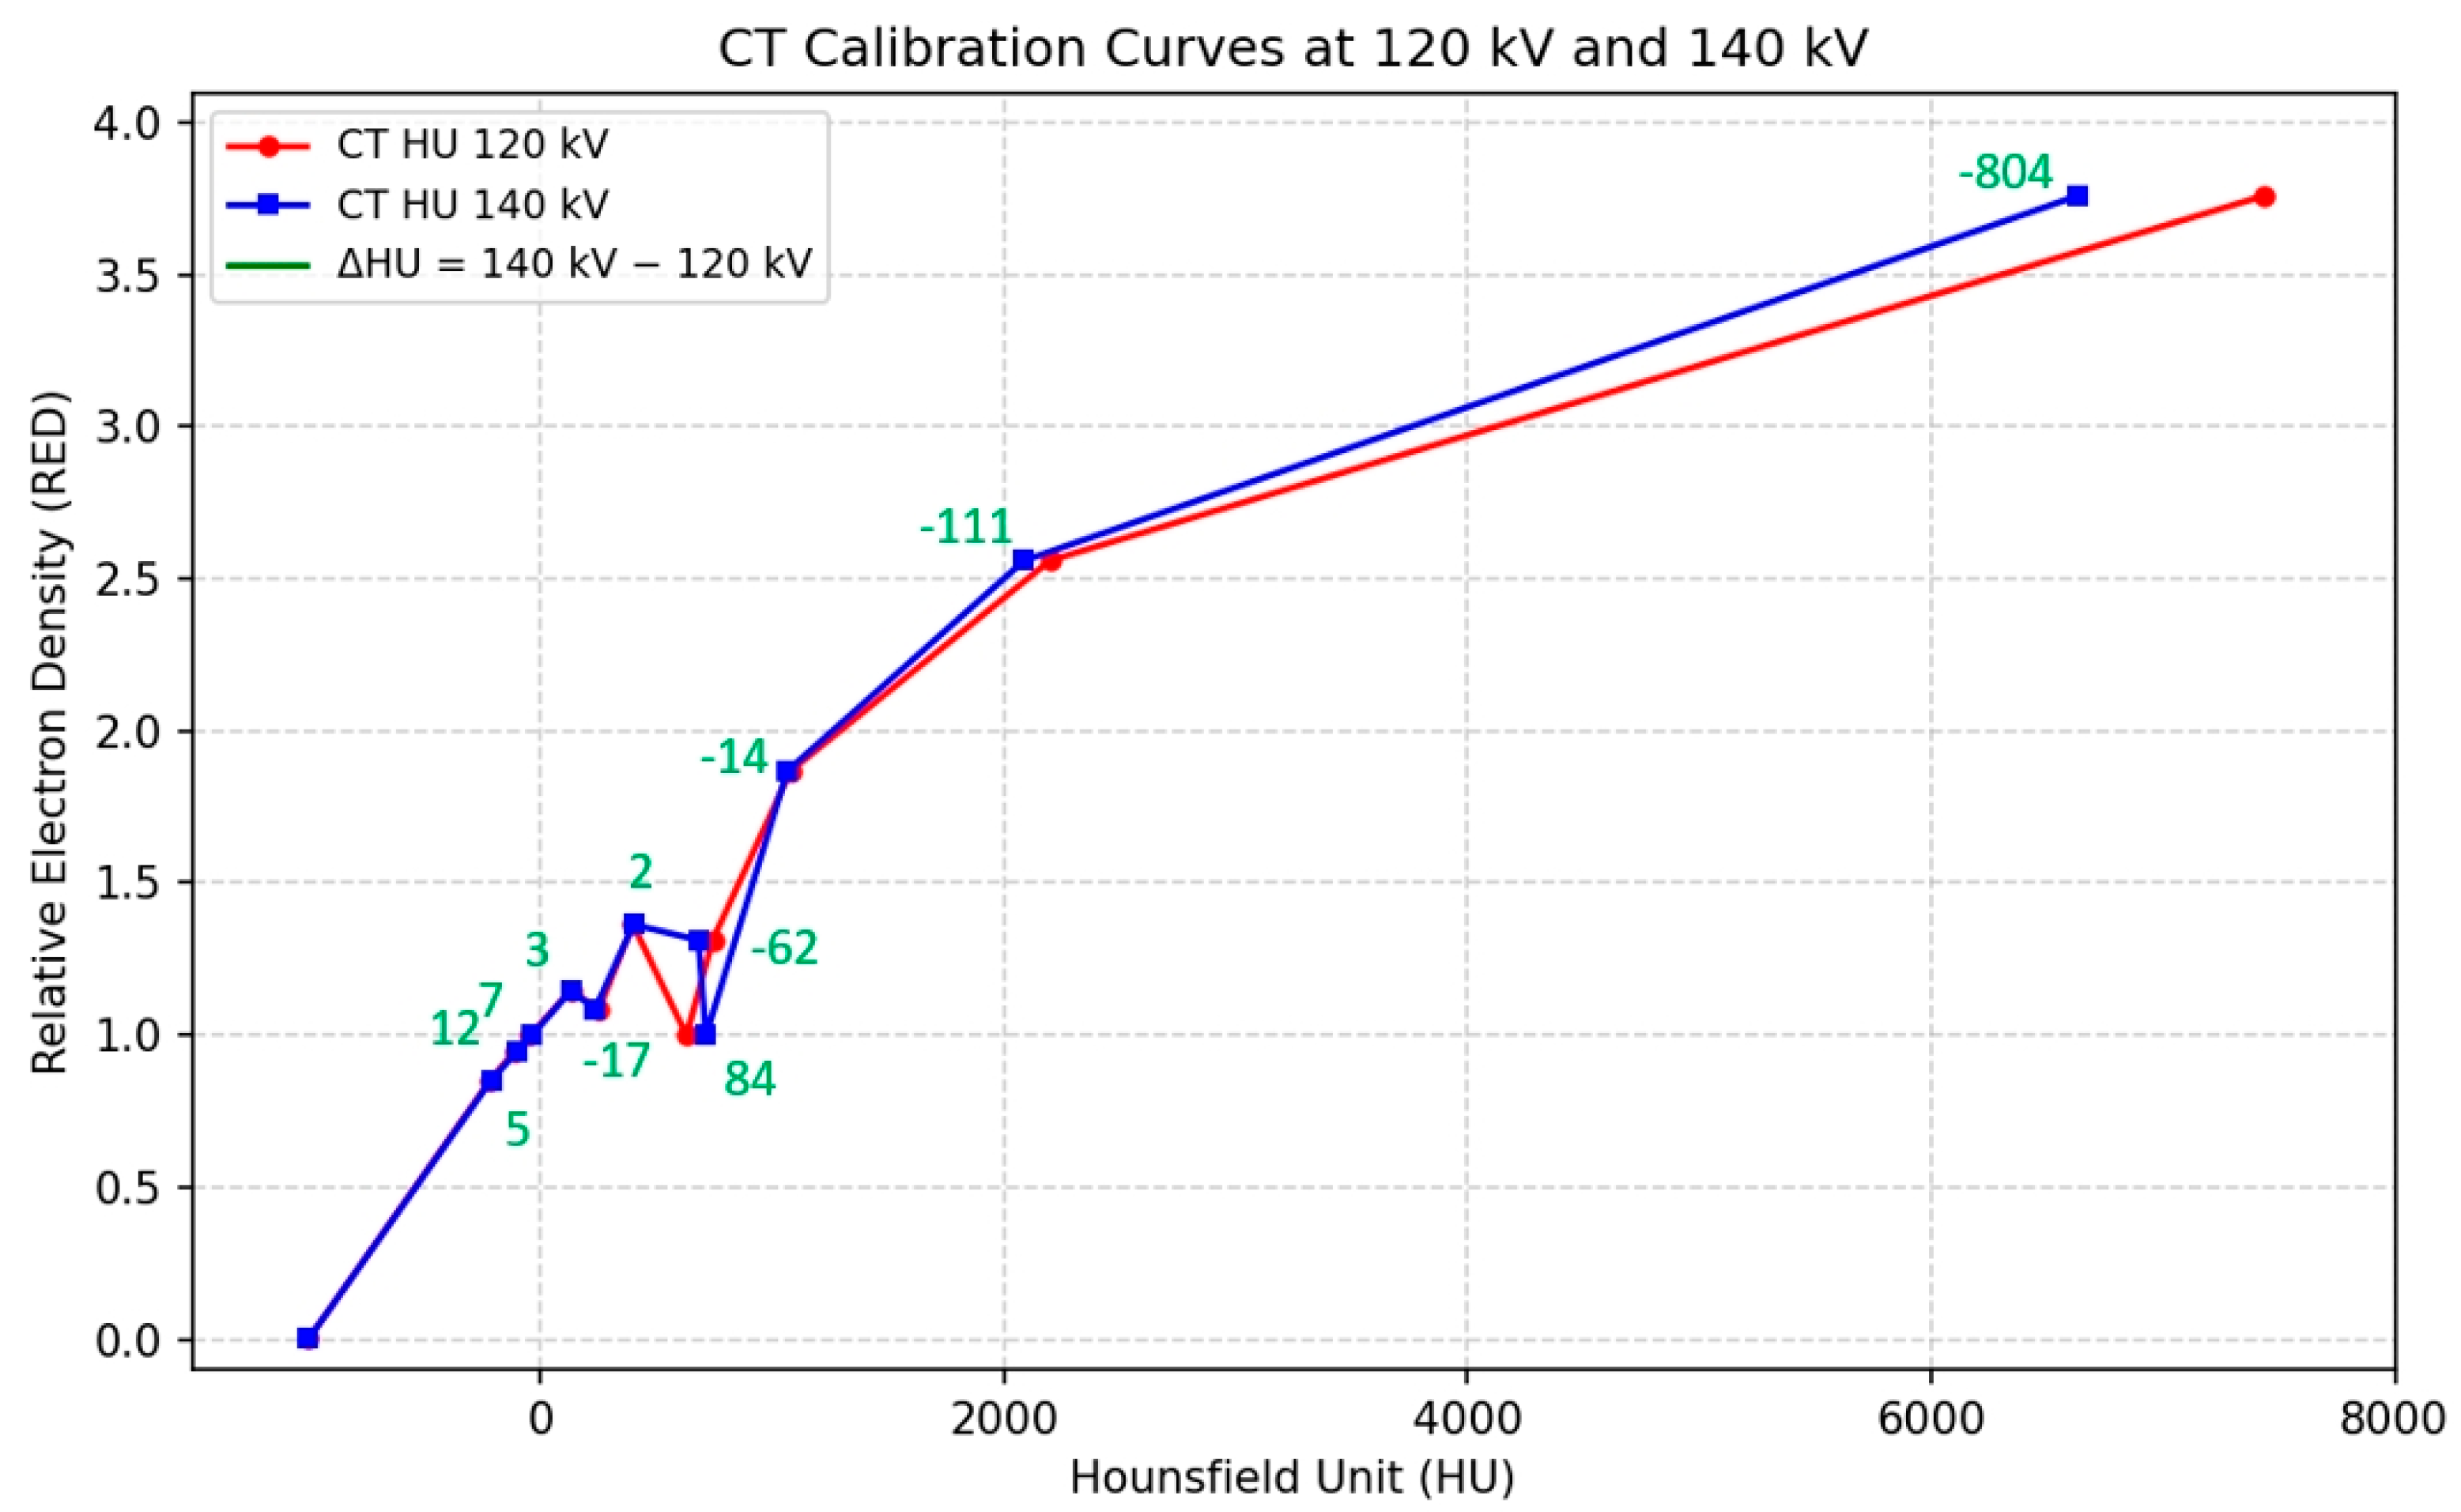
The Catphan 604 phantom was scanned at 120 kV and 140 kV to generate CT calculation tables. HU values were measured from inserts of varying densities, and calibration curves were derived to convert HU into relative electron density (RED).
Figure 3 shows the CT calibration curves obtained at 120 kV and 140 kV, both demonstrating strong linear correlations between HU and RED (120 kV: r = 0.995,
p < 0.001; 140 kV: r = 0.995,
p < 0.001). The HU differences between 140 kV and 120 kV varied by material density as follows: a mean of +8.7 HU for low-density materials (RED < 1.0), −23.1 HU for medium-density materials (RED 1.0–2.0), and −445.5 HU for high-density materials (RED > 2.0). The overall mean difference was −67.5 ± 267.2 HU, with a maximum difference of −804 HU.
Figure 4a–f illustrates the dose distributions for PEEK, Ti-mesh, and Ti-solid implants at 120 kV with and without iMAR reconstruction. The figure shows that PEEK produced minimal beam-hardening effects, Ti-mesh demonstrated moderate artifact reduction, and Ti-solid resulted in pronounced streak artifacts.
Figure 5a–f presents HU comparisons for PEEK, Ti-mesh, and Ti-solid across a 12.5 cm depth profile at 120 kV and 140 kV. PEEK demonstrated high measurement reproducibility, showing −261.3 ± 1.2 HU (CV = 0.4%) at 140 kV and −253.0 ± 6.1 HU (CV = 2.4%) at 120 kV at the entry surface. Within the cube, stable values around 200 HU were observed, with only minor changes following the application of iMAR. Ti-mesh exhibited good reproducibility within the cube, with 1001 ± 10 HU at 140 kV and 1256 ± 15 HU at 120 kV, indicating an energy dependence of approximately 255 HU. A slight increase was observed after applying iMAR.
Ti-solid exhibited the highest HU values at the center of the cube, measuring 6612 ± 43 HU (CV = 0.65%) at 140 kV and 7422 ± 134 HU (CV = 1.81%) at 120 kV, indicating an energy dependence of 810 HU. No statistically significant changes were observed following the application of iMAR.
All materials demonstrated excellent measurement reproducibility, with coefficients of variation below 2%. Ti-solid showed approximately 6.6-fold higher HU values than Ti-mesh and about 25-fold higher values than PEEK. The effect of iMAR was limited across all materials. In summary, PEEK exhibited stable and highly reproducible HU distributions, Ti-mesh showed moderate levels of distortion, and Ti-solid presented the most severe HU distortion.
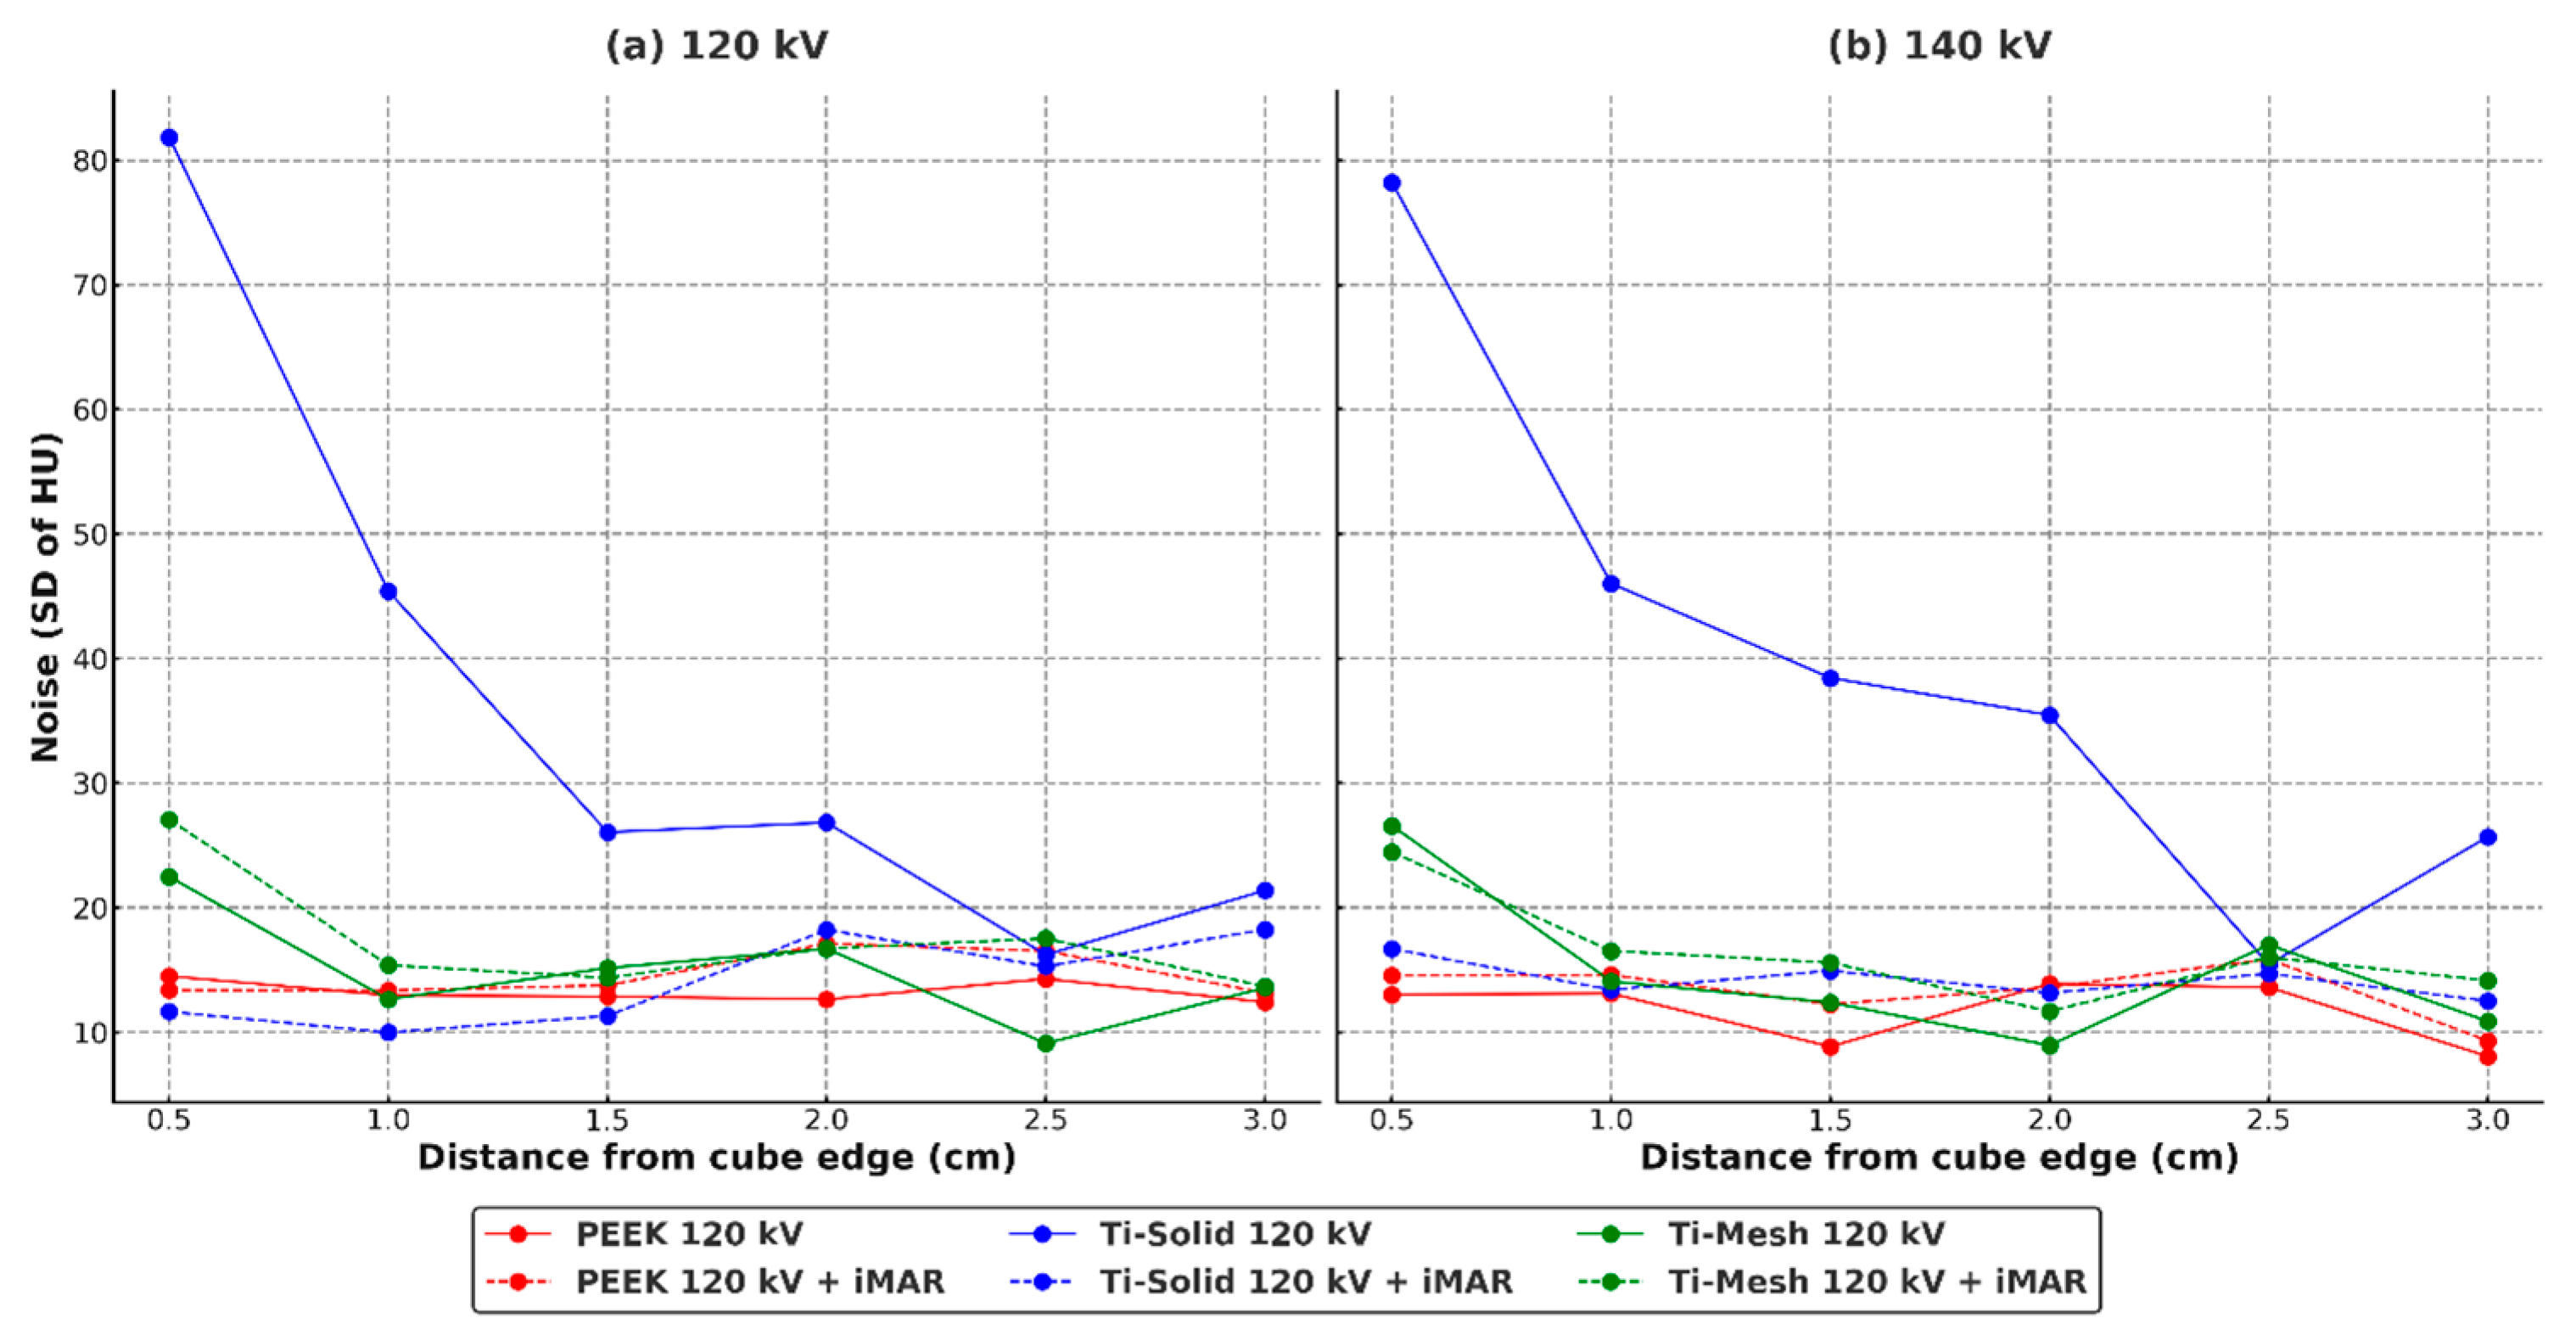
Figure 6 illustrates the noise characteristics of each material and the effect of iMAR. Ti-solid exhibited extremely high noise at the boundaries (120 kV: 81.86; 140 kV: 78.22), but showed a dramatic reduction of more than 80% following the application of iMAR. In contrast, Ti-mesh demonstrated baseline noise levels approximately 70% lower than Ti-solid, with the effect of iMAR differing by energy condition—increasing at 120 kV and decreasing at 140 kV. PEEK consistently maintained stable low-noise levels under all conditions and was unaffected by iMAR.
Figure 7 presents a comparison of PDD profiles for PEEK, Ti-mesh, and Ti-solid under 120 kV and 140 kV conditions, with and without iMAR. At a depth of 2 cm, Ti-solid showed the highest PDD values (120 kV: 168.0%; 140 kV: 165.6%), Ti-mesh demonstrated intermediate values (153.3–153.4%), and PEEK exhibited the lowest value (150.3%). Beyond 8 cm, all materials converged to similar values (102–104%).
With the application of iMAR, a distinct reduction in PDD was observed only for Ti-solid. At a depth of 2 cm, values decreased from 168.0% to 161.3% at 120 kV and from 165.6% to 159.7% at 140 kV. In contrast, Ti-mesh and PEEK exhibited changes of less than 1%. Energy dependence was most pronounced in Ti-solid, showing a 2.4% difference at 2 cm, whereas in the posterior region, differences were less than 1% for all materials.
The results of absolute point dose comparison and gamma evaluation for the VMAT plans are summarized in
Table 1. For each condition, five repeated measurements were performed to ensure reproducibility and statistical reliability. In point dose analysis, the mean absolute dose differences across all material conditions ranged from 3.91 ± 0.24 cGy to 4.37 ± 0.34 cGy, corresponding to within 2.2% of the total prescribed dose (200 cGy), which was considered clinically acceptable. The standard deviations from repeated measurements ranged from 0.24 to 0.38 cGy, demonstrating stable reproducibility. In the energy-dependent comparison, the 140 kV condition showed slightly lower absolute dose differences and higher gamma pass rates compared with the 120 kV condition.
In the VMAT plans, absolute point dose comparisons and gamma analysis results are presented in
Table 1. Five repeated measurements were performed for each condition to ensure reproducibility and statistical reliability. Both PEEK and Ti-mesh demonstrated stable characteristics, with high gamma pass rates of 97–98%. In contrast, Ti-solid showed clearly lower values, ranging from 89% to 94%, failing to meet the clinical acceptance criterion of 95% in some cases. These differences were considered meaningful when compared with the clinical threshold and were further confirmed by effect size analysis. Specifically, Ti-solid exhibited very large effect sizes compared with PEEK (Hedges’ g ≈ 3.8 at 120 kV; g ≈ 1.7 at 120 kV + iMAR) and large effect sizes compared with Ti-mesh (g ≈ 3.9 at 120 kV), indicating that the reduction in gamma pass rate was both statistically significant and clinically relevant. By contrast, the difference between PEEK and Ti-mesh was negligible (g < 0.1). These findings may be related to the complexity of metallic artifacts and the limited effectiveness of iMAR correction algorithms.
The effect of iMAR varied by material. For Ti-solid, the gamma pass rate improved from 90.9% to 93.2% at 120 kV, but decreased from 94.1% to 89.0% at 140 kV. In contrast, PEEK and Ti-mesh showed no appreciable changes in dose accuracy with iMAR application.
4. Discussion
The HU profile analysis performed in this study confirmed that the pattern of HU distortion differed markedly depending on the implant material, and these variations could affect the accuracy of dose calculation in radiotherapy. It should be noted that the 1 cm
3 cubic phantom geometry used in this study represents a simplified model compared with actual clinical implants. This configuration was intentionally chosen to minimize shape-related confounding factors and to enable controlled inter-material comparisons under standardized conditions. PEEK exhibited the smallest HU fluctuations (CV < 3%) and provided stable dose calculation results under all conditions. As a low-electron-density, non-metallic material, PEEK generated only limited X-ray scattering artifacts and did not induce beam hardening effects, thereby maintaining stability in dose calculation. These findings suggest that PEEK is relatively suitable for applications in radiotherapy [
33].
In this study, Ti-solid exhibited severe HU distortion, with central HU values exceeding 6000–7000 at both 120 kV and 140 kV. This phenomenon can be attributed to beam hardening and cupping artifacts, which occur as low-energy photons are selectively absorbed in high-density metals. The Beer–Lambert law (I = I
0 exp[−μx]), which is applicable to monochromatic X-rays, does not sufficiently describe the characteristics of the polychromatic X-ray beams used in clinical practice. A more accurate representation is given by I = I
0 ∫ S(E) exp[−μ(E)x] dE, where selective attenuation of low-energy photons increases the relative proportion of high-energy photons in the transmitted beam. This process is the fundamental cause of cupping artifacts [
34].
Compared with Ti-solid, Ti-mesh demonstrated substantially reduced HU distortion, highlighting the advantages of its porous structure. The air gaps within the mesh helped mitigate beam hardening effects and enabled a more uniform HU distribution. In this study, the HU value of Ti-mesh measured at 140 kV was approximately 1001 ± 10 HU, which was significantly lower than that of Ti-solid, suggesting potential improvements in the accuracy of dose calculation.
The air-filled condition within the mesh structure modeled in this study adequately reflects the actual clinical situation. In a clinical case of 3D-printed titanium implants reported by Park et al. (2020), the rate of tissue integration was only 45.96%, and substantial air spaces within the mesh were observed to persist over an extended period [
35,
36,
37]. This supports the validity of the air-filled mesh model applied in this study. The 1 cm cube size falls within the range of implant dimensions commonly used in clinical practice, while analysis centered on VMAT techniques reflects mainstream radiotherapy practice and provides a comprehensive assessment of the impact of metallic artifacts.
Standardized 1 cm3 cubic phantoms were employed to ensure comparability and reproducibility. As mentioned earlier, this simplified configuration does not fully represent clinical implant geometries but provides a reliable basis for quantifying material-dependent HU distortion and dosimetric differences.
In dosimetric verification, point dose analysis demonstrated clinically acceptable accuracy across all materials, with mean absolute dose differences ranging from 3.91 ± 0.24 cGy to 4.37 ± 0.34 cGy. However, gamma analysis revealed distinct material-dependent differences. PEEK consistently achieved high pass rates between 96.1 ± 1.4% and 98.1 ± 1.0%, whereas Ti-solid showed relatively poor performance with pass rates ranging from 89.0 ± 2.0% to 94.1 ± 1.7%. Ti-mesh exhibited performance comparable to PEEK, with pass rates between 97.4 ± 1.1% and 98.0 ± 1.1%, confirming the advantages of its porous structure. Effect size analysis further supported these findings: Ti-solid demonstrated very large effect sizes compared with PEEK (Hedges’ g > 3.5 at 120 kV) and large effect sizes compared with Ti-mesh (g > 3.5), indicating that the reduction in gamma pass rate was both statistically significant and clinically meaningful. In contrast, the difference between PEEK and Ti-mesh was negligible (g < 0.1), suggesting that their dosimetric performance was essentially equivalent.
The dosimetric advantages observed in this study are consistent with previous findings. Katsifis et al. (2022) reported a 10–15% dose enhancement at the proximal interface of titanium implants due to internal cavities, whereas no significant dose variations were observed with PEEK [
38]. Similarly, Müller et al. (2020) demonstrated that in IMPT plans, titanium implants led to an average increase of 7.6 ± 2.3% in standard deviation within the target, whereas carbon fiber–reinforced PEEK showed only a 3.4 ± 1.2% increase, displaying a pattern similar to mesh structures [
39]. These studies suggest that mesh or composite structures improve dose calculation accuracy compared with solid metallic implants. However, unlike these prior studies, which primarily focused on proton or IMPT dose perturbations, the present work quantitatively compares HU distortion and dose calculation accuracy among different implant materials (PEEK, Ti-mesh, and Ti-solid) using an extended-CT protocol.
These comparisons highlight not only the consistency of our results with established literature but also the novel contribution of evaluating iMAR correction effects and kV-dependency in a unified framework, thereby reinforcing the clinical relevance of Ti-mesh structures. This effect is interpreted as a consequence of intrinsic air gaps within the structure, which mitigate beam hardening, enhance HU stability, and thereby minimize dose calculation errors.
In this study, the ~90% gamma pass rate observed for Ti-solid indicates a systematic error between the calculated and measured doses. Although point dose accuracy was comparable across all materials, the differences in gamma pass rates suggest that the complexity and uncertainty of spatial dose distributions are differentially influenced by the material properties.
A clear correlation was observed between the HU profile analysis and the gamma pass rates. Ti-solid exhibited the highest HU values at the cube center (120 kV: 7422 ± 134 HU, 140 kV: 6612 ± 43 HU) and the lowest gamma pass rates (89.0–94.1%). Ti-mesh demonstrated relatively lower HU values (120 kV: 1256 ± 15 HU, 140 kV: 1001 ± 10 HU) and higher pass rates (97.4–98.0%). PEEK maintained stable HU values with consistently high pass rates (96.1–98.1%). This pattern confirms that the degree of HU distortion in CT imaging directly affects the accuracy of dose calculation.
The reproducibility confirmed through five repeated measurements demonstrated the greatest variability in Ti-solid (SD = 1.7–2.0%), reflecting the uncertainty of dose delivery in complex metallic environments. Therefore, in treatment planning for patients with metallic implants, it is advisable to account for such calculation uncertainties and to consider additional verification methods or alternative dose calculation techniques.
The effect of iMAR application varied depending on the material. For Ti-solid, the pass rate improved from 90.9% to 93.2% at 120 kV, but paradoxically decreased from 94.1% to 89.0% at 140 kV. This opposing energy-dependent effect arises from a mismatch between the beam-hardening correction model of the iMAR algorithm and the actual X-ray spectrum characteristics [
6,
8]. At 120 kV, where low-energy photons are abundant and pronounced beam hardening occurs, iMAR correction is effective. In contrast, at 140 kV, the beam is already hardened, and repeated corrections by iMAR may introduce new artifacts [
40,
41]. On the other hand, PEEK and Ti-mesh showed no significant changes in dose accuracy with iMAR application. As confirmed in this study, under the standard 120 kV clinical condition, iMAR can partially mitigate artifacts in Ti-solid. Although the 140 kV setting is not routinely used in clinical practice, it may be considered as an auxiliary option when severe metallic artifacts are present. However, the present findings indicate that iMAR at 140 kV can reduce dose accuracy, suggesting that unconditional application of iMAR under 140 kV conditions is not recommended and should instead be used cautiously depending on material characteristics.
Because this study used standardized cubic implant models, additional validation is required for the wide variety of implant shapes and sizes applied in clinical practice. In particular, the considerable structural diversity of implants in craniofacial and orthopedic (
Figure 8) applications necessitates further clinical data and multi-shape phantom experiments to generalize the findings of this study. The investigation was designed on the basis of the VMAT technique, which is valid given its close reflection of actual clinical conditions. However, confirming whether similar results can be reproduced with other photon-based modalities, such as IMRT or 3D-CRT, remains a task for future research. Proton therapy, on the other hand, differs from photon therapy in terms of physical properties and dose delivery mechanisms; thus, it should be addressed as a separate research topic rather than a direct extension of the present work. While this study used standardized cubic implant models to ensure controlled comparisons, further in vivo and patient-based studies are warranted to validate these findings under realistic anatomical and biological conditions.
Similar comparative studies between 3D-printed titanium and PEEK implants have also reported comparable outcomes in clinical applications [
42]. Future investigations involving clinical CT datasets and actual implant geometries will help confirm the translational applicability of the present results and guide optimization of radiotherapy planning protocols for patients with metallic implants.
5. Conclusions
This study systematically evaluated the impact of implant materials on HU distortion in CT imaging and the accuracy of dose calculation in radiotherapy. PEEK demonstrated the lowest HU variability under all conditions and consistently achieved gamma pass rates above 96%, confirming its suitability as the most favorable material for radiotherapy. Ti-mesh showed significantly reduced HU distortion compared with solid titanium and maintained gamma pass rates of 97–98%, meeting clinical acceptance criteria and demonstrating the advantage of mesh structures. In contrast, Ti-solid exhibited the largest HU distortions and the lowest gamma pass rates (as low as 89%), indicating the greatest uncertainty in dose delivery.
The effect of iMAR correction varied depending on the material. For Ti-solid, partial improvement was observed under 120 kV conditions, whereas performance worsened under 140 kV. For PEEK and Ti-mesh, iMAR application did not lead to significant changes in dose accuracy. Across five repeated measurements, PEEK and Ti-mesh showed stable reproducibility, while Ti-solid demonstrated the greatest variability, further highlighting the uncertainty of dose delivery in complex metallic environments.
In summary, PEEK is the most stable and suitable material for radiotherapy, and when titanium is unavoidable, mesh structures are preferable to solid forms. Clinically, PEEK implants should be prioritized, and mesh-based titanium designs are recommended when titanium must be used. Moreover, alternative correction strategies such as HU reassignment may be more effective for improving dose calculation accuracy than iterative corrections like iMAR. These trends were consistently confirmed by 95% confidence interval and effect size analyses.
