1. Introduction
The selection of an appropriate excavation method is fundamentally guided by the geotechnical properties of the rock mass, which is a composite of intact rock material and a network of discontinuities. Key factors influencing rock mass quality and behavior include the intact rock strength, the density and condition of discontinuities, and groundwater conditions [
1,
2]. While blasting is a foundational technique for fragmenting hard rock, the two primary methods for rock mass disintegration are mechanical excavation and drilling-and-blasting [
1,
3,
4]. The choice between them is contingent upon both geological characteristics and operational constraints [
1]. Although drilling-and-blasting is highly efficient and cost-effective in hard rock, its use in urban areas is often limited by vibration and community impact [
1,
5]. Conversely, mechanical excavation offers distinct advantages such as enhanced ground control, safer working conditions, and lower initial investment [
1,
6,
7,
8], with technological advances increasingly enabling its application in hard, fractured rock [
1].
Among mechanical tools, hydraulic impact hammers are increasingly adopted in tunneling for their efficiency, especially as an alternative to roadheaders and tunnel boring machines (TBMs) in difficult ground. Their appeal stems from strong performance in fractured or geologically disturbed rock with a uniaxial compressive strength (
UCS) below 100 MPa, coupled with lower energy consumption and capital cost [
6,
9,
10]. Their versatility makes them ideal for short tunnels, metro stations, and urban projects where blasting is restricted, while their portability allows for quick relocation and operational flexibility [
4,
6,
10]. They are also particularly effective at excavating along bedding planes and in jointed rock masses, where roadheaders suffer from excessive tool wear and downtime [
4,
6,
10].
An impact hammer operates by a reciprocating piston striking an adapter, which transmits impact energy to a chisel at the tool’s tip, fracturing the rock [
11,
12]. The hydraulic system of a carrier machine (e.g., excavator, backhoe) provides the necessary input pressure [
10], making the hammer a highly adaptable attachment [
5].
Selecting the optimal impact hammer is crucial for project economics and depends on rock type, strength, carrier specifications, chisel design, and hammer features [
1]. Consequently, accurate prediction of machine productivity, expressed as the Net Breaking Rate (
NBR in m
3/h), is essential for reliable project planning and cost estimation [
10,
12].
NBR analysis supports both equipment selection and efficient scheduling [
13].
While early performance prediction relied on manufacturer specifications and contractor experience [
6], research has since developed more scientific empirical models based on field data. A foundational model by [
14] related
NBR to machine power and a Rock Mass Cuttability Index (
RMCI), which itself is a function of Uniaxial Compressive Strength (
UCS) and Rock Quality Designation (
RQD):
where
P is the input power of the hydraulic hammer (Hp).
Ref. [
3] modified this model to account for the thickness (<50 cm) of high-strength dykes, introducing a reduction factor (
K) for thin-bedded rocks (Equation (3)).
For weak rock masses, different parameters were incorporated. Ref. [
15] found a strong correlation between
NBR and Schmidt Hammer Rebound Values (
SHRV) for low
RQD:
Ref. [
16] proposed a model for very weak rock masses (
RQD < 20% or
GSI < 35) using the Geological Strength Index (
GSI) and a Weak Rock Breakability Index (WRBI):
where
BPI is the block punch strength index (MPa).
Later, ref. [
13] developed a model using a Rock Structure Index (
RSI) and the hammer’s output power:
where
Pout is output power of impact hammer (kW).
Building on this empirical foundation, researchers employed advanced computational techniques. Ref. [
17] developed Multiple Linear Regression (MLR) models for different excavation types:
Refs. [
8,
12], focusing on a specific metro tunnel, developed an MLR model (R
2 = 0.89) that first transforms
UCS and
RQD inputs before calculating NBR:
In parallel, techniques like Adaptive Neuro-Fuzzy Inference Systems (ANFIS) and Artificial Neural Networks (ANN) have demonstrated superior predictive capabilities compared to classical regression [
6,
18], with recent studies leveraging machine learning [
10] and hybrid methods like gene expression programming with particle swarm optimization [
4].
Despite these advances, a critical gap persists. While cycle-time optimization is standard for TBMs, it remains underdeveloped for impact hammers. Existing models predict NBR based on geomechanical parameters but treat excavation in isolation, ignoring the link between fragmentation and mucking efficiency.
This oversight is critical in weak rock masses (RMR < 40) under shallow urban overburdens, where stand-up time is negligible. Here, the muck pile itself becomes a primary safety bottleneck: it blocks access for support crews, forcing personnel to work beneath an unsupported face to clear the very debris preventing its stabilization.
This safety-critical issue reframes the core objective. The question is no longer merely “how fast can we excavate?” but “how can we excavate to ensure muck can be cleared within the stability window for immediate support installation?”.
Most prior research focuses on excavation speed, treating the muck pile as an unimportant byproduct and overlooking the face clearance phase. A significant research gap exists in correlating impact hammer operational parameters with the resulting particle size distribution of the muck pile. The absence of predictive models integrating fragmentation efficiency with operational timelines fundamentally limits the optimization of tunneling cycles in high-risk environments.
This study addresses this gap by reframing the challenge from pure excavation efficiency to the optimization of the complete excavation-support-mucking cycle. It was introduced and modelled the missing link: the mean particle size (
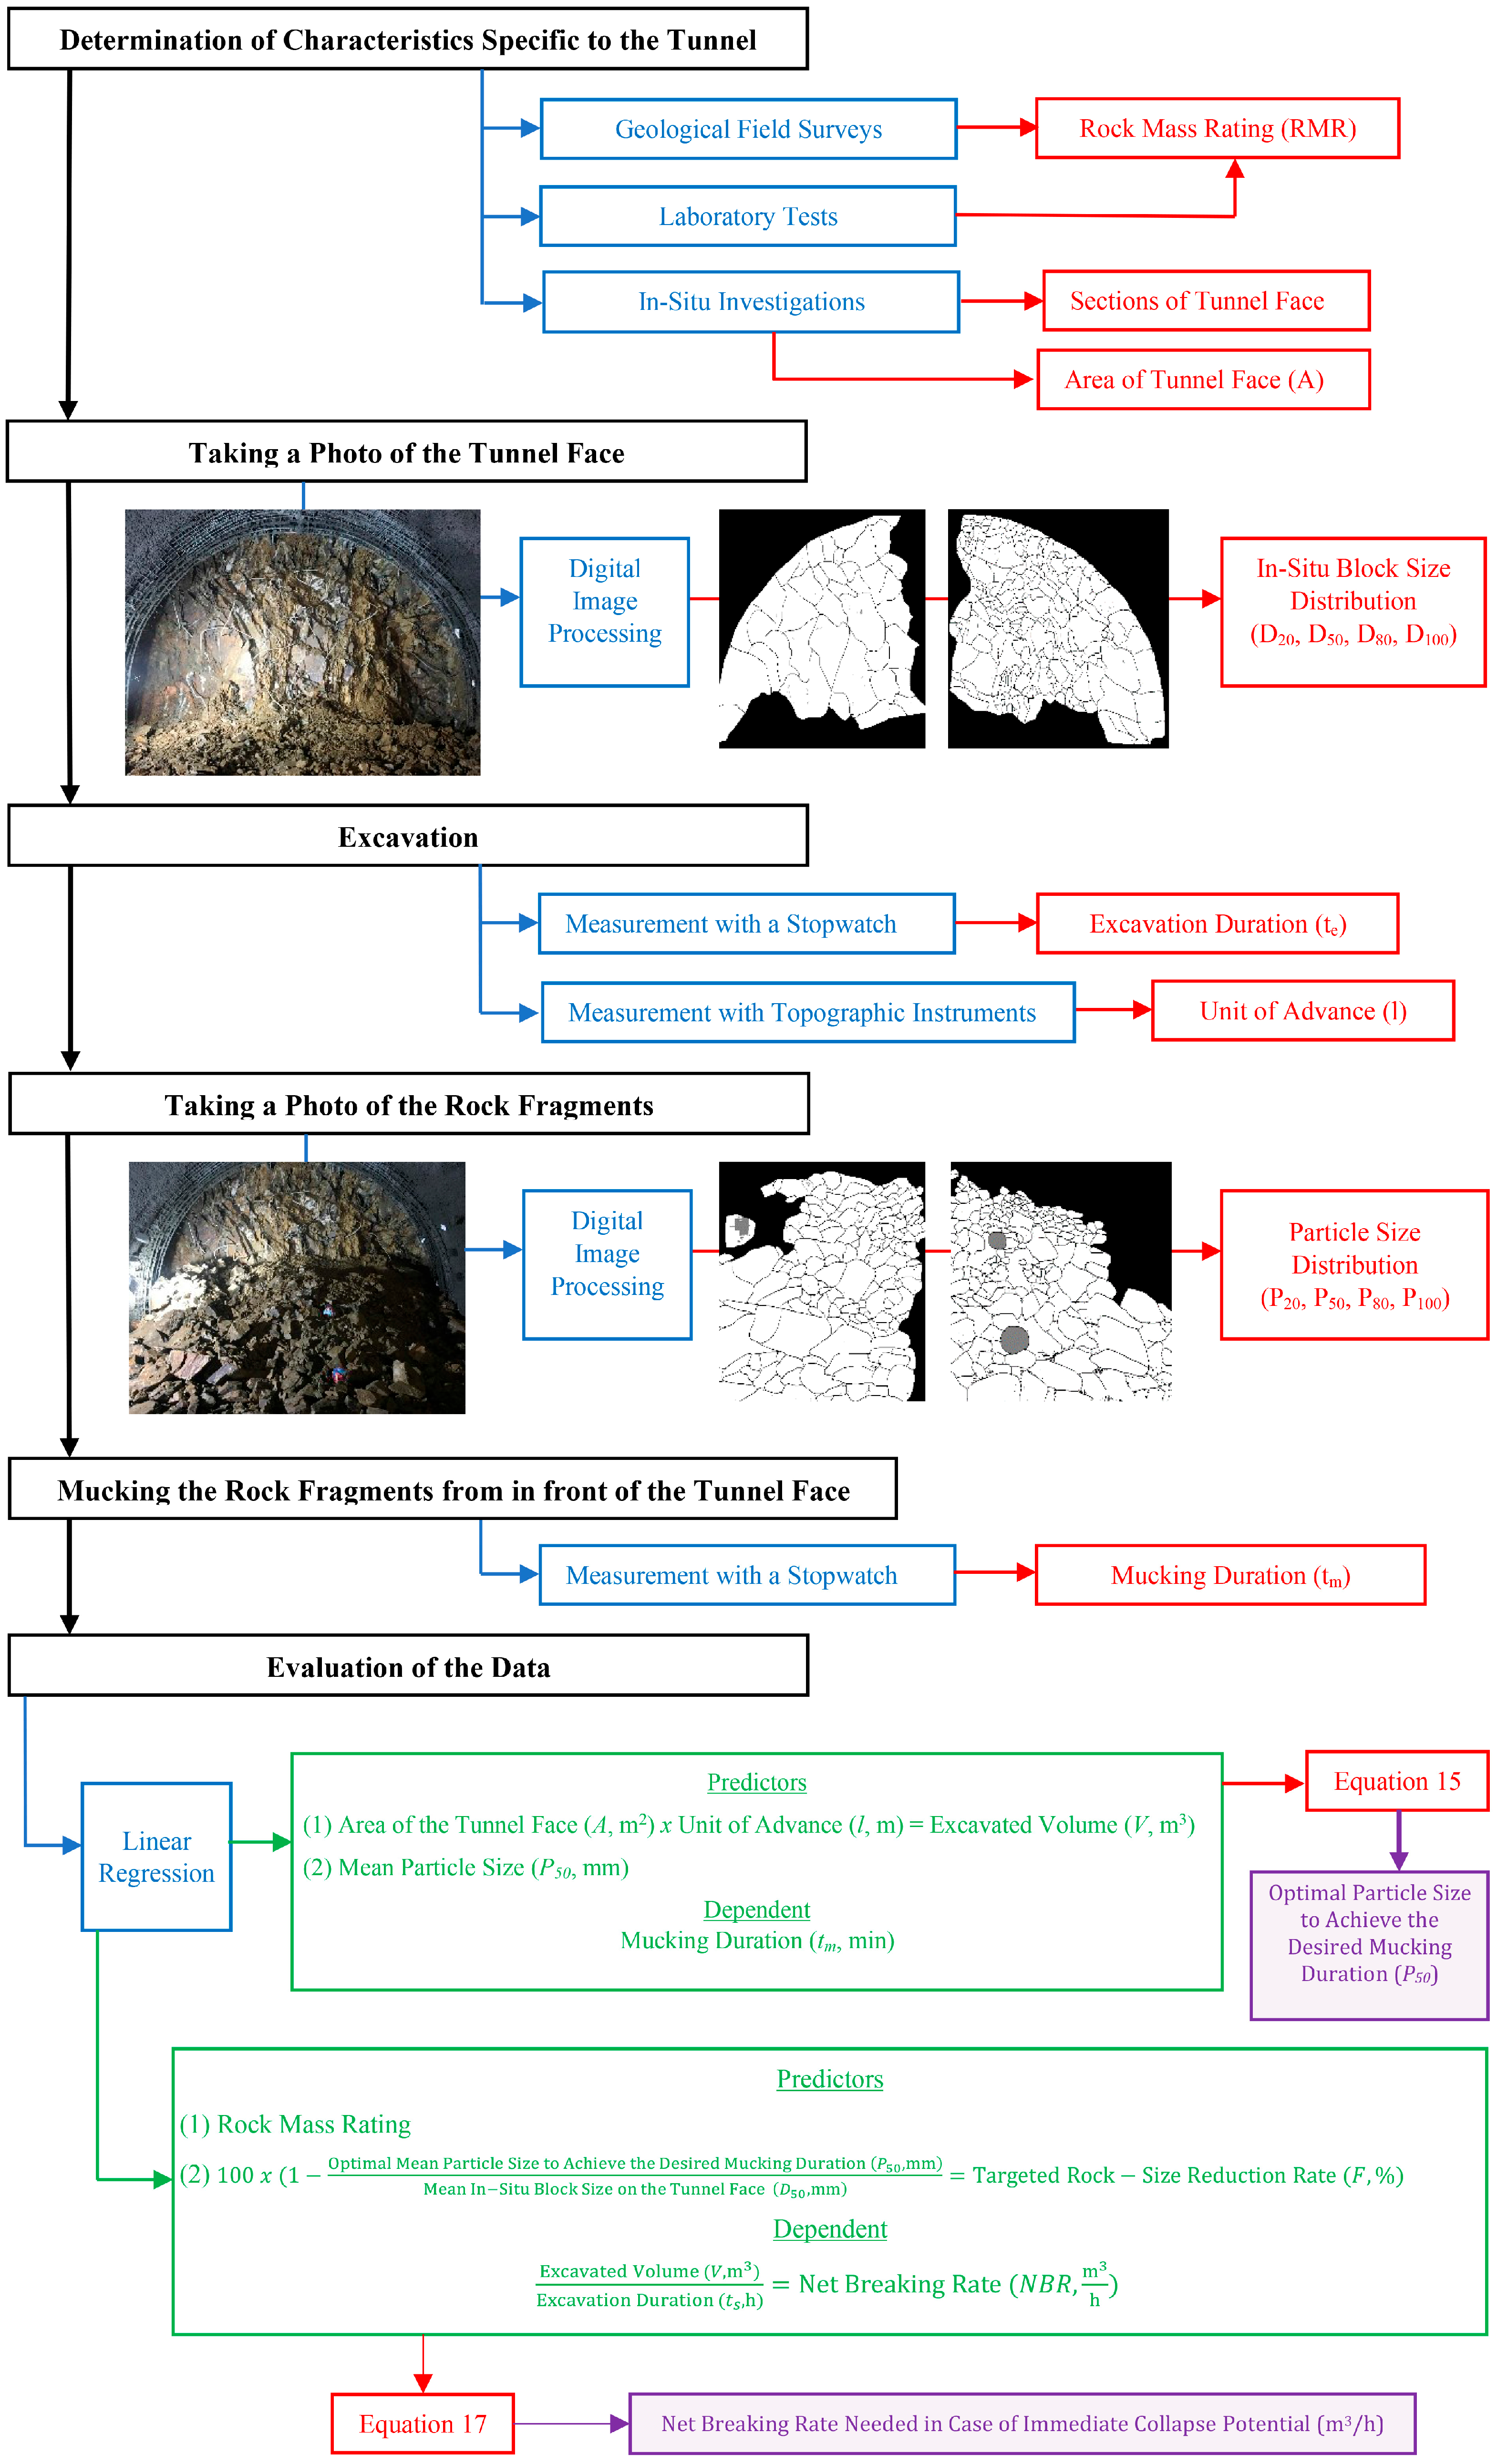
P50), which connects excavation to mucking. The methodological steps followed in the study are presented as a flowchart in
Figure 1. A new model is developed for the optimal selection of hydraulic impact hammers in immediate-collapse-prone ground by incorporating the rock size reduction ratio (
F) and mucking duration (
tₘ) into the equipment selection criteria. This establishes a quantitative, data-driven framework that allows engineers to choose hammers based on their capacity to generate fragmentation that facilitates rapid mucking, thereby resolving the critical bottleneck in the advance cycle. The selected parameters (
F and
tₘ) are practical for field engineers to measure, ensuring the model’s immediate utility. Through statistically validated models and a comprehensive operational equation, this research provides a transformative tool for data-driven optimization of the entire excavation-support cycle, enhancing safety and operational efficiency by minimizing unsupported ground exposure time.
2. Study Area
To compile an extensive dataset, concurrent field studies were conducted at two active tunneling sites within the same geological formation: the Istanbul New Airport–Halkali Metro Line and the Basaksehir–Kayasehir Metro Line. Excavation was performed sequentially in top and bottom sections; this study focuses exclusively on the top-section excavations.
2.1. Istanbul New Airport–Halkali Metro Line
The Istanbul New Airport–Halkali Metro Line is a critical transportation infrastructure project designed to provide high-speed connectivity between urban centers on Istanbul’s European Side and Istanbul Airport. It is the system’s fastest line, utilizing advanced driverless GOA4 signaling technology and operating with 180 s headways to achieve a unidirectional capacity of 36,000 passengers per hour at speeds up to 120 km/h. The project’s extensive underground infrastructure includes multiple bored-tunnel and cut-and-cover stations, bored tunnel segments, switch structures, and service stations. A key component is the comprehensive 124,000 m
2 depot facility, which includes significant train parking capacity, workshops, technical buildings, and a double-track bored access tunnel. This study focuses specifically on the excavation operations at the Fenertepe Station location (
Figure 2) within this project framework [
19].
2.2. Basaksehir–Kayasehir Metro Line
The 6.20 km Basaksehir–Kayasehir Metro Line serves as an extension of the Kirazli–Basaksehir–Olympic Village Metro Line, enhancing urban transit connectivity in Istanbul. This metro line has been strategically designed to support accessibility to the Istanbul Ikitelli Integrated Health Campus Project, a key healthcare hub planned for the region. This study specifically examines the excavation operations conducted at the Kayasehir and Onurkent stations (
Figure 3) [
20].
2.3. Geology
The project area is geologically complex, featuring Paleozoic basement units in the west and Upper Cretaceous volcanic flysch deposits in the east, separated by a high-angle reverse fault system. A key unit is an east–west-oriented band of Triassic sandstone–limestone, which is in tectonic contact with both the Carboniferous Thrace Formation and the Upper Cretaceous Sariyer Volcanics. Reverse faulting has resulted in a stratigraphy with the Thrace Formation at the top, underlain by Triassic and then Upper Cretaceous formations.
The Paleogene and Neogene sequences in the Thrace Basin consist predominantly of reef and reef-associated carbonates, including carbonate clastics, with terrestrial clastics present at the base. Coal-bearing layers are intermittently distributed, particularly toward the Black Sea coast. These Oligo-Miocene deposits primarily comprise claystone, siltstone, and subordinate sandstone. Additionally, lacustrine carbonates, clays, and localized fluvial sediments constitute the western lithological distribution.
Within the project area, the most prominent unit observed is the overconsolidated clay of the Gungoren Formation. The uppermost cover units belong to the Belgrade Formation, a Miocene-Pliocene terrestrial sedimentary deposit that extensively overlies nearly all underlying rock units, especially in northern zones. In areas of high relief, slope rubble and colluvial sediments derived from basement units are evident. The youngest geological formations in the region consist of alluvial and coastal deposits, including fluvial and beach sediments, predominantly found in river valleys and coastal zones [
19,
21].
2.4. Rock Mass Rating
Rock Mass Rating (
RMR), evaluated for every advance through rigorous field and laboratory analysis, displayed pronounced variability—not only across the longitudinal profile of the tunnel but also within individual tunnel faces—highlighting the inherent heterogeneity of the rock mass. The determined
RMR values ranged from 18 to 33, classifying the excavated rock masses as very weak to weak [
22].
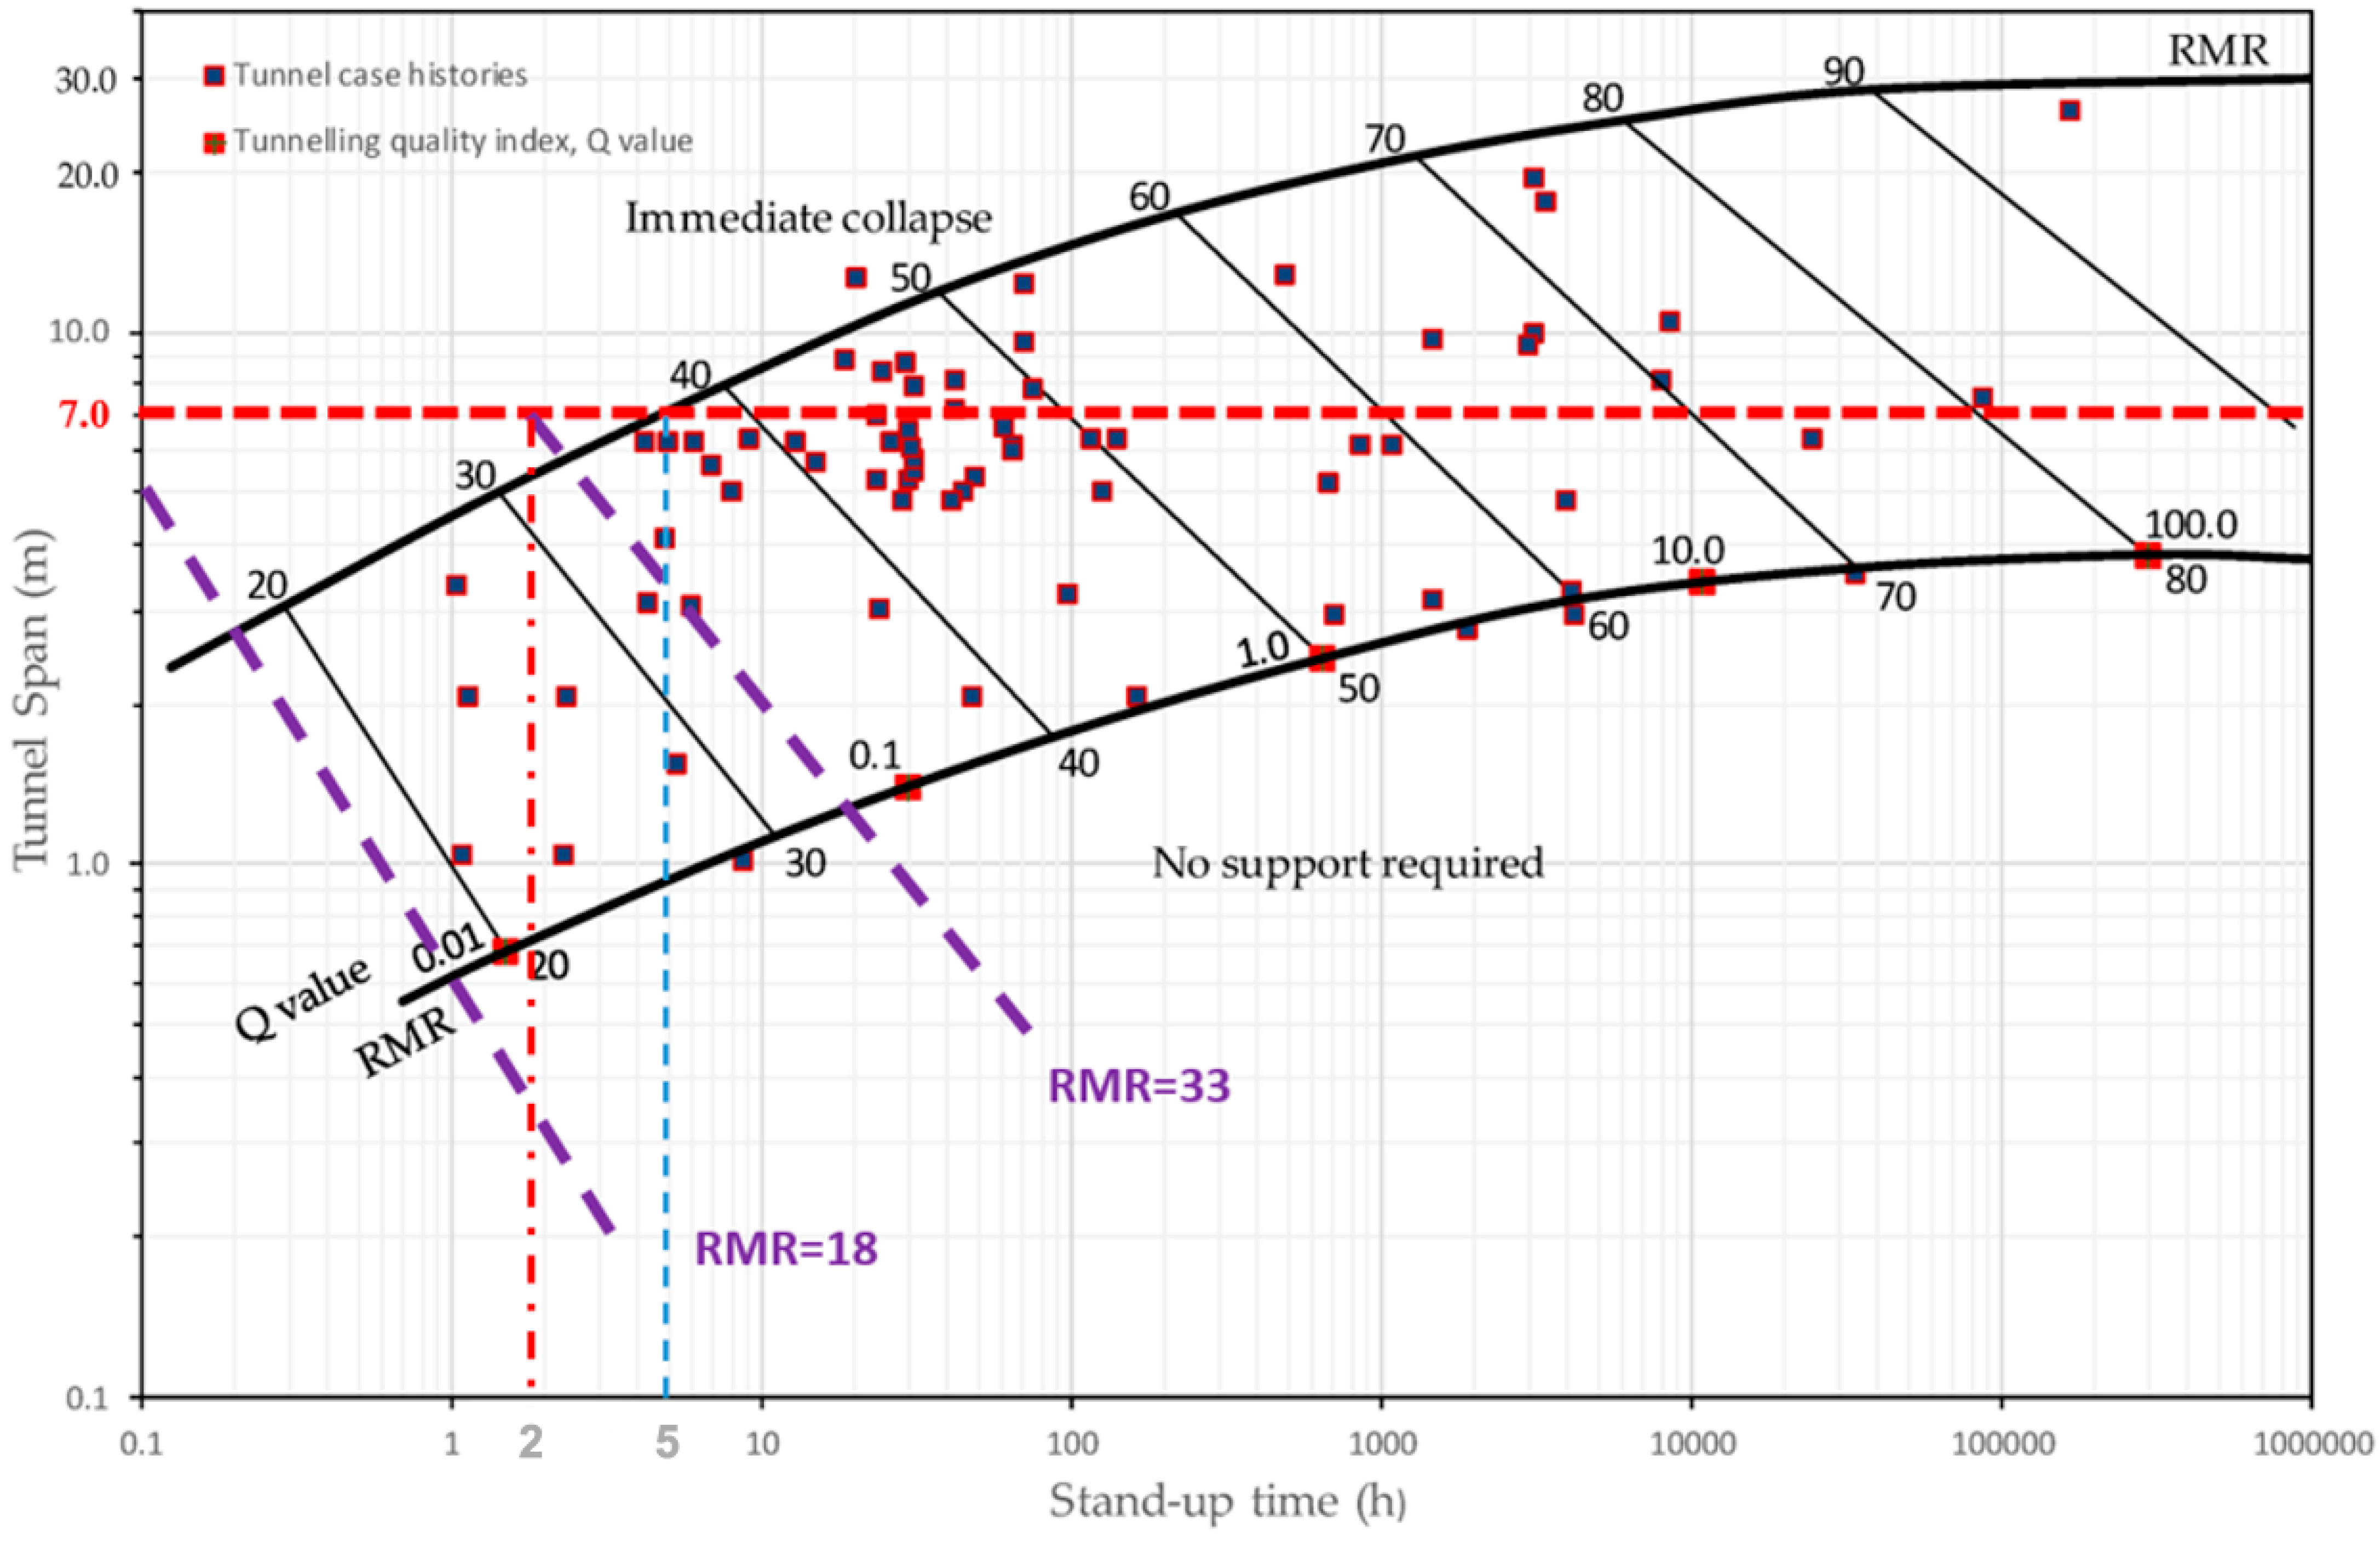
In tunneling through such weak ground, direct measurement of stand-up time is not feasible. Therefore, the authoritative empirical chart by [
23], a widely recognized and conservative tool in rock engineering, was used to classify the stability condition. The combination of the very weak rock mass (
RMR 18-33) and the significant 7 m excavation span definitively places the ground conditions within the ‘immediate collapse’ zone of this chart, validating this critical design assumption for the operational model (
Figure 4).
This assessment is further contextualized by Bieniawski’s chart [
23], which indicates that a minimum RMR of 40 is required to avoid being classified as ‘immediate collapse-prone’ for a 7 m span. Crucially, even at a ‘fair’ rock mass quality of RMR = 50, the stand-up time for this span is only approximately 5 h—a period that is still very short and demands prompt support. Consequently, even in the most favorable ground conditions (RMR = 33) encountered along the tunnel, which remain well within the ‘immediate collapse’ zone, the maximum estimated stand-up time for the 7 m span plummets to a mere 2 h, assuming immediate collapse does not occur.
This geotechnical reality dictates the operational sequence. While short-term support measures (e.g., shotcrete, steel sets, umbrella-arch) provide immediate stabilization, they are temporary. For long-term safety and operational resilience, permanent support systems must be installed as soon as possible. The fundamental principle is to minimize unsupported ground exposure time, necessitating immediate support installation following excavation [
24]. Consequently, in this immediate-collapse-prone ground, the efficiency of the mucking operation—the process that directly controls the delay before support can be installed—becomes the critical bottleneck and the primary safety concern governing the entire advance cycle.
2.5. Tunnel Excavation
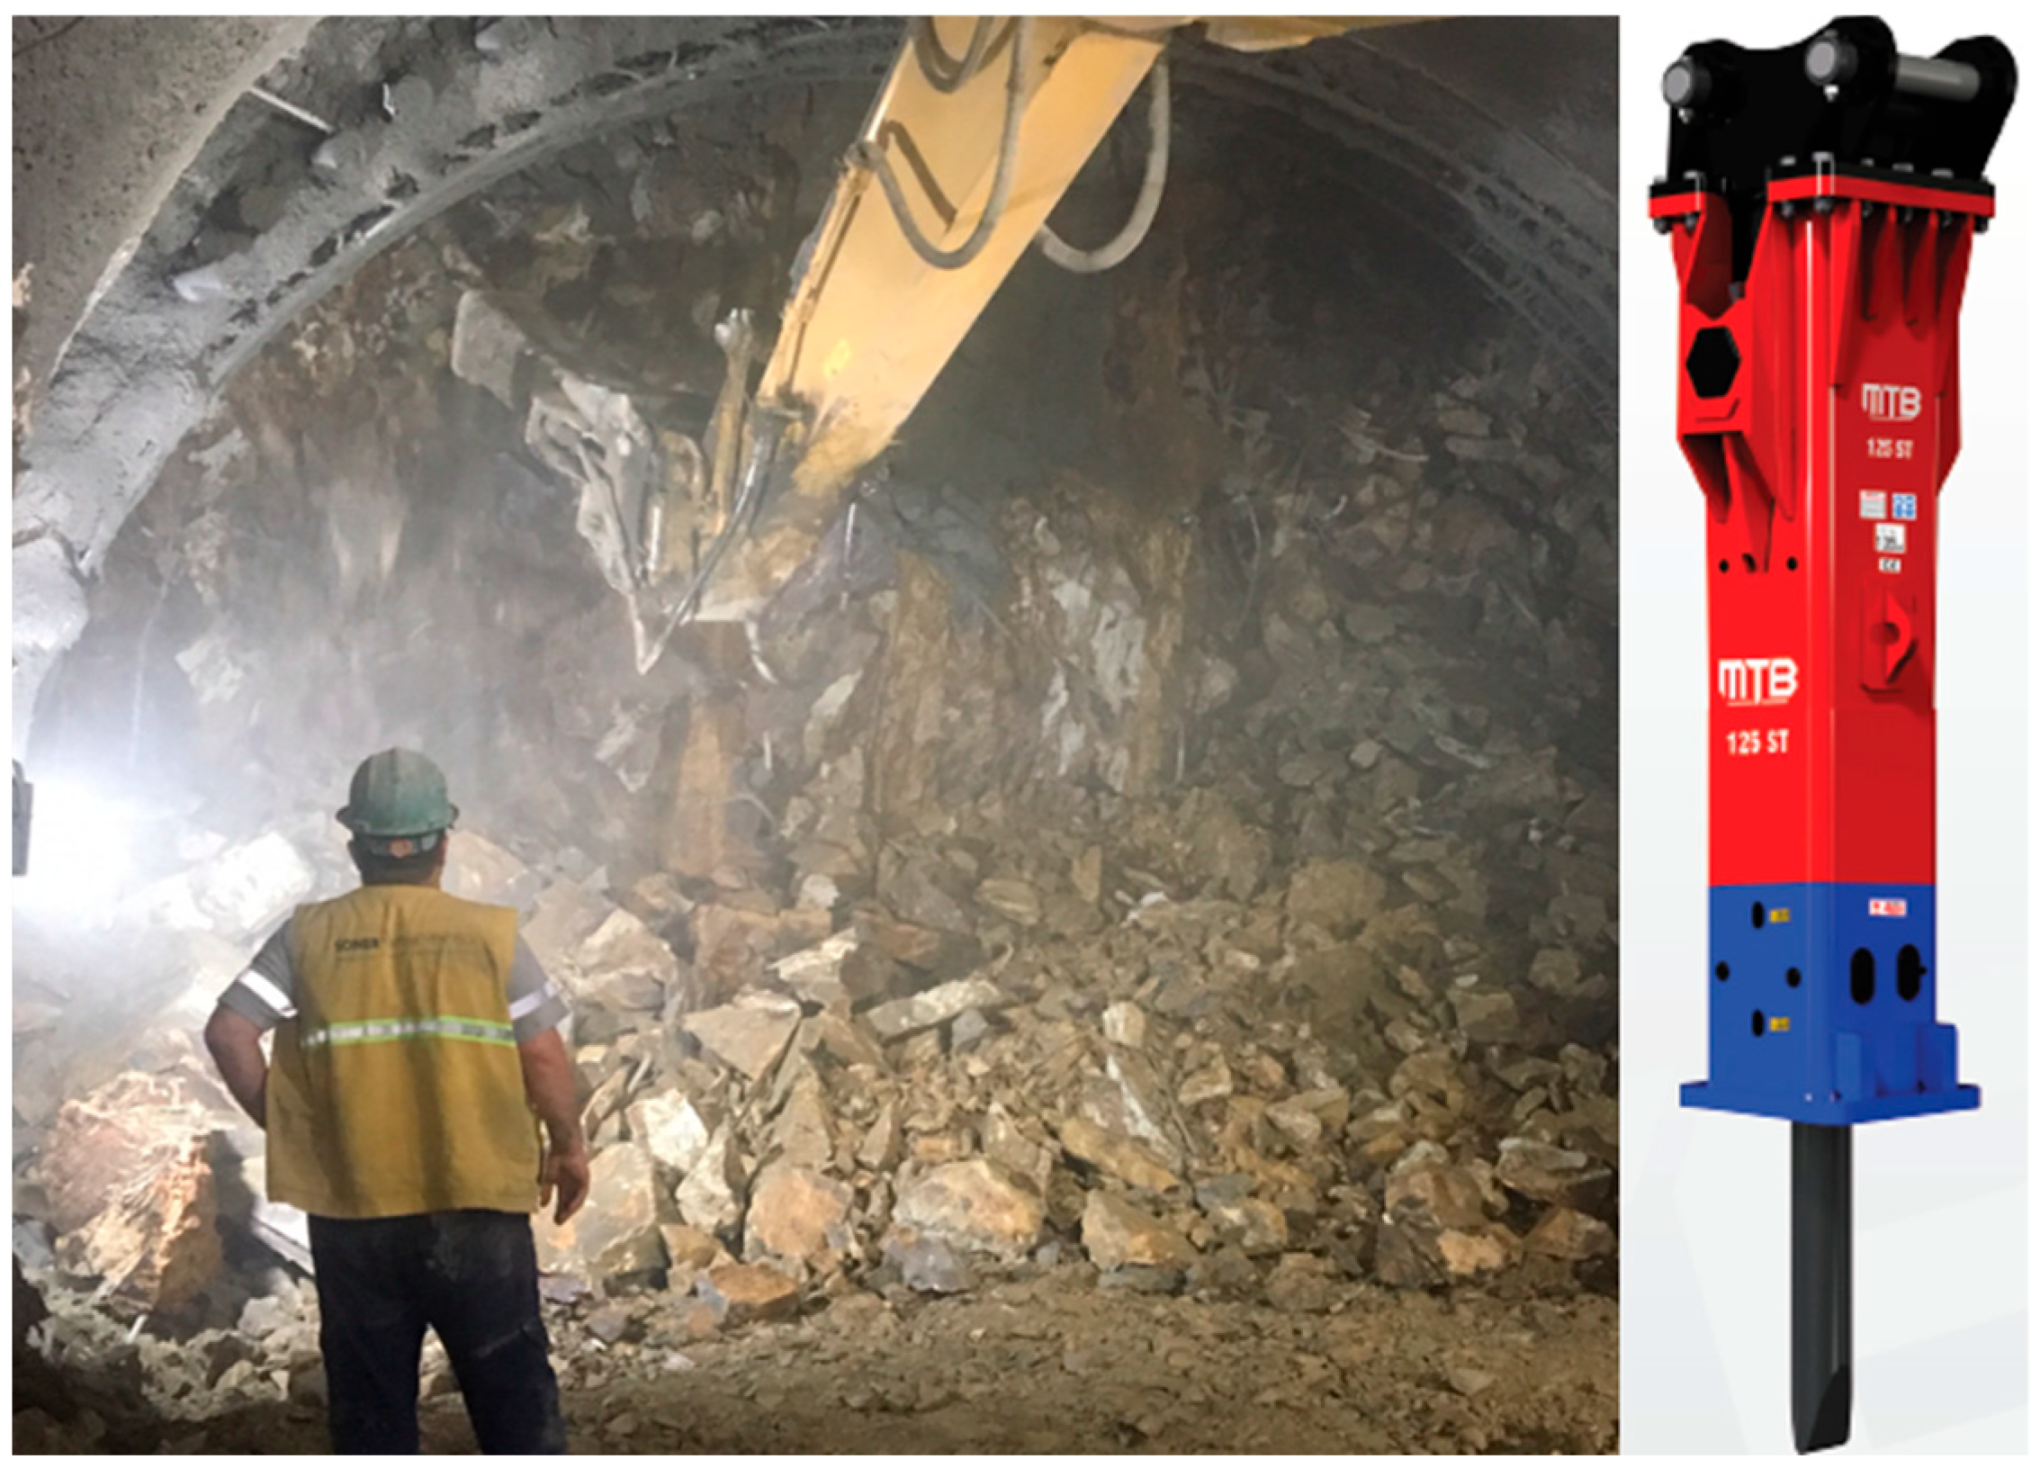
Excavation through the weak and challenging rock mass along the tunnel route was efficiently undertaken using an MTB 125 ST impact hammer (
Figure 5). With its weight of 1.255 kg and compatibility with carrier equipment weighing between 1.4 and 100 tons, this sturdy impact hammer is extremely adaptable to a wide range of operational scales. It delivers an impressive frequency of 390–700 blows per minute (bpm) and a powerful impact energy of 1880 joules per blow. The efficient fragmentation of the unstable ground made possible by the high impact energy and quick cycling proved crucial in preserving excavation progress and safety in the challenging geotechnical environment.
The deliberate choice to maintain constant hammer parameters allowed for the isolation of the effects of RMR and the resulting rock size reduction ratio (F) on the NBR, forming the core investigative focus of this research.
2.6. Mucking the Muck Pile
Following excavation, the muck pile accumulated at the tunnel face, obstructing the installation of permanent support (
Figure 6a). Given the immediate collapse risk, conventional mucking for off-site disposal was too slow and hazardous. Instead, a temporary side-stockpiling technique was employed (
Figure 6b). Using a loader with a 3 m
3 bucket, the muck was quickly pushed laterally along the tunnel walls. This cleared the face area, allowing immediate installation of permanent supports like steel sets and shotcrete. The stockpiled material was removed only after the support system was secured.
Only after the permanent support system was securely in place and the excavation cavity stabilized were the temporarily, stockpiled materials subsequently loaded and transported from the tunnel. This engineered operational sequence—prioritizing provisional stockpiling over immediate removal—significantly accelerated the support installation process, minimizing unsupported ground exposure time and enhancing overall safety in the face of imminent collapse conditions.
This temporary side-stockpiling was a rapid logistical maneuver. The limited muck volume from short advances was instantly pushed laterally to clear the face, creating only a minimal, short-duration distributed load to allow support crew access. This process, executed concurrently with immediate support installation, did not generate a significant surcharge on the initial lining.
3. Experimental Study
3.1. In Situ Investigations and Measurements
Field data were collected from 16 primary excavation cases across three locations: the East Tunnel, and the South Caissons and Onurkent Station tunnels. Due to significant heterogeneity within single tunnel faces, each face was subdivided into left, right, and center sections for individual analysis. This approach accounted for spatial variability and generated 33 discrete datasets for robust statistical analysis.
For each case, RMR values were determined and meticulously recorded for the identified parts of the face to quantify the ground conditions. The RMR ratings were updated immediately before each advance round based on face mapping and laboratory testing of the specific section to be excavated, ensuring the regressor accurately reflected the ground conditions for that round. At the same time, topographic instruments were used to precisely measure the cross-sectional area of the tunnel face (A) and the unit of advance (l) made in each case. This provided the essential baseline geometric parameters required for all excavated volume (V) and advance rate calculations.
The duration of all breaking and mucking activities was recorded with chronometric precision using digital stopwatches. The net breaking rate (NBR, m3/h), representing the hourly excavation volume, was calculated from the measured broken volume and the precise breaking time. Similarly, the net mucking rate (NMR, m3/h), representing the hourly mucking volume, was derived from the same volume data and the total recorded mucking duration, defined as the period from the end of excavation until the final clearance of the face for support installation.
While the complete dataset exceeds the scope of this study, a statistically representative subset of results (
Table 1) validates the methodology’s application and robustness.
3.2. Rock Size Reduction Ratio (F)
A rigorous photogrammetric methodology was employed to quantify the in situ block size distribution on pre-excavation tunnel faces and the particle size distribution of the resulting muck piles. To ensure data consistency, representative portions of the tunnel faces and the ensuing fragmentation zones were methodically photographed under meticulously regulated lighting and positional conditions. Digital image processing was then conducted using Split Desktop v2.0 Software (from Split Engineering, Tucson, AZ, USA) to characterize in situ block sizes, as defined by the key percentiles D20, D50, D80, and D100, and the post-excavation particle sizes, quantified by the corresponding P20, P50, P80, and P100 metrics.
Photographs were taken from an average distance of 3 m with a 30 MP camera, yielding a ground sample distance (GSD) of approximately 2–3 mm/pixel. Consistent with common practices in photogrammetric fragmentation analysis, particles smaller than ~20–30 mm may be underrepresented. The P50 metric was selected for model development due to its greater robustness compared to finer percentiles in accommodating this limitation, while still effectively characterizing the fragmentation profile relevant to mucking operations.
The efficiency of the excavation process was subsequently evaluated through the rock size reduction ratio (
F), a critical performance indicator derived from the ratio of
P50 to
D50. The excavation process achieves a greater degree of size reduction when the ratio is expressed as a percentage in Equation (14), where a higher value indicates a more successful and effective fragmentation outcome.
Since it is not possible to share all the values of in situ block size and particle size distributions from the study, a representative sample is presented in
Table 2.
4. Statistical Analysis
The study concluded with a synthesis stage, during which the entire dataset—which includes RMR, pre-excavation in situ block dimensions, excavation durations, post-excavation fragmentation analyses, and mucking times—was consolidated and subjected to advanced statistical modeling and analysis. This was performed using IBM SPSS Statistics 25 from IBM Corporation, Armonk, NY, USA.
The quantitative relationships between the measured parameters were determined using comprehensive multivariate linear regression. Various non-linear model forms (e.g., power, exponential) were evaluated during the analysis. However, for this specific dataset, the linear regression model consistently provided superior or equivalent performance based on cross-validated R2 and error metrics, while also offering significant advantages in parsimony and practical interpretability for field engineers.
This statistical technique was selected to model the linear relationship between a continuous dependent variable and multiple independent predictors, while also providing the capability to isolate both individual and interactive effects of the examined key factors, thereby enabling the development of a useful and interpretable predictive model. It was ensured that the predictors are either currently being recorded by field engineers or can be easily measured. This makes it possible for the models to be easily put into use on real-world sites.
As a result of the analysis, two statistically significant predictive models were made. For the first model, the mucking duration (tₘ) is based on two main factors: V and P50 of the muck pile that is made. The second model predicts the NBR, a crucial metric of excavation efficiency. This model demonstrates that the NBR is primarily influenced by the RMR, which describes the in situ geotechnical quality of the rock mass, and F, which quantifies the degree of fragmentation achieved by the excavation process.
4.1. Limitations
The predictive models established in this work are bounded by several critical limitations that define their scope of applicability. A primary constraint is the specific geotechnical context for which they were developed—excavations in immediate-collapse-prone ground, specifically within over-consolidated clay and weak rock masses under a defined tunnel span. Consequently, the direct transferability of the models to other geological settings or stability conditions is limited.
Operationally, the models are valid only within the observed ranges of the predictor variables, as detailed in
Table 3. Extrapolation beyond these empirical boundaries is not advised, as predictive reliability cannot be assured. This is especially pertinent for scenarios such as significantly larger advance rounds (>1.1 m), where non-linear changes in loader trafficability and mucking logistics occur, which are not captured by the current dataset.
Methodologically, several specific limitations must be acknowledged. The regression coefficients, particularly for the NBR model (Equation (17)), are calibrated to the operational characteristics of the specific MTB 125 ST impact hammer used in this study; application to different hammer classes would require validation and potential coefficient recalibration. Similarly, the mucking efficiency relationship (Equation (15)) and the derived target P50 (Equation (16)) are intrinsically tied to the specific mucking methodology employed—a temporary side-stockpiling operation using a loader with a 3 m3 bucket. Predictions are therefore most accurate when applied to comparable equipment and operational sequences. Additionally, the photogrammetric fragmentation analysis, while robust for determining P50, may systematically underrepresent fine particles (typically below 20–30 mm), a known limitation of optical measurement techniques.
Finally, regarding model selection, a comparative analysis with various advanced machine learning algorithms (including Artificial Neural Networks and Random Forest) was conducted. For this particular dataset size and engineering application, linear regression proved to be the most appropriate technique, demonstrating superior robustness against overfitting while providing directly interpretable coefficients, which is essential for practical implementation.
4.2. Estimation Model for Mucking Duration (tm)
tₘ was set as the primary response variable. Initial analysis showed tₘ is predominantly influenced by V and particle size distribution. P50 was selected as the key granulometric parameter because it best represents the central tendency of the distribution and is robust against outliers. A collinearity analysis confirmed that P50 exhibited the strongest relationship with the response variable. Consequently, using P50 alone avoids the statistical issues of multicollinearity that would arise from including multiple, highly correlated particle size percentiles, thereby preserving model parsimony and enhancing interpretability.
A statistically robust fit was achieved by the derived linear regression model for estimating tₘ, as demonstrated by the model summary in
Table 4. The high coefficient of determination (R
2 = 0.877) indicates that approximately 87.7% of the variability in mucking duration is explained by the combined effect of the excavated volume and the mean particle size.
An Analysis of Variance (ANOVA) was conducted to assess the overall significance of the regression model. The results, detailed in
Table 5, confirm that the model is statistically significant at the 95% confidence level (F = 106.648,
p < 0.001).
The coefficients of the model, which quantify the relationship between each predictor and the dependent variable, are presented in the coefficient table. Both V and P50 were found to be significant positive predictors of mucking duration (p < 0.001 for both). The Variance Inflation Factor (VIF) was calculated to check for multicollinearity between the predictors. The VIF values for V and P50 were 1.12 and 1.08, respectively. These values are well below the common threshold of 5, indicating that multicollinearity is not a concern and that the standardized beta coefficient of 1.052 for V is a reliable indicator of its strong individual effect on mucking duration.
The resulting estimation equation is given Equation (15).
This equation can be inversed to determine the target
P50 necessary to complete the mucking operation within a specified timeframe (
tm) for a given volume of excavated material (
V), providing a crucial and practical tool for operational planning (Equation (16)):
It is acknowledged that this algebraic inversion of Equation (15) to derive Equation (16) assumes the predictor V is error-free, an assumption which, if violated, can introduce minor rearrangement bias. However, given that V is typically measured with higher relative accuracy compared to other field-based measurements like tₘ and especially P50, and given the paramount importance of obtaining an explicit, closed-form expression for the target P50 for practical operational planning, the use of the inverted form was deemed a justified and appropriate simplification for this engineering application.
4.3. Estimation Model for NBR
Beyond the efficiency of mucking operations, the overall advancement rate of a tunnel boring process is fundamentally dictated by NBR of the impact hammer. Whereas traditional models predict NBR based primarily on intact rock properties, this study proposes a more holistic model that incorporates the interplay between the in situ rock mass condition and the effectiveness of the fragmentation process itself. Consequently, NBR was modeled as a function of RMR and the newly introduced F, a parameter quantifying the efficiency of fragmentation from D50 to P50.
The regression model for
NBR estimation demonstrated a strong predictive capability. The model summary (
Table 6) shows a high coefficient of determination (R
2 = 0.800), indicating that 80.0% of the variance in
NBR is accounted for by
RMR and
F.
The ANOVA results (
Table 7) confirm that the regression model is statistically significant (F = 59.84,
p < 0.001).
The analysis of the coefficients reveals that both predictors are statistically significant (p < 0.001). The negative coefficients for RMR and F indicate that NBR decreases as the rock mass becomes more competent (higher RMR) and as the size reduction ratio increases, meaning more energy is spent on fracturing the rock.
The final estimation model for
NBR is given in Equation (17).
By incorporating the definition of
F from Equation (10), the model can be expanded to explicitly include the pre- and post-excavation particle sizes (Equation (18)):
This formulation provides a direct link between the
P50 and the achievable breaking rate. Furthermore, by substituting the expression for the target
P50 from Equation (16)—which is itself a function of the desired
tₘ and
V—a comprehensive operational equation is obtained. This integrated equation allows for the direct estimation of the required impact hammer’s
NBR based on the geotechnical conditions (
RMR,
D50), the excavated volume (
V), and the critical operational timeframe for mucking and support installation (Equation (19)):
4.4. Validation
A high correlation coefficient indicates that the model successfully captures the linear relationship between variables. However, this does not imply that the predictions will not deviate significantly from the actual data in absolute values. While the model may be able to accurately show the overall trend, it can make big mistakes when predicting specific events. Therefore, the model was tested using various metrics, including mean square error (MSE), mean absolute percentage error (MAPE), and root mean square error (RMSE), in addition to correlation, to fully assess its performance.
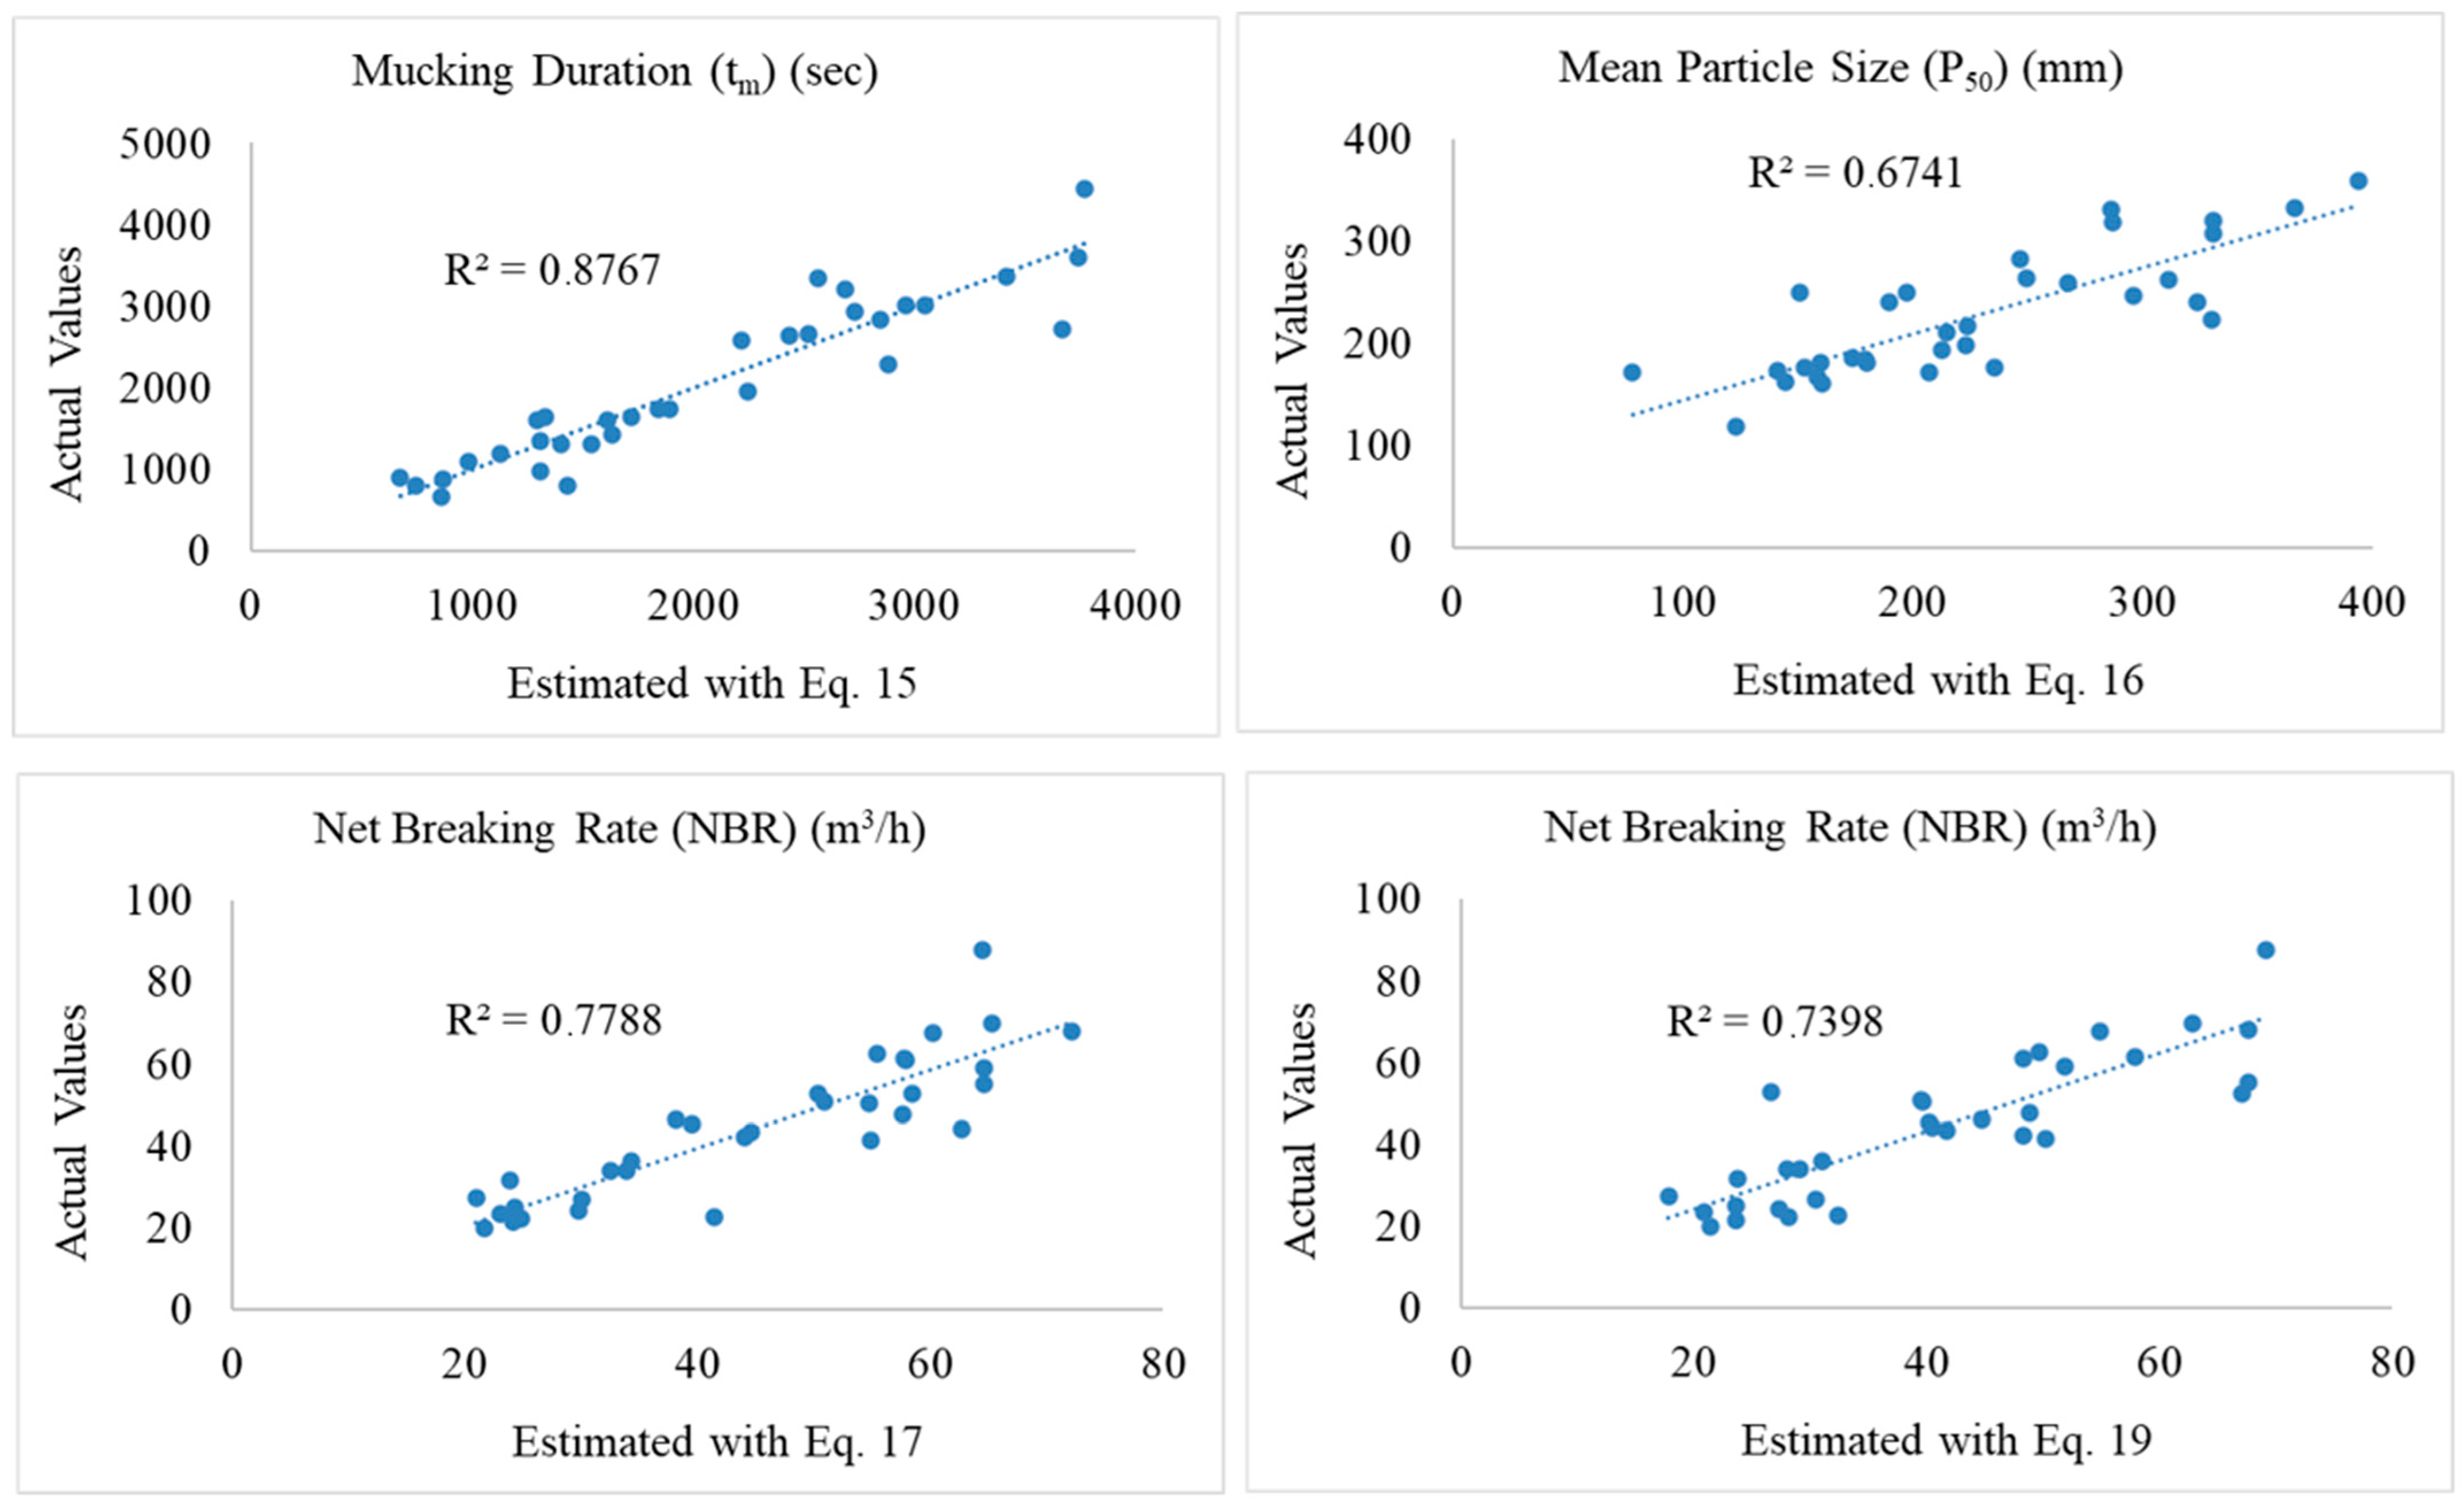
While
Figure 7 visually compares the actual values against estimations produced by the derived equations,
Table 8 provides the formal quantitative accuracy assessment for these equations.
A fundamental distinction between Equations (17) and (19) in
Table 8 lies in the source of
F parameter. While the
F value in Equation (17) is determined empirically based directly on field measurements, in Equation (19),
F is based on a
P50-based estimate calculated via Equation (16). Within this framework, Equation (19) was preferred as the operational model for predicting the necessary target particle size to ensure the effective mucking under defined time constraints. This formulation inherently incorporates the
P50 estimate derived from Equation (16), providing a holistic and functional tool for practical applications.
Error analysis for Equation (15) confirmed a statistically significant relationship between tₘ, P50, and V. The model demonstrates strong reliability, with a high coefficient of determination (R2 = 0.877) and low mean error metrics (MAPE = 13.90%; RMSE = 340.54 s). Although Case 10 showed a high deviation (76.35%), errors in the remaining 32 cases were below 34.56%, likely due to local geotechnical heterogeneity or operational factors rather than model deficiencies.
Equation (16)—a modified version of Equation (15) employed to determine the necessary P50 value—displays a predictive capability that is both acceptable and moderate when contrasted with other derived models. The largest deviations were observed in Case 10 (43.68%) and Case 6 (54.62%), while the errors in the remaining 31 cases were less than 39.65%. The model’s practical utility for operational decision-making is supported by its reasonable accuracy metrics (MAPE = 14.72%; RMSE = 54.62 mm). The sporadic higher errors may stem from the challenges of precisely controlling fragmentation or from the aforementioned non-ideal field conditions.
The reliability of Equation (17) was confirmed through statistical validation, yielding a strong coefficient of determination (R2 = 0.800, p < 0.001) and a standard error of 7.50574. The highest deviation was observed in Case 14 (%71.00), while errors in the remaining 32 cases remained below 48.89%. The model demonstrates high predictive accuracy under homogeneous rock conditions, as further supported by low mean absolute percentage error (MAPE = 12.25%) and root mean square error (RMSE = 7.50 m3/h) values. The extreme deviation in Case 14 and other outliers are likely attributable not to inherent model deficiencies, but to a combination of external and difficult-to-measure factors, such as anomalous geological conditions, measurement inconsistencies, or site-specific stochastic influences.
As the final operational equation derived from this study, Equation (19) demonstrates strong performance, exhibiting a high predictive capability (R2 = 0.8115) and the lowest minimum error (0.08%) among the evaluated models. The remarkably low minimum error of 0.08%, while below the practical resolution of field measurement tools (e.g., stopwatch precision of ±1 s), serves as a strong indicator of the model’s excellent internal consistency and its ability to accurately capture the fundamental trends within the dataset. The primary validation of its practical utility, however, rests on the robust overall performance metrics (MAPE, RMSE) and the successful field test applications.
Furthermore, the maximum deviation (49.08%) occurred in a single instance (Case 22). A post hoc investigation did not pinpoint a single definitive cause for this outlier, which may be attributable to the cumulative effect of inherent field measurement uncertainties, transient operational factors, or unquantified local heterogeneity. A sensitivity analysis showed that excluding Case 22 resulted in only a marginal improvement in model metrics (R2 = 0.812), indicating the model’s overall robustness. It was therefore retained to reflect the full range of variability encountered in field conditions.
To address the propagation of uncertainty in the combined operational model (Equation (19)) and provide a practical tool for risk-aware decision-making, 95% prediction intervals were calculated. These intervals quantify the expected range for a new observation, accounting for the error in both constituent models (Equations (15) and (17)). For a typical scenario within the dataset (e.g., V = 13.3 m3, RMR = 25, D50 = 576 mm, tₘ = 2040 s), Equation (19) predicts a required NBR of 44.2 m3/h. The associated 95% prediction interval for this estimate is between 28.1 and 60.3 m3/h. A practitioner should apply this by selecting a hammer with an NBR capacity at the upper end of this range to incorporate a safety factor against predictive uncertainty and ensure the target mucking duration is achieved.
All formulated equations satisfy rigorous scientific validity criteria, exhibiting statistically significant predictive performance. The models maintain consistent reliability with MAPE values substantially below the 20% industrial threshold, despite occasional higher errors attributable to various field conditions.
Equation (19) emerges as particularly noteworthy for stability-critical applications, achieving a level of precision that justifies its adoption as a decisive decision-support framework. Its strong performance enables data-driven optimization of impact hammer capacity and operational parameters based on predicted fragmentation characteristics. By establishing a direct correlation between excavation parameters and mucking efficiency, the model significantly improves support system scheduling, ensuring the prompt installation of reinforcement. This makes it an indispensable tool for tunneling projects in difficult ground conditions where minimizing unsupported ground exposure time is paramount.
4.5. Model Robustness and Generalizability
To comprehensively assess the out-of-sample predictive performance and generalizability of the developed models, a 5-fold cross-validation was performed for each key equation (Equations (15)–(19)). The dataset (N = 33) was randomly split into 5 folds, and the process was repeated 100 times with different random seeds to ensure stability. For each iteration, the model coefficients were recalculated on the training folds, and predictions were made on the held-out test fold. The cross-validated performance metrics (R
2, RMSE, and MAPE) were averaged over all repetitions and folds. The results are summarized in
Table 9.
The cross-validated R2 values are strong and align closely with the models’ performance on the full dataset, indicating excellent generalizability and a low risk of overfitting. The minor decrease in performance is expected and confirms the models’ robustness for predictive applications in similar ground conditions.
4.6. Testing
A field test was conducted in South Caissons Tunnel in Kayasehir Station on the Basaksehir–Kayasehir Metro Line to assess the practical utility of the equations derived from regression analysis. The field data of the testing is presented in
Table 10.
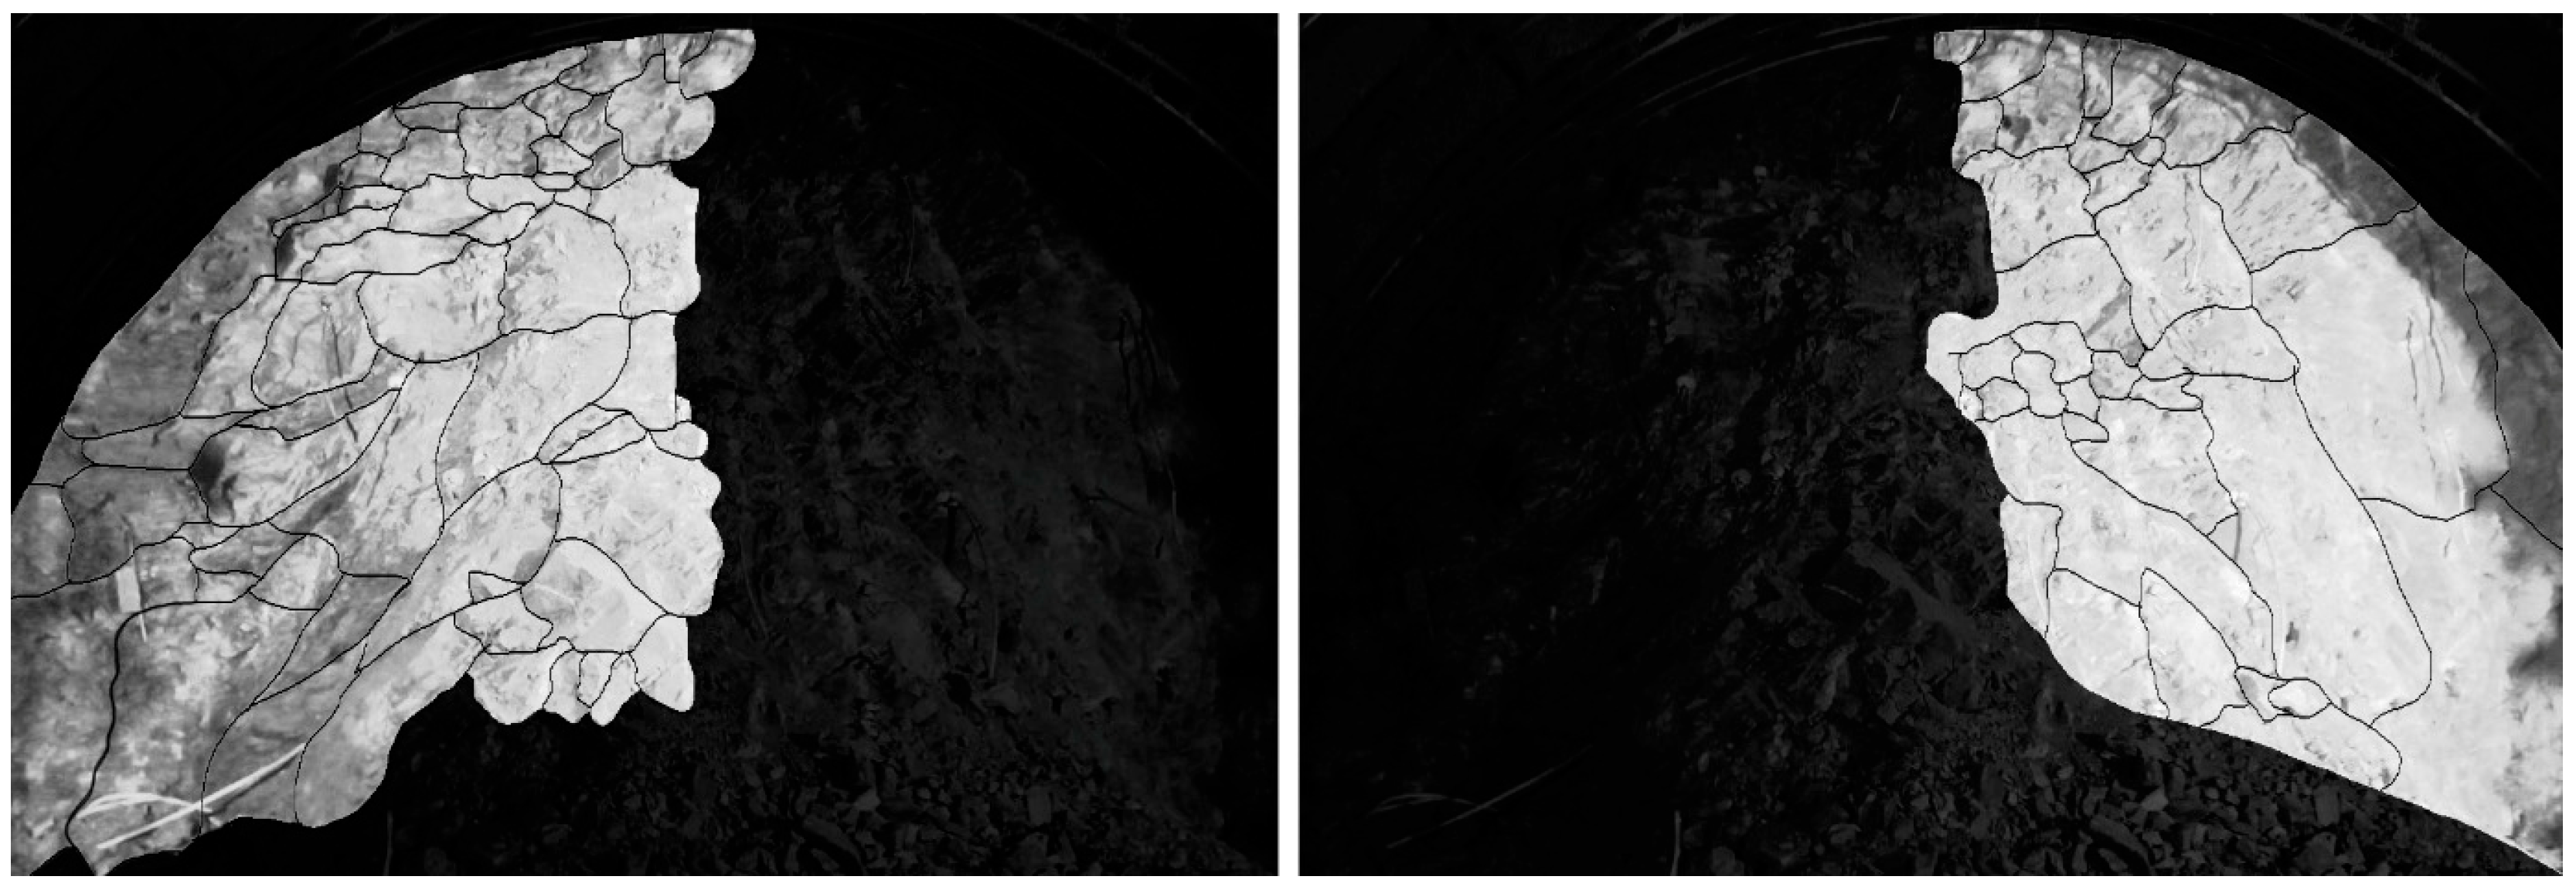
Digital image processing was employed to determine the in situ block size and characterize the particle size distributions, as presented in
Figure 8 and
Figure 9. The results indicate
D50 of 772 mm and a
P50 of 176 mm in the left part; the right part yielded a
D50 of 978 mm and a
P50 of 185 mm. Furthermore,
F was calculated to be 77.2% in the left part and 81.1% in the right part.
As seen in testing results (
Table 11), the mucking duration model (Equation (15)) shows particularly strong predictive accuracy with errors as low as 4.29%, representing a reliable tool for time estimation. The inverse model for target
P50 (Equation (16)) provides useful guidance despite slightly higher margins of error, which remain within reasonable expectations for field applications involving granular materials.
The NBR models also yielded noteworthy results. Equation (17) provided high accuracy with a 2.63% error rate in a specific case, while the comprehensive model, Equation (19), successfully integrated multiple parameters and maintained error rates below 11%. These findings indicate that the developed models offer a robust theoretical framework for equipment selection and process optimization; in engineering applications, they can be evaluated as decision support tools, supported by quantitative data, which balance theoretical depth with practical applicability.
5. Results and Discussion
The results confirm that in weak rock masses, the advance rate is governed not only by excavation speed (NBR) but also critically by the mean particle size (P50). This validates the central hypothesis and distinguishes the framework from conventional models. While previous research asked, “how fast can we excavate?”, the model addresses the safety-critical question: “how must we excavate to enable rapid muck clearance?”.
The equations developed in this study are empirical models established to predict and improve the performance of impact hammers under the relevant ground conditions. These models are based not on theoretical physical laws, but on the results of statistical regression analysis of comprehensive field data. Consequently, the coefficients and constants in the equations are parameters that merely ensure the balancing of units and the achievement of statistical fit; they acquire their true meaning only when evaluated within the holistic context of the model.
The equation (Equation (15)) arranged to calculate tm models this duration as a function of V and P50. The positive coefficient for V indicates that a larger excavated volume logically requires a longer tm. More importantly, the positive coefficient for P50 reveals that a larger mean particle size also increases tm. A decrease in P50, meaning the muck becomes finer and more uniformly graded, has two significant positive effects on mucking efficiency: Firstly, it increases the bucket fill factor. Large, irregular blocks create significant voids within the bucket as they interlock and bridge. Finer material flows more easily, packs more efficiently, and eliminates these voids, allowing the same bucket to carry a significantly greater weight of material per load. Secondly, the swell factor decreases. Swell is the increase in volume that occurs when in situ rock is excavated and becomes a loose pile of muck. Rock comprising large blocks has a very high swell factor due to the large voids formed between the blocks. Finer, more fractured material, having already been compacted during the excavation process, bulks up much less. A lower swell factor means that each cubic meter of in situ rock results in a smaller volume of loose muck to be transported.
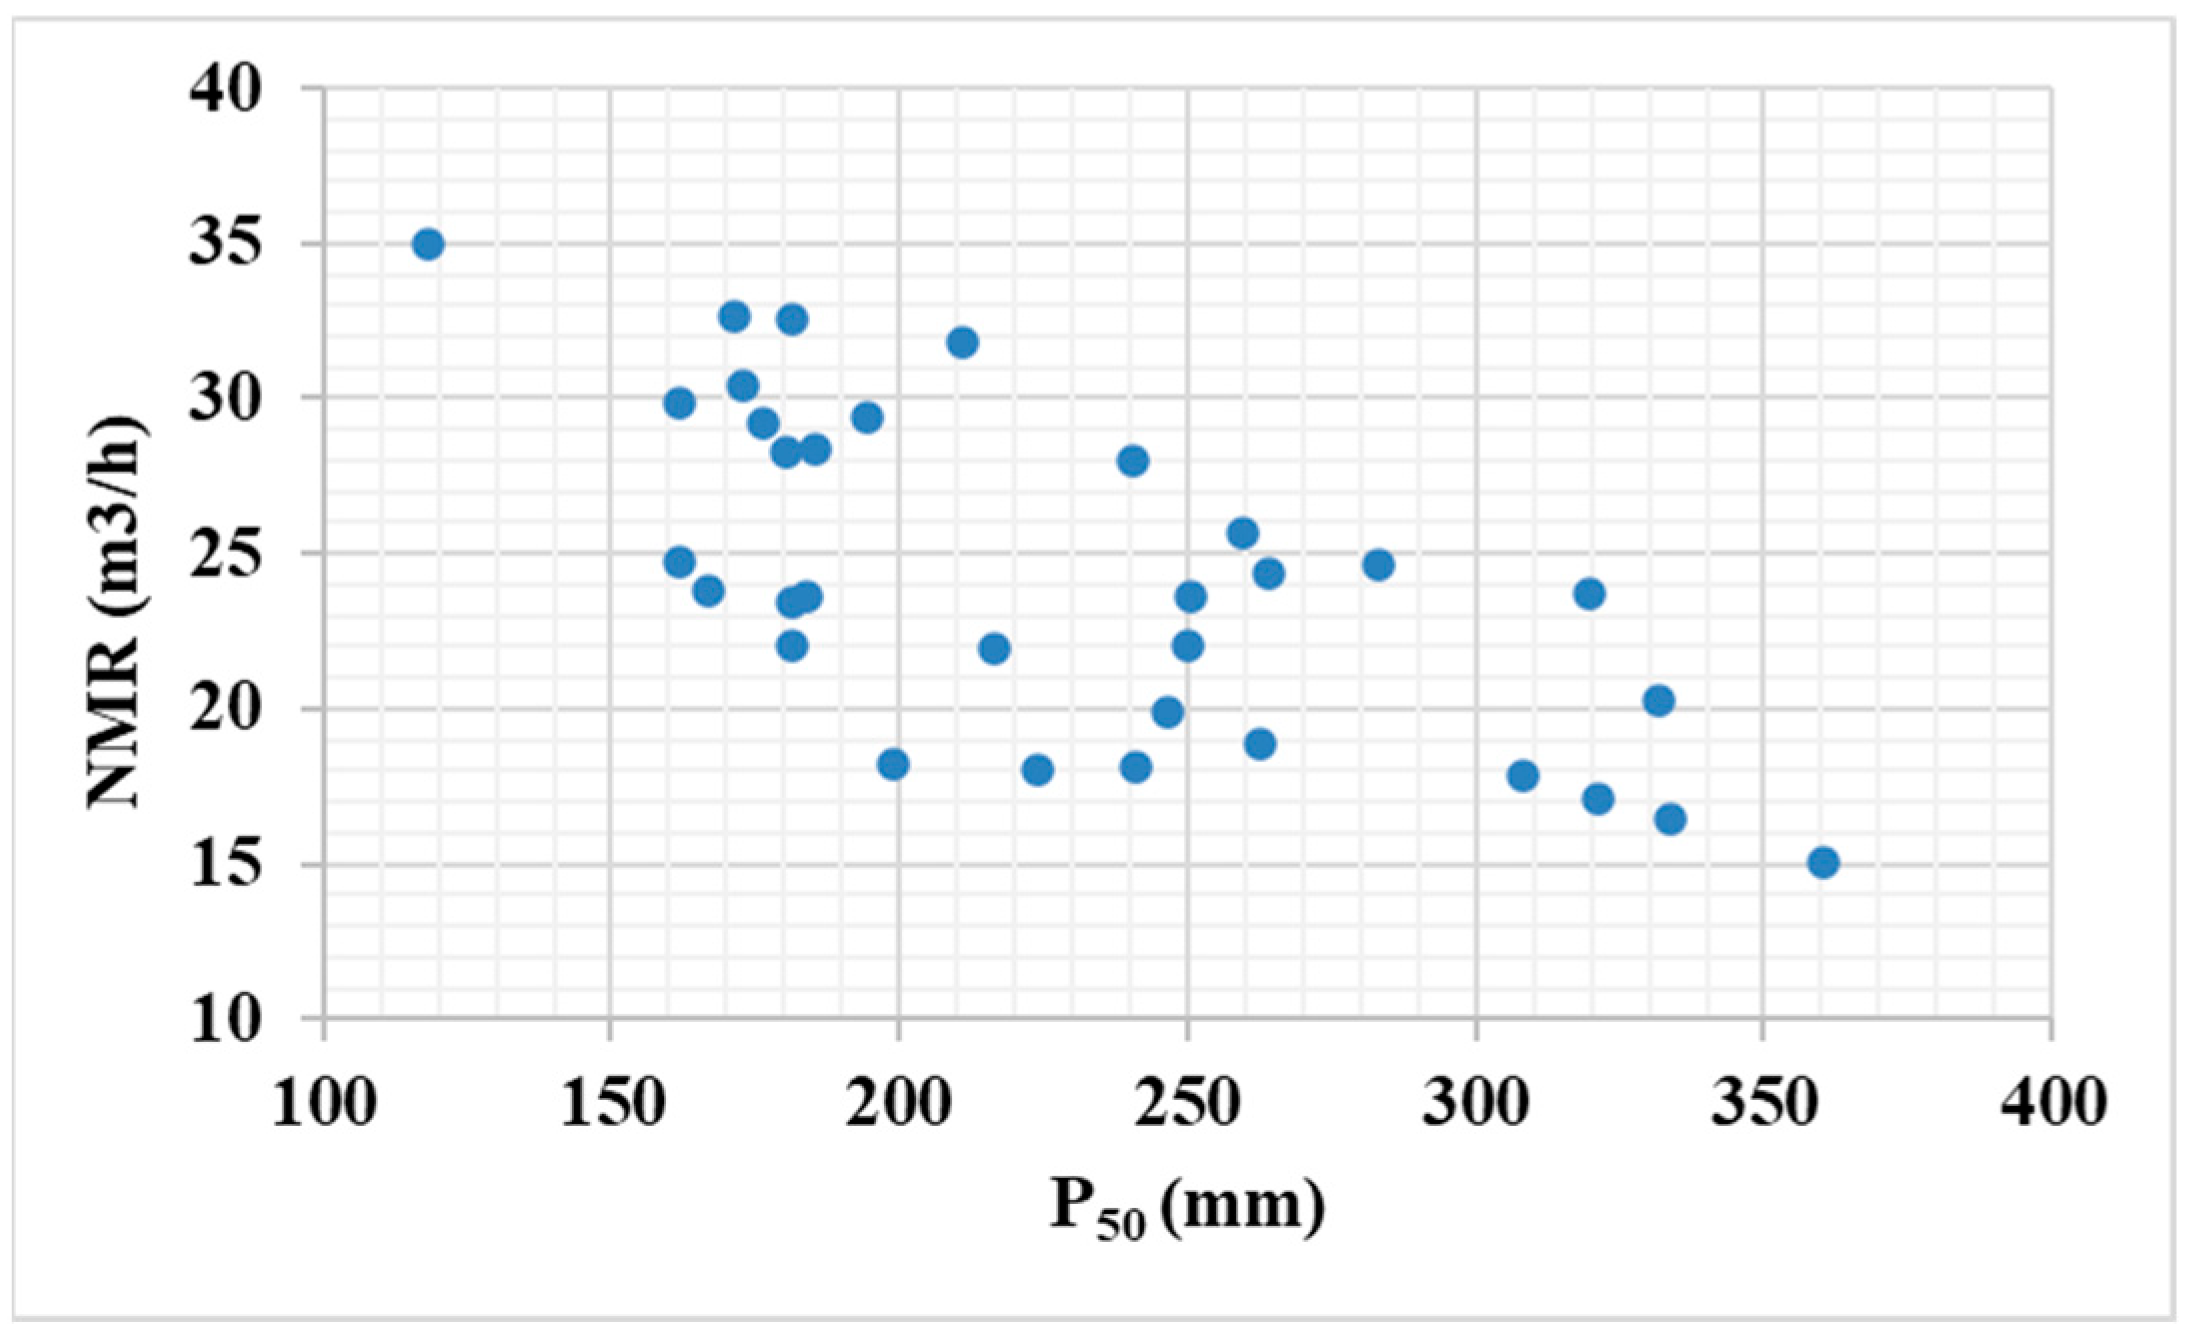
Figure 10 demonstrates the direct operational impact of particle size on the composite metric
NMR, calculated as V/t
e, showing an inverse relationship with
P50. This relationship is physically explained by reduced bucket fill factors and increased handling times for larger fragments, which are inherently captured within the total
tₘ. A larger
P50 leads to a slower mucking rate, which extends the high-risk window of unsupported ground exposure.
The developed NBR model (Equation (17)) defines the NBR as a function of RMR and F. The term −1.683 RMR confirms a well-established inverse relationship: as the rock mass becomes stronger and more competent (i.e., with a higher RMR), the net breaking rate decreases. This correlation is expected, as fracturing harder and more intact rock requires greater energy and time, consequently reducing the advance rate. Furthermore, the model indicates that the energy expended to achieve the target rock fragmentation (quantified by ratio F) also exerts a slight negative influence on NBR, as evidenced by its negative coefficient of −0.521.
An extensive literature review confirmed that existing predictive frameworks for impact hammer selection or
NBR universally overlook fragmentation parameters (specifically
P50 and
F). This absence underscores the novel contribution of the present study, which establishes, for the first time, quantifiable relationships involving these critical variables. Consequently, a direct quantitative comparison with conventional
NBR models e.g., [
14,
16] was not feasible, as the fundamental objectives and predictor variables are distinct. Traditional models aim to predict ‘how fast’ excavation will proceed based on intrinsic rock properties like
UCS and
RQD. In contrast, the proposed model addresses “how can we excavate to enable rapid muck clearance?” by integrating the target
P50. This paradigm shift precludes a straightforward performance comparison but powerfully highlights the unique operational utility and novelty of the introduced framework.
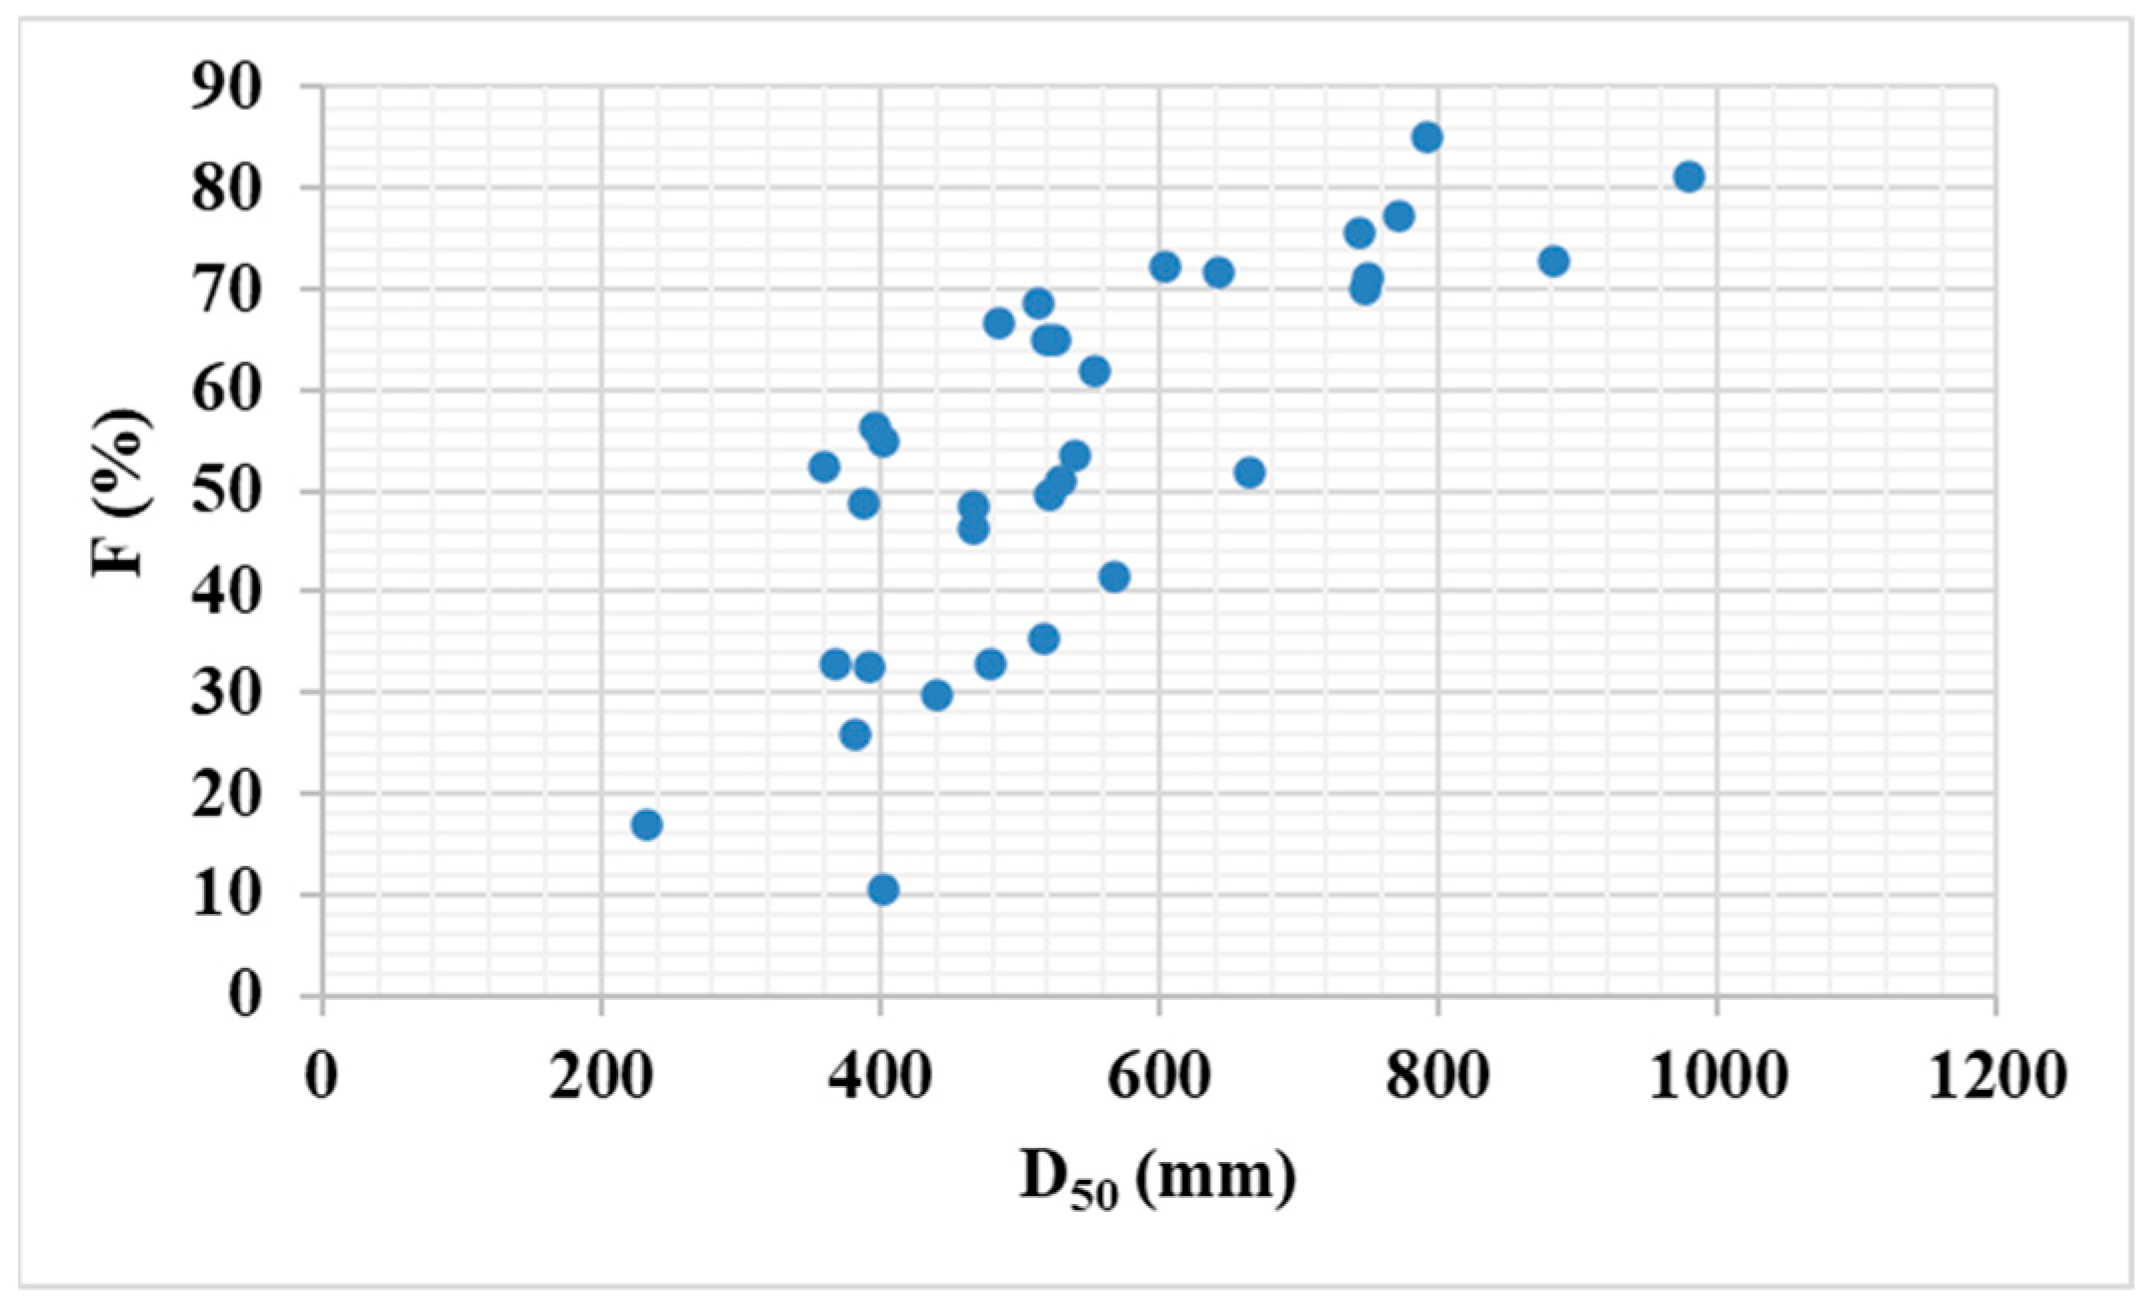
A core finding of this study is the relationship between
D50, governed by the rock mass’s discontinuity density, and
P50. This trend, illustrated by a higher
F in massive zones, is powerfully explained by the fracturing mechanisms theorized by [
25]. Their work, grounded in stress wave theory and numerical modeling, posits that the impact of an impact hammer creates a crushed zone and subsequent crack propagation. In larger rock with low discontinuity density, the hammer’s energy is not spent on liberating pre-existing blocks but is instead consumed in comminuting the intact rock itself, leading to greater size reduction.
Figure 11 illustrates this dominant trend.
The primary output, the integrated operational model (Equation (19)), provides a practical and transformative tool that moves beyond the capabilities of existing empirical models. While conventional models answer ‘how fast can we excavate?’, this framework allows engineers to answer the more complex, safety-critical question: ‘how must we excavate to ensure rapid muck clearance and timely support installation?’. Planners can now work backwards from a safety-derived time constraint (tₘ) to determine a required P50, and subsequently to the necessary hammer performance (NBR). This proactively transforms the muck pile from a passive, unpredictable bottleneck into an active, manageable engineering variable for risk mitigation.
Consequently, this study provides a quantitative tool for a previously anecdotal observation. It transforms muck pile fragmentation from a passive outcome into an active, predictable performance metric. This directly enables proactive risk management in the most challenging grounds, allowing crews to anticipate and mitigate delays in the support cycle that could lead to face collapse, thereby ensuring safety through predictability and transforming a critical safety paradox into a manageable engineering variable.
6. Conclusions
This study redefines performance criteria for hydraulic impact hammers in immediate-collapse-prone ground, shifting the paradigm from pure excavation speed (NBR) to total cycle-time efficiency. The core contribution is a novel framework that, unlike existing empirical models, quantitatively integrates rock fragmentation (P50) and its direct effect on mucking as central criteria for equipment selection. This directly addresses the critical stability constraints ignored by conventional NBR-focused approaches.
The key innovation lies in establishing a quantitative relationship between the hammer’s operation, the resulting fragment size P50 and tₘ. This provides the crucial missing link between excavation and support installation in time-sensitive ground conditions. The study delivers practical empirical models for predicting both mucking time and excavation rate (NBR), synthesized into a comprehensive operational equation tailored for immediate-collapse scenarios.
These models enable a proactive equipment selection workflow specifically designed for high-risk grounds. Engineers can now determine the necessary hammer performance (NBR) based on its ability to produce a target P50 that ensures mucking can be completed within the project’s critical stability window, thereby directly mitigating collapse risk.
This is achieved through an iterative workflow: (I) Prior to excavation, determine the
RMR and
D50 for the upcoming advance round through face mapping and core logging. (II) Establish the maximum allowable
tₘ based on the estimated stand-up time (from empirical charts such as Bieniawski’s chart,
Figure 4) and the planned time for support erection. (III) Using the planned
V for the advance, apply the inverted mucking model (Equation (16)) to calculate the target
P50 required to achieve the desired
tₘ. (IV) Use the comprehensive operational model (Equation (19)) to determine the required
NBR of an impact hammer capable of achieving the target
P50 under the given ground conditions (
RMR, D
50). This methodology transforms equipment selection from a singular focus on breaking capacity to a dual requirement optimizing both fragmentation quality and excavation rate for safe cycle completion.
Consequently, this research transforms rock fragmentation from a passive byproduct into an active safety control measure in collapse-prone ground. It provides a quantitative decision-support tool that enables selection based on guaranteed cycle efficiency rather than theoretical breaking capacity.
The developed framework and its operational equation (Equation (19)) are inherently suited for integration into digital construction management and decision-support systems (DSS). By providing a quantitative link between geological inputs, equipment performance, and operational timelines, the model can serve as a core algorithmic component in DSS platforms for real-time cycle-time optimization and proactive risk assessment in tunneling projects.
To advance these critical safety applications, future research should prioritize expanding the database with detailed case studies from various immediate-collapse-prone formations. Concurrent validation work should test the framework’s performance limits in different geological settings exhibiting similar collapse behaviors. Furthermore, applying machine learning techniques to this specialized dataset offers promising potential for enhancing predictive accuracy of fragmentation patterns in unstable ground conditions. Systematic high-resolution geological mapping remains essential for validating and refining these correlations specifically for impact hammer operations in collapse-prone environments.
