1. Introduction
The accelerating global demographic shift towards an aging population has brought the quality of life and well-being of older adults into sharp focus as a core societal concern. China formally entered an aging society in 2000. In 2020, China’s population aged 60 or older exceeded 264 million, representing 25% of the global population in that age group, and the older population in China will exceed 300 million by 2025, marking the intensification of the trend of population aging [
1,
2,
3]. Within this context, the research, development, and optimization of age-friendly products hold significant importance for enhancing the autonomy, safety, and comfort of older individuals. As essential components of daily living, furniture designs for the elderly must comprehensively address their specific characteristics, including physiological decline, reduced mobility, and evolving psychological needs [
4]. However, the current market exhibits significant deficiencies in furniture tailored for this demographic. Key shortcomings include inadequate comfort, poor ergonomic fit, and a lack of considerate emotional design [
5,
6,
7,
8]. Research concerning furniture for the self-care elderly—those capable of independent living—has been notably neglected. This group represents the largest proportion of the older population, and their needs for health maintenance and social participation urgently require support through scientifically informed design [
9,
10].
Seating, being among the most frequently used furniture items by the elderly, directly impacts sitting stability, blood circulation, and musculoskeletal health. Studies indicate that poorly designed seats can lead to localized pressure concentrations, resulting in adverse outcomes such as pressure ulcers (bedsores) and chronic lower back pain. These issues, in turn, can exacerbate age-related declines in physical function [
11,
12,
13]. Consequently, optimizing seat design parameters to improve pressure distribution has emerged as a critical scientific challenge in the field of age-friendly furniture. While existing research often focuses on assistive devices for intermediate elderly (those requiring external assistance), systematic studies on seating comfort for the self-care elderly remain scarce. Furthermore, although body pressure distribution (BPD) testing is widely employed in seating assessment, the correlation between objective BPD metrics and subjective comfort evaluations lacks in-depth exploration. This gap results in a paucity of empirical evidence to underpin robust design criteria for this vital user group.
In recent years, scholars have increasingly recognized the significance of body pressure distribution (BPD) parameters—specifically contact area and pressure gradient—in assessing seating comfort [
14,
15,
16,
17,
18,
19,
20,
21,
22]. For instance, Fasulo employed pressure map analysis to characterize seated students’ movements, examining how the number, description, and frequency of these movements served as indicators of perceived comfort [
15]. Seat pressure measurements effectively quantify seating comfort and reflect the influence of body mass index on ergonomic design optimization [
23]. Similarly, Jiang et al. captured BPD under various sitting postures using pressure sensor arrays to inform airbag dynamic adjustment strategies based on comfort assessment [
24].
However, a critical limitation persists: most existing studies have focused on younger cohorts and have not adequately accounted for the distinct physiological characteristics of older adults, such as reduced muscle tone, joint stiffness, and altered tissue compliance. Emerging research specific to the elderly indicates lower pressure sensitivity thresholds and diminished capacity for postural adaptation [
25]. This necessitates more refined parameter selection for age-friendly seat design to accommodate these vulnerabilities.
Consequently, this study investigated the influence of seat height and backrest inclination on pressure distribution and subjective comfort in healthy older adults aged 61–70 years. Integrating objective BPD testing with structured subjective evaluations, the research aimed to quantify BPD characteristics (contact area, average pressure, maximum pressure, pressure gradient) across varied seat parameters (height and inclination); elucidate the correlation between objective BPD metrics and subjective comfort ratings; and propose evidence-based optimal design parameters for age-friendly seats targeting the self-care elderly population.
2. Materials and Methods
2.1. Laboratory Equipment and Personnel
The experimental setup comprised a rigid seat with adjustable seat height and backrest inclination. The apparatus was self-designed and constructed by our research team, instead of being purchased from a commercial supplier. Body pressure distribution was measured using a Tekscan (Boston, MA, USA) Model 5315 Body Pressure Distribution Measurement System (BPMS). The BPMS sensor mat has an active sensing area of 487.7 mm × 426.7 mm, containing 2016 individual sensing elements [
25], and collects real-time pressure distribution data with an accuracy of ±10% [
26]. Supporting equipment included electronic weighing scales and tape measures for recording participant anthropometrics and adjusting seat parameters.
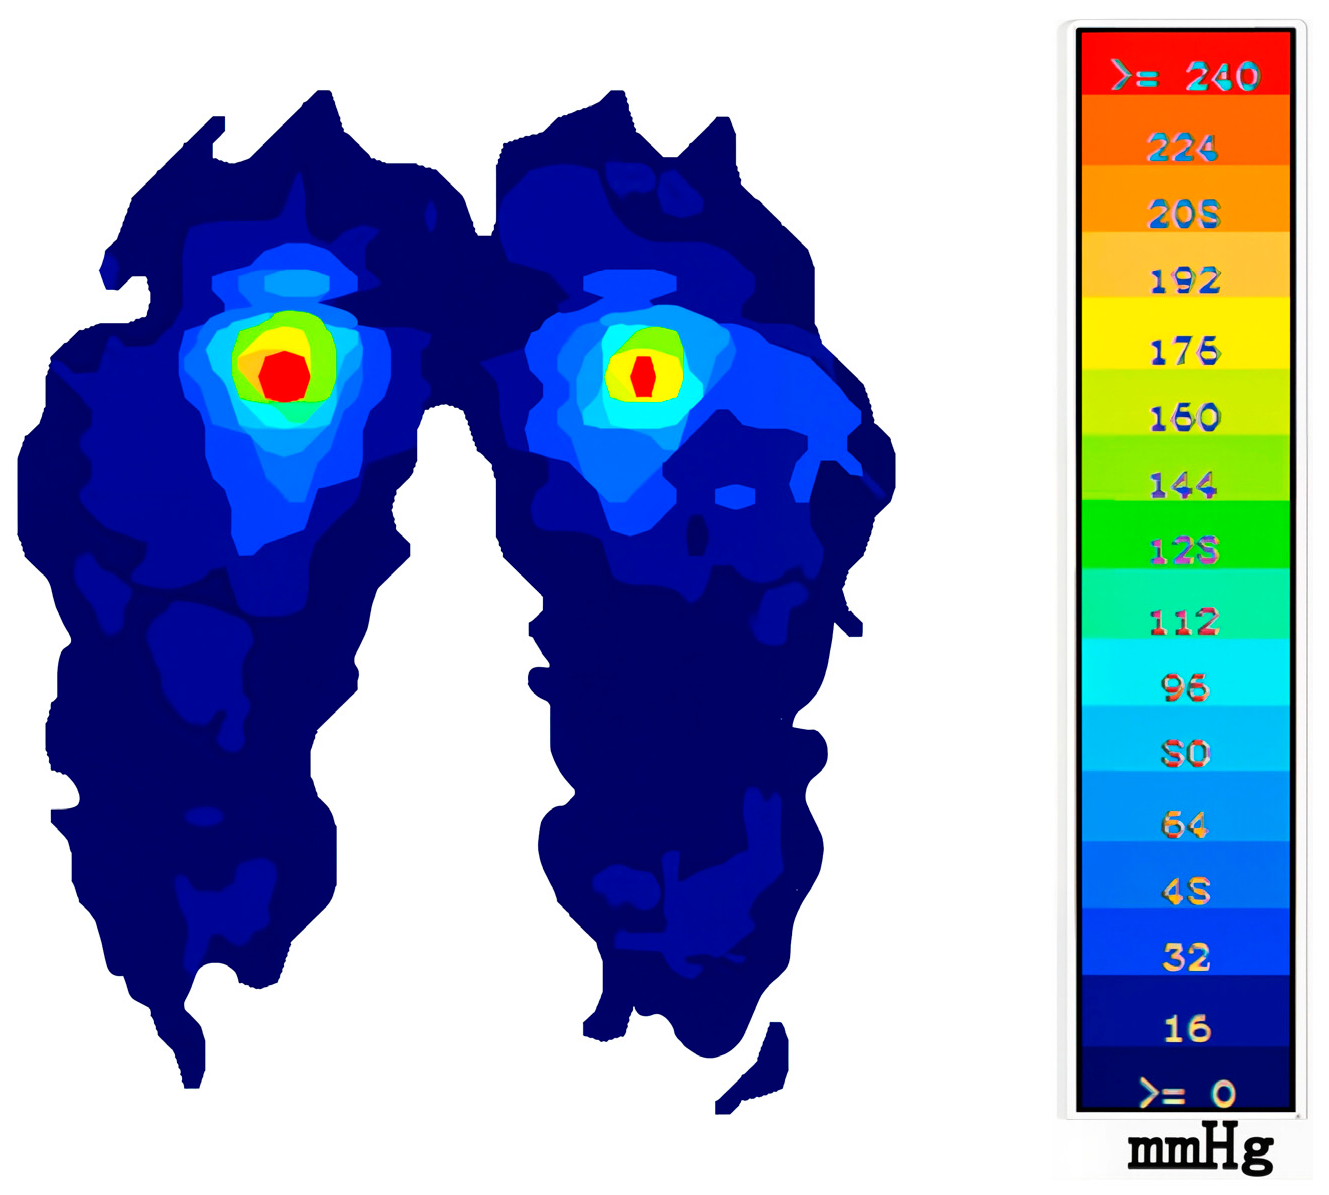
The BPMS software provided real-time visualization of pressure distribution via 2D contour maps and 3D pressure topography plots (
Figure 1), utilizing a color gradient (dark blue indicating low pressure to red indicating high pressure) to represent pressure magnitude differences. The software synchronously recorded key pressure parameters for both the seat cushion and backrest, including maximum pressure, average pressure, contact area, and pressure gradient, at a sampling frequency of 50 Hz. All acquired data were saved in ASCII format for subsequent offline statistical analysis. Twenty healthy, community-dwelling older adults (age range: 61–70 years) were recruited to participate in the body pressure testing and subjective evaluation experiments. Participant characteristics are summarized in
Table 1.
All experimental sessions were conducted in May 2024 between 9:00 and 11:30 a.m. to minimize the potential influence of diurnal variation on comfort perception. The session duration was approximately 60 min per participant, comprising an initial briefing, anthropometric measurements, a 5 min acclimatization period, the formal 45 min seating trial, and a short debrief. The laboratory environment was kept quiet and well-illuminated, with air temperature maintained at 24 °C and relative humidity at approximately 55%. To foster a relaxed atmosphere, only the researcher and the participant were present during testing. Seating was provided by a rigid hardwood chair with adjustable seat height (360–460 mm) and backrest angle (90–135°). Both seat and backrest surfaces consisted of 18 mm flat plywood panels without padding, thereby eliminating any confounding effects of upholstery materials.
2.2. Testing Procedure
The study investigated the effects of seat height and backrest inclination independently.
Five seat heights were tested relative to each participant’s reference seat height, defined as H mm = knee popliteal height (KPH) plus heel thickness, with a small adjustment margin for movement. The tested heights were H − 50 mm, H − 25 mm, H mm, H + 25 mm, and H + 50 mm. Here, H mm served as the baseline reference height for all experimental conditions. For backrest inclination, four angles were tested: 90°, 105°, 120°, and 135°. The backrest was adjusted to the target angle. The pressure sensor mat was carefully placed flat and smoothly on the seat pan or backrest surface to avoid folds or wrinkles. Once the sensor readings stabilized, participants sat down in a relaxed posture (without leaning against the backrest for seat-only tests, or with full back support for backrest tests), and data recording began.
For all tests, participants kept their arms relaxed at their sides, with forearms and palms resting naturally on their thighs. After the real-time pressure readings in the BPMS software stabilized, 200 consecutive frames of pressure data were recorded and saved in ASCII format. To ensure data quality, frames were inspected to remove artifacts or sudden spikes. Retained frames were averaged to obtain stable values for maximum pressure, average pressure, contact area, and pressure gradient. Pressure gradients were calculated as the spatial difference in pressure between adjacent sensing elements normalized by local contact area. All values were standardized within each participant to allow for comparison across different seat heights and backrest angles.
Immediately after data recording for each condition, participants reported their comfort sensations and completed an evaluation form assessing seven areas: front of thighs, back of thighs, tailbone (coccyx), buttocks (ischial region), calves, feet, and overall comfort, using a 7-point Likert scale (1 = very uncomfortable, 7 = very comfortable). After completing one condition, participants got up from the seat, the seat height or backrest angle was adjusted to the next setting, and the entire testing cycle was repeated until all combinations were tested.
3. Results
3.1. Body Pressure Distribution Measurements and Analyses
Pressure data collected by the body pressure measurement system were exported as CSV files, constructing pressure distribution matrices. These data were processed in Microsoft Excel 2023 to calculate key metrics for each trial: contact area (cm2), average pressure (kPa), maximum pressure gradient (kPa/cm), and average pressure gradient (kPa/cm). Metric values were then averaged across trials within each test condition to generate summary tables.
The processed dataset was analyzed using IBM SPSS Statistics 26.0. Correlation analyses examined relationships among objective pressure metrics, relationships among subjective comfort ratings, and correlations between objective metrics and subjective ratings.
Figure 2 shows the effect of seat height on the contact area. Contact area between participants and the seat surface showed a positive correlation with increasing seat height. At the lowest height (H − 50 mm), the anterior thighs tended to lift, minimizing contact area. As seat height increased, thigh contact became more complete, resulting in a steady increase in contact area.
Figure 3 shows the effect of backrest inclination on the contact area. At the standard seat height (H mm), the contact area between the lower back and backrest increased with greater backrest inclination. As the backrest angle increased, participants’ upper bodies tilted forward and settled deeper into the seat. This postural shift significantly enhanced contact area in the lumbar region.
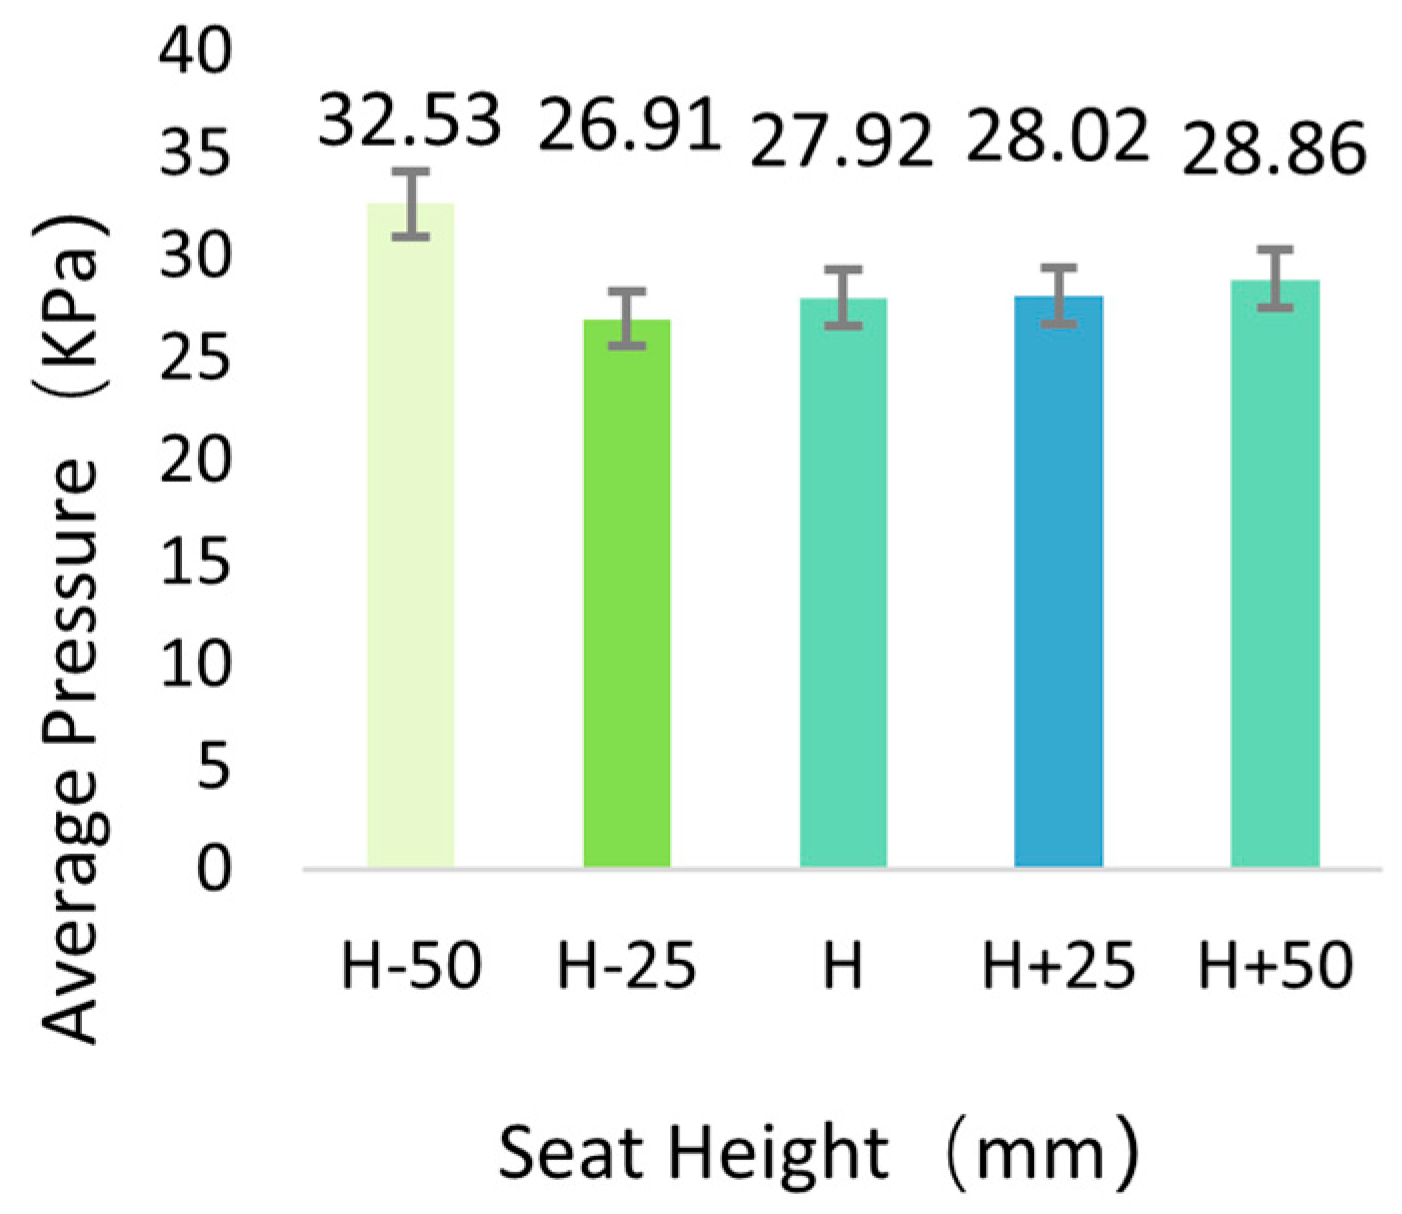
Figure 4 shows the effect of seat height on average pressure. Average pressure exhibited a U-shaped relationship with seat height, decreasing initially before rising. The minimum average pressure occurred at H − 25 mm. Beyond this height, average pressure stabilized. This trend reflects asynchronous changes in total force and contact area; as their divergence increased, the ratio (average pressure = total force/contact area) shifted nonlinearly.
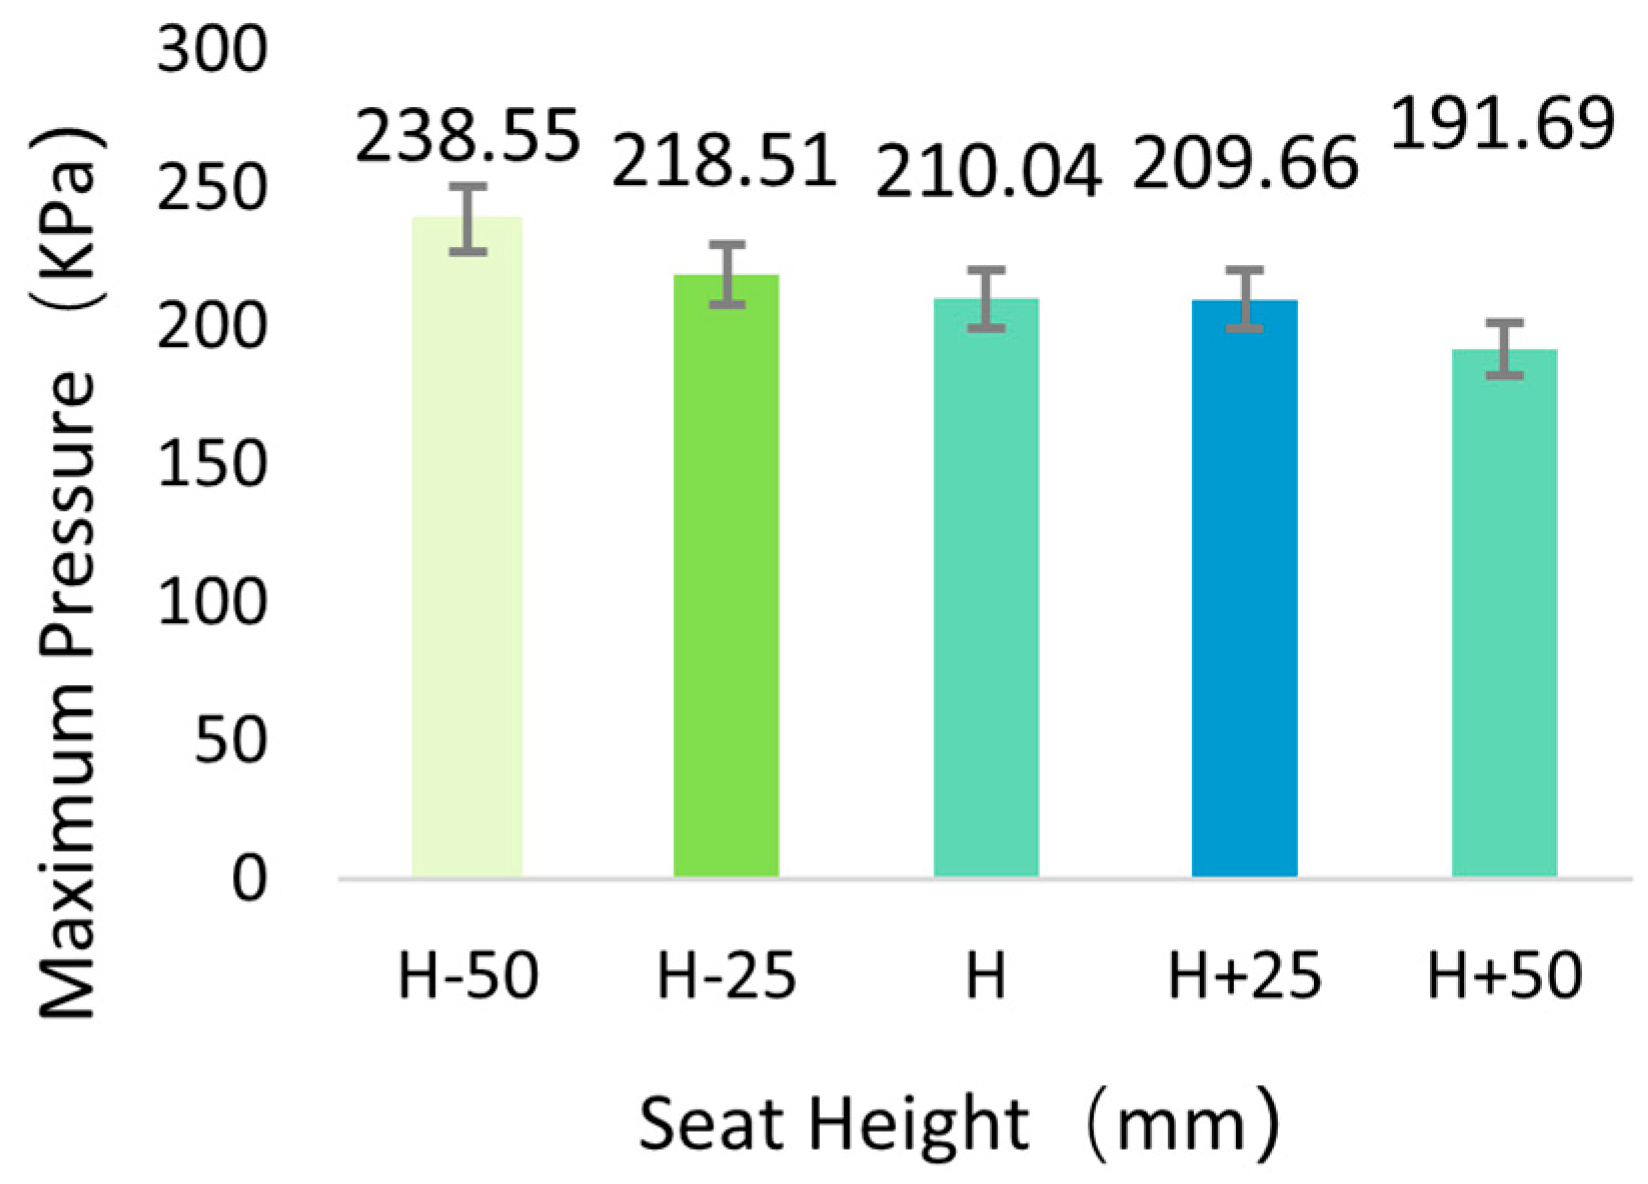
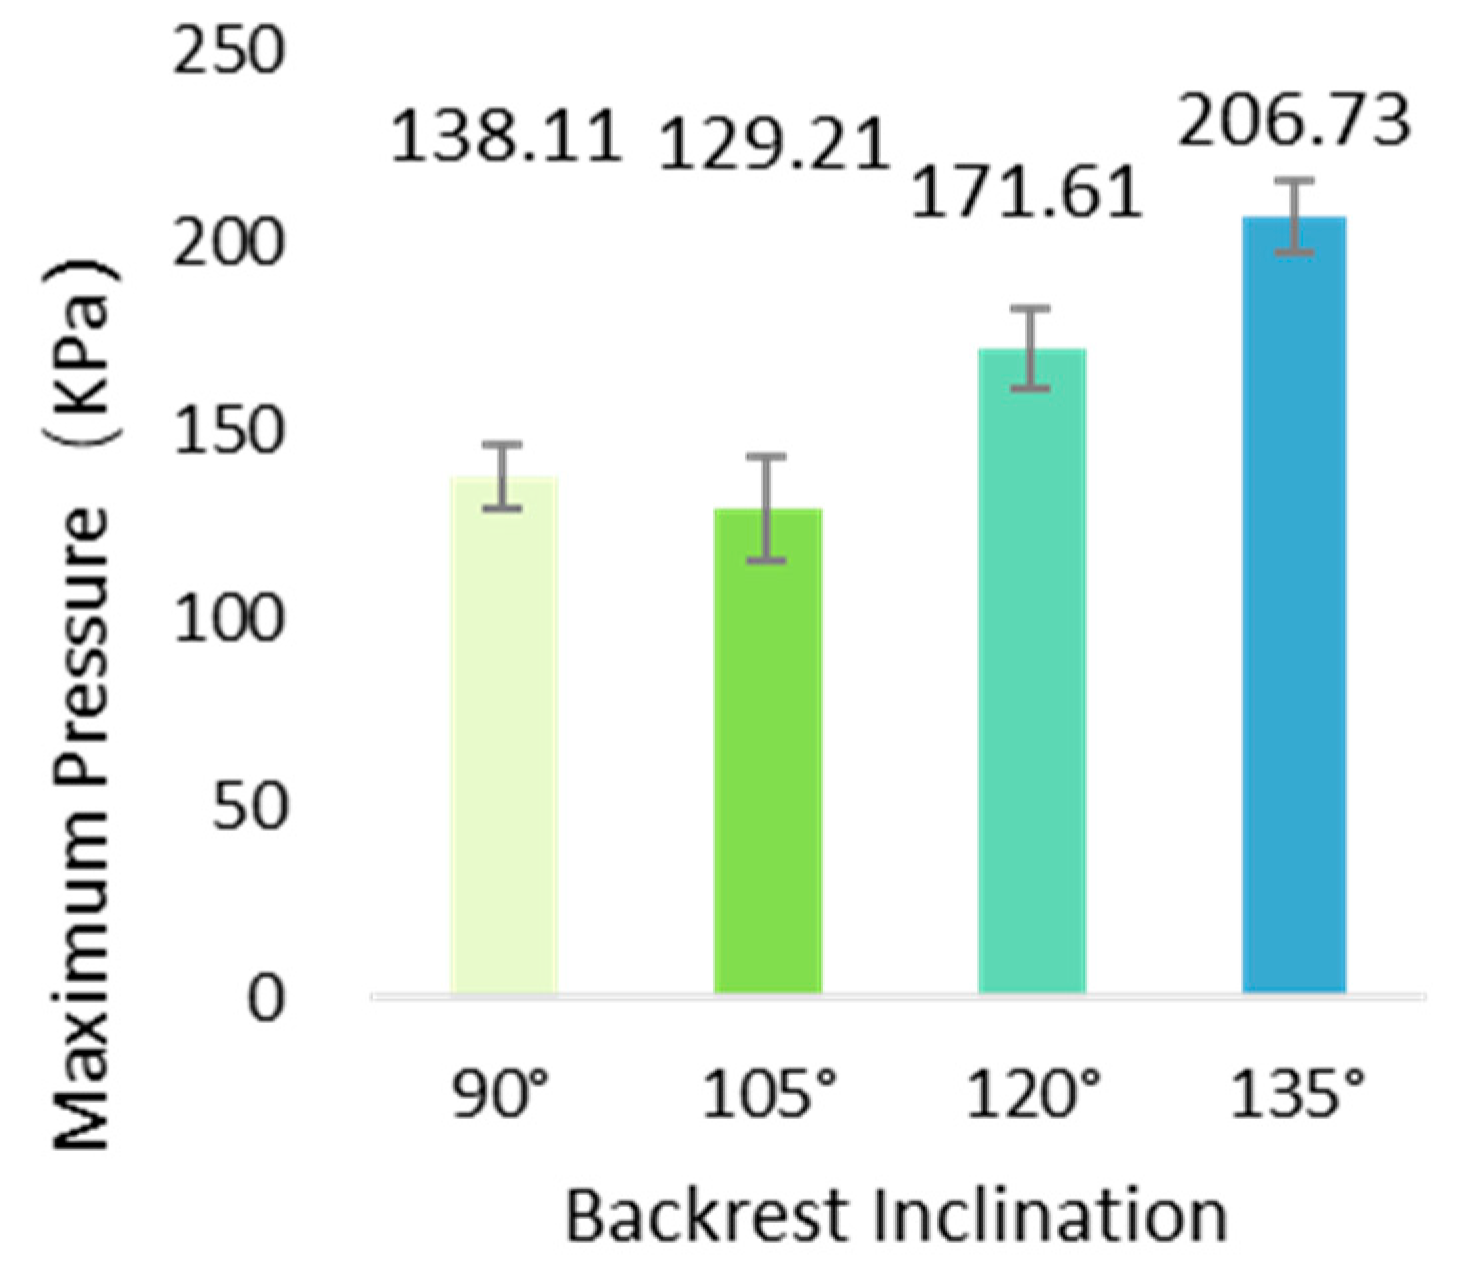
Figure 5 and
Figure 6 show the effect of seat height on maximum pressure. Maximum pressure reached its lowest value at H + 50 mm. Pressure concentration was primarily localized near the ischial tuberosities. Increasing seat height expanded thigh–seat contact area, gradually increasing thigh pressure while significantly reducing pressure at the ischial tuberosities, thereby lowering maximum pressure. Comparing height conditions, both average and maximum pressures were lowest at H mm and H − 25 mm, and highest at H − 50 mm. Overall, both pressure metrics displayed a decreasing trend as seat height increased.
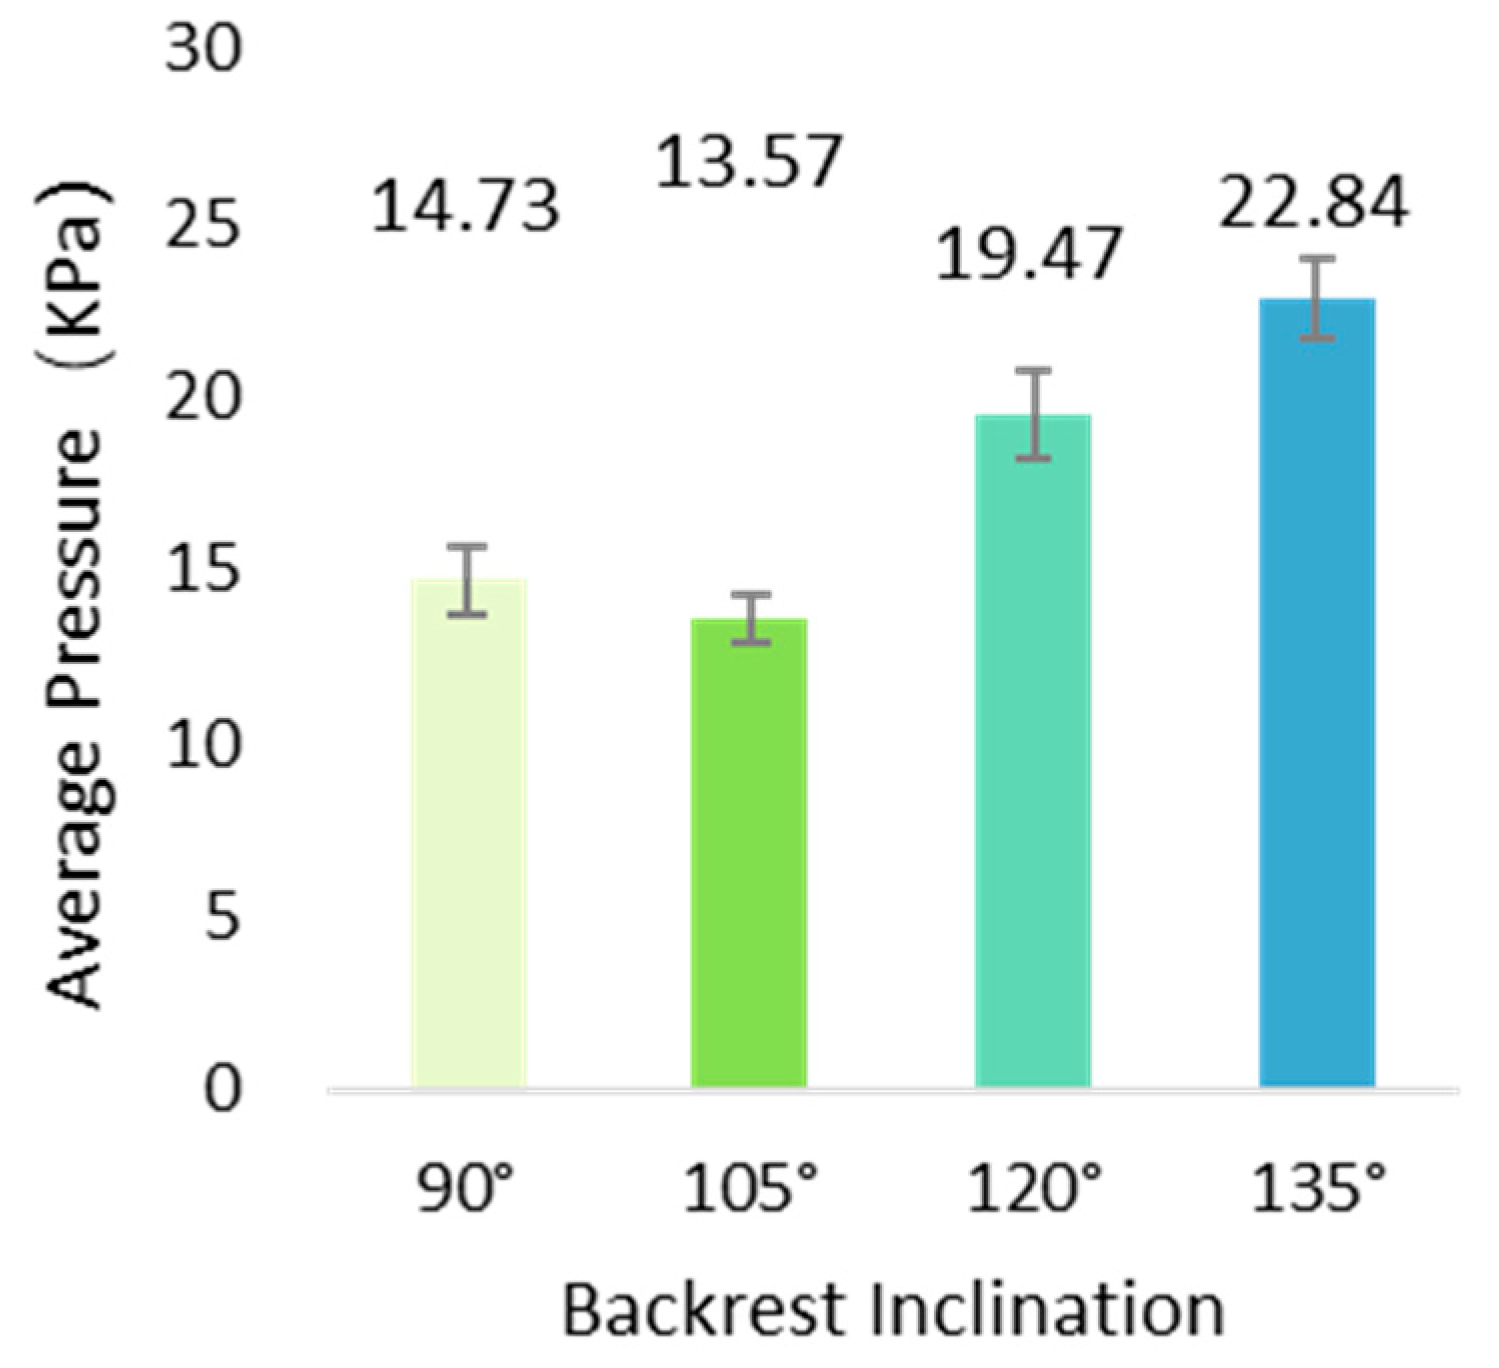
Figure 7 and
Figure 8 show the effect of backrest inclination on the pressure distribution. Average and maximum pressures on the backrest generally increased with greater inclination, though this trend was nonlinear, characterized by an initial decrease followed by an increase. Two mechanisms explain this: one is increased load sharing, i.e., greater backrest inclination shifted more upper body weight onto the backrest, increasing the proportion of total body load supported dorsally and significantly elevating maximum pressure. The other is area–force imbalance, i.e., the increase in total force exerted on the backrest exceeded the concurrent expansion of the contact area, driving up the average pressure.
The inclination angle of 105° represented the optimum, this is characterized by a reduction in both the average and maximum pressures to their lowest values, and the difference between them being the smallest. This configuration yielded high seating stability and optimal pressure distribution, indicating a critical angle for achieving balanced loading.
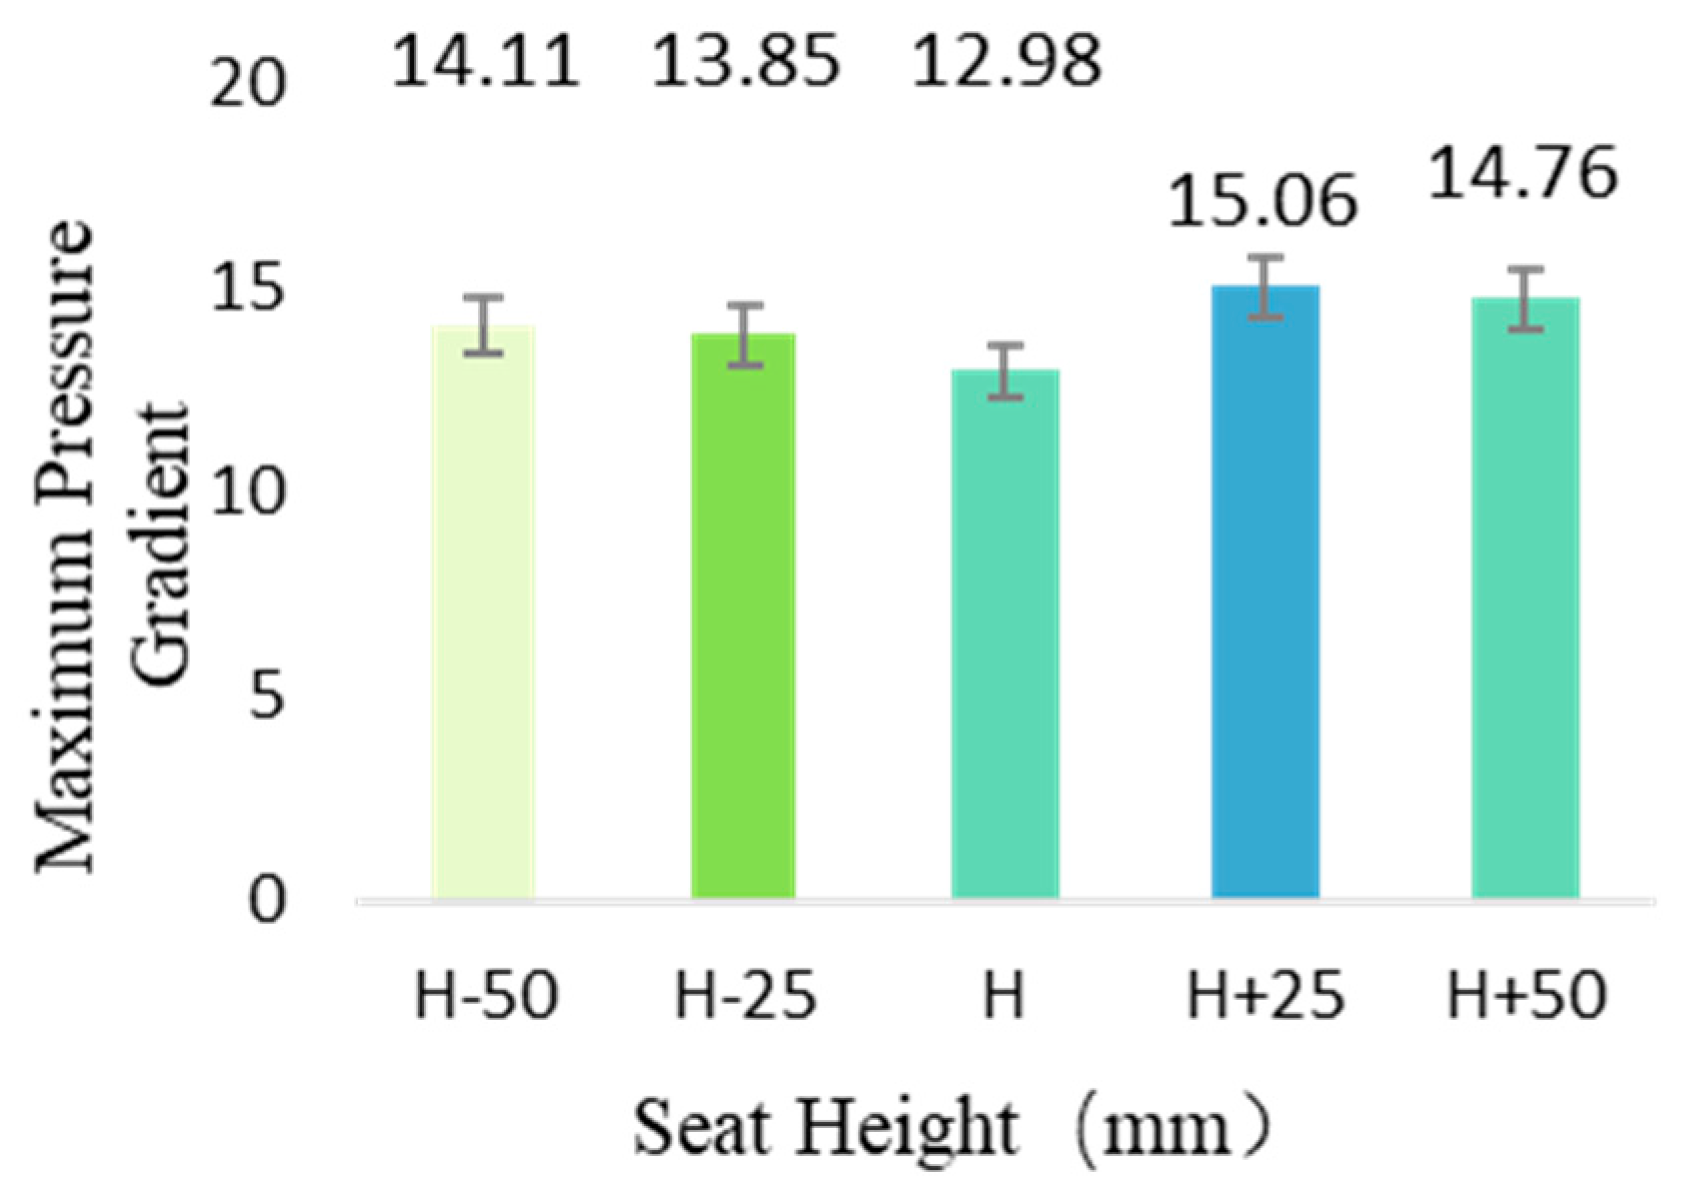
Figure 9 and
Figure 10 illustrate the effect of seat height on pressure gradient. Both the average and maximum pressure gradients exhibited an asymmetric trend, decreasing initially before increasing as the height of the seating surface rose. Both gradients reached their minimum values at the baseline height (H mm). The average pressure gradient peaked at H + 50 mm, while the maximum pressure gradient peaked at H + 25 mm. This pattern indicates that adjusting the seating surface height alters the dynamic balance of pressure distribution within the contact area, triggering a nonlinear response in the gradient metrics.
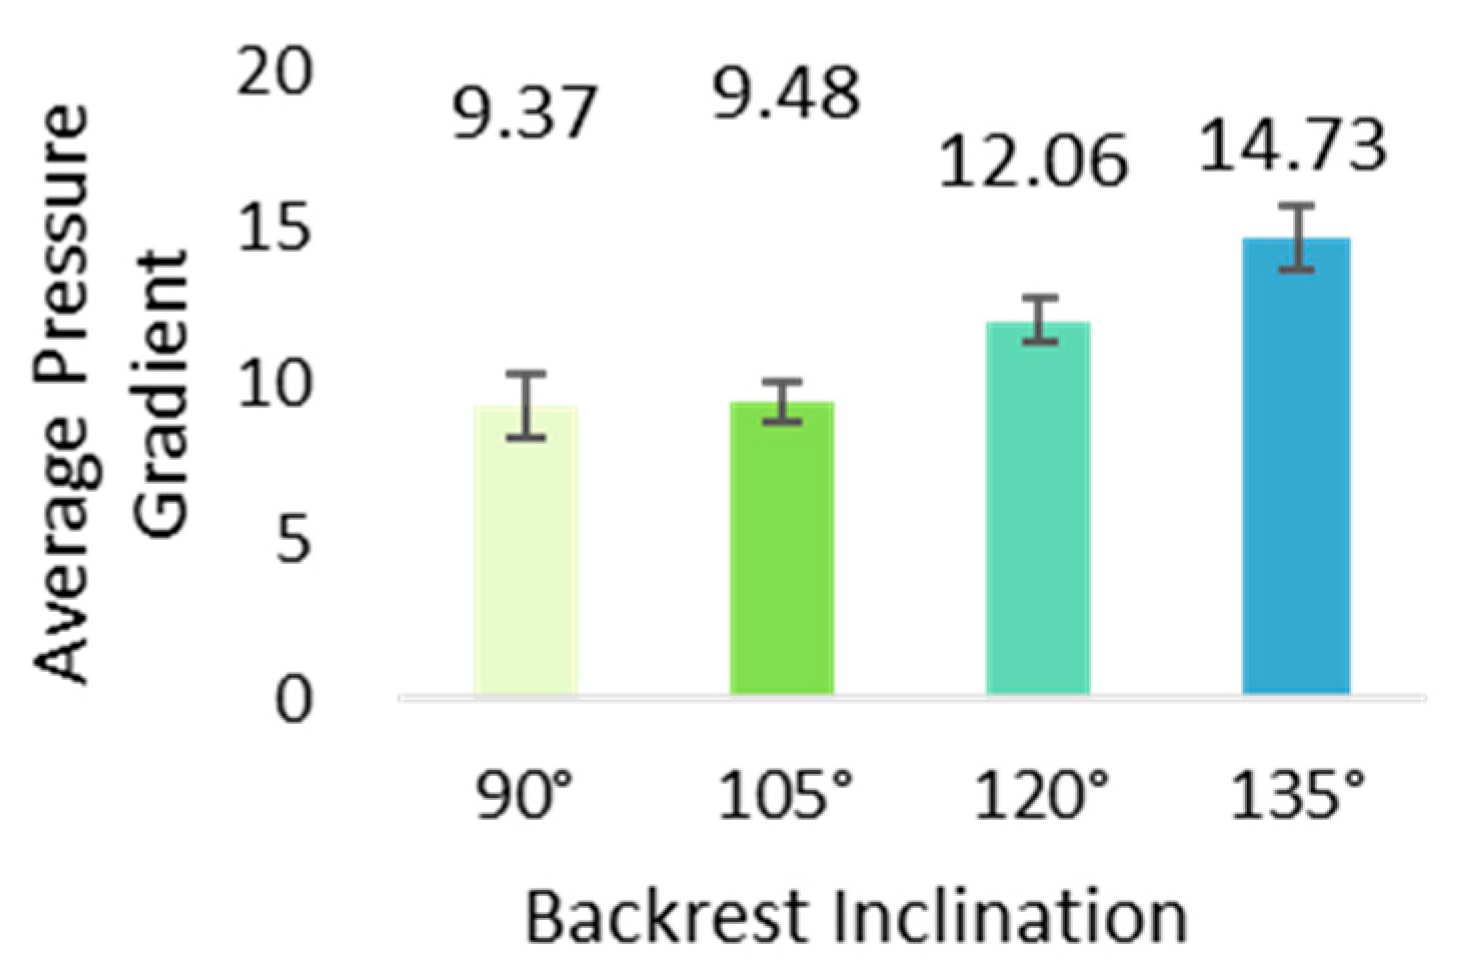
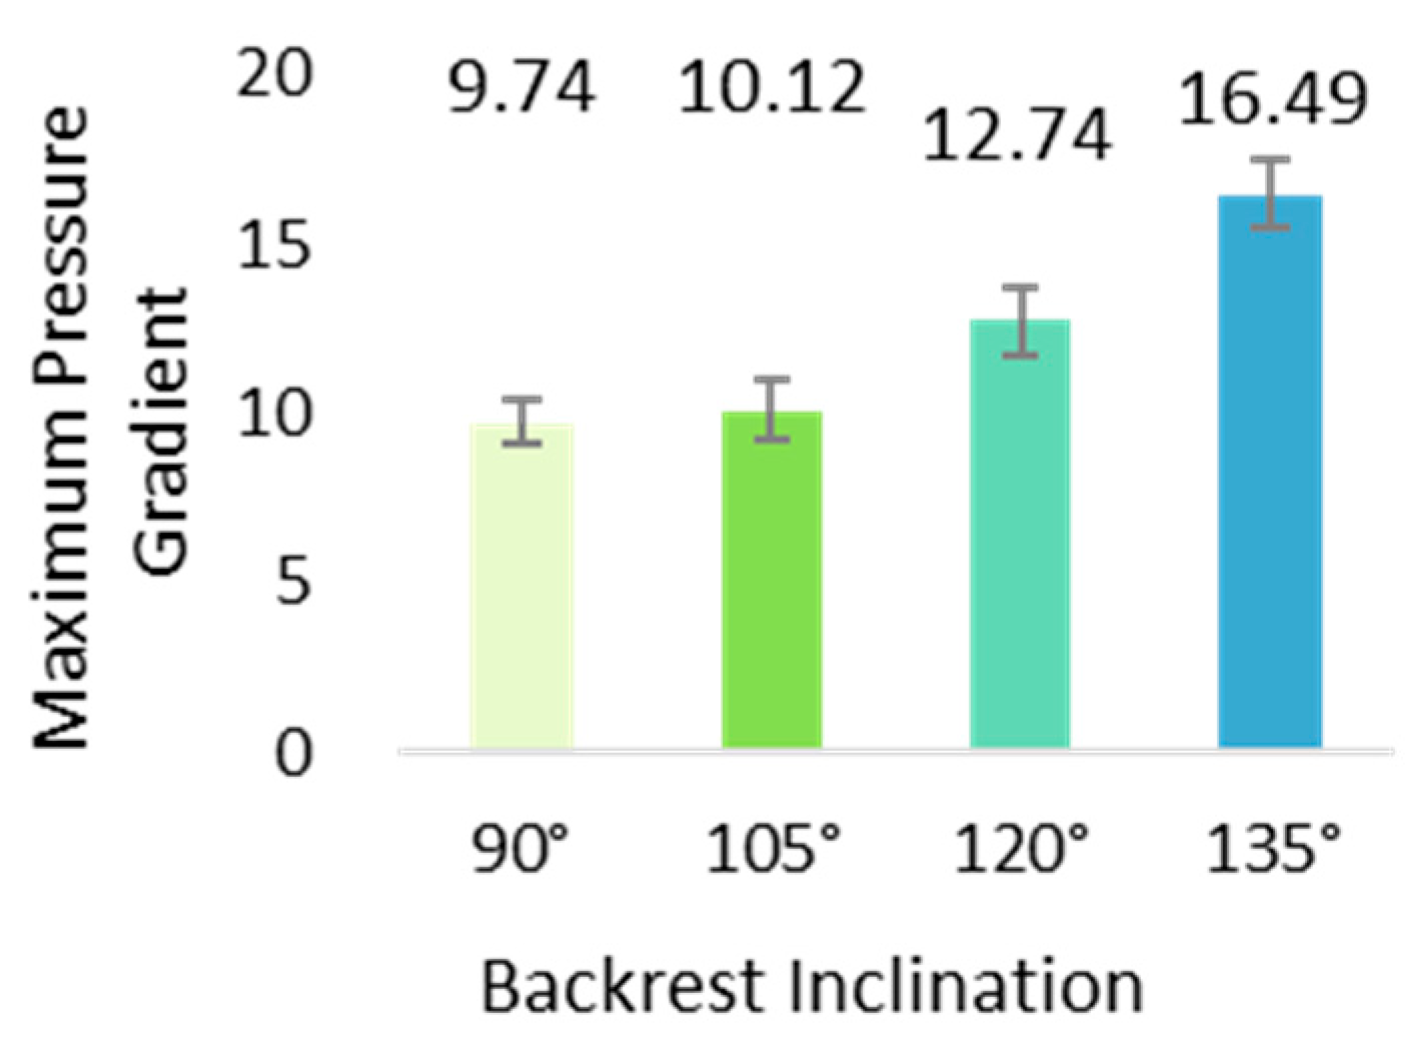
Figure 11 and
Figure 12 depict the effect of backrest inclination on pressure gradient. Both average and maximum pressure gradients showed significant positive correlations with increasing backrest inclination, reaching their maximum values simultaneously at 135°. At inclination angles of 90° and 105°, pressure gradient values remained comparatively low, reflecting a balanced pressure distribution between the occupant and backrest, along with optimized support efficiency. The consistently lower gradient values observed at inclinations ≤ 105° further corroborate the existence of the ‘critical state of pressure equilibrium’ proposed in the previous section.
3.2. Analysis of Subjective Evaluation Results
Figure 13 illustrates the effect of seat height on subjective comfort. Comfort scores followed a unimodal distribution relative to seat height, peaking at the baseline height (H mm) with a mean overall score of 6.1 at H + 50 mm, scores decreased to their lowest value with mean value of 3.9. Within the range of H − 25 mm to H mm, regional comfort perception and overall scores were significantly superior to other height configurations. Consequently, for elderly users, the recommended seat height is optimized between 25 mm below and equal to popliteal height (H − 25 mm to H mm) to maximize ergonomic adaptation.
Figure 14 depicts the effect of backrest inclination on subjective comfort. Overall comfort increased gradually between 90° and 105°, peaking at 105° (mean value of 5.8), where regional comfort metrics were concurrently optimal. Beyond 105°, comfort declined markedly (mean value of 4.4 at 135°). This reduction is attributable to (1) diminished foot–ground contact area reducing postural stability due to insufficient friction and (2) backward gravitational shift inducing muscular compensation that accelerates fatigue accumulation. These findings establish 105° as the critical threshold for the synergistic optimization of pressure distribution balance and postural stability.
3.3. Correlation Analysis of Subjective and Objective Results
Figure 15 presents correlations between regional and overall comfort. Bivariate analysis revealed significant positive correlations between overall comfort and comfort at the foot, calf, coccyx, and anterior thigh (
p < 0.01), identifying these regions as primary drivers of overall comfort. Calf comfort correlated significantly with foot, coccyx, and anterior thigh comfort (
p < 0.05), suggesting a synergistic lower-limb comfort mechanism mediated by gravitational shift and pressure redistribution during seat height adjustment.
Figure 16 extends this analysis to lumbar, back, shoulder, hip, and slippage metrics. Overall comfort correlated positively with foot/calf comfort and negatively with slippage (
p < 0.01). Foot and calf comfort were strongly correlated and jointly exhibited negative correlations with slippage. This interdependency arises because (1) gravitational shifts at higher inclinations (>105°) synchronize mechanical loading on the foot–calf complex, coupling their comfort responses; and (2) reduced foot–ground contact at >105° diminishes friction, exacerbating slippage perception and degrading overall comfort.
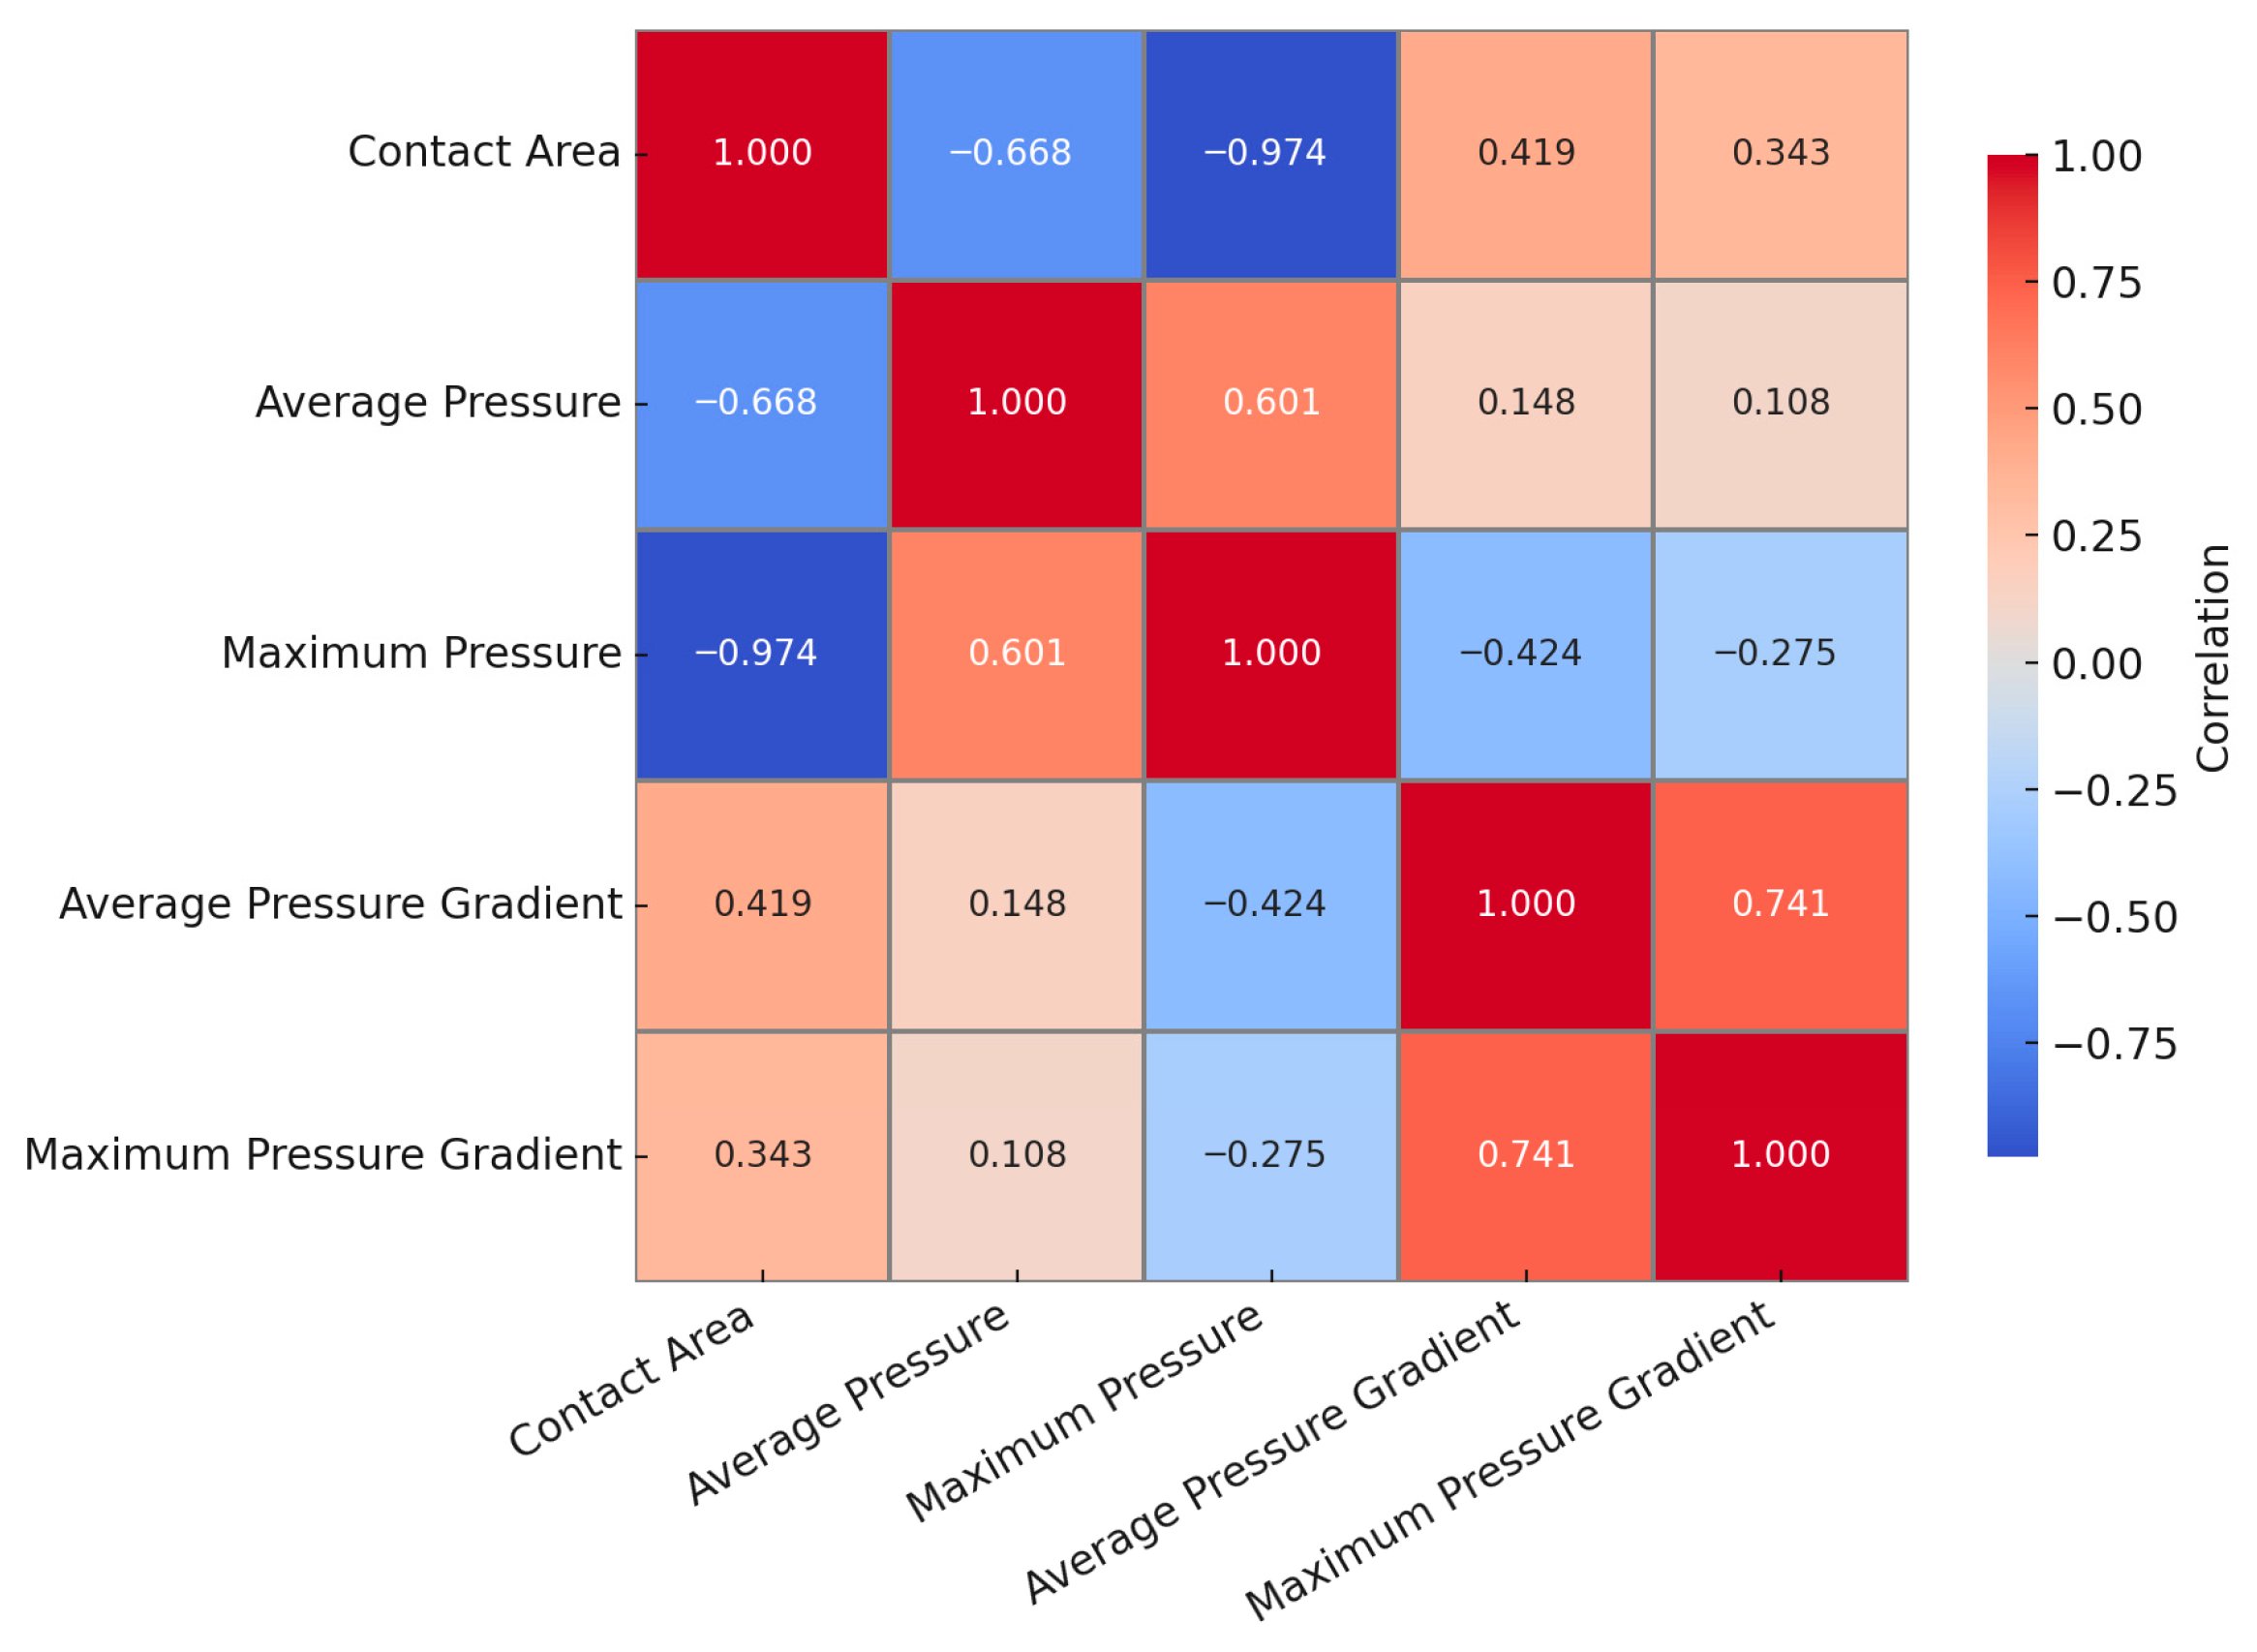
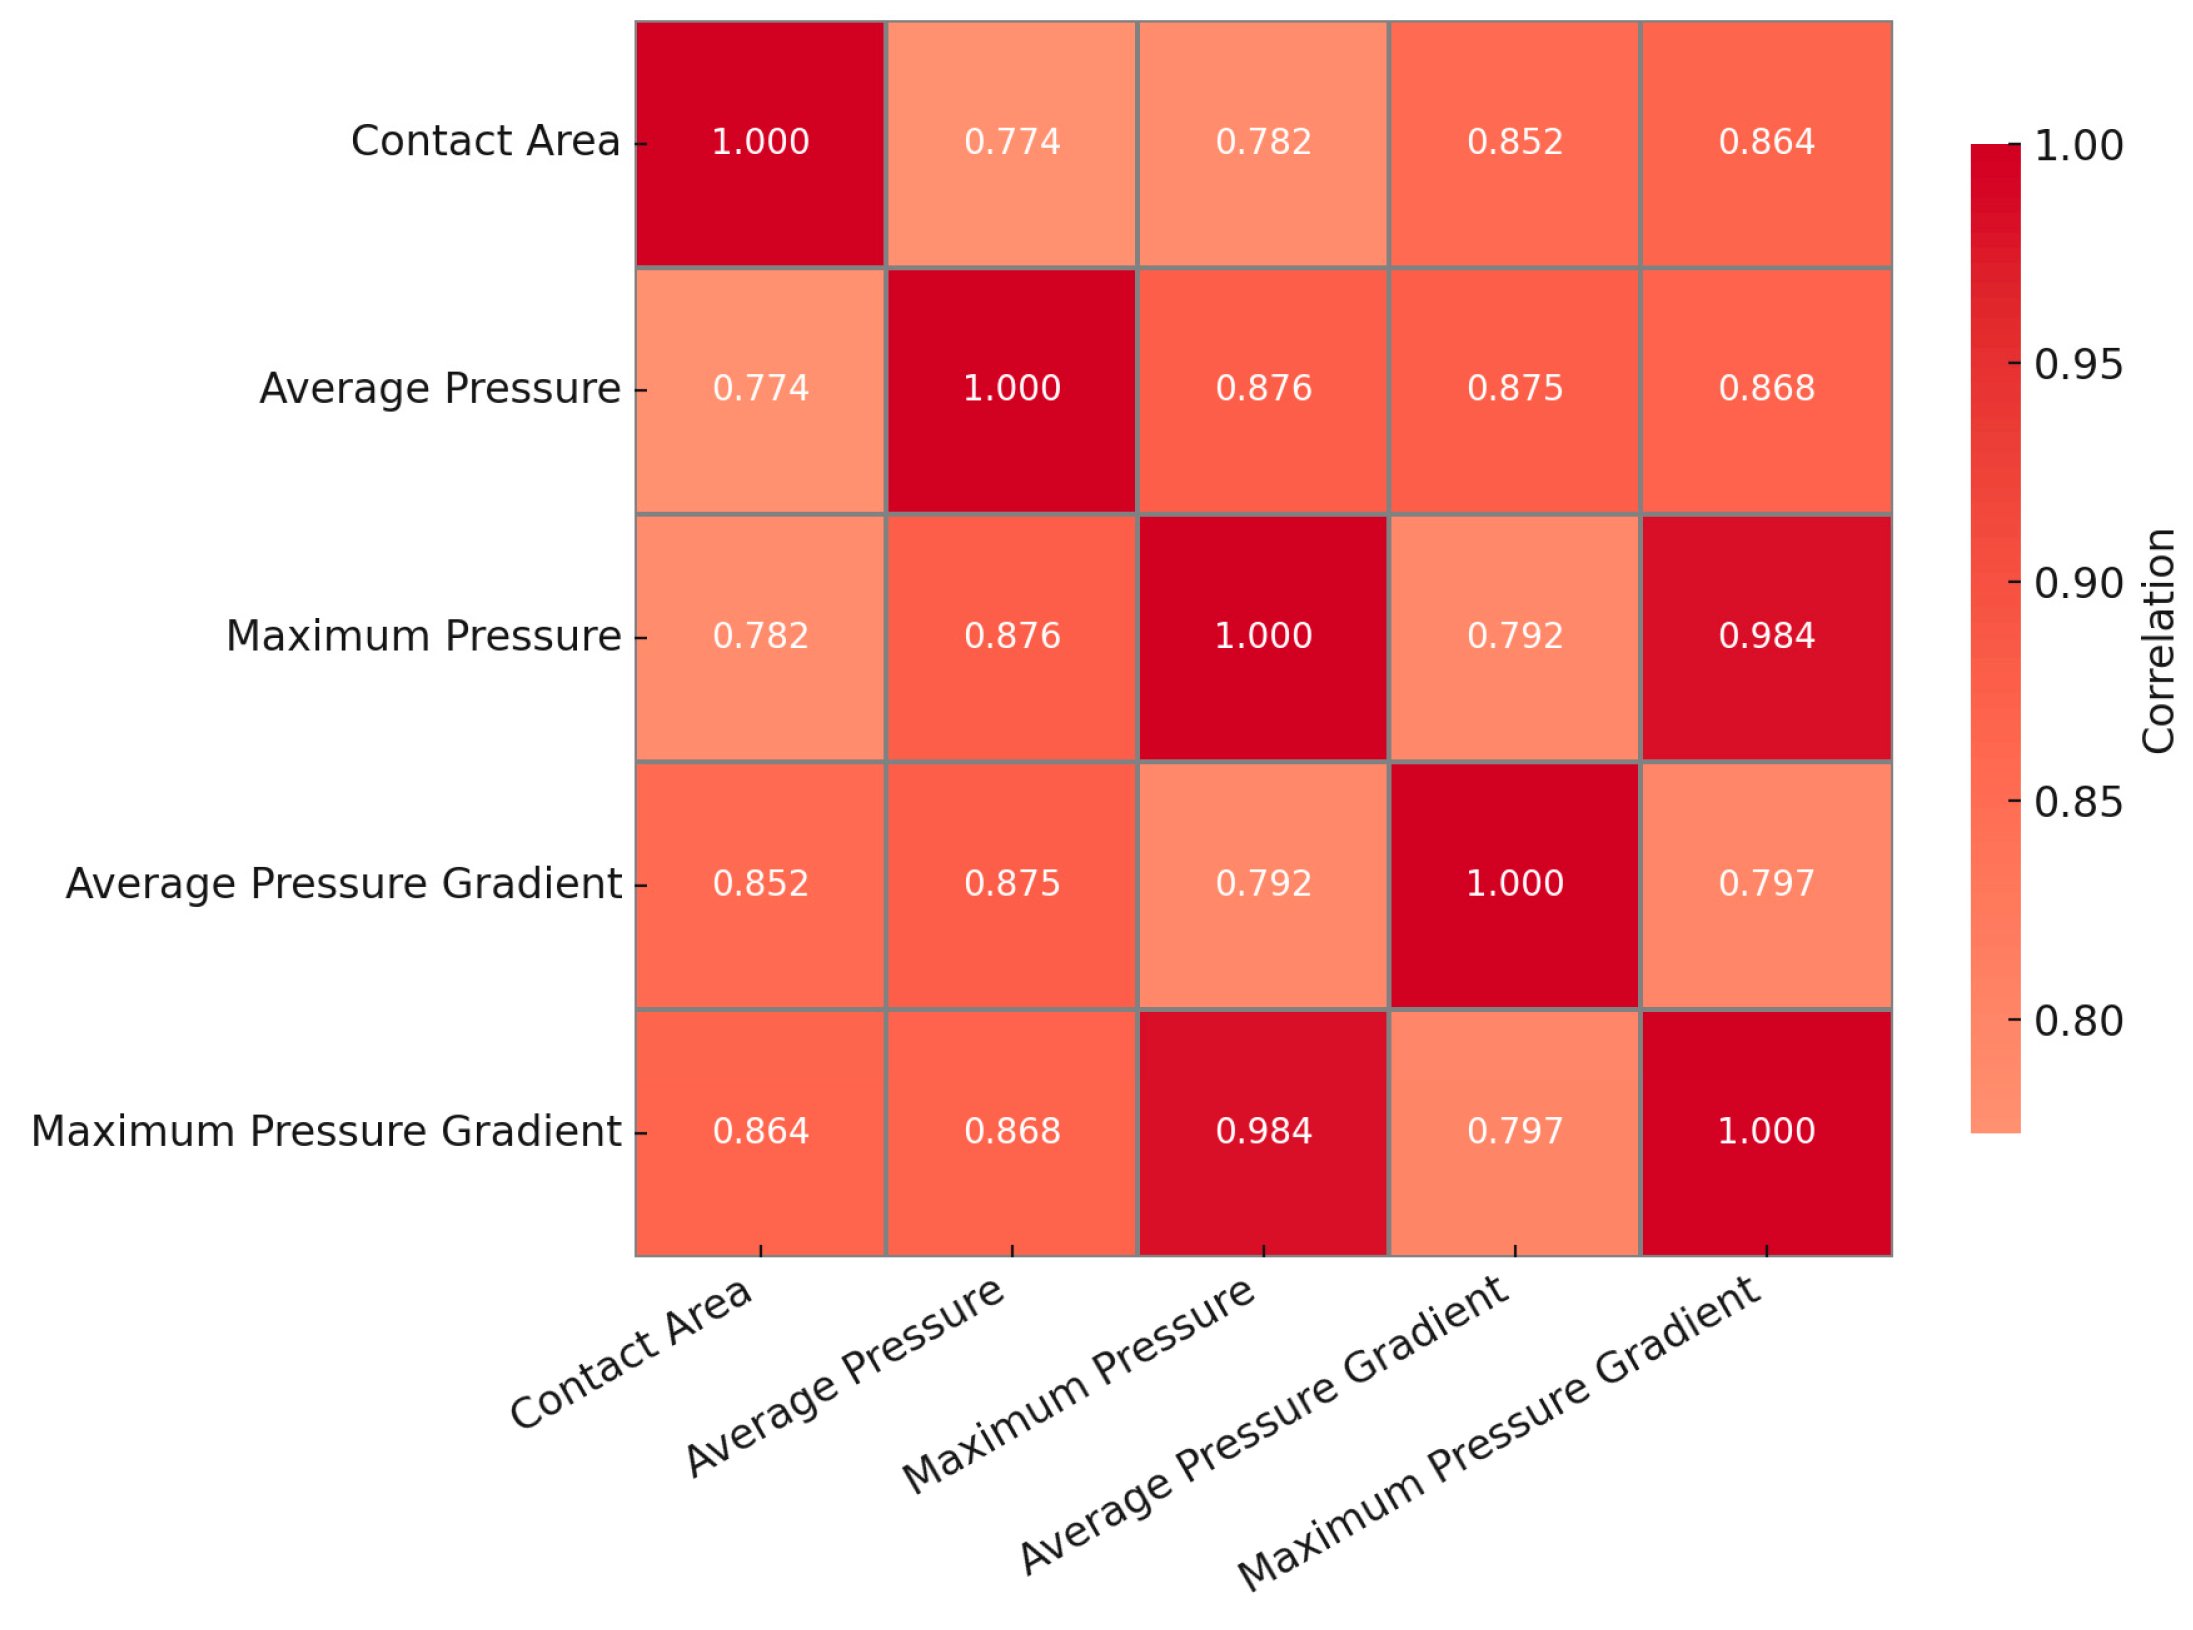
Figure 17 and
Figure 18 show correlations between objective pressure metrics and comfort. Bivariate analysis of contact area, seat height (H mm), mean/maximum pressure (kPa), and mean/maximum pressure gradient (kPa/cm) revealed a highly significant positive correlation (
p < 0.01) between maximum pressure and maximum pressure gradient, indicating synergistic escalation. This coupling originates from (1) backward gravitational shift at increased inclinations amplifying pressure concentration in lumbar/shoulder support zones; (2) pressure distribution inhomogeneity concurrently elevating peak pressure and its spatial gradient; and (3) pressure gradient serving as a quantifier of distributional instability, jointly with absolute pressure defining the support system’s stability threshold.
Figure 19 demonstrates the effect of average pressure gradient on comfort. Overall comfort and foot/calf comfort exhibited significant negative correlations with mean seat pressure gradient (kPa/cm) (
p < 0.01), indicating high sensitivity of lower limbs to pressure inhomogeneity. As key weight-bearing structures, the foot and calf experience comfort degradation synchronously under elevated pressure gradients, which intensify localized muscular compensation and subjective discomfort. Low average pressure gradients reflect homogeneous pressure distribution, mitigating tissue compression and thereby enhancing lower-limb and overall comfort. Excessively low seat heights trigger forward gravitational shift, concentrating pressure in the sciatic region and elevating the average pressure gradient. This simultaneously reduces foot–ground contact area, destabilizing lower-limb support and increasing seat pressure gradients.
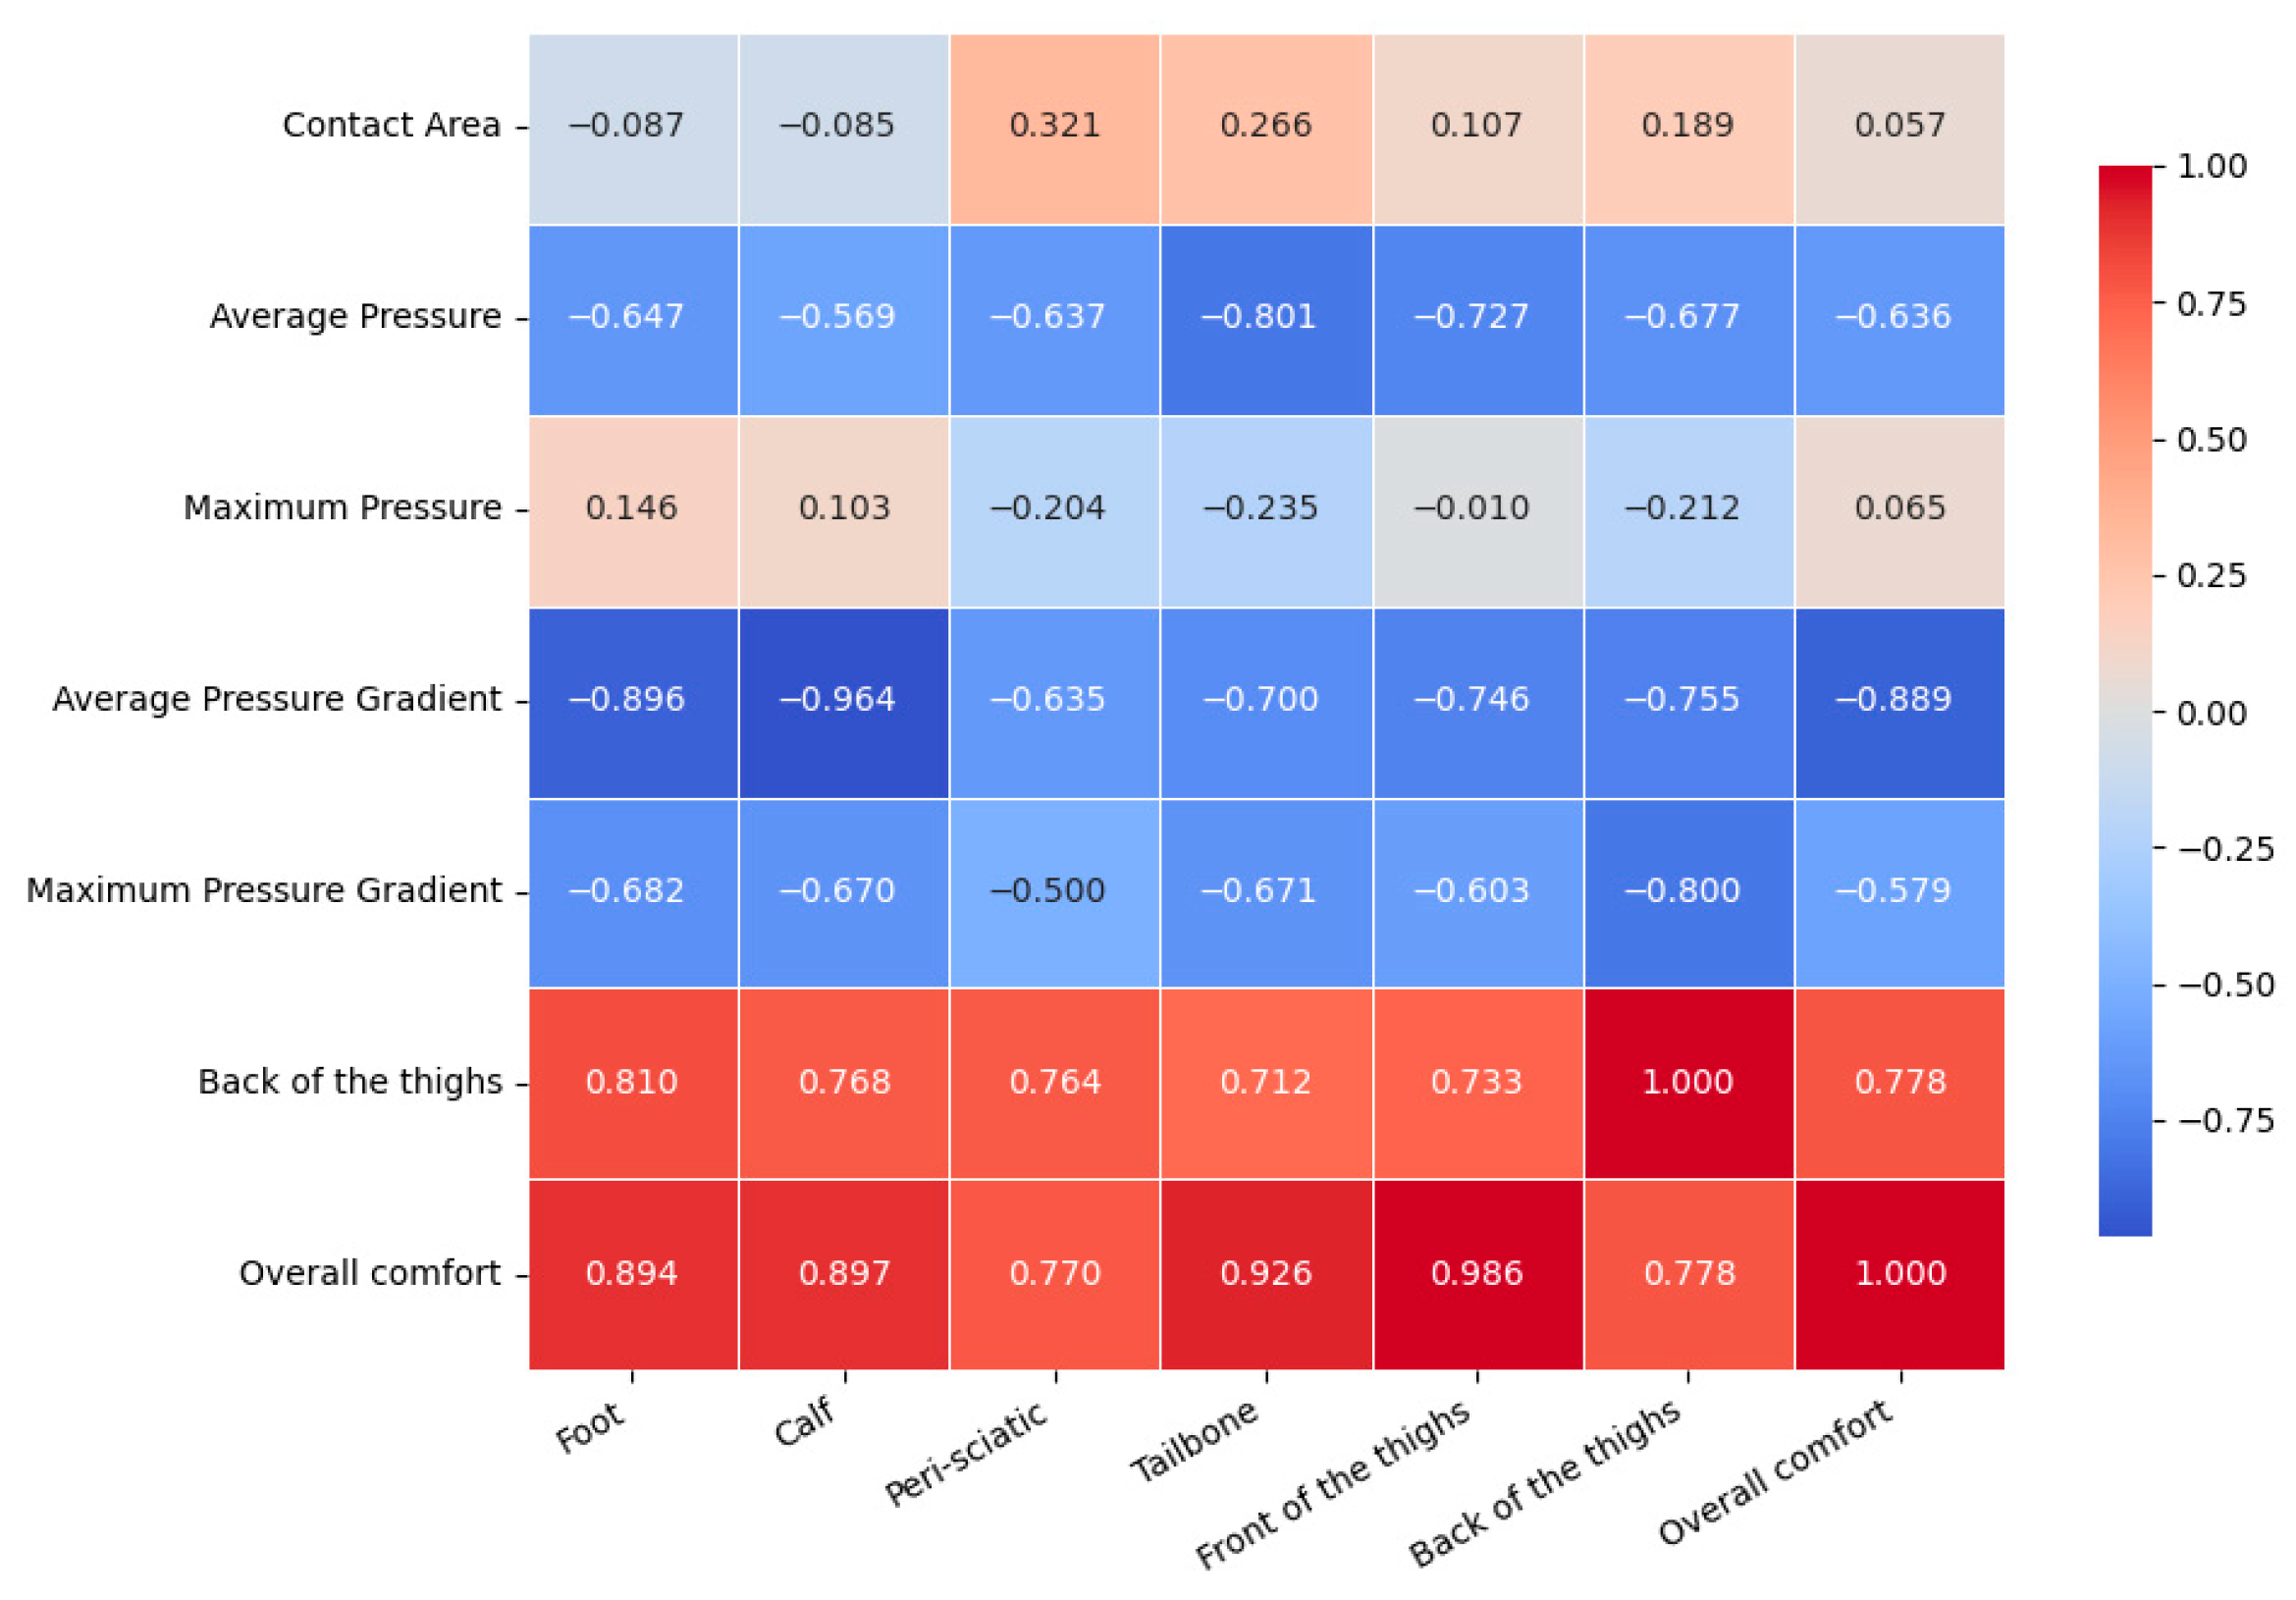
Figure 20 synthesizes system-level associations. Overall comfort correlated negatively with mean/maximum pressure (kPa) and pressure gradients (kPa/cm) (
p < 0.01), confirming that lower pressure metrics elevate comfort. This relationship stems from increased backrest inclination shifting the center of gravity backward, raising trunk-seat interface pressure and consequently increasing all pressure metrics—reducing overall comfort. Foot/calf comfort declined with elevated mean/maximum pressures due to inclination-induced foot–ground contact loss exacerbating pressure maldistribution. Slippage perception correlated positively with average pressure and gradient (
p < 0.01), as pressure inhomogeneity amplifies slippage sensation, while insufficient interfacial friction synergizes with gravitational shift to increase slippage risk.
4. Discussion
This study systematically analyzes how seat height and backrest inclination affect sitting comfort in elderly populations, revealing critical relationships between body pressure distribution metrics and subjective perception. These findings establish foundational insights for designing age-appropriate seating solutions.
4.1. Mechanisms of Influence of Seat Parameters on Pressure Distribution
Experimental results indicate optimal pressure distribution uniformity at seat heights corresponding to popliteal height (H mm) or H − 25 mm, significantly enhancing comfort in the foot, calf, coccyx, and anterior thigh. Biomechanically, excessively low seating (e.g., H − 50 mm) reduces contact area, concentrating pressure on the ischial tuberosities and inducing localized fatigue. Conversely, excessive height (H + 50 mm) compromises foot support, forcing sustained calf muscle contraction that increases metabolic load. Heights of H mm or H − 25 mm balance contact area and pressure dispersion, enabling even weight distribution through the hips and thighs while minimizing compression risks. A backrest inclination of 105° minimized pressure gradients and maximized overall comfort. This angle maintains the spine’s natural physiological curvature and provides balanced lumbar–thoracic support, aligning with ergonomic sitting posture standards. At 135° inclination, reduced foot–ground contact area increased slippage perception despite greater weight sharing by the backrest. While prior studies like Jiang et al. employed similar pressure distribution methodologies, this work advances the field by establishing standardized design parameters integrating seat height and inclination for independent elderly users [
24].
Our results also align with recent findings showing that seat inclination beyond 30° compromises spinal curvature and perceived comfort [
27]. By contrast, the present study identifies 105°—approximately equivalent to a mild recline between 10 and 15° from upright—as is optimal for elderly individuals. This convergence reinforces that excessive recline angles destabilize posture and heighten discomfort, while moderate inclinations support both spinal alignment and subjective comfort.
4.2. Theoretical Implications of Subjective–Objective Consistency
Significant positive correlations emerged between overall comfort and comfort in the foot, calf, coccyx, and anterior thigh, while slippage perception negatively impacted comfort. This validates the hypothesis that localized discomfort drives holistic comfort evaluation. Furthermore, the negative correlation between average pressure gradient and overall comfort confirms pressure distribution uniformity as a core comfort determinant. Beyond quantifying pressure metrics, this study proposes a design paradigm balancing physiological requirements with psychological perception. For instance, large inclination angles exacerbate slippage perception—directly impacting elderly users’ sense of security—and provide actionable engineering parameters. While Jiang et al. established objective–subjective correlations, they did not investigate psychological factors in depth [
24].
This perspective resonates with ergonomic design frameworks that consider multidimensional attributes—such as safety and usability—alongside physical comfort [
28]. In elderly populations, perceptions of stability and control become especially salient, suggesting that subjective feelings of safety should be treated as co-determinants of comfort, not merely secondary reflections of biomechanical load.
4.3. Comparison with Existing Studies and Innovativeness
This research corroborates the literature emphasizing uniform pressure distribution and localized comfort optimization but provides novel empirical evidence for age-specific seat design. Crucially, we identify 105° as optimal for elderly users, contrasting with studies recommending greater angles—likely due to reduced lumbar flexibility in older adults, where smaller angles mitigate kyphotic pressure. Additionally, defining ±25 mm from popliteal height as the optimal seat height interval represents a breakthrough, overcoming traditional single-benchmark limitations and enabling personalized adjustment.
The integration of body pressure distribution testing with multidimensional subjective assessment (7-point scale) addressed the limitations of single-metric approaches. For example, despite larger contact area at H + 25 mm, lower subjective ratings indicate that maximizing contact area alone may be counterproductive. This challenges “area-first” design philosophies and underscores the necessity of integrated subjective–objective evaluation.
Compared with models that derive chair dimensions from generalized adult anthropometry or height-based equations [
29], our study advances the field by tailoring parameters to an elderly cohort. Importantly, height-based predictive models often exclude seniors due to altered body proportions; our results suggest that integrating pressure distribution analysis with elderly-specific anthropometry can bridge this gap. Finally, our findings extend the work on sit-to-stand dynamics [
30], showing that excessively low seats not only hinder upward movement efficiency but also compromise static comfort through pressure concentration. This cross-linking of static and dynamic ergonomic evidence underscores the broader functional consequences of seat parameter misalignment in elderly populations.
4.4. Research Limitations and Directions for Improvement
This study has the following limitations: the sample was restricted to healthy adults aged 61–70, excluding both older individuals and those with mobility impairments, which necessitates cautious generalization of findings; the laboratory-based static sitting protocol ignored dynamic daily activities (e.g., rising, turning), warranting future incorporation of dynamic pressure monitoring during prolonged sitting sessions; the exclusive use of hard-seat controls omitted the investigation of practical materials like memory foam or mesh fabrics that demonstrably alter pressure distribution, indicating that subsequent research should integrate material mechanical properties into multi-parameter optimization models; and finally, the influence of assistive devices (e.g., handrails) on pressure distribution in assisted elderly populations remains unexplored and represents a key area for extension.
Another limitation lies in our reliance on pressure distribution as the primary biomechanical index. As prior work has demonstrated, low seat heights disproportionately impair older adults’ ability to perform sit-to-stand transitions [
30]. Incorporating such dynamic performance metrics could strengthen the applicability of seating design recommendations to real-world functional contexts. Moreover, although our focus was on elderly-specific optimization, future research should also consider how these parameters might be scaled for universal designs in shared or public environments, as suggested by height-based models of chair dimensioning [
29]. This balance between targeted ergonomics and inclusivity remains a crucial challenge for seating design.
5. Conclusions
This study establishes key ergonomic principles for age-appropriate seat design through an integrated analysis of pressure distribution, subjective evaluation, and design simulation. The results highlight several specific design intervals and mechanisms that are directly relevant for both research and industrial application.
First, optimal comfort and uniform pressure distribution were achieved when seat height was set at the user’s popliteal height (H mm) or 25 mm below, combined with a backrest inclination of approximately 105°. Within this configuration, localized comfort ratings for the foot, calf, coccyx, and anterior thigh exhibited strong positive correlations with overall comfort, while the average pressure gradient showed a significant negative correlation. These findings confirm the sensitivity of pressure gradients as a quantitative indicator of discomfort and provide a reliable metric for future ergonomic evaluation. Second, excessive backrest inclination, as represented by the inclination of 135°, increased perceptions of slippage and reduced postural security, underscoring the importance of limiting recline angles when designing for elderly populations. This emphasizes that stability, rather than extreme relaxation postures, is a priority for maintaining comfort and perceived safety. Third, the validation of pressure metrics such as contact area and pressure gradient as design indices suggests that comfort can be engineered proactively rather than assessed only after prototyping. Accordingly, the recommended baseline configuration of H/H − 25 mm seat height with a 105° backrest inclination should be considered a robust starting point for product development. Engineering implementations should further prioritize non-slip foot and calf support, while adopting pressure-gradient-driven dynamic equalization strategies such as zoned elasticity, variable-density cushioning, or adjustable mechanical systems to accommodate different body types and prolonged use.
Although this study was conducted with a relatively small sample, the convergence of objective and subjective measures provides strong evidence for the proposed design guidelines. For furniture manufacturers, these results translate into actionable recommendations that can directly enhance comfort, usability, and safety for elderly users. For researchers, the integration of quantitative pressure distribution metrics with subjective comfort assessment offers a methodological template for future ergonomic investigations.
In conclusion, the work advances the field of age-appropriate furniture design by providing empirically validated parameters and demonstrating how pressure-based indices can guide engineering decisions. Future research should extend the sample size, include diverse elderly populations with varying mobility levels, and explore additional variables such as cushioning materials, dynamic seating postures, and long-term use scenarios. Such efforts will help refine the ergonomic framework presented here and support the development of inclusive, evidence-based seating solutions that better meet the needs of an aging society.
Author Contributions
Conceptualization, J.L. and M.C.; methodology, J.L. and M.C.; writing—original draft preparation, S.C., S.X., Q.Z., D.C., Y.L. and H.W.; writing—review and editing, J.L. and M.C. All authors have read and agreed to the published version of the manuscript.
Funding
This research was supported by the Sichuan Science and Technology Program (grant no. 2023YFS0462), the Double Support Plan of Sichuan Agricultural University (grant no. 2022SYZD06), the Innovation and Entrepreneurship Training Program for College Students in Sichuan Province (grant no. S202510626108), the Undergraduate Student Research Interest Training Program (application no. 2025745X and 2025755X, i.e., grant no.594 and 595), and the Forestry Engineering Practice Education Center of Sichuan Agricultural University.
Institutional Review Board Statement
The study was conducted in accordance with the Declaration of Helsinki and approved by the Academic Ethics Committee of Sichuan Agricultural University (protocol code H20250043 and date of approval is 22 July 2025).
Informed Consent Statement
Informed consent was obtained from all subjects involved in the study.
Data Availability Statement
The original contributions presented in the study are included in the article; further inquiries can be directed to the corresponding author.
Conflicts of Interest
The authors declare no conflicts of interest.
References
- Maestas, N.; Mullen, K.J.; Powell, D. The effect of population aging on economic growth, the labor force, and productivity. Am. Econ. J. Macroecon. 2023, 15, 306–332. [Google Scholar] [CrossRef]
- Sun, J.-G.; Liu, M.; Feng, G.; Dong, X. Internet use among older adults: Determinants of usage and impacts on well-being. Comput. Hum. Behav. 2023, 139, 107538. [Google Scholar] [CrossRef]
- Payne, C.F.; Xu, K.Q. Life course socioeconomic status and healthy longevity in China. Demography 2022, 59, 629–652. [Google Scholar] [CrossRef]
- Kiyota, Y.; Malfroy, J. Housing design that improves independence and safety for older adults using walkers. Appl. Ergon. 2021, 97, 103539. [Google Scholar] [CrossRef]
- Bethell, B.; Fancott, S.; Boger, S. Older adults’ self-reported barriers to aging in place. J. Appl. Gerontol. 2021, 40, 1678–1686. [Google Scholar] [CrossRef]
- Klumpp, M.; Ruiner, C. Artificial intelligence, robotics, and logistics employment: The human factor in digital logistics. J. Bus. Logist. 2022, 43, 297–301. [Google Scholar] [CrossRef]
- Joksimović, M.; De Angeli, A.; Morrison, A.; Coventry, L. User requirements for inclusive technology for older adults. Int. J. Hum.-Comput. Interact. 2021, 37, 1947–1965. [Google Scholar] [CrossRef]
- Webb, R.B.; Lawson, B.; Ross, P.; Mallett, S.; Doessel, D. The reverse mortgage conundrum: Perspectives of older households in Australia. Habitat. Int. 2019, 94, 102073. [Google Scholar] [CrossRef]
- Shareef, M.A.; Kumar, V.; Dwivedi, Y.K.; Kumar, U.; Akram, M.S.; Raman, R. A new health care system enabled by machine intelligence: Elderly people’s trust or losing self-control. Technol. Forecast. Soc. Change 2021, 162, 120334. [Google Scholar] [CrossRef]
- Phelps, C.F.; Quarles, C.C.; Li, S.; Doshi, A.R.; Murtaugh, B.; Godwin, D.C. The forgotten middle: Many middle-income seniors will have insufficient resources for housing and health care. Health Aff. 2019, 38, 851–859. [Google Scholar] [CrossRef]
- Bauer, C.; Tilley, W.R.; Franz, M.; Vogl, R.; Greiner, T.; Wirth, P.-M.; Zimmermann, R. Low back pain and its relationship with sitting behavior among sedentary office workers. Appl. Ergon. 2019, 81, 102894. [Google Scholar] [CrossRef]
- Albanese, F.; Nair, A.; Papi, M.; Harris-Adamson, C. Postural strategies among office workers during a prolonged sitting bout. Appl. Ergon. 2022, 102, 103723. [Google Scholar] [CrossRef]
- De Carvalho, D.E.; Callaghan, J.P. Effect of office chair design features on lumbar spine posture, muscle activity, and perceived pain during prolonged sitting. Ergonomics 2022, 66, 1441–1452. [Google Scholar] [CrossRef]
- De Looze, M.P.; Kuijt-Evers, L.F.M.; Van Dieën, J. Sitting comfort and discomfort and the relationships with objective measures. Ergonomics 2003, 46, 985–997. [Google Scholar] [CrossRef]
- Fasulo, L.; Naddeo, A.; Cappetti, N. A study of classroom seat (dis)comfort: Relationships between body movements, center of pressure on the seat, and lower limbs’ sensations. Appl. Ergon. 2019, 74, 233–240. [Google Scholar] [CrossRef]
- Park, Y.; Gu, N.-H.; Seo, W.-K.; Kim, W. Heater-integrated flexible piezoresistive pressure sensor array for smart-car seats. IEEE Sens. J. 2024, 24, 1255–1263. [Google Scholar] [CrossRef]
- Kolich, M. Predicting automobile seat comfort using a neural network. Int. J. Ind. Ergon. 2004, 33, 285–293. [Google Scholar] [CrossRef]
- Schmidt, S.; Amereller, M.; Franz, M.; Kaiser, R.; Schwirtz, A. A literature review on optimum and preferred joint angles in automotive sitting posture. Appl. Ergon. 2014, 45, 247–260. [Google Scholar] [CrossRef] [PubMed]
- Habr, A.; Nagy, L.; Tunák, M.; Antoch, J. Testing the effect of textile materials on car seat comfort in real traffic. J. Ind. Text. 2021, 51, 740–767. [Google Scholar] [CrossRef]
- Wu, X.; Rakheja, S.; Boileau, P.-É. Distribution of human–seat interface pressure on a soft automotive seat under vertical vibration. Int. J. Ind. Ergon. 2019, 24, 545–557. [Google Scholar] [CrossRef]
- Sheng, J. Comfort Prediction of Human-Seat System Based on Body Pressure Distribution. Master’s Thesis, Chongqing University, Chongqing, China, 2017. (In Chinese). [Google Scholar]
- Li, J.Z. Research on Seat Static Comfort Based on Body Pressure Distribution. Master’s Thesis, Hunan University, Changsha, China, 2017. (In Chinese). [Google Scholar]
- Lyu, J.; Peng, Q.; Chen, M. Influence of body mass index on comfort and parametric optimization design of seat. Tehnički vjesnik 2022, 29, 1262–1269. [Google Scholar] [CrossRef]
- Jiang, Y.; Deng, J.; Deng, S.; Qi, Y.; Wang, P.; Wang, Z.; Zhang, T. Sitting posture recognition by body pressure distribution and airbag regulation strategy based on seat comfort evaluation. J. Eng. 2019, 23, 8910–8914. [Google Scholar] [CrossRef]
- Zainuddin, I.; Shanat, M. The Interaction of Ergonomic and Anthropometric Factors in Occasional Chair Design for Elderly Malaysians. Int. J. Glob. Optim. Its Appl. 2023, 2, 60–73. [Google Scholar] [CrossRef]
- Na, Y.; Chong, Y.; Hui, L.; Ming, L. Effects of Mattress Firmness on Infant Body Pressure Distribution. Int. J. Ind. Ergon. 2021, 83, 103101. [Google Scholar] [CrossRef]
- Siqueira Labrego, A.C.; Mendes Esperedião, A.C.; Gonçalves Oliveira, C.D.; de Melo do Espirito Santo, C.; Araujo, R.C. The effect of three different angles of the working seat on lumbar spine curvatures and comfort: An observational study. J. Bodyw. Mov. Ther. 2025, 42, 838–845. [Google Scholar] [CrossRef]
- Goonetilleke, R.S.; Feizhou, S. A Methodology to Determine the Optimum Seat Depth. Int. J. Ind. Ergon. 2001, 27, 207–217. [Google Scholar] [CrossRef]
- Sydor, M.; Hitka, M. Chair Size Design Based on User Height. Biomimetics 2023, 8, 57. [Google Scholar] [CrossRef]
- Honda, K.; Sekiguchi, Y.; Sasaki, A.; Shimazaki, S.; Suzuki, R.; Suzuki, T.; Kanetaka, H.; Izumi, S.I. Effects of seat height on whole-body movement and lower limb muscle power during sit-to-stand movements in young and older individuals. J. Biomech. 2021, 129, 110813. [Google Scholar] [CrossRef] [PubMed]
Figure 1.
Typical example of body pressure distribution map.
Figure 1.
Typical example of body pressure distribution map.
Figure 2.
The relationship between seat height and contact area.
Figure 2.
The relationship between seat height and contact area.
Figure 3.
The relationship between backrest inclination and contact area.
Figure 3.
The relationship between backrest inclination and contact area.
Figure 4.
The relationship between seat height and average pressure.
Figure 4.
The relationship between seat height and average pressure.
Figure 5.
The relationship between seat height and maximum pressure.
Figure 5.
The relationship between seat height and maximum pressure.
Figure 6.
Pressure distribution at different seat heights.
Figure 6.
Pressure distribution at different seat heights.
Figure 7.
The relationship between backrest inclination and average pressure.
Figure 7.
The relationship between backrest inclination and average pressure.
Figure 8.
The relationship between backrest inclination and maximum pressure.
Figure 8.
The relationship between backrest inclination and maximum pressure.
Figure 9.
The relationship between seat height and average pressure gradient.
Figure 9.
The relationship between seat height and average pressure gradient.
Figure 10.
The relationship between seat height and maximum pressure gradient.
Figure 10.
The relationship between seat height and maximum pressure gradient.
Figure 11.
The relationship between backrest inclination and average pressure gradient.
Figure 11.
The relationship between backrest inclination and average pressure gradient.
Figure 12.
The relationship between backrest inclination and maximum pressure gradient.
Figure 12.
The relationship between backrest inclination and maximum pressure gradient.
Figure 13.
Subjective comfort evaluation results at different seat heights.
Figure 13.
Subjective comfort evaluation results at different seat heights.
Figure 14.
Subjective comfort evaluation results under different backrest inclinations.
Figure 14.
Subjective comfort evaluation results under different backrest inclinations.
Figure 15.
Subjective correlation analysis at different seat heights.
Figure 15.
Subjective correlation analysis at different seat heights.
Figure 16.
Subjective correlation analysis at different backrest inclinations.
Figure 16.
Subjective correlation analysis at different backrest inclinations.
Figure 17.
Objective correlation analysis at different seat heights.
Figure 17.
Objective correlation analysis at different seat heights.
Figure 18.
Objective correlation analysis at different backrest inclinations.
Figure 18.
Objective correlation analysis at different backrest inclinations.
Figure 19.
Subjective and objective correlation analysis at different seat heights.
Figure 19.
Subjective and objective correlation analysis at different seat heights.
Figure 20.
Subjective and objective correlation analysis at different backrest inclinations.
Figure 20.
Subjective and objective correlation analysis at different backrest inclinations.
Table 1.
Basic information of the subject.
Table 1.
Basic information of the subject.
| Test Items | Age | Height/cm | Weight/kg | KPH/mm | Sitting Width/mm | Sitting Depth/mm |
|---|
| average value | 67.45 | 163 | 60.75 | 406.25 | 356.5 | 422.5 |
| maximum values | 76 | 175 | 83 | 440 | 391 | 464 |
| minimum value | 60 | 152 | 45 | 360 | 338 | 419 |
| Disclaimer/Publisher’s Note: The statements, opinions and data contained in all publications are solely those of the individual author(s) and contributor(s) and not of MDPI and/or the editor(s). MDPI and/or the editor(s) disclaim responsibility for any injury to people or property resulting from any ideas, methods, instructions or products referred to in the content. |
© 2025 by the authors. Licensee MDPI, Basel, Switzerland. This article is an open access article distributed under the terms and conditions of the Creative Commons Attribution (CC BY) license (https://creativecommons.org/licenses/by/4.0/).
