Abstract
The high salt content, low permeability, and fragile structure of saline–alkali land severely constrain the construction and development of irrigation channels. Compaction is an effective means of improving the soil’s engineering performance. Previous studies in this field have mostly been limited to two-dimensional numerical simulations and generally lack systematic physical experiments to support their findings, resulting in an insufficient understanding of the three-dimensional deformation mechanism and macroscopic mechanical response of soil during compaction. In view of the above limitations, this study adopts a comprehensive research framework of “physical experiment–numerical simulation”. Conducting indoor rolling model tests of control variables and simultaneously constructing the corresponding 2D and 3D discrete element models based on the MatDEM platform revealed the influence of curing agent dosage (10% and 25%), loosely laid sample thickness (10 cm and 30 cm), and number of rolling passes on the compaction effect. The test results show that the degree of compaction increases in a typical three-stage pattern of “rapid rise–slow growth–gradual stabilization” with the number of rolling passes, and the number of economic rolling passes is from 4 to 6. Increasing the dosage of the curing agent and reducing the thickness of application both significantly improve the uniformity of compaction and the final density. Numerical simulation further reveals that the 3D model can more accurately reflect the three-dimensional stress state of the soil and the spatial movement of particles, and that the simulation results are in higher agreement with the experimental data. The 2D model has greater computational efficiency and can capture the main compaction trends under specific simplified conditions, but it has deficiencies in quantitative accuracy. This study verified the effectiveness and advantages of MatDEM in simulating complex geotechnical compaction processes, providing theoretical support for an in-depth understanding of compaction mechanisms and the optimization of construction parameters using discrete element methods.
1. Introduction
Saline–alkali soil refers to soil containing soluble salts at concentrations greater than or equal to 0.3% but less than 20%, exhibiting engineering characteristics such as subsidence or salt heaving. Due to the high concentration of soluble salts in saline–alkali soil, channels constructed in saline–alkali areas are highly susceptible to problems like soil erosion, soil disintegration, and expansion erosion [1,2,3,4]. The use of technology that improves solidification has become a key strategy in saline–alkali soil remediation because of its high efficiency and cost-effectiveness. To address the aforementioned situation, this paper employs a novel salt-affected soil stabilizer. After adding the stabilizer and compacting the soil through rolling, the treated soil achieves the strength performance requirements for channel construction. Among the most common on-site construction techniques, compaction governs the long-term stability and engineering performance of solidified soil bodies. Although existing research has explored the consolidation mix design and macromechanical properties of saline–alkali soils in depth, the macro-micro response mechanisms of consolidated saline–alkali soils under compaction loads remain unclear. Traditional laboratory tests can yield macroscopic compaction indices but struggle to capture the dynamic evolution of internal soil structures in real time. Conventional continuum numerical models also exhibit significant limitations when simulating particle fragmentation and large deformation phenomena.
The Discrete Element Method (DEM) is increasingly applied in geotechnical engineering, demonstrating unique advantages in simulating soil–machine interactions, vibratory compaction, and dynamic compaction processes. Three studies showcase DEM’s modeling capabilities and ability to reveal micro-mechanisms across diverse scenarios: agricultural tire compaction, the vibratory compaction of rubber–sand mixtures, and the dynamic compaction of gravelly soils. Acquah [5] developed a soil–tire interaction model using DEM to simulate changes in soil pressure under varying compaction cycles, validating the model’s accuracy with experimental field data. The results indicated that the maximum soil pressure increases with rolling passes, though the model accurately predicts the first two passes while exhibiting significant errors thereafter—likely due to its omission of hard layers and density stratification. Sun [6] employed a two-dimensional DEM to simulate the compaction of rubber–sand mixtures by vibratory rollers, revealing the substantial effects of rubber content and compaction parameters (frequency, speed, mass) on compaction outcomes. The optimal vibration frequency increased as the rubber content increases (from 30 Hz to 35 Hz), with a 20% rubber content at 35 Hz yielding the best compaction results and lowest energy consumption. The study also revealed micro-mechanisms through force chains, displacement fields, and velocity fields. Ma [7] focused on the dynamic compaction of gravelly soils using the dynamic compaction method, employing PFC2D/PFC3D to analyze changes in porosity and the effectiveness of compaction. The results indicated that a reduction in porosity positively correlated with the contact stiffness and hammer weight, while negatively correlating with the dynamic hysteresis parameters. The maximum influence depth in three-dimensional simulations was lower than in two-dimensional simulations, demonstrating the significant impact of geometric dimensions on simulation outcomes. Jing et al. [8] conducted discrete element simulations using MATDEM software on semi-rigid subgrades, crushed stone subgrades, and geogrid-reinforced crushed stone subgrades. They systematically analyzed the strain, displacement distribution, and failure patterns of the three structures under bending loads, revealing the positive effect of geogrid reinforcement in enhancing subgrade bending resistance and extending service life. However, existing research has primarily focused on single material layers or simplified models, with insufficient investigation into the synergistic working mechanism between the reinforced structure and the base course.
In landslide disaster research, rock landslides in reservoir areas exhibit more complex deformation mechanisms and failure processes due to the influence of reservoir water level fluctuations. Chen et al. [9], using the Tanjiahe landslide in the Three Gorges reservoir area as a case study, combined field monitoring with MatDEM numerical simulations. They revealed that high reservoir water levels and sudden drops are the primary external factors inducing landslide deformation, while internal permeability variations control the deformation response characteristics. This study further simulated the push-type failure process and surge wave hazards of landslides, providing a theoretical basis for predicting reservoir landslide disasters. Regarding rockfall hazards, columnar rock masses garner significant attention due to their high aspect ratios, frequent instability, and potent destructive force. Jin et al. [10] established a two-dimensional discrete element model on the MatDEM platform using the Zengziyan columnar rockfall in Chongqing as a case study, investigating the dynamic fragmentation behavior of falling rocks during their motion. Through fragment identification and grain size distribution analysis, they found significant fragmentation during initial failure and collisions, resulting in fractal characteristics of the debris size distribution. Fragmentation severity was positively correlated with travel distance. This study reveals the influence of fragmentation on rockfall motion at the granular scale, addressing previous research gaps in simulating dynamic fragmentation processes in real-world cases.
In recent years, the Discrete Element Method (DEM) has been widely employed in geotechnical engineering due to its unique ability to describe the micromechanical behavior of granular materials. MatDEM, as a domestically developed high-performance DEM software leveraging GPU parallel computing capabilities, can efficiently simulate the complex contact behavior of millions of particles. It is particularly suitable for the mechanical analysis of discontinuous media such as soil–rock mixtures and cemented soils [11,12,13,14,15,16]. However, current DEM research on the compaction process of solidified saline–alkali soils still exhibits significant limitations: First, existing simulations are predominantly confined to two-dimensional (2D) models, making it challenging to accurately reflect lateral extrusion effects and spatial stress distributions under three-dimensional soil–compactor interactions. Second, the lack of systematic validation through coordinated laboratory testing raises questions regarding the calibration of micromechanical parameters and the overall reliability of the models.
Based on this, this study proposes a dual-track research framework combining experiments and simulations:
(1) Conduct controlled variable indoor compaction model tests, precisely documenting the evolution of soil settlement, dry density, and compaction degree under varying numbers of compaction passes to establish a macro-response database;
(2) Utilize the MatDEM platform to concurrently develop 2D and 3D discrete element models aligned with experimental data, systematically evaluating the capability, accuracy, and limitations of both models in reproducing the macroscopic mechanical behavior of compacted soil.
For the first time, this study applies the domestically developed MatDEM software to the full-dimensional simulation (2D/3D) of the compaction process for solidified saline–alkali soil. Through rigorous experiment–simulation cross-verification, it demonstrates the non-negligible nature of three-dimensional effects in compaction simulation. The findings provide theoretical support for enhancing our understanding of compaction mechanisms and optimizing the design of construction parameters, while advancing the practical application of high-performance discrete element technology in engineering.
2. Materials and Methods
2.1. Indoor Crushing Test
2.1.1. Compaction Test Materials
- Saline–Alkali Soil
The saline–alkali soil sample used for testing was collected near Erlongshan on Provincial Highway 211 in Zhenlai County, Baicheng City, Jilin Province.
- Cement
Portland cement with specification P.O42.5 was used for the test.
- Sodium Silicate
The sodium silicate used in this test is a fast-dissolving powdered sodium silicate with a modulus of 2.0.
- Fibers
The fibers used in this test are basalt chopped fibers. When used, they should be mixed with a small amount of sand and formed into balls.
- Curing Agent
The curing agent used in this test is an inorganic curing agent independently developed by our research team, primarily composed of the aforementioned cement (accounting for 76–88% of the total curing agent mass), silicate, and basalt fiber.
2.1.2. Test Soil Samples
- Physical and Chemical Properties of Saline–Alkali Soil
In accordance with the requirements of the Standard for Geotechnical Test Methods (GB/T 50123-2019) [17], the physical properties of the test soil samples were determined. First, the liquid and plastic limits of the soil samples were determined using a combined liquid-plastic limit tester, and the plasticity index was calculated based on these values. Subsequently, the optimal moisture content and maximum dry density of the soil samples were obtained through compaction tests. Details of the test results are presented in Table 1.

Table 1.
Physical properties of saline–alkali soil.
The chemical properties of the test soil samples primarily include their pH, total soluble salts, and concentrations of eight major ions. Each test corresponds to the procedures specified in the Standard Test Methods for Soil. To determine the pH of the test soil sample, the soil sample leachate must be prepared by filtration. The probe of an electronic pH meter is then immersed in the leachate. The measured pH of the soil sample was 9.3. To determine the total content of soluble salts, the leachate from the soil sample is used and measured via the evaporation method. The determination of soluble salt ion concentrations strictly follows the standard specifications. The total content of soluble salts in the soil sample was found to be 0.816%. The results for the individual ion concentrations are shown in Table 2.

Table 2.
Chemical properties of saline–alkali soil.
- Compaction Test for Stabilized Soil
As this study primarily serves channel construction in saline–alkali soil regions, according to Technical code of practice for solidification treatment of saline–alkali soil on river and channel slope (DB22/T 3506-2023) [18], the recommended curing agent dosage for channel subbases is 8–12%, while that for protective layers is 20–30%. Therefore, this study employs stabilized soil with curing agent dosages of 10% and 25%.
In accordance with the requirements of the Standard for Geotechnical Test Methods, compaction tests were conducted on stabilized soil samples with stabilizer contents of 10% and 25%. The mass of stabilizer added was calculated using Formula (1).
where m is the mass of added curing agent (g); k is the curing agent dosage (%); and M is the mass of saline–alkali soil (g).
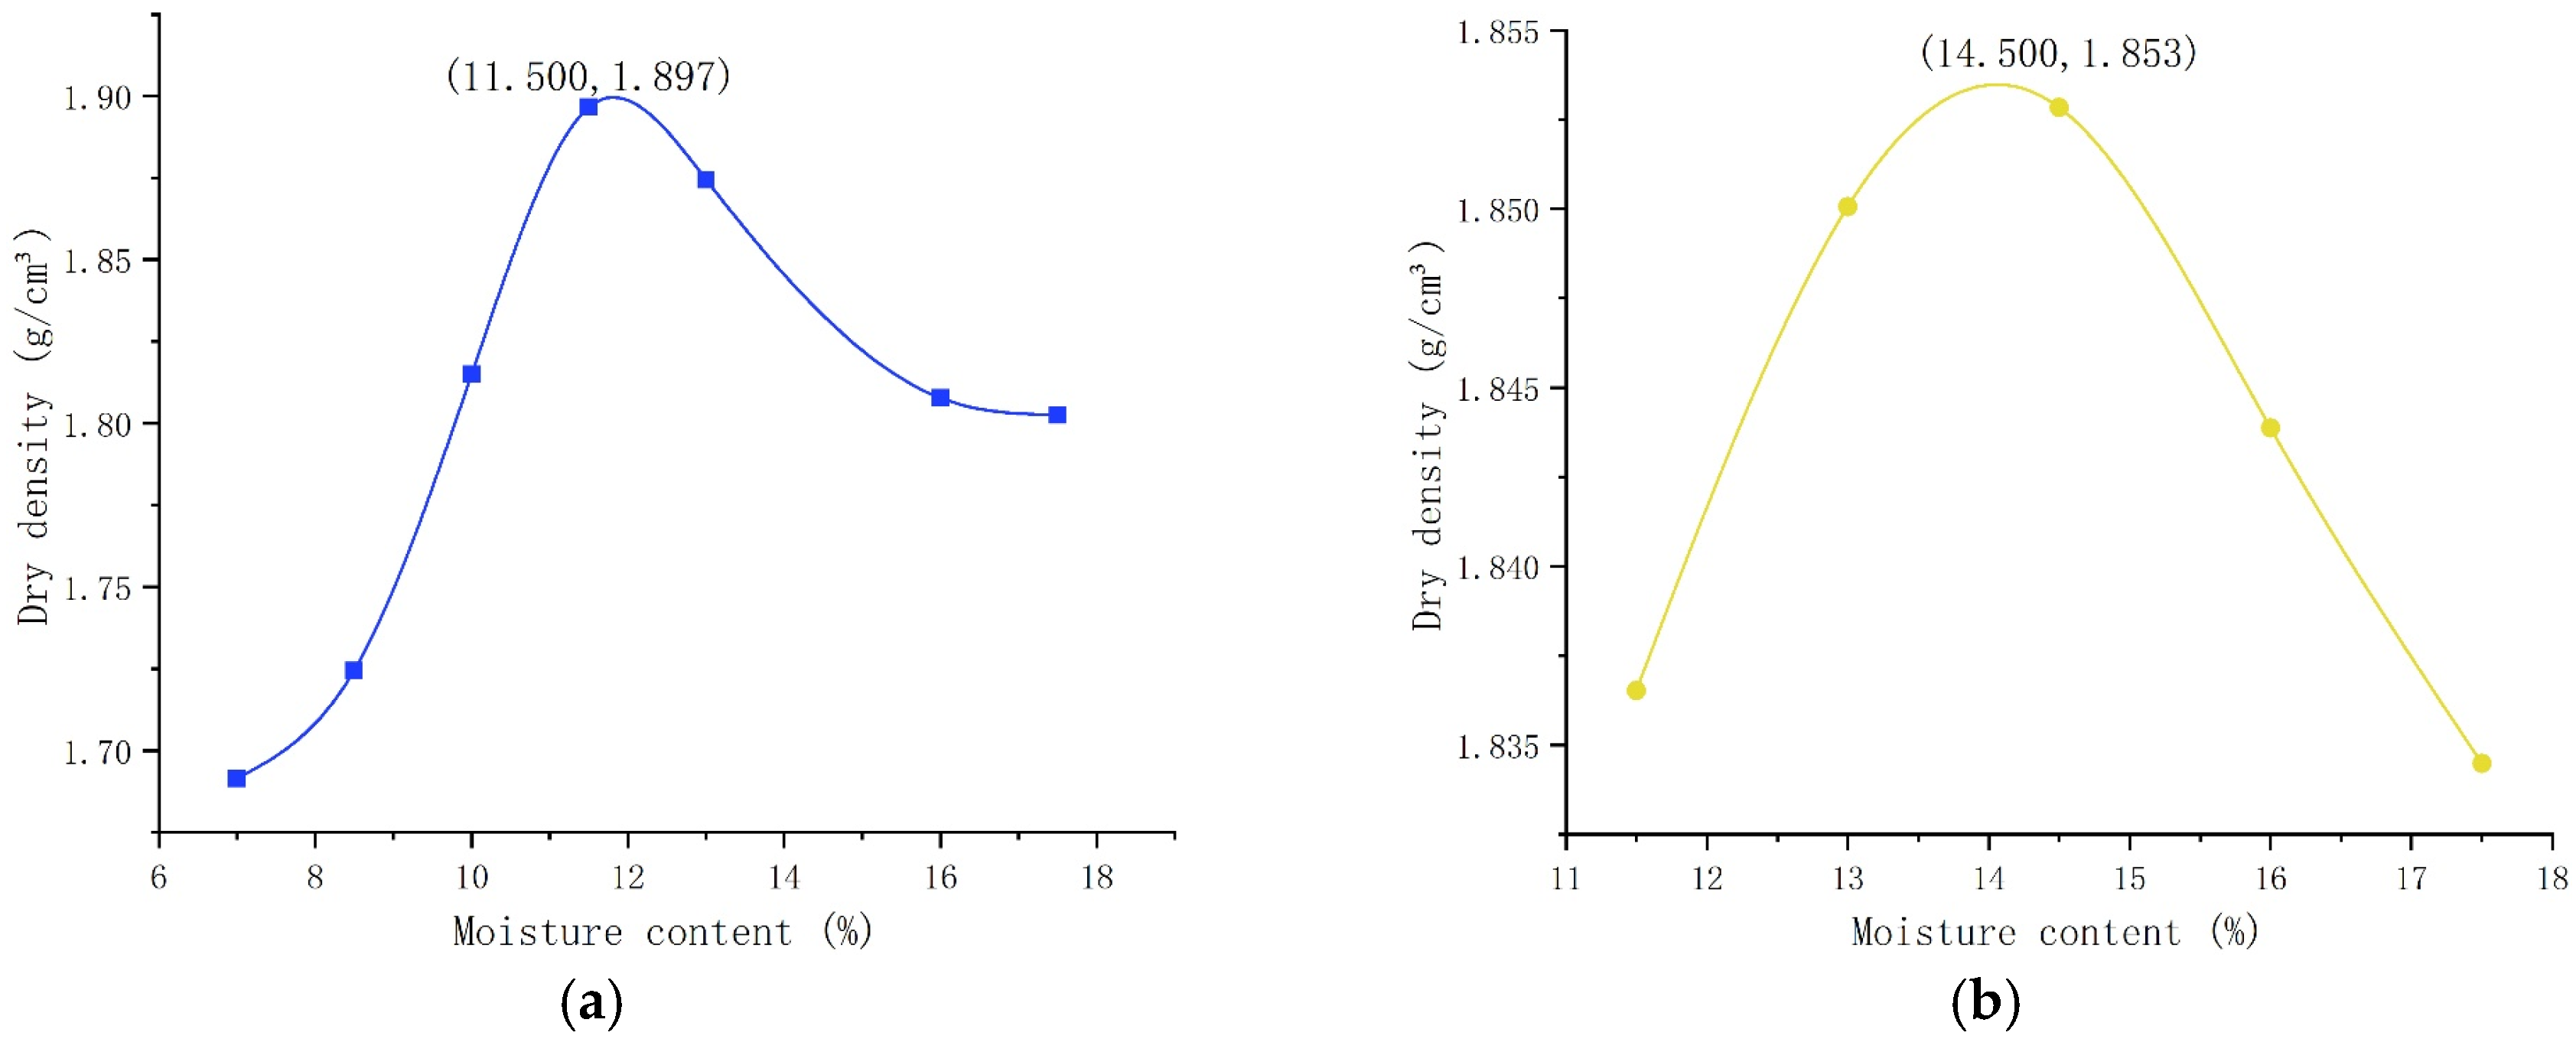
The compaction test results are shown in Figure 1:
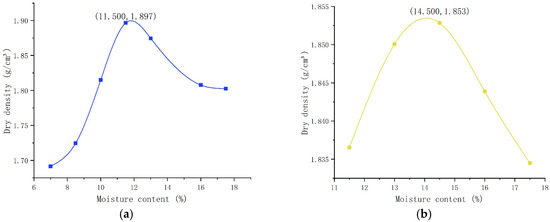
Figure 1.
Compaction curve of soil sample: (a) 10% curing agent dosage; (b) 25% curing agent content.
The compaction patterns indicate that as the curing agent content increases from 10% to 25%, the maximum dry density of the soil decreases (from 1.897 g/cm3 to 1.853 g/cm3). This is primarily because the density of the curing agent particles themselves may be lower than that of soil particles. Their incorporation replaces part of the soil and occupies space between soil particles, resulting in a slight decrease in the total mass of solid particles per unit volume (i.e., dry density). Simultaneously, the reaction between the curing agent and soil particles may alter the arrangement and flocculation state of the particles, thereby affecting the degree of compactability. Conversely, increasing the solidifier dosage raises the optimum moisture content (from 11.5% to 13.0%). This occurs because the solidifier’s hydration reaction consumes additional water. Higher dosages demand more water for hydration. Consequently, more water is required to lubricate soil particles and supply reaction water, thereby achieving optimal compaction results.
2.1.3. Compaction Test Plan
- Test Site
The test site consists of a rectangular flat area measuring 3 m in length and 1.4 m in width. Prior to testing, the foundation was cleared and leveled according to the design drawings. All debris and waste materials were completely removed. After foundation clearance, any low-lying areas were compacted and filled.
- Test Equipment
(1) Considering the scale of indoor testing, the compaction equipment selected for this test is the GTYLJ-2.5T double-drum vibratory roller.
(2) HDJ-B geotechnical electric compaction tester, ring knife (volume 100 cm3), soil cutting knife, electronic scale, aluminum box, oven, etc.
- Test Method:
First, sufficient quantities of stabilized soil specimens with curing agent contents of 10% and 25% were prepared according to the established mix design. The moisture content of the test soil was strictly controlled within ±2% of the optimum moisture content. For each curing agent content, compaction tests were conducted with loose layers of 10 cm and 30 cm thickness.
Following mixing and leveling, uniform static compaction was performed within 30 min using a roller at a constant speed of 0.3 m/s. After each compaction pass, soil compaction was measured three times at equidistant positions using the ring knife method, with the average value recorded. The surface elevation of the cured soil layer was also documented to calculate compressive deformation. The compaction degree of rolled and cured soil is calculated according to Formulas (2) and (3).
In the formula, ρ represents the wet density of the soil sample, w represents the moisture content of the soil sample, ρd represents the dry density of the soil sample, ρd_max represents the maximum dry density of the soil sample, Dc represents the compaction degree of the soil sample.
2.2. MatDEM Numerical Simulation
2.2.1. Introduction to the Discrete Element Method (MatDEM)
MatDEM is based on the fundamental principles of the discrete element method. By simulating interactions among numerous particle elements, it reproduces the mechanical behavior of granular materials such as rock and soil under external loads. Its core innovation lies in employing a matrix computation approach, thus transforming traditional particle-by-particle calculations into efficient matrix operations. This fully leverages the parallel computing capabilities of GPUs, enabling large-scale, high-efficiency numerical simulations [19,20,21,22,23,24,25].
When simulating compaction tests, MatDEM demonstrates reliable numerical implementation and robust validation foundations. Its linear elastic contact model and cohesion-sliding mechanism accurately characterize the force transmission, compression, and shear processes between particles. Successfully applied to various geotechnical mechanical behavior simulations, it ensures the validity and credibility of modeling large-deformation, multi-contact problems such as compaction.
The discrete element method constructs geotechnical models by assembling and bonding a series of particles with specific mechanical properties. Based on this framework, numerical simulations are performed using time-step iterative algorithms. In the most fundamental linear elastic model, particles are assumed to interact through springs that generate forces. Normal forces and normal deformations between particles can be simulated using normal springs between them. Initially, particles are interconnected with adjacent particles, acting as springs under both tensile and compressive forces. When the normal relative displacement between two particles exceeds the fracture displacement, the spring breaks. The tensile force between particles disappears, leaving only compressive forces to act. The normal force (Fn) between particles can be expressed by Formula (4).
In the formula, Kn is the normal stiffness; Xn is the normal relative displacement; Xb is the fracture displacement.
The shear force (Fs) and shear deformation between particles are simulated using a tangential spring, as described by the principle in Formula (5).
In the formula, Ks represents the tangential stiffness; Xs represents the tangential displacement.
Similarly, springs also exhibit failure criteria in the tangential direction, based on the Mohr-Coulomb criterion. Specifically, as shown in Formula (6).
In the formula, Fsmax represents the maximum shear force; Fs0 denotes the shear resistance between particles; and μp is the friction coefficient between particles. In the Mohr-Coulomb criterion, the maximum shear strength between units correlates with the initial shear strength. Fs0 represents the maximum shear force units can withstand without applied normal pressure, analogous to cohesion in geomaterials. Greater normal pressure yields higher shear strength. When the tangential force exceeds the maximum shear strength, the tangential bond fails, leaving only sliding friction between particles −μpFn.
MatDEM software employs a linear elastic contact model by default and utilizes global damping to dissipate energy. From a fundamental perspective, the deformation of discrete element piles under loading in MatDEM can be modeled as damped harmonic oscillation of a spring-mass system, governed by the Formula (7).
In the formula, m represents the unit mass; x’’ denotes the unit acceleration; x’ signifies the unit velocity; and k is the spring stiffness coefficient. That is, the product of the unit mass and acceleration, plus the damping force and spring force, equals zero. This constitutes the equilibrium equation for damped harmonic oscillation.
Currently, the Discrete Element Method (DEM) is primarily used in academic research, with relatively limited practical applications in geotechnical engineering. To apply it to real-world projects, three major challenges must first be addressed: ① Massive computational demands restrict modeling scale and scope. DEM spatially decomposes soil and rock into discrete particles and performs iterative time-step calculations, resulting in enormous computational requirements. The number of computational cells in three-dimensional numerical simulations is typically limited to tens of thousands, resulting in excessively small sample scales that fail to meet practical engineering requirements. ② Unclear macro–micro mechanical properties complicate modeling. In the DME, geological models are constructed from aggregates of numerous discrete particles. Traditional modeling requires iterative adjustments and testing to determine appropriate inter-particle micro-mechanical parameters, thereby achieving numerical models with specific mechanical properties. The complexity of quantitative modeling significantly hinders practical application. ③ Incomplete multi-physics and fluid–solid coupling theories, coupled with a lack of simulation software. Modern large-scale engineering projects frequently involve complex multi-physics coupling (hydrothermal) and fluid-solid coupling (solid–liquid–gas), such as hydraulic fracturing and tunnel excavation. The Discrete Element Method remains less mature than methods like the Finite Element Method for addressing these issues and lacks relevant numerical software.
2.2.2. Simulation Test Plan
- Material Training
MatDEM discrete elements can calculate five inter-particle mechanical parameters—normal stiffness (Kn), tangential stiffness (Ks), fracture displacement (Xb), initial shear force (Fs0), and friction coefficient (μp)—through conversion formulas based on five macroscopic mechanical properties of the material: Young’s modulus (E), Poisson’s ratio (ν), compressive strength (Cu), tensile strength (Tu), and internal friction angle (μi). MatDEM trains the discrete element model using Formula (8) through (12).
Macroscopic physical and mechanical properties of loose soil mixed with curing agents were successfully determined through triaxial compression tests conducted on nine specimens each for two curing agent dosages (10% and 25%), with each specimen tested under different confining pressure conditions. Detailed results are presented in Table 3.

Table 3.
Macro-physical and mechanical properties of loose soil with the addition of the curing agent.
- Boundary Conditions and Load Application
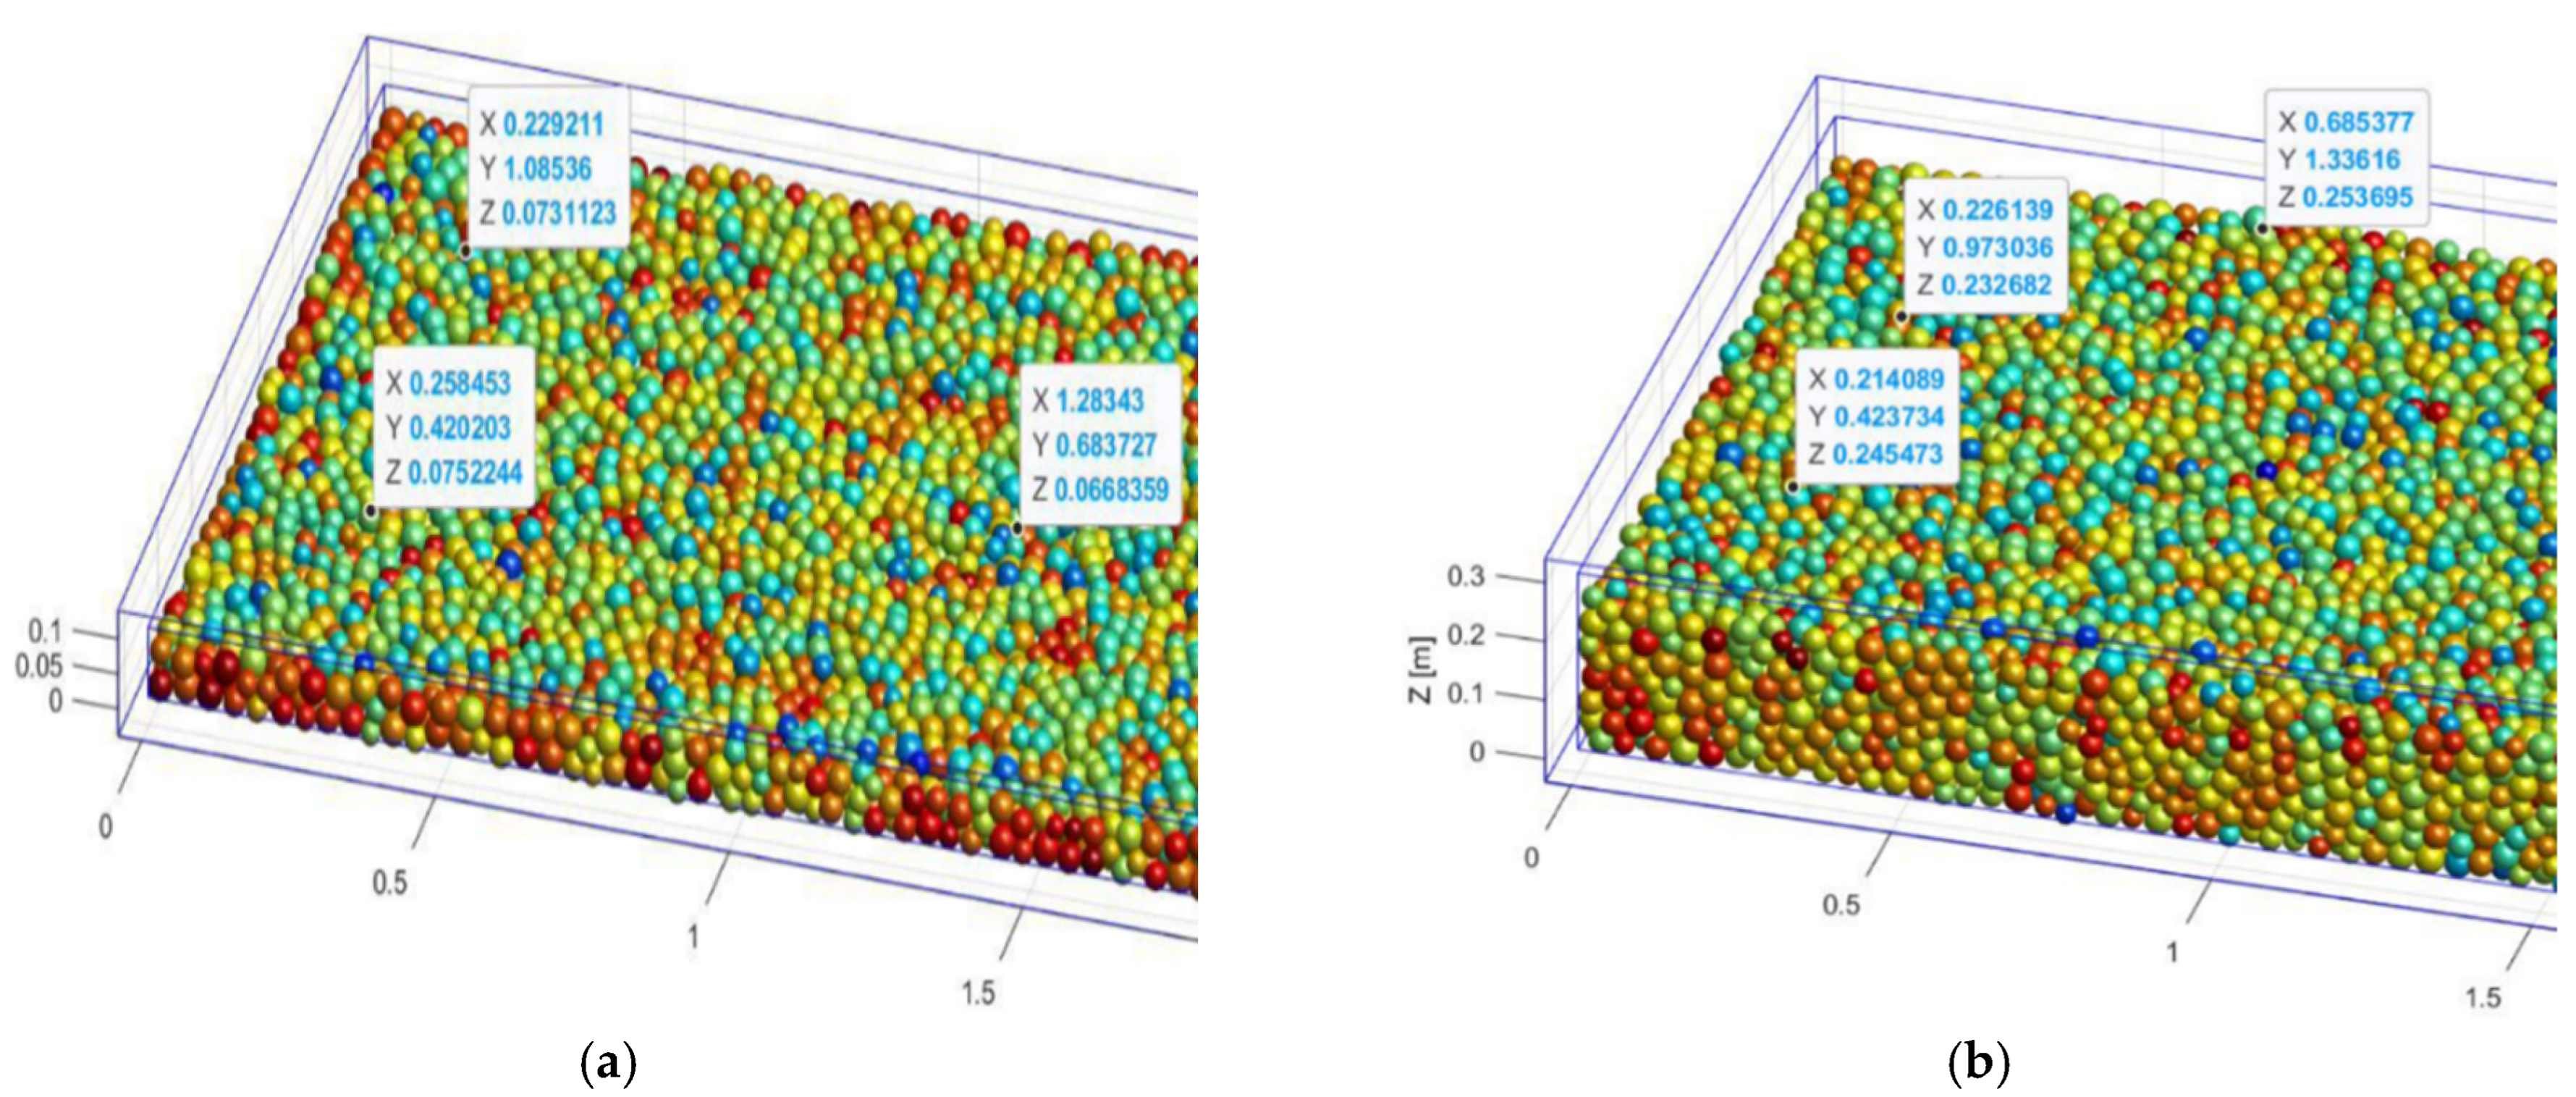
(1) 3D Simulation: Since the mass of the roller is primarily concentrated at the compaction steel wheel, this paper simplifies the roller to a steel wheel with the same mass as a 2.5-ton roller. The soil specimen dimensions correspond to those used in indoor compaction tests: 3 m in length, 1.4 m in width, with soil particle radii of 0.02 m. Simulated experiments were conducted at heights of 0.1 m and 0.3 m. During simulation, after assigning material properties to the soil and applying gravitational deposition, the steel wheel uniformly compacts the soil at a speed of 0.3 m/s in a back-and-forth motion. After each simulated pass, the Z-coordinate of the center point for the surface particle cells is extracted using MatDEM’s built-in commands, and its average value is calculated. This average value, plus the particle cell radius, represents the post-compaction surface elevation of the soil. Since the overall rolling test duration is controlled within 30 min, changes in soil moisture content are disregarded in the simulation. Consequently, the post-rolling compaction degree can be derived using Formula (13).
In the formula, Dc0 represents the compaction degree of the soil after compaction, m represents the mass of the soil body, S represents the base area of the soil model, w represents the moisture content of the soil body, and h represents the height of the soil body after compaction.
The specific model is illustrated in Figure 2.

Figure 2.
Three-dimensional model: (a) 30 cm soil sample loosely laid; (b) 10 cm soil sample loosely laid.
(2) 2D Simulation: The material properties in the 2D simulation are identical to those in the 3D simulation, with only the widths of the soil body and steel wheel reduced. It is important to note that if the soil body is fully defined as a 2D plane, the simulated soil particles will be difficult to compact due to restricted degrees of freedom, failing to reflect the patterns observed in rolling tests. Therefore, in this 2D simulation, the soil body width is set to 0.2 m to approximate a 2D state. All other test conditions remain consistent with the 3D simulation. Specific models are illustrated in Figure 3.

Figure 3.
Two-dimensional model: (a) 30 cm soil sample loosely laid; (b) 10 cm soil sample loosely laid.
3. Results
3.1. Indoor Crushing Test Compaction Results
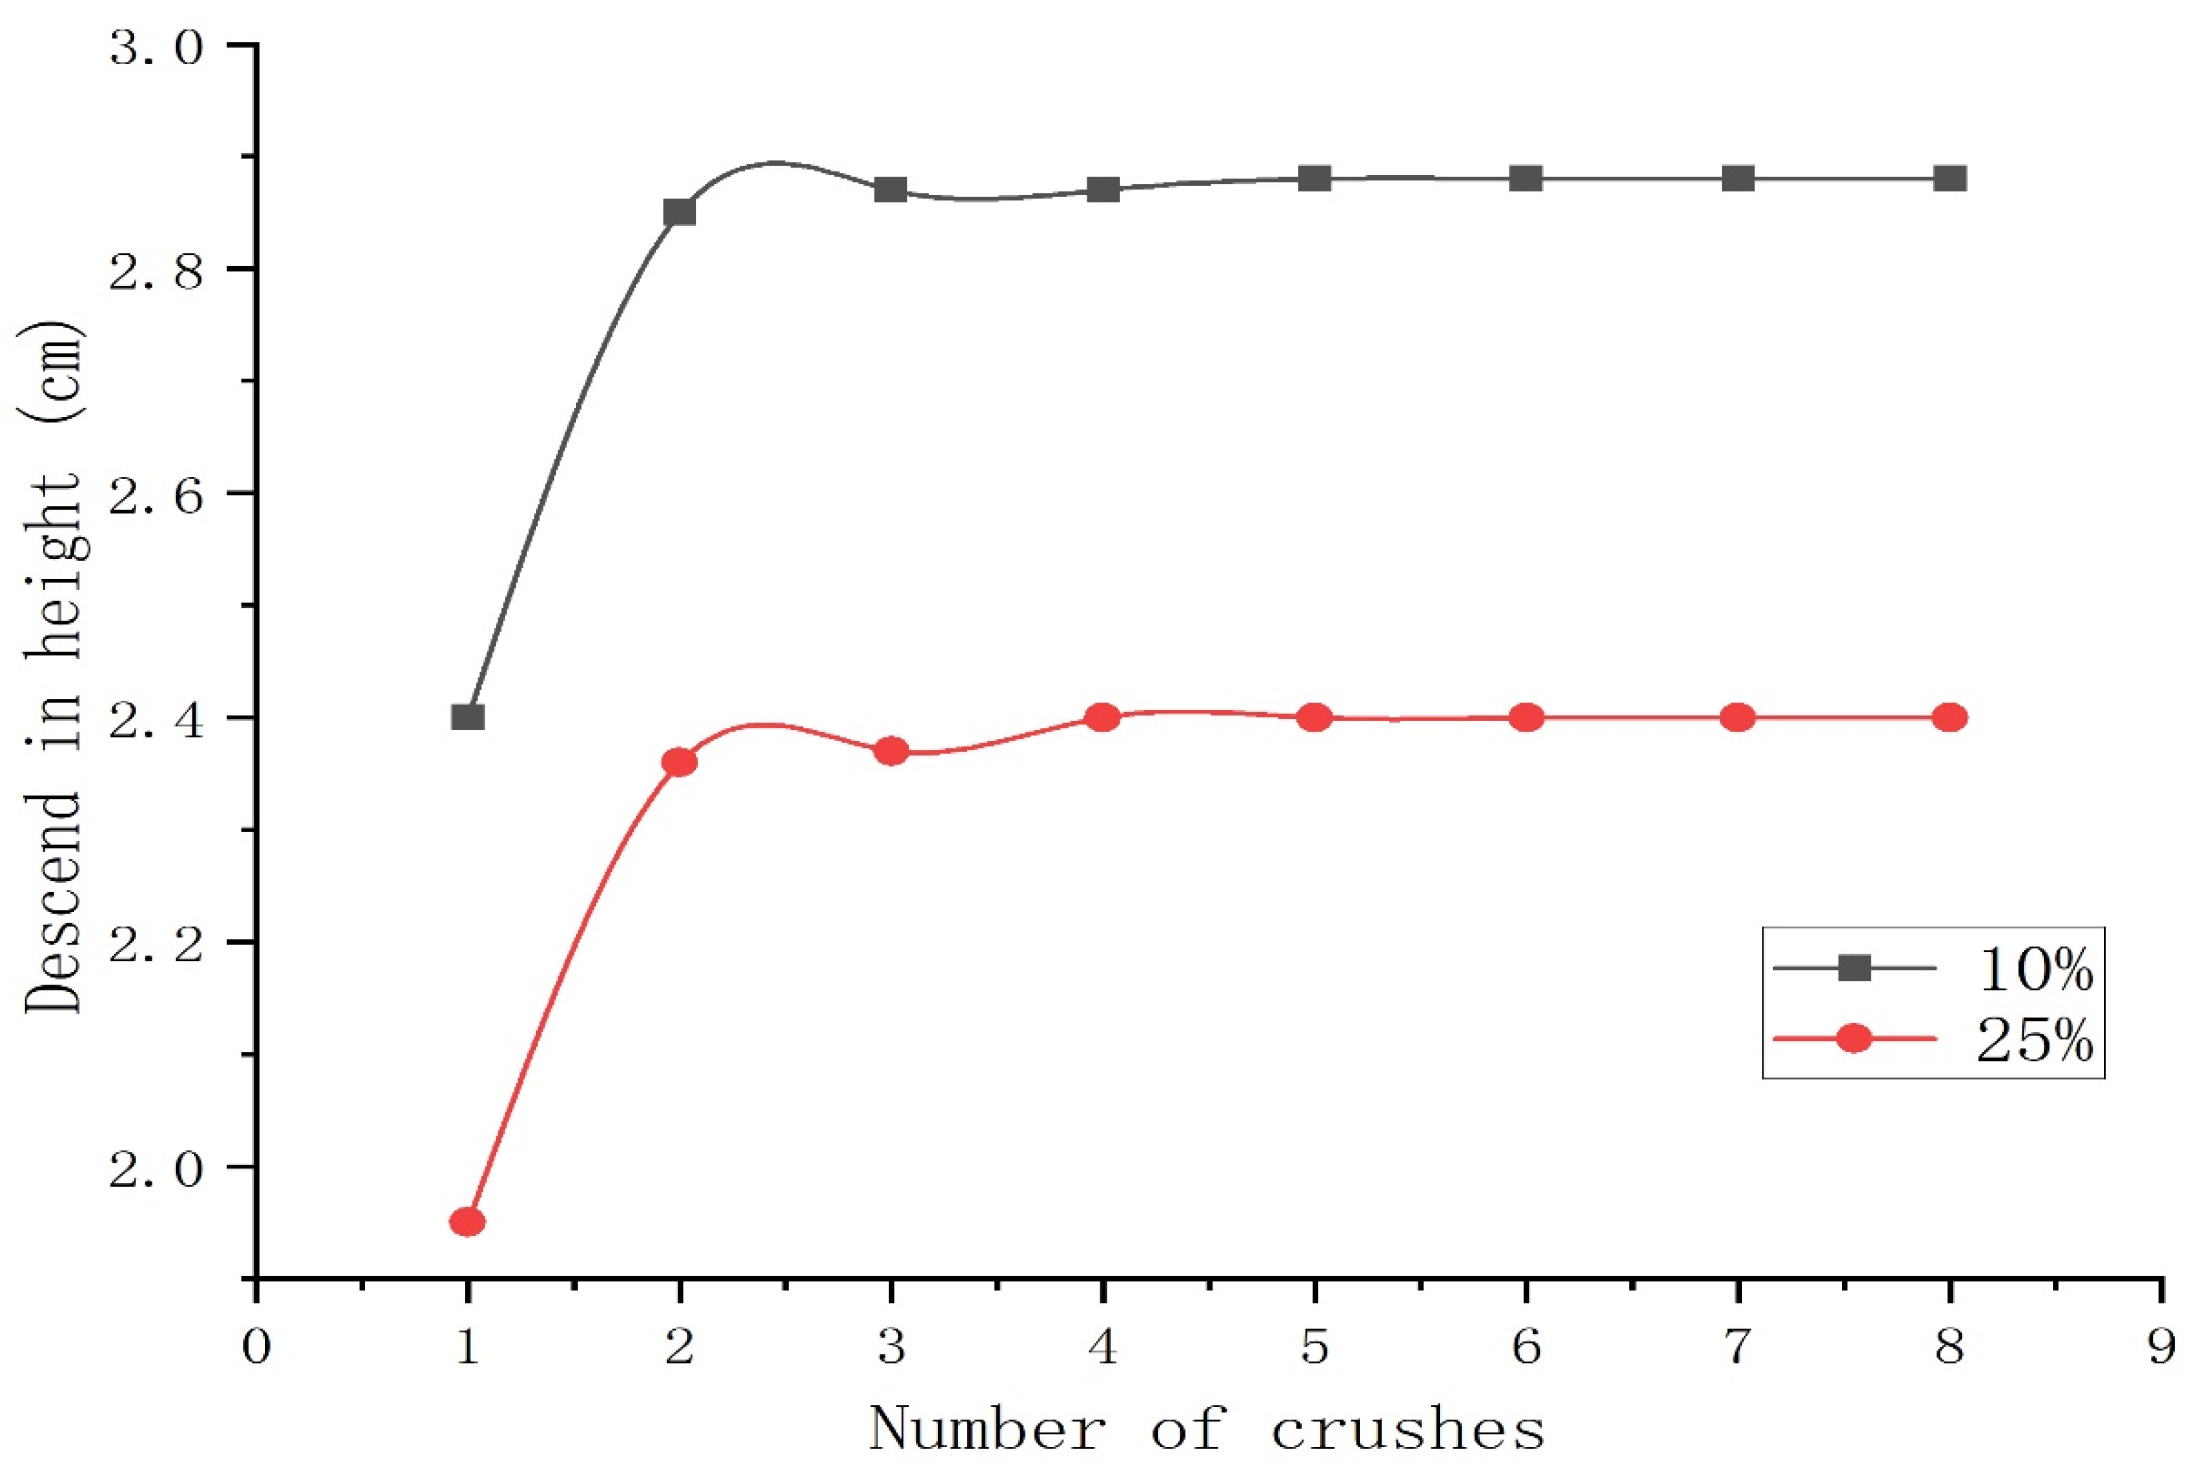
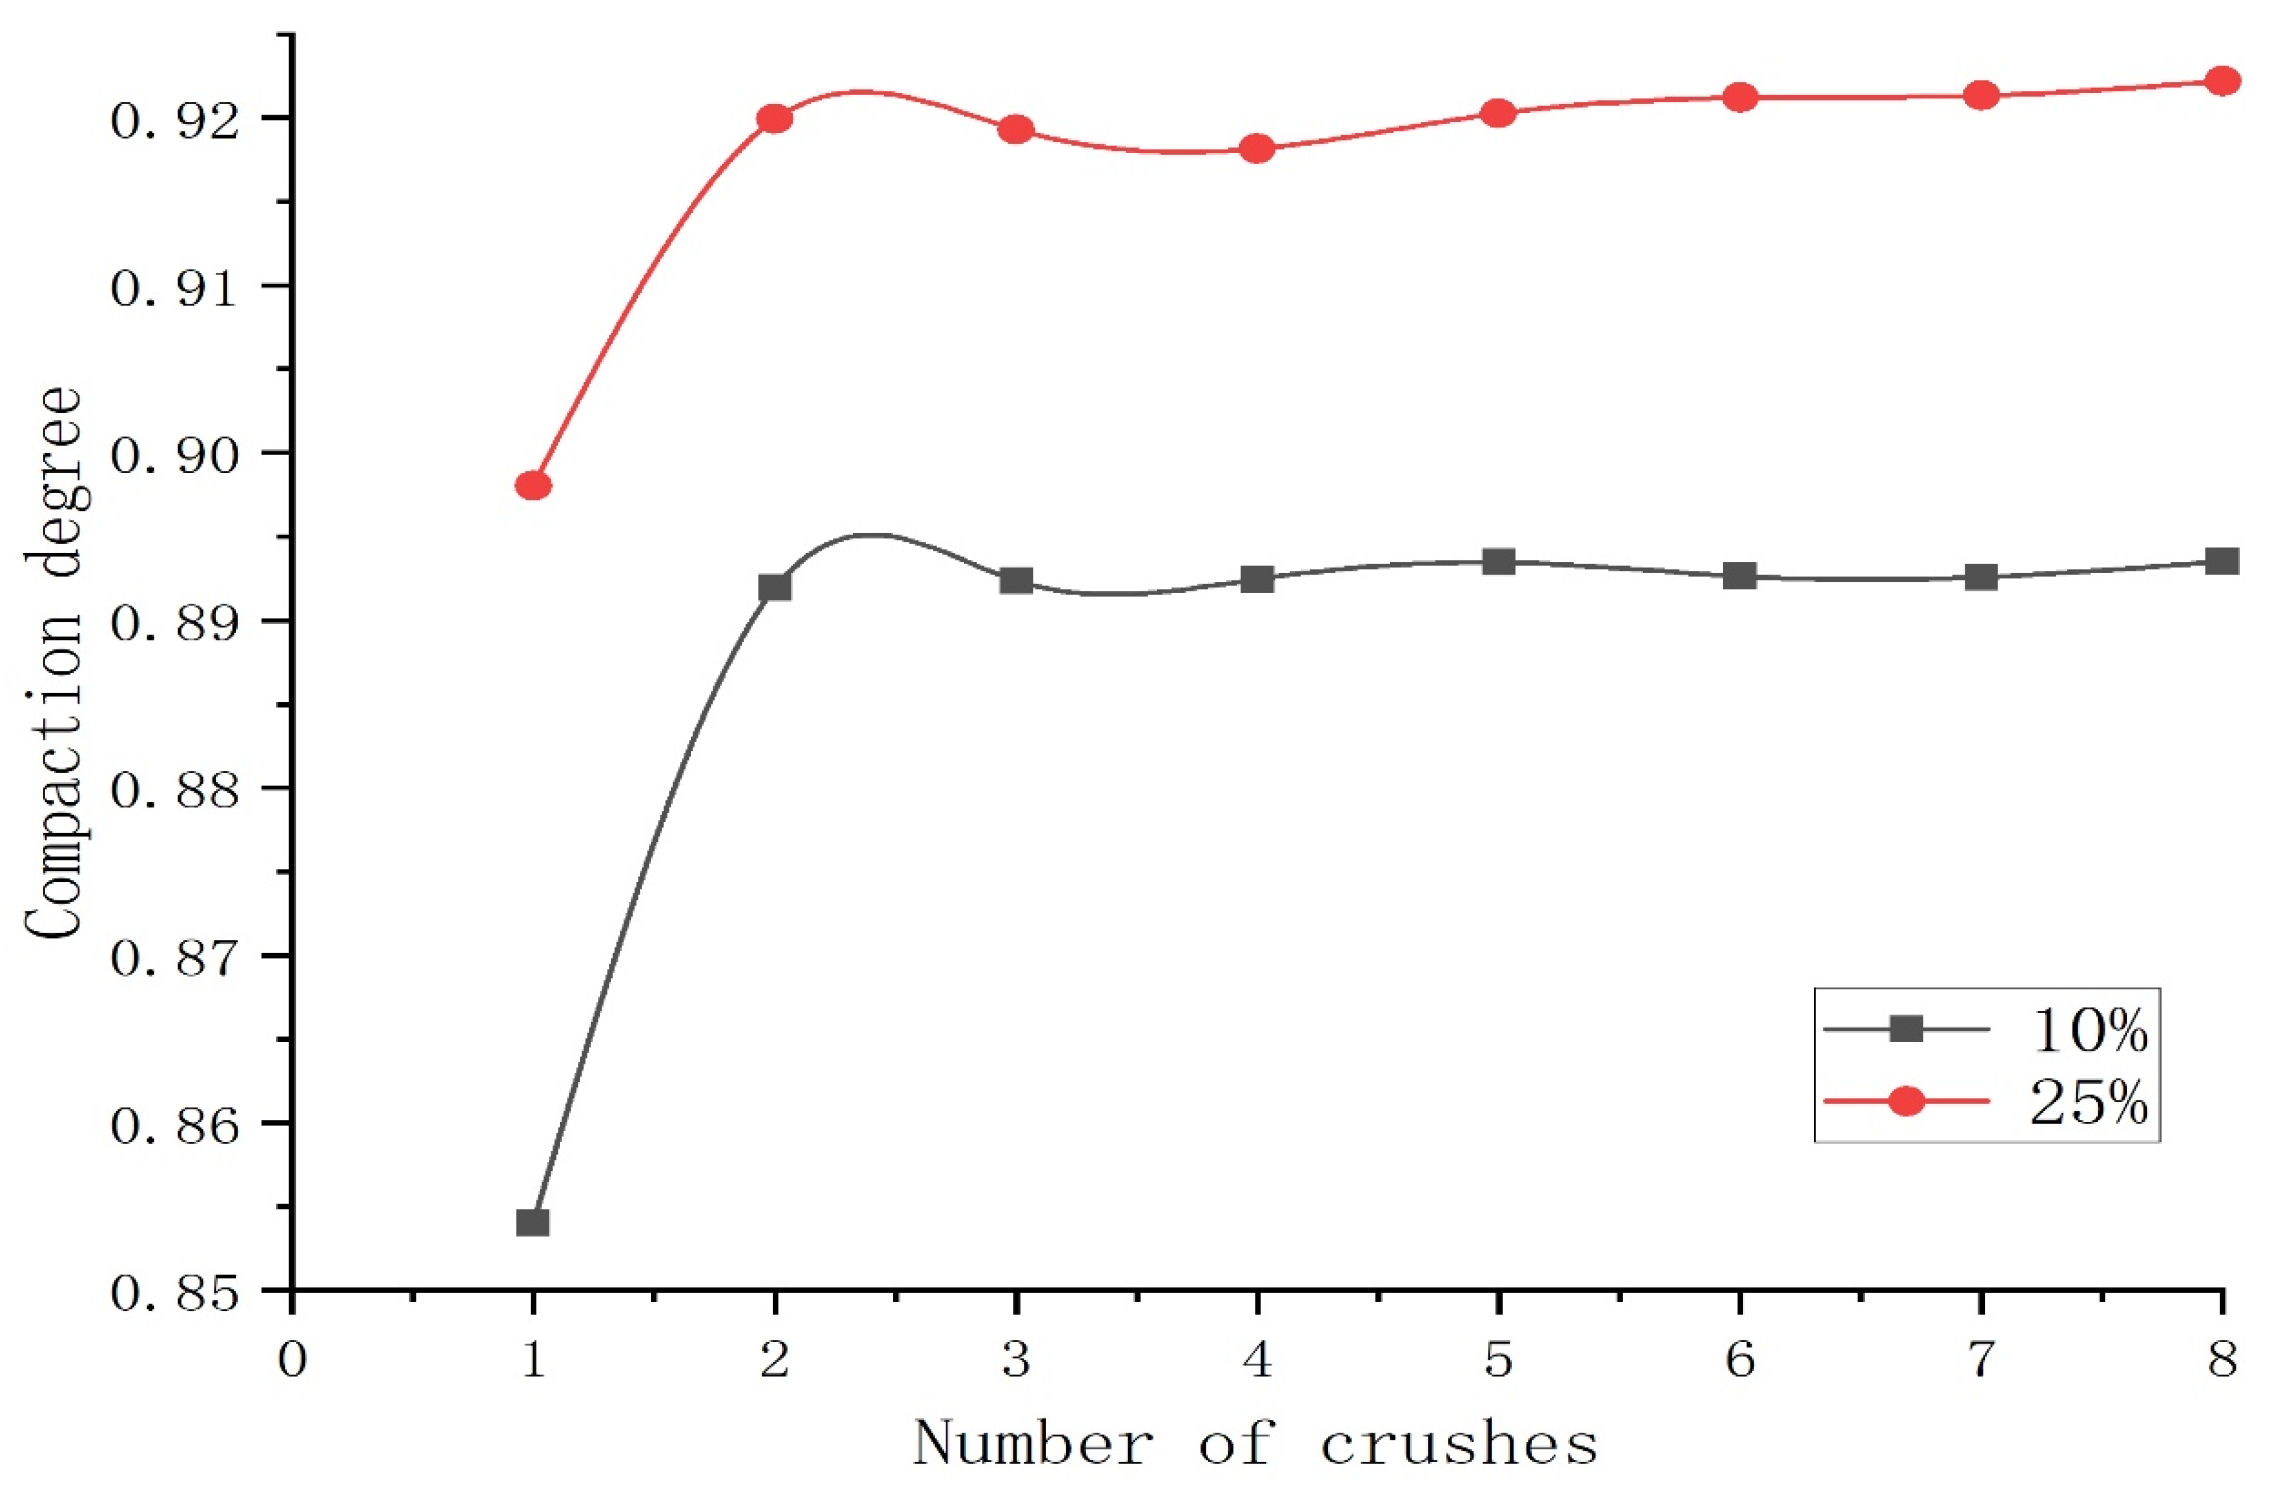
The results of the compaction tests on the 10 cm loose layer are presented in Table 4, Figure 4 and Figure 5.

Table 4.
Compaction test results for 10 cm loosely placed soil samples.
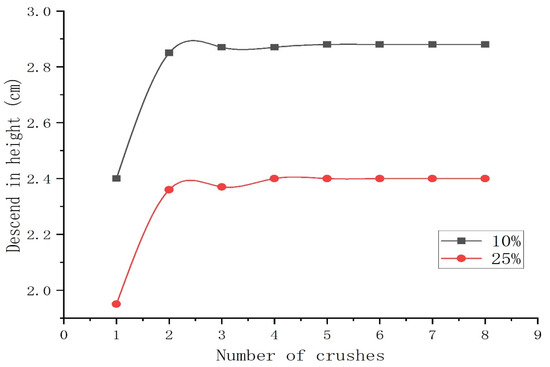
Figure 4.
Relationship between number of compaction passes and settlement height for 10 cm loosely placed soil sample.
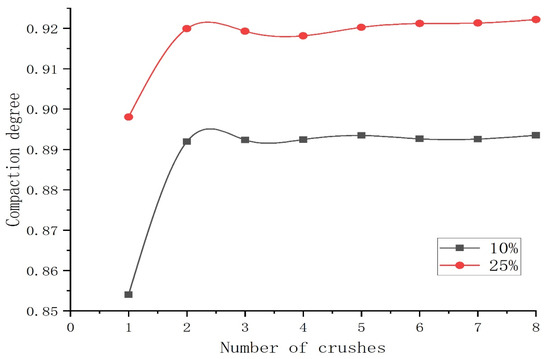
Figure 5.
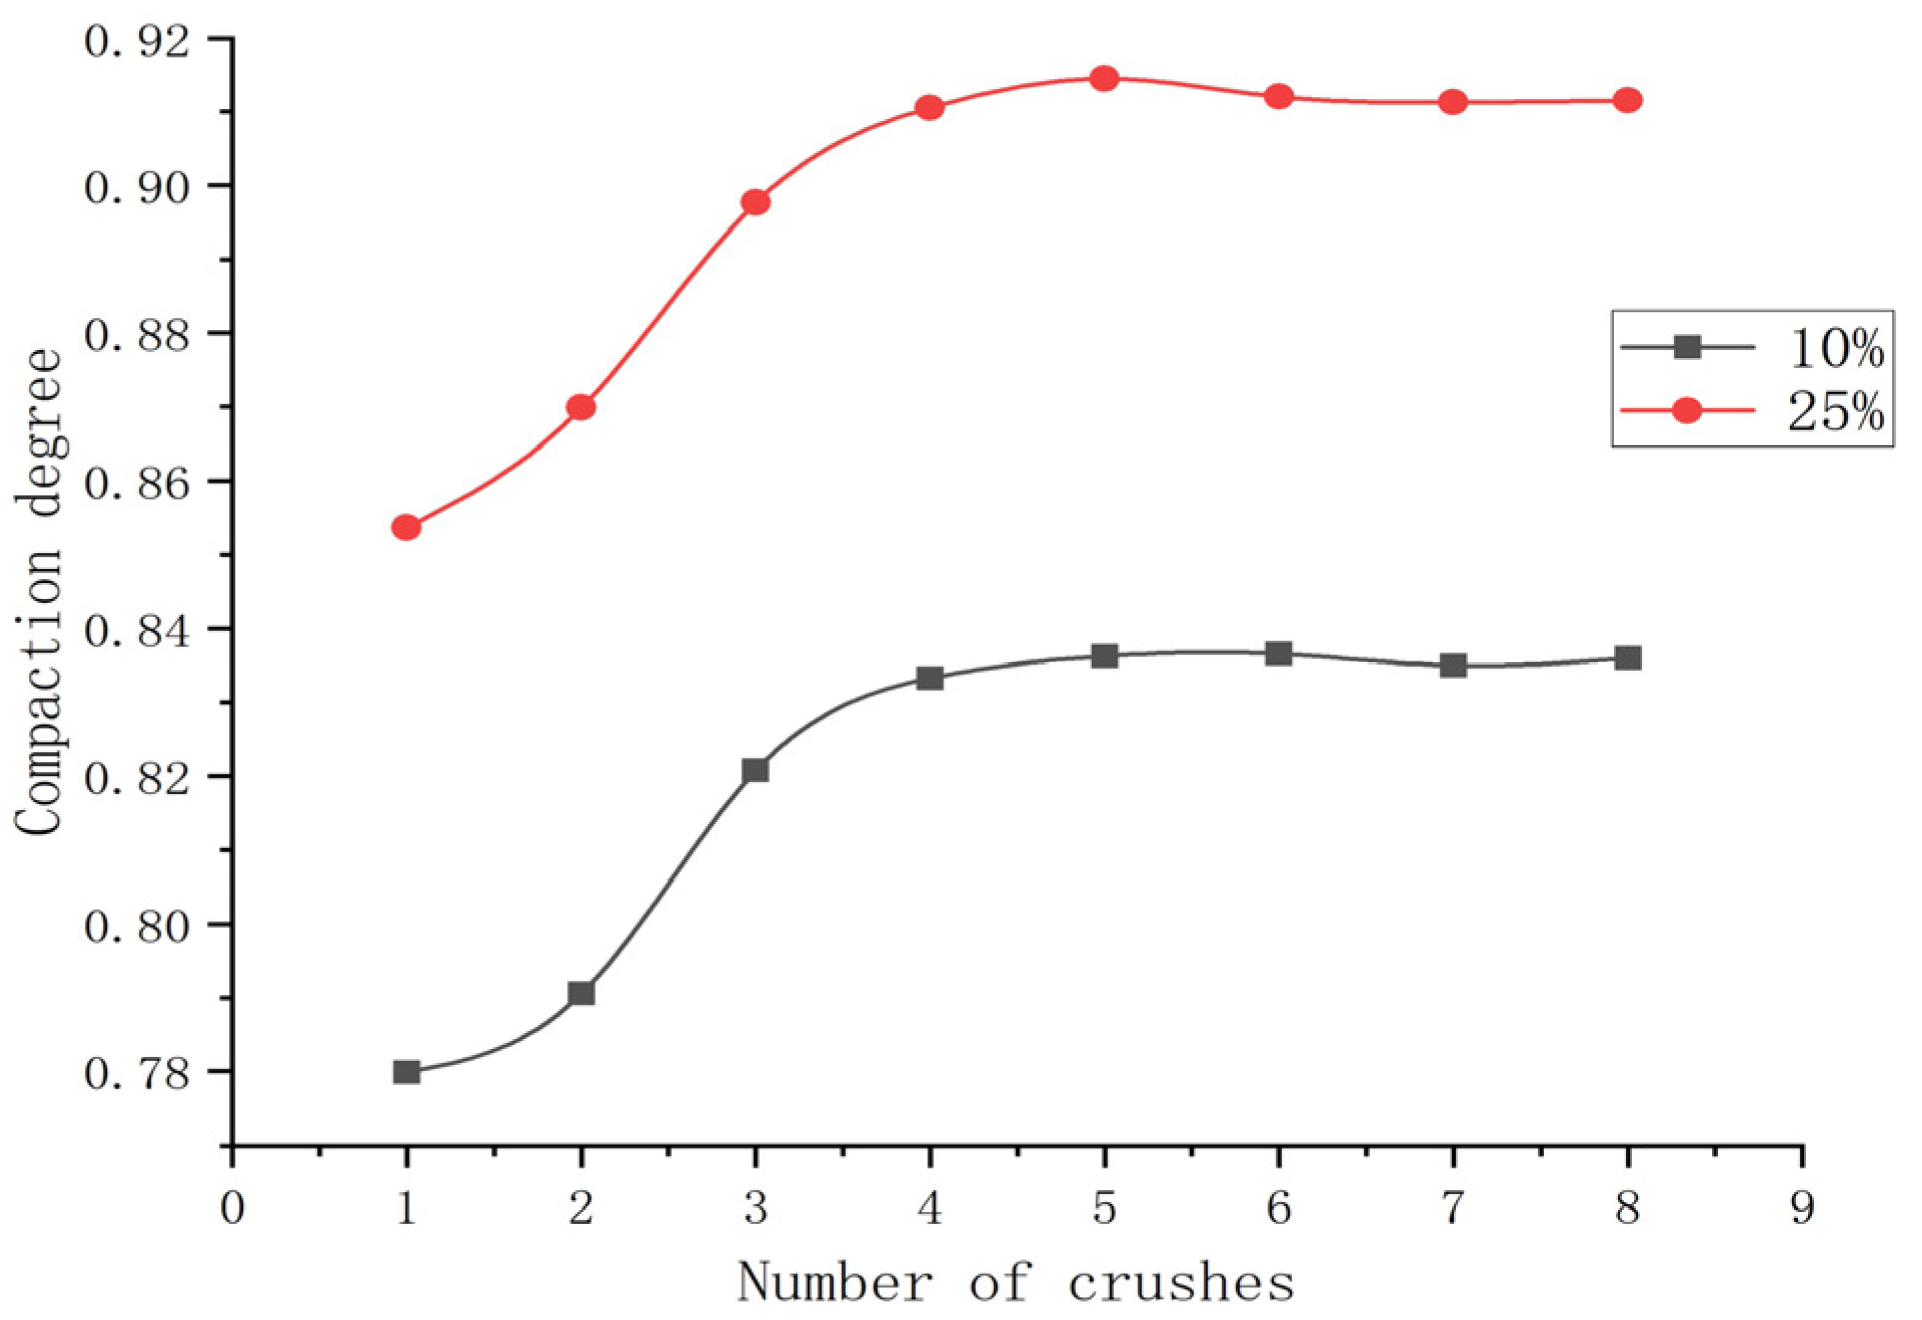
Relationship between number of compaction passes and compaction degree for 10 cm loosely placed soil sample.
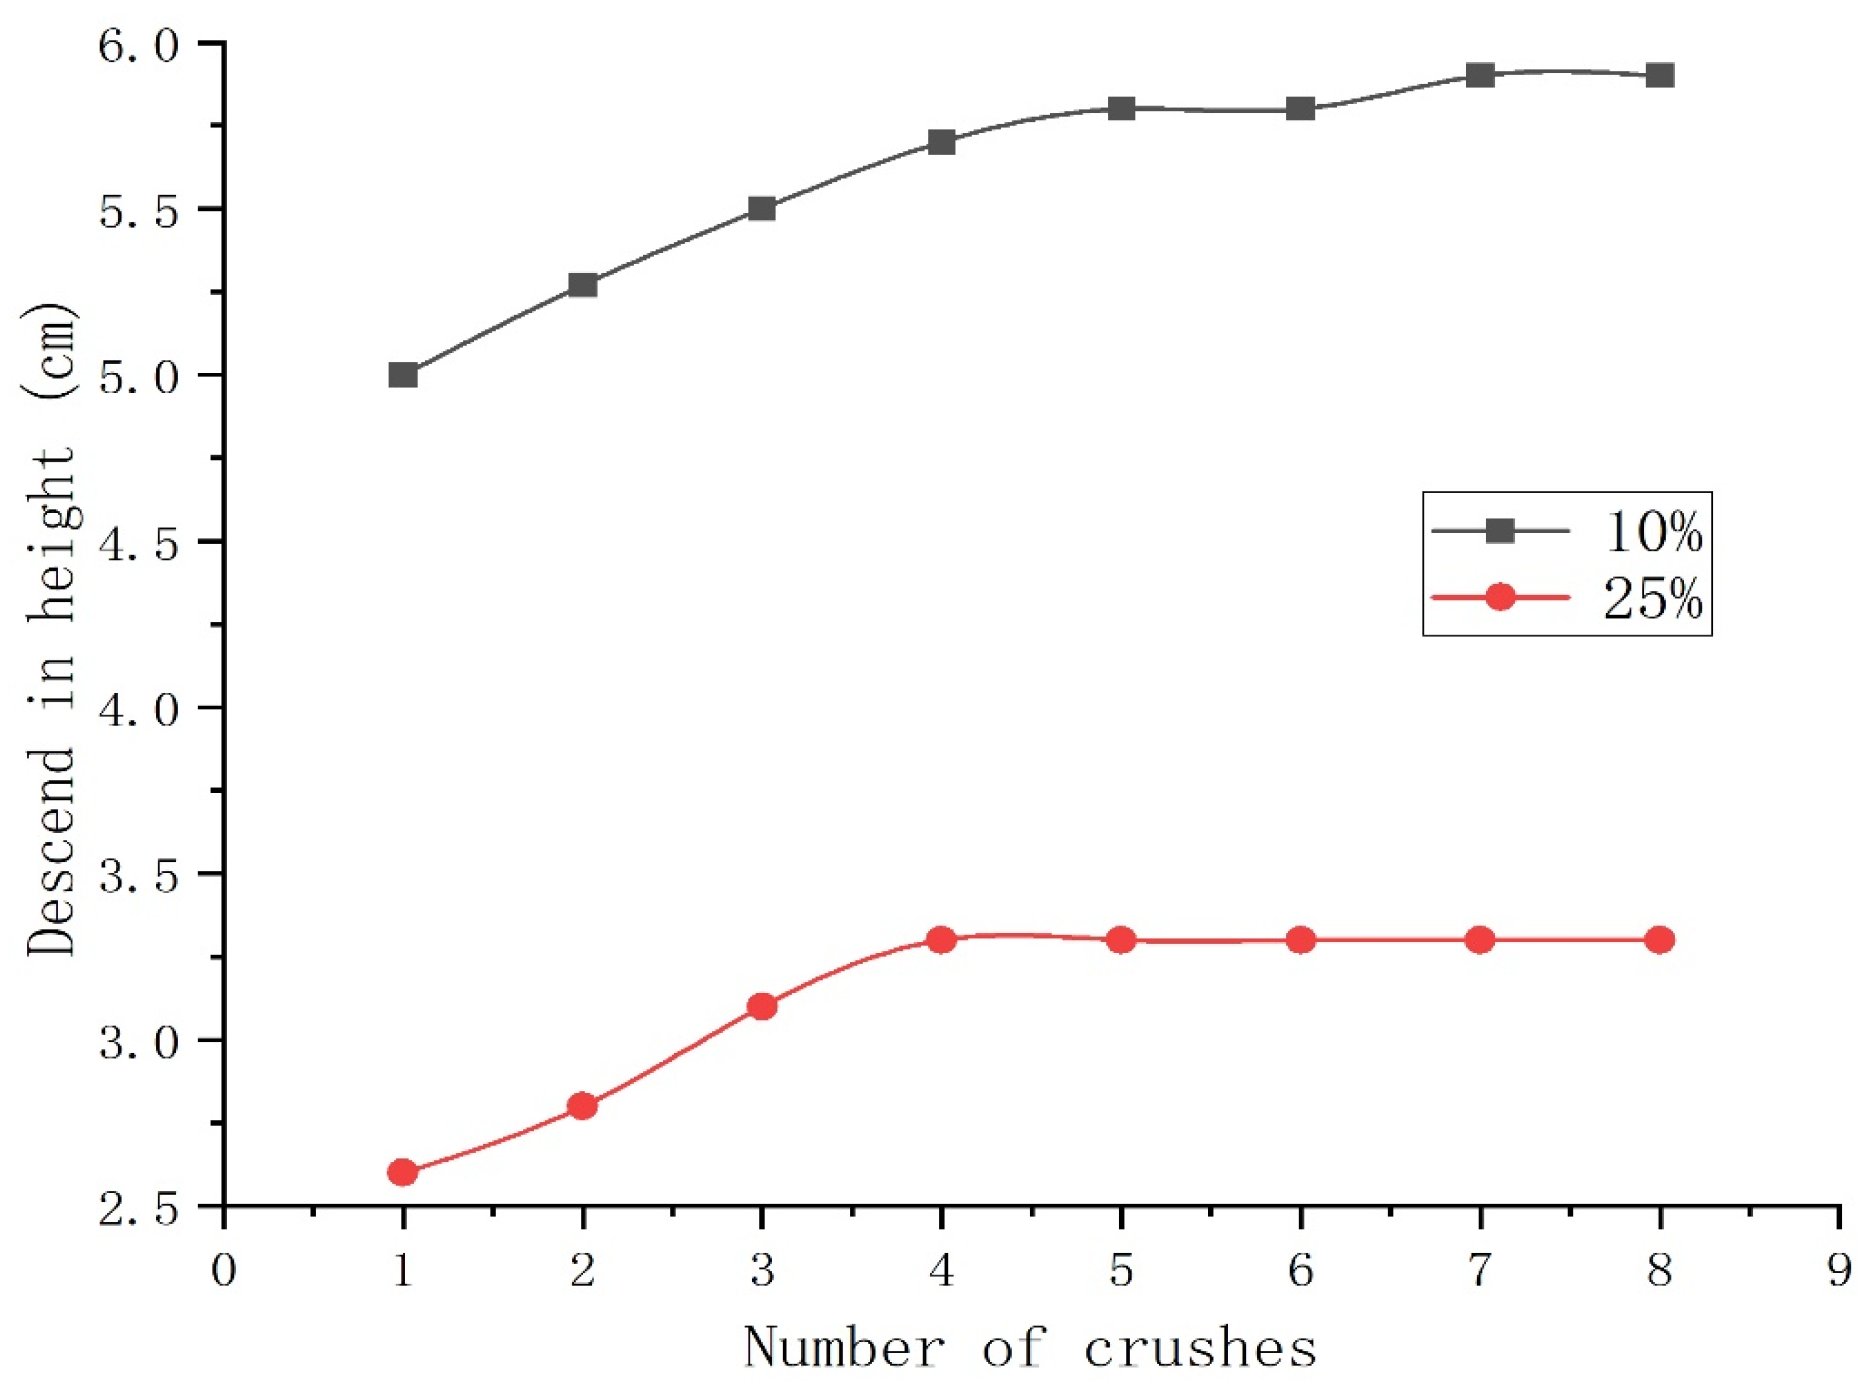
The results of the compaction test for the 30 cm loose layer are presented in Table 5, Figure 6 and Figure 7.

Table 5.
Compaction test results for 30 cm loosely placed soil samples.
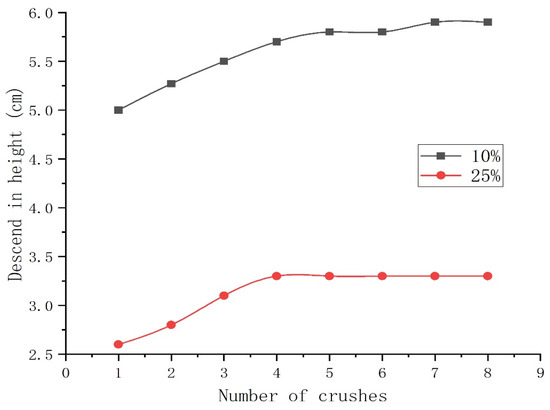
Figure 6.
Relationship between number of compaction passes and settlement height for 30 cm loosely placed soil sample.
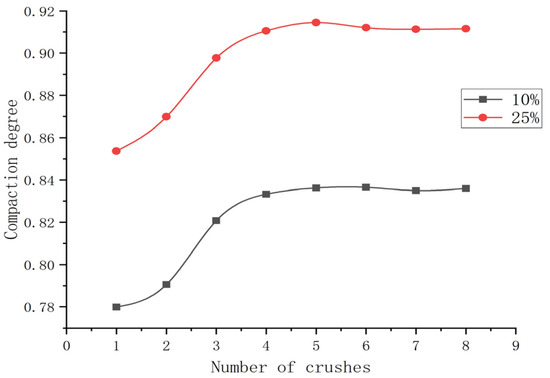
Figure 7.
Relationship between number of compaction passes and compaction degree for 30 cm loosely placed soil sample.
Based on the results of the compaction tests, the following key conclusions were drawn:
(1) The effect of compaction passes on compaction efficiency exhibits distinct phased characteristics: For all test groups, the compaction degree follows a pattern of “rapid increase → gradual growth → stabilization” as the number of passes increases. The primary increase in compaction degree occurs during the first four passes, with gains exceeding 5.2%. Beyond 4 to 6 passes, compaction gains become extremely limited, even showing slight fluctuations. This indicates that the optimal economic number of passes is 4 to 6. Continued compaction constitutes ineffective work and may lead to overcompaction, causing micro-damage to the structure.
(2) Curing agent dosage is a key factor in enhancing the compaction performance and mechanical stiffness: Comparing test groups with an identical loosely laid sample thickness revealed that increasing the curing agent dosage significantly improved the final compaction degree and initial structural stiffness of the stabilized soil. Soil samples with 25% admixture consistently achieved superior final compaction compared to those with 10% admixture. Additionally, high-admixture specimens exhibited significantly lower settlement during compaction, indicating that high-admixture stabilized soil achieves a higher density with minimal deformation, effectively enhancing the soil’s bearing capacity.
(3) Loosely laid sample thickness significantly affects the compaction uniformity and ultimate compaction limit: At the same solidifying agent dosage, reducing the loosely laid sample thickness facilitates higher ultimate compaction (e.g., at 25% dosage, 10 cm thickness yields 0.922 compaction > 30 cm thickness at 0.914). This confirms that thin-layer compaction facilitates more uniform energy transfer, avoiding energy attenuation in thicker layers and ensuring consistent compaction quality and upper limits.
3.2. Simulation Results
Based on the established 2D and 3D discrete element models, numerical simulations were conducted for the compaction process under four conditions: curing agent contents of 10% and 25%, and loosely laid sample thicknesses of 10 cm and 30 cm. After each compaction pass, the settlement, average dry density, and compaction degree at the soil surface were extracted and compared with laboratory test results.
- 3D Simulation Results
The 3D model effectively reproduced the three-dimensional response of the soil during actual compaction. Figure 8 and Figure 9 show the changes in thickness after the eighth pass of compaction for soils with a 10% and 25% curing agent content at loosely laid sample thicknesses of 10 cm and 30 cm, respectively. The random sampling of soil samples after each compaction pass yielded the 3D simulated compaction indices for 10 cm and 30 cm loosely laid sample thicknesses, as presented in Table 6 and Table 7.
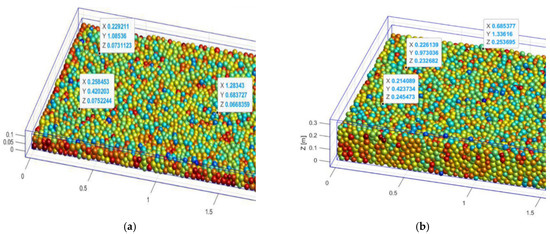
Figure 8.
The 10% cement-stabilized soil after eight passes of 3D compaction: (a) 10 cm soil sample loosely laid (model excerpt); (b) 30 cm soil sample loosely laid (model excerpt).
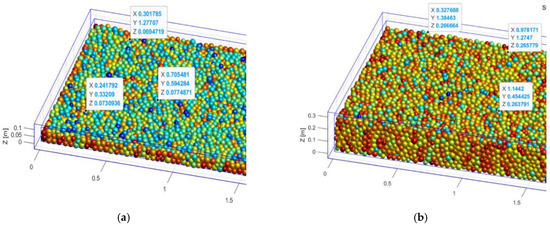
Figure 9.
The 25% cement-stabilized soil after eight passes of 3D compaction: (a) 10 cm soil sample loosely laid (model excerpt); (b) 30 cm soil sample loosely laid (model excerpt).

Table 6.
Three-dimensional simulation results for compaction of 10 cm soil sample on gravel bed.

Table 7.
Three-dimensional simulation results for compaction of 30 cm soil sample on gravel bed.
- 2D Simulation Results
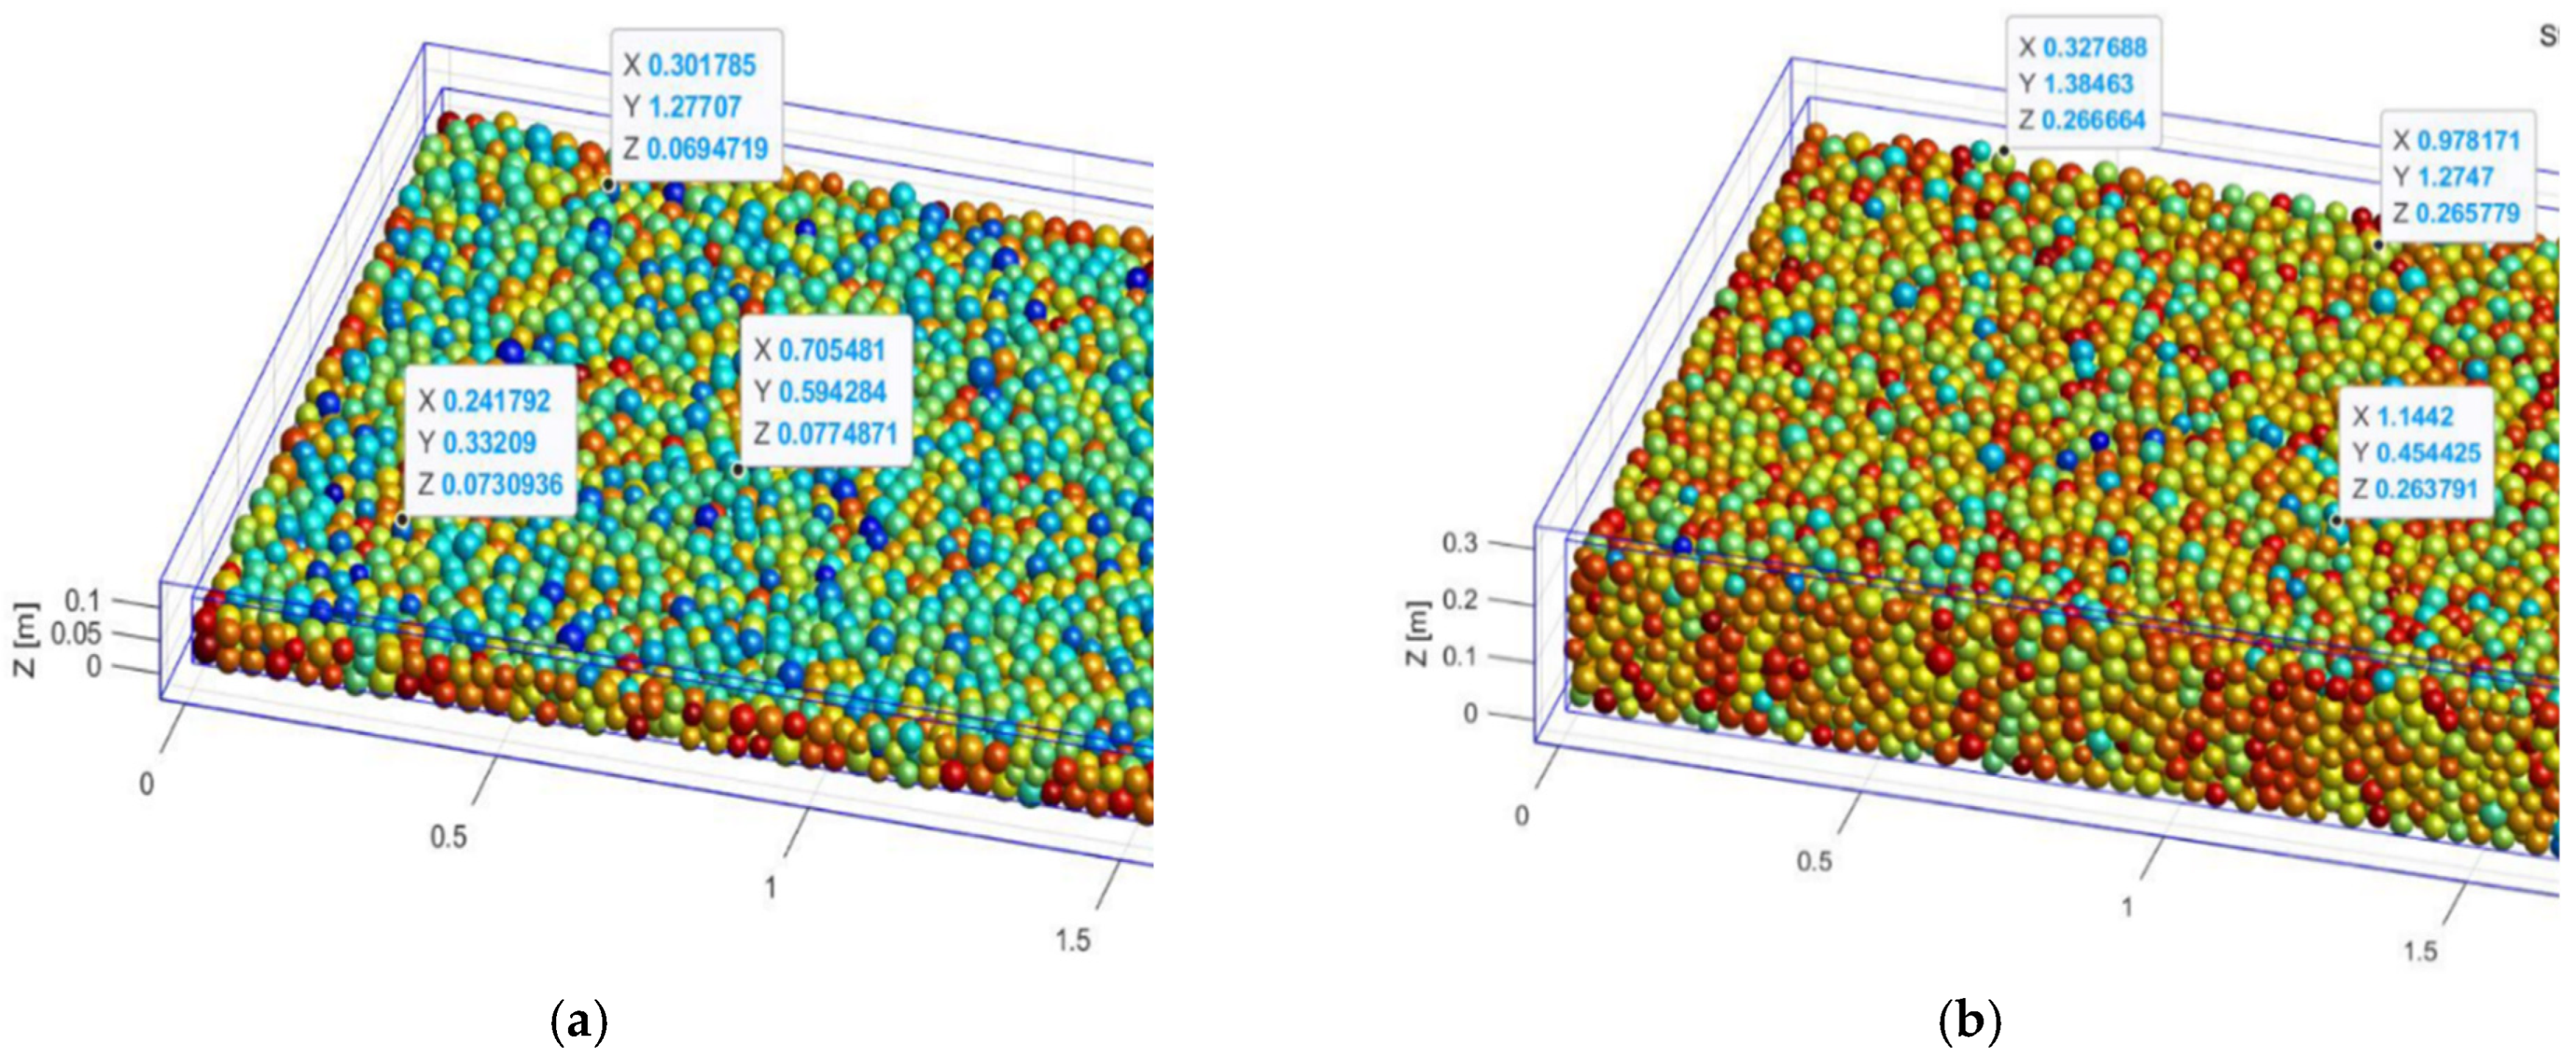
The 2D model demonstrates significantly higher computational efficiency than the 3D model. Figure 10 and Figure 11 show the changes in thickness after the eighth pass of compaction for soils with curing agent contents of 10% and 25% under loosely laid sample thicknesses of 10 cm and 30 cm, respectively. Table 8 and Table 9 present the compaction index results obtained from 2D simulations for loose layers with thicknesses of 10 cm and 30 cm, respectively.

Figure 10.
The 10% cement-stabilized soil after eight passes of 2D compaction: (a) 10 cm soil sample loosely laid (model excerpt); (b) 30 cm soil sample loosely laid (model excerpt).

Figure 11.
The 25% cement-stabilized soil after eight passes of 2D compaction: (a) 10 cm soil sample loosely laid (model excerpt); (b) 30 cm soil sample loosely laid (model excerpt).

Table 8.
Two-dimensional simulation results for compaction of 10 cm soil sample on gravel bed.

Table 9.
Two-dimensional simulation results for compaction of 30 cm soil sample on gravel bed.
4. Discussion
- Comparison of test results
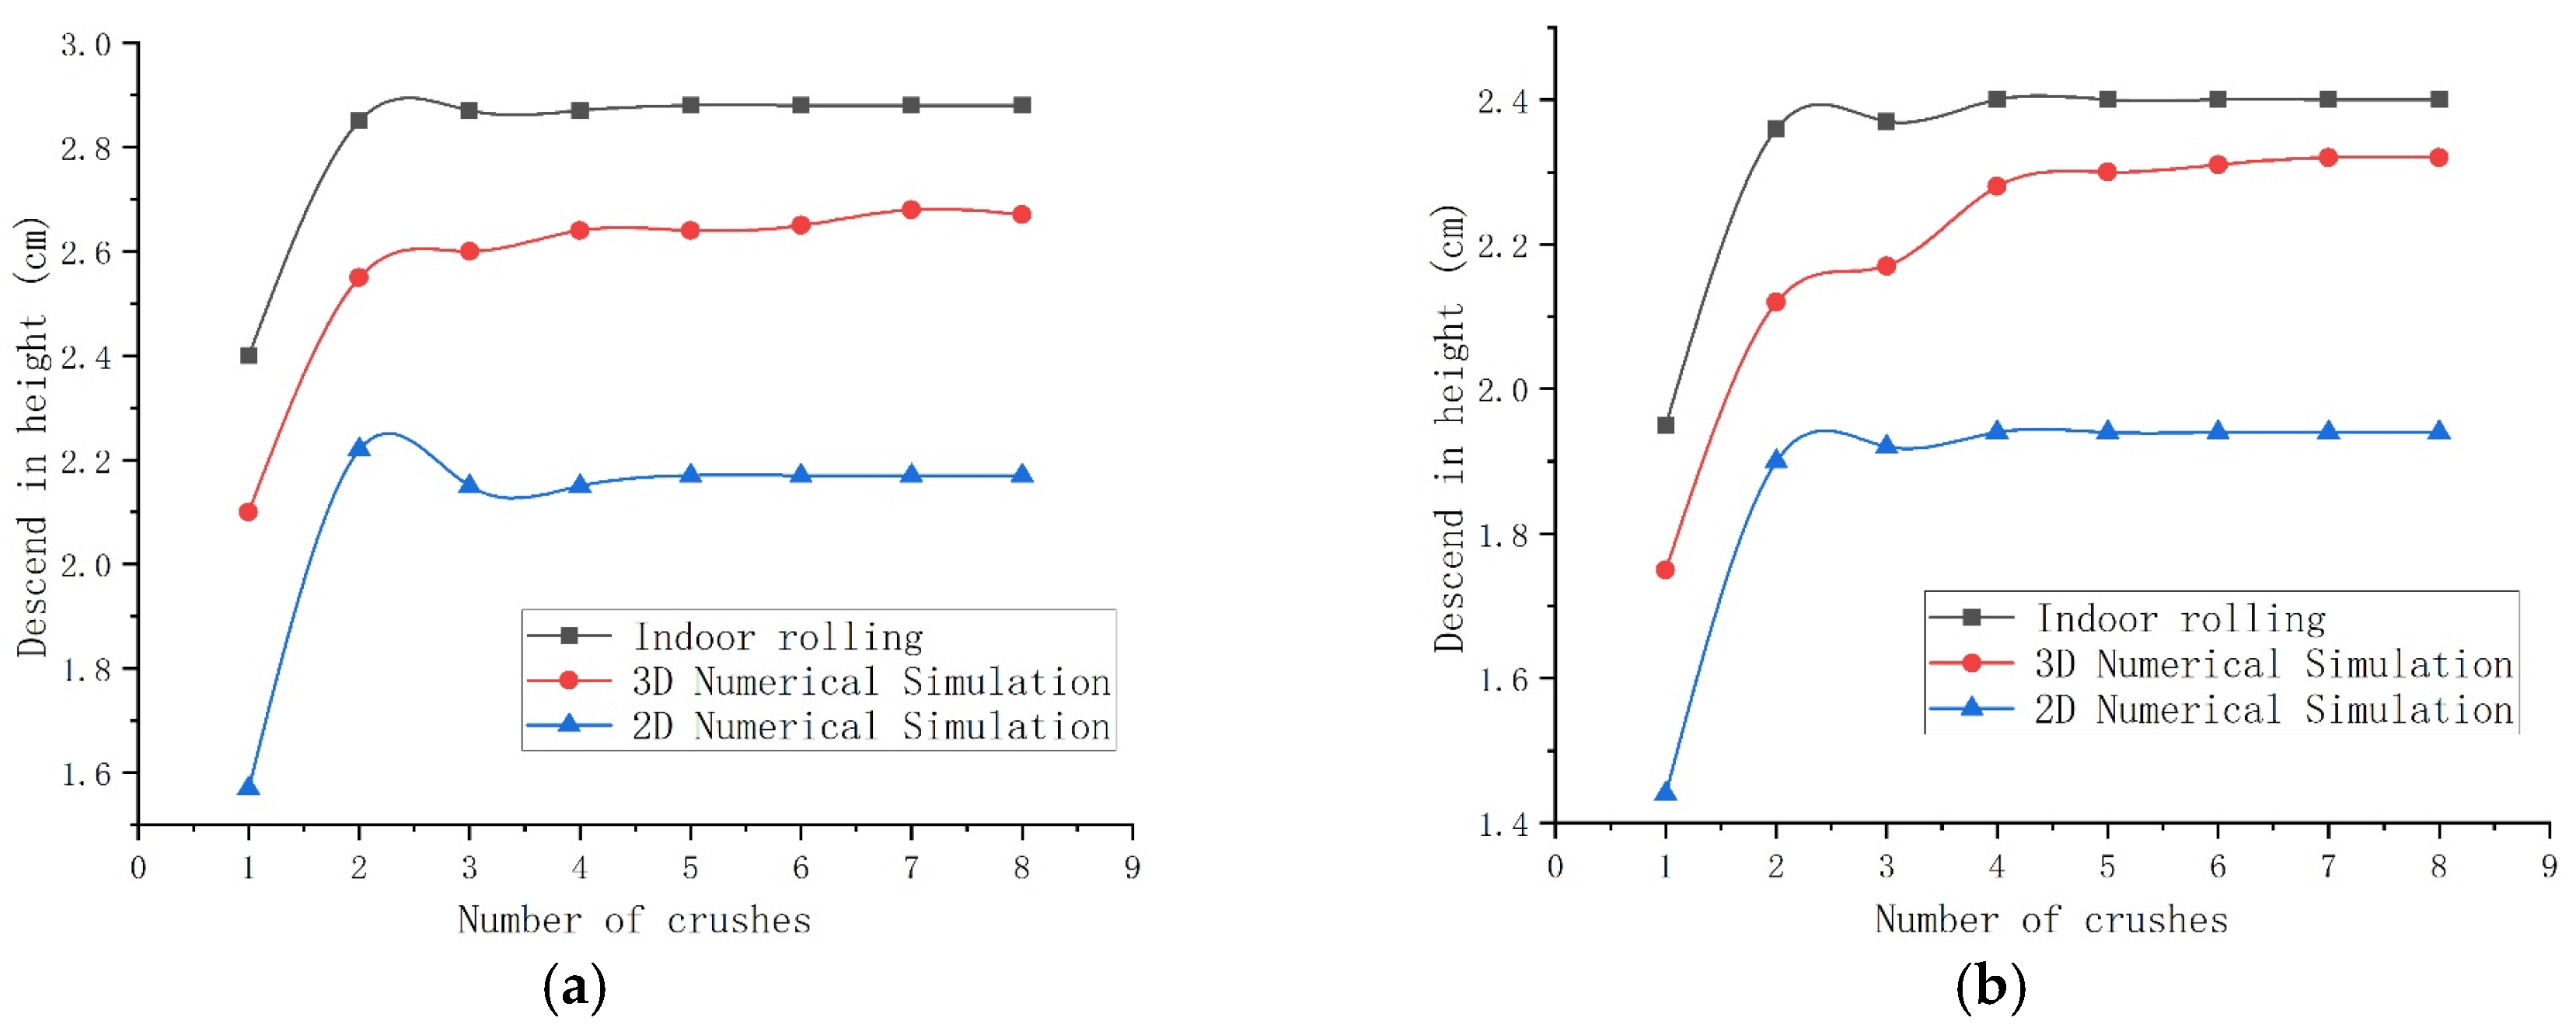
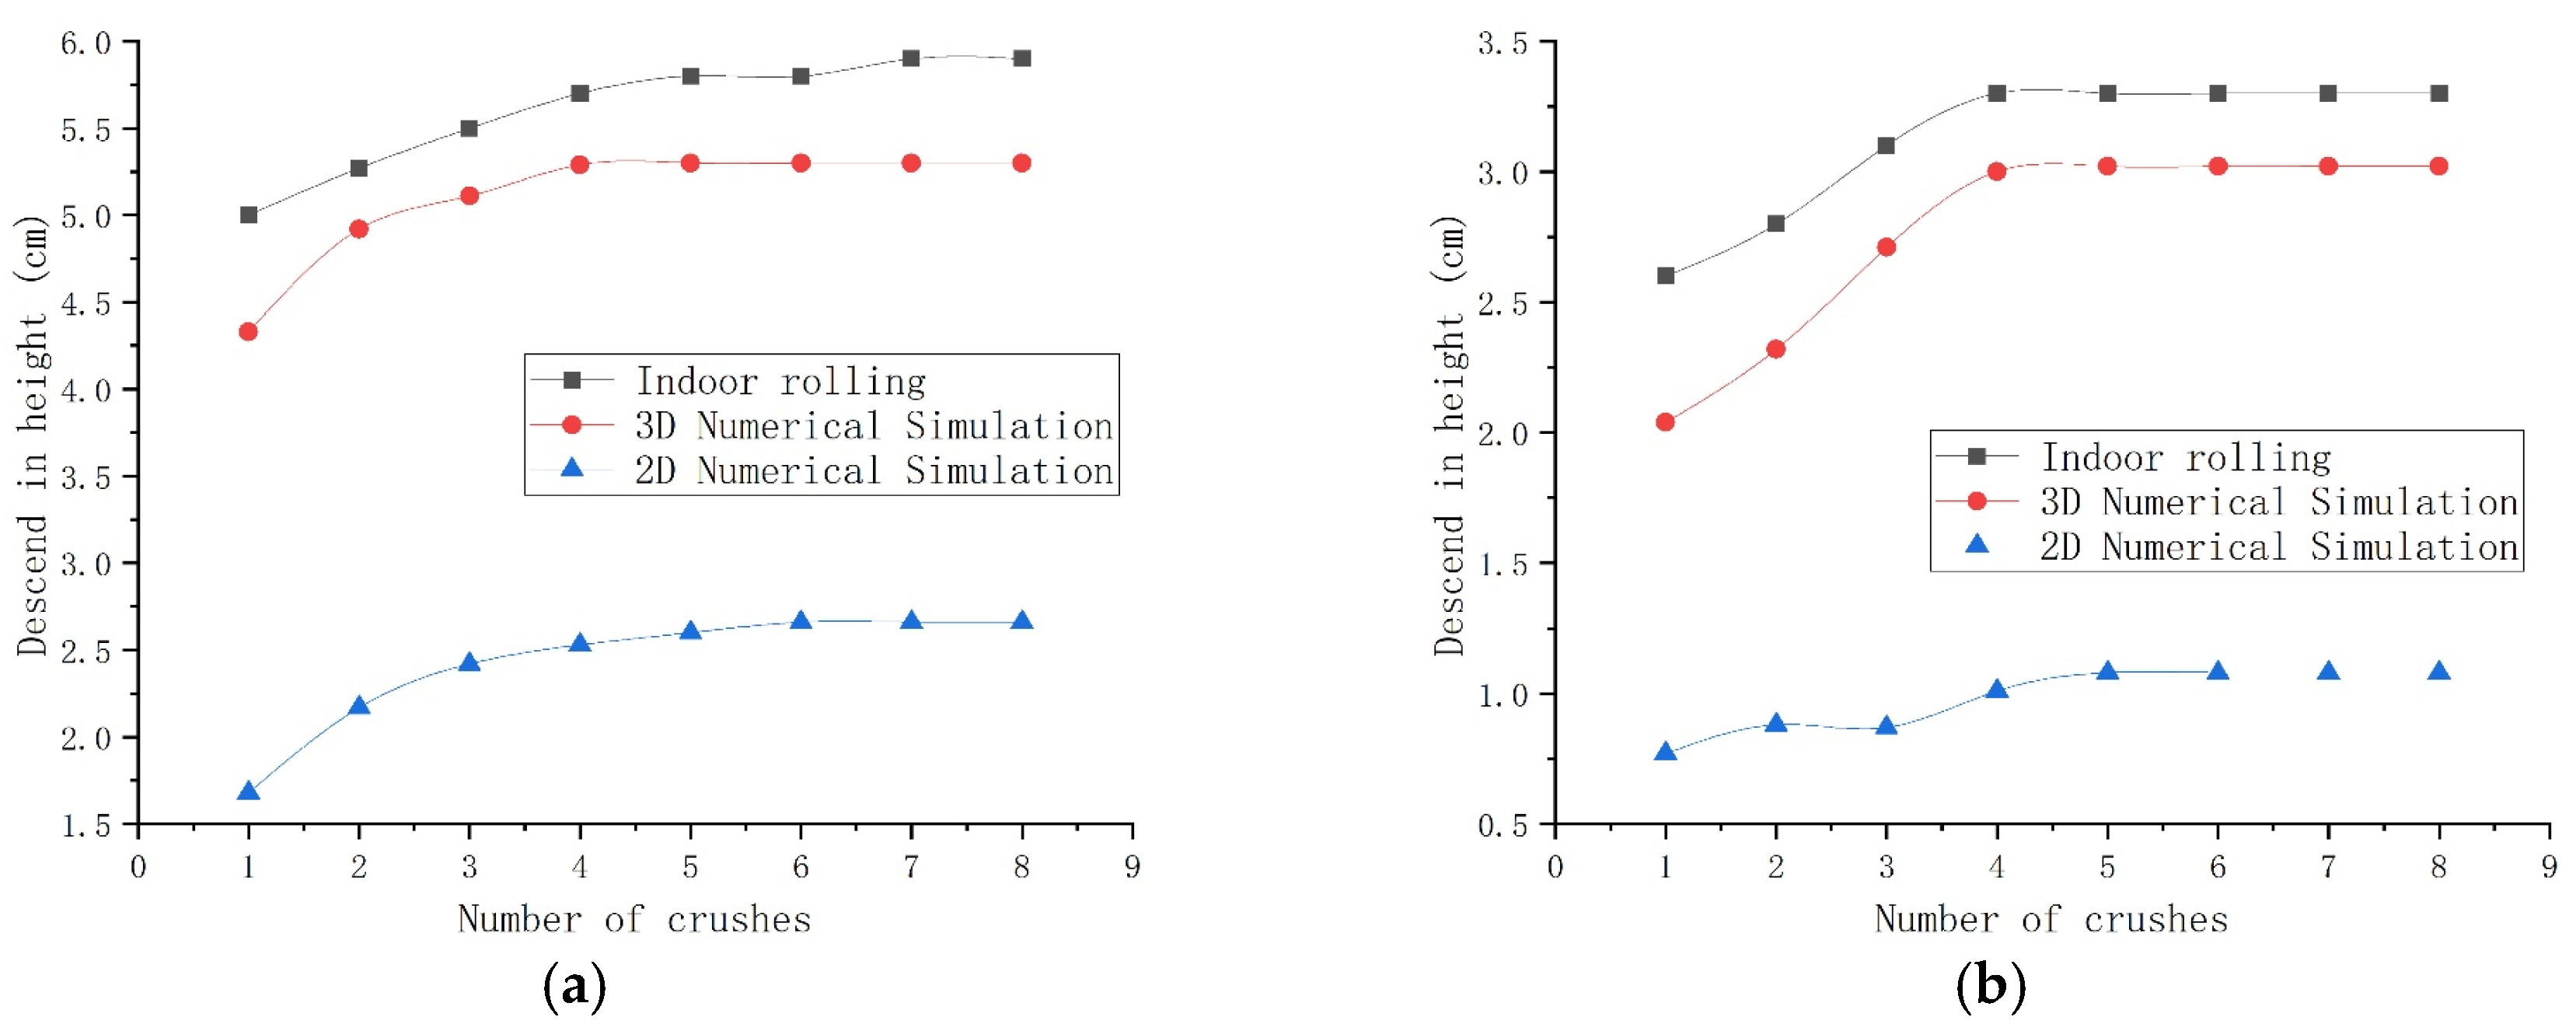
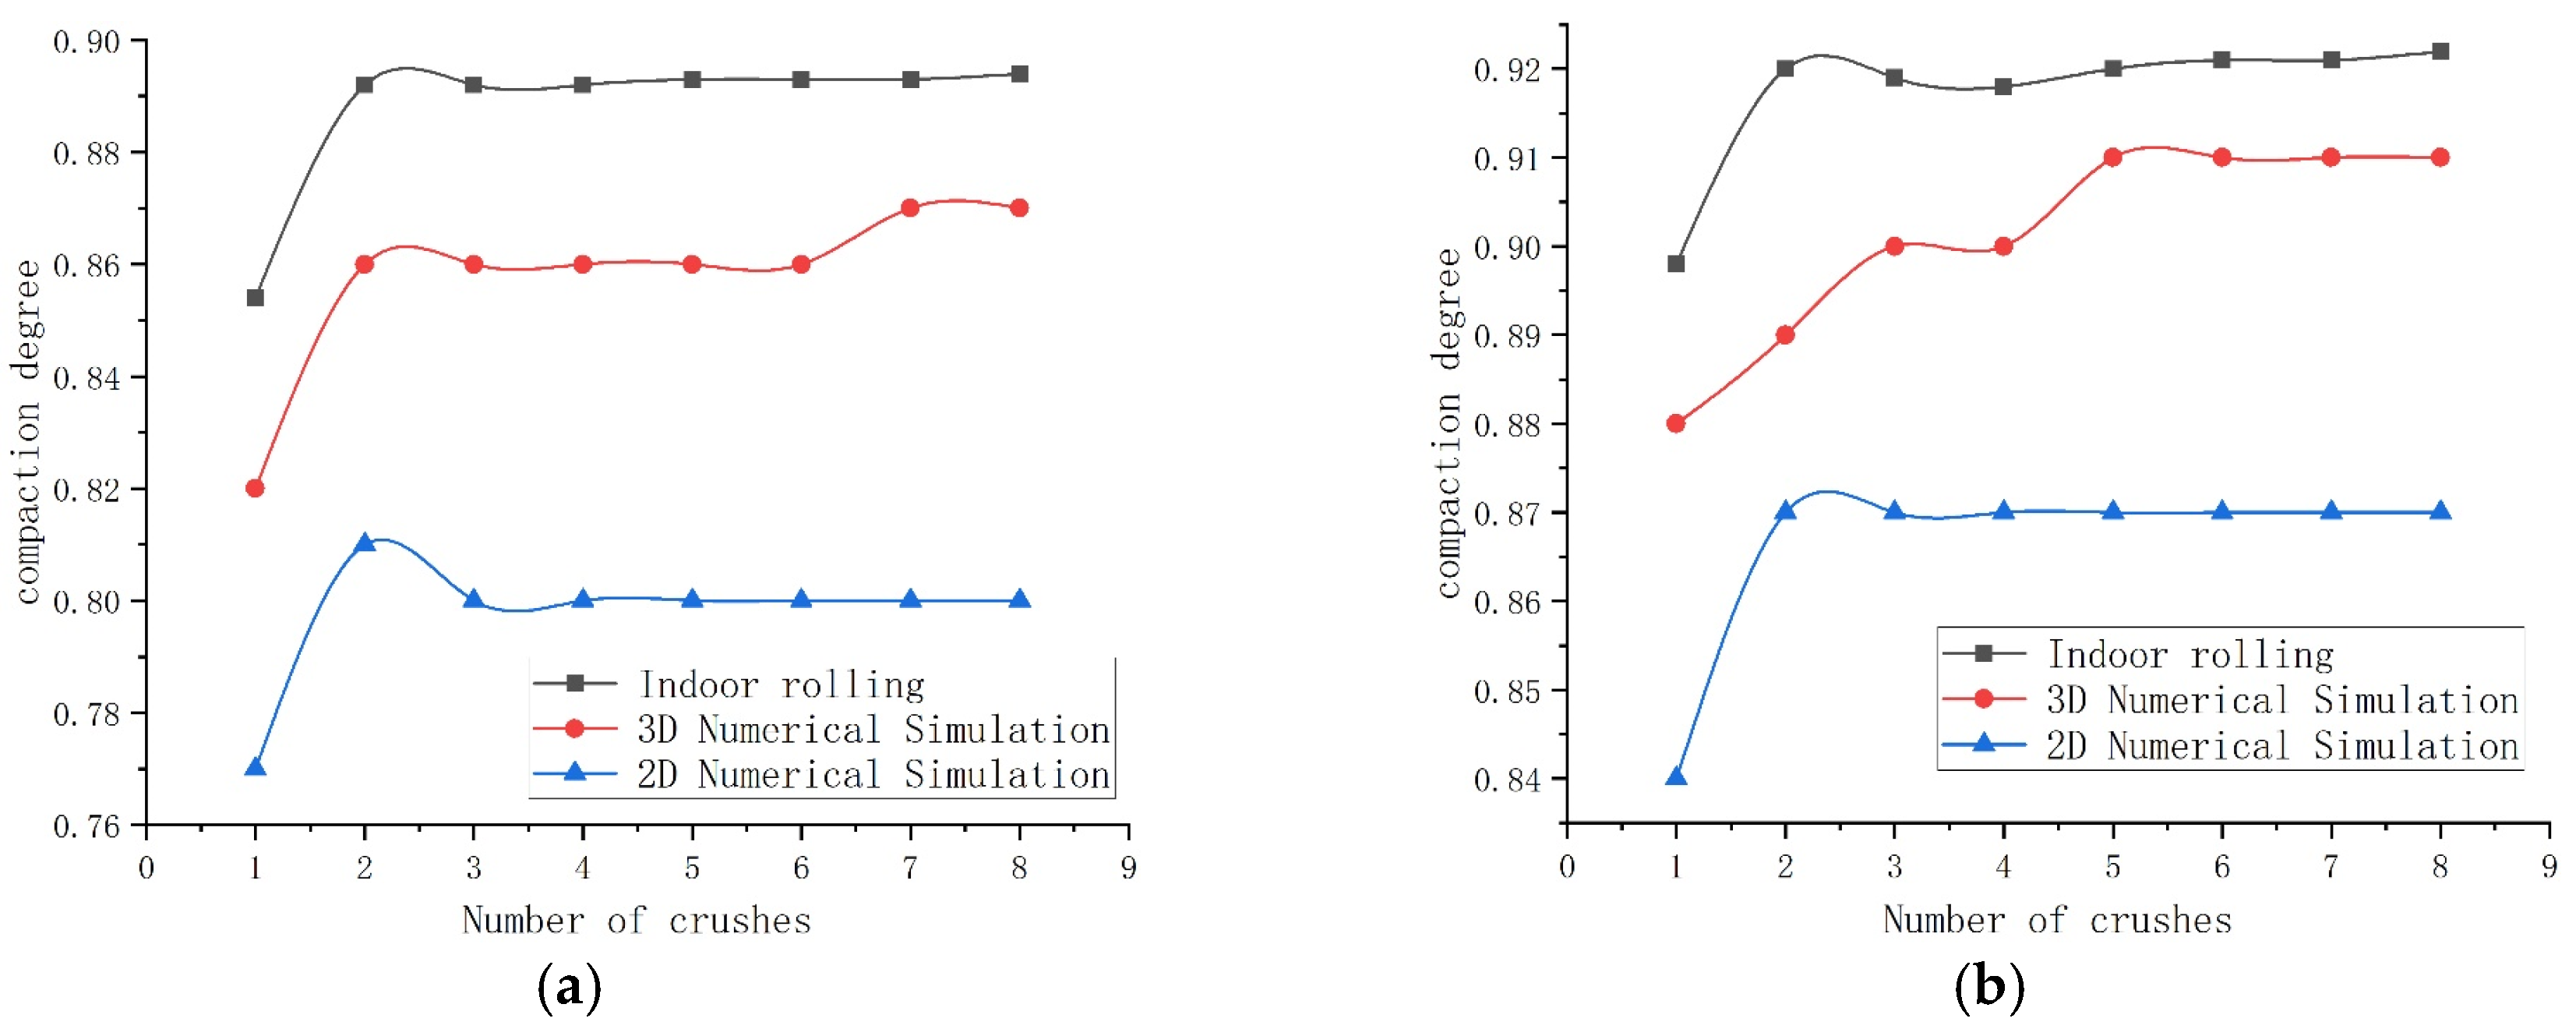
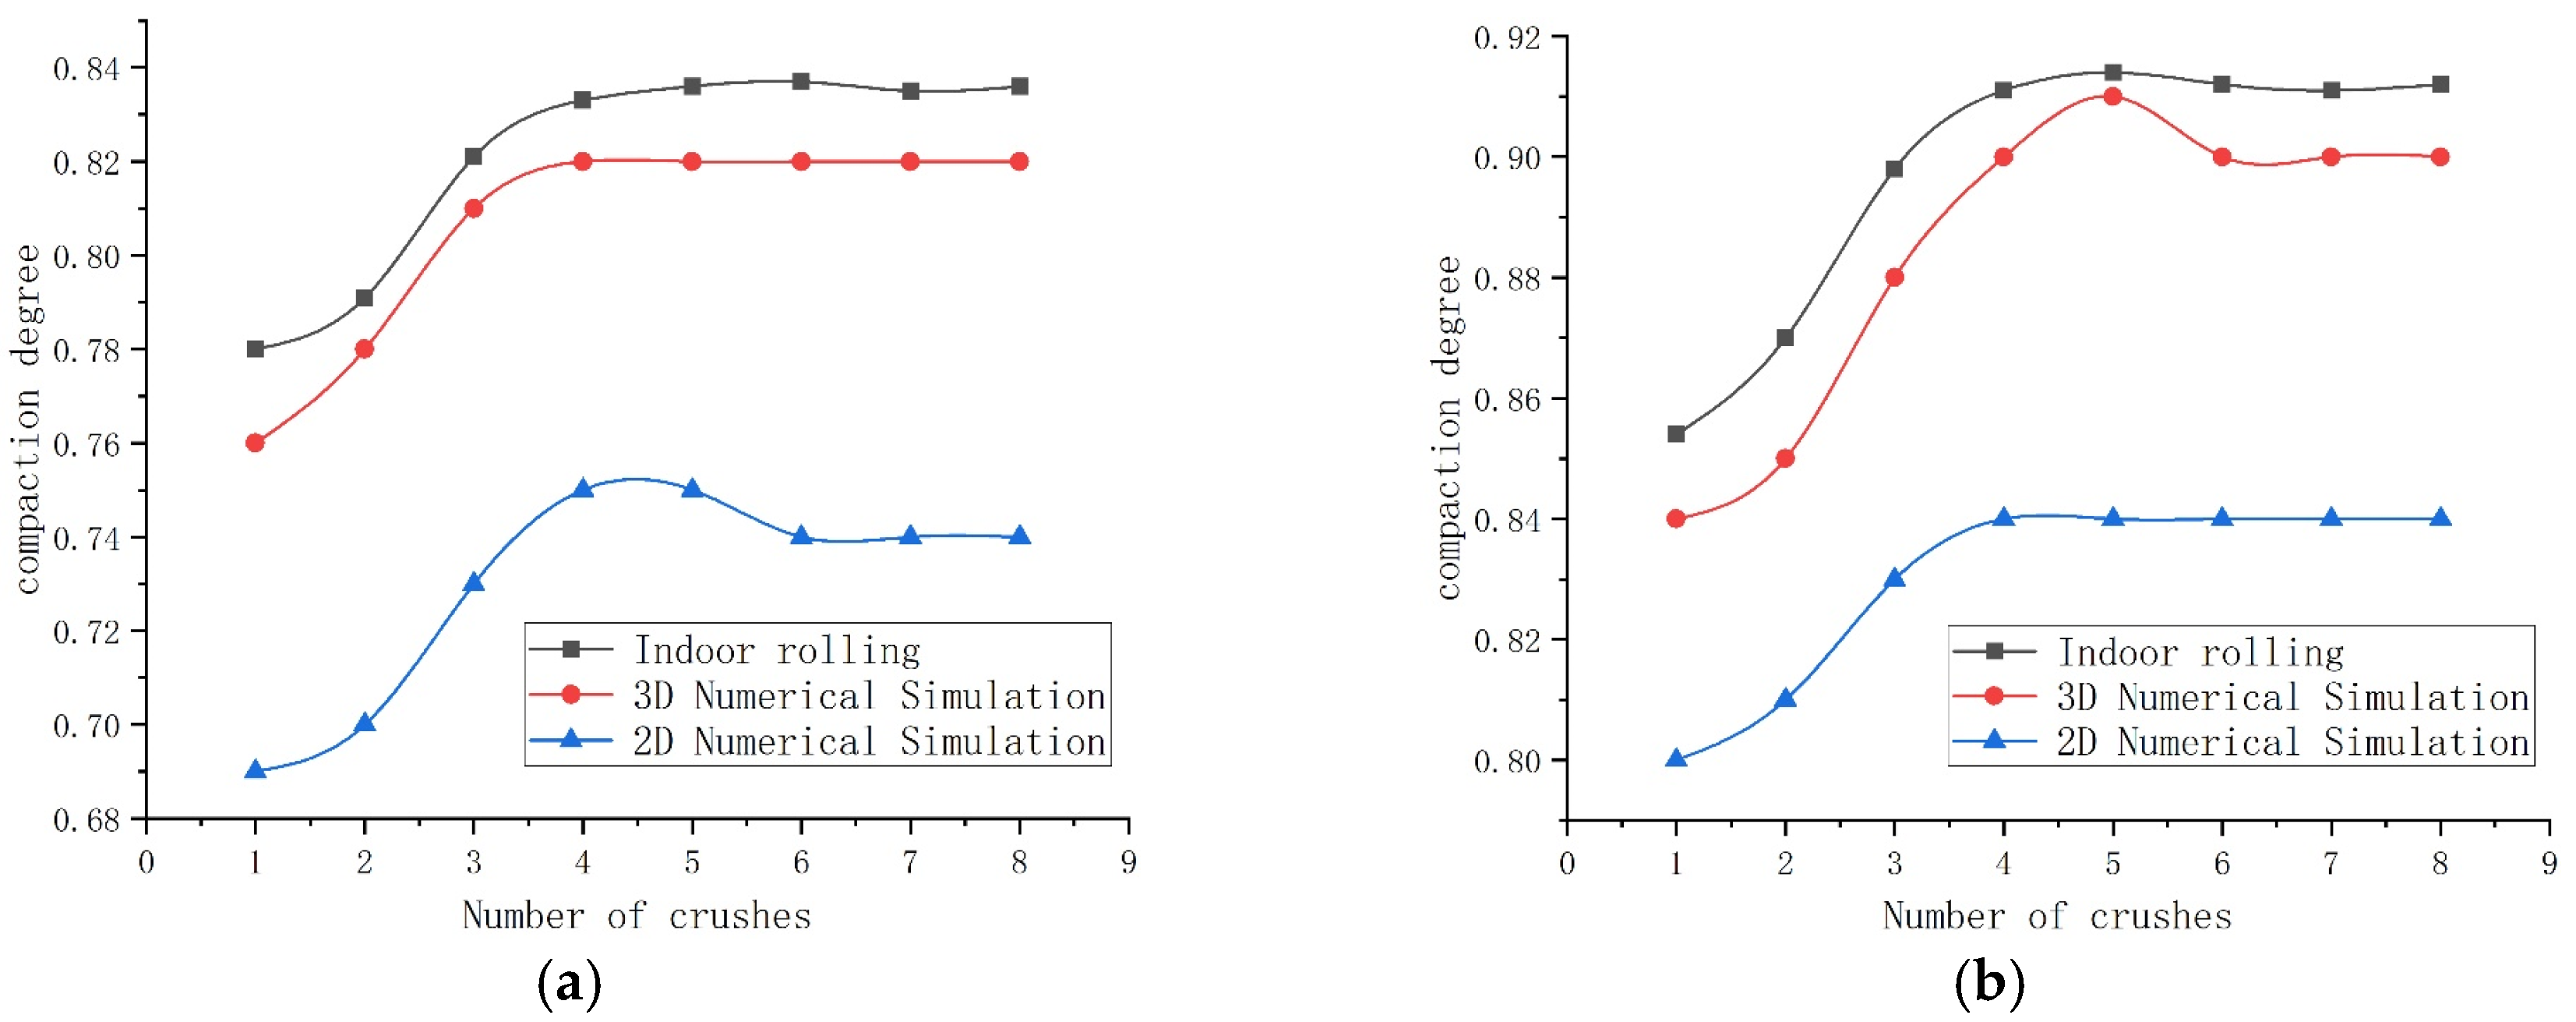
The results comparing the laboratory compaction tests are presented in Figure 12, Figure 13, Figure 14 and Figure 15.
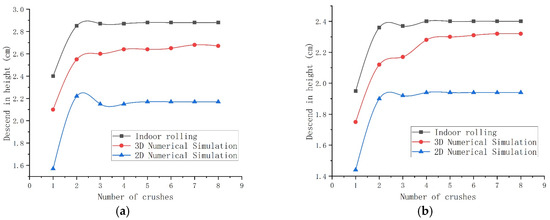
Figure 12.
Comparison of slump compaction settlement height for 10 cm soil samples: (a) 10% curing agent dosage; (b) 25% curing agent dosage.
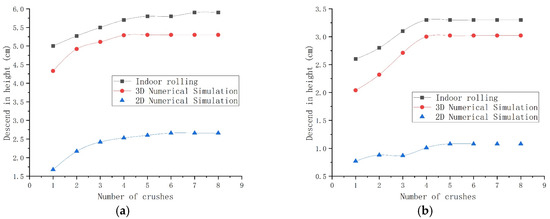
Figure 13.
Comparison of loose layer compaction settlement for 30 cm soil samples: (a) 10% curing agent dosage; (b) 25% curing agent content.
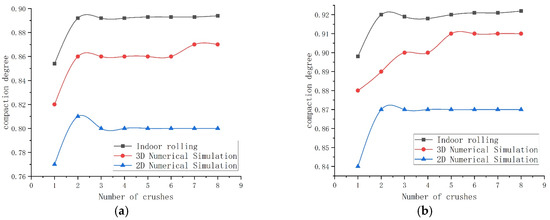
Figure 14.
Comparison of loose layer compaction density for 10 cm soil samples: (a) 10% curing agent content; (b) 25% curing agent content.
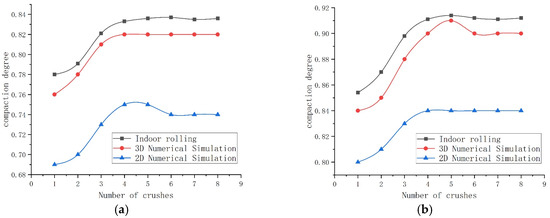
Figure 15.
Comparison of changes in compaction degree in 30 cm soil samples during loose layer compaction: (a) 10% curing agent content; (b) 25% curing agent content.
The 3D simulation results showed good agreement with the laboratory test data, particularly during the mid-to-late compaction stages (after the 4th pass). Errors in the compaction degree were generally controlled within 5%, validating the reliability of the 3D model in simulating the three-dimensional compaction process.
The 2D simulation demonstrated better computational efficiency but exhibited inherent limitations in its quantitative accuracy. Its predicted settlement values were generally underestimated, and the compaction gain trend deviated from the experimental data, with an average error of approximately 10%. Nevertheless, the 2D model effectively captures the overall trend in compaction with rolling passes and identifies the economically viable pass range. It retains value as an engineering reference for scenarios emphasizing qualitative analysis, trend assessment, or constrained computational resources.
- Error Analysis
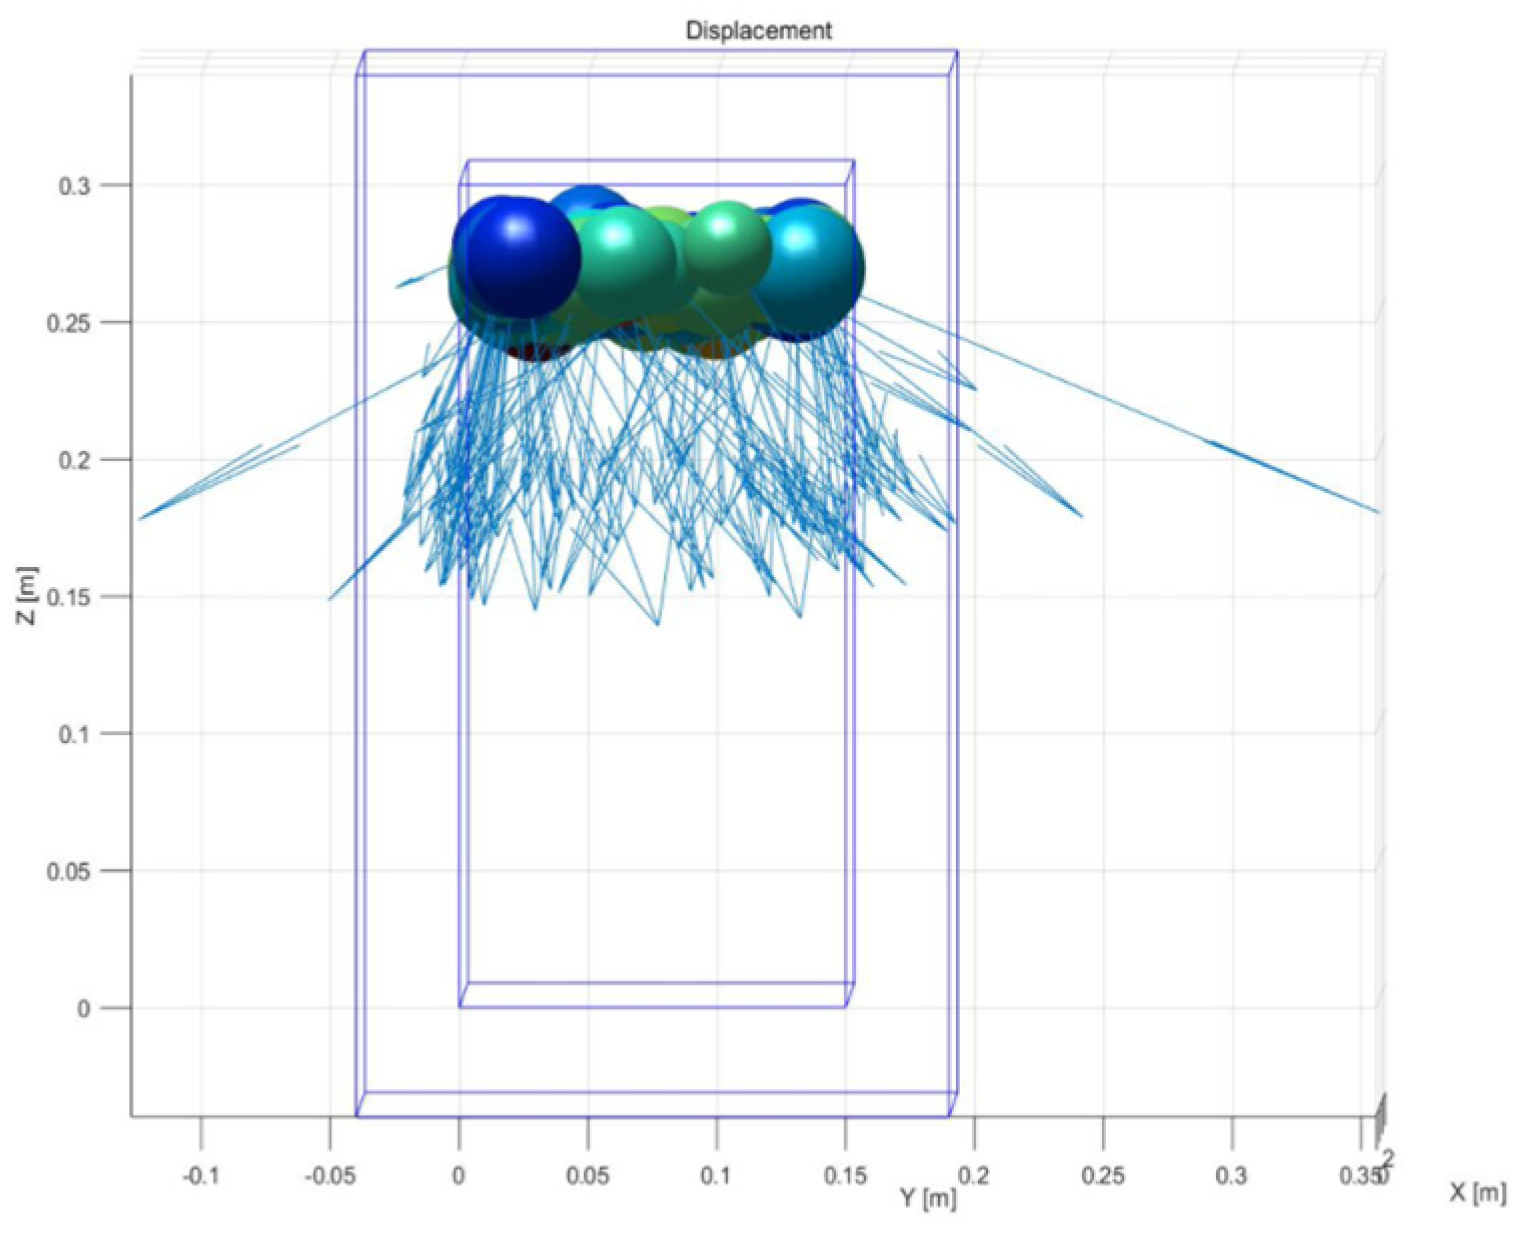
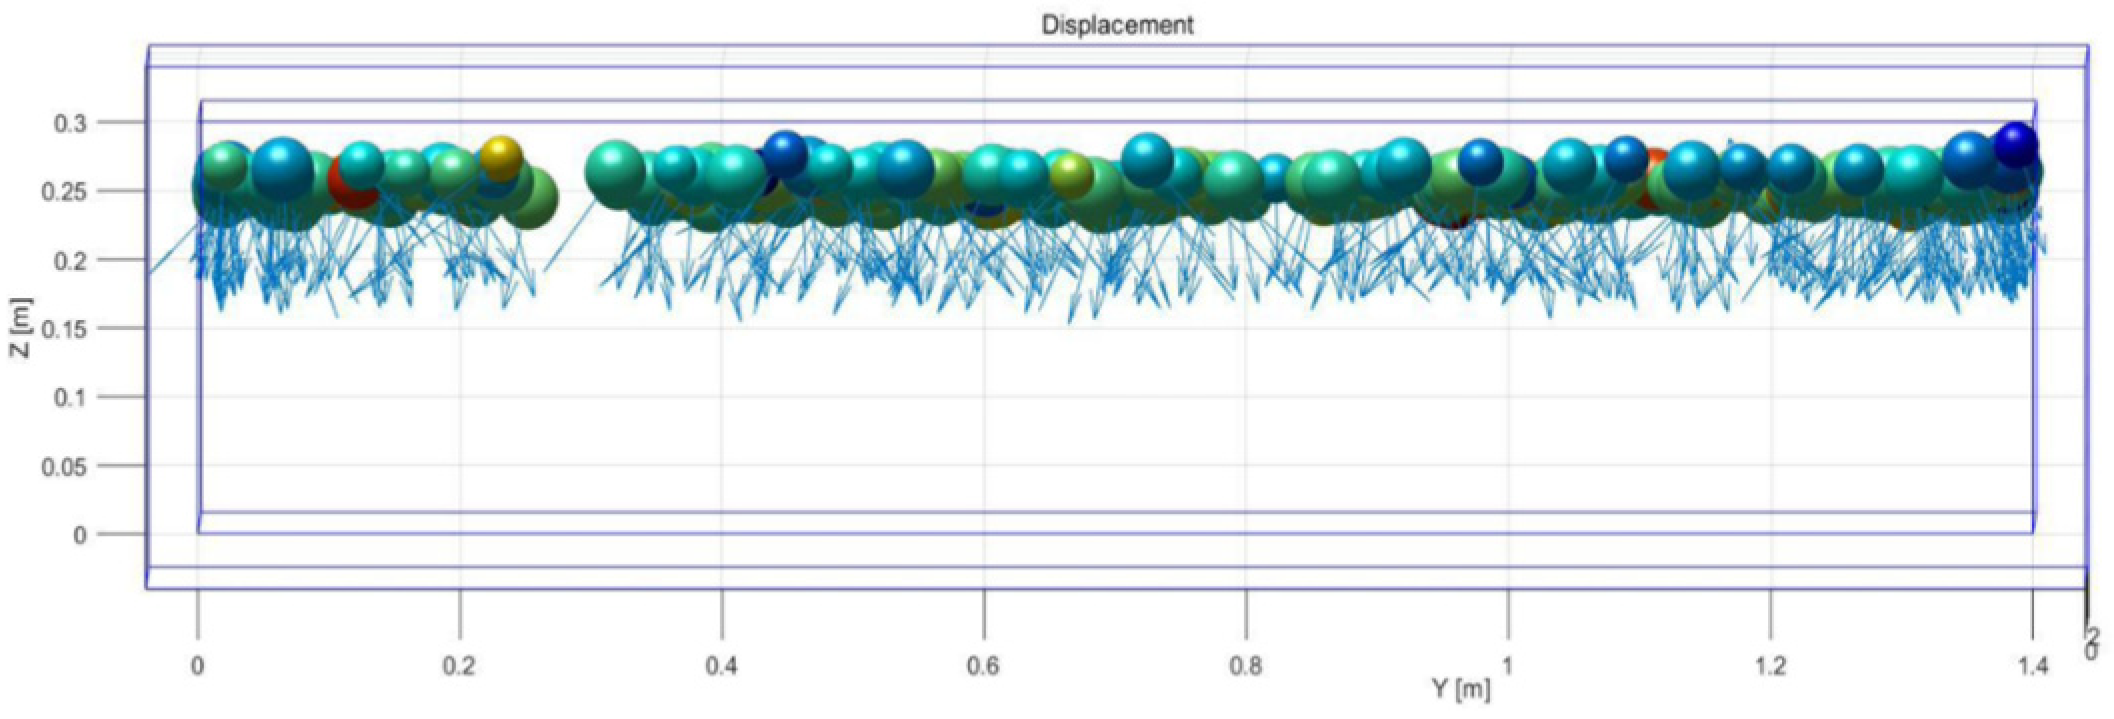
The 2D model confines the simulation domain to a narrow space, limiting particle deformation in the third dimension. Specific manifestations are illustrated in Figure 16 and Figure 17.
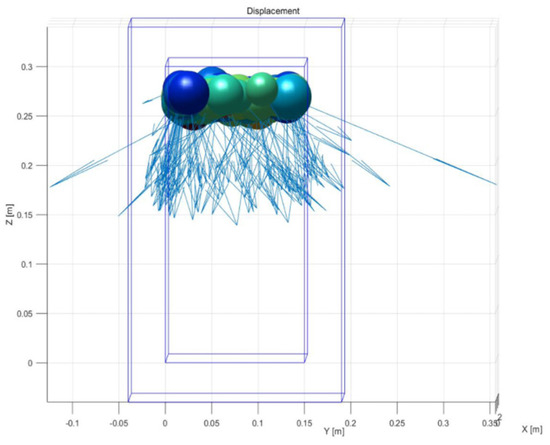
Figure 16.
Two-dimensional displacement vector diagram of loosely laid 20 cm soil sample during compaction.
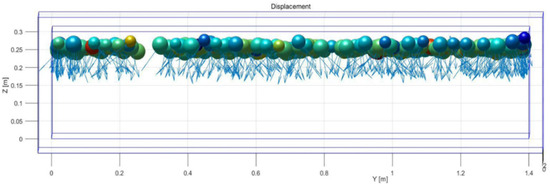
Figure 17.
Three-dimensional displacement vector diagram of loosely laid 30 cm soil sample during compaction.
(1) The displacement vector diagrams reveal that during actual compaction, soil undergoes significant lateral displacement and extrusion alongside vertical compression. The 2D model constrains this lateral deformation, preventing soil from “escaping” laterally under load, as it does in reality. Consequently, the soil is forced to bear higher vertical compressive stress, resulting in simulated settlement values that are generally lower than the experimental values.
(2) This study simplifies real-world irregular, angular soil particles into perfect spherical particles. While this simplification greatly enhances the computational efficiency, it inevitably introduces deviations in mechanical behavior. The angularity and non-spherical nature of real soil particles significantly enhance inter-particle mechanical interlocking, providing greater shear resistance and deformation resistance [26]. The spherical particle model fails to simulate this effect, leading to a systematic underestimation of the compacted soil strength.
(3) During actual compaction, applied loads drive water migration and redistribution within the soil, causing localized changes in moisture content. This significantly affects the inter-particle lubrication, effective stress, and shear strength [27,28]. The model assumes a uniform and constant moisture content, failing to simulate the softening behavior induced by water movement. Additionally, the hydration reaction of binders is a time-dependent process, with the bond strength continuously increasing over time. The model in this study uses macroscopic parameters to calibrate mechanical properties at a specific moment, but it cannot simulate the time-dependent characteristic of real-time bonding strength enhancement during compaction. This leads to the model underestimating the failure strength of newly formed bonding bonds in the early compaction stage and overestimating the compressibility within the existing bonding framework in the middle and late stages. Consequently, it introduces time-dependent deviations when simulating the effects of compaction for different numbers of passes.
5. Conclusions
(1) Indoor compaction test results indicate that the effectiveness of compaction in solidified saline–alkali soil is jointly determined by the number of compaction passes, the curing agent dosage, and the loose layer thickness. As the number of compaction passes increases, the degree of soil compaction exhibits a typical three-stage variation pattern: rapid rise, gradual increase, and eventual stabilization. The first four passes yield the most significant improvement in compaction degree, exceeding 5.2%, indicating rapid rearrangement of the soil particles and pore compression during the initial compaction phase. After passes 4 to 6, the increase in the degree of compaction slows markedly. Further increases in the pass count offer limited compaction benefits and may even cause particle breakage or structural disturbance due to overcompaction, leading to fluctuations in the degree of compaction. This phenomenon aligns with the variation patterns of compaction curves in classical soil mechanics, indicating an economically optimal range of compaction passes (4–6 passes).
Increasing the solidifying agent dosage significantly improves the soil compaction performance and mechanical response. At all compaction passes, the 25% dosage soil exhibited higher compaction and lower settlement (reduction height), indicating that the solidifying agent not only fills voids but also enhances inter-particle bonding through cementation, thereby increasing the stiffness and deformation resistance of the soil. Additionally, thin-layer placement achieves higher and more uniform compaction than thick layers, attributed to the efficiency of compaction energy transfer: thin soil layers are more readily fully compacted with minimal energy loss, enabling the effective compaction of underlying soil.
(2) Using MatDEM, 2D and 3D discrete element models were successfully established to simulate compaction processes under various conditions. Comparisons with laboratory test data on settlement height and compaction degree revealed excellent agreement between the 3D model simulations and experimental results (error < 5%). The 3D model demonstrated particular advantages in simulating the effects of lateral extrusion and spatial stress distribution. It more accurately reflects the three-dimensional stress state and particle motion behavior during wheel–soil interaction, making it suitable for the micromechanical interpretation of compaction mechanisms.
Although the 2D model offers significant advantages in terms of its computational efficiency, it exhibits notable deficiencies in quantitative accuracy (with errors around 10%). Due to its inability to reflect the soil’s true three-dimensional constraints and lateral deformation, the 2D model generally underestimates settlement values, and its compaction degree also deviates from the experimental results. However, the 2D model still holds some reference value for qualitative trend analysis.
(3) This study employed a “trial–simulation” approach to confirm the effectiveness and applicability of MatDEM in simulating the compaction process of solidified saline–alkali soils, particularly highlighting the advantages of 3D models in explaining micromechanical mechanisms. Nevertheless, this study has certain limitations: First, the numerical model still simplifies complex behaviors such as particle shape and cementation failure. Second, the current model does not fully account for the coupled effects of moisture migration and solidification reaction processes on the compaction process. Future studies could further incorporate multi-field coupling models and extend this research to more complex engineering scenarios such as dynamic compaction and non-uniform soils.
Author Contributions
M.W. and R.W. were responsible for conceptualization; validation; writing—original draft preparation and writing—review and editing. M.W. was responsible for methodology; formal analysis and visualization. R.W. was responsible for software; investigation and data curation. J.G. was responsible for supervision. M.W. and R.W. contributed equally to this work and should be considered co-first authors. All authors have read and agreed to the published version of the manuscript.
Funding
This research was funded by Jilin Provincial Science and Technology Development Program “Optimization and Application Technology of Channel Structures Based on Ecological Solidification Technology for Saline-Alkali Soils (Project No.: 20210202010NC)”.
Data Availability Statement
The data presented in this study are available on request from the corresponding author.
Acknowledgments
The author acknowledges the assistance provided by Zhicheng Zuo and Sihai Yu during the experiments, and thanks Ming Li for his support in project management and funding. The author also extends gratitude to other faculty members and staff for their contributions.
Conflicts of Interest
The authors declare no conflicts of interest.
References
- Lei, S.; Jia, X.; Zhao, C.; Shao, M. A review of saline-alkali soil improvements in China: Efforts and their impacts on soil properties. Agric. Water Manag. 2025, 317, 109617. [Google Scholar] [CrossRef]
- Wei, Y.; Jiao, L.; Zhang, P.; Liu, F.-D.; Xiao, H.; Dong, Y.-C.; Sun, H.-W. Research and application progress of biochar in amelioration of saline-alkali soil. Huanjing Kexue 2024, 45, 940–951. [Google Scholar] [PubMed]
- He, L.; Luo, Y. Effects of long-term sand mixing ameliorating measures on soil salinity characteristics of saline-alkali land in northern Shaanxi. IOP Conf. Ser. Earth Environ. Sci. 2021, 781, 022084. [Google Scholar] [CrossRef]
- Song, Y.; Gao, M.; Li, Z. Impacts of straw return methods on crop yield, soil organic matter, and salinity in saline-alkali land in North China. Field Crops Res. 2025, 322, 109752. [Google Scholar] [CrossRef]
- Acquah, K.; Chen, Y. Discrete element modelling of soil pressure under varying number of tire passes. J. Terramech. 2023, 107, 23–33. [Google Scholar] [CrossRef]
- Sun, W.; Xie, Q.; Li, H.; Chen, J.; Wu, K. A dynamic assessment of rubber–sand mixtures as subgrade materials during vibratory roller compaction through DEM simulation in 2D. Sustainability 2023, 15, 14238. [Google Scholar] [CrossRef]
- Ma, Z.; Dang, F.; Liao, H. Numerical study of the dynamic compaction of gravel soil ground using the discrete element method. Granular Matter 2014, 16, 881–889. [Google Scholar] [CrossRef]
- Jing, H.; Gou, M.; Song, L. Discrete element simulation of bending deformation of geogrid-reinforced macadam base. Teh. Vjesn. Tech. Gaz. 2021, 28, 230–239. [Google Scholar]
- Chen, Y.; Zhang, Y.; Wang, L.; Wang, S.; Tian, D.; Zhang, L. Influencing factors, deformation mechanism and failure process prediction for reservoir rock landslides: Tanjiahe landslide, Three Gorges Reservoir Area. Front. Earth Sci. 2022, 10, 974301. [Google Scholar] [CrossRef]
- Jin, K.; Xing, A.; Li, B.; He, K.; Zhuang, Y.; Chang, W. Dynamic fragmentation characteristics of columnar rockfall: Insights from discrete element method. Bull. Eng. Geol. Environ. 2023, 82, 322. [Google Scholar] [CrossRef]
- Bu, X.; Liu, F.; Chen, L.; Li, S.; Yang, J.; Li, Y. Analysis of the failure process of the Leidashi landslide based on MatDEM, in Chengdu, Sichuan Province, China. In Proceedings of the Fourth International Conference on Geoscience and Remote Sensing Mapping, Chengdu, China, 6 August 2019; State Grid Sichuan Electric Power Company (China); State Grid Sichuan Integrated Energy Co., Ltd.: Chengdu, China, 2023. [Google Scholar]
- Liu, C.; Xu, Q.; Shi, B.; Deng, S.; Zhu, H. Mechanical properties and energy conversion of 3D close-packed lattice model for brittle rocks. Comput. Geosci. 2017, 103, 12–20. [Google Scholar] [CrossRef]
- Liu, Y.; Zhang, D.; Wang, G.Y.; Liu, C.; Zhang, Y. Discrete element method-based prediction of areas prone to buried hill-controlled earth fissures. J. Zhejiang Univ.-Sci. A 2019, 20, 794–803. [Google Scholar] [CrossRef]
- Chen, Z.; Song, D. Numerical investigation of the recent Chenhecun landslide (Gansu, China) using the discrete element method. Nat. Hazards 2020, 105, 717–733. [Google Scholar] [CrossRef]
- Song, D.; Quan, X.; Liu, M.; Liu, C.; Liu, W.; Wang, X.; Han, D. Investigation on the Seismic Wave Propagation Characteristics Excited by Explosion Source in High-Steep Rock Slope Site Using Discrete Element Method. Sustainability 2022, 14, 17028. [Google Scholar] [CrossRef]
- Zhu, J.; Li, W.; Li, D.; Wang, Q.; Li, X. Failure characteristics of weakly cemented overburden strata and compaction response behavior of caving materials in shadow buried panels: A study in Western China. Results Eng. 2025, 26, 105580. [Google Scholar] [CrossRef]
- GB/T 50123-2019; Standard for Geotechnical Testing Method. Ministry of Housing and Urban-Rural Development of the People’s Republic of China: Beijing, China; China Planning Press: Beijing, China, 2019.
- DB22/T 3506-2023; Technical Code of Practice for Solidification Treatment of Saline-Alkali Riverbanks and Canal Slopes. Jilin Provincial Department of Water Resources: Changchun, China; Jilin Water Resources Survey and Design Review Station: Changchun, China, 2023.
- Liu, C.; Liu, H.; Zhang, H. MatDEM-fast matrix computing of the discrete element method. Earthq. Res. Adv. 2021, 1, 100010. [Google Scholar] [CrossRef]
- Liu, Z.; Fan, C.; Min, Y.; Liu, C.; Li, S.; Li, Y.; Liang, X. An experimental and numerical investigation of influencing factors of gravel vibratory compaction. Constr. Build. Mater. 2025, 473, 141084. [Google Scholar] [CrossRef]
- Huang, Y.; Chen, W. Influence of fractal fabric on the shear characteristics of large scale accumulation bodies. Sci. Rep. 2025, 15, 7835. [Google Scholar] [CrossRef]
- Xiao, L.; Meng, Q.; Lv, S.; Yao, T.; Liao, Y. Numerical investigation of ground reinforced embankments: Structural geometry design. Geotext. Geomembr. 2025, 53, 780–797. [Google Scholar] [CrossRef]
- Yu, H.; Liu, Z.; Tang, Y.; Deng, Y.; Luo, T. Discrete element simulation of shallow soil landslides with weak interlayer due to the mechanism of unsaturated seepage. Bull. Eng. Geol. Environ. 2025, 84, 129. [Google Scholar] [CrossRef]
- Li, Q.; Wang, Y.; Hou, D.; Jiang, S.; Gong, B.; Li, X. Simulating the failure mechanism of high-slope angles under rainfall-mining coupling using MatDEM. Water 2025, 17, 414. [Google Scholar] [CrossRef]
- Xia, W.; Liu, C.; Liu, H.; Zhao, T.; Zhu, Y. Modeling of particle migration in piping based on an improved discrete element method. Rock Mech. Bull. 2025, 4, 100151. [Google Scholar] [CrossRef]
- Baghbani, A.; Costa, S.; Lu, Y.; Soltani, A.; Abuel-Naga, H.; Samui, P. Effects of particle shape on shear modulus of sand using dynamic simple shear testing. Arab. J. Geosci. 2023, 16, 422. [Google Scholar] [CrossRef]
- Yuan, K.; Ni, W.; Lü, X.; Wang, H.; Nie, Y.; Della Vecchia, G. Loess compaction at different water contents: Effects on hydraulic conductivity, compression behavior, microstructure, and water distribution. J. Rock Mech. Geotech. Eng. 2025, 17, 5307–5317. [Google Scholar] [CrossRef]
- Liu, C.; Shi, B.; Gu, K.; Zhang, T.; Tang, C.; Wang, Y.; Liu, S. Negative pore water pressure in aquitard enhances land subsidence: Field, laboratory, and numerical evidence. Water Resour. Res. 2022, 58, e2021WR030085. [Google Scholar] [CrossRef]
Disclaimer/Publisher’s Note: The statements, opinions and data contained in all publications are solely those of the individual author(s) and contributor(s) and not of MDPI and/or the editor(s). MDPI and/or the editor(s) disclaim responsibility for any injury to people or property resulting from any ideas, methods, instructions or products referred to in the content. |
© 2025 by the authors. Licensee MDPI, Basel, Switzerland. This article is an open access article distributed under the terms and conditions of the Creative Commons Attribution (CC BY) license (https://creativecommons.org/licenses/by/4.0/).

