3.1. Characteristics of Shock-Wave Load Curve in the Straight Tunnel
Under different working conditions, the contour of the overpressure time-history curve in a straight tunnel remains consistent. The arrival time of the shock wave at each measuring point is directly proportional to its distance from the tunnel entrance. Furthermore, due to the influence of aluminized explosives, the overpressure waveform in the straight tunnel exhibits markedly distinct characteristics near the explosion source compared to that of TNT. Relevant studies have demonstrated that the afterburning effect of aluminum powder primarily alters the shock-wave waveform within the near-explosion region [
16].
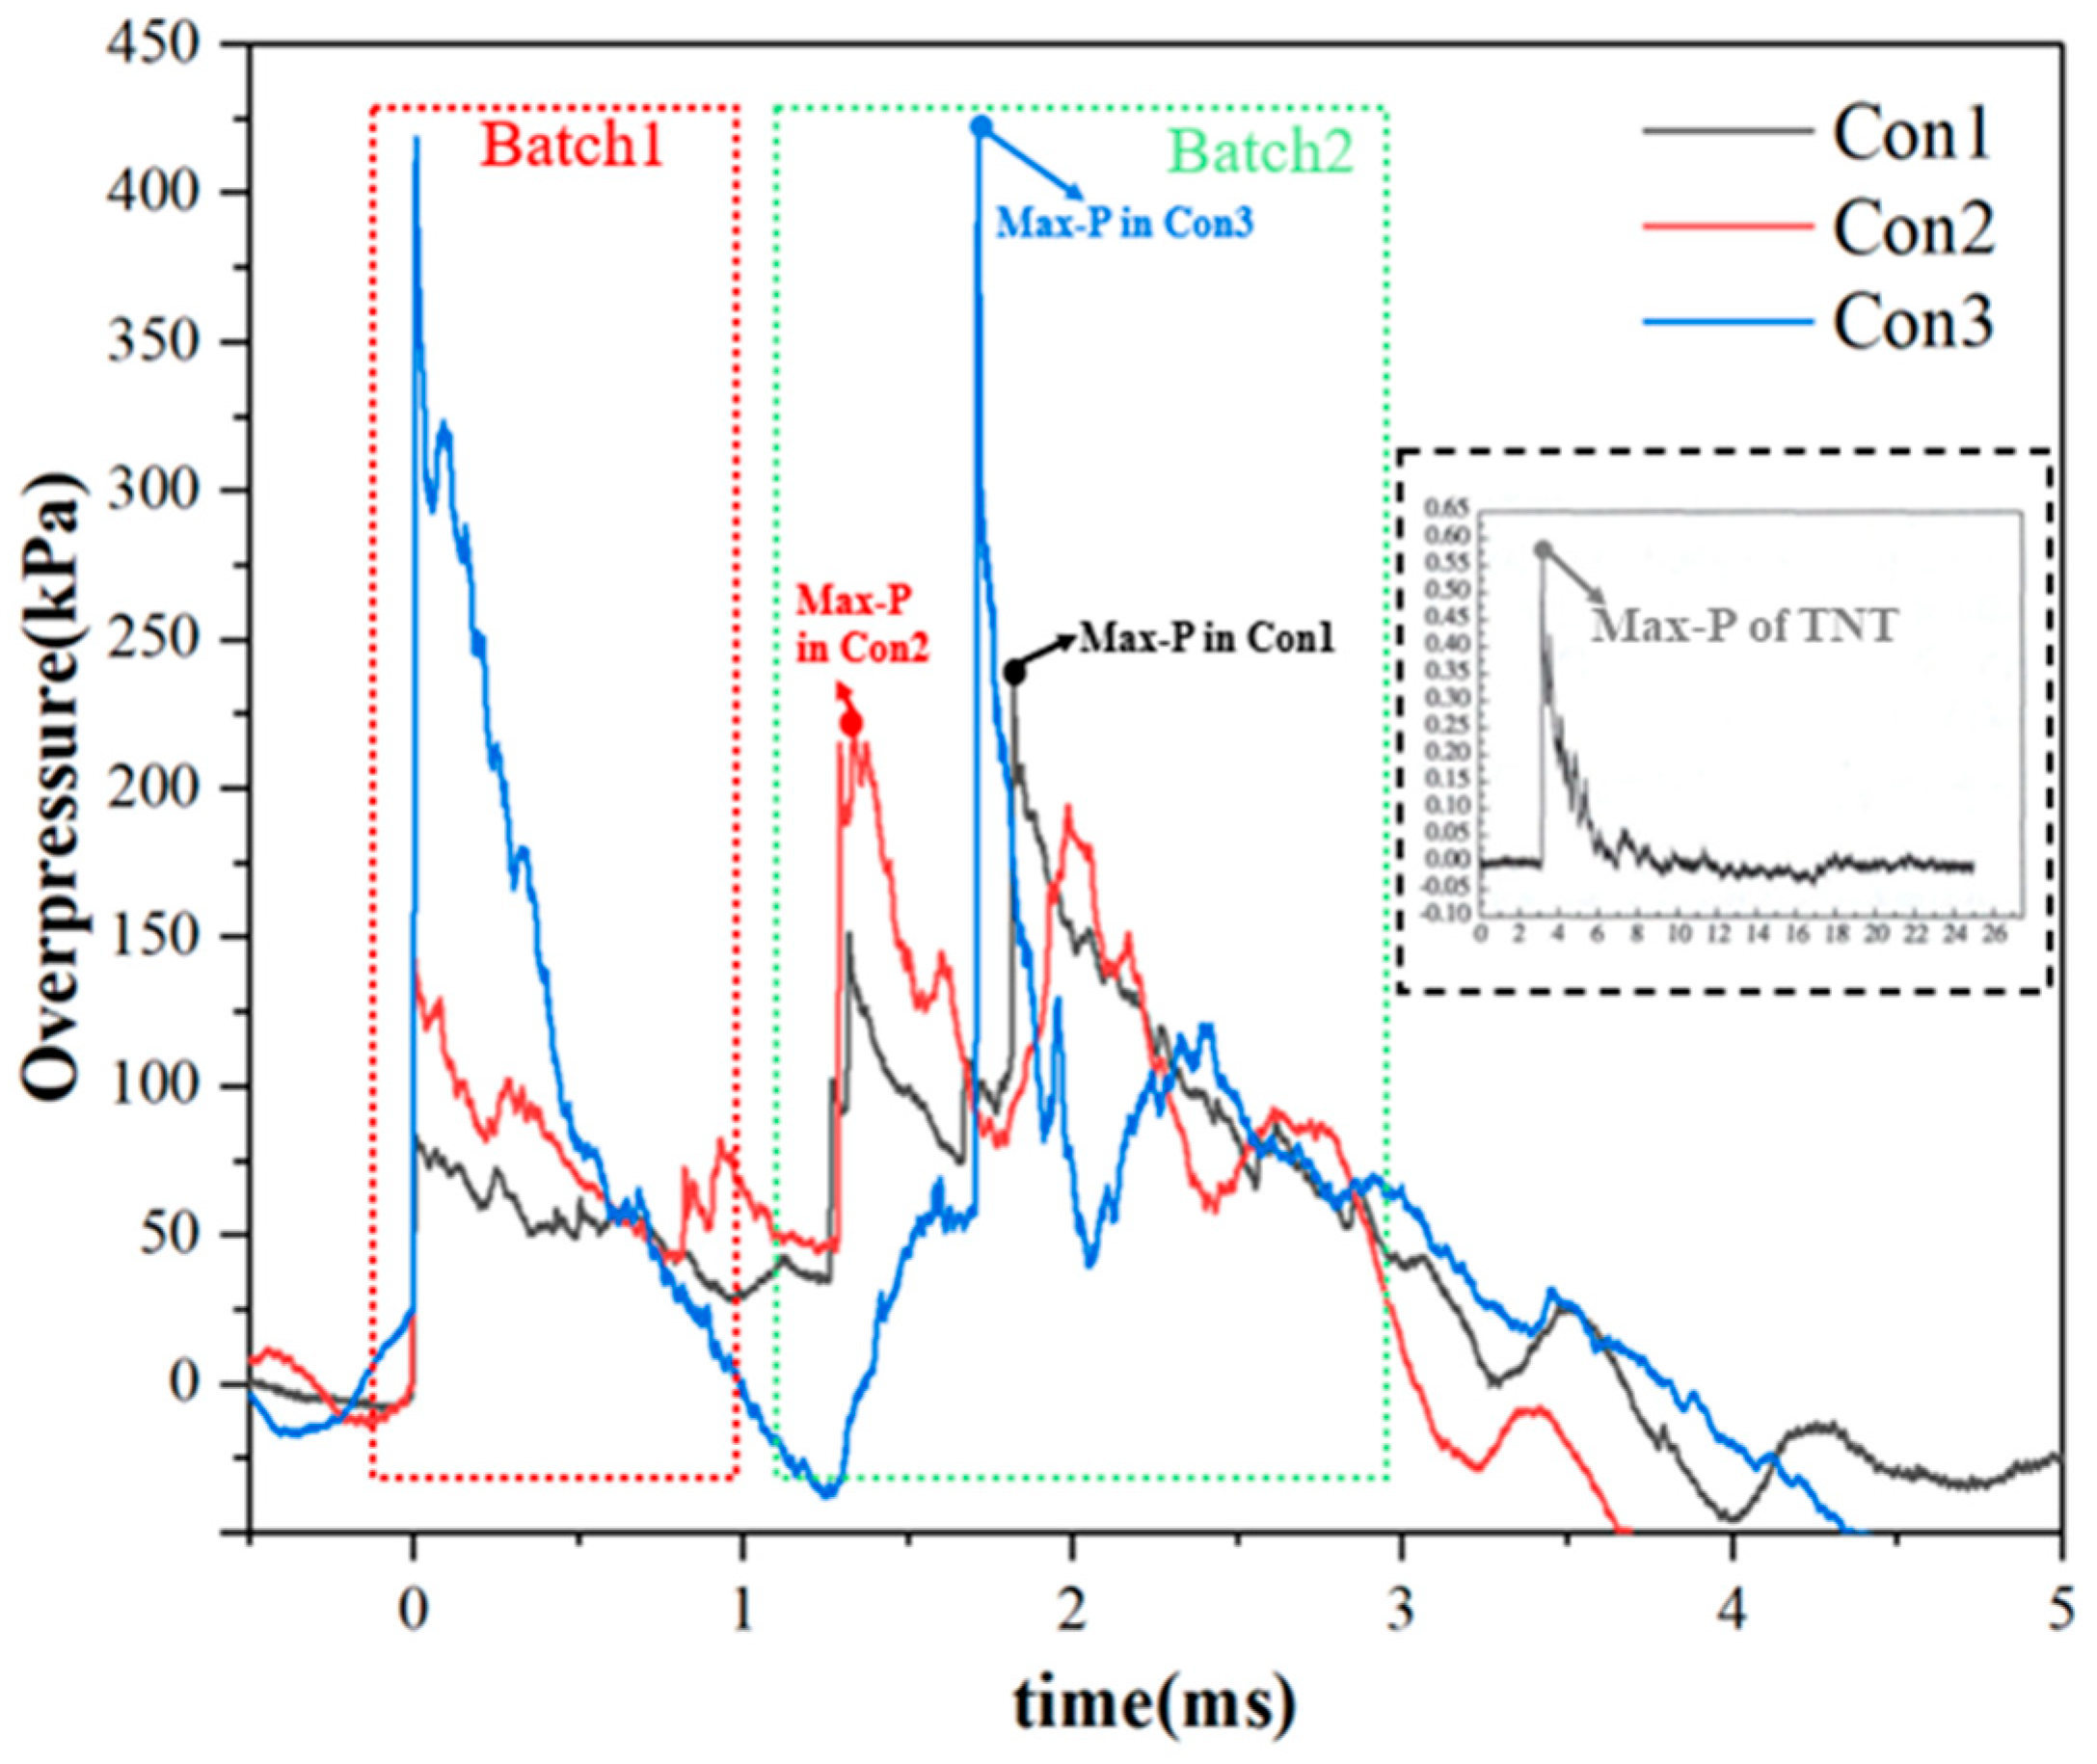
Figure 3 illustrates the overpressure time history curve at measurement point A1. Due to the combustion of metal powder, the overpressure curve waveform is distinctly divided into two batches. In the first batch, the waveform exhibits a triangular shape, with pressure rising sharply to the first peak before rapidly declining. Under Condition 3 (Con3), the explosion center is located at −1 m, relatively close to the measurement point, causing the pressure to drop to negative values. In the second batch, the curve waveforms under Conditions 1 and 2 (Con1 and Con2) display multi-peak characteristics. The maximum overpressure peaks occur at the second peak of the first batch and the first peak of the second batch, with respective peak values of 235 kPa and 219 kPa. For Con3, the overpressure curve rises steeply to its peak and then declines sharply. The maximum overpressure peak occurs at the first peak of the second batch, with a peak value of 418.6 kPa.
The small figure in
Figure 3 illustrates the overpressure time-history curve of the shock wave generated by TNT explosive at a distance of 3.75 m from the tunnel entrance [
21]. A comparison reveals that, unlike the triangular waveform characteristic of the TNT explosive overpressure curve, the overpressure curve of aluminized explosives is distinctly divided into two batches. Notably, under all three working conditions, the overpressure peaks are located in the second batch. Furthermore, by comparing the second-batch curves of Con2 and Con3, it can be observed that the explosion of aluminized explosives generates two prominent triangular waves. During propagation, the triangular waves in the second batch evolve into rectangular waves with two distinct peaks.
Figure 4 presents the overpressure time-history curves of measuring points A2 through A5 in the straight tunnel. From the figure, it can be observed that the overpressure waveform of the shock wave propagating in the tunnel varies systematically with time.
At the A2 measurement point, the overpressure curves under the three working conditions exhibit triangular waveforms, with peak magnitudes of 228 kPa, 406 kPa, and 389 kPa, respectively. At this measurement point, the shock wave is influenced by the enclosed space of tunnel, resulting in multiple reflections off the wall surfaces. These reflections interact, leading to mutual superposition and interference. Consequently, at the A3 measurement point, the overpressure curve waveform displays characteristics of multiple peaks, an extended positive pressure duration, a reduced magnitude of the overpressure peak, and the maximum peak occurring at the final wave peak, followed by a continuous decrease in overpressure.
With the multiple reflections of the shock wave on the tunnel wall, the initially complex shock wave gradually evolves into a plane wave. According to existing studies, the distance required for the formation of a plane wave is approximately 3 to 5 times the equivalent roadway diameter [
24].
The measuring points A4 and A5 are located on the cross-section 20 m from the tunnel entrance, and the waveforms at these measurement points exhibit regular triangular patterns. The A5 measuring point is located on the floor of the tunnel, near the main tunnel entrance. Under the three working conditions, the overpressure response was first detected at the A5 measuring point, followed by the response at the A4 measuring point. The overpressure curve at the A4 measurement point exhibits a triangular wave shape, characterized by a prolonged positive pressure duration and a lower peak overpressure compared to the A5 measurement point. As the shock wave propagates through the T-shaped junction into the main tunnel, the positive pressure duration at the A5 measurement point decreases substantially relative to that at A4. Furthermore, under all working conditions, the positive pressure duration remains below 0.4 ms.
By comparing the overpressure curves at measuring points A4 and A5 under various working conditions, it is evident that the variation pattern of the overpressure time-history curve remains consistent when the explosive shock wave from an aluminized explosive reaches the T-shaped port. Changes in the detonation point and equivalent properties only influence the arrival time and peak pressure of the shock wave at the distal end of the explosion channel. The first peak overpressure and the maximum peak overpressure at each measuring point for the shock wave of an aluminized explosive explosion propagating in a straight tunnel are presented in
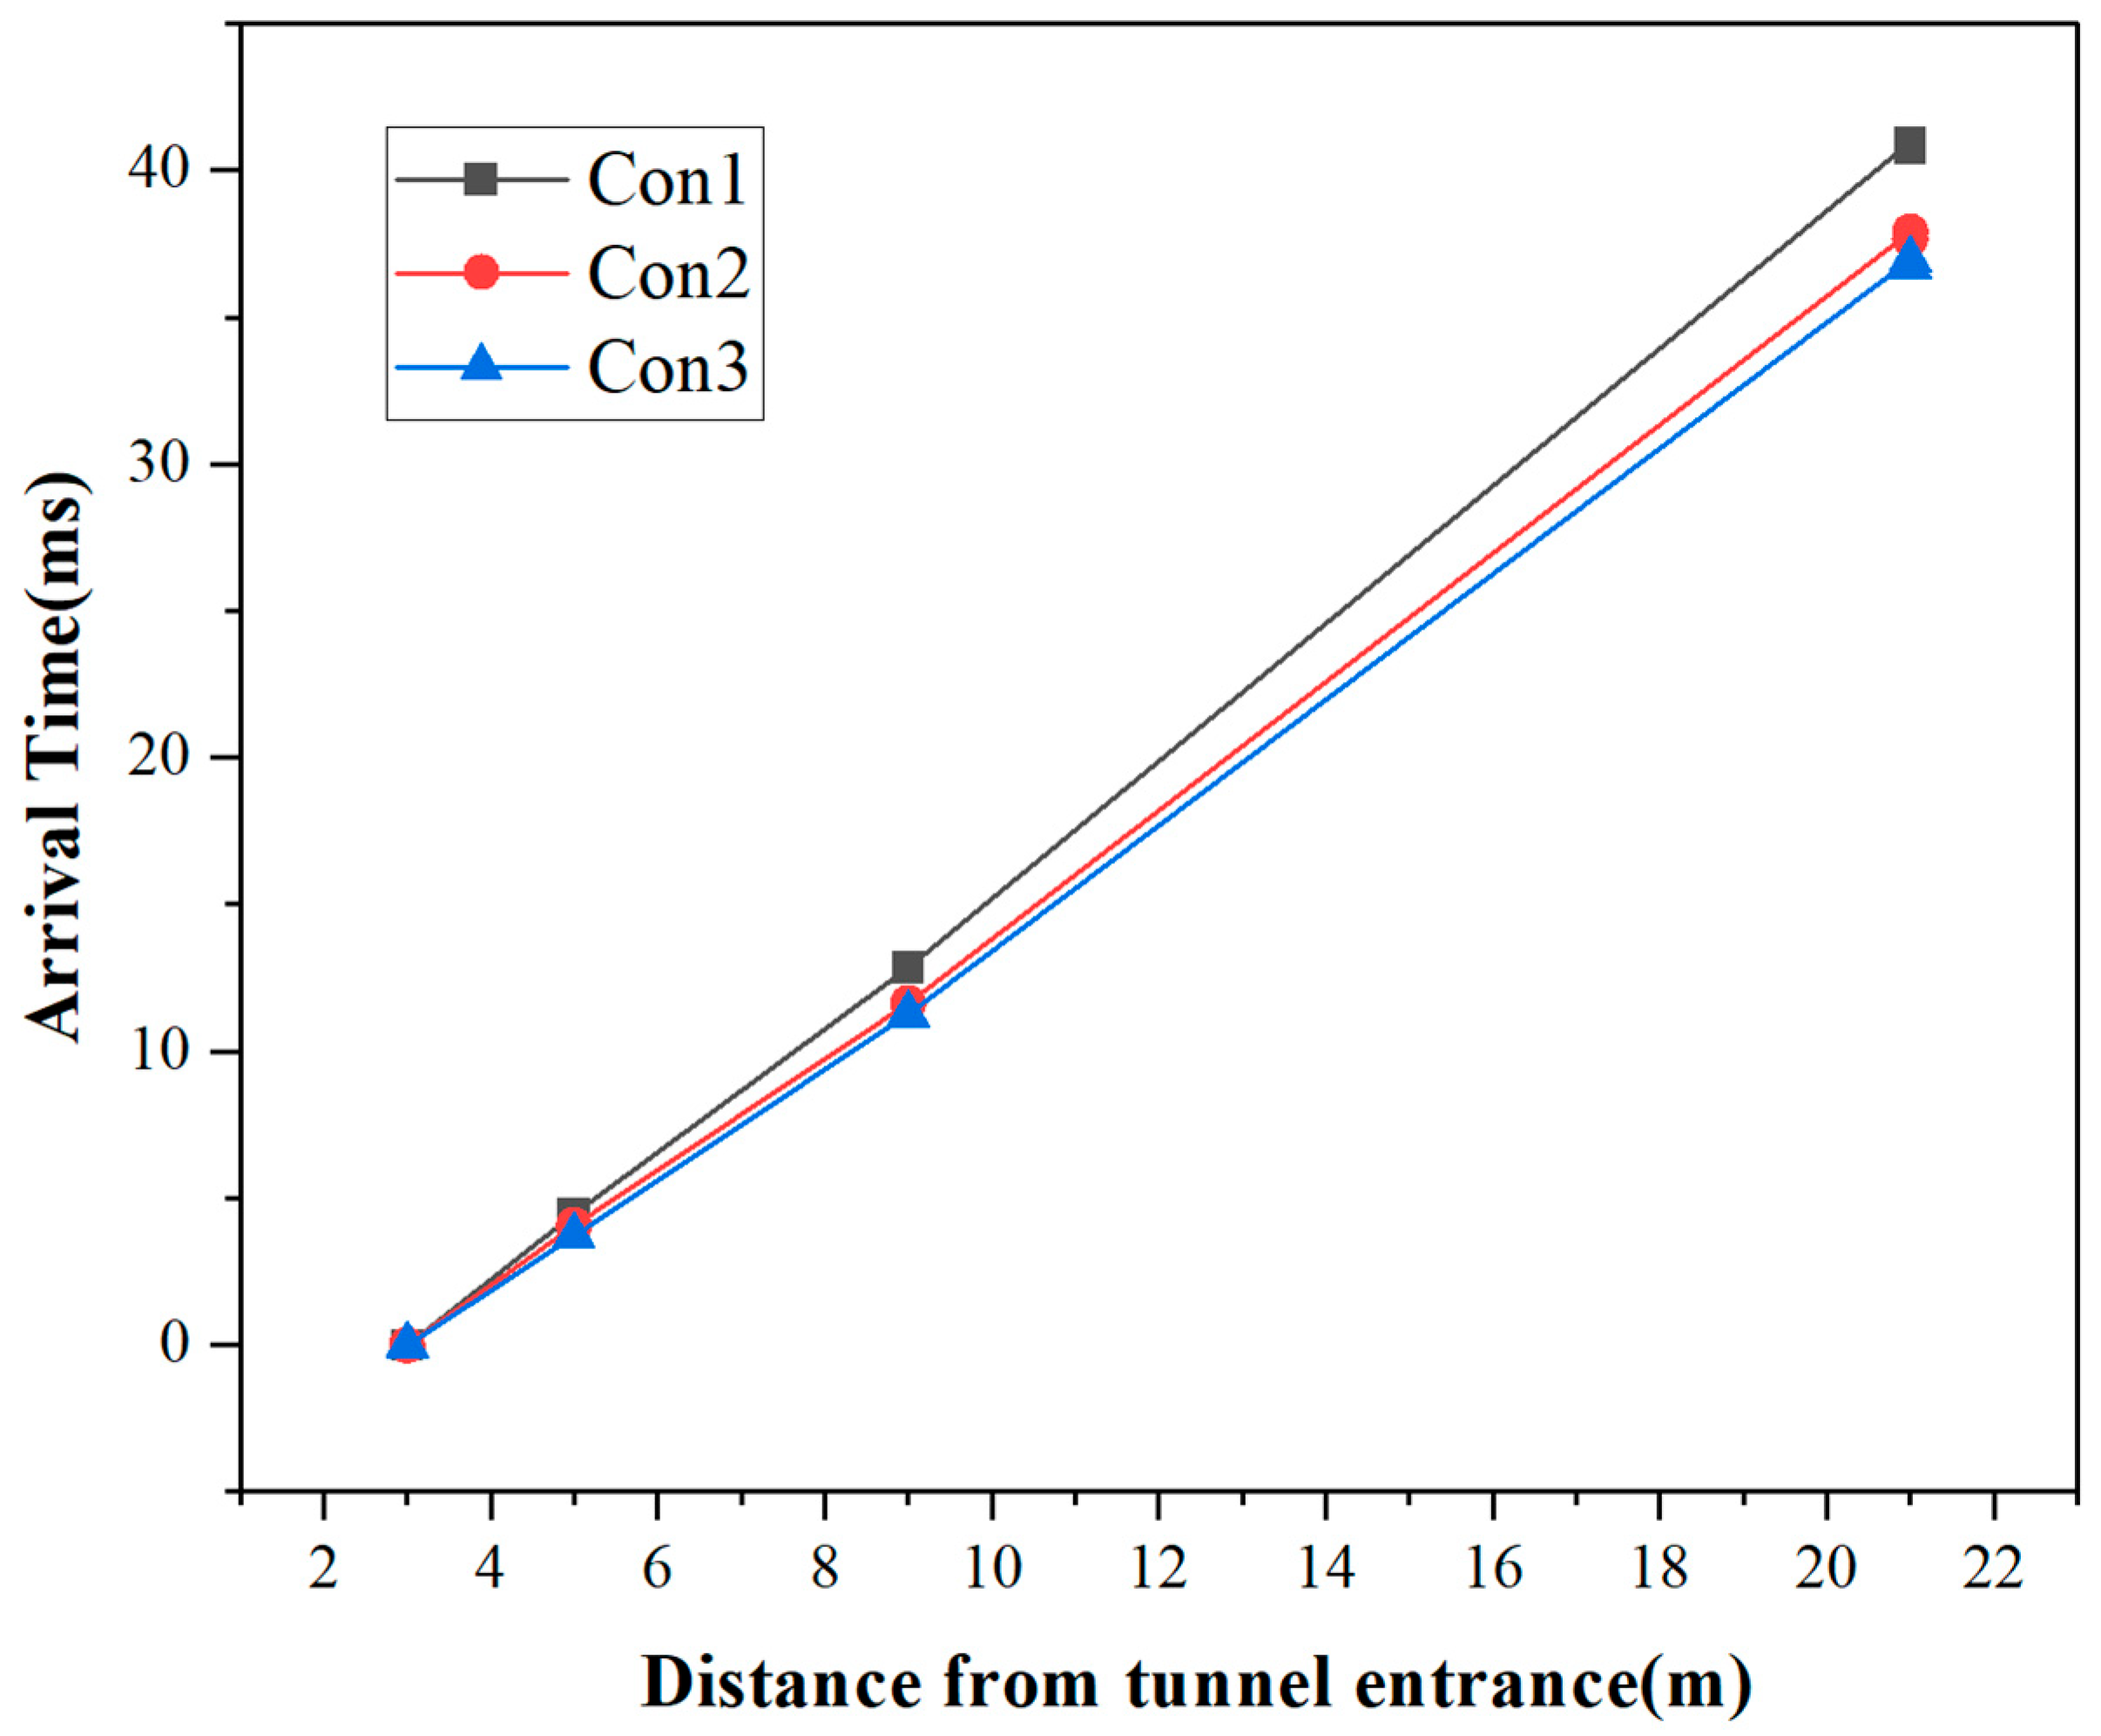
Figure 5. As the shock wave propagates through the straight tunnel, the overall peak overpressure of the shock wave continuously attenuates, the waveform of the overall overpressure curve progressively approaches a stable triangular shape, and the first peak and the maximum peak of the shock wave gradually converge. At measuring points A4 and A5, the first response peak corresponds to the maximum peak overpressure. The comparison of shock-wave arrival times under different working conditions is presented in
Figure 6. The arrival time exhibits a linear relationship with the distance from the measurement point to the tunnel entrance, indicating that the variation in shock-wave propagation speed remains relatively small.
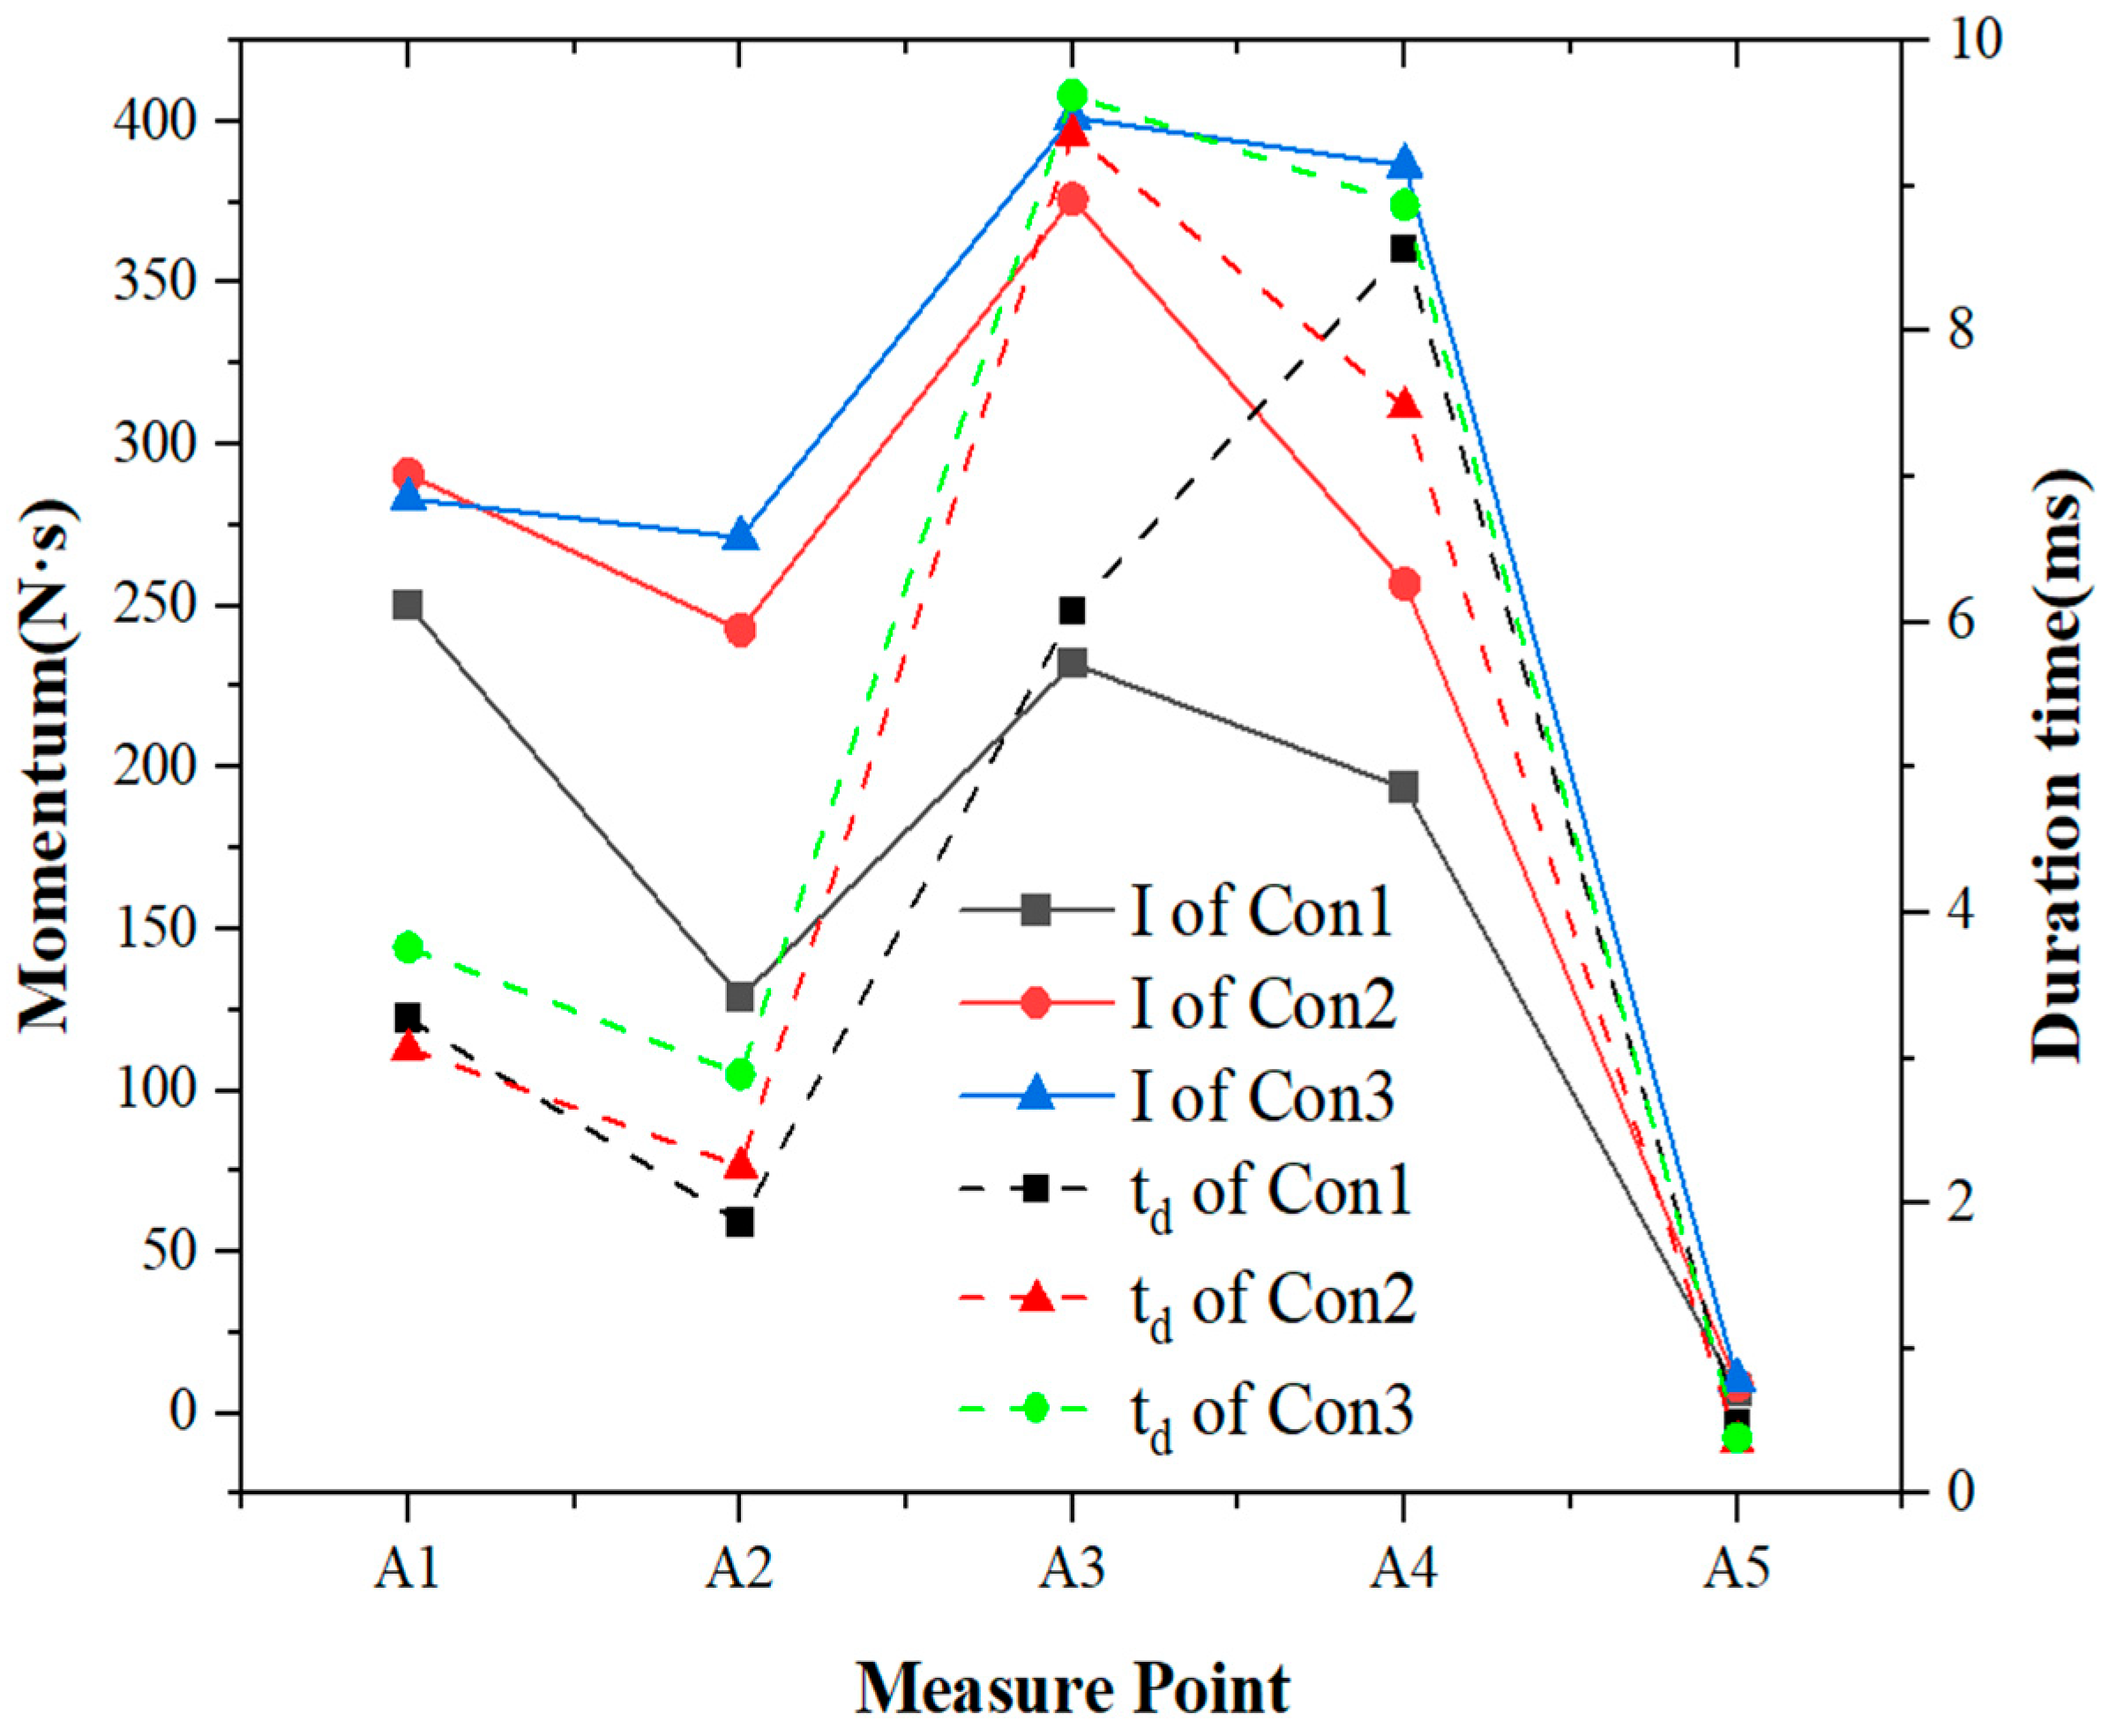
Figure 7 presents the curve graphs of momentum and positive pressure duration at each measuring point under three working conditions. By comparing the variation curves of momentum and positive pressure duration, it can be observed that the overall trends of the two curves are consistent. In conjunction with the feature shown in
Figure 5, where the pressure peaks of each working condition continuously attenuate and converge as the shock wave propagates, it is evident that the positive pressure duration is the primary factor influencing the variation in impulse magnitude along the straight tunnel wall. The influence of the T-shaped junction results in a notable reduction in positive pressure duration at A5, which consequently leads to a significant decrease in the momentum.
3.2. Load Distribution Characteristics on Main Tunnel and Protective Door
The shock wave is influenced by the T-shaped junction, leading to complex reflection and diffraction phenomena. Although there are variations in charge equivalence and explosion center positions, the overpressure time-history curves for each condition in the T-shaped opening exhibit similar patterns.
In the main tunnel, B1, B2, and B3 are three measuring points at the same cross-section. The overpressure time-history curves of them are shown in
Figure 8. According to the characteristics of the overpressure curves, the curves at the three measuring points can all be divided into four batches.
The waveform of the first batch at the B1 measurement point shows a gently varying rectangular shape, with the overpressure peak at the first wave crest. The second batch has a triangular waveform, and the maximum overpressure peak is observed at B1. The overpressure rises rapidly to its peak and then decreases continuously, approaching negative pressure. The third batch arrives with relatively low overall overpressure, showing a rectangular waveform with multiple peaks. The fourth batch also presents a rectangular waveform with multiple peaks.
The first batch of shock-wave overpressure curves at B2 exhibit waveform similarity to those at B1 but with a shorter positive pressure duration. The second batch displays a multi-peak rectangular waveform, with the maximum overpressure peak occurring at the first peak. The third batch consists of two triangular waveforms, with the overpressure peak also at the first peak.
The overpressure curve at B3 for the first shock-wave batch shows two distinct triangular peaks, with the maximum occurring at the first peak. The second batch presents an irregular multi-peak waveform, featuring three prominent peaks. The third batch displays a triangular waveform, with overpressure rising sharply to its peak before declining into negative pressure. The fourth batch exhibits multiple peaks, with the highest overpressure at the first peak.
By analyzing the curve characteristics of the first batch, it is evident that the overpressure waveforms at the three measuring points in the first batch exhibit multi-peak rectangular patterns, with the overpressure peak occurring at the first peak. The overall pressure variation is relatively smooth. By comparing the arrival times of the shock waves at each measuring point for the first batch (as shown in
Figure 9), it can be observed that on the same section, the shock wave first reaches the B1 measuring point on the back blast surface, followed sequentially by the B2 and B3 measuring points. In contrast, for the second batch, the shock waves nearly simultaneously reach the B2 and B3 measuring points first, before subsequently reaching the B1 measuring point.
The third batch of shock waves initially arrived at B3, showing a triangular waveform. At B2, the peak pressure had decreased, and the waveform split into two distinct triangular components. By the time it reached B1, the peak pressure continued to decrease, forming an overall rectangular waveform with multiple peaks. In the fourth batch, the overpressure waveforms at all three measurement points were similar, characterized by rectangular waves with multiple peaks. Comparing the arrival times of the peaks at each point, it can be concluded that the overpressure response in the fourth batch resulted from the reflection of the shock wave at the protective door. The reflected shock waves from the door impacted B1, B2, and B3 nearly simultaneously, causing approximately equal impulses on both the wall and the ground.
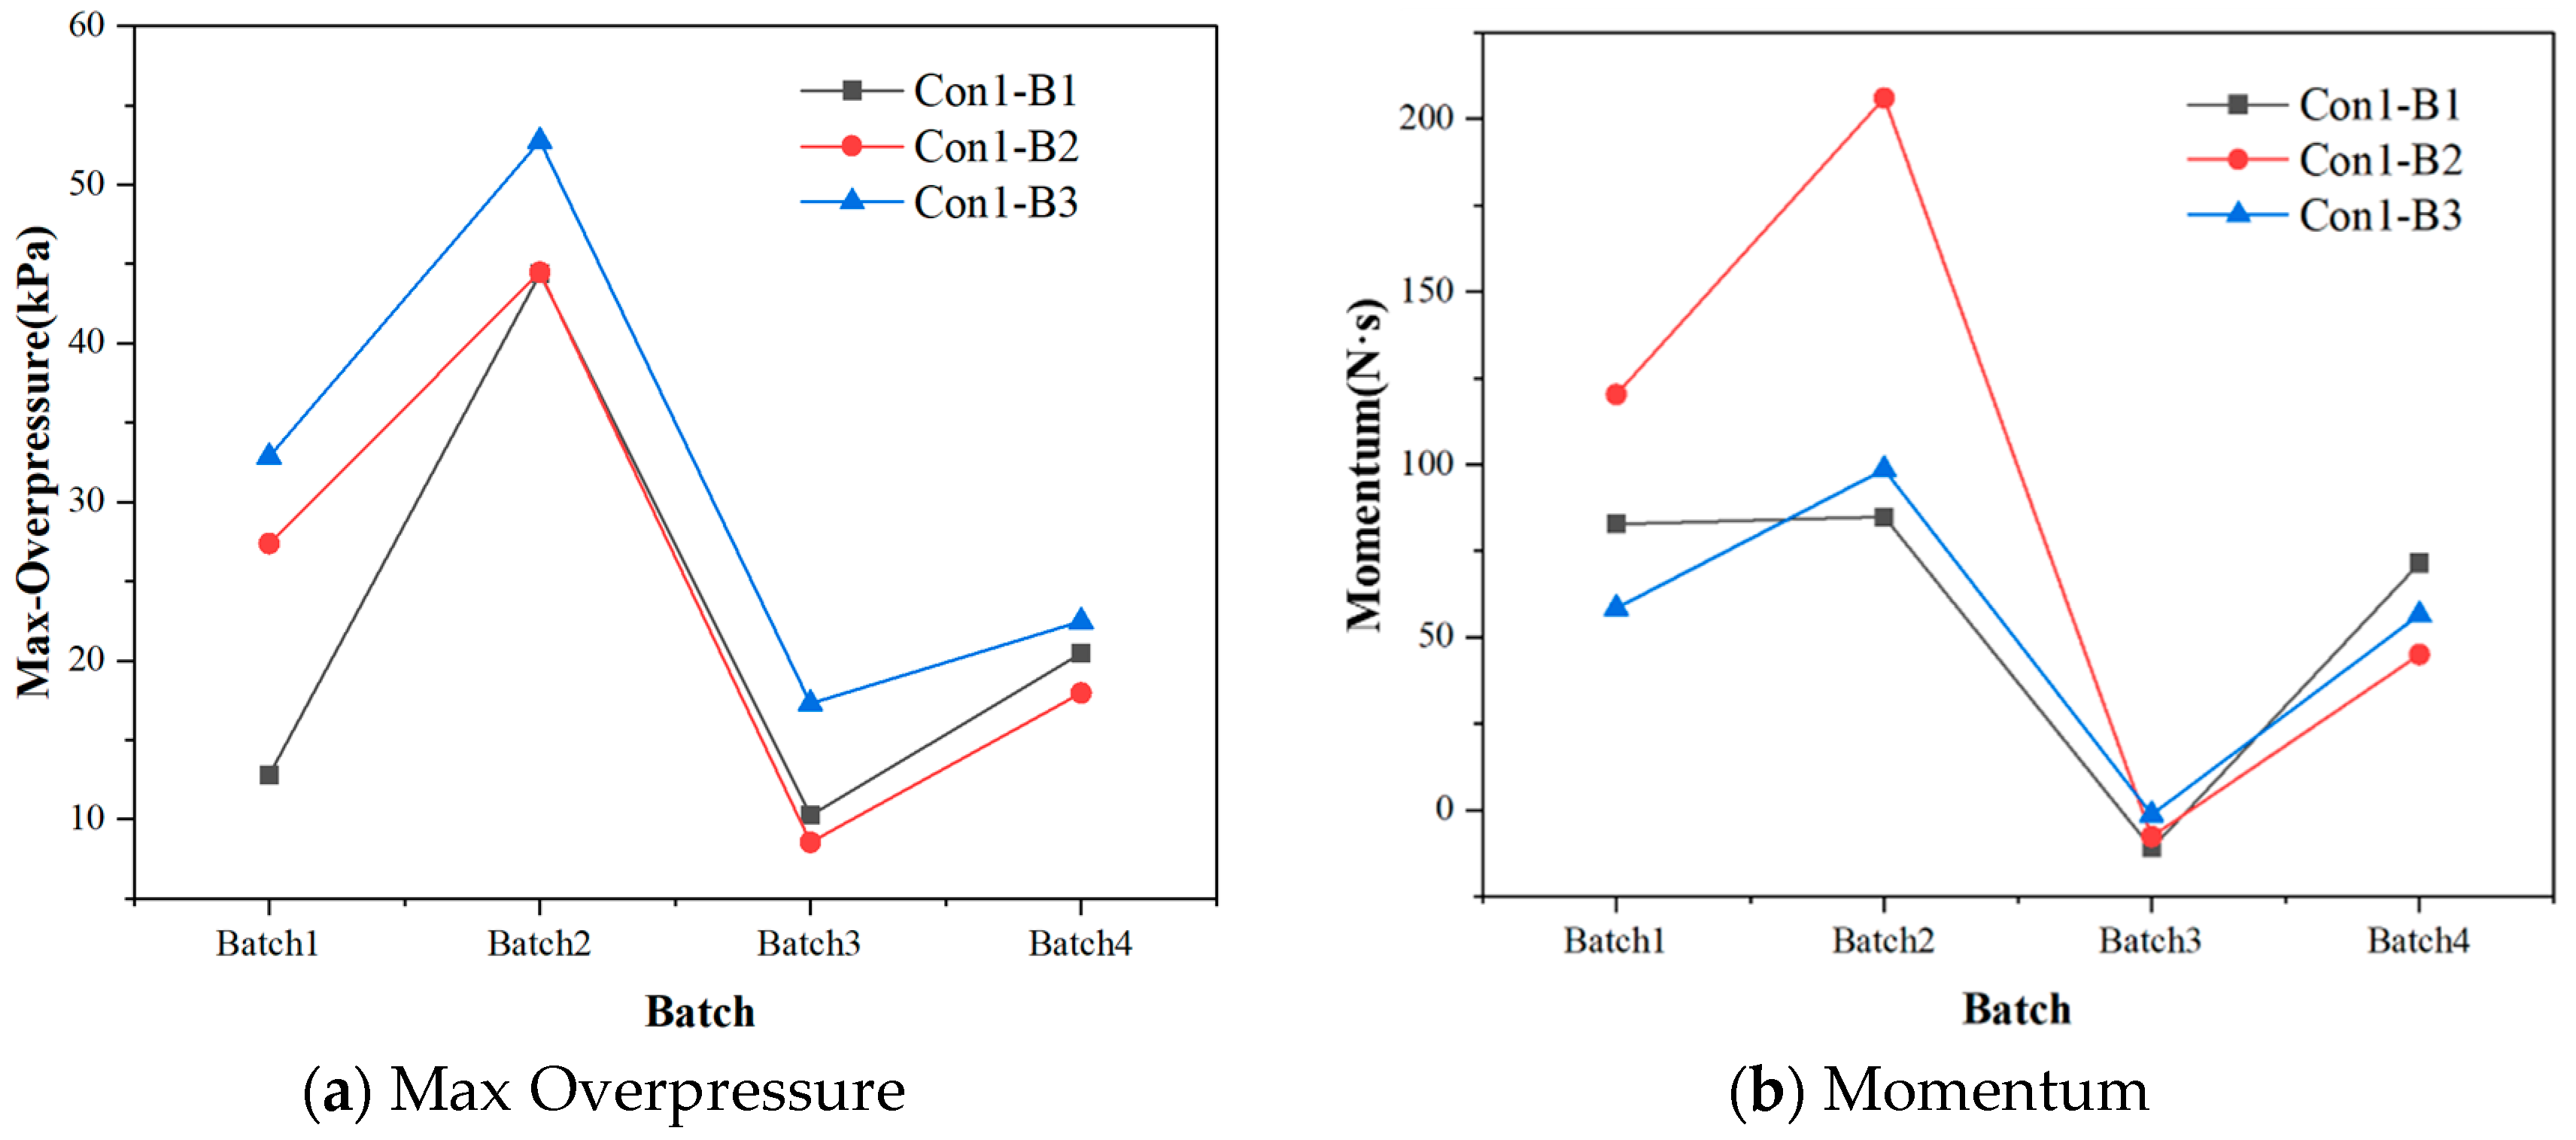
Figure 10 illustrates the curves of peak overpressure and momentum for the four batches in Con1 (with similar patterns observed in Con2 and Con3). It is evident that the ranking of peak overpressure at each measuring point in the first batch, from highest to lowest, is: B3 > B2 > B1. At the B2 measuring point located midway along the tunnel, the momentum values for the first and second batches were significantly higher than those at the other two points due to the influence of the expansion wave. The maximum peak overpressure and momentum at the T-shaped opening both occurred in the second batch as a result of the reflected wave, with the maximum peak overpressure specifically recorded at the B3 measuring point on the blast-facing surface. In the third batch, the peak overpressure and momentum at each measuring point were relatively low, with negative momentum values indicating minimal shock-wave effects. Additionally, the peak overpressure and momentum caused by the reflected shock wave of the fourth batch, generated upon the closure of the protective door, exhibited similar magnitudes across all measuring points.
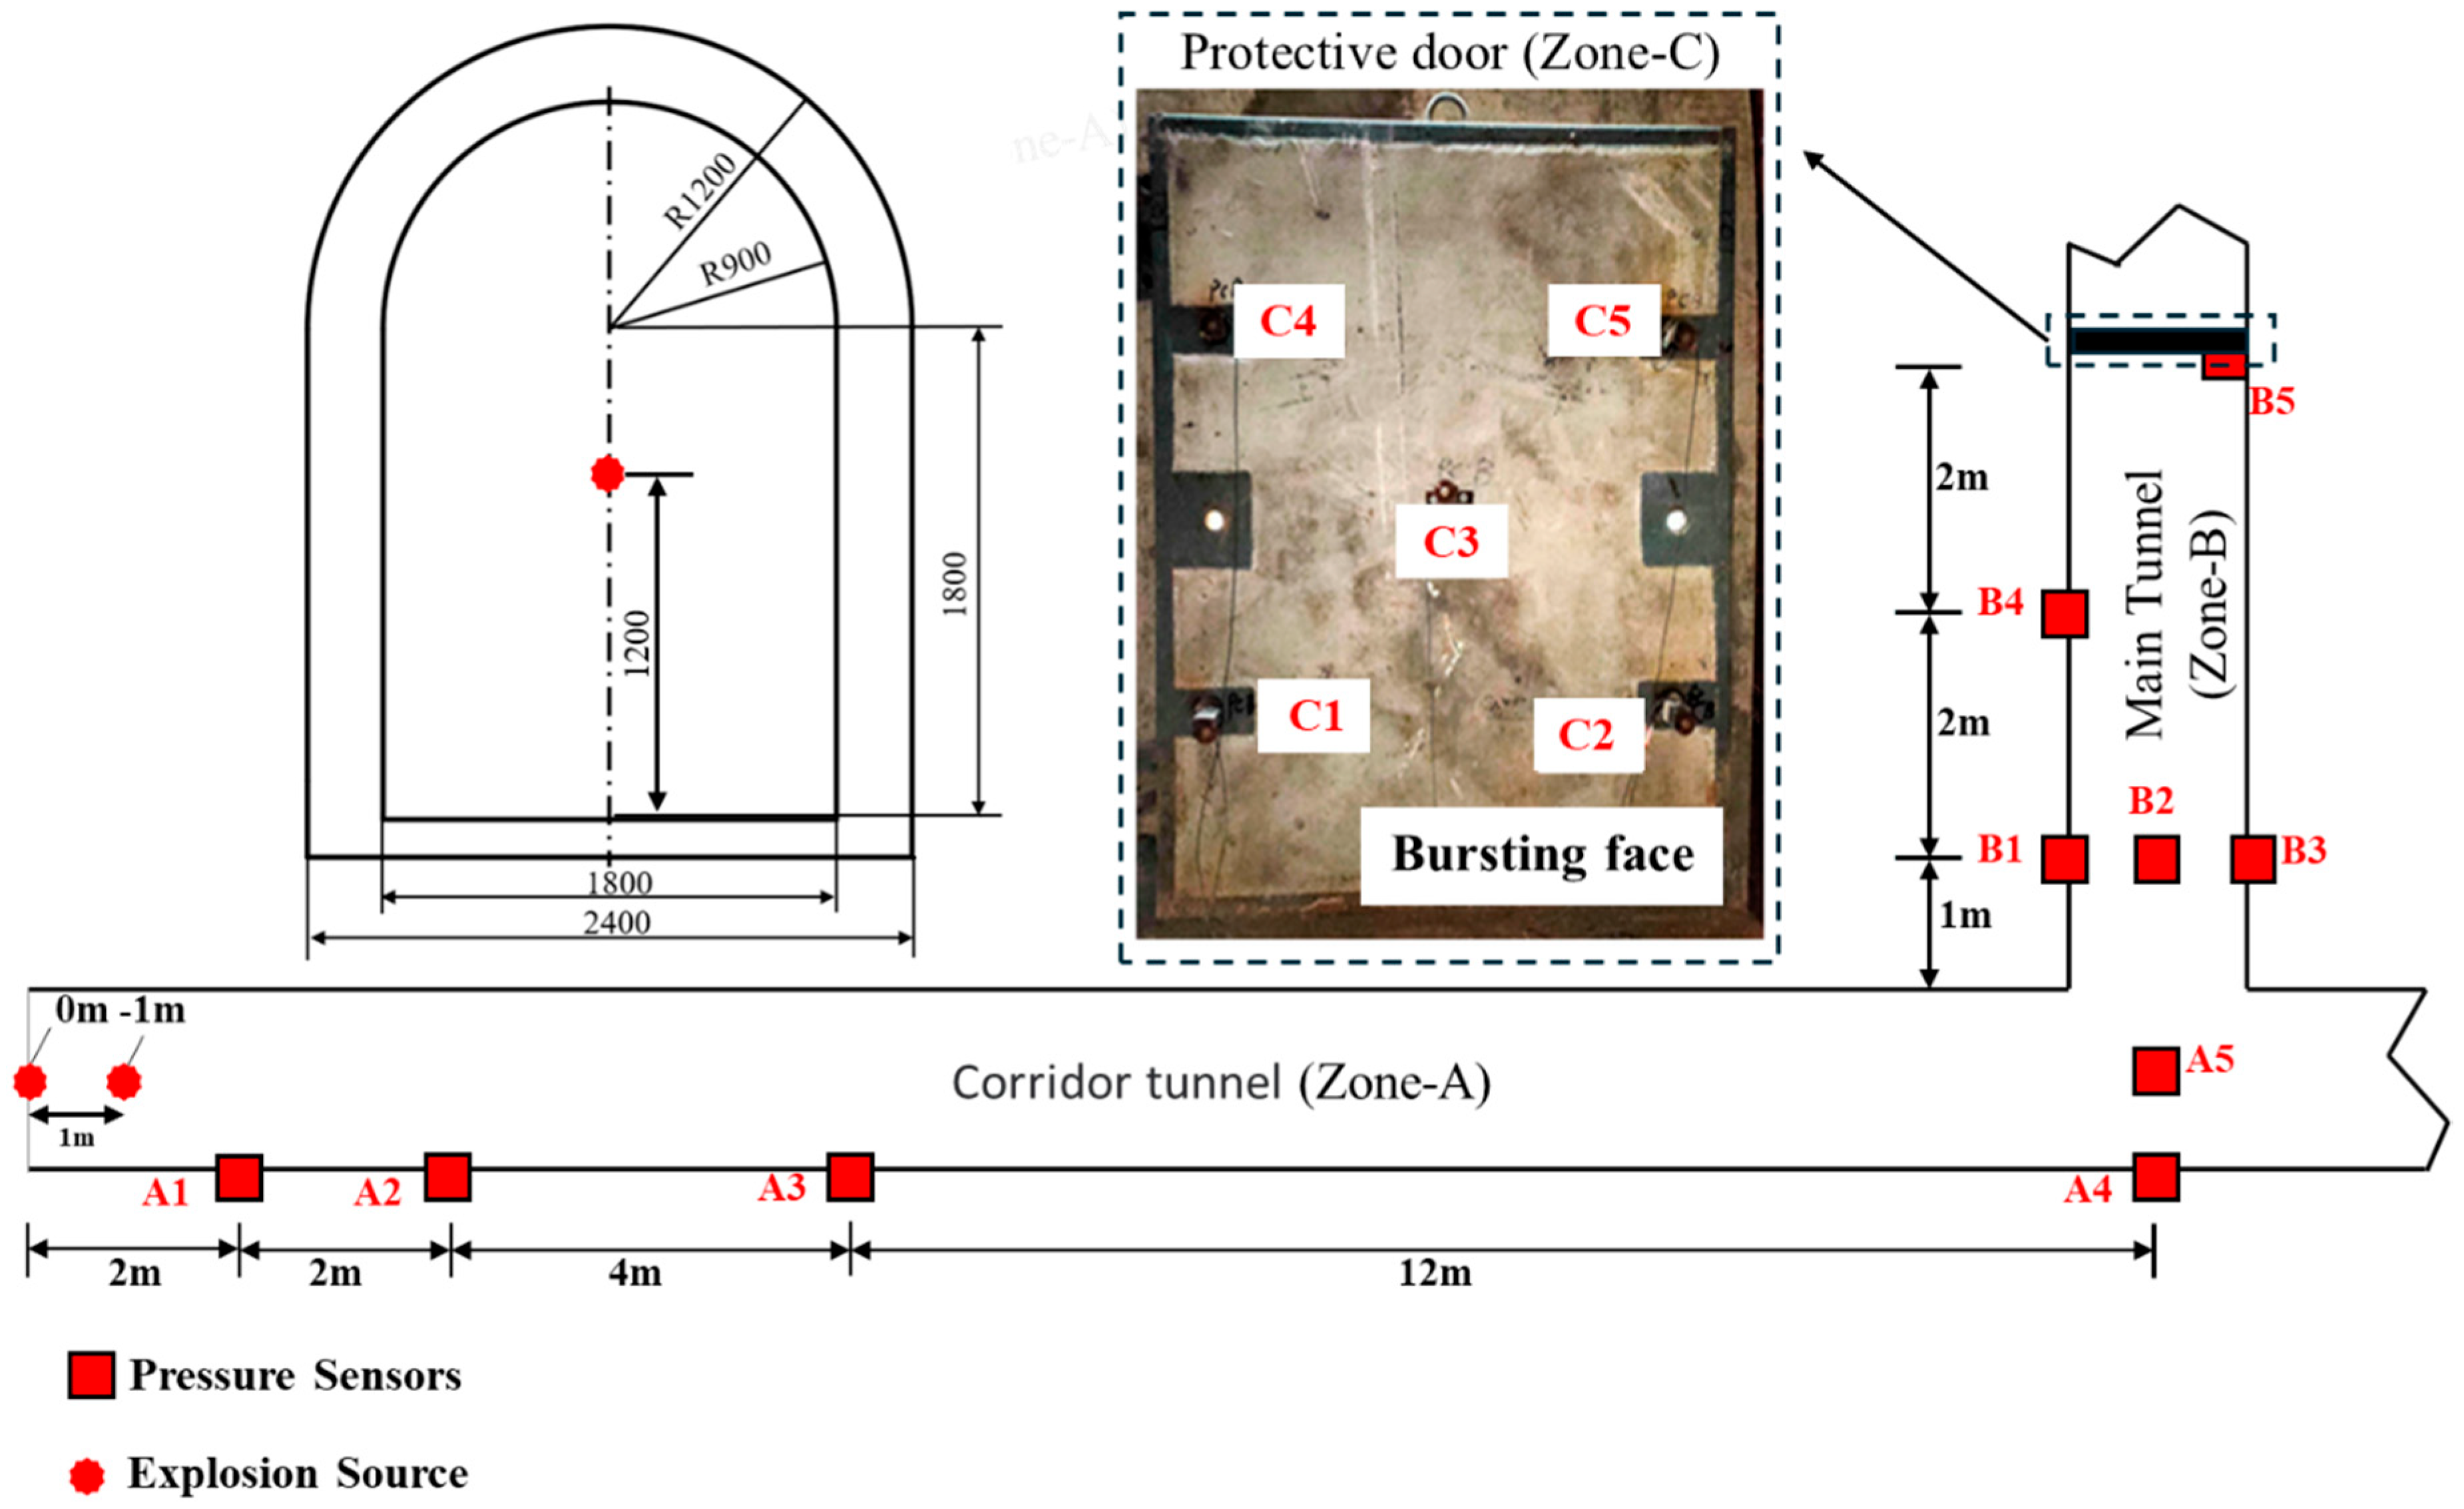
Since the main difference in the shock waves entering the T-shaped port under the three working conditions is the magnitude of the peak value, and the overall patterns are similar, the following analysis takes Con1 as an example to explore the shock-wave propagation laws and load characteristics of the three measuring points B3, B4, and B5 with the same spacing in the main tunnel.
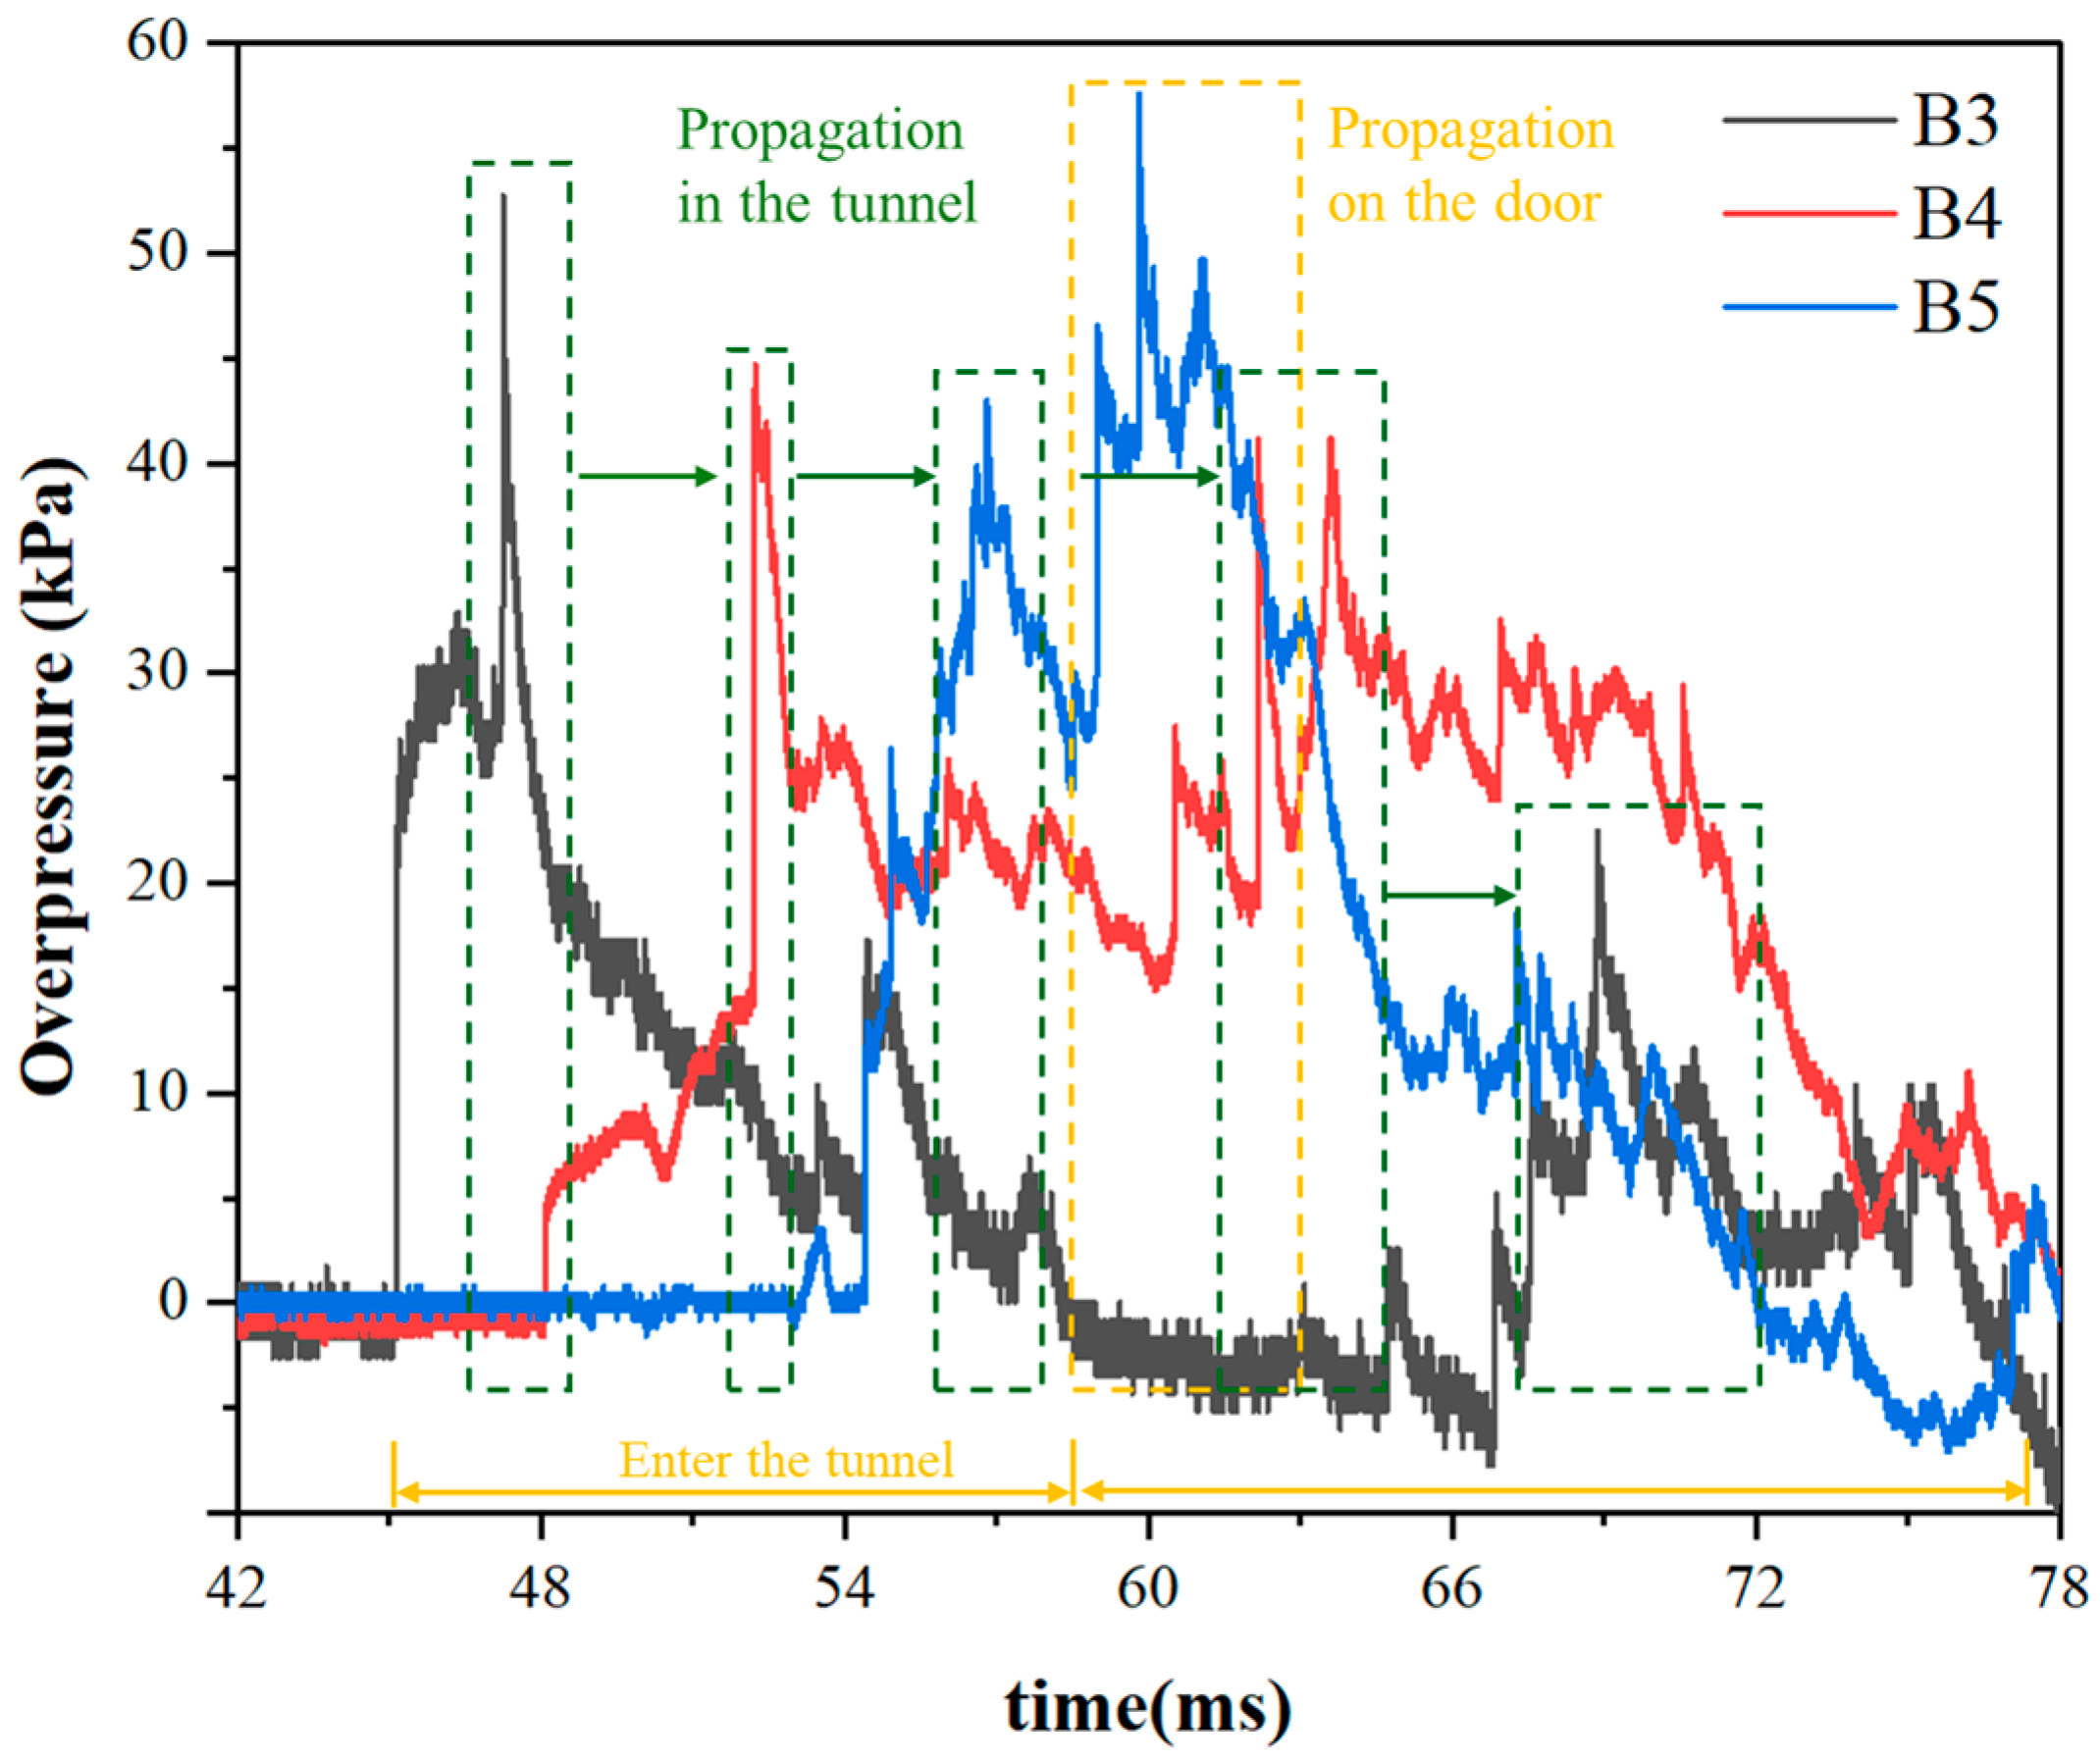
Figure 11 presents the overpressure time-history curve at three measurement points. The green box line highlights the peak overpressure response due to shock-wave propagation along the tunnel direction, while the yellow box line indicates the peak overpressure response of the shock wave propagating along the protective door, influenced by the door’s presence. At the B4 measurement point on the back blast surface, the positive pressure duration is 30.36 ms, significantly higher than at the other two measurement points, and its overpressure curve exhibits a multi-peak characteristic. The B5 measurement point is located on the blast-facing wall near the protective door. Its overpressure curve shows two distinct wave peaks. The first wave peak is caused by the shock wave propagating along the tunnel, resulting in a triangular-shaped overpressure curve. The second wave peak is attributed to the shock wave propagating along the protective door. The maximum peak overpressure occurs at this second wave peak, and the overpressure curve also demonstrates a multi-peak characteristic.
Figure 12 illustrates the overpressure with arrival time curve at each measuring point under Condition 1. It is evident that, due to the influence of the enclosed space, the positive pressure duration at measuring point B4 on the back blast surface is significantly longer than at other points. Additionally, the maximum momentum in the main tunnel occurs at point B4. Furthermore, the momentum values within the enclosed space in front of the door are higher than those at the T-junction measuring points, and the positive pressure duration at point B5 is slightly greater than that at the T-junction measuring points.
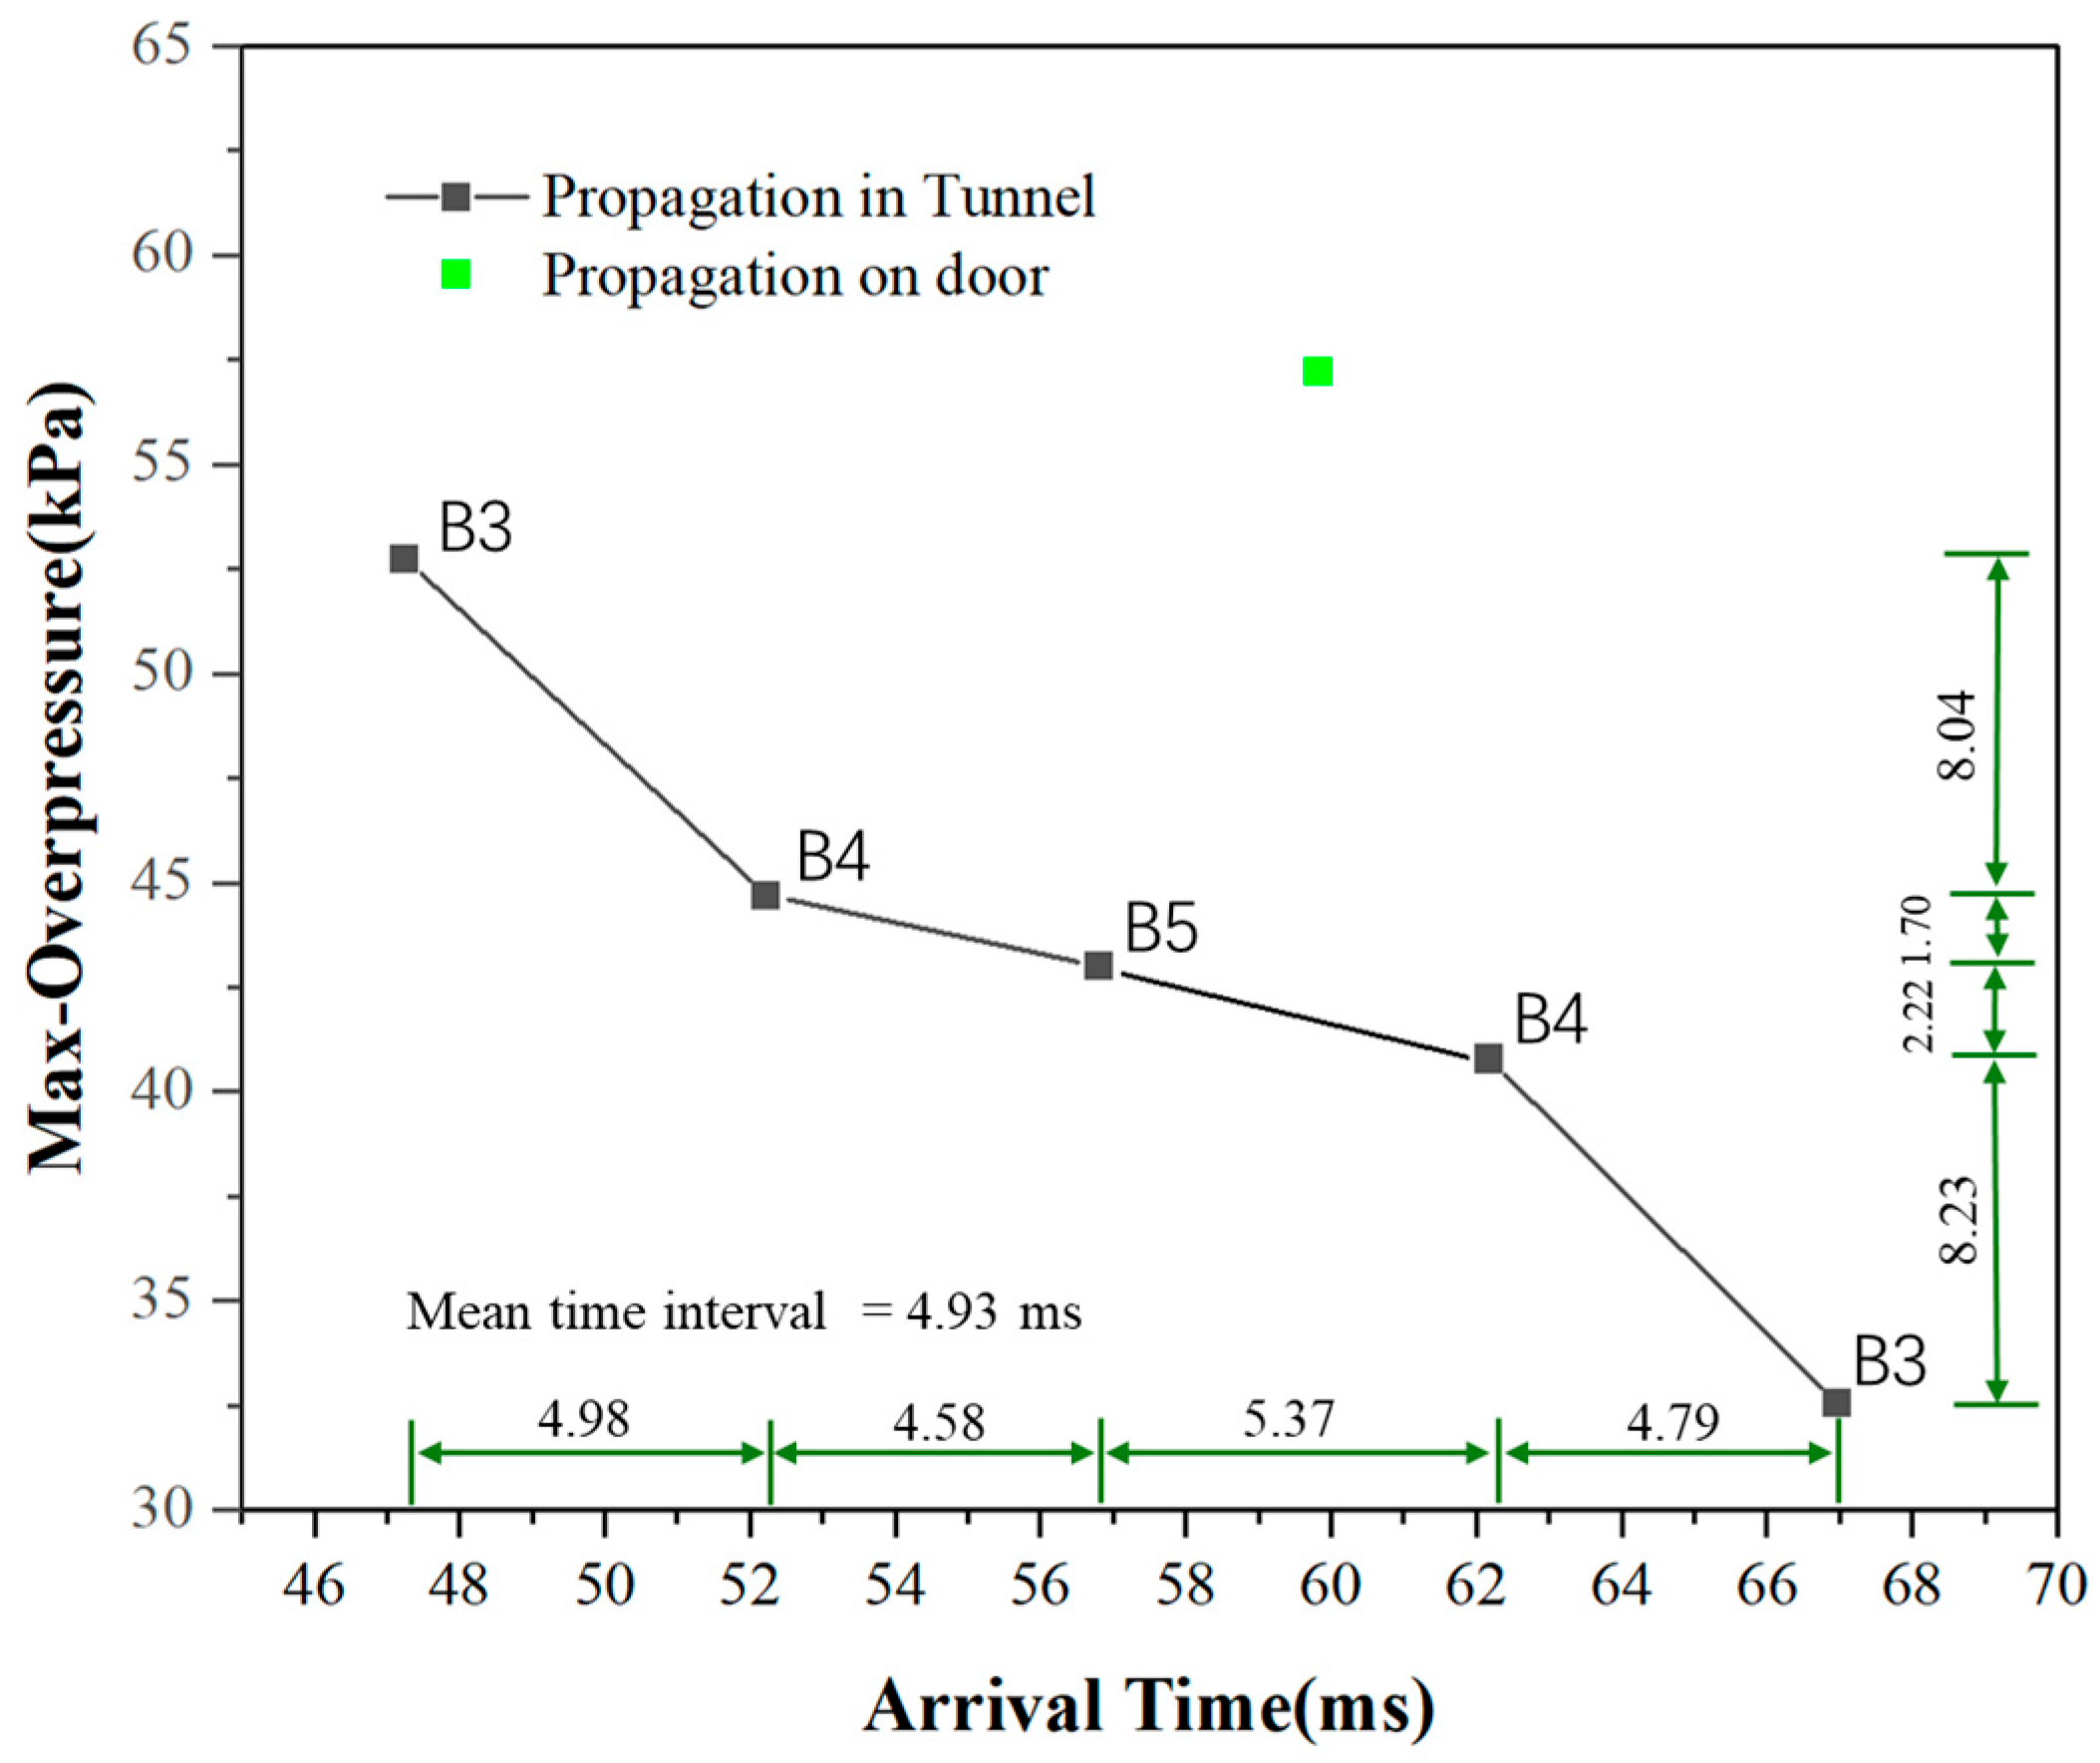
The overpressure peaks and corresponding arrival times on the overpressure curves for each measuring point are presented in
Figure 13. It is evident that the time intervals between the arrival times of shock waves propagating along the tunnel are relatively close, with an average interval of 4.93 ms. Furthermore, the overpressure peaks of the shock waves exhibit a decreasing trend during propagation. Notably, the peak value decreases sharply between measuring points B3 and B4, whereas it decreases gradually between B4 and B5. Additionally, the magnitudes of the peak value reduction during propagation between the same measuring points are consistent.
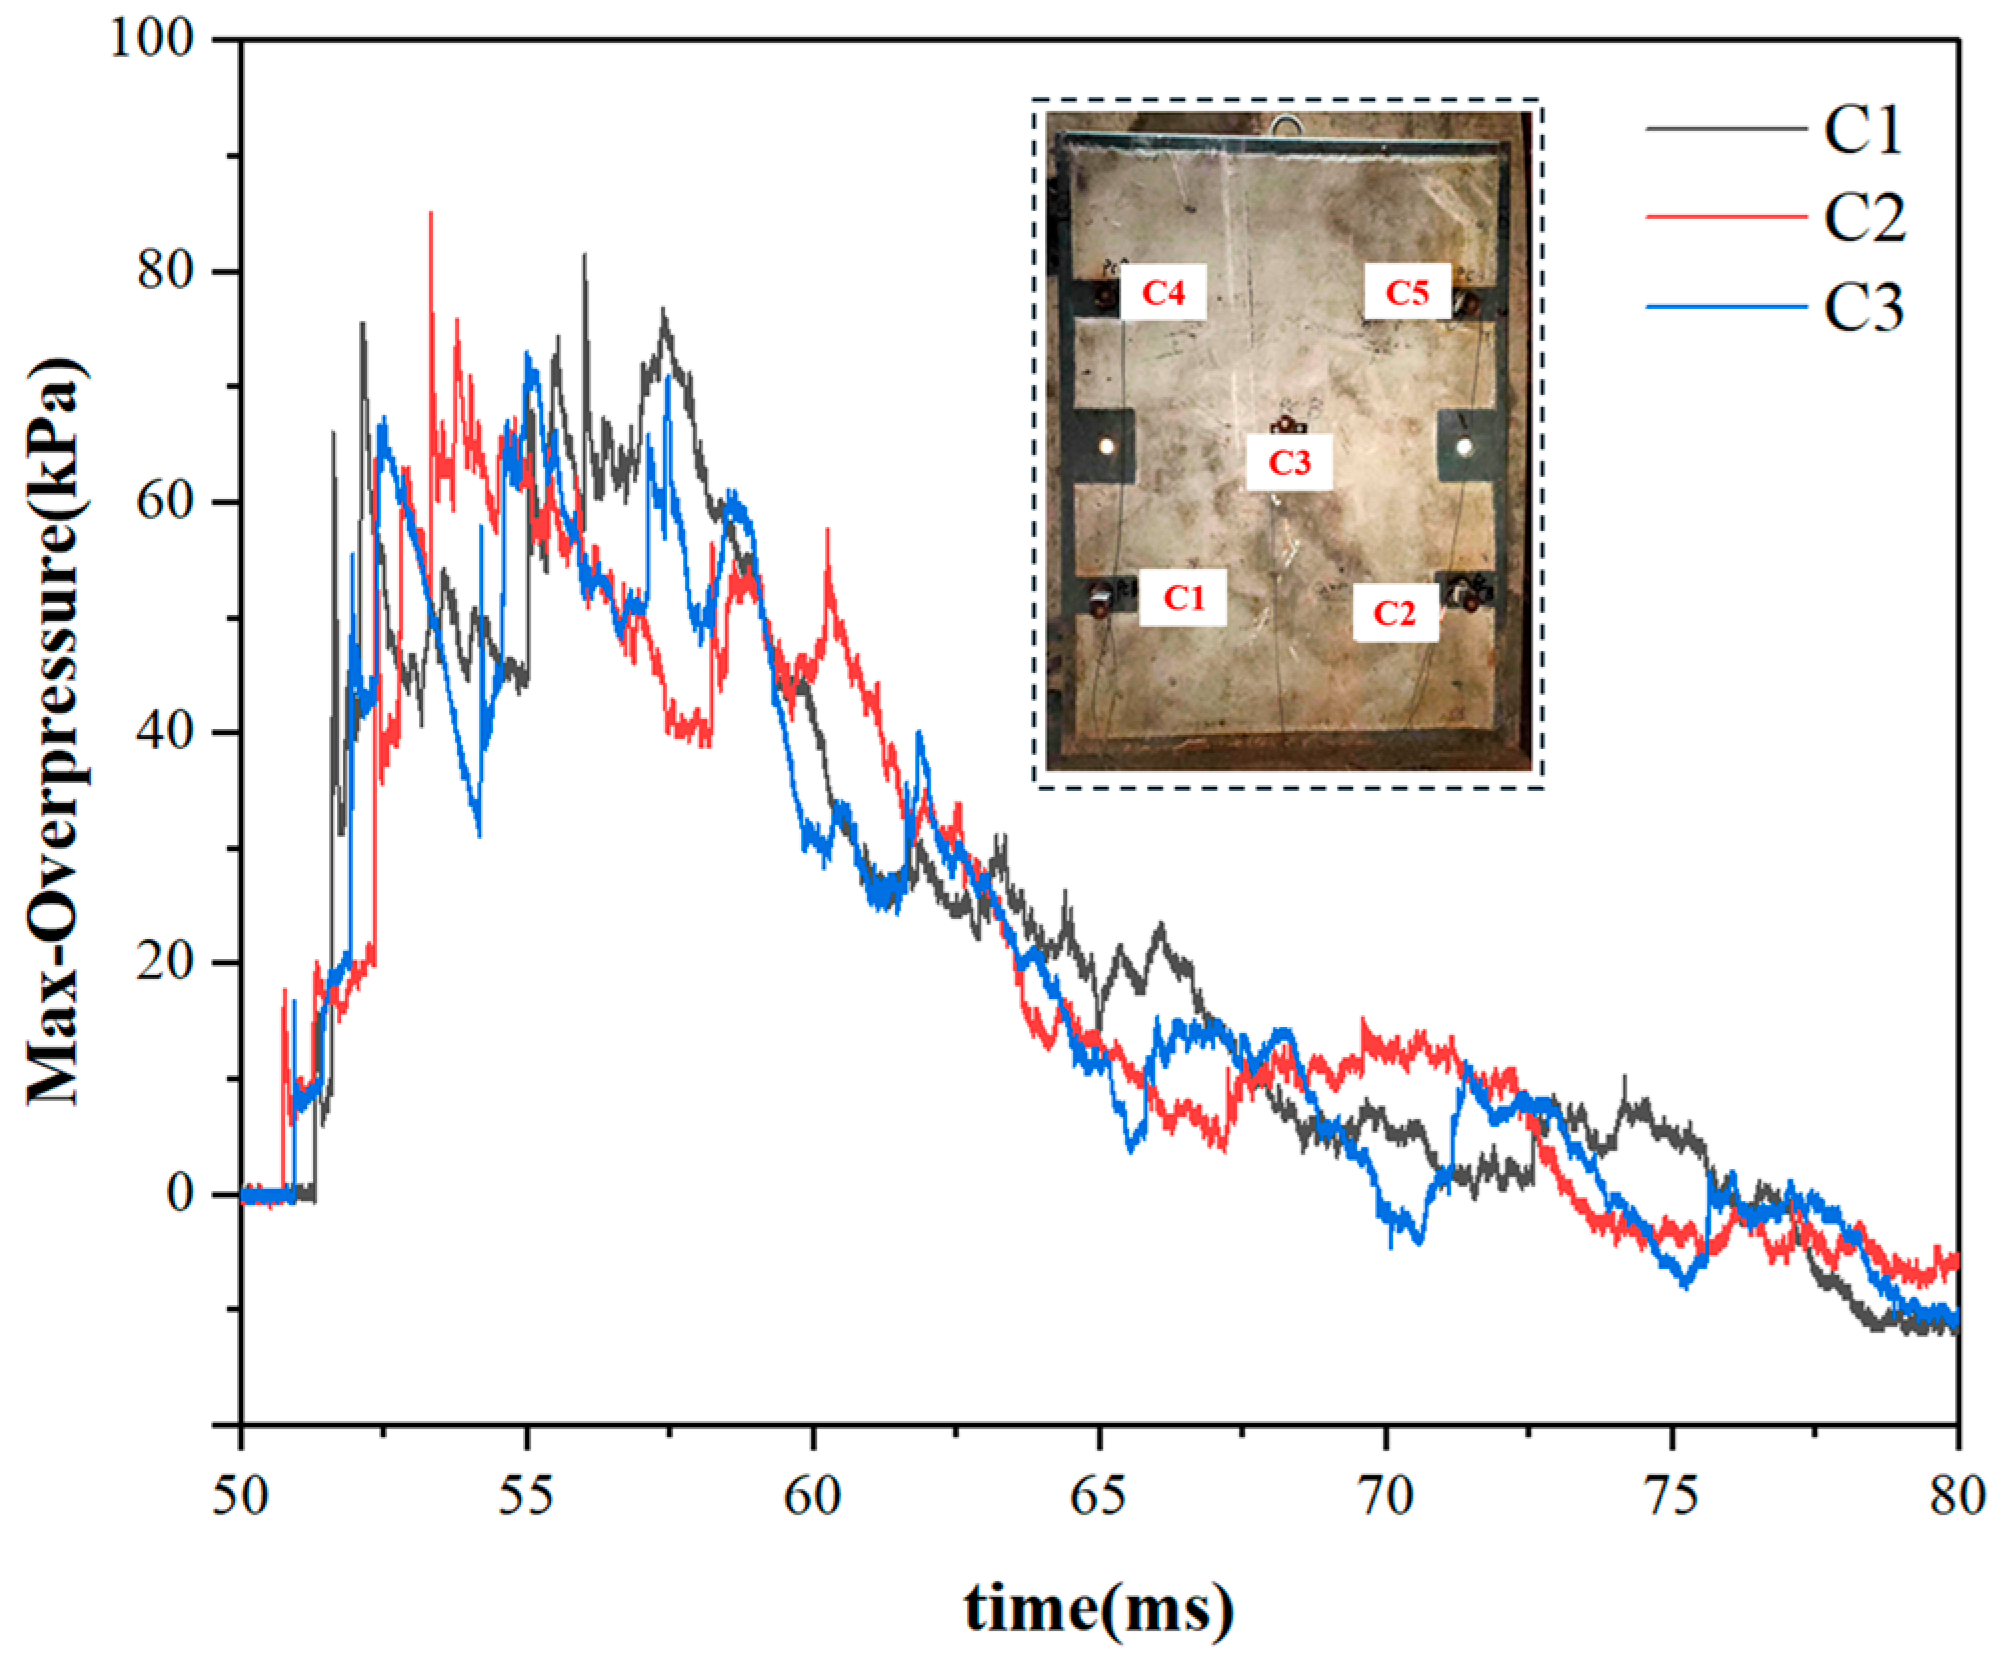
The curves of the symmetrical measuring points on the upper and lower parts of the protective door exhibit a similar pattern. Taking the C1, C2, and C3 measuring points under Condition 1 (Con1) as an example, the overpressure curve on the protective door is illustrated in
Figure 13. Each measuring point on the protective door is influenced by a complex shock wave, resulting in an overpressure curve that exhibits characteristics of multiple peaks. The peak values of each wave crest are nearly identical, with the maximum overpressure peak reaching 85 kPa. The positive pressure duration of the overpressure curve on the door is consistent across all measuring points, approximately 25 ms. The originally independently propagating reflected waves superimpose at the protective door, leading to the formation of a multi-peak load characteristic. This results in the peak pressure on the protective door being higher than that on adjacent wall surfaces.
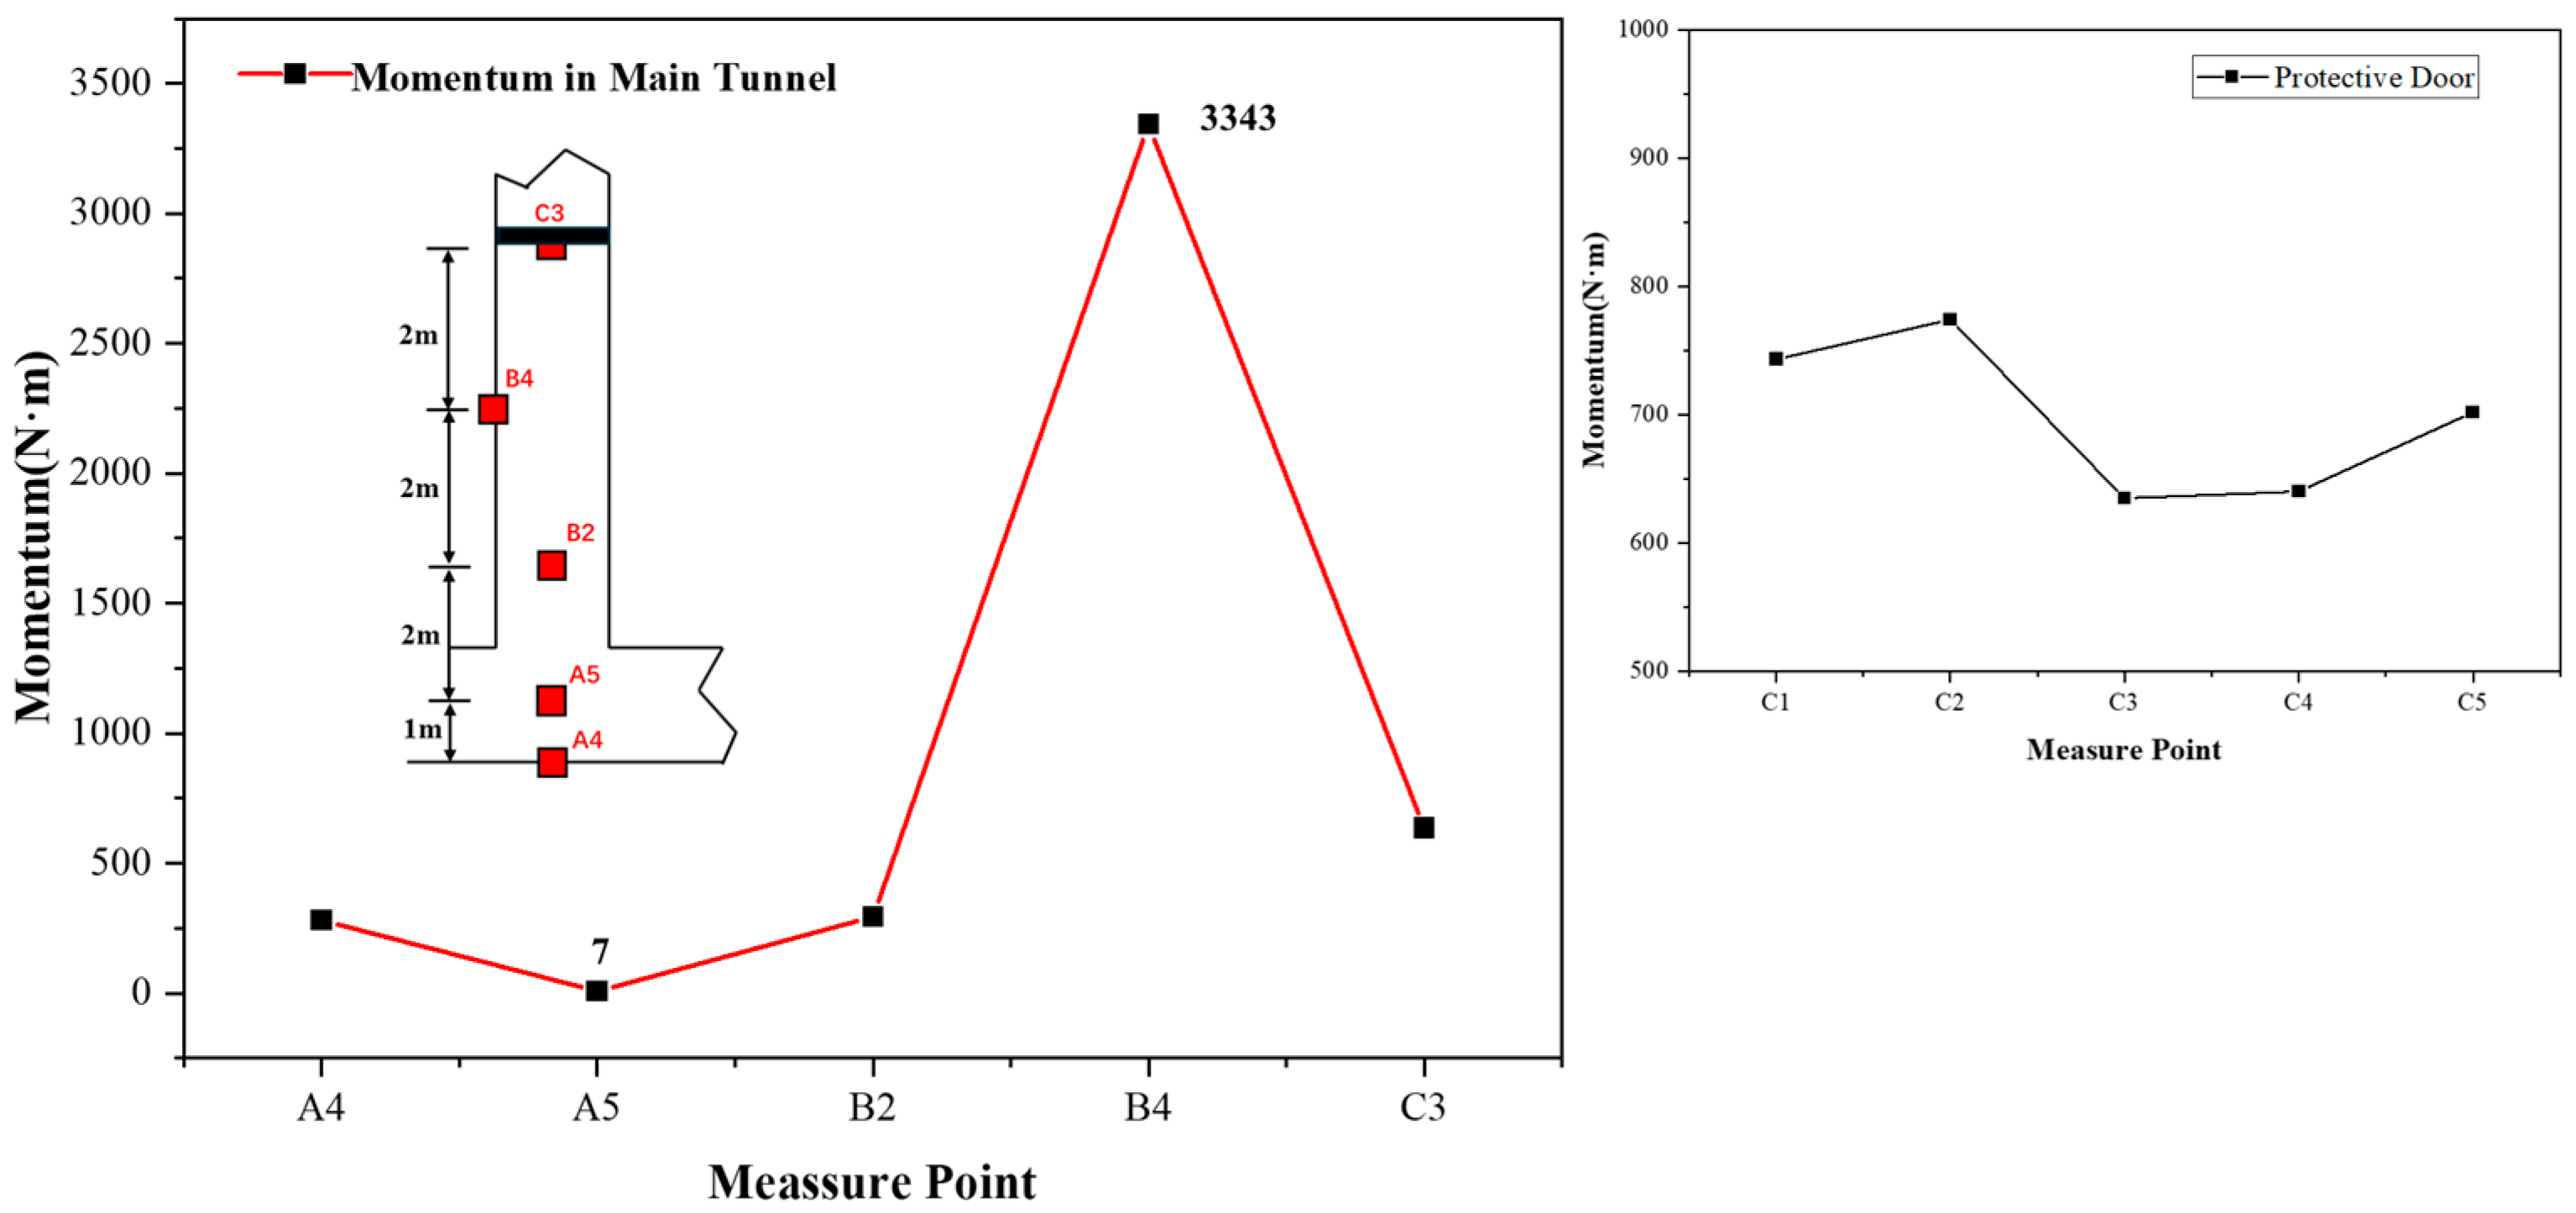
Figure 14 shows the comparison of momentum value at various measurement points on the central section of the main tunnel (point B4 is located on the reverse blasting surface). A4 and B2 have nearly the same momentum, with the momentum being around 285 N∙s. Additionally, each point on the door has a relatively similar momentum. Taking the impulse in the straight tunnel as the reference of A4, the impulse increase multiples of the other four points are, respectively, 0.0264 (A5), 1.0449 (B2), 11.935 (B4) and 2.26 (C3). It can be observed that due to the reflection from the tunnel walls and the protective doors, the shock wave concentrates its effect on the rear explosion surface within the tunnel. Compared to a straight tunnel, the momentum on the doors also significantly increases.
3.3. The Propagation of the Shock Wave at the T-Gate
Although the working conditions are different, the shock-wave load curves in the main tunnel exhibit similar patterns. Specifically, the shape of the overpressure curve at the same measuring point remains consistent, while the propagation law of the shock wave along the path can be clearly observed between different measuring points. To further investigate the propagation characteristics and process of the shock wave in the T-shaped main tunnel, this paper establishes a numerical model of the T-shaped tunnel using LS-DYNA numerical simulation technology.
The numerical model is designed to have the same dimensions as the experimental setup. In this model, the concrete tunnel, explosives, and air are all represented as three-dimensional solid elements. During the modeling process, the ALE algorithm is employed for both the explosives and air to enhance computational accuracy. The explosive is located at the entrance of the tunnel, 1.2 m below the ground level, and its explosive yield is 1 kg. To achieve more precise results, an obstacle-free air region is established at the tunnel entrance, with its boundaries defined as non-reflective to minimize interference. The detailed configuration of the model is presented in
Figure 15 [
8]. Among them, the tunnel model is a rigid body, the air grid is an ale grid, and the size of the air grid is 0.05 m [
8]. The outer boundaries of all the boundaries are set as non-reflective boundaries.
Air was characterized as an ideal gas without viscosity, which was defined by MAT_NULL material and EOS state equation.
where
P is air pressure,
C0~
C6 are constants,
μ is the rate of density change, and
E0 is the energy in initial state. The detailed parameters of air were given in
Table 2.
The explosive was defined by MAT_HIGH EXPLOSIVE BURN material and JWL state equation.
where
Pcj is the pressure generated in explosion,
E0 is the internal energy density,
A,
B,
R1,
R2 and
ω are material constants [
25]. The detailed parameters of explosive were given in
Table 3.
The numerical model is mainly used to verify the analysis of shock-wave propagation at the T-shaped opening in this paper. As shown in
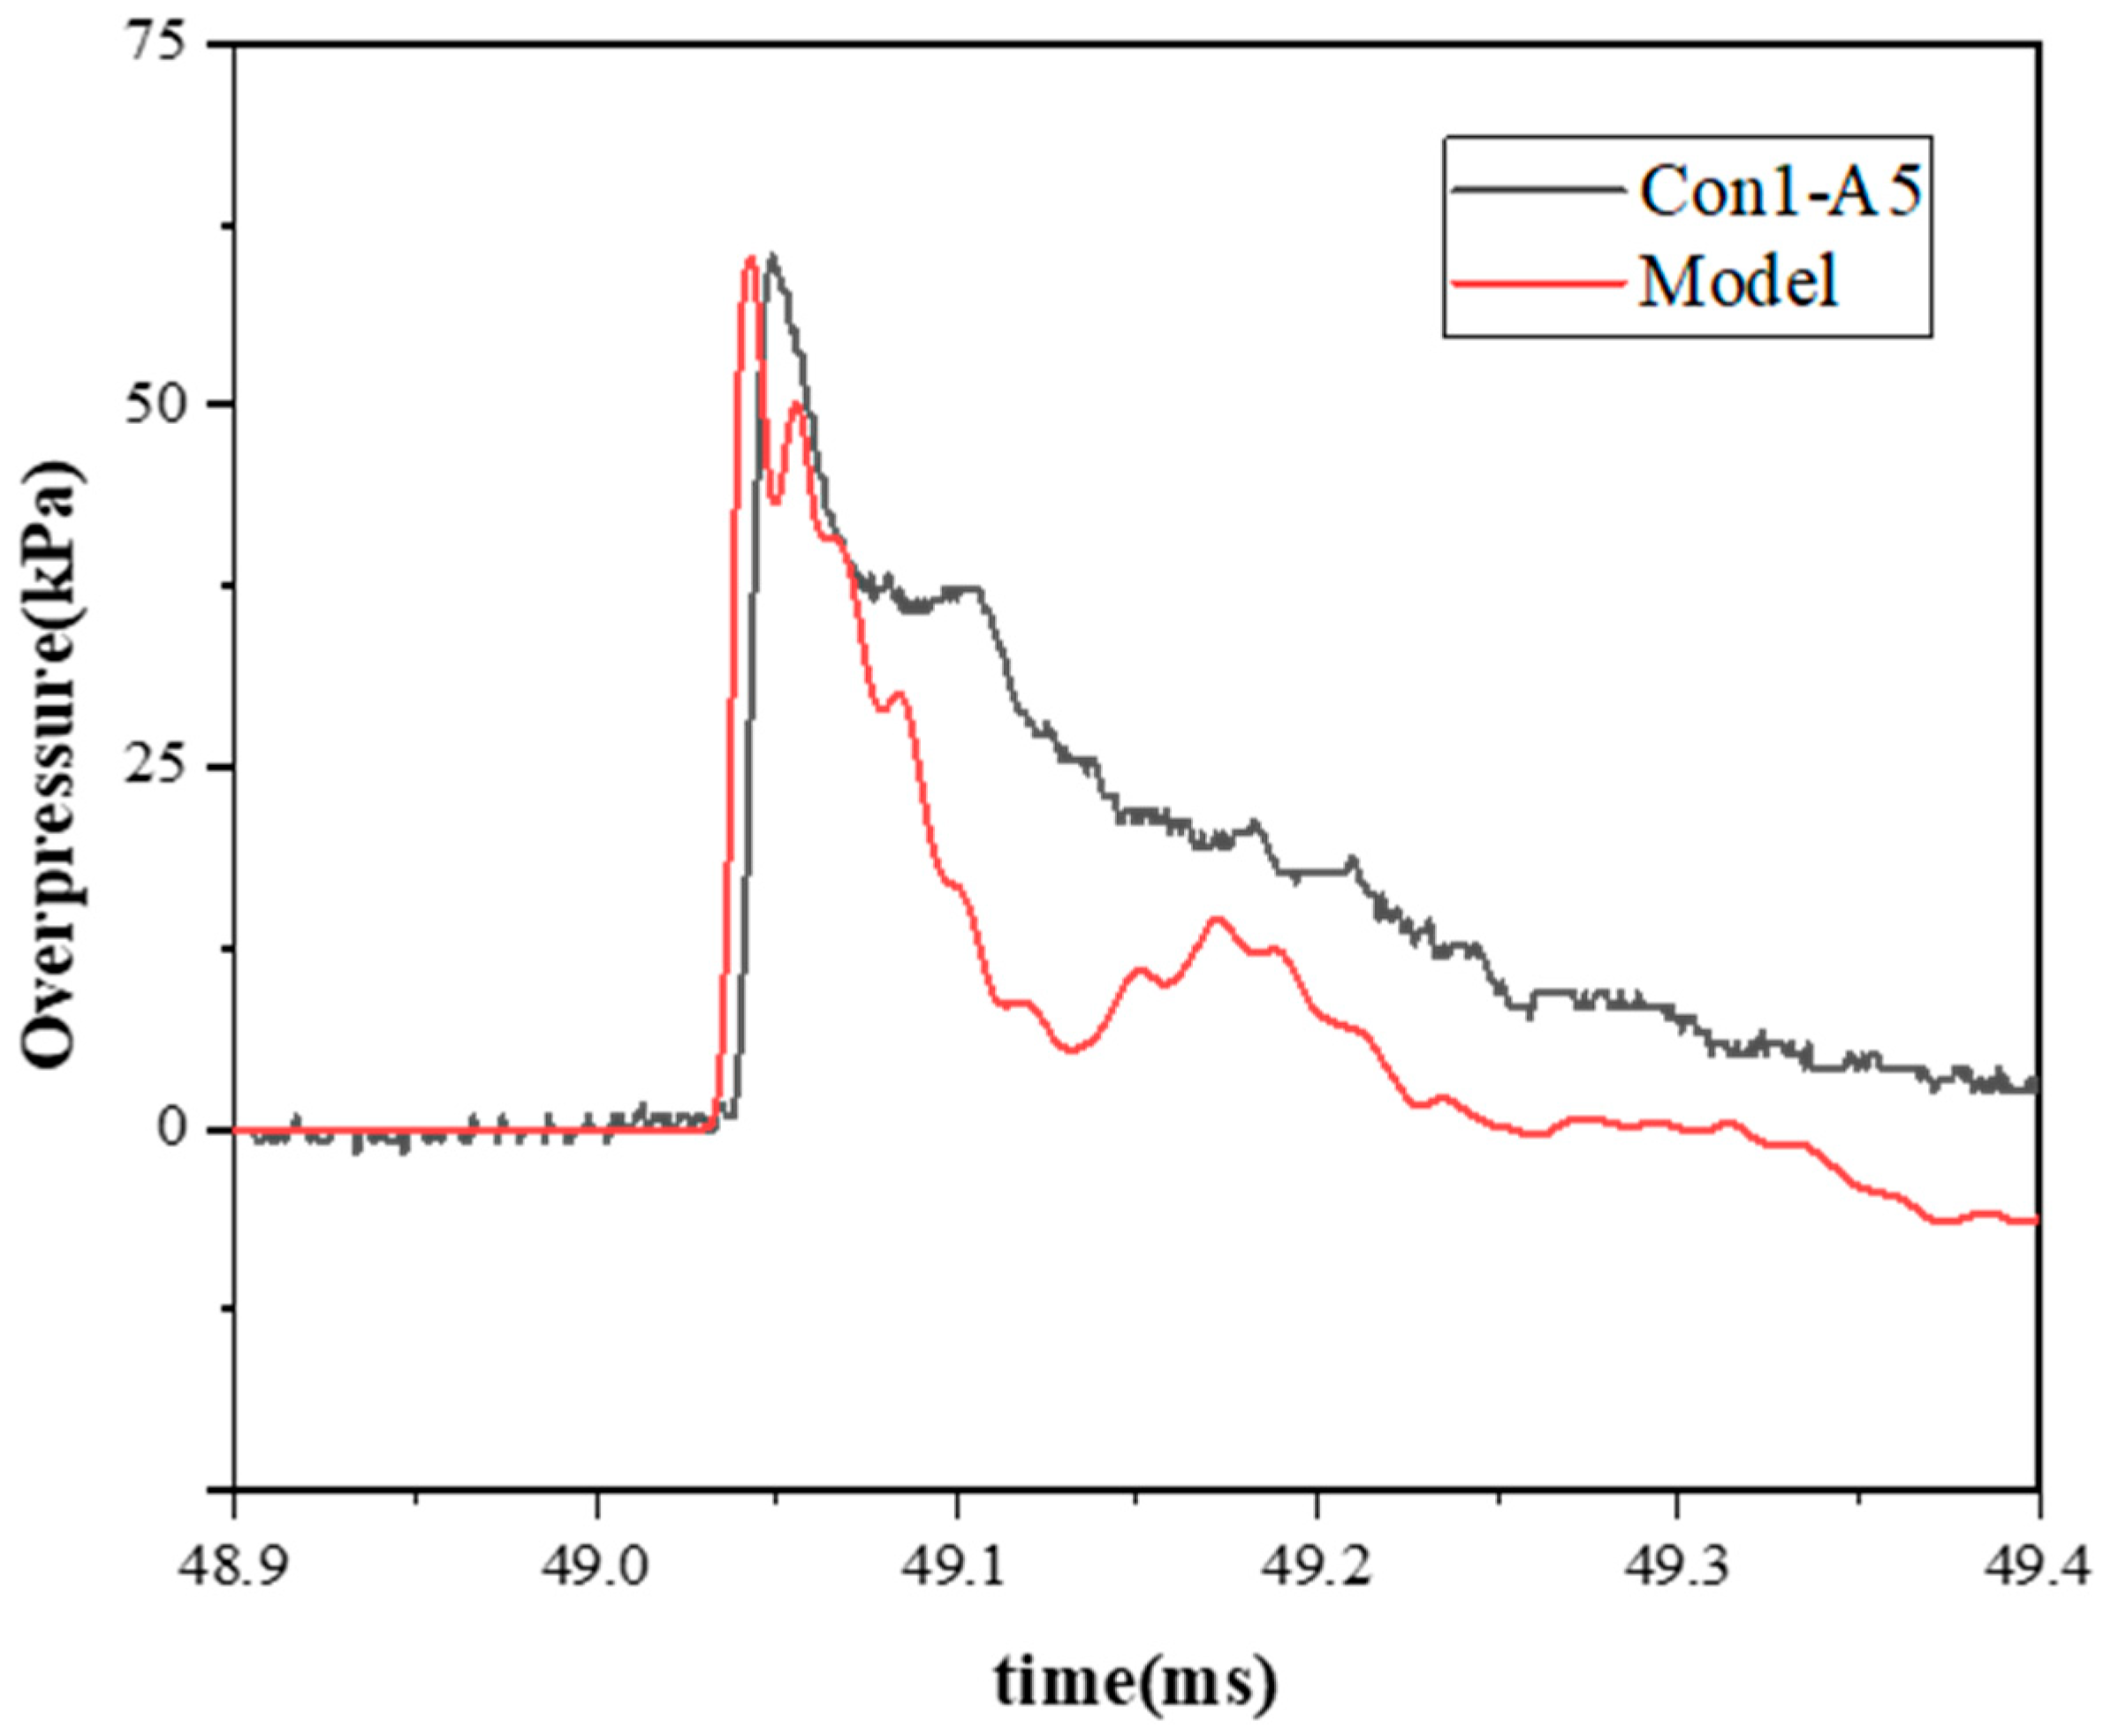
Figure 16, at the wall measuring point of the curve 20 m away from the tunnel entrance, the peak values of the curves are close, and the variation laws are similar.
At present, in the research of aerodynamics, it is found that when the shock wave reaches the T-shaped junction, it will expand into the tunnel interior in a certain pattern. According to the expansion wave theory of supersonic airflow in aerodynamics [
26], when supersonic airflow encounters a small external turning angle, it transitions from a high-pressure region to a low-pressure region. This transition causes the airflow to accelerate while experiencing a pressure drop, resulting in the formation of expansion waves. Each small turning angle on the various interfaces traversed by the supersonic airflow generates an associated expansion wave.
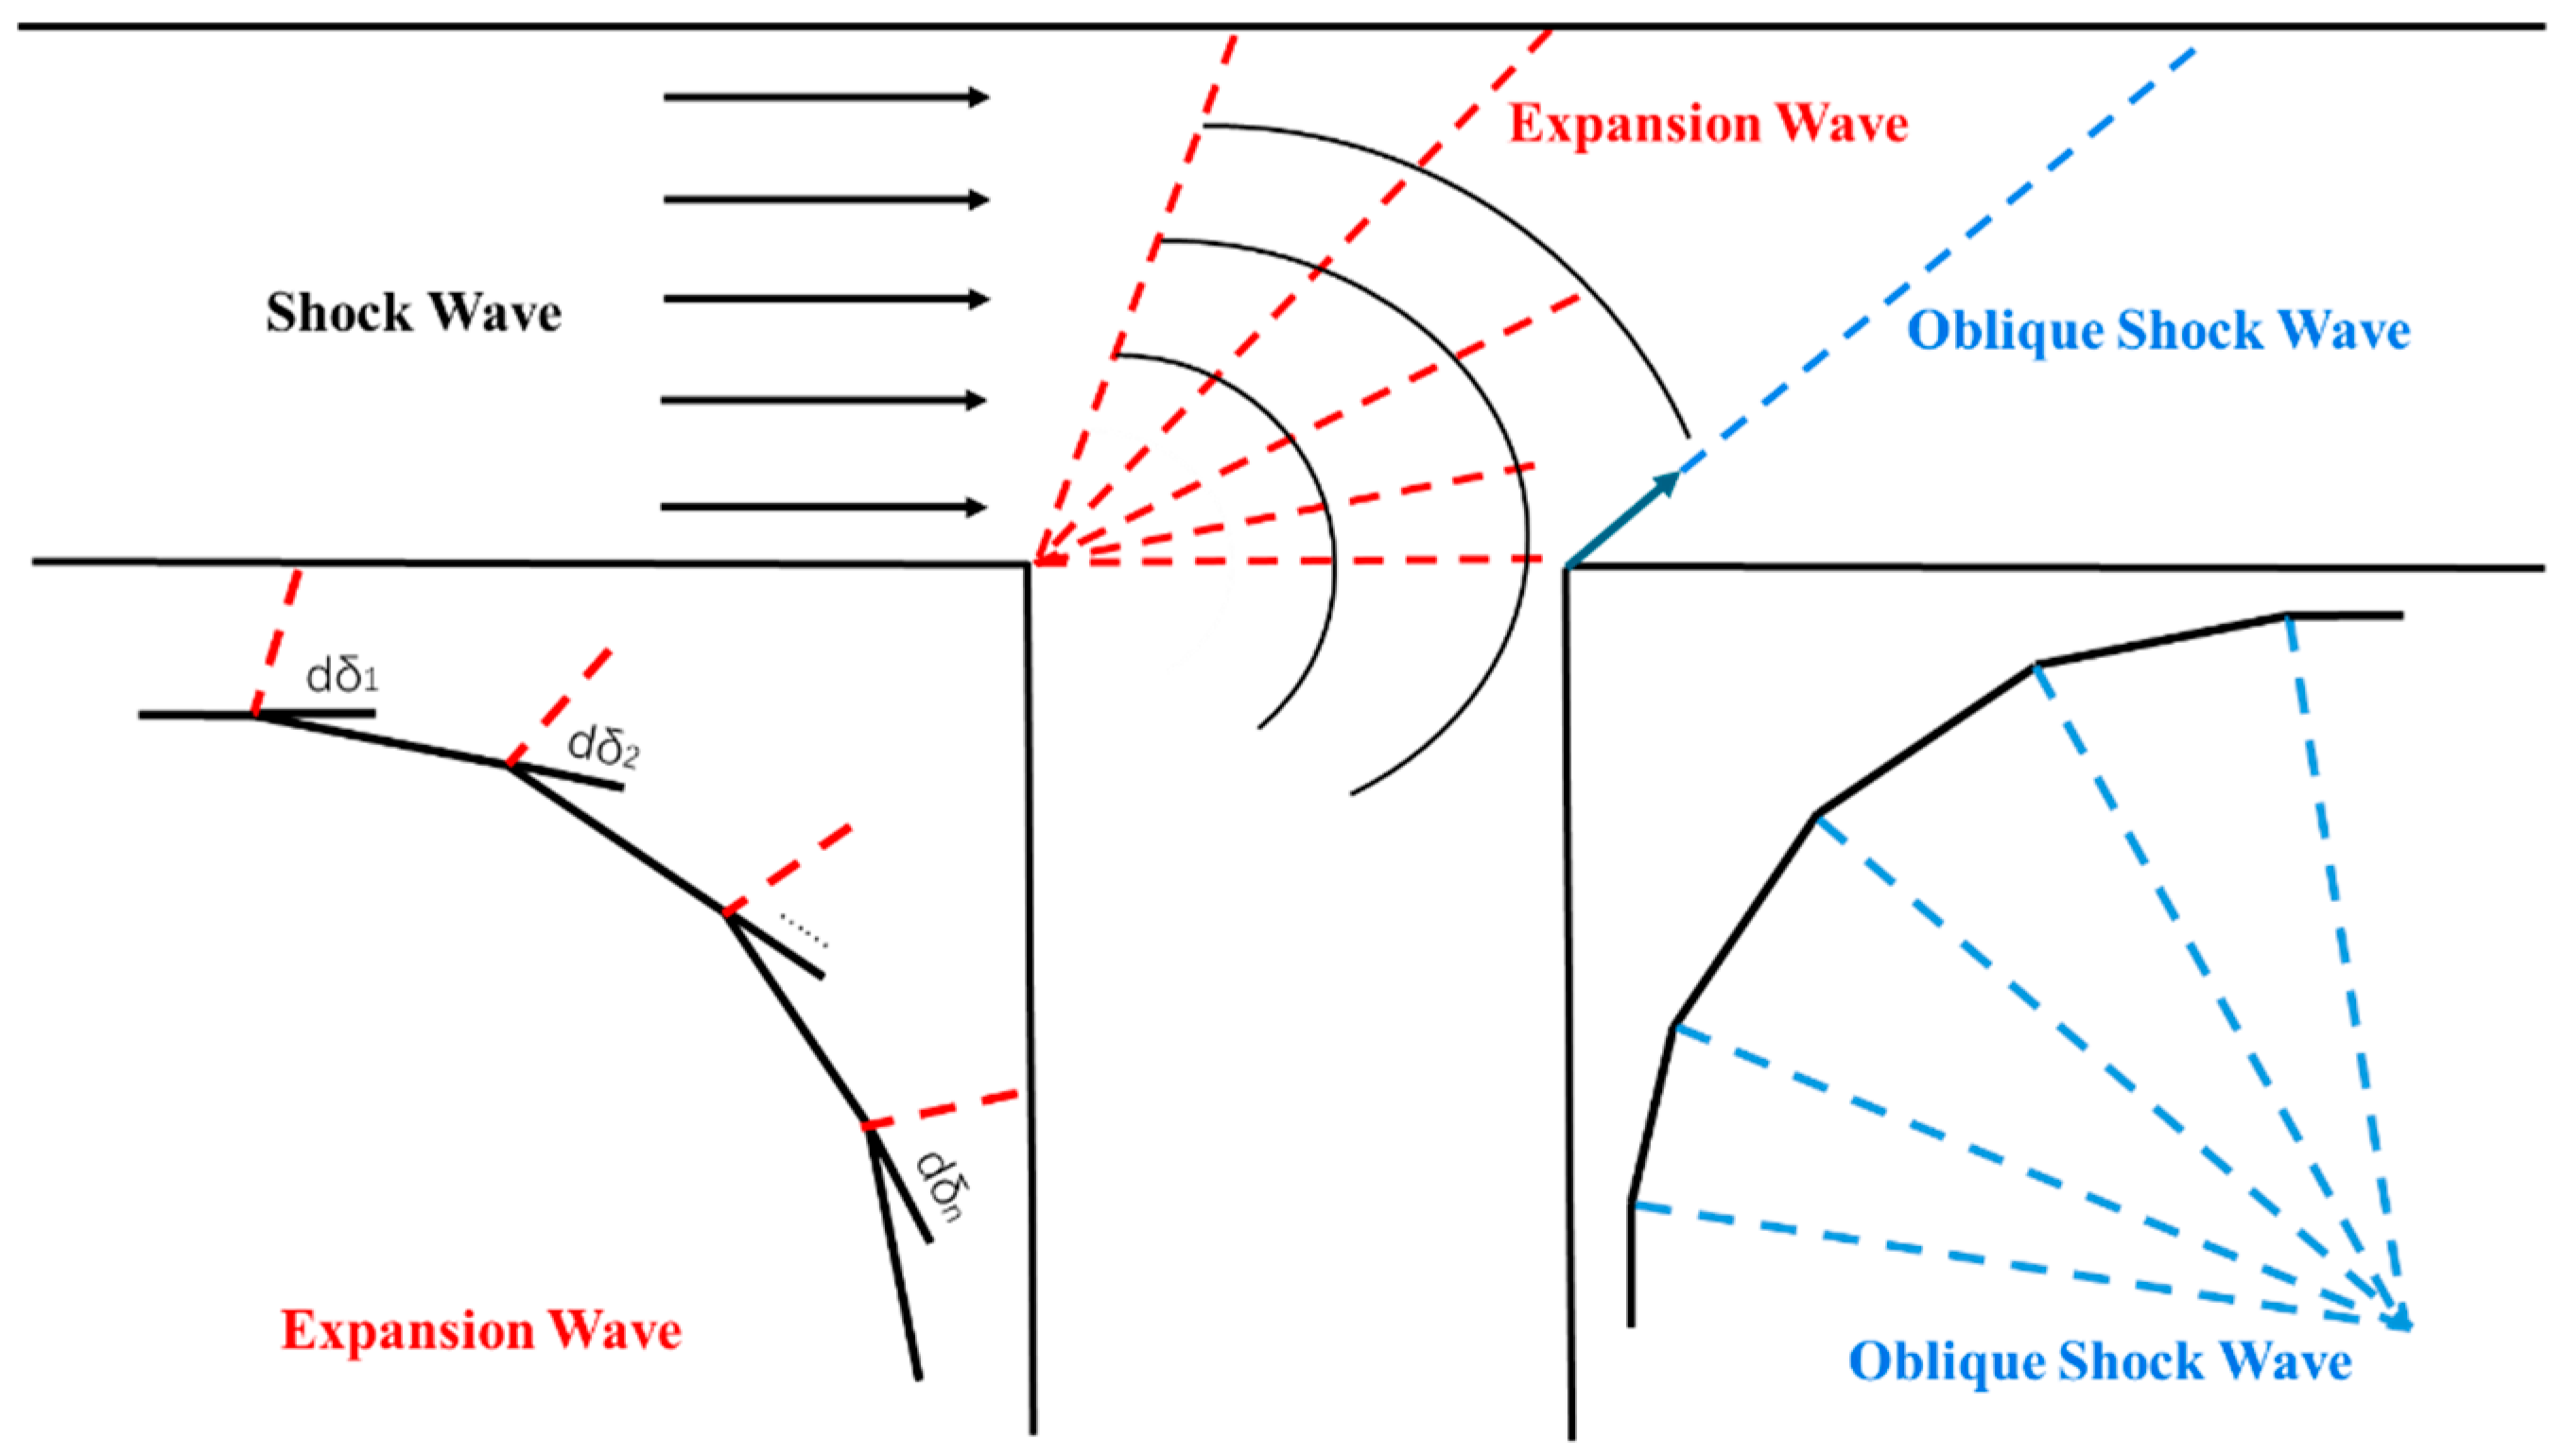
If the length of each external folding angle’s line segment is progressively reduced, in the limit case, all the external folding angles converge into a single corner with a larger angle. When supersonic airflow passes through this configuration, it generates a fan-shaped expansion wave region centered at the turning point, as illustrated in
Figure 17. Through this fan-shaped area, the airflow velocity increases while both pressure and density decrease. Similarly, when a shock wave traverses the T-shaped opening, it is influenced by the blast-facing surface of the opening, causing the cross-sectional area of the tunnel to abruptly reduce. If the right-angle corner is divided into an infinite number of infinitesimal folding angles, the compression waves generated by each folding angle will have the same direction. In the limit case, after the shock wave passes through the right-angle corner, it propagates uniformly in the same direction, forming an oblique shock wave (as shown in
Figure 17).
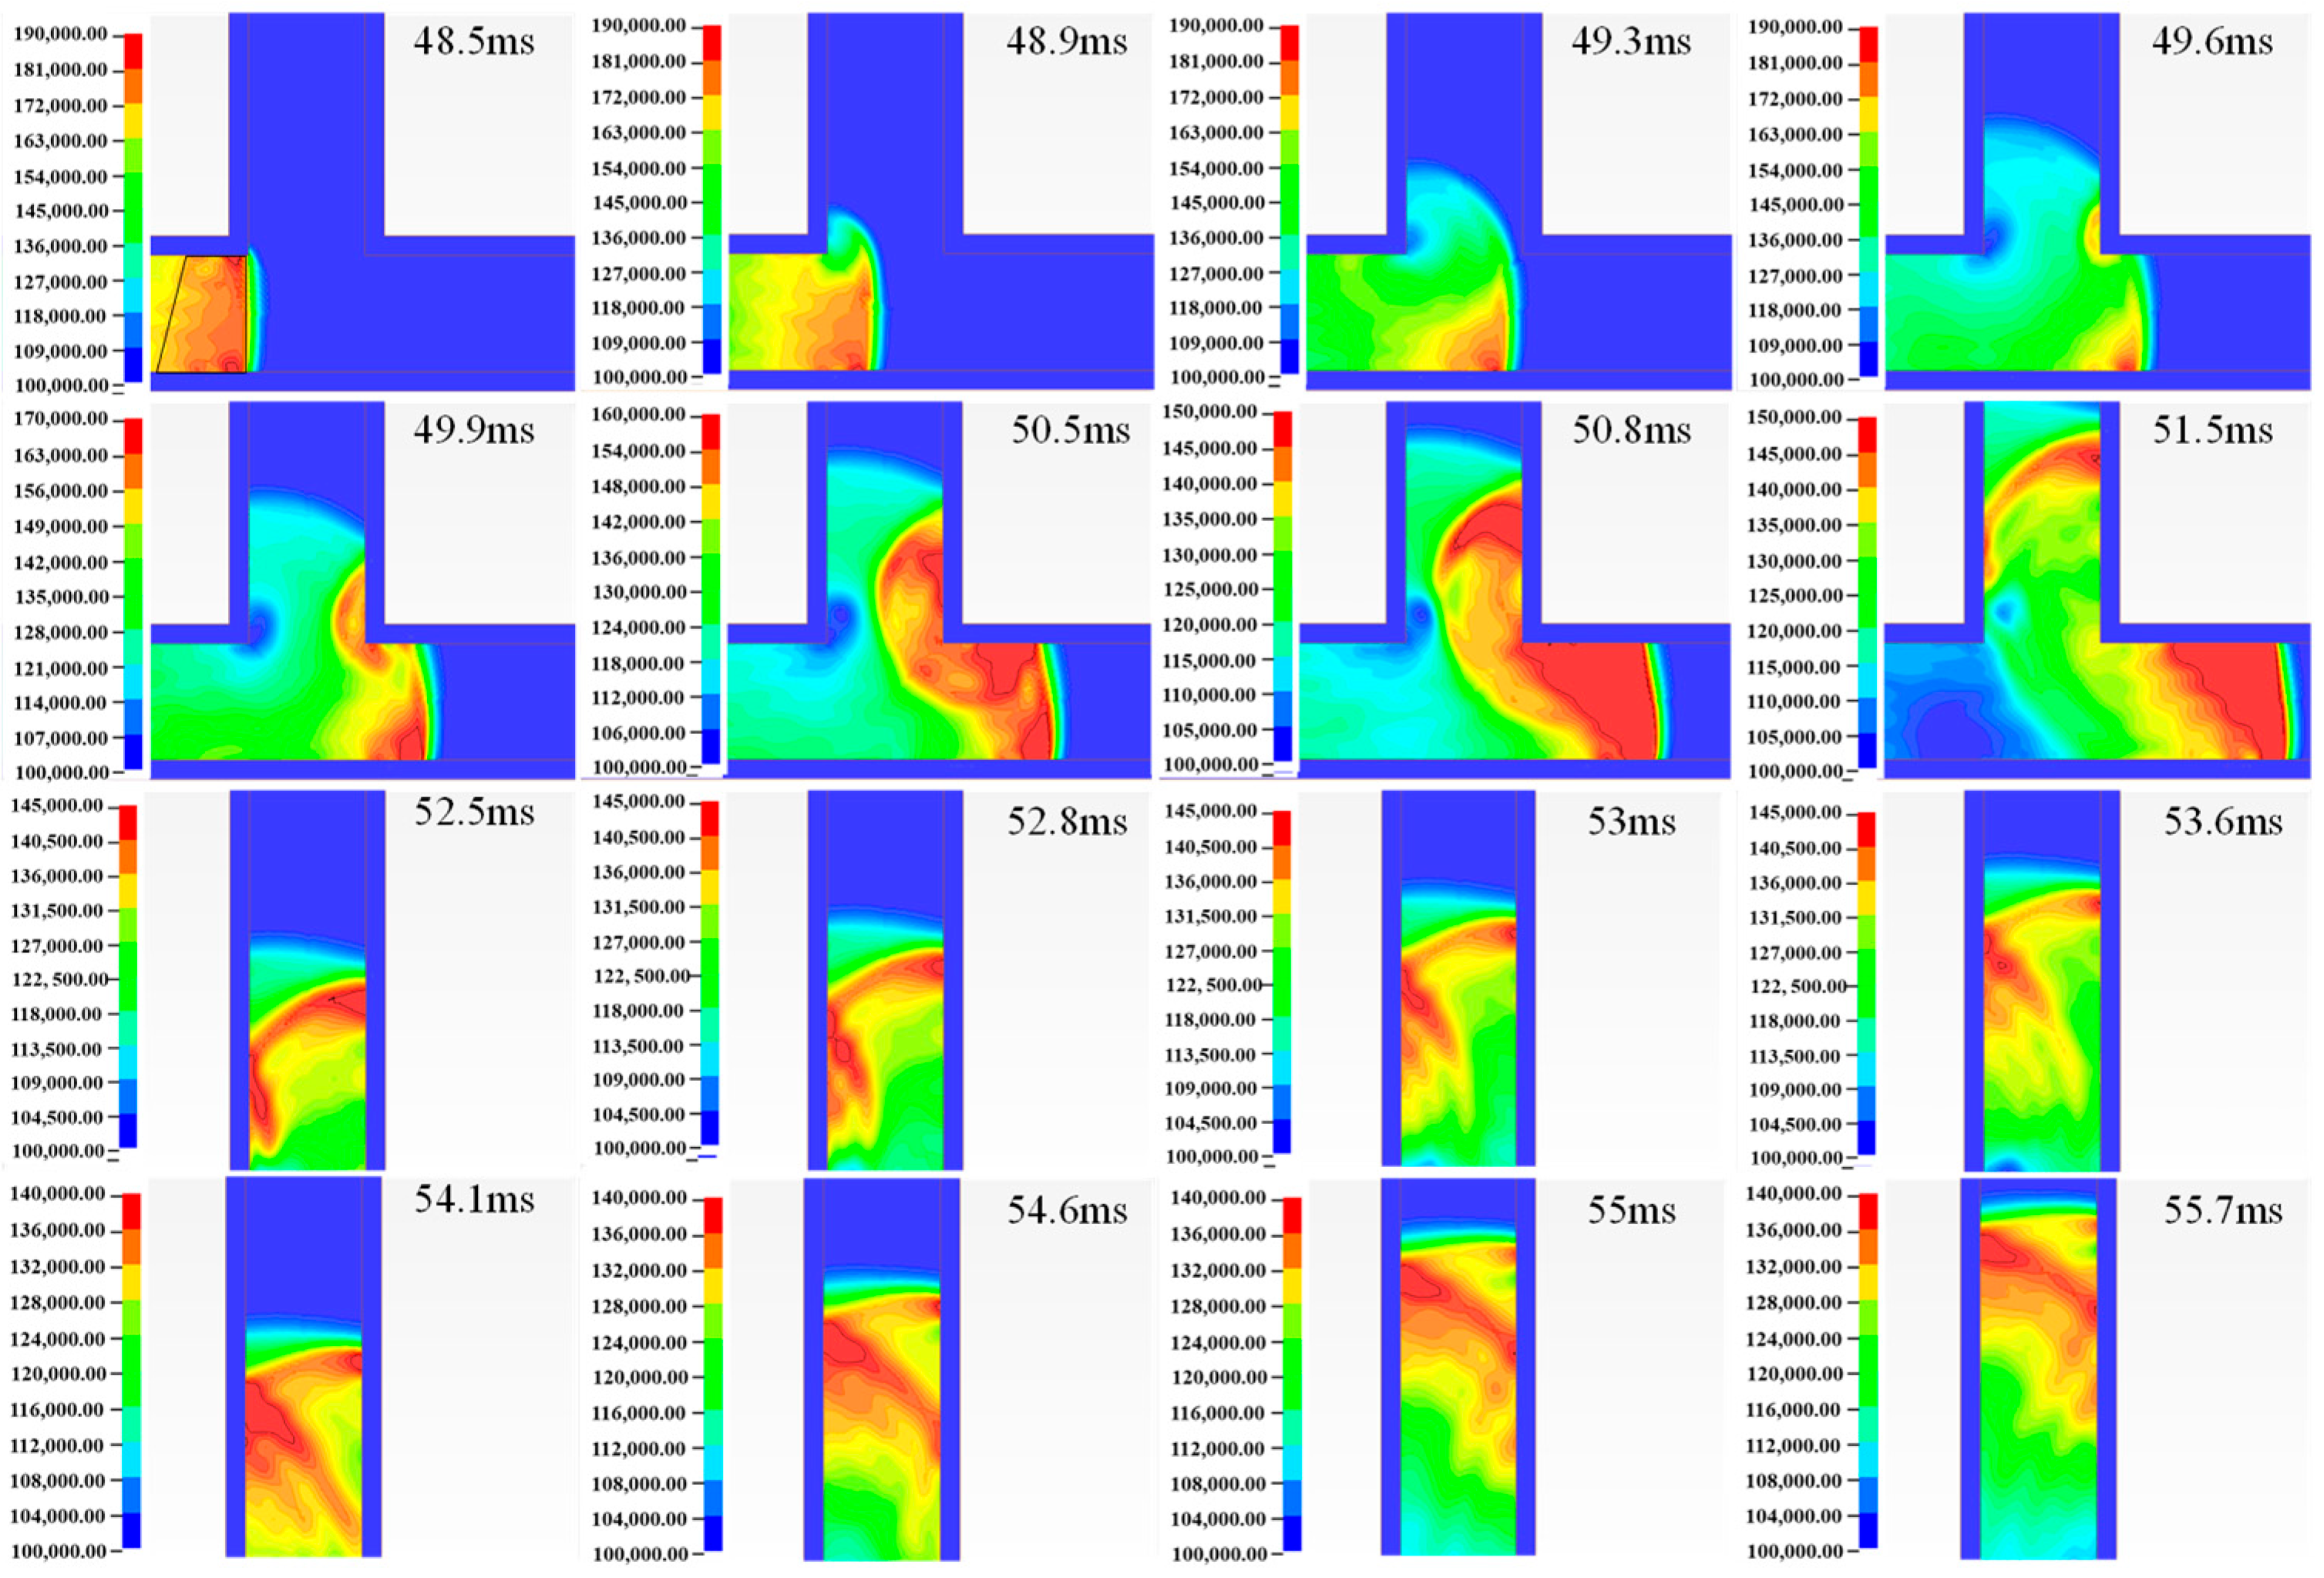
Based on the analysis of the numerical simulation pressure chart (
Figure 18), in conjunction with experimental data and aerodynamic theory, it can be concluded that when the shock wave enters the T-shaped port space, an expansion wave is generated at the free interface and propagates inward toward the interior of the T-shaped port. Simultaneously, the shock wave within the straight tunnel continues to expand toward the main tunnel, forming a triangular wave front that propagates along the bottom of the T-shaped port. Subsequently, this wave front undergoes its first reflection on the blast-facing surface, generating a reflected wave with relatively high pressure. Additionally, due to the sudden contraction effect of the T-shaped port section, an oblique shock wave with a specific angle forms within the straight tunnel. This oblique shock wave superimposes with the triangular wave initially transmitted from the exit of the T-shaped port, and they propagate together forward along the corridor tunnel. In the main tunnel, as the reflected wave on the blast-facing surface propagates, it undergoes a second reflection on the blast-back surface and returns to the blast-facing surface again; however, no significant third reflection phenomenon is observed. Ultimately, as the shock waves gradually catch up with and superimpose upon one another, a red high-pressure planar region propagating along the tunnel gradually forms.
According to the load characteristics of shock waves at each batch measured at points B1, B2, and B3, in conjunction with the numerical simulation propagation contour map and aerodynamic theory, the formation mechanisms and propagation features of the shock-wave curve characteristics for different batches can be systematically analyzed and determined.
Based on the analysis of
Figure 9 and
Figure 10, when the shock wave initially enters the T-shaped opening, the expansion wave diffracts and reaches the back blast surface, subsequently propagating along it toward the interior of the tunnel. Given that the sensors are positioned 1 m away from the entrance section of the main tunnel, at the measurement point section, the expansion wave has already reached the back blast surface via diffraction. The peak overpressure of the first batch progressively decreases from B3 to B1, while the shock wave arrives at the B1 measurement point first, which aligns with the propagation characteristics of the expansion wave. It can thus be inferred that this shock wave corresponds to the expansion wave generated by the inward propagation of the shock wave in the straight tunnel as it interacts with the T-shaped opening. Based on the overpressure characteristics and arrival times of the second batch of shock waves, it is evident that these shock waves result from the reflection formed after the shock wave in the straight tunnel collides with the wall of the blast-facing surface. This reflected wave propagates outward spherically from the detonation point with a relatively high velocity. Consequently, the second batch of overpressure responses occur nearly simultaneously at the B2 and B3 measurement points, where they overlap with the expansion wave, leading to more intricate waveform curves.
In the experiments described in this paper, a semi-enclosed space was formed as a result of the protective door’s presence. The shock wave underwent successive reflections off the blast-facing surface, the back-blast surface, and the door itself. Notably, measuring point B4 was concurrently influenced by reflections from both the back-blast surface and the door, leading to the longest positive pressure duration and the highest impulse recorded at this specific location.
3.4. Prediction of Momentum at Measurement Points of Main Tunnel
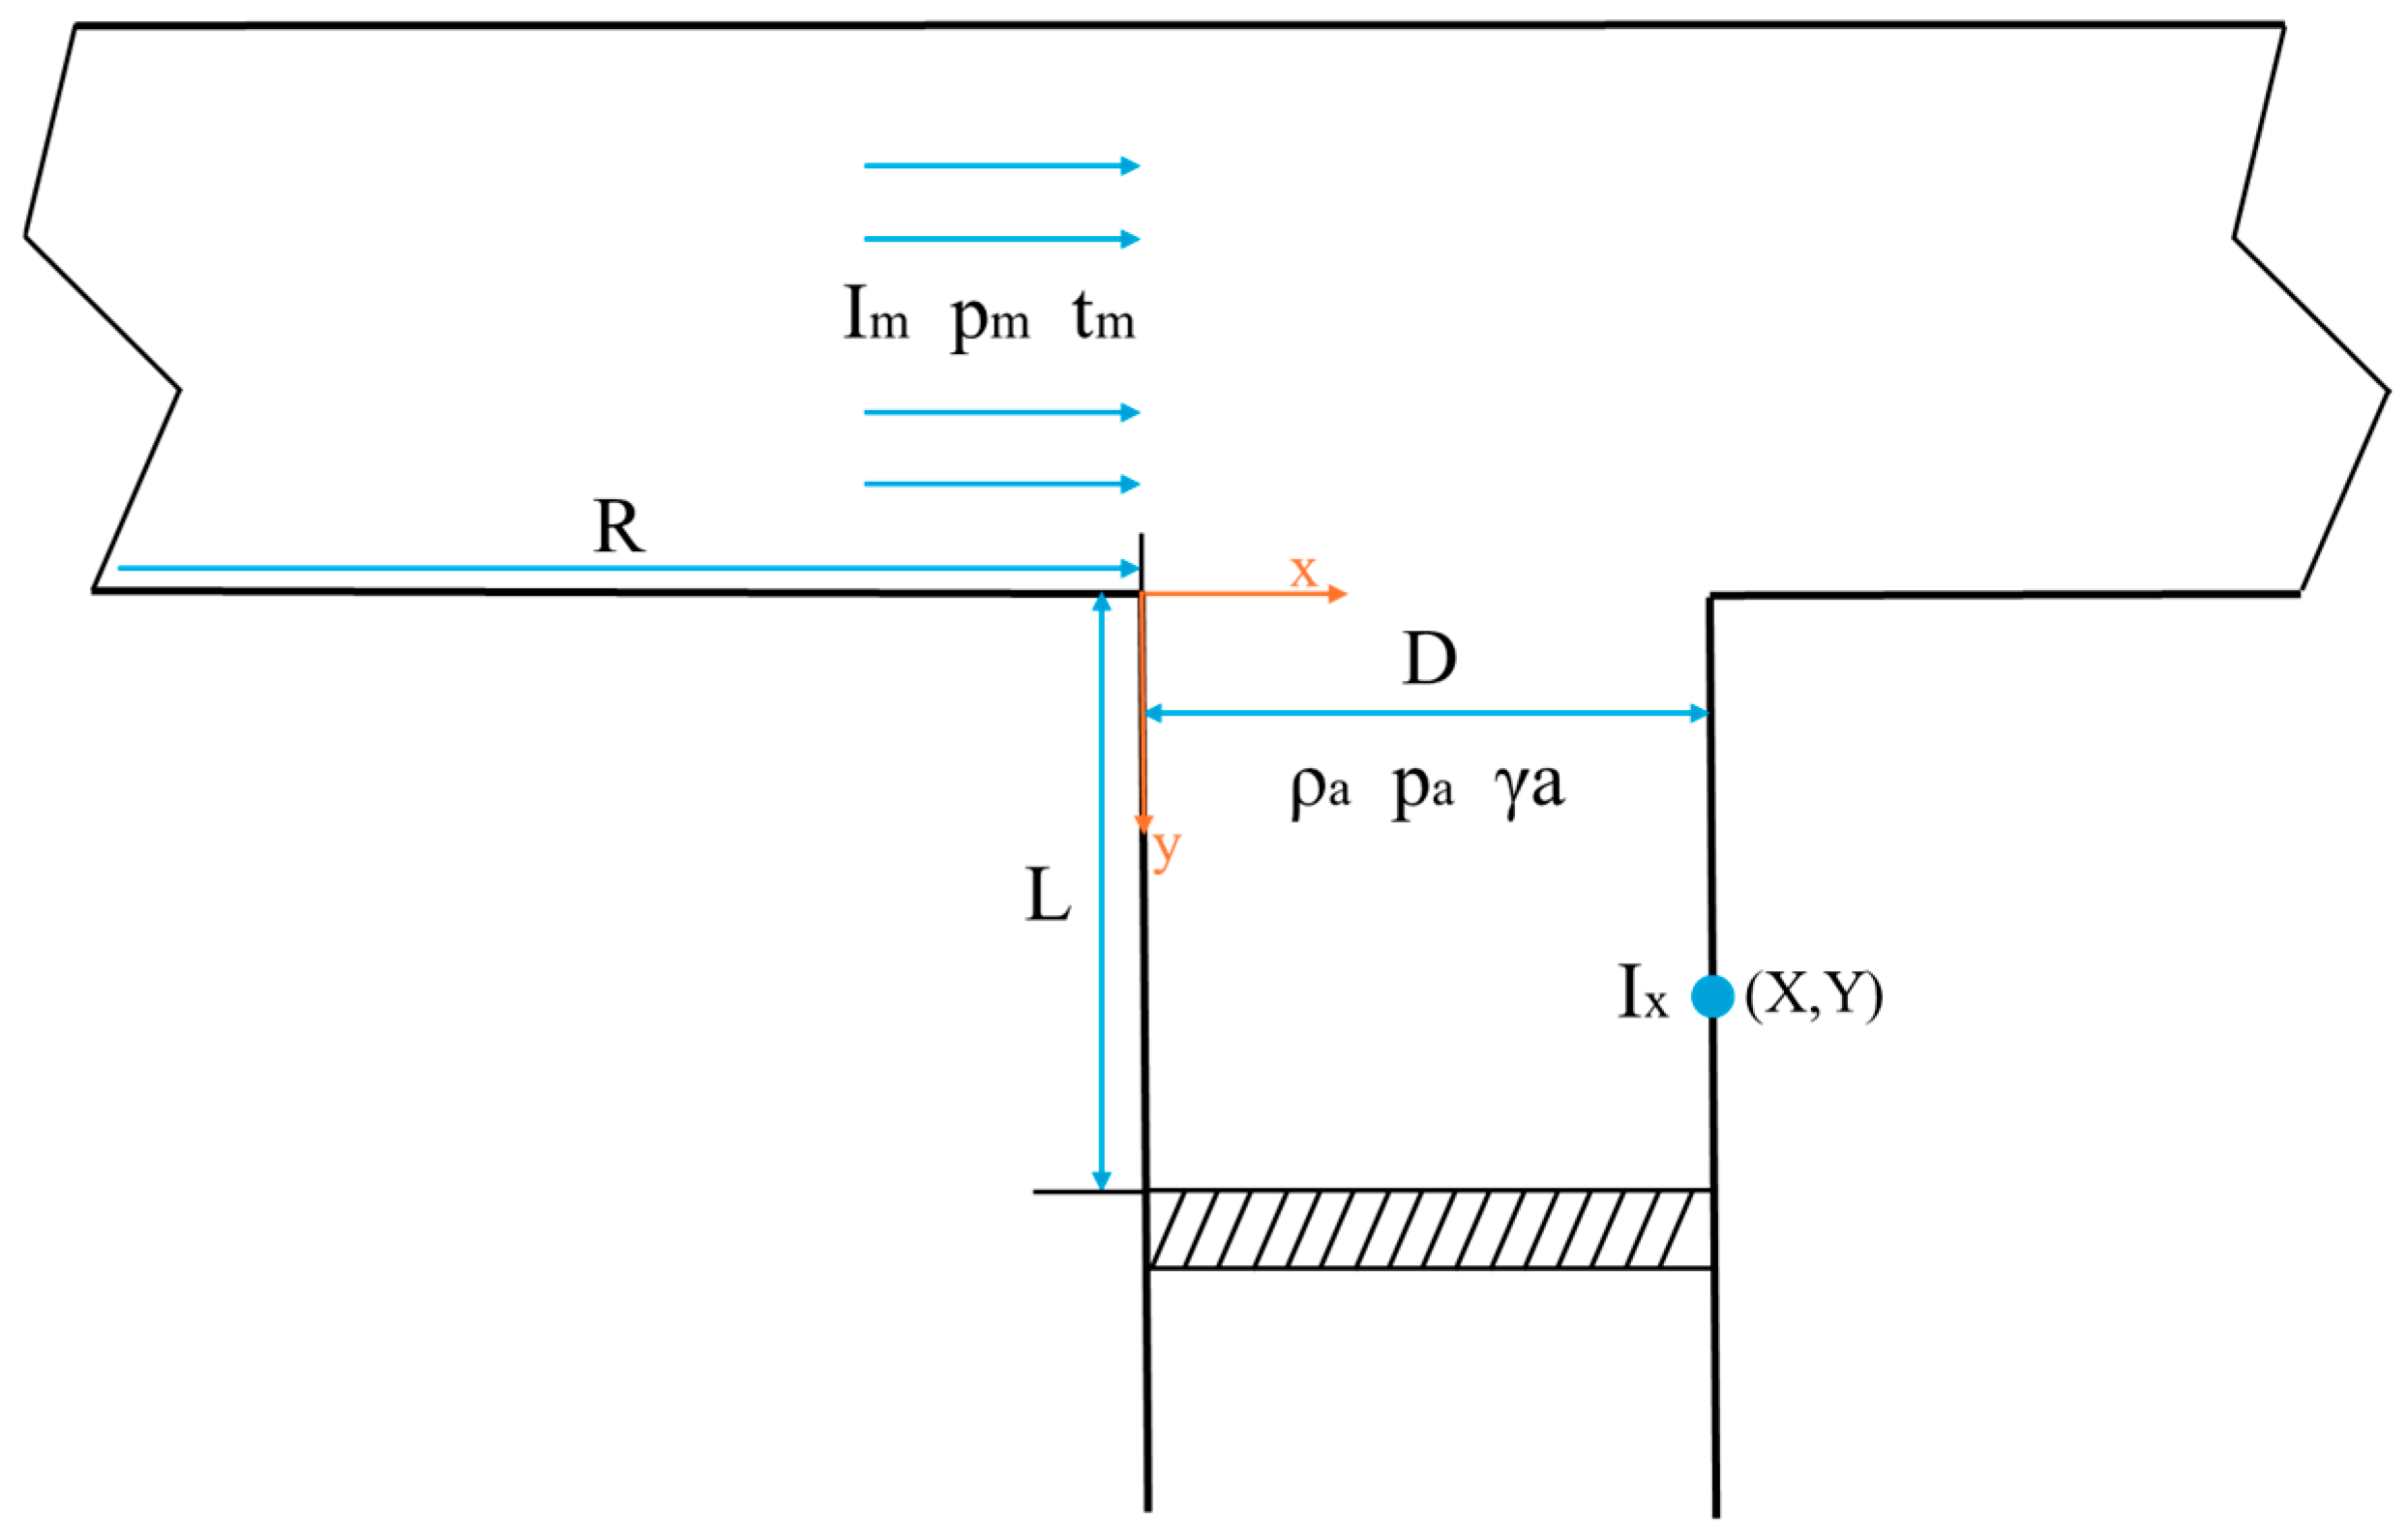
By comparing the impulse and peak value within the T-shaped opening, it can be found that the impulse is the main factor for evaluating the degree of the shock wave’s effect on the inner wall surface of the main tunnel. A dimensional analysis was conducted on the physical model of the T-shaped tunnel with a protective door (as shown in
Figure 19). Ignoring the influence of the size and shape of the explosive, the tunnel and the protective door were assumed to be rigid bodies. The width of the T-shaped opening was D, and the distance from the tunnel door to the opening of the T-shaped opening was L.
Considering the equivalent of the explosive, the proportional distance between the T-junction and the entrance of the tunnel is . It is assumed that the distance from the T-junction to the entrance of the tunnel is sufficient for the shock wave to form a stable triangular plate. Suppose the shock-wave pressure entering the T-junction is , the positive pressure action time is , the initial density of the air in the T-junction is , and the initial pressure is . The propagation of the shock wave is regarded as an adiabatic process, and the adiabatic coefficient of the air is .
Let the impulse of the shock wave entering the T-shaped port be , the peak overpressure be , the positive pressure duration be , and the coordinates of a point on the inner wall surface of the T-shaped port be X and Y. The impulse at this point is . Ignore the influence of the tunnel cross-sectional shape.
The main determining parameter group of this problem is
,
D,
L,
X,
Y,
. The impulse at a point on the inner wall of the T-shaped port can be expressed as the following functional relationship.
Using the L-T-M measurement unit system, according to the Π theorem, taking the independent dimensional quantities as
,
, and
, the following dimensionless combinations can be determined from the main parameter group:
After rearranging and simplifying Equation (4) and substituting it into Equation (3), the dimensionless functional expression for the impulse can be derived as follows.
The following will substitute the reference values into the above formula, conduct operations and parameter traversals using code, and provide reference suggestions for engineering applications.
Based on the analysis and prediction with the parameters of this test model, under the fixed test conditions, when the proportional distance
is constant, the parameters
and
at the entrance of the T-shaped port remain unchanged. Meanwhile, the shock wave propagates in the same medium (air), and
and
remain unchanged. Considering the practical application and convenience, let
= 1,
= 1,
= 1,
= 1, and
= 1, to obtain the simplified engineering model of the shock-wave impulse on the inner wall surface of the tunnel T-shaped port:
When organizing the form of a function by experimental methods, an exponential relationship form can often be adopted in a certain range of the independent variable. Suppose the variable has the following relationship:
Among them, A is a constant.
Based on the 13 sets of impulse data in the T-shaped tunnel, the parameters of each working condition are brought in, ensuring that A is a constant, and the two points (B3, B4) with the highest peak and the largest impulse in Con3 are verified.
The parameters
A,
α,
β, and
γ are obtained after screening in a traversal manner as shown in
Table 4:
Under this parameter, the comparison of the predicted and actual impulse values of measuring points B3 and B4 is shown in
Table 5. This formula is applicable for the excessive volume prediction of the internal space when a protective door is installed in a T-shaped oral cavity. However, due to the limitations of this experiment, this model is established in a circular arch-shaped tunnel with a width of 1.2 m. Considering the multiple reflection phenomena of shock waves within the tunnel, when using this formula, it is necessary to make further corrections based on the actual width of the tunnel.
