Abstract
This work presents a validation process of a Helmholtz cage developed by the authors at AGH University of Krakow. This type of test stand can generate a near-uniform, precisely controlled magnetic field inside its workspace. This is a crucial tool for several applications, including calibration of magnetic sensors, testing magnetorquers, and hardware-in-the-loop tests of attitude determination and control systems of small satellites. Although many institutions develop Helmholtz cages, we found the literature on methods of validating the final accuracy and uniformity of the generated magnetic field somewhat lacking. In this research, we showcase an approach to perform 3D scans of the magnetic field inside the cage using a probe actuated by a robotic arm. With that method, we verified that the magnitude and angle nonuniformity of the magnetic field vectors in our cage are below 2 percent and 0.4°, respectively, for a wide range of control inputs. We also perform background magnetic field measurements to identify and quantify sources of magnetic disturbances coming from the outside of our system and propose methods of minimizing their impact. It turns out that careful design and building process of the cage and its power driver might not be sufficient to achieve the optimal performance. In our case, we found that some factors, if unmitigated, can cause an error of a few milligauss. Hopefully, this work will help other teams developing similar devices avoid at least some of the possible pitfalls.
1. Introduction
Helmholtz cages can generate a near-uniform, precisely controlled magnetic field under laboratory conditions. This is useful for applications such as the calibration of magnetic sensors [1], the testing of magnetic torquers [2], and the characterization of residual moment [3]. If the device under test is not stationary within the cage, but moves significantly, it is not enough to control the field in the center of the cage, but a wider area of nearly uniform field is needed. Therefore, larger cages [4,5,6], often supplemented with rotary stages or air bearings [7,8,9], are used for closed-loop testing of small satellite attitude determination and control systems (ADCS).
A classical Helmholtz coil pair consists of two identical circular coils, appropriately spaced along their common axis of symmetry to generate a near-uniform magnetic field in the center of the setup. Helmholtz cages aim to provide control of the magnetic field in all three axes. A theoretical work by Pastena and Grassi [10] explores optimal designs for three pairs of square or circular coils placed orthogonally. In addition, the authors investigate the use of four coils per axis and compare all these designs for the use cases of achieving the best field uniformity, maximum field intensity, and electrical power efficiency. Merritt et al. [11] investigate setups consisting of square coils with three, four, and even five of them per axis. In addition to those theoretical works, Magdaleno-Adame et al. [12] provide a comprehensive finite element analysis of many of these configurations.
Some researchers use three pairs of circular coils for their Helmholtz cage designs [13]. Sometimes, more than two coils are used per axis [14]. However, most setups use three pairs of orthogonally oriented square coils [4,5,6,7,8,9]. According to [15], square coils provide better use of space and field homogeneity compared to a circular setup. They are also easier to build from readily available components, making this choice more practical.
Teams developing Helmholtz cages use different strategies to verify their design. This process is especially important if there is a strict requirement on the magnetic field uniformity within a specified workspace inside the cage. It is also crucial to calibrate the power source to achieve the desired intensity of the magnetic field. One possible strategy is to model the entire setup with the finite element method [8]. This approach is relatively simple to implement, but does not provide end-to-end verification. Some researchers actually measure the magnetic field inside the cage by applying a constant current to one or more coil pairs. This can be done by placing a magnetometer at several points along one of the axes, like in [5,9], on a plane like in [6], or distributed in a 3D space [2]. Some teams also attempt to use feedback control, with a single magnetometer constantly measuring the magnetic field intensity achieved at a single point [4].
The main aim of our research is to enhance the methods used for validation and calibration of Helmholtz cage test stands by:
- Proposing a procedure for measuring the uniformity and accuracy of the generated field by performing repeatable 3D scans of the field intensity and direction within the cage workspace for different coil current values.
- Comparing the results of the magnetic field scans performed for different currents applied to the coil with an analytical model.
- Performing control measurements to characterize disturbances in the background magnetic field and the influence of the moving robotic arm, which is part of the measurement chain.
- Analyzing the sources of errors uncovered in the generated fields and propose appropriate mitigation methods whenever possible.
- Developing an analytical model of the magnetic field generated inside the cage, which could be used, for example, to design a closed-loop magnetic feedback controller.
Hopefully, this will help other research teams avoid certain pitfalls and realistically assess the accuracy, homogeneity, and stability of the generated magnetic field.
The work is organized as follows. In Section 2 we briefly outline the design of our test stand, including the custom current controller and analytical model of the generated magnetic field. Section 3 describes the experimental setup used to verify its performance, which consists of a small industrial robot that carries a long boom with a milligauss meter probe installed at its tip. Section 4 presents the results of various experiments, including a comparison of the modeled and measured magnetic field distribution. The discussion of the results is provided in Section 5.
2. Helmholtz Cage Design
2.1. Purpose of the Test Stand
The first-generation test stand developed in our laboratory [16] was used to verify the algorithm for partial, magnetic field-based, orbit determination [17,18]. Based on our experience gathered throughout this project, we have designed and built a new cage that is mechanically more precise and driven by a redesigned controlled current driver made by Inteco [19] company. These improvements yield better uniformity and precision of the generated field. We also developed a spherical air bearing table [20], which, integrated with the Helmholtz cage, provides dynamical testing capabilities of three axes of freedom similar to the one presented in [21]. Alternatively, our setup with the STANDA 8MR190-2-28 (Vilnus, Lithuania) rotary stage [22] allows testing small satellite models with precisely controlled rotation around one axis. The sensors and actuators of the test piece are usually mounted in the center and displaced by a few centimeters as it rotates. Therefore, the test stand must produce a nearly uniform field within its predefined workspace.
2.2. Mechanical Design
Our cage is constructed with three pairs of square coils as shown in Figure 1. Each pair produces a magnetic field along one direction of the Cage Reference Frame (CRF). For our application, we need the generated field to be sufficiently uniform in the workspace defined as a cuboid located in the center of the cage. The workspace is slightly narrower along the vertical axis because the air bearing table we intend to use can potentially displace a device under test more in the horizontal plane than up or down. The maximum deviation of the field magnitude relative to the central point of the cuboid should not exceed 2%, and the maximum allowed direction error is 0.4°. According to [23], for two square coils with a side length of d, it is best to space them apart by to maximize field uniformity. We also needed to optimize the number of coil turns n, the area of the wire cross-section a, and the length of the coil side d to generate a sufficiently large and uniform field with limited electrical power input . The increase in the number of turns and the wire cross-section increases the field. The increase in the coil side length makes the field in the center of the cage weaker but more uniform. The power depends on the geometric and electrical properties of the coils by
where U is the electrical voltage, is the resistivity of the wire material. We designed the cage to simulate a magnetic field around the Earth, which does not exceed 0.65 G. Therefore, we assumed that the cage should be able to generate up to 1.5 G in the center of the cage on each axis, to cancel the background field and create the desired one on top of that with a significant margin. Taking into account the aforementioned considerations, we arrive at the specifications given in Table 1.
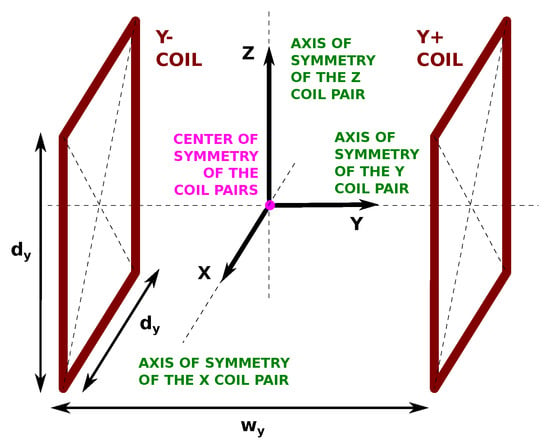
Figure 1.
Helmholtz Cage Reference Frame (CRF). Its origin is in the geometric center of coil pairs. Note that only one of the three perpendicular coil pairs is presented here for clarity.

Table 1.
Main design specifications of the Helmholtz cage.
The cage coils are attached to an aluminum frame by 3D printed elements as shown in Figure 2. The frame is made of T-slot aluminum profiles. The entire cage is then attached to a polymethyl methacrylate (PMMA) plate placed at the top of a thick sheet of plywood, which ensures the rigidity of the cage base (see Figure 3).
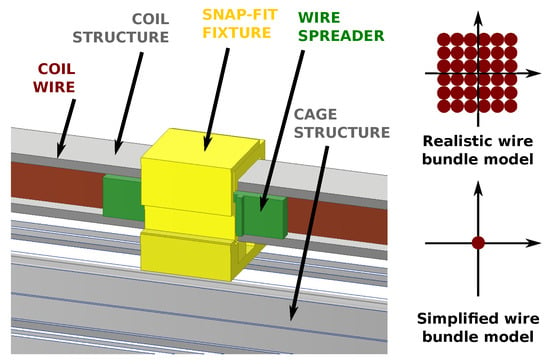
Figure 2.
Coil wire is placed in multiple loops in a C-shaped aluminum channel mounted to the cage structure. Snap-fitted spreader elements are used to keep the wire bundle pressed to the inside of the C-beam and make the coil cross-section shape uniform. Two models were considered in the mathematical modeling of the coil: the realistic one, assuming multiple loops of wire, and a simplified one where the coil was approximated with a single loop of wire located in the center of the wire bundle (see Table 2).
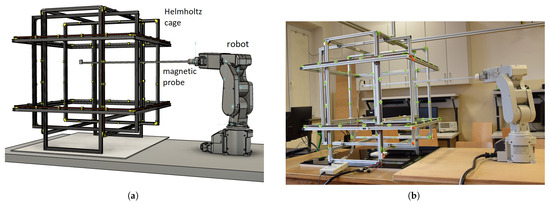
Figure 3.
Helmholtz cage is powered with a computer-controlled current driver. The robot carrying a precise 3-axis magnetometer sensor attached to the boom can repeatably measure the magnetic field in predetermined positions inside the cage workspace: (a) CAD visualization, (b) real photo.

Table 2.
Root mean square difference between the magnetic field modeled with single-loop and multi-loop analytical models of the coil wire bundle (see Figure 2). The error introduced by the simplified model is at least one order of magnitude smaller than the other expected errors. This justifies the use of a simplified model throughout this study.
| Compared Value | RMS Difference |
|---|---|
| field | |
| field | |
| field | |
| B magnitude |
2.3. Magnetic Field Model
To facilitate cage design, to allow numerical analysis of its properties, and to enable computer simulations of its behavior, a simplified mathematical model based on the Biot–Savart law has been developed. The final formula allows us to compute all three components of the magnetic flux density vector relative to the cage reference frame, at a location given by three Cartesian coordinates, for given currents of all three coil pairs of the cage. A closed analytical formula has been derived with the help of the Symbolic Math Toolbox available in the MATLAB environment. To make the problem tractable, several simplifying assumptions have been made:
- The corners of the square coils are not rounded (the radius of curvature is infinitesimally small). As a result, the coil consists exclusively of line segments.
- The diameter of a copper magnet wire that forms coils is negligible. Hence, it can be assumed that the current flows along a one-dimensional line.
- All materials used for cage construction have identical relative permeability equal to the permeability of ambient air and are magnetically anisotropic.
- The cage is in a free space – the magnetic field generated by the cage is not distorted by any external object.
The net magnetic flux density vector can be computed as a vector sum of three vectors generated by the three pairs of orthogonal coils. The magnetic field of each pair is the sum of the fields originating from the two coils it comprises. The magnetic induction of a single coil is the sum of components contributed by all its turns or loops. A field of a single turn is the sum of the fields generated by all its four sides. Hence, the total induction vector can be broken down into terms corresponding to straight wire segments with current. Each of those terms can be computed according to the Biot–Savart law as a line integral along a straight path. For that problem, there exists a closed-form solution involving only elementary functions. Hence, the overall formula can be easily used for numerical computation.
Two different models with different levels of fidelity were considered. The more complex one assumes that the coil is made up of a number of turns of wire and that individual wires are uniformly distributed over a square cross-section of the C-shaped channel (see Figure 2). In the simplified model, the multi-turn winding is represented by a single loop of wire located in the geometric center of the square cross-section. That greatly reduces the complexity of the resulting formula. Table 2 shows the results of the comparison of those two models. The data correspond to a case where only the x axis coil pair is fed with full rated current, while the other two coil pairs are de-energized. That explains a nearly two-order-of-magnitude difference between errors in x and y axes. Since the error caused by model simplification is considerably smaller than other expected errors (e.g., the uncertainty stemming from the limited accuracy of the coil current driver), we decided to employ the low-fidelity variant for further analysis.
Even for the simplified model, the derived mathematical formula is relatively long. It comprises 1410 addition operations, 510 subtractions, 2424 multiplications, 195 divisions, 1152 square computations, 96 square root extractions, and 1074 parentheses. Hence, we decided not to present it in the paper, but it is available at the public GitHub repository [24]. Despite the large number of operations, it only takes about 42 µs to compute the magnetic field vector in the MATLAB R2019b application running under the Windows 10 Pro operating system on a PC with the Intel Core i7-1065G7 CPU @ 1.3–3.9 GHz microprocessor. That makes the model fully applicable and practical for most design and analysis purposes. Figure 4 shows an example plot of magnetic field lines in the 0yz plane for a field generated by a pair of Helmholtz coils wound around the 0y axis. Each line has been obtained by solving (for different initial conditions) a set of ordinary differential equations with right-hand-side expressions dependent on the magnetic field vector. For this task, we used the ode45 function [25] available in MATLAB. It took about 50 s to draw the plot.
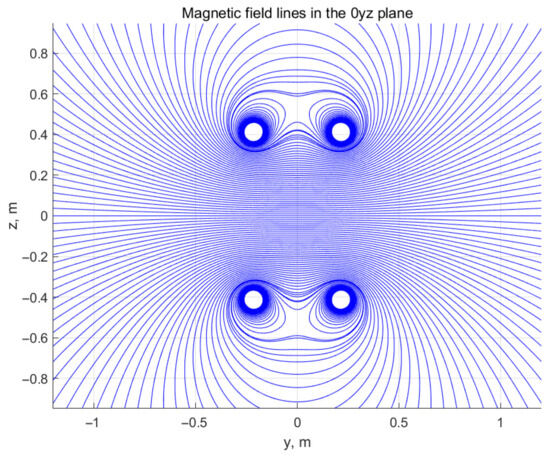
Figure 4.
Magnetic field lines in the plane for the case when only the coil pair wound around the axis of the cage is energized. The plot has been prepared using the simplified mathematical model of the cage derived based on the Biot–Savart law.
2.4. Controller Design
The Helmholtz cage control system block diagram is presented in Figure 5. It incorporates the three-channel power interface that amplifies the input voltages (, , and ) controlling the coil currents; an analog control and measurement signal conditioning block, and a power supply block that generates the supply voltages required by the electronic components. Furthermore, the RT-DAC/Zynq [26] control board is used for rapid control prototyping.
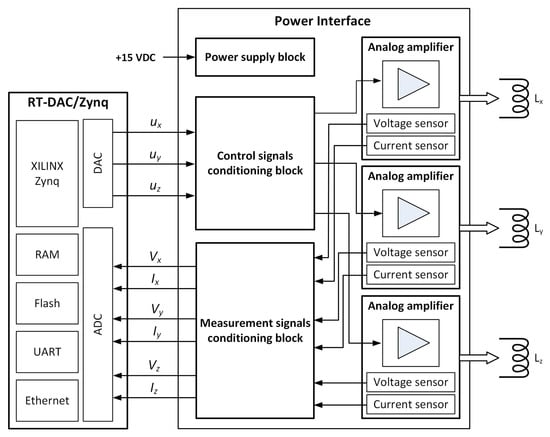
Figure 5.
Block diagram of the system controlling coil currents. It comprises two main units: a custom power interface and a universal control and measurement platform (RT-DAC/Zynq). Each coil pair is driven by an individual analog power amplifier controlled with an output signal of a digital-to-analog converter. Coil voltages and currents are measured with suitable sensors and analog-to-digital converters. An algorithm of a coil current controller is implemented on a processor of a Zynq SoC device. The controller source code is automatically generated in a MATLAB/Simulink environment.
Supply voltage and current are provided to the , , and coils by three power analog amplifiers with built-in thermal, overvoltage, and short circuit protections. Each of them is powered by the 15 V DC voltage and can supply up to 2 A of current (limited by coil resistance). The analog power stage reduces the fluctuation of the magnetic field, especially in comparison with an H-bridge driver driven with a PWM-modulated signal causing current ripples in an inductive load. The power interface contains sensors measuring the currents (, and ) and voltages (, and ) of the Helmholtz cage coils. The current is measured with a 0.01 shunt resistor, with a tolerance of 0.5% and a temperature coefficient of 75 ppm/°C. The analog signal conditioning blocks scale the voltages provided by the sensors to the range of the ADC converters located on the RT-DAC/Zynq board. The same board hosts the coil current regulator, which generates the voltage control signal based on its measured and desired values.
3. Materials and Methods
3.1. The Experimental Setup
The experimental setup is presented in Figure 3. In addition to the Helmholtz cage and computer-controlled current source, it also includes a small industrial Mitsubishi RV-2F-D robot and a magnetic probe. The probe consists of an aluminum C-beam rigidly connected to the robot wrist and a sensor of a three-axis magnetometer mounted on its tip. The sensor is connected to an electronic unit of the meter with a flat ribbon cable.
Mitsubishi RV-2F-D [27] is a 6-axis industrial robot with a rated load of 2 kg and pose repeatability of . It is rigidly fixed to the wooden table at a distance that allows it to reach with the probe inside the cage and operate within a relatively large interior workspace. Its workspace is limited by the reach of the arm, the movement limits of the joints, and the horizontal beams of the Z-axis of the Helmholtz cage, which are an obstacle to the probe arm. Simultaneously, we wanted to place the robot as far from the cage as possible to reduce its effect on the magnetic field generated by the device.
Magnetic field measurement is performed with the MR3 Magnetoresistive Milligauss Meter from Alpha Labs [28]. Its declared sensitivity error is of the reading and the maximum offset error is . The sensor includes three discrete sensing elements (for fields along the X, Y, and Z axes), which are factory-calibrated to ensure that the three axes are perpendicular. The sensing elements are located a few millimeters apart.
The magnetic sensor is attached to the probe beam with a 3D-printed PLA interface. In addition to precisely positioning the end effector, the robot also provides measurement of this position in the robot reference frame (RRF). We use this to measure the position and orientation of the Helmholtz cage relative to the robot. A downward-pointing tip present on the magnetometer mount, as shown in Figure 6, can be positioned to touch each of the three markers attached to the lower Z-axis coil of the cage. Next, their position in the RRF can be used to calculate the cage positioning and to find a transformation between the cage and robot reference frames (CRF, RRF).
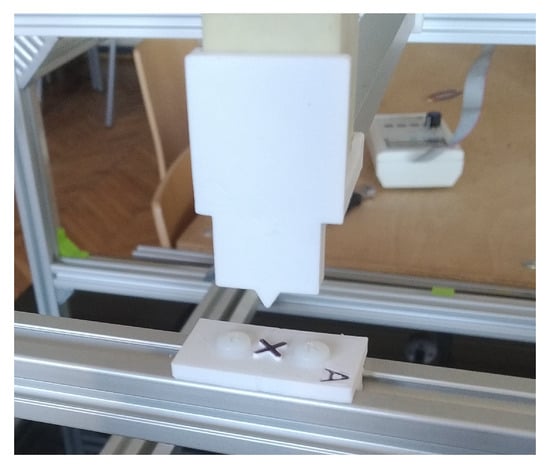
Figure 6.
Tip at the end of the magnetic probe was used to measure the position and orientation of the three not collinear markers (one of them shown as example) attached at known locations to the Helmholtz cage. After reading their coordinates with the robot by aligning the tip in their centers, we could calculate the translation and rotation between the robot reference frame (RRF) and the cage reference frame (CRF).
The robot, the Helmholtz cage, the power supply, and the milligauss meter are all controlled by a computer. This allows us to automate the measurement process. It is especially important because the entire 3D scan of the magnetic field workspace inside the cage is relatively long and takes around 3.5 h. Moreover, it is better to conduct it at night, to avoid some of the magnetic disturbances described in Section 3.2.
3.2. Error Sources
We performed two experiments to estimate the expected magnetic field measurement error. First, we placed the milligauss meter in the center of the Helmholtz cage, with inactive coils, and observed the background field. This measurement, shown in Figure 7, lasted about three days (Saturday, Sunday, and Monday to include both a weekend and a normal workday).
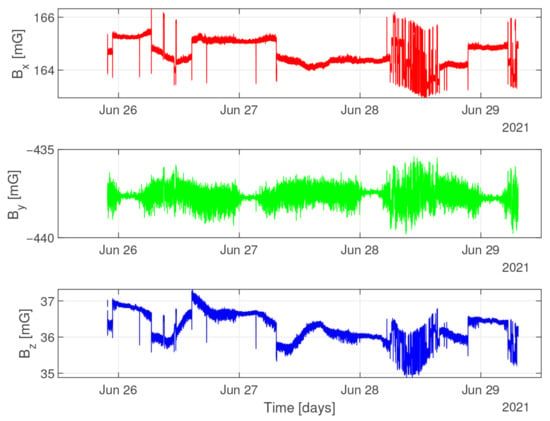
Figure 7.
Measurement of the background magnetic field. The magnetometer was placed inside the cage for three days, with both the cage coils driver and the robot disabled. The step changes in the field (especially in ) are due to the elevator in the building stopping at different floors. The noise increase between 5 am and midnight (especially in and ) is probably due to the working hours of the public tram system. The slow drift corresponds to the daily variations of the Earth’s magnetic field.
First, the steep step-like changes and spikes in the magnetic field are caused by the elevator installed in the building. Steps occur when the elevator moves from one floor to another and stays there for a while, while spikes are associated with the elevator moving to a particular floor and then immediately returning. Notice that in Figure 7 those effects are especially visible on the X-axis, on 28 June (Monday). On Saturday and Sunday (26 June and 27 June, respectively), there are few people in the building and the elevator is rarely used. In order to validate this, we performed a shorter background field measurement while logging elevator floor positions. The results for the X-axis are shown in Figure 8. Elevator movement can introduce disturbances in the field of up to 2 mG in the X-axis, and up to 1 mG in the Y and Z axes. Those easily noticeable changes can be explained by the fact that the elevator shaft is in the immediate vicinity of our laboratory and its cage is made of metal, as is the massive counterweight.
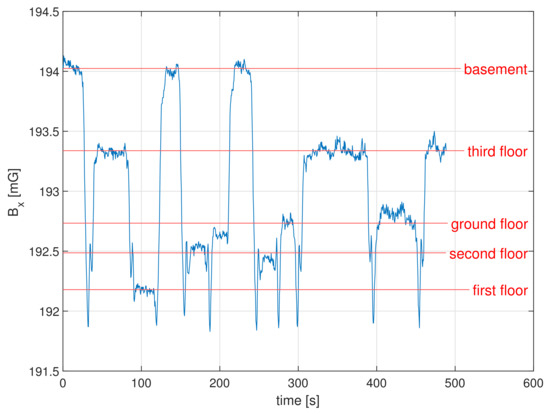
Figure 8.
Measurement of the background magnetic field in the X-axis performed while noting the elevator floor position. The Helmholtz cage is located on the 3rd floor. The value of the magnetic field is largest when the elevator is in the basement, which coincides with its counterweight being closest to the laboratory. It is smallest when the elevator is on the first floor, which coincides with both the elevator cage and its counterweight being relatively far away from the Helmholtz cage.
Second, some noise with a standard deviation of about 1 is visible on the Y-axis. Interestingly, it is not present between midnight and 5 am for all three measurement days. Its probable causes are the disturbances introduced by the public electric tram service in the city. The network does not work for five hours at night, which is exactly in accordance with the absence period of noise. We have made an attempt to estimate the possible magnetic field generated by the tram system by approximating a tram line with two infinite wires spaced vertically by 5.5 m and a maximum current draw by a single tram of 1200 A while accelerating. There are two such lines, at distances of 590 m and 650 m. As many as 10 trams accelerating simultaneously on each of them would be needed to generate a peak-to-peak magnetic field amplitude of 1.4 mG at our cage location. This seems like an unrealistic scenario, so there are probably some other effects in play. We have tried to measure disturbances coming from the building’s electric network, but they seem to be negligible, probably due to alternating current, and pairs of wires placed close to each other in the walls and cables. There are also no other large current consumers in the vicinity that we could identify that would be periodically disabled at night. One possibility is that some metal pipes or other underground infrastructure create a magnetic circuit that allows the magnetic field generated by tram lines to travel from the source to the building where the Helmholtz cage is located.
Finally, in addition to the previous effects, it is apparent that the magnetic field values drift slowly in all three axes, by about 1 . According to [29], this could be explained by the natural diurnal variability in the Earth’s magnetic field. The same source suggests that disturbances up to 20 can also be present during geomagnetic storms.
To estimate the influence of the robot arm changing its position while reaching different measurement points, we measured with a magnetometer mounted in the center of the cage and the arm rehearsing the movement it will later perform during the measurements with the magnetometer attached to it. We took two subsequent measurements: with the measurement boom attached to the robot and without it. As expected, it does not matter if we remove the measurement boom (made of aluminum); almost all the observed disturbances seem to be caused by the robot itself. Figure 9 shows the magnetic field values with the robot-induced error staying within 2 on each axis.
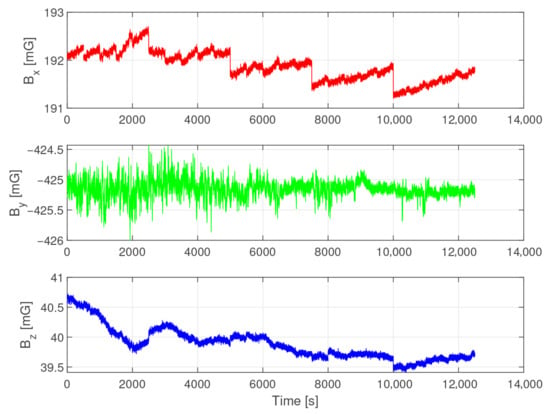
Figure 9.
Influence of the robot movement on the magnetic field inside the cage workspace. The magnetometer was placed on a mount in the center of the cage, while the empty robot arm performed movements identical to the ones during the experimental runs. It turns out that the robot can disturb the magnitude of the background field measurement by around 3 .
Identified error sources affecting magnetic field measurements in the Helmholtz cage are summarized in Table 3.

Table 3.
Summary of identified error sources affecting magnetic field measurements in the Helmholtz cage. The table lists the main disturbance sources, their physical origin or mechanism, and their quantitative impact on the measured magnetic field. The reported magnitudes correspond to observed deviations during long-term background measurements and validation experiments.
In the following experiments, we avoided the influence of building elevator and public tram systems by taking measurements at night (between 0:20 a.m. and 3:40 a.m.), when neither is in use. The natural shift in Earth’s magnetic field was mitigated by measuring the background field immediately before energizing the coil for each of the sampled points and subtracting that value from the measurement with the coil energized. Unfortunately, it is difficult to eliminate the effect of the presence of the robot, so we expect a deviation on the order of 3 in the measured values from the theoretical predictions between the different measurement locations.
3.3. Experimental Procedure
To make the experiment repeatable, we wrote a MATLAB M-file script that controls the Helmholtz cage power driver and the robotic arm positioning the sensor boom with an attached milligauss meter. It could also automatically start the experiments at a predefined time. The measurements subsequently presented were performed for different coil currents, but at the same locations organized in a point grid that spans 140 in each direction, as shown in Figure 10. After reaching each of the points, the following steps were executed:
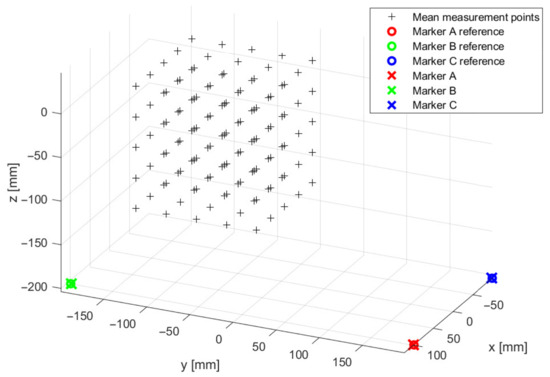
Figure 10.
Measurement points location represented in the cage reference frame (CRF). The position of three markers mounted on a cage frame is measured before each experiment and compared to their known positions to align the measurements. Black plus signs indicate the points of a 3D square grid at which measurements of the field generated by the Helmholtz cage are taken.
- Wait 10 s to allow the boom to settle.
- Disable the coils driver and perform 80 measurements of the background field.
- Enable the required current to the coils and perform 80 measurements of the field.
- Move the sensor to the next measurement point.
Given the size of the surveyed area, such a grid span yields 125 measurement points. With 80 measurements per point, this results in a total of 10,000 magnetic field measurements. A grid thus represents a practical compromise between measurement time and workspace coverage. It is also important to complete the measurements as quickly as possible to minimize the impact of diurnal variations in the geomagnetic field. The selected grid span also appears well-suited for typical applications of the Helmholtz cage, such as nanosatellite studies and the testing and calibration of magnetic field sensors.
3.4. Data Calibration
To properly interpret the results, we needed to determine the position and orientation of the sensor with respect to the Helmholtz cage. A set of three non-collinear physical markers was placed on the T-slot profiles (see Figure 6). Before the experiments, we positioned the robot arm to touch those markers with the dedicated probe. The measured position of the i-th marker in the robot reference frame was read for each of the markers in the robot control panel.
To transform the marker position (and later also the magnetic field measurement positions) from the robot frame to the cage frame, we need to establish the translation vector and the orientation matrix between the frames. The transformation formula is as follows:
We know the true positions of the markers in the Cage Reference Frame from the CAD model so that we can formulate a least-squares objective function
and find the transformation parameters using optimization methods.
As mentioned in Section 3.1, the sensing elements for the X, Y, and Z axes are located a few millimeters apart inside the milligauss meter sensing element. To take that into account, we separately stored the measurement positions for each of the axes during the experiments. They were shifted from probe positions by , , and , respectively. Furthermore, we assumed that the measurement boom can flex slightly under gravity (FEM analysis showed a bending of around 0.5° at the end of the boom. This flex causes the orientation of the sensing unit to be slightly off with respect to the robot reference frame, which we describe with the orientation matrix . The linear position error caused by the beam sag is automatically accounted for by the nature of the marker calibration procedure.
Magnetic sensors for the X, Y, and Z axes are located at slightly different locations inside the sensing probe. Their respective j-th measurements, made at the same instant of time, are , , and . However, to take into account the reference frame transitions required, let us vectorize them as follows:
Then, the calibrated value of the j-th measurement of the magnetic field in the respective axes of the cage reference frame (, , ) can be calculated by applying the rotations and as follows.
We found values of the matrix by plotting the field lines of the measured field inside the cage for several cases and finding the boom bending and twisting values that best aligned them with the simulated field. This resulted in the estimation of the boom gravity bending angle of and the twisting angle of . These distortions affected not only the sensor orientation but also the position, so we applied this rotation matrix to the measurements.
Finally, for the j-th measurement set, we obtain three position-measurement pairs corresponding to the three sensing elements: , , and . To simplify data visualization and error calculation, we need to combine the separate measurements for each axis into full three-dimensional vectors. For each of the j measurement sets, we selected a position vector that lies close to , , and . Then we interpolated the corresponding single-axis magnetic field measurement to obtain a three-dimensional vector . Thanks to taking additional measurements for each j-th set with the Helmholtz coils not energized, the value of the background magnetic field could be calculated similarly. In the next analyses, we will use those interpolated position-field-background triplets ().
In summary, the calibration procedure involves the following steps:
- Marker placement: Three non-collinear reference markers are fixed on the Helmholtz cage to define known points in the cage reference frame.
- Marker measurement: The robot arm touches each marker, and their positions in the robot reference frame are recorded.
- Frame alignment: Using the known marker positions from the CAD model, we compute the rotation and translation between the robot and cage frames via least-squares optimization.
- Sensor offset correction: Small spatial offsets of the X, Y, and Z sensing elements are recorded and applied to their respective measurement positions.
- Boom flex correction: We estimate a rotation matrix to account for minor bending and twisting of the probe due to gravity.
- Apply transformations: All sensor positions and magnetic field measurements are transformed into the cage reference frame using the calculated matrices.
- Combine axis data: Separate X, Y, and Z readings are merged into full 3D magnetic field vectors at interpolated positions.
- Background field removal: Measurements with the coils turned off are used to determine and subtract the background magnetic field.
- Final dataset: Each measurement set consists of the calibrated position, magnetic field vector, and background field used for subsequent analysis.
4. Experiment Results
Each measurement set included spatial measurements of the background magnetic field performed when the coils were disabled. An example measurement of the spatial distribution of the background field inside the coil is shown in Figure 11. The reference frame of the plot is the reference frame of the cage that originates in the geometric center of the cage. The three presented heat map cross sections are crossing that point. The plot was created by averaging interpolated values for each of the positions on the grid ( points). It is important to note that each of those 125 points was computed by averaging up to 80 individual data points (corrupt measurements were discarded). With the sampling time of the magnetometer of , collecting data for each point took around 40 with coils disabled and another 40 with coils enabled. Furthermore, measurements for the grid points were conducted sequentially, so although the data are represented on a single plot, it actually took around 3.5 h to obtain it.
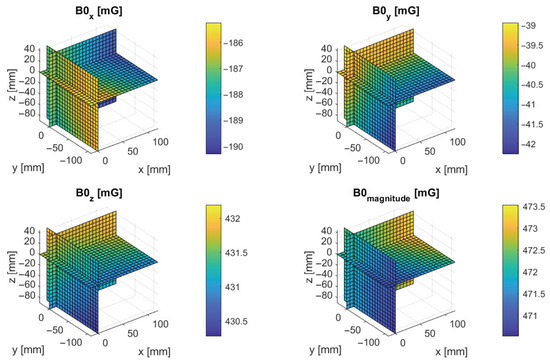
Figure 11.
Measurement of the background magnetic field. Some spatial variability is visible, even though Earth’s magnetic field should be uniform in such a small space. Notice that the value of this spatial variation is consistent with the influence of the robot position, as measured in Figure 9. Please note that the color scales of the plots are not the same, to make each of them more readable.
Therefore, the variations in the background magnetic field shown in Figure 11, are due not only to spatial, but also to temporal field changes. Taking into account the analysis of possible error sources and mitigation strategies described in Section 3.2, it seems that the variations of around 3 mG visible in the plot are of the same order as the expected errors. Furthermore, the direction and magnitude of the field are consistent with the expected geomagnetic field at our laboratory location (50.06596 N, 19.919421 E).
Thanks to the measurements of the background field , we can subtract it from the field measured when the Helmholtz cage coils were energized. An example of values of is visualized in Figure 12. This plot also presents the values calculated based on the analytical model presented in Section 2.3.
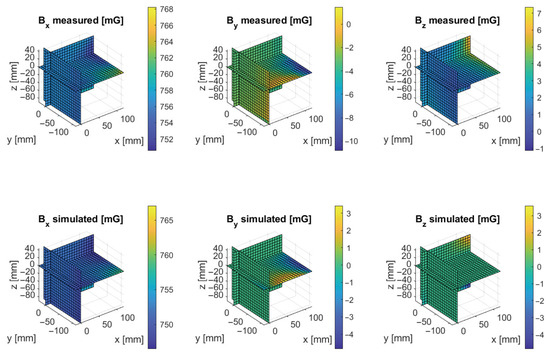
Figure 12.
Comparison of the measured and simulated magnetic field value for coils powered with currents , , and . The plots show slices of the interpolated field measurements taken at 125 points (5 × 5 × 5 grid). For each point, 80 samples of the field were taken, and another 80 samples of the background field with the cage disabled. For the measured data, the averages were calculated, and the background was subtracted to show the field generated by the cage itself. Please note that the color scales of the plots are not the same, to make each of them more readable.
It is apparent that the values of the modeled and simulated fields are similar, but it is perhaps easier to see the error between them in Figure 13. In addition to the error on the particular axes, it also shows the field magnitude and direction errors.
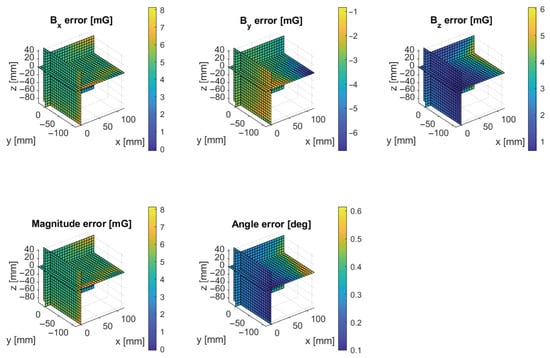
Figure 13.
Error in the magnetic field value and direction. The data from Figure 12 was used, but the values are represented as the difference between the measured and expected (simulated) magnetic field in terms of value and vector angle. Please note that the color scales of the plots are not the same, to make each of them more readable.
Those differences between measurements and simulation can easily be quantified in terms of root mean square errors. Seven experimental runs were conducted as part of this study. Each of them differs in the currents applied to the Helmholtz cage coil pairs. The resulting modeling errors are summarized in Table 4.

Table 4.
Root mean square error of the Helmholtz cage magnetic field model, compared to the spatial magnetic field measurements. It was calculated for a uniformly spaced cubic cloud of points, similar to the measurement cloud seen in Figure 10.
The RMS modeling error along the axes of the pairs of non-energized coils appears to be around 3 , which is again consistent with the various errors mentioned in Section 3.2. The powered axes generate slightly higher errors (on the order of 4– 5 for X and Z, and on the order of 6 for the Y-axis). This is probably due to disturbances from the robot that performs the measurement, which is constructed of a considerable amount of ferromagnetic material. As the robot performing the measurement is located towards the −Y direction, it may explain the higher errors in that axis.
The proposed simplified model may be employed for purposes such as the design and optimization of a Helmholtz cage with given parameters or the estimation of field uniformity within the workspace. For such applications, the model accuracy (as reported in Table 4) is generally sufficient. Furthermore, the model may be utilized for open-loop magnetic field control; however, such an approach should be preceded by cage calibration or by a more refined model adjustment in order to minimize the discrepancy between the target value and the actual magnetic flux density. Another possible application of the cage magnetic field model is in the design phase of a closed-loop control system with feedback signals provided by magnetic field sensors. In such a system, desired or commanded values of the magnetic flux density vector components at the DUT (Device Under Test) location are compared against actual values. The resulting errors are used to compute control signals for electronic power stages that drive individual coil pairs. Since it is usually impossible or impractical to place feedback magnetic sensors at the location of the DUT, the actual magnetic field cannot be measured directly. Instead, a non-collocated inferential control (or a soft-sensor approach) must be employed. Feedback sensors must be installed elsewhere, and the magnetic field in the center of the cage must be inferred based on available measurement results. Moving the sensors away from the device being tested also reduces the disruptive effect of the magnetic field it may generate on the operation of the cage control system. Using the magnetic field model, we can find a relationship between the magnetic field density at the DUT position and at sensor locations and use it to derive a soft-sensor formula. With a sufficient number of carefully placed and calibrated sensors, it should be possible to discriminate between external magnetic disturbances and the field generated by the cage and to compensate for the former by application of a feedforward control method. That approach depends heavily on the assumption of uniformity of the external field and nonuniformity of the field generated by the cage at sensor locations. Determination of the accuracy and effectiveness of such an approach would require further extensive research.
5. Discussion
The measurement methodology showcased in this work allowed us to perform 3D scans of the magnetic field for several cases where constant current was applied to one or more of the Helmholtz cage coil pairs. Based on the data from the experiments presented in Table 4, we could calculate the field magnitude and angle nonuniformity. Their comparison with the expected value of the model is shown in Table 5. The measured magnetic field magnitude diverges from the central point roughly by the amount expected from the model, and therefore satisfies the 2% requirement. Although the nonuniformity of the angle is slightly higher than expected, it is still well within the required 0.4°.

Table 5.
Maximum nonuniformity of the magnetic field in the Helmholtz cage workspace (central cuboid ). The deviation value is measured as the percent difference between the magnitude of the field vector at the specific point of the cage and the central point (0, 0, 0), and the maximum value is recorded here. The angle nonuniformity is measured analogically.
It is also possible to depict nonuniformity on cross-sectional heat maps; an example is shown in Figure 14. The fact that the plots for the simulated case and the experiment are very similar further increases our confidence in the accuracy of the cage construction, coil driver design, and modeling approach.
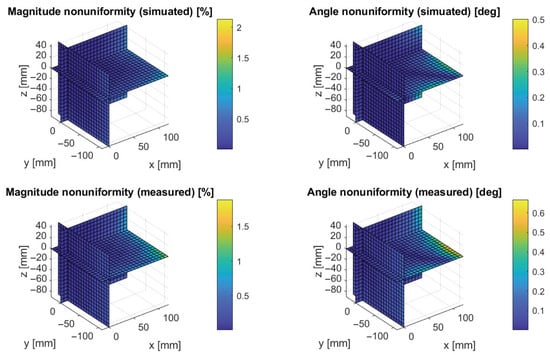
Figure 14.
An example nonuniformity of the magnetic field in the Helmholtz cage. The value deviation is measured as the percent difference between the magnitude of the field vector at the specific point of the cage and the central point (0, 0, 0). The angle nonuniformity is measured similarly. Please note that the color scales of the plots are not the same, to make each of them more readable.
We also performed some control measurements. The long-term measurement of the background field at the center of the cage (with all coils disabled) and a similar shorter-term experiment with the robotic arm performing exactly the same motion as during the 3D scans. In the process, we discovered some interesting sources of error and, where possible, proposed mitigation methods.
- The robotic arm causes errors on the order of shown in Figure 9 while moving. It will, of course, be removed altogether when the Helmholtz cage is used operationally and the robot is no longer needed for calibration and field characterization purposes.
- The nearby elevator and its metal counterweight cause step changes in the magnetic field within the coil shown in Figure 8 that amount to approximately . Possible mitigation techniques include moving the Helmholtz cage to another laboratory, as far away from the elevator shaft as possible, performing experiments when the elevator is not used, or disabling the elevator when needed.
- The medium-frequency noise that occurs from 5 am to midnight each day shown in Figure 7, which can probably be at least in part attributed to the magnetic disturbances generated by the public tram system. It cannot be easily dealt with or avoided. If it is not possible to move to another laboratory far from trams, trains, and other high-current electric DC installations, the only viable solution is to remove the experiments when they are not in use. In our case, we can do that at night when the trams are not running.
- The lower-frequency drift of the background magnetic field due to the natural diurnal variability in the Earth’s magnetic field shown in Figure 7. It appears that at our location, this error can be approximately . If the experiment is relatively short (on the order of 1 h), this can be mitigated by simply measuring the background field at the beginning and the end of the experiment and calibrating out this error.
Thanks to the fact that we developed an analytical model of the Helmholtz cage setup, in addition to the mitigation methods mentioned above, it is also potentially possible to create a closed-loop magnetic feedback control system. We can calculate in real time the expected contribution of the Helmholtz cage in a predefined position in its vicinity based on the known currents applied to the cage. It might be possible to deduce the disturbances based on measurements of a number of magnetometers strategically placed outside the defined workspace. Hopefully, closing the magnetic feedback control loop will provide disturbance rejection and improve our experimental flexibility, as it is more convenient to operate the test stand during the day. Unfortunately, there will still be some limitations. The attitude control systems of small satellites usually include magnetic torquers. Testing them with magnetic feedback would be problematic, as they themselves are a major source of the magnetic field. However, magnetic feedback can be useful, for example, in attitude determination algorithm testing, sensor testing, and calibration.
Author Contributions
Conceptualization, P.Z., D.K., A.T. and A.G.; methodology, P.Z., K.K., A.T. and A.G.; software, P.Z., D.K., K.K. and A.T.; validation, P.Z., D.K., K.K., M.R., A.T. and A.G.; formal analysis, P.Z. and A.T.; investigation, P.Z. and A.T.; resources, P.Z.; data curation, P.Z., D.K. and A.T.; writing—original draft preparation, P.Z.; writing—review and editing, P.Z., D.K. and A.T.; visualization, P.Z. and D.K.; supervision, P.Z.; project administration, A.G.; funding acquisition, P.Z. and A.G. All authors have read and agreed to the published version of the manuscript.
Funding
This work was supported by the Polish Ministry of Science and Higher Education 16.16.120.773.
Institutional Review Board Statement
Not applicable.
Informed Consent Statement
Not applicable.
Data Availability Statement
Dataset available on request from the authors.
Conflicts of Interest
The authors declare no conflicts of interest.
Abbreviations
The following abbreviations are used in this manuscript:
| ADC | Analog-to-Digital Converter |
| ADCS | Attitude Determination and Control System |
| CPU | Central Processing Unit |
| CRF | Cage Reference Frame |
| DC | Direct Current |
| FEM | Finite Element Method |
| PC | Personal Computer |
| PLA | Polylactic Acid |
| PMMA | Polymethyl Methacrylate |
| RMS | Root Mean Square |
| RRF | Robot Reference Frame |
| SoC | System on a Chip |
References
- Mahavarkar, P.; John, J.; Dhapre, V.; Dongre, V.; Labde, S. Tri-axial square Helmholtz coil system at the Alibag Magnetic Observatory: Upgraded to a magnetic sensor calibration facility. Geosci. Instrum. Methods Data Syst. 2018, 7, 143–149. [Google Scholar] [CrossRef]
- Chaisakulsurin, J.; Manuthasna, S.; Masri, T.; Panyalert, T.; Palee, K.; Prasit, P.; Kamsing, P.; Torteeka, P. Hardware-in-the-Loop Simulation Testbed for Three-Axis Earth’s Magnetic Field Generation Based on 2.4- Meter Square Helmholtz Coils. In Proceedings of the 2023 IEEE/ION Position, Location and Navigation Symposium (PLANS), Monterey, CA, USA, 24–27 April 2023; pp. 829–834. [Google Scholar] [CrossRef]
- Springmann, J.; Cutler, J.; Bahcivan, H. Magnetic Sensor Calibration and Residual Dipole Characterization for Application to Nanosatellites. In Proceedings of the AIAA/AAS Astrodynamics Specialist Conference. AIAA, Toronto, ON, Canada, 2–5 August 2010. [Google Scholar] [CrossRef]
- Little, E.; Hester, D.; Ray, A.; Addison, D.; Fogle, M.; Adams, M. Attitude Determination and Control Subsystem Testing Environment for 12U Nanosatellites. IEEE J. Miniaturization Air Space Syst. 2022, 3, 129–134. [Google Scholar] [CrossRef]
- Piergentili, F.; Candini, G.P.; Zannoni, M. Design, Manufacturing, and Test of a Real-Time, Three-Axis Magnetic Field Simulator. IEEE Trans. Aerosp. Electron. Syst. 2011, 47, 1369–1379. [Google Scholar] [CrossRef]
- Batista, D.S.; Granziera, F.; Tosin, M.C.; de Melo, L.F. Three-Axial Helmholtz Coil Design and Validation for Aerospace Applications. IEEE Trans. Aerosp. Electron. Syst. 2018, 54, 392–403. [Google Scholar] [CrossRef]
- da Silva, R.C.; Ishioka, I.S.K.; Cappelletti, C.; Battistini, S.; Borges, R.A. Helmholtz Cage Design and Validation for Nanosatellites HWIL Testing. IEEE Trans. Aerosp. Electron. Syst. 2019, 55, 3050–3061. [Google Scholar] [CrossRef]
- Olsen, J.A.; Grøtte, M.E.; Gravdahl, J.T. Attitude determination and control system testbed for hardware and software testing and verification for HYPSO small satellites. In Proceedings of the 72nd International Astronautical Congress, Dubai, United Arab Emirates, 25–29 October 2021. [Google Scholar]
- de Loiola, J.V.L.; van der Ploeg, L.C.; Cardoso da Silva, R.; Guimarães, F.C.; Borges, R.A.; Borges, G.A.; Battistini, S.; Cappelletti, C. 3 Axis simulator of the Earth magnetic field. In Proceedings of the 2018 IEEE Aerospace Conference, Big Sky, MT, USA, 3–10 March 2018; pp. 1–8. [Google Scholar] [CrossRef]
- Pastena, M.; Grassi, M. Optimum design of a three-axis magnetic field simulator. IEEE Trans. Aerosp. Electron. Syst. 2002, 38, 488–501. [Google Scholar] [CrossRef]
- Merritt, R.; Purcell, C.; Stroink, G. Uniform magnetic field produced by three, four, and five square coils. Rev. Sci. Instruments 1983, 54, 879–882. [Google Scholar] [CrossRef]
- Magdaleno-Adame, S.; Olivares-Galvan, J.; Campero-Littlewood, E.; Escarela-Perez, R.; Blanco Brisset, E. Coil Systems to Generate Uniform Magnetic Field Volumes. In Proceedings of the COMSOL Conference 2010, Boston, MA, USA, 7–9 October 2010. [Google Scholar]
- Belaidi, E.Y.; Aissa, B.; Benzina, M.B.; Mokhtar, A.A.; Kada, H.; Brahim, G. Development of Magnetometer Sensors Calibration Platform and Orbital Satellite Scenario Emulation. In Proceedings of the 2024 11th International Workshop on Metrology for AeroSpace (MetroAeroSpace), Lublin, Poland, 3–5 June 2024; pp. 163–167. [Google Scholar]
- Prinkey, M. CubeSat Attitude Control Testbed Design: Merritt 4-Coil per axis Helmholtz Cage and Spherical Air Bearing. In Proceedings of the AIAA Guidance, Navigation, and Control (GNC) Conference, Boston, MA, USA, 19–22 August 2013. [Google Scholar] [CrossRef]
- Alvarez, A.F.R.; Franco-Mejía, E.; Pinedo-Jaramillo, C.R. Study and Analysis of Magnetic Field Homogeneity of Square and Circular Helmholtz Coil Pairs: A Taylor Series Approximation. In Proceedings of the 2012 VI Andean Region International Conference, Cuenca, Ecuador, 7–9 November 2012; pp. 77–80. [Google Scholar] [CrossRef]
- Gallina, A.; Zagorski, P.; Rachucki, J. Test bed for simulation of magnetic field measurements of low Earth orbit satellites. Mech. Control 2015, 34, 47. [Google Scholar] [CrossRef]
- Zagorski, P.; Bangert, P.; Gallina, A. Identification of the orbit semi-major axis using frequency properties of onboard magnetic field measurements. Aerosp. Sci. Technol. 2017, 66, 380–391. [Google Scholar] [CrossRef]
- Zagorski, P.; Gallina, A.; Rachucki, J.; Moczala, B.; Zietek, S.; Uhl, T. An orbit determination algorithm for small satellites based on the magnitude of the earth magnetic field. Prog. Flight Dyn. Guid. Navig. Control- 10 2018, 10, 35–46. [Google Scholar]
- INTECO. 2025. Available online: https://www.inteco.com.pl/ (accessed on 18 July 2025).
- Zagórski, P.; Król, P.; Gallina, A. Batch Algorithm for Balancing the Air Bearing Platform. In Proceedings of the Advanced, Contemporary Control, Łódź, Poland, 24 January 2020; Advances in Intelligent Systems and Computing. Bartoszewicz, A., Kabziński, J., Kacprzyk, J., Eds.; Springer International Publishing: Berlin/Heidelberg, Germany, 2020; Volume 1196, pp. 736–746. [Google Scholar] [CrossRef]
- Modenini, D.; Bahu, A.; Curzi, G.; Togni, A. A dynamic testbed for nanosatellites attitude verification. Aerospace 2020, 7, 31. [Google Scholar] [CrossRef]
- STANDA. 8MR190-2-28 Rottary Stage. 2025. Available online: https://www.standa.lt/products/catalog/motorised_positioners?item=244 (accessed on 18 July 2025).
- Rudd, M.E.; Craig, J.R. Optimum Spacing of Square and Circular Coil Pairs. Res. Pap. Phys. Astron. 1968, 39, 1372. [Google Scholar] [CrossRef]
- Tutaj, A. 2025. Available online: https://github.com/spaceagh/sat-helmholtz/ (accessed on 10 September 2025).
- Mathworks. ode45() Function Documentation. Available online: https://www.mathworks.com/help/matlab/ref/ode45.html (accessed on 18 July 2025).
- INTECO. RT-DAC/Zynq User’s Manual. 2019. Available online: http://www.inteco.com.pl/Docs/Rtdac_Zynq.pdf (accessed on 18 July 2025).
- Mitsubishi. RV-2F-D Series Standard Specifications Manual. 2023. Available online: https://dl.mitsubishielectric.com/dl/fa/document/manual/robot/bfp-a8900/bfp-a8900ag.pdf (accessed on 18 July 2025).
- Magnetometer Model MR3. 2016. Available online: https://www.alphalabinc.com/wp-content/uploads/2018/02/mr3_2016.pdf (accessed on 18 July 2025).
- Onovughe, E.V. Geomagnetic Diurnal Variation Studies Using Global Models & Observatory Data at Quiet & Moderately Disturbed Times. Ph.D. Thesis, Queensland University of Technology, Brisbane, Australia, 2015. [Google Scholar]
Disclaimer/Publisher’s Note: The statements, opinions and data contained in all publications are solely those of the individual author(s) and contributor(s) and not of MDPI and/or the editor(s). MDPI and/or the editor(s) disclaim responsibility for any injury to people or property resulting from any ideas, methods, instructions or products referred to in the content. |
© 2025 by the authors. Licensee MDPI, Basel, Switzerland. This article is an open access article distributed under the terms and conditions of the Creative Commons Attribution (CC BY) license (https://creativecommons.org/licenses/by/4.0/).