Article

Digital-Driven New Quality Productivity and Its Impact on Supply Chain Resilience: A Complex Network Approach Integrating the Hadamard Product

School of Statistics and Mathematics, Zhongnan University of Economics and Law, Wuhan 430073, China
*
Author to whom correspondence should be addressed.
Appl. Sci. 2025, 15(20), 11193; https://doi.org/10.3390/app152011193
Submission received: 5 September 2025 / Revised: 13 October 2025 / Accepted: 15 October 2025 / Published: 19 October 2025

Abstract

Technological decoupling, geopolitical tensions, and carbon neutrality pressures have created systemic risks, making supply chain security a global concern. Digital-driven new quality productivity (NQP), as a key driver of supply chain upgrading, plays a crucial role in restructuring modern supply chain systems and enhancing resilience. Based on data from Chinese supply chain data from listed companies (2012–2023), this study integrates enterprise-level NQP and applies complex network methods and the Hadamard product model to analyze how NQP regulates supply chain resilience. The results show that NQP affects network resilience through three nonlinear coupling mechanisms: strengthening defense at fixed points, promoting recovery through chain reinforcement, and enhancing sustainability via network expansion. Its impact is stage-dependent—showing partial vulnerability during early technology diffusion but significantly improving overall resilience at maturity, with structural imbalance remaining a potential risk. This study provides theoretical and practical insights for optimizing supply chain structures and improving risk prevention and collaborative capabilities.

1. Introduction

Under the dual forces of deep restructuring in global value chains and the rapid evolution of technological revolutions, the security of supply chain systems has become a central focus in the economic competition among major powers [1]. As the fundamental units of economic activity, enterprises form complex and efficient supply chain network (SCN) through division of labor, competition, information exchange, and agglomeration. The stability and competitiveness of these networks play a vital role in determining the long-term sustainability and growth potential of national economies. NQP, as an emerging form of productive force, is driven by scientific and technological innovation. By integrating new labor talent, advanced production technologies, and innovative organizational structures of production factors, NQP effectively improves the quality of productivity while promoting rational and sustainable growth in its scale [2]. According to Marxist production theory, the development of productive forces is the fundamental driver of social progress, determined by the dynamic interaction among laborers, labor tools, and labor objects [3]. NQP represents a contemporary extension of this framework, reflecting the qualitative transformation and reorganization of production factors in the digital, intelligent, and green era. As one of the world’s economies with the most complete industrial system and tightly connected upstream–downstream networks, China has made NQP a core priority in its national industrial strategy. Centered on technological innovation, NQP seeks to build an autonomous, secure, and resilient industrial system. By improving innovation capacity, efficiency, integration, and sustainability, NQP reshapes industrial foundations, enhances supply quality, and strengthens key links across the network. It also boosts total factor productivity and promotes collaboration through technological diffusion and knowledge spillovers, thereby enhancing overall competitiveness. Therefore, clarifying how enterprise-level NQP strengthens SCN resilience and understanding its mechanisms are crucial for building a secure, stable, and competitive modern industrial system.
“Resilience” originated in ecology and systems science, describing a system’s ability to maintain its functions, adapt to changes, and recover in the face of external shocks [4]. In the field of supply chain management, resilience is defined as the ability of a supply chain to recover rapidly from disruptions or risks and even achieve optimization [5]. Its connotation extends beyond recovery, encompassing a comprehensive capacity for defense, response, and adaptation [6]. Considering the scale-free structural characteristics of industrial chains, Hearnshaw et al. (2013) introduced complex network theory into industrial chain research [7], viewing the industrial chain as a complex system composed of enterprise nodes and relationships such as transactions, capital flows, and technology transfers. The resilience of such a system generally refers to its ability to recover and optimize through network structural adjustments when subjected to shocks [8]. Specifically, the resilience of industrial chain networks not only concerns the stability of the overall economic system when certain segments experience sudden disruptions but also emphasizes the capacity for timely recovery and adaptive response to subsequent changes [9]. In recent years, increasing attention has been devoted to the factors influencing industrial chain resilience and pathways for its enhancement. Studies have shown that information sharing and collaborative planning mechanisms [10] as well as the adoption of industrial robots [11] can strengthen a system’s resistance to shocks through improved agility and technological spillover effects. The decentralization and traceability features of blockchain technology contribute to greater supply chain sustainability and security [12], while digital transformation has been found to significantly enhance overall industrial chain resilience [6]. Overall, technological innovation and network effects play a synergistic and reinforcing role in improving industrial chain resilience.
NQP is a form of advanced productive force driven by scientific and technological innovation. Its core characteristics lie in taking high-quality labor as the main body, high-tech production tools as the carrier, and new types of labor objects as the foundation, realizing a qualitative leap in productivity through the innovative recombination and systematic integration of these elements [13]. Compared with traditional productivity, which relies on factor inputs and capital accumulation, NQP driven by technological innovation and factor reconfiguration signifies a transition from extensive growth to green and efficient development. It embodies the integrated evolution of digital, green, and intelligent productivity while restructuring traditional production relations, representing a new stage of productivity development under the deep integration of technological progress and industrial transformation [14]. NQP features innovation-driven, green, low-carbon, and integrative development. It aligns with the goals of building a modern industrial system and serves as a key driver of industrial upgrading and sustainable economic growth. In existing research, scholars grounded in Marxist political economy generally conceptualize NQP through three core dimensions—laborers, means of labor, and objects of labor—and have developed corresponding measurement frameworks to evaluate its connotation and impact [13,15]. As a result, more scholars now focus on how NQP enhances supply chain resilience. Evidence shows that firm-level NQP improves innovation and management efficiency, which strengthens resilience by raising product quality, reducing risks, and increasing employee adaptability [16]. Moreover, the advancement of NQP improves firm performance by enhancing supply chain standards, empowering employees, and increasing labor efficiency [17]. By driving green supply chain collaboration and sustainable business practices [18], NQP also exert long-term positive impacts on sustainable economic development [13].
In summary, existing literature on the role of NQP in enhancing SCN resilience has established a solid foundation, but several limitations remain. Most existing studies rely on static regression or structural equation models, which are limited in capturing the dynamic evolution of complex systems. Research perspectives are often confined to single dimensions such as digitalization, greening, or knowledge capital, lacking an integrated analysis of multi-factor interactions. Although some studies employing complex network models emphasize topological structures, they fail to effectively link micro-level firm characteristics with the macro-level evolution of resilience (Table 1 and Table 2). Overall, existing research still needs to be deepened in terms of dynamic analysis and system integration.
Building on previous studies, this paper centers on the innovation endowment of firms’ NQP and explores how it dynamically shapes supply chain network (SCN) resilience. The main contributions are as follows: (1) It integrates NQP into the modern supply chain system and proposes a “point-chain-network” framework that explains how NQP enhances defense, recovery, and sustainability within SCNs. (2) By combining supply chain relationship data and NQP data from representative firms across industries, this study constructs a multi-industry, long-term network map, addressing the limitations of prior research that focused on single industries and static resilience analysis. (3) Within a complex network framework, a vector of firms’ relative NQP levels is introduced, and the Hadamard product is applied to develop a resilience regulation model. By adjusting inter-firm linkage strengths, the model captures the moderating effect and dynamic influence patterns of NQP under risk shocks, revealing for the first time how NQP iteratively affects network resilience through the integrated pathway of “firm characteristics-network structure-macroscopic resilience.”
The remainder of this paper is structured as follows: Section 2 elaborates on the theoretical framework and pathways. Section 3 presents the research design and model. Section 4 provides the indicator measurement and the empirical analysis of the impact of NQP on supply chain networks. Section 5 concludes with key findings and policy implications.

2. Theoretical Pathways of NQP on SCN Resilience

Driven by scientific and technological innovation, NQP comprises four key elements: new laborers, new labor tools, new labor objects, and new production organizations. New laborers represent knowledge-based and innovative human capital, providing intellectual support to the system. New labor tools include algorithms, data, and intelligent equipment, driving improvements in efficiency and innovation. New labor objects encompass digital assets and green resources, reflecting a shift in production factors from material-based to information-based and ecology-based forms. New production organizations emphasize platform-based and networked governance, offering institutional coordination and structural support. Together, these four dimensions form a modern production system characterized by people-centered development, innovation-driven progress, digital empowerment, and green synergy.
NQP enhances supply chain network resilience through a hierarchical pathway of “stabilizing nodes, strengthening chains, and expanding networks.” Its core logic lies in four mechanisms: new laborers reinforce cognitive defense, new labor tools enable technological recovery, new labor objects promote resource circulation, and new production organizations ensure institutional coordination. The interaction of these elements dynamically links defense, recovery, and sustainability, enabling supply chain networks to maintain stability and achieve high-quality development under complex environmental conditions. The specific impact pathways are illustrated in Figure 1.

2.1. Stabilize Nodes: NQP Enhances SCN Defense Capability

The Molloy–Reed criterion states that when nodes are removed from a network, structural stability must be preserved to prevent the system from fragmenting into disconnected components [35]. The node level forms the foundation of supply chain resilience, as the stability of enterprise nodes determines the system’s defensive performance during the initial stage of external shocks. NQP enhances firms’ ability to identify and respond to risks by integrating innovative technologies, digital elements, and high-quality human capital, thereby forming a stable mechanism of “technology-empowered firms—coordinated chain stabilization—resilient network consolidation” [36,37]. Specifically, new laborers strengthen cognitive defense through knowledge accumulation and skill upgrading, establishing proactive early-warning and rapid-response mechanisms. Meanwhile, new production organizations enhance structural defense through digital governance and flexible process design, enabling self-repair at the node level and institutional stability to support overall system resilience.

2.2. Strengthen Chains: NQP Enhances SCN Recoverability

When risks exceed the defensive threshold of individual nodes, the core of recovery lies in dynamic coordination and resource reallocation within the industrial chain. New labor tools enhance flexible recovery by using intelligent algorithms, digital twins, and AI scheduling to achieve multi-path supply–demand rebalancing [38]. New labor objects—such as data, knowledge, and green resources—act as key production factors that enable sharing and reuse across the chain, reducing delays in emergency response and alleviating resource bottlenecks. New production organizations leverage blockchain and industrial internet technologies to achieve unified dispatch of emergency resources and institutional coordination [39]. Together, these mechanisms form a dynamic recovery system centered on technological restoration, factor reconfiguration, and organizational collaboration [40], allowing the supply chain to resume operations quickly and regain structural balance.

2.3. Expand Network: NQP Enhances SCN Sustainability

At the macro level, the sustainability of industrial networks is reflected in their long-term stability and capacity for self-evolution [41]. New labor objects promote the extension of value chains through data circulation and the reuse of green assets, facilitating knowledge diffusion and enhancing environmental performance [42,43]. New production organizations maintain institutional continuity and collaborative governance through industrial ecosystem alliances and digital governance systems, strengthening cross-regional resource integration and fostering long-term cooperation [44]. Meanwhile, new laborers and new labor tools together enhance the system’s learning and technological connectivity, increasing network redundancy and adaptability. Together, these elements form a dynamic mechanism of “factor circulation–institutional continuity–systemic symbiosis”, ensuring that industrial networks achieve steady evolution and sustainable growth amid economic fluctuations and environmental constraints.

3. Research Design and Model Construction

Research on complex networks focuses on the topological structure of interactions among individual entities within a network, which forms the basis for understanding the properties and functions of complex systems [45,46]. Network structure is an important approach to measuring network characteristics and performance, and variations in network attributes can affect network functionality and resilience. Supply chain networks are constructed as networks with enterprises as nodes through supply-demand relationships, representing an essential abstraction of complex supply chain systems. These networks feature multi-level interactions and dependencies among enterprise nodes, along with “core-periphery” differentiation. When examining factors influencing their resilience, it is necessary to account for the nonlinear characteristics of risk cascade transmission between enterprises [47]. Consequently, complex network models offer greater applicability and explanatory power for such analyses.
Structural indicators of supply chain networks serve as benchmarks for evaluating their functionality and resilience. This study employs simulation experiments of attacks on supply chain network nodes to model the dynamic changes in structural indicators under risk shock scenarios, thereby quantifying the evolving resilience levels of supply chain networks. Drawing on existing research [48,49], the network structural indicators selected in this paper are as follows: ① network efficiency (NE), which examines the efficiency of information transmission and risk response among nodes in the supply chain network, serving as a measure of the network’s defensive capacity; ② cascade failure scale (CFS), which measures the extent of damage and the difficulty of recovery when the supply chain network is subjected to shocks, serving as a measure of the network’s recovery capacity; and ③ connectivity scale intensity (CSI), which assesses the degree of network connectivity, i.e., the strength of interactions and cooperation among nodes, serving as a measure of the network’s capacity for sustained expansion.

3.1. SCN Model Construction

In this paper, the upstream and downstream supply–demand relationships between enterprises are regarded as the economic linkages among firms, forming a supply chain. A complex network model is employed to construct a directed weighted network G   =   ( N ,   E ,   A ) to characterize the supply chain network system [50], in which enterprises are represented as nodes and the inter-firm linkages as edges. This study constructs an industrial chain network by taking Chinese listed companies as nodes and using their upstream and downstream supply–demand relationships (i.e., transaction values) as edges to form the adjacency matrix. Assume that the supply chain consists of n enterprises, with N   =   { 1 ,   2 , ,   n } denoting the set of enterprises and other relevant institutions in the network, i.e., the set of nodes. Let the binary matrix E = [ e i j ] represent the supply–demand adjacency matrix of the supply chain. Here, e i j indicates the supply-demand relationship between enterprise i and enterprise j . If e i j   =   0 , there is no edge between nodes i and j , implying the absence of a supply–demand relationship. If e i j   =   1 , there is an edge between nodes i and j , indicating that such a relationship exists. Let the weight matrix A   =   [ w i j ] represent the strength matrix of supply-demand relationships between enterprises. Where w i j   >   0 denotes the path edge weight between nodes i and j , defined as the total weight of the shortest path connecting them. In the supply chain context, w i j represents the sales revenue generated by the goods or services provided by enterprise i to enterprise j , reflecting the intensity of their economic linkage. The shortest path length d i j denotes the minimum number of edges required to connect enterprises i and j . In the network structure, an edge i j is an outgoing edge of node i , indicating that enterprise i supplies goods or services to enterprise j , in which case i is referred to as a supplier node. Conversely, an edge j i is an incoming edge of node i , indicating that enterprise i purchases goods or services from enterprise j , making i is the customer node. Let P ( i ) denote the set of supplier nodes for enterprise i , C ( i ) denote the set of customer nodes for enterprise i , and T i denote the initial load of node i , defined as the total procurement value when enterprise i acts as a customer node.
By calculating the network structure indicators (NE, CFS, and CSI) of the weighted network G as measures of supply chain network resilience, the overall resilience of the supply chain network can be comprehensively evaluated.

3.2. SCN Resilience Indicators

This study selects NE, CFS, and CSI as the core indicators of industrial chain network resilience, aligning with the commonly adopted “resistance–recovery–adaptation” resilience framework. Specifically, NE reflects the network’s ability to maintain resource and information flows when certain nodes fail, representing resistance; CFS measures the scale and propagation length of risk diffusion, corresponding to absorption and recovery; and CSI captures the average linkage strength and overall connectivity, reflecting adaptation and innovation. Together, these three indicators highlight the defensive, restorative, and evolutionary functions of the system, enabling the evaluation of both short-term robustness and long-term sustainability during shocks, thus forming a systematic and comprehensive resilience assessment framework.
(1) Defensive capacity indicator—NE
The defensive capacity of a supply chain network refers to its ability to resist disturbances and maintain normal operation when subjected to shocks, even if certain nodes fail. If too many nodes fail, or if the failed nodes are core nodes (i.e., nodes with a high number of adjacent nodes and large edge weights), the network becomes susceptible to a cascading “chain break” effect, spreading from individual nodes to larger regions, thereby reducing the efficiency of information transmission. Accordingly, the variation trend of the N E during shocks can be used to measure the network’s risk defense capability. A higher NE value indicates greater efficiency in information transmission among firms, faster mutual response, and higher sensitivity to supply–demand disruptions, reflecting stronger defensive capacity. In this paper, two types of attack modes are designed: “deliberate attack (DA)” and “random attack (RA).” In a deliberate attack, nodes are removed in descending order of their number of adjacent nodes; in a random attack, the sequence of node failures is determined randomly [49]. By observing changes in edge weights and path lengths after node failures under different attack modes, the N E value is calculated to assess the level of network defensive capacity, as shown in Equation (1):
N E t = 1 N ( N 1 ) i j N   w i j , t d i j
where N represents the number of enterprises in the network, t represents the number of simulated attacks, and the corresponding N E value is calculated each time a simulated attack is conducted in the simulation experiment. When N E is 0, the network is in a completely paralyzed state.
(2) Recovery capacity indicator—CFS
Recovery capacity refers to the dynamic adjustment and restoration ability of a supply chain network after being attacked and experiencing “chain failures.” The network structure of a supply chain is a double-edged sword: while it shortens the transactional “distance” between firms and industries, it also facilitates the propagation of local risks across a broader scope. Theoretically, the spread of risks in the supply chain can be modeled as a cascade failure or avalanche process. When node failures lead to partial chain disruptions, longer broken chains result in larger areas of local network failure, increasing the difficulty of recovery; thus, the weaker the network recovery capacity [51]. To evaluate recovery capacity, this study simulates various risk shock scenarios and measures the CFS based on the cumulative number of failed nodes and the lengths of broken chains, reflecting the network’s ability to recover from different levels of damage. The risk propagation process is as follows:
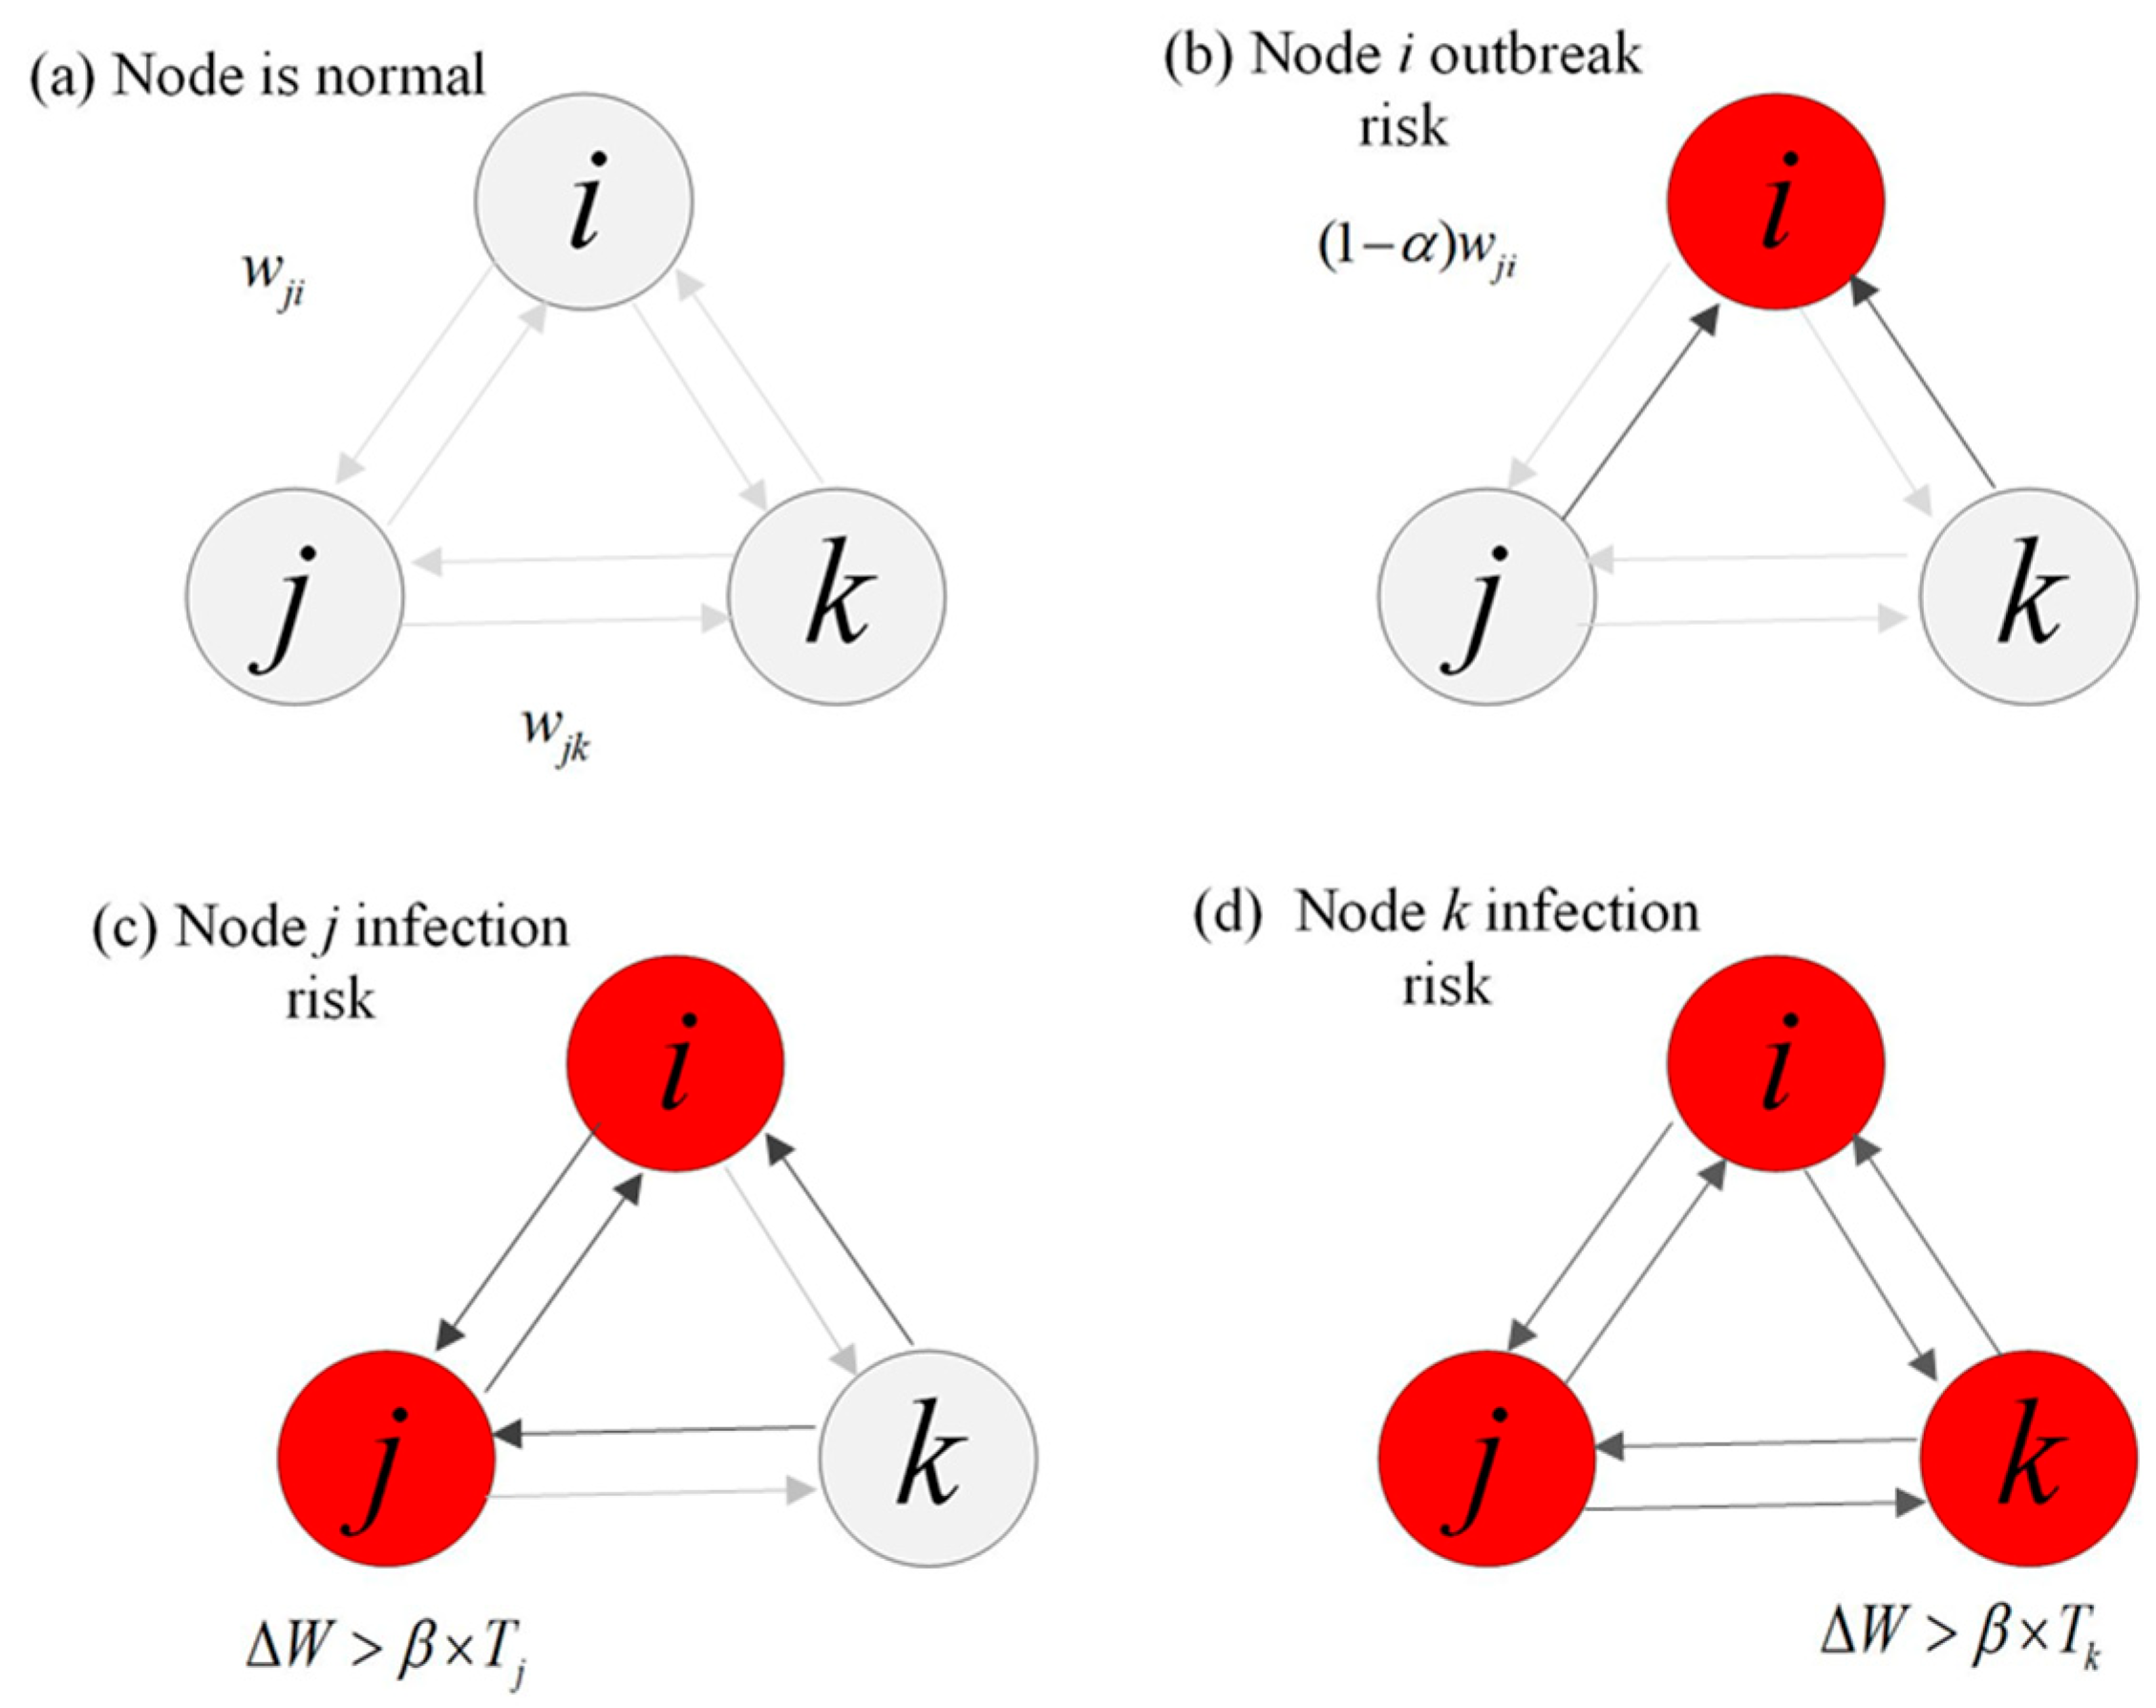
① Initially, all nodes in the network are in normal state. The initial load of enterprise i is T i , calculated as in Equation (2). The simulation process is shown in Figure 2a.
T i = j P ( i )   w j i
② When risk propagation begins, the risk propagates over discrete time steps s = ( 0,1 , 2 ) , with s = 0 being the initial state. Each additional step of s indicates that the risk propagates to the next enterprise node in the supply chain. The node state during the risk propagation process is recorded as x j ( s ) , as shown in Equation (3). Assuming that node i is the source of the risk outbreak and its state is abnormal, when the risk has not been transmitted to the next node, the discrete time step of risk propagation is 0, that is, x i 0   =   1 . When node i acts as a supplier, all its outbound edge weights w i j decrease in proportion to the risk coefficient α . After s steps of risk propagation, the change is Δ w i j ( s ) , as shown in Equation (4). Where α [ 0,1 ] represents the degree of damage to the enterprise caused by the impact risk. The simulation process is shown in Figure 2b.
x j ( s ) = 1 ,   N o d e   j   i s   i n   a n   a b n o r m a l   s t a t e   a t   t i m e   s t e p   s 0 ,   N o d e   j     i s   i n   n o r m a l   s t a t e   a t   t i m e   s t e p   s            
Δ w i j ( s ) = ( 1 α x i ( s ) ) w i j ( s ) , j C ( i )
③ If the cumulative impact value Δ W transmitted to a normal node j from all abnormal suppliers exceeds β times its initial load T j , as shown in Equation (5), node j also becomes abnormal, and the state of node j is updated. Where β ( 0,1 ) is the node failure threshold. The simulation process is shown in Figure 2c.
Δ W = i P ( j )   Δ w i j ( s ) > β T j
④ Repeat step ③ until there are no new abnormal enterprises in the network and the simulation process terminates, as shown in Figure 2d. Assume that the propagation process stops within a finite number of steps S (i.e., no new nodes fail), and update the state of the enterprise node x j s at this time, as shown in Equation (6). At this time, the total number of enterprise nodes j N   x j s with x j s   =   1 is the total number of failed nodes in the supply chain network under this round of risk shock, that is, the total failure scale of the network, and the final failure step length is s . The total failure scale and failure step length are comprehensively examined to measure the resilience of the supply chain network CFS. The smaller the total failure scale and the shorter the failure step length, the easier it is for the supply chain network to repair to its initial state, and the stronger the resilience of the supply chain network, and vice versa.
x j s = 1 ,         I f   x j s = 1   i s   a l r e a d y   a b n o r m a l ,   k e e p   i t   a b n o r m a l . 1 ,         I f   x j s = 0 ,   a n d   W s   >   β T j 0 ,         O t h e r w i s e
The dynamic changes in the model results under different shock scenarios depend on the ratio r = α / β . By adjusting the value of r , a criterion for determining whether a node becomes infected can be established. It should be noted that if r is too large, the failure of any single node may trigger a large-scale cascade failure, whereas if r is too small, effective propagation cannot occur. In this paper, we assume a binary equal-probability infection risk and set β = 0.5 , referring to [52] for risk factor settings in cascade failure studies. The risk factor αis set to two values: α1 = 0.6 and α2 = 0.9, corresponding to two risk scenarios: moderate risk r 1 and high risk r 2 , respectively.
(3) Sustainability indicator—CSI
Sustainability refers to the network’s capacity for expansion and long-term development. In the context of a supply chain network, sustainability is reflected in the network’s extensibility and the lifecycle of its chains. When the network exhibits strong synergy and high resource-sharing efficiency—that is, when network connectivity is high—supply–demand relationships between firms develop positively, trade links become closer, network resources are richer, and market conditions tend to improve. From the perspective of the entire supply chain network, a high connectivity network has two advantages: (1) existing nodes maintain stable connections, enhancing the network’s resistance to shrinkage; and (2) new nodes are stimulated to join, expanding the network scale. Even if some nodes or chains fail locally, the overall network can still maintain normal operation through other stable transactional links, thereby reducing the risk of systemic disruption [48].
Accordingly, this paper uses connectivity scale intensity as the core indicator to measure the sustainability of the supply chain network. CSI is defined as the ratio of the sum of all edge weights to the total number of edges in the network, representing a weighted version of the network’s average connectivity, expressed as Equation (2).
C S I t = ( i , j ) E   w i j , t E
where the numerator represents the sum of all edge weights in the network, reflecting the overall transaction volume or dependency level of the supply chain. The denominator E denotes the total number of edges in the network, indicating the number of transactional links. A higher CSI value implies that the connections within the supply chain network are tighter, with a higher average strength per link, indicating stronger inter-firm dependencies, better synergy, and greater network resilience. Conversely, a lower CSI value suggests loose internal connections and lower levels of supply chain collaboration.

3.3. NQP Impacts SCN Model Construction

In production activities, enterprises rely on the development of NQP to optimize production structures and enhance total factor productivity, thereby generating new momentum for upgrading the industrial chain system. This study introduces the Hadamard product to characterize the moderating effect of NQP on the strength of industrial chain network relationships [53]. Given two matrices A = [ a i j ] and B = [ b i j ] of the same dimensions m × n , their Hadamard product (denoted A B ) is defined as A B = [ a i j b i j ] , which means each element is multiplied element-wise: ( A B ) i j = a i j b i j , i , j . By evaluating how the relative level of corporate NQP adjusts the edge weights within the network, we examine its impact on network resilience. Unlike methods that directly alter the network topology, this approach maintains the overall structure of the adjacency matrix while element-wise modifying edge weights at the firm level, thereby influencing the intensity of upstream and downstream linkages. This design better reflects the mechanism through which economic and technological effects are transmitted by enterprises as the fundamental units of industrial chain operations, effectively bridging micro-level firm characteristics (NQP) and macro-level network resilience indicators. Specifically, firms with higher levels of NQP strengthen upstream and downstream trading relationships through technology diffusion and efficiency improvement, while those with lower levels weaken transaction intensity due to limited efficiency. The Hadamard product not only ensures the mathematical stability and operability of the network but also economically captures the dynamic mechanisms of technological diffusion and resource reallocation. Moreover, this method can be seamlessly integrated into the computation framework of resilience indicators—NE, CFS, and CSI—thus providing a feasible quantitative pathway to analyze the interactive relationship between NQP and industrial chain network resilience.
Let the NQP level vector be s = s 1 , s 2 , , s n T , where s i represents the NQP level of enterprise i . We construct the adjustment factor vector k = k 1 , k 2 , k 2 T , where the adjustment factor for enterprise i is defined as: k i = s i s ¯ (and s ¯ = 1 n i = 1 n s i is the average NQP level of the entire supply chain network.). Thus, k i reflects the relative level of enterprise i within the system and quantifies the marginal impact of its NQP on the overall supply chain system. The supply chain network, when adjusted by the factor k , reflects changes in the strength of connections between associated enterprises arising from the marginal innovation gains obtained through the transformation of new quality productivity at the individual firm level. Such changes may, in turn, trigger structural transformations within the overall supply chain cluster and lead to adjustments in the configuration of the supply chain network.
Based on the above definition, this paper applies a nonlinear effect on the edge weight data (i.e., the strength of association between enterprises in the supply chain) in the supply chain network G = ( N , E , A ) constructed in the previous article by adjusting the factor k to construct the adjusted adjacency matrix:
A k = A ( k 1 T )
w i j k = w i j · k i
where denotes the Hadamard (element-wise) product, and 1 R n denotes the all-ones vector. It is expressed in matrix form as shown in Equation (10).
w l l w l N w N l w N N k l k l k N k N = w l l k w l N k w N l k w N N k
When k i > 1 , enterprise iii exhibits a level of new quality productivity above the average, classifying it as a high–value-added enterprise in terms of new quality productivity. In this case, the enhanced new quality productivity strengthens the supply and exchange relationships between the enterprise node and its upstream and downstream counterparts, accelerating network-wide technological upgrading and efficiency improvement through a “pressure-enhancing channel” of technological diffusion [54]. Conversely, when k i < 1 , enterprise iii demonstrates a level of new quality productivity below the average, indicating a low-value-added enterprise in terms of new quality productivity. In such a situation, the weakened new quality productivity attenuates the supply and exchange relationships between the enterprise node and its upstream and downstream nodes, potentially triggering resource reallocation within the network. This process facilitates structural upgrading of the network through the elimination of inefficient enterprises and subsequent network optimization. The adjusted supply chain network resilience index is calculated as follows:
Based on Equation (1), the adjusted NE value is
N E t k = 1 N ( N 1 ) i j N   w i j t k d i j
According to Equations (4) and (5), the changes in network cascading failure after adjustment are obtained:
Δ w i j k ( s ) = ( 1 α x i ( s ) ) w i j ( s ) k , j C ( i )
Δ W k = i P ( j )   Δ w i j ( s ) k > β T j
Combined with Equation (6), derive the altered abnormal node state x j k s and calculate the j N   x j k S k to examine the resilience of the adjusted network CFS t k . According to Equation (7), the adjusted CSI value is obtained as
C S I t k = ( i , j ) E   w i j t k | E |
By comparing the changes in various resilience indicators of the supply chain network before and after adjustment by NQP, it is possible to analyze how NQP regulates the resilience of the supply chain network.

4. Result Analysis

4.1. Measurement Results of SCN Resilience

4.1.1. Data Sources and Processing

First, this paper draws on the research of [14,55], based on the connotation of NQP, and constructs a comprehensive indicator system for firms’ NQP. The system is built around four “news”: new labor, labor materials, labor objects, and innovative production organization methods. The detailed indicator framework and introduction are provided in the Supplementary Materials. Secondly, this paper uses A-share-listed companies on the Shanghai and Shenzhen stock exchanges as the research sample, covering the period from 2012 to 2023, which captures China’s industrial transformation from informatization to intelligentization and ultimately greening, reflecting both the structural upgrading of its industrial system and the incubation and growth stages of NQP. Following the approach of [56], upstream suppliers and downstream customer data of the listed companies were matched to form an “upstream supplier–target firm–downstream customer annual dataset.” Data were primarily sourced from the CSMAR and Wind databases, as well as listed companies’ annual reports and interim announcements. Considering that network indicator values vary only slightly between consecutive years, and based on observed changes in supply chain transaction amounts along with the evolution of firms’ NQP levels, the dataset is divided into three periods: 2012–2014, 2015–2020, and 2021–2023. Furthermore, taking into account data availability and the long-tail distribution of industries [57], over 2000 representative firms with relatively large transaction volumes and well-documented management information across different supply chain segments were selected for the three-stage network model analysis, the multi-stage empirical analysis not only examines the developmental patterns of NQP across different periods but also serves as a robustness check for the model. The SCN data information is presented in Table 3.

4.1.2. Measurement Results of SCN Resilience

Based on the calculation methods for supply chain network resilience indicators, this paper measures the resilience of the three-stage supply chain networks prior to adjustment by firms’ NQP. The descriptive statistics of the measurement results are shown in Table 4.
According to the results in Table 4, (1) the network consistently demonstrates higher robustness against random attacks compared to deliberate attacks, indicating a clear dependence on core nodes. During the 2015–2020 period, robustness declined, with the minimum resilience under deliberate attacks noticeably lower than in the early period. This suggests that reliance on core nodes increased further during this phase, and the efficiency of the network would sharply drop if these nodes were compromised. From 2021 to 2023, robustness improved, with the minimum resilience under deliberate attacks recovering, indicating structural optimization of the supply chain network. (2) The period of 2015–2020 exhibits the weakest recovery capacity. The increase in failed nodes, coupled with longer risk propagation steps, reflects a fragile network structure that hinders restoration. In the 2021–2023 period, with more redundant nodes and enhanced substitutability of key nodes, the network’s recovery capacity improved significantly. (3) Between 2012 and 2020, the sustainability of the supply chain network remained relatively stable. During the 2021–2023 period, sustainability increased markedly. Notably, the minimum CSI value under deliberate attacks during the 2015–2020 period slightly increased compared to the previous period, suggesting that although the supply chain structure remained uneven, structural reforms strengthened the development of small- and medium-sized enterprises (SMEs), enhancing the foundational stability of the network.
In summary, the supply chain network exhibited relatively low overall resilience from 2012 to 2023, but with considerable room for recovery and improvement. The period 2015–2020 represents a vulnerable phase, characterized by strong dependence on core nodes and systemic risk under deliberate attacks, with resilience under random attacks exceeding that under targeted attacks. From 2021 to 2023, the network entered an optimization phase. Through topological reconstruction, increased path redundancy, and modular layout, reliance on core nodes decreased, sustainability improved, and the conflict between efficiency and security at core nodes was mitigated. Recovery capacity was significantly enhanced, cascading scales contracted, and risk propagation paths shortened, demonstrating a dual defense effect of “early containment–mid-term blocking.” These findings indicate that, under national policy guidance promoting scientific supply chain development, the overall resilience of the supply chain network has been effectively enhanced.

4.2. Impact of NQP on SCN Defense Capability

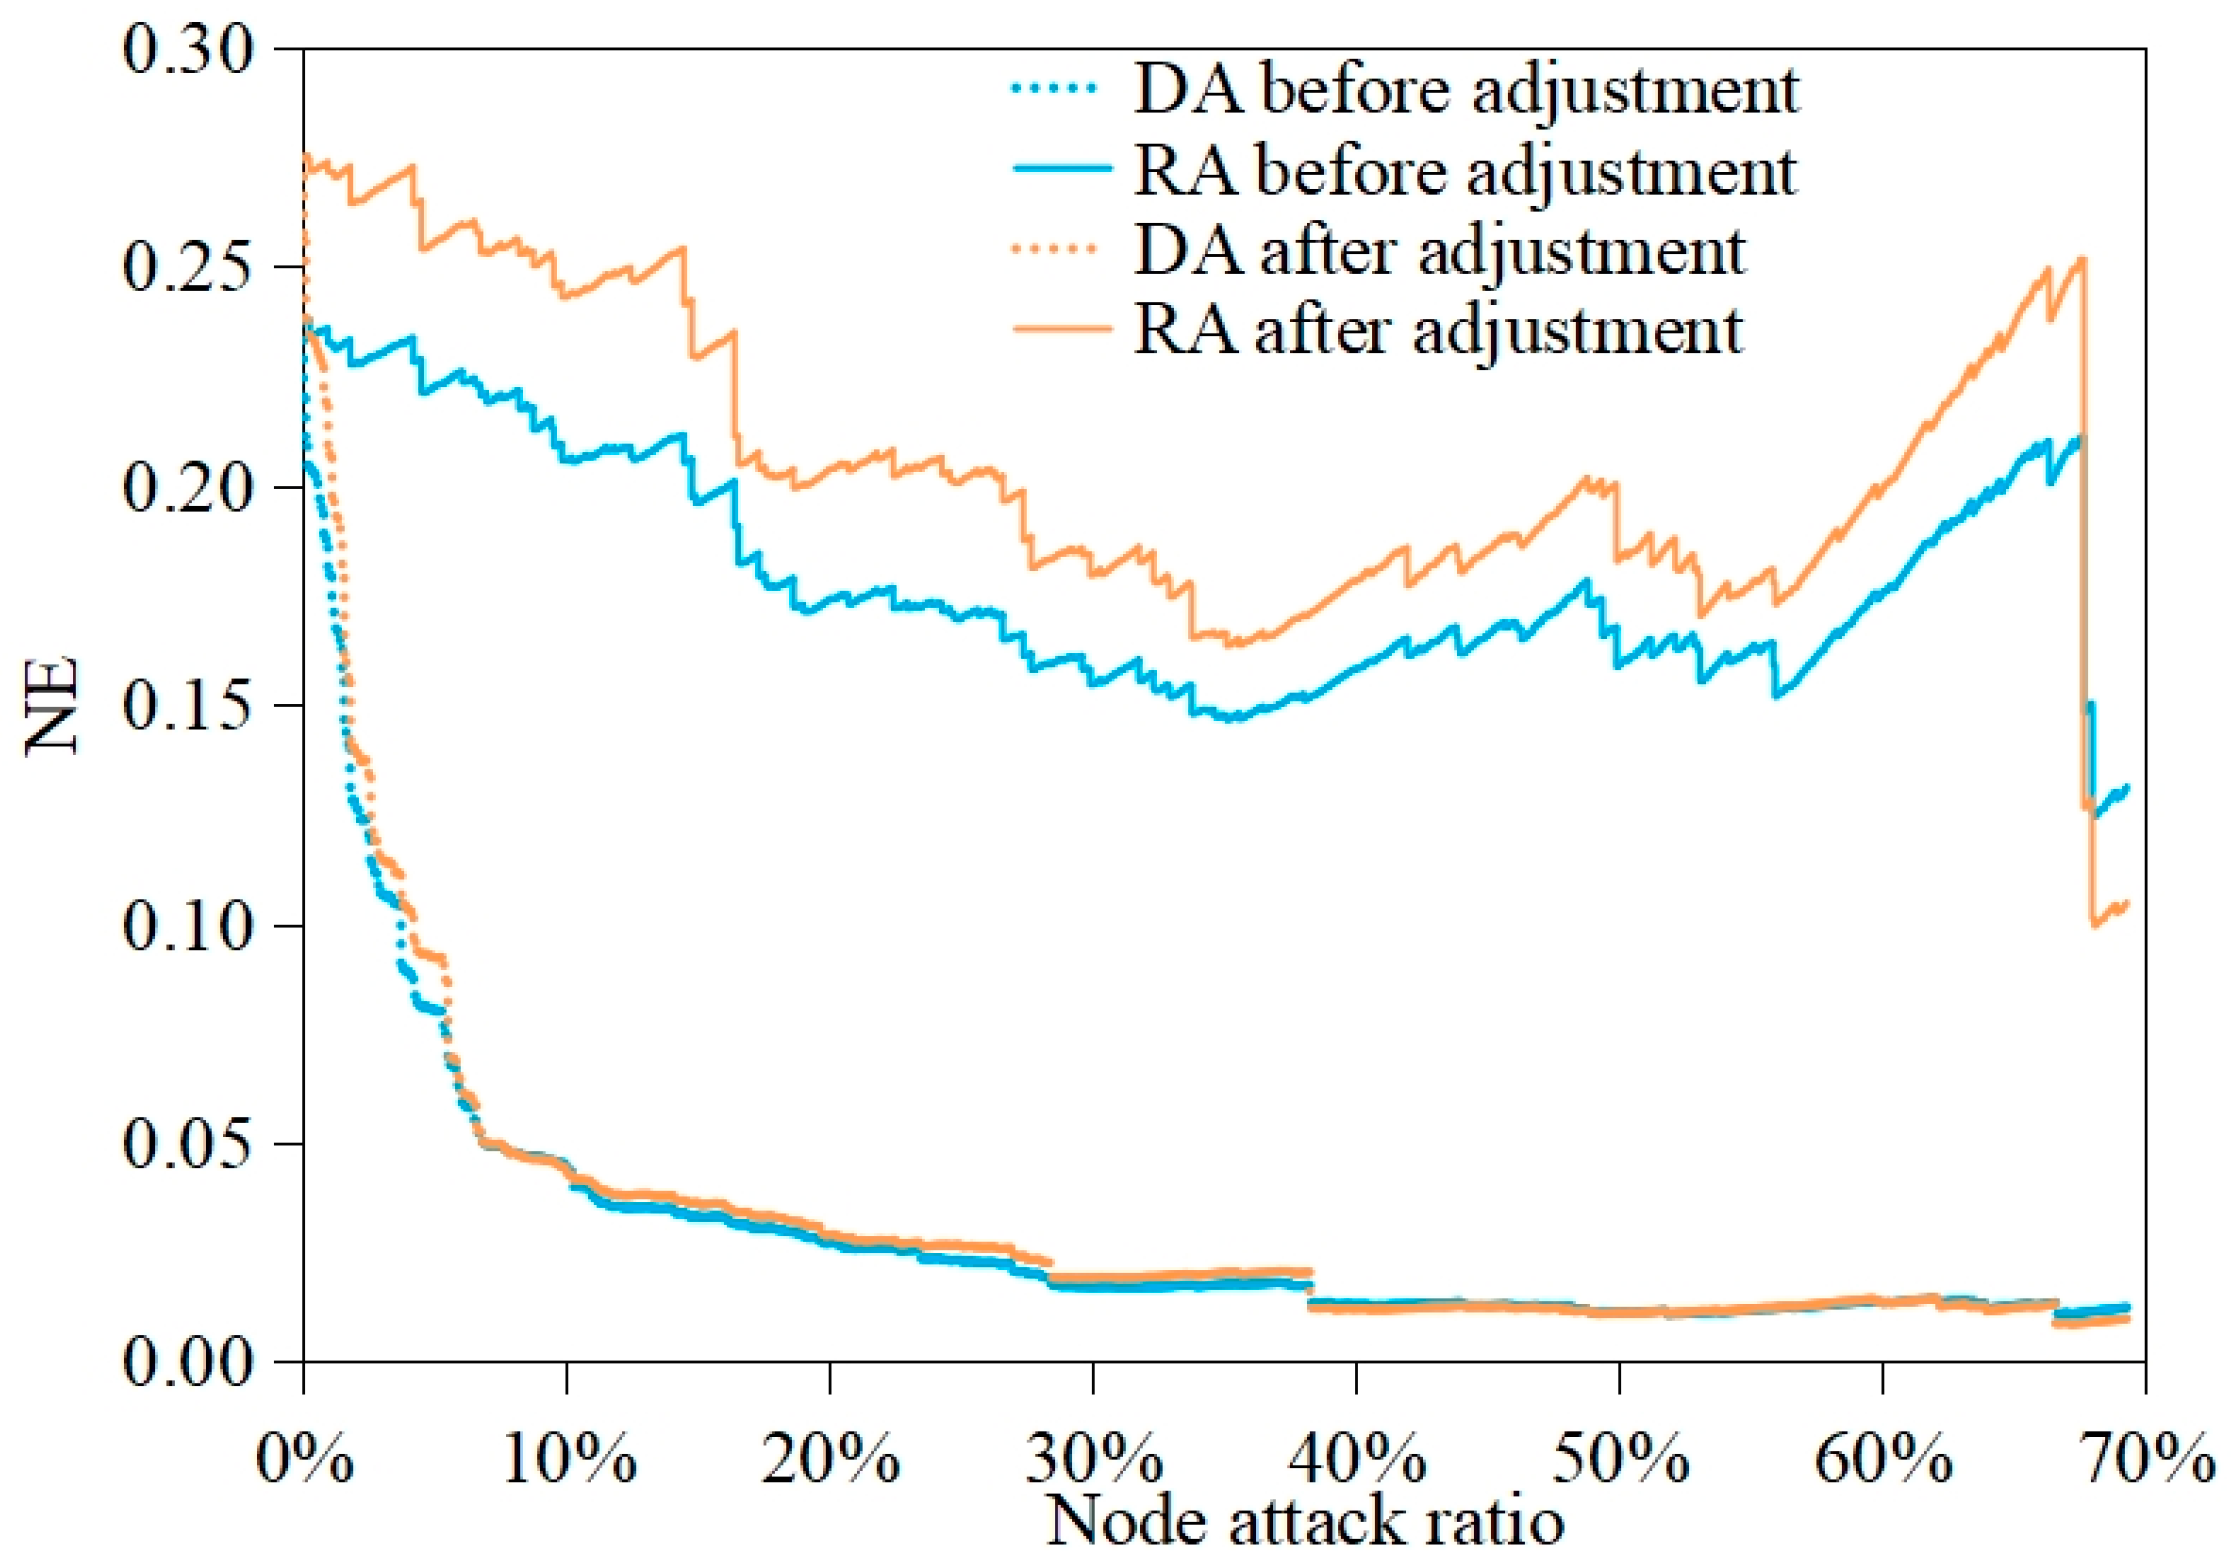
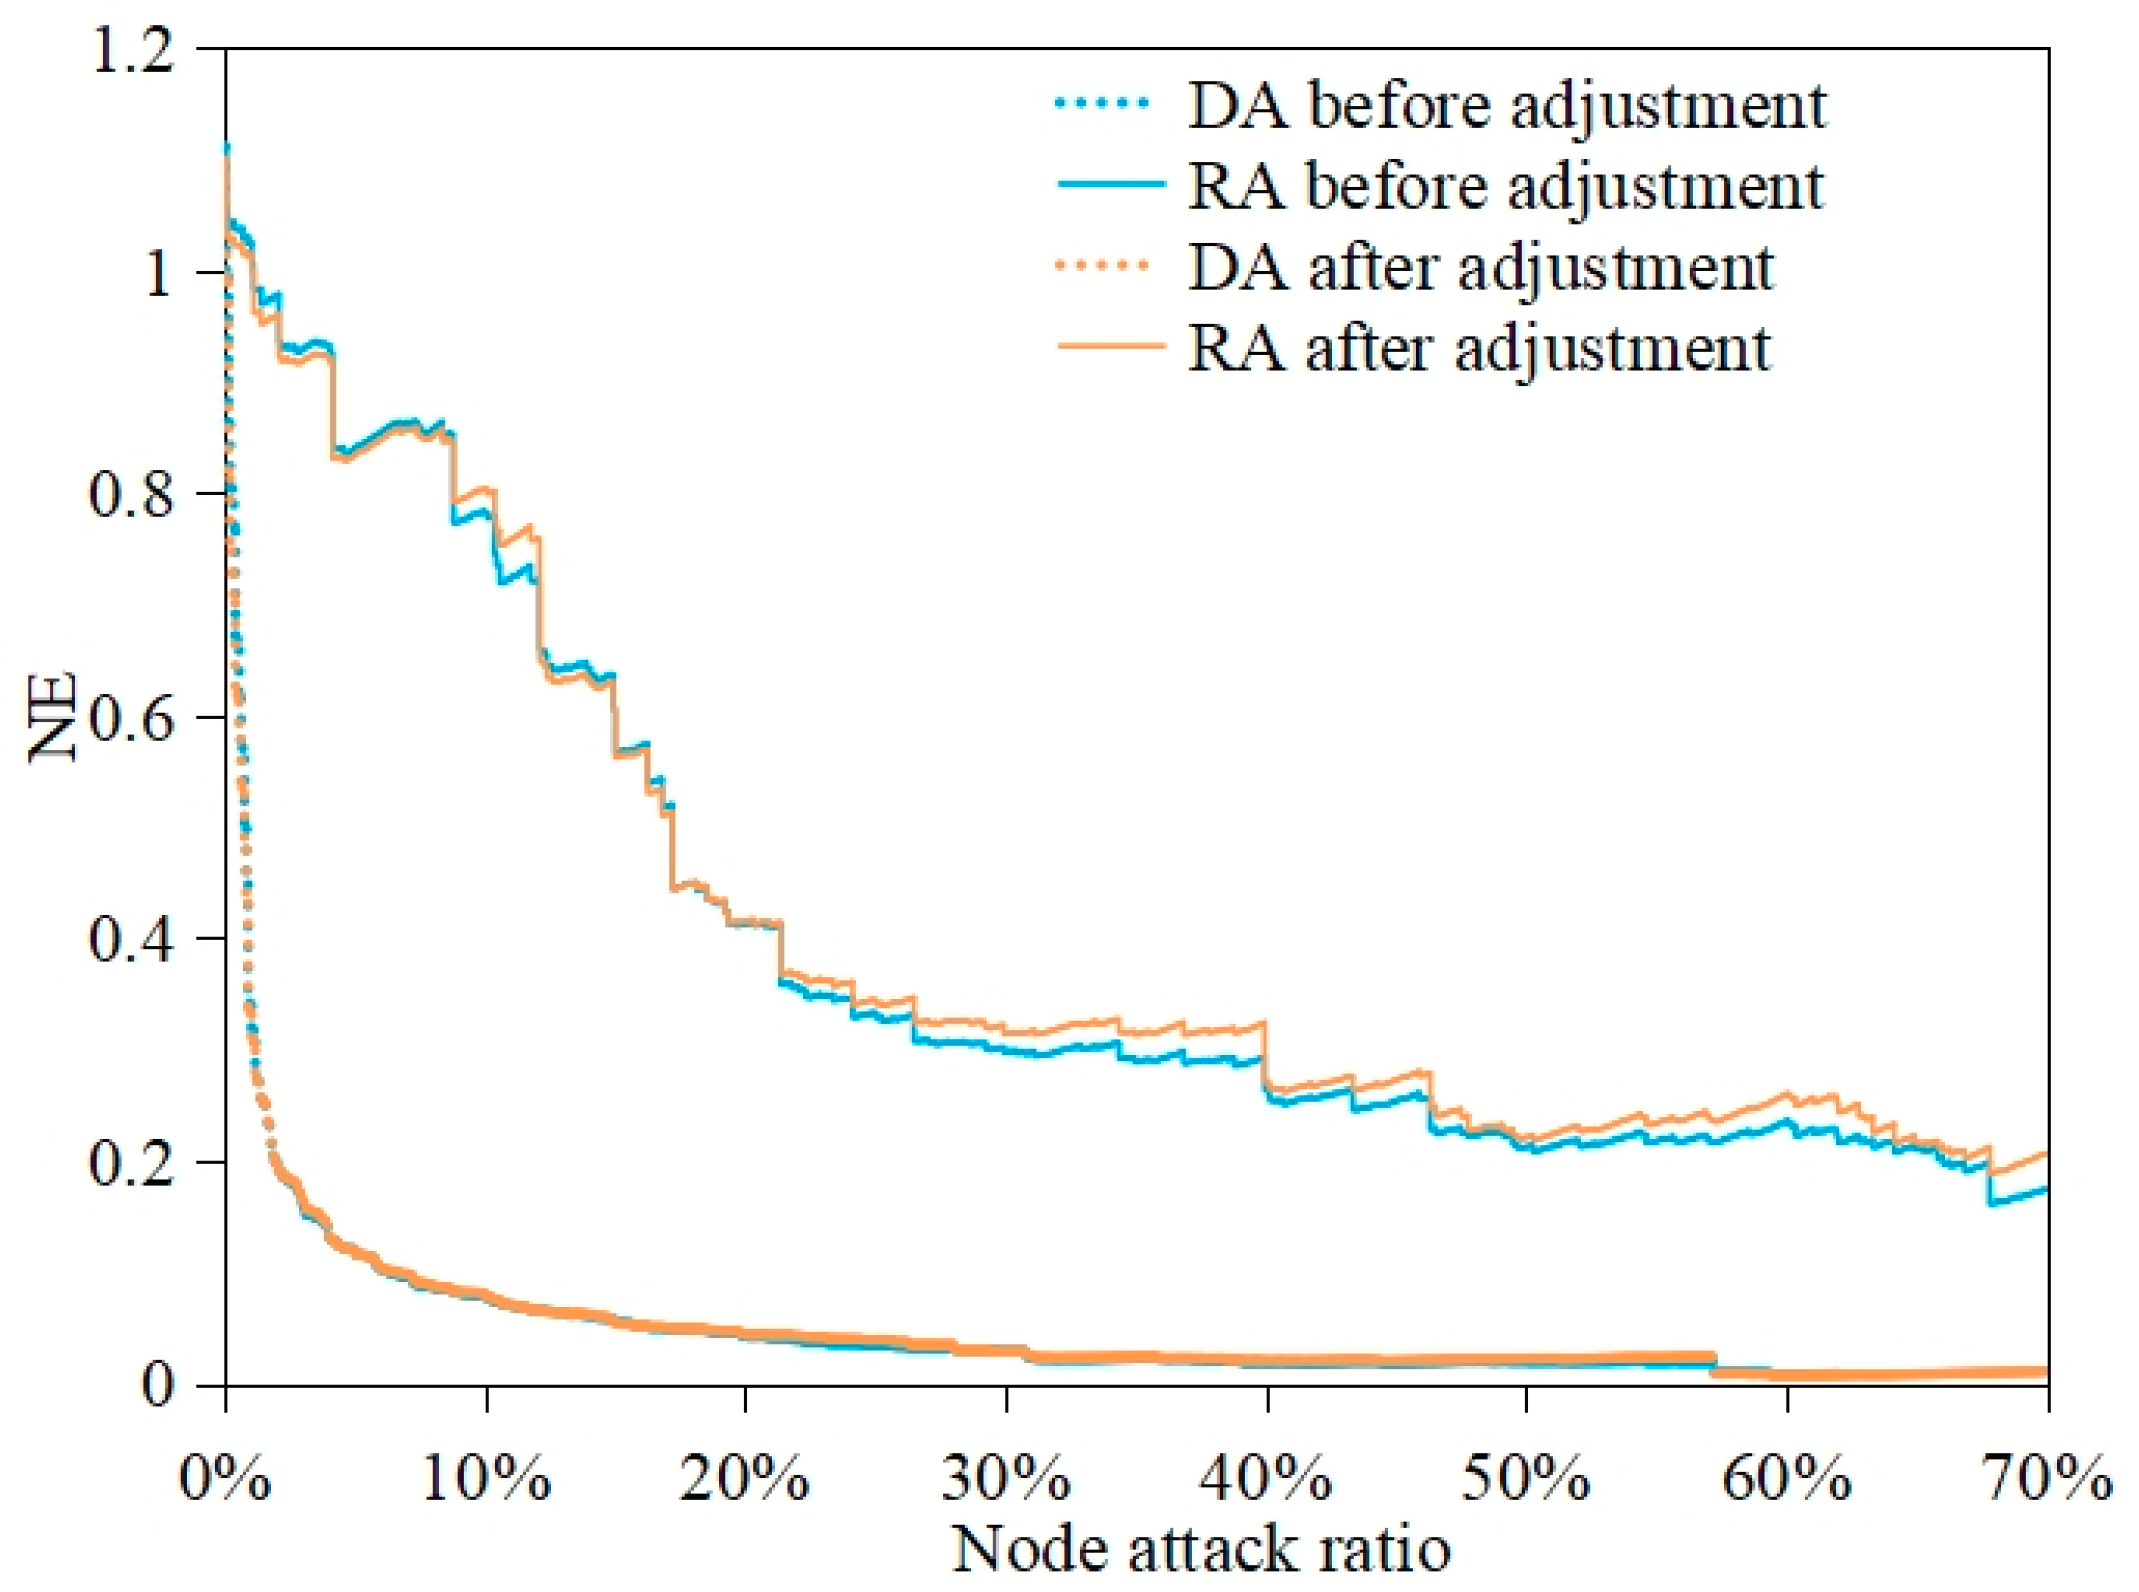
Figure 3, Figure 4 and Figure 5 illustrate the moderating effects of NQP on the defense capability of the supply chain network across the three stages. Overall, the defense capability of the supply chain network is enhanced after NQP adjustment, and the effect is more obvious under random attacks.
Specifically, Figure 3 shows that during the 2012–2014 stage, under random attacks on the supply chain network, the adjusted curve consistently lies above the pre-adjustment curve, indicating that NQP broadly enhances network defense capability. When the proportion of attacked nodes is below 45%, the adjustment effect fluctuates less. The most pronounced effect occurs when 19% of nodes are attacked, with the overall NE value increasing by approximately 0.043 after adjustment. The smallest adjustment occurs at 21% of attacked nodes, with an increase of about 0.02. When the proportion of attacked nodes exceeds 45%, the adjustment effect slightly rebounds, reaching the maximum increase at around 60%. However, when 70% of nodes are compromised, the network suffers extensive damage and the NQP adjustment effect fails. Under deliberate attacks, the difference between pre- and post-adjustment curves is less pronounced, indicating that NQP’s moderating effect on network robustness is weaker than under random attacks. Nevertheless, when the proportion of attacked nodes is below 9%, NQP still effectively enhances network defense capability. During this stage, leading firms seize early development opportunities, improve their NQP first, and stabilize the backbone of the supply chain network. In particular, when attacks target only the top ~2% of leading enterprises, NQP increases the NE value by more than 0.025. However, when the proportion of attacked nodes exceeds 49%, the moderating effect of NQP nearly disappears. At this stage, the positive impact of NQP primarily arises from a few leading firms that take the lead in green innovation and technological upgrading, enhancing the stability and spillover influence of core nodes. Consequently, under low-intensity random attacks, the network remains relatively stable. However, as the scope of attacks widens or when core firms are deliberately targeted, the moderating effect of NQP quickly diminishes or even disappears, suggesting that its influence is highly dependent on the leadership role of these core enterprises.
Figure 4 shows that during the 2015–2020 period, after several years of supply chain system development, NQP gradually matured, and the overall robustness of China’s supply chain network improved. Regardless of whether the network was adjusted by NQP, the NE values under attacks of the same scale were higher than those in the previous stage. However, the moderating effect of NQP reached a bottleneck in this period. Under random attacks, when the proportion of attacked nodes was below 13%, NQP exhibited a negative moderating effect. It then increased sharply, reaching the maximum positive effect at around 17.5%, enhancing the network NE value by approximately 0.038. Subsequently, the effect became negative again until the attacked node proportion reached 27%, after which a stable positive moderating effect emerged. Even when the proportion of attacked nodes reached 70%, the NE values remained higher than in the previous stage, indicating that under large-scale random attacks (over 30%), NQP consistently reinforced the network’s robustness. Under deliberate attacks, the moderating effect of NQP was much weaker, with the maximum NE increase not exceeding 0.005. Moreover, the two curves under deliberate attacks indicate that during this period of rapid economic growth, the excessive dominance of leading enterprises, which had been neglected, caused the network to face a sharply increased risk of collapse when core nodes were intentionally attacked. When around 40% of nodes were targeted, NE approached zero, signaling that the network was on the verge of systemic failure. As NQP gradually diffuses and becomes more widely adopted across firms, the overall defensive capacity of the network improves. However, due to the uneven distribution of resources, negative moderating effects emerge at certain node proportions—manifested as heightened vulnerability caused by excessive concentration of risk in specific areas. Only when the scale of attacks surpasses a certain threshold does NQP exhibit a broadly positive effect on network resilience.
As shown in Figure 5, during the 2012–2023 period, the curves adjusted by NQP consistently lie above the pre-adjustment curves. In this stage, NQP entered a new development phase characterized by widespread application of big data and artificial intelligence, further reinforcing the robustness of the supply chain network. The overall NE values under both attack scenarios are higher than in the previous stage, particularly under large-scale attacks, where robustness is generally enhanced. Under random attacks, NQP exhibits peaks of positive moderating effects on network robustness when the proportion of attacked nodes is approximately 2.5%, 20%, and 53%, each increasing NE values by more than 0.04. Moderate increases occur around 13% and 33% of attacked nodes, with NE increases of approximately 0.02. Under deliberate attacks, the positive effect gradually declines as the proportion of attacked nodes increases. The strongest moderating effect occurs when less than 5% of nodes are attacked, with the maximum NE increase around 0.038, while negative effects appear when more than 45% of nodes are targeted. Notably, when the proportion of attacked nodes is low, NQP shows effective moderating effects under both attack scenarios. When the attack area is large, its effect is more pronounced under random attacks. This suggests that the development of NQP, by enhancing firms’ digitalization, intelligent management, and technological innovation, strengthens digital interconnectivity among network nodes, thereby mitigating efficiency losses under widespread random risks. However, due to uneven supply chain development, the issue of core enterprises acting as risk nodes in the supply chain network remains unresolved.
The results indicate that overall, NQP enhances the resistance of industrial networks, significantly strengthening their capacity to withstand external shocks. However, this moderating effect is conditioned by several boundary factors. Through the technological diffusion effect, NQP promotes transactional resilience among firms, thereby reinforcing network defense against random disruptions. Yet, during the early and structurally uneven stages of development, the resource concentration effect may undermine network stability in some contexts due to the uneven distribution of innovation and resources. As NQP reaches the large-scale adoption stage, it further enhances overall network defense through digital interconnection effects, though the single-point failure of core firms continues to pose a key structural vulnerability within the system.

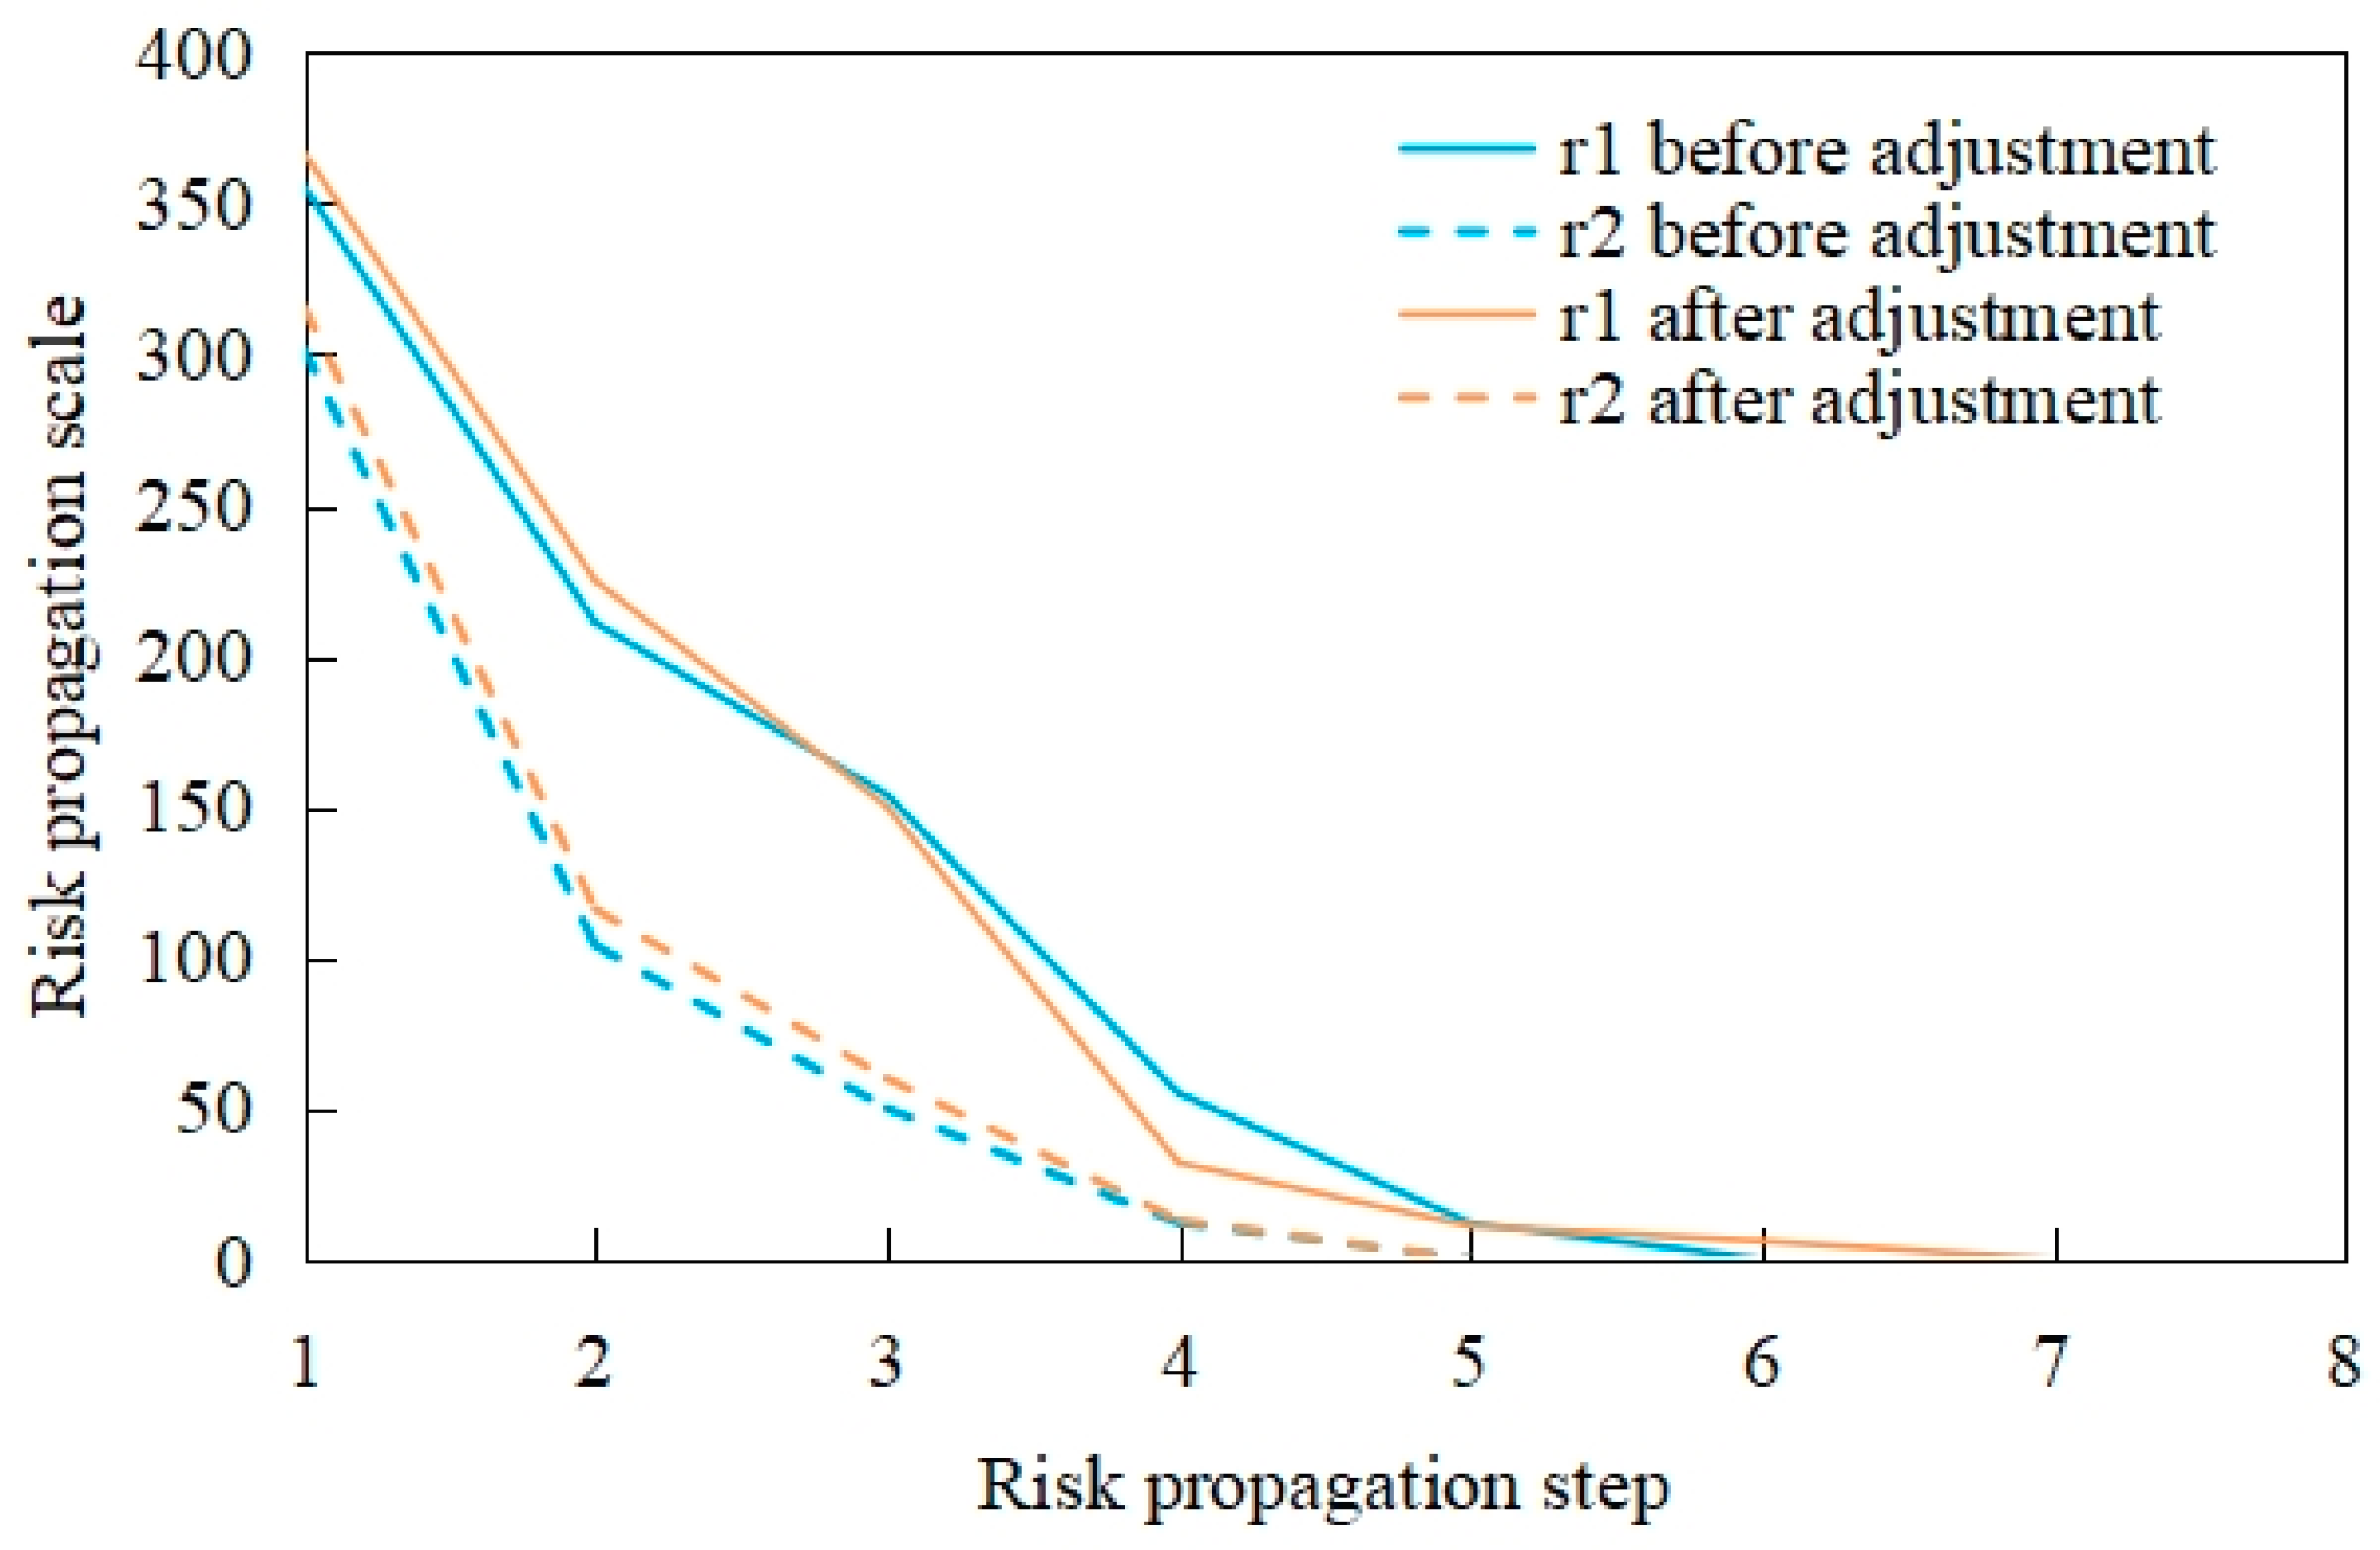
4.3. Impact of NQP on SCN Recoverability

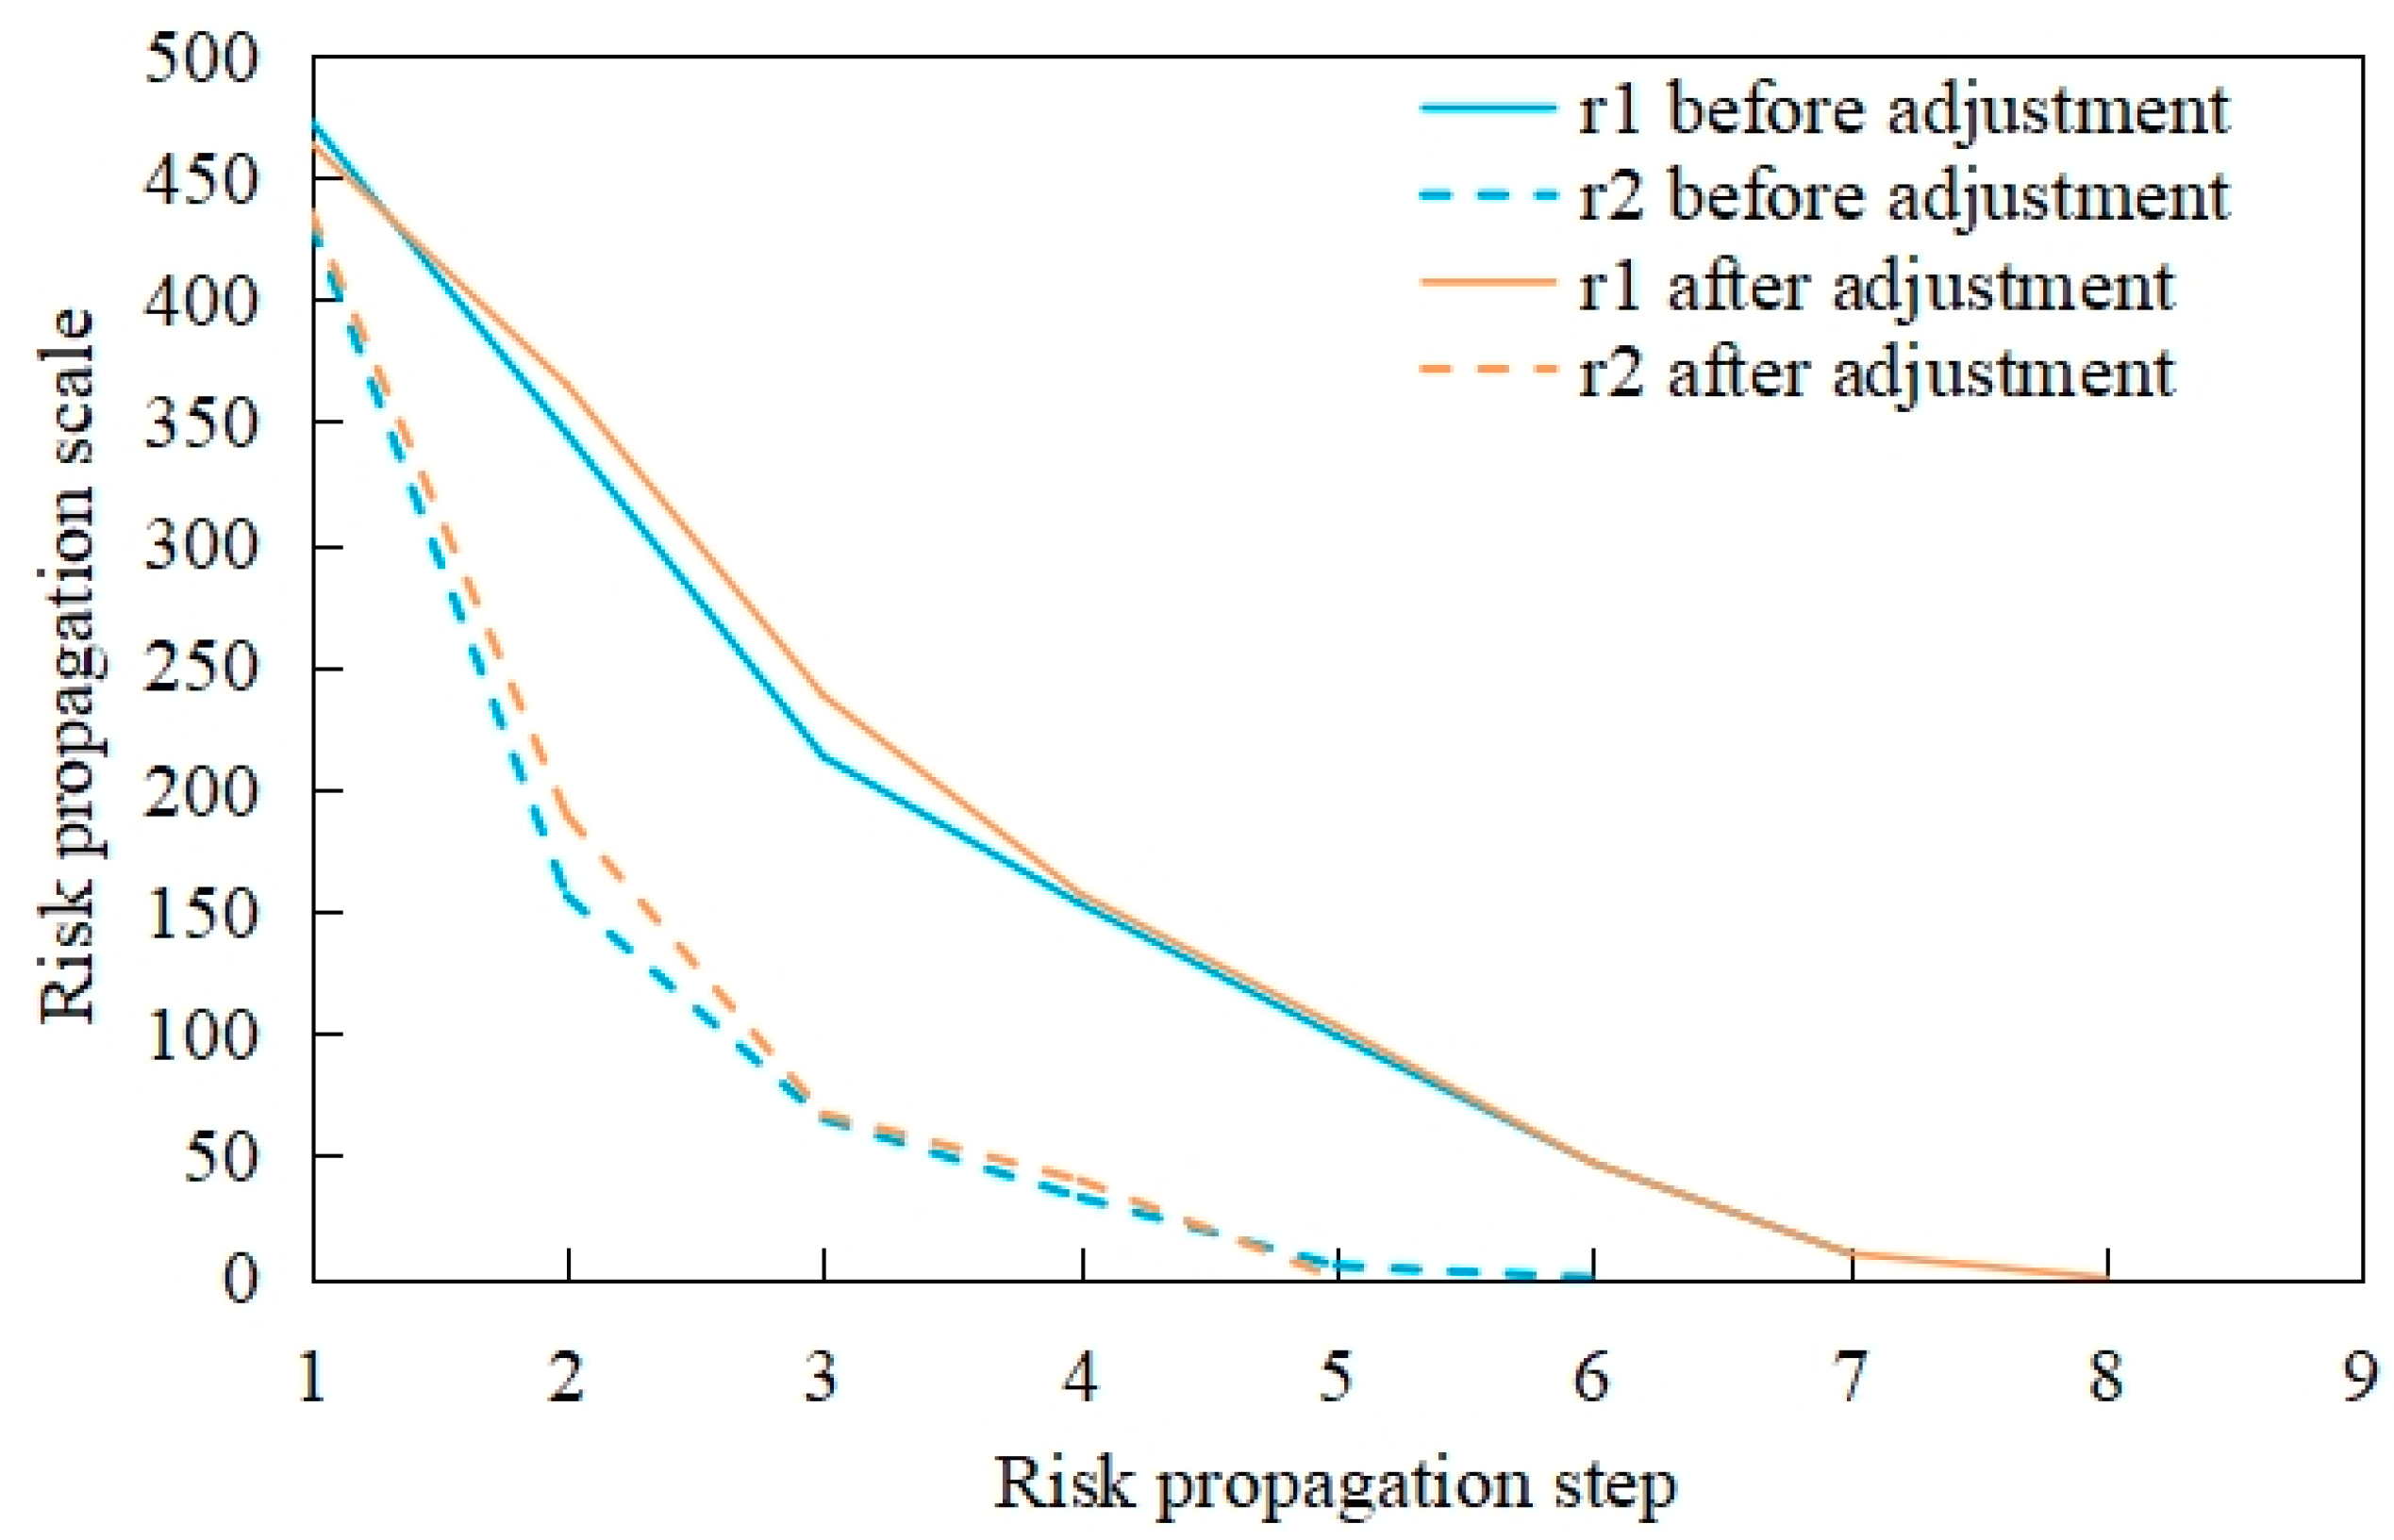
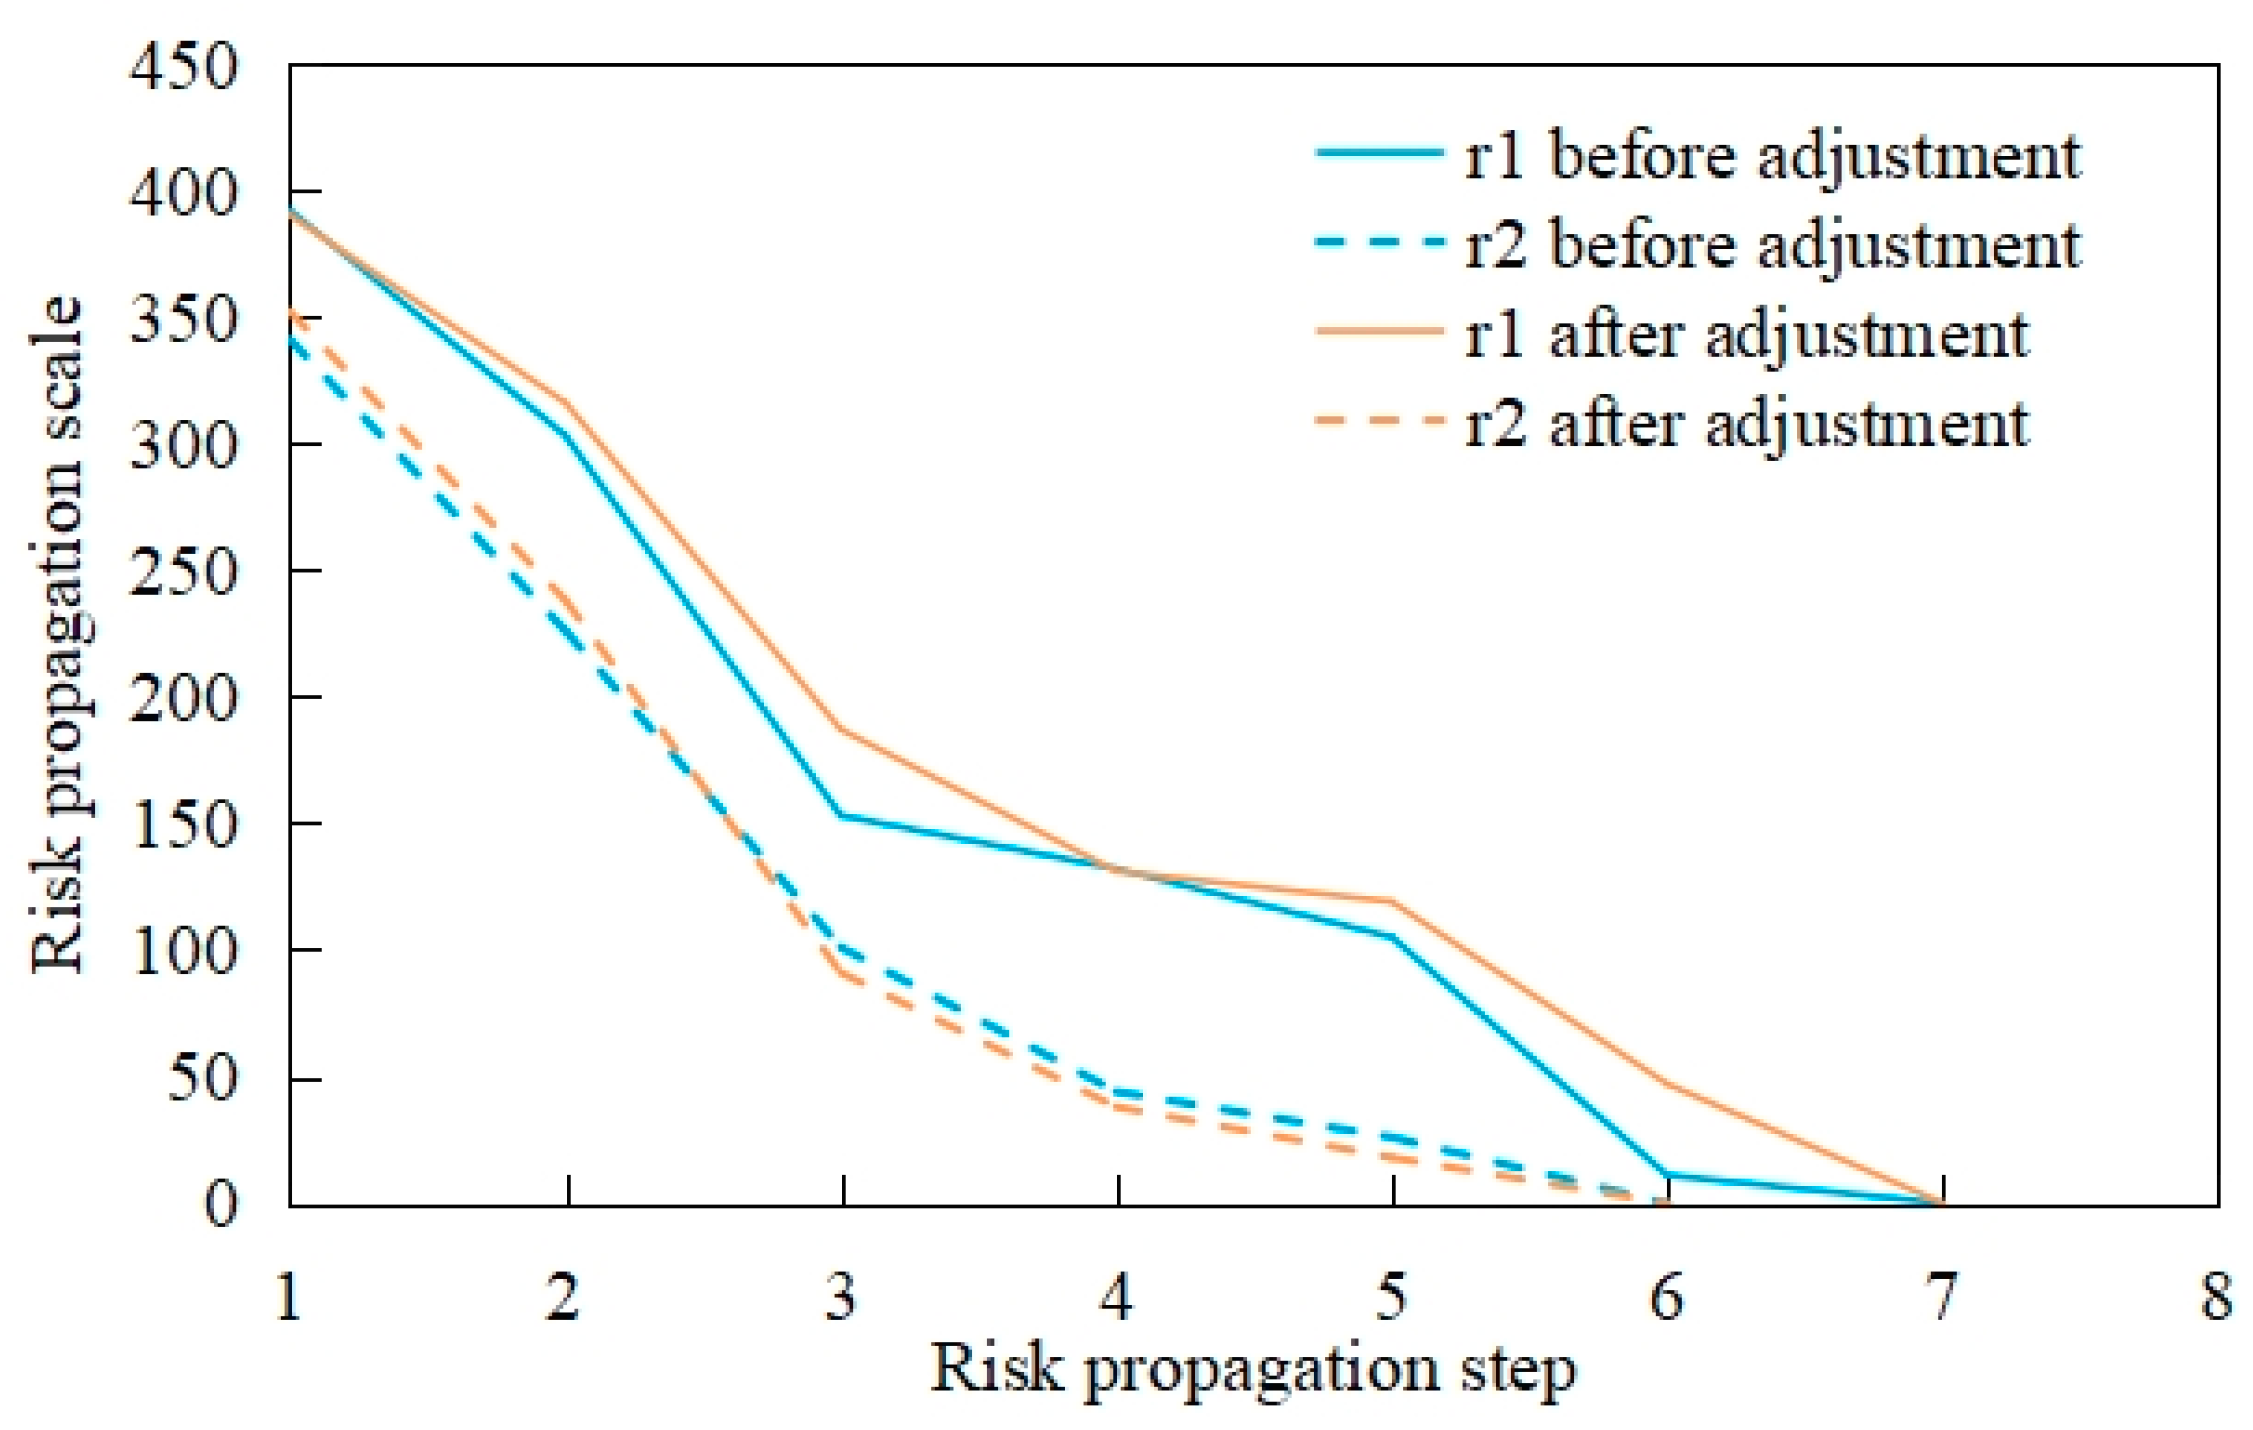
Under the influence of NQP, both the propagation levels and cumulative scale of cascading failures in the supply chain network are altered. Figure 6, Figure 7 and Figure 8 present the comparative effects of NQP on network recovery capacity across the three stages. In the figures, solid lines represent high-risk scenarios r 1 , and dashed lines represent medium-risk scenarios r 2 . Overall, NQP shortens the number of propagation steps; however, its impact on cumulative failure scale exhibits stage-specific heterogeneity. Without NQP, cascading failures typically propagate to the sixth or seventh step. After NQP adjustment, the number of failure propagation steps decreases overall, indicating that NQP helps the supply chain network to interrupt continuous cascading risks within a shorter period. Nevertheless, its effect on suppressing the total scale of risk propagation is limited, and in certain periods, the cumulative failure scale may even expand.
From Figure 6, it can be observed that during the 2012–2014 period, NQP exerted a negative regulatory effect on the risk propagation of supply chain resilience. Under both the r1 and r2 shock scenarios, the total scale of risk propagation after NQP regulation was larger than before regulation, particularly within propagation levels of fewer than four steps. However, as the propagation deepened, at the fourth step, NQP produced a slight positive regulatory effect under the high-risk shock scenario, while under the medium-risk shock scenario, NQP continued to exert a negative regulatory effect. Figure 7 shows that in the 2015–2020 period, although the total scale of risk propagation did not decrease significantly, the propagation levels of supply chain network risk were reduced after NQP regulation; for instance, under the r2 scenario, the propagation steps decreased from six to five. This indicates that during this period, due to gradual optimization of the supply chain structure, redundant chains increasingly played a substitutive role, reducing cascading risk in the supply chain network. In the 2021–2023 period, with NQP entering a new wave of innovation breakthroughs and enterprises competing again for emerging resources, NQP only suppressed the total scale of risk propagation under medium-risk shocks when the propagation exceeded three steps, as shown in Figure 8.
Overall, NQP plays a significant regulatory role in enhancing supply chain network recovery. By flattening network hierarchies, breaking technological barriers, and fostering multi-enterprise collaboration, it effectively reduces the propagation of cascading failures and curbs the further expansion of disruption—particularly when α is relatively small, where its suppressive effect on cascading failures is more pronounced. However, while strengthening cohesion and connectivity among firms, NQP may also, to some extent, amplify the scale of risk shocks. The findings further suggest that the network’s responsiveness to external shocks is jointly shaped by factors such as the economic structure, stage of supply chain development, and degree of NQP adoption. The effect of NQP on recovery capacity depends on both its level of maturity and the intensity of external disturbances: it facilitates recovery through structural optimization and adaptive coordination, yet under conditions of excessive resource and technological concentration, it may inadvertently magnify systemic vulnerabilities.

4.4. Impact of NQP on SCN Sustainability

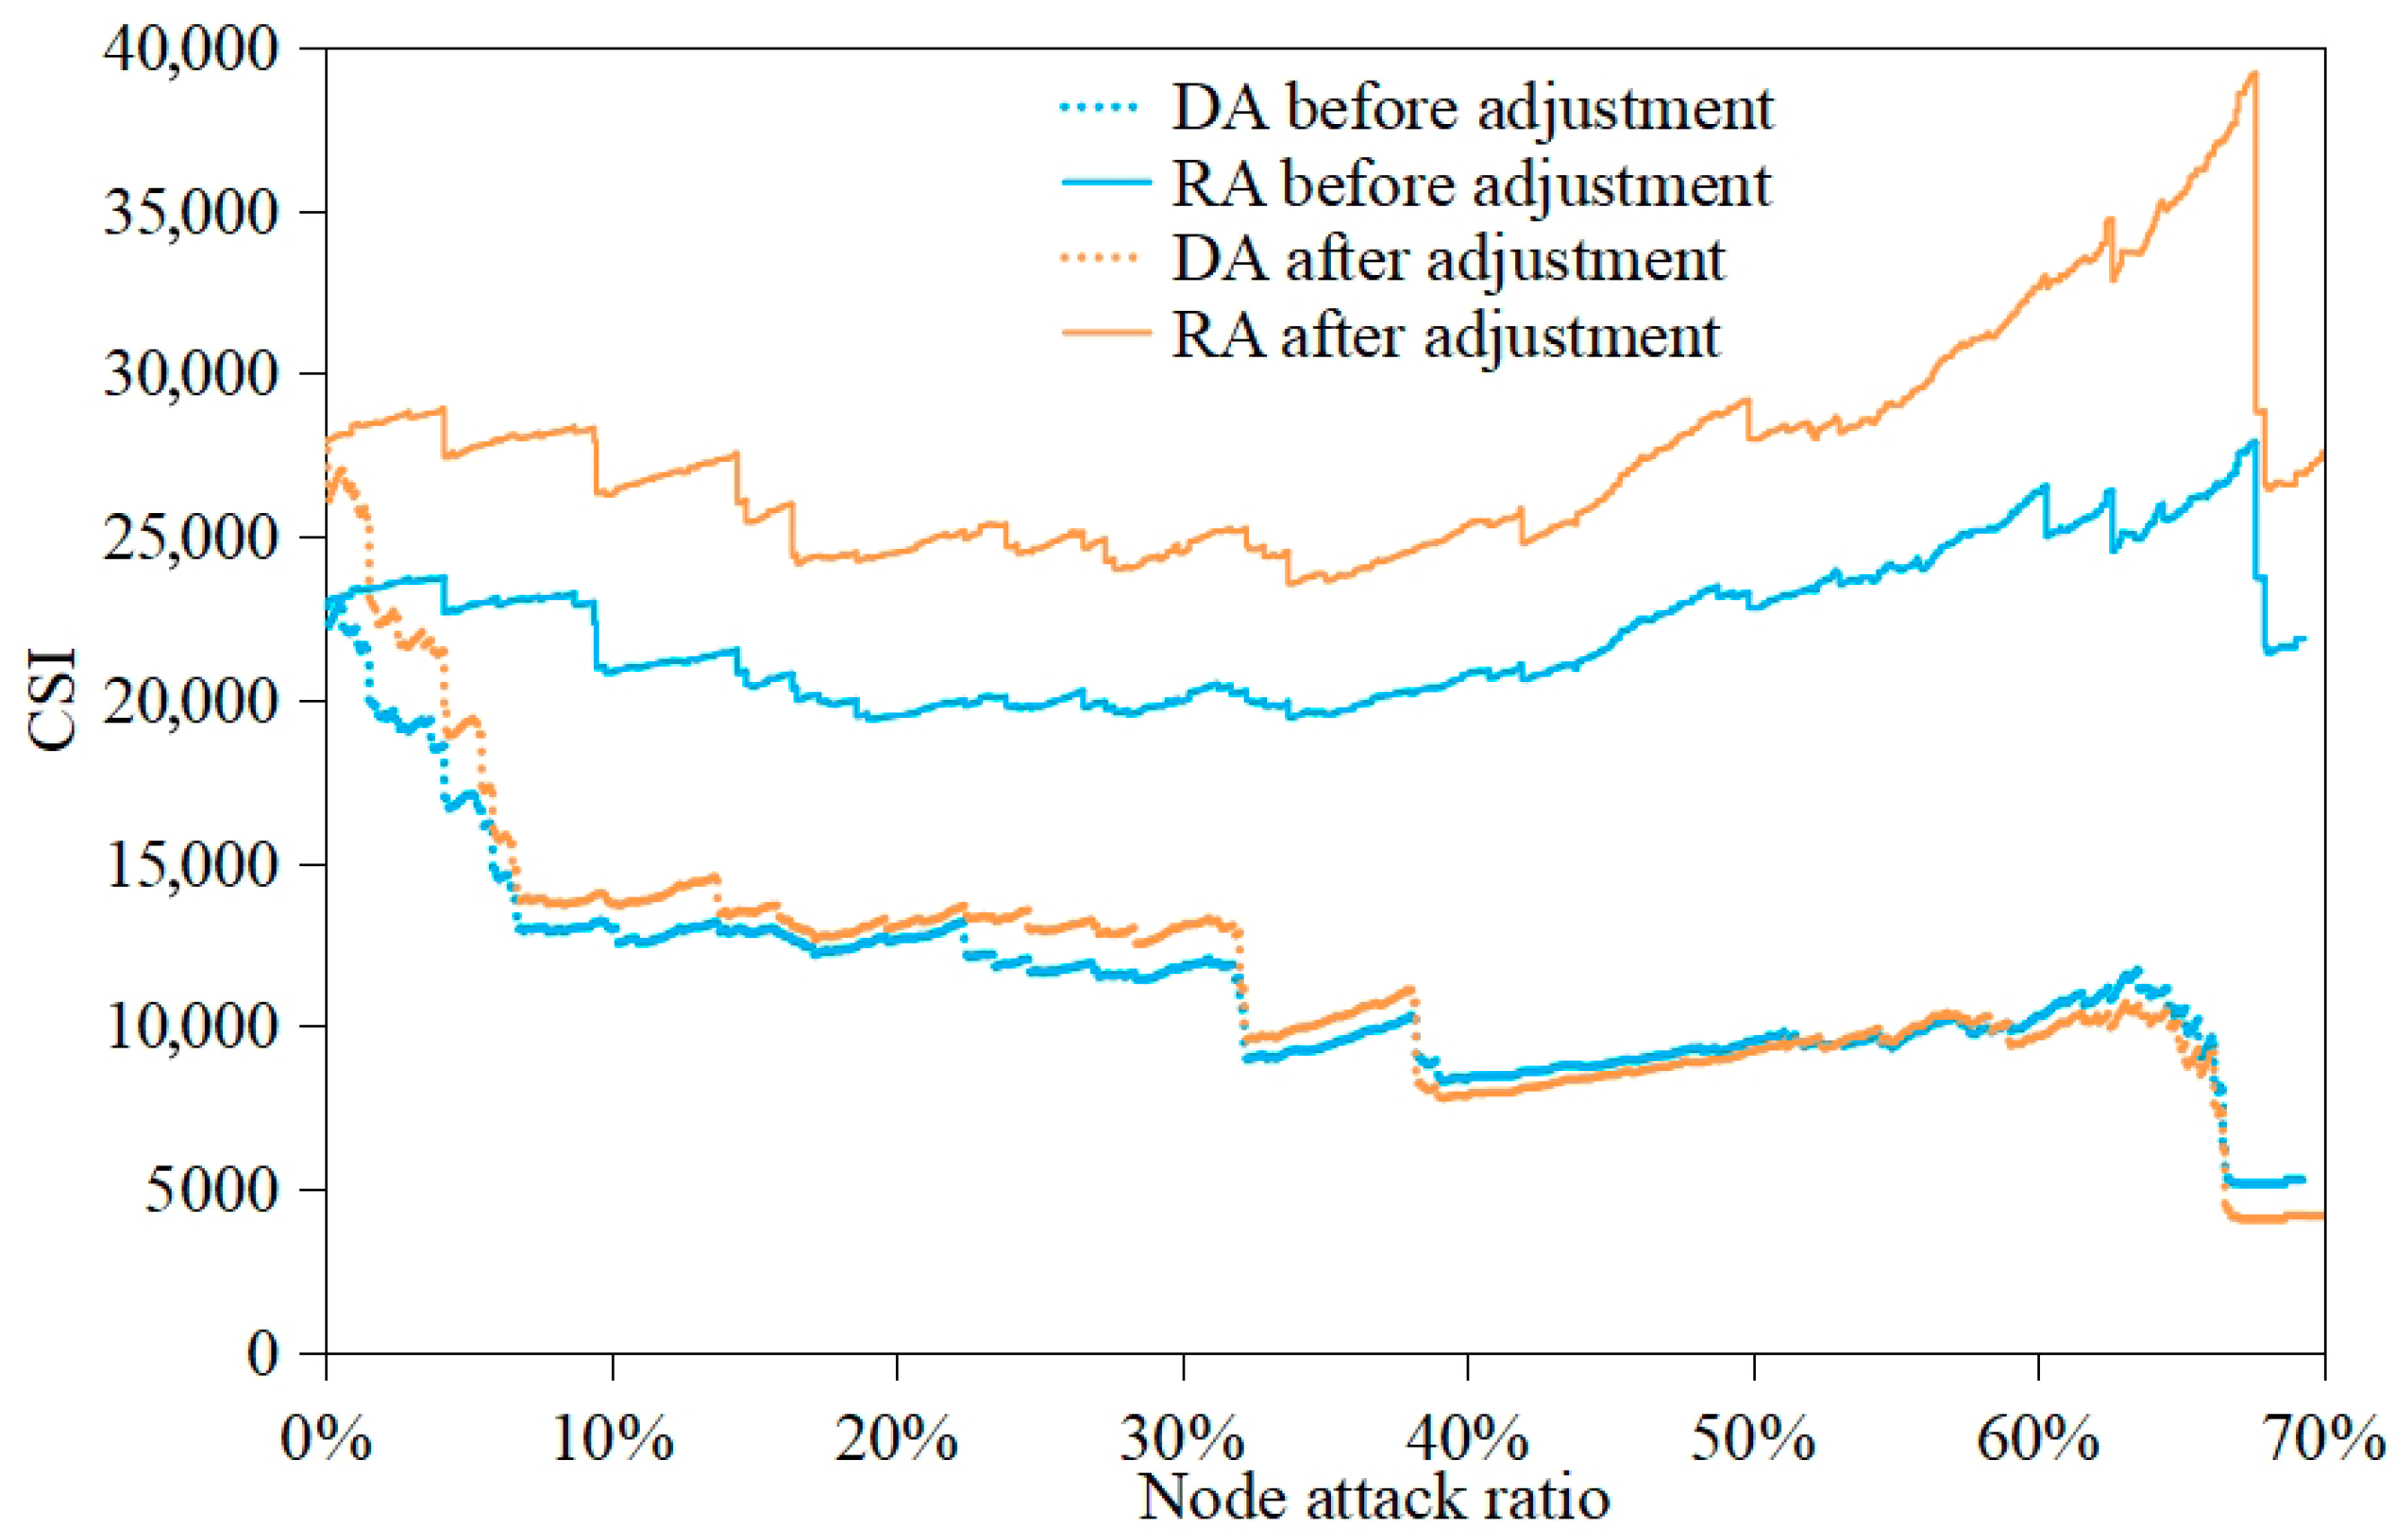
The results in Figure 9, Figure 10 and Figure 11 present a comparison of the supply chain network’s sustainability before and after the adjustment by NQP across the three stages. In the figures, the two solid lines at the top represent the sustainability results of the network under random attack scenarios, while the two dashed lines at the bottom represent deliberate attack scenarios. The gray lines indicate the sustainability results of the network before the adjustment by NQP, and the black lines indicate the results after the adjustment. Overall, in all three stages, the post-adjustment curves are almost consistently above the pre-adjustment curves, suggesting that NQP effectively promotes the sustainability of the supply chain network.
Figure 9 shows that during the 2012–2014 stage, except when the supply chain network was subjected to large-scale deliberate shocks, the differences in CSI between the pre-adjustment and post-adjustment networks remained relatively stable, demonstrating that NQP generally exerted a positive promoting effect on the sustainability of the supply chain network. Specifically, under random attacks, the strengthening effect of NQP on the CSI of the supply chain network was more evident, with the maximum increase reaching around 5300. Moreover, the post-adjustment curve followed the same fluctuation pattern as the pre-adjustment curve while consistently lying above it, indicating the broad positive influence of NQP on the network’s sustainability. In the case of deliberate attacks, when the proportion of attacked nodes was below 9%, the positive moderating effect of NQP on sustainability was relatively high but then declined with fluctuations. Once the proportion of attacked nodes exceeded 40%, negative moderating effects began to appear. At this stage, the enhancement of overall sustainability in the industrial chain network driven by NQP is primarily led by dominant firms and gradually diffuses to SMEs. The positive effect mainly relies on technological breakthroughs and the spillover influence of leading firms, forming a “point-based diffusion” pattern centered on core enterprises—an effect particularly evident under random attack scenarios. However, when shocks target a small number of leading firms, the overall network connectivity declines sharply, and the moderating role of NQP weakens or even turns negative.
Figure 10 shows that during the 2015–2020 period, NQP effectively increased the sustainability of the supply chain network in the face of random attacks. This was particularly true when the proportion of attacked nodes was below 14%, with the maximum CSI increase reaching approximately 6500, higher than in the previous period. Beyond 14%, the positive regulatory effect of NQP remained relatively stable, and the network remained intact even after a large-scale attack with over 70% of attacked nodes. This result demonstrates that NQP began to leverage its shared and integrated advantages during this period, benefiting a wide range of enterprises. The two curves under the deliberate attack scenario indicate that the regulatory effect of NQP significantly increased the stability of core enterprises. Driven by both green integration and innovative efficiency, NQP effectively strengthened the top 1% of key hub nodes in the supply chain network, increasing the network’s CSI by approximately 5000 and mitigating the risk of supply chain disruption caused by damage to leading enterprises. At this stage, NQP has begun to diffuse more broadly, fostering sharing and integration effects among enterprises and significantly enhancing the overall CSI of the industrial chain network. Even under large-scale attack scenarios, the network maintains strong connectivity, indicating that NQP effectively strengthens the long-term sustainability of the supply chain through collaborative diffusion and network integration effects. However, under extreme targeted attacks, damage to core nodes can still bring the network to the brink of collapse.
Figure 11 illustrates the effective positive moderating effect of NQP on the sustainability of the supply chain network during the 2021–2023 period. After the development in the previous two stages, NQP had already widely and effectively enhanced the CSI of the supply chain network. Therefore, in this stage, the increase of the post-adjustment curve compared with the pre-adjustment curve is slightly lower than in the earlier stages, generally remaining within 5000, but with a more stable trend. This indicates that the promotion effect of NQP on the sustainability of the supply chain network has entered a normalized and stabilized phase. When facing deliberate attacks, the moderating effect of NQP on the resilience of hub nodes in the supply chain network expands to include the top 5% of core enterprises, and the effect becomes more pronounced. This suggests that dominant enterprises have formed relatively mature and stable NQP. However, it should be noted that when the proportion of attacked nodes reaches 30%, the network connectivity declines sharply, and by 50% it approaches zero. At this stage, NQP has entered a phase of widespread and normalized application, leading to a more stable enhancement of the network’s CSI. This suggests that its contribution has evolved from “structural breakthroughs” toward “systematic and sustained strengthening.” However, while industrial clustering driven by supply chain restructuring can significantly improve production efficiency, it also increases the risk of industrial homogeneity and risk convergence. The tension between “multi-point redundancy” and “risk resonance” thus remains a key challenge. Due to the boundary effects of core node failures and excessive industrial similarity, the positive impact of NQP may be partially weakened or, in some cases, even reversed.
Overall, NQP enhances the resilience of industrial networks across multiple dimensions through mechanisms such as technological diffusion, information interconnection, structural optimization, and collaborative expansion. Nevertheless, its effects display clear stage-dependent and structural boundary characteristics. Specifically, its impact on NE derives from technological and informational interconnectivity that enhances stability but may diminish under large-scale attacks or core node failures. Its influence on CFS relies on structural optimization and inter-firm complementarity, though resource concentration or intense shocks may trigger risk resonance. Regarding CSI, its improvement results from collaborative diffusion and network integration, yet adaptability can be constrained when core nodes fail or when industrial clustering leads to excessive homogeneity.

5. Conclusions and Policy Implications

This study constructs a “Fixed Point → Strong Chain → Network Expansion” framework to systematically analyze the nonlinear coupling mechanism between NQP and modern SCN. Using panel data from China A-share-listed companies (2012–2023), we apply complex network methods and a Hadamard-based regulation model to capture how firm-level NQP influences network resilience from a dynamic perspective. The empirical results reveal that NQP significantly enhances the defense, recovery, and sustainability capacities of industrial networks. Specifically, NQP strengthens defensive capability under random shocks by promoting technological diffusion and inter-firm information connectivity, though the effect diminishes under extensive or targeted attacks on core firms. The recovery effect of NQP shows stage dependence: in the early stage of industrial transformation, excessive concentration of technology and resources among a few firms may amplify risk propagation; as industrial structures mature, redundancy and synergy improve recovery efficiency. Furthermore, NQP fosters network sustainability through collaborative innovation and digital–green integration, improving coordination efficiency and long-term adaptability. Nevertheless, excessive industrial homogeneity may weaken these positive effects and, in extreme cases, increase systemic fragility. Theoretically, this study advances the understanding of how innovation-driven productivity transformation shapes supply chain resilience by linking micro-level firm heterogeneity with macro-level network dynamics. Managerially, it offers practical insights for firms and policymakers to enhance supply chain robustness through digital empowerment, green transformation, and coordinated industrial upgrading, thereby achieving a balance between efficiency and resilience, while also emphasizing the need to strengthen risk early-warning systems and dynamic monitoring mechanisms.
Despite its contributions, several limitations remain. The study focuses on China’s A-share-listed companies, which—though representative of key industrial actors—limit generalizability to smaller or unlisted enterprises. In addition, the complex network model assumes relatively stable inter-firm linkages, potentially overlooking unstructured or time-varying relationships. Future research should incorporate small and medium-sized enterprises, multinational supply chain data, and dynamic network characteristics to further test the robustness, cross-context applicability, and scalability of the proposed framework. Such extensions will deepen the theoretical and practical understanding of how NQP drives sustainable and resilient supply chain development in diverse economic contexts.

Supplementary Materials

The following supporting information can be downloaded at https://www.mdpi.com/article/10.3390/app152011193/s1, S1. Measurement and analysis of firms’ NQP [18], S2. Data sources and processing, S3. Measurement results and analysis of firms’ NQP [31], S4. NQP Moderation Results.

Author Contributions

Conceptualization, Z.L. and X.K.; Data curation, Z.L. and X.K.; Resources, Z.L.; Validation, Z.L.; Funding acquisition, Z.L.; Methodology, X.K.; Software, X.K.; Formal analysis, X.K.; Writing—original draft, X.K.; Writing—review & editing, Z.L. and X.K. All authors have read and agreed to the published version of the manuscript.

Funding

This research is supported by the National Social Science Fund of China (Grant No. 21BTJ063).

Data Availability Statement

The data supporting the findings of this study are mainly obtained from publicly available databases, including CSMAR, Wind, and publicly disclosed information such as annual reports and temporary announcements of listed companies. The relevant data can be accessed and downloaded from the following official websites: CSMAR Database: https://www.gtarsc.com, Wind Database: https://www.wind.com.cn, Annual Reports and Announcements of Listed Companies: official websites of the respective listed companies. Additional processed or derived data supporting the findings of this study are available from the corresponding author upon reasonable request. The related data can also be obtained from the authors upon reasonable request.

Conflicts of Interest

The authors declare no conflict of interest.

References

  1. Ma, C.; Zhang, L.; You, L.; Tian, W. A review of supply chain resilience: A network modeling perspective. Appl. Sci. 2024, 15, 265. [Google Scholar] [CrossRef]
  2. Lin, L.; Gu, T.; Shi, Y. The Influence of New Quality Productive Forces on High-Quality Agricultural Development in China: Mechanisms and Empirical Testing. Agriculture 2024, 14, 1022. [Google Scholar] [CrossRef]
  3. Walton, N.; Nayak, B.S. Rethinking of Marxist perspectives on big data, artificial intelligence (AI) and capitalist economic development. Technol. Forecast. Soc. Change 2021, 166, 120576. [Google Scholar] [CrossRef]
  4. Bag, S.; Rahman, M.S.; Chiarini, A. Building Sustainable Supply Chain Resilience: Insights From a Mixed-Method Study. Bus. Strategy Environ. 2024, 34, 2103–2127. [Google Scholar] [CrossRef]
  5. Chowdhury, M.M.H.; Islam, M.T.; Ali, I.; Quaddus, M. The role of social capital, resilience, and network complexity in attaining supply chain sustainability. Bus. Strategy Environ. 2023, 33, 2621–2639. [Google Scholar] [CrossRef]
  6. Elnadi, M.; Gheith, M.H.; Troise, C.; Abdallah, Y.O.; Abdelaziz, M.A.A. Digital Transformation and Sustainable Supply Chain Performance for Sustainable Development: The Mediating Role of Supply Chain Capabilities. Sustain. Dev. 2025. online version of record before inclusion in an issue. [Google Scholar] [CrossRef]
  7. Hearnshaw, E.J.; Wilson, M.M. A complex network approach to supply chain network theory. Int. J. Oper. Prod. Manag. 2013, 33, 442–469. [Google Scholar] [CrossRef]
  8. Guntuka, L.; Carnovale, S.; Falcone, E. Supply Chain Plasticity: A Responsive Network Capability to Ensure Resilience. J. Bus. Logist. 2024, 45, e12398. [Google Scholar] [CrossRef]
  9. Patrucco, A.S.; Picanço Rodrigues, V.; Fransoo, J.C.; Mejia-Argueta, C. Resilient Supply Chains Amid Uncertainty: Do Agility, Adaptability, and Alignment Mitigate the Effects of Major Disruptions? J. Bus. Logist. 2025, 46, e70037. [Google Scholar] [CrossRef]
  10. Qi, Y.; Wang, X.; Zhang, M.; Wang, Q. Developing supply chain resilience through integration: An empirical study on an e-commerce platform. J. Oper. Manag. 2022, 69, 477–496. [Google Scholar] [CrossRef]
  11. Yu, Y.; Li, Z.; Mangla, S.K.; Song, M. Robot Built Different: How It Affects Supply Chain Resilience. J. Bus. Logist. 2025, 46, e70028. [Google Scholar] [CrossRef]
  12. Pandey, A.K.; Daultani, Y.; Pratap, S. Blockchain technology enabled critical success factors for supply chain resilience and sustainability. Bus. Strategy Environ. 2023, 33, 1533–1554. [Google Scholar] [CrossRef]
  13. Xu, T.; Yang, G.; Chen, T. The role of green finance and digital inclusive finance in promoting economic sustainable development: A perspective from new quality productivity. J. Environ. Manag. 2024, 370, 122892. [Google Scholar] [CrossRef] [PubMed]
  14. Zhang, Z.; Li, P.; Wang, X.; Ran, R.; Wu, W. New energy policy and new quality productive forces: A quasi-natural experiment based on demonstration cities. Econ. Anal. Policy 2024, 84, 1670–1688. [Google Scholar] [CrossRef]
  15. Zhang, Z.; Hua, Z.; He, Z.; Wei, X.; Sun, H. The impact of local government attention on green total factor productivity: An empirical study based on System GMM dynamic panel model. J. Clean. Prod. 2024, 458, 142275. [Google Scholar] [CrossRef]
  16. Li, K. The Promoting Role of New Quality Productive Forces in Rural Revitalization and Its Mechanism Analysis—An Empirical Study Based on the Effects of Innovation Spillover and Industrial Upgrading. Adv. Econ. Manag. Res. 2025, 13, 238. [Google Scholar] [CrossRef]
  17. Guo, J.; Tang, Q.; Jin, G. Labor protection and the efficiency of human capital investment. Econ. Anal. Policy 2021, 69, 195–207. [Google Scholar] [CrossRef]
  18. Zhang, J.; Zhang, Y. Research on Collaborative Performance of Green Supply Chain Enabled by New Quality Productivity. Sustainability 2025, 17, 3793. [Google Scholar] [CrossRef]
  19. Aslam, H.; ur Rehman, A.; Iftikhar, A.; ul Haq, M.Z.; Akbar, U.; Kamal, M.M. Digital transformation: Unlocking supply chain resilience through adaptability and innovation. Technol. Forecast. Soc. Change 2025, 219, 124234. [Google Scholar] [CrossRef]
  20. Tu, Y.; Li, H.; Dong, J.; Zhou, J.; Hu, L. Impacts of intellectual capital, supply chain knowledge sharing on supply chain resilience: Evidence from China. J. Intellect. Cap. 2025, 26, 1013–1035. [Google Scholar] [CrossRef]
  21. Issa, A.; Khadem, A.; Alzubi, A.; Berberoğlu, A. The path from green innovation to supply chain resilience: Do structural and dynamic supply chain complexity matter? Sustainability 2024, 16, 3762. [Google Scholar] [CrossRef]
  22. Metwally, A.B.M.; Ali, H.A.A.; Aly, S.A.S.; Ali, M.A.S. The Interplay between Digital Technologies, Supply Chain Resilience, Robustness and Sustainable Environmental Performance: Does Supply Chain Complexity Matter? Sustainability 2024, 16, 6175. [Google Scholar] [CrossRef]
  23. Cherian, T.M.; Mathivathanan, D.; Arun SJ, C.J.; Ramasubramaniam, M.; Alathur, S. Influence of supply chain resilience, information technology capabilities and agility on cost and delivery performance in construction supply chains: An Indian perspective. Int. J. Logist. Manag. 2023, 34, 1050–1076. [Google Scholar] [CrossRef]
  24. Kumar, M.; Raut, R.D.; Gunasekaran, A.; Venkateshwarlu, M.; Choubey, V.K. Developing supply chain capabilities through digitalization and viability for controlling the ripple effect. IEEE Trans. Eng. Manag. 2023, 71, 10341–10357. [Google Scholar] [CrossRef]
  25. Ge, R.; Bao, H. Digital transformation and resilience of supply chain in manufacture listed firms: A backward spillover effects in the vertical supply chain relationship. Financ. Res. Lett. 2024, 65, 105516. [Google Scholar] [CrossRef]
  26. Ma, L.; Luo, X.; Xi, M. The impact of regional artificial intelligence development on the resilience of enterprise supply chains. Int. Rev. Econ. Financ. 2025, 102, 104305. [Google Scholar] [CrossRef]
  27. Jia, L.; Li, J. How does digital collaboration impact supply chain resilience. Financ. Res. Lett. 2024, 66, 105684. [Google Scholar] [CrossRef]
  28. Song, Y.; Zhu, M.; Wang, Y. Corporate financialization, digital transformation, and industrial supply chain resilience: Mechanisms based on R&D investment and financial regulation. Int. Rev. Financ. Anal. 2025, 102, 104119. [Google Scholar] [CrossRef]
  29. Yin, W.; Ran, W. Supply chain diversification, digital transformation, and supply chain resilience: Configuration analysis based on FSQCA. Sustainability 2022, 14, 7690. [Google Scholar] [CrossRef]
  30. Effah, D.; Bai, C.; Asante, W.A.; Quayson, M. The role of artificial intelligence in coping with extreme weather-induced cocoa supply chain risks. IEEE Trans. Eng. Manag. 2023, 71, 9854–9875. [Google Scholar] [CrossRef]
  31. Wang, Y.; Wu, D.; Li, H. Efficiency measurement and productivity progress of regional green technology innovation in China: A comprehensive analytical framework. Technol. Anal. Strateg. Manag. 2022, 34, 1432–1448. [Google Scholar]
  32. Hosseini, S.; Ivanov, D.; Blackhurst, J. Conceptualization and measurement of supply chain resilience in an open-system context. IEEE Trans. Eng. Manag. 2020, 69, 3111–3126. [Google Scholar] [CrossRef]
  33. Bag, S.; Rahman, M.S.; Chan, H.-L.; Sharma, J. Effect of Supply Chain Flexibility and Supply Chain Endurance on Supply Chain Resilience in Extreme Weather Events: An Empirical Study. IEEE Trans. Eng. Manag. 2025, 72, 2150–2164. [Google Scholar] [CrossRef]
  34. Wang, X.; Zhang, M.; Qi, Y.; Wang, Q. Developing supply chain resilience: A supply network perspective. Supply Chain Manag. Int. J. 2025, 30, 353–368. [Google Scholar] [CrossRef]
  35. Lavassani, K.M.; Boyd, Z.M.; Movahedi, B.; Vasquez, J. Ten-tier and multi-scale supply chain network analysis of medical equipment: Random failure & intelligent attack analysis. Int. J. Prod. Res. 2023, 61, 8468–8492. [Google Scholar] [CrossRef]
  36. Jia, Z.; Li, Y.; Wang, J.; Wang, Z.; Zhao, G. A Study on the Measurement of China’s Manufacturing Industry Chain Toughness and Regional Heterogeneity from a Dynamic Perspective. Int. Rev. Econ. Financ. 2025, 102, 104329. [Google Scholar] [CrossRef]
  37. Zhang, M.; Wei, L.; Yi, Z. The impact of embedded global innovation networks on manufacturing value chains. Sci. Rep. 2025, 15, 28275. [Google Scholar] [CrossRef] [PubMed]
  38. Tsolakis, N.; Schumacher, R.; Dora, M.; Kumar, M. Artificial intelligence and blockchain implementation in supply chains: A pathway to sustainability and data monetisation? Ann. Oper. Res. 2023, 327, 157–210. [Google Scholar] [CrossRef]
  39. Xue, J.; Li, G.; Ivanov, D. Digital transformation in the blockchain era: Balancing efficiency and resilience in operations management. Int. J. Prod. Econ. 2025, 282, 109525. [Google Scholar] [CrossRef]
  40. Zouari, D.; Ruel, S.; Viale, L. Does digitalising the supply chain contribute to its resilience? Int. J. Phys. Distrib. Logist. Manag. 2021, 51, 149–180. [Google Scholar] [CrossRef]
  41. Liu, Y.; He, Z. Synergistic industrial agglomeration, new quality productive forces and high-quality development of the manufacturing industry. Int. Rev. Econ. Financ. 2024, 94, 103373. [Google Scholar] [CrossRef]
  42. Xu, Y.; Li, C. Digital transformation, firm boundaries, and market power: Evidence from China’s listed companies. Systems 2023, 11, 479. [Google Scholar] [CrossRef]
  43. Wei, L.; Wei, W.; Liu, Y.; Zhang, J.; Xu, X. Mitigating supply-demand mismatch: The relationship between inventory sharing and demand learning. Decis. Sci. 2024, 55, 533–548. [Google Scholar] [CrossRef]
  44. Wang, B.; Sui, Q.; Liu, H.; Yu, G.; Qu, J. Promoting environmental risk assessment and control of emerging contaminants in China. Engineering 2024, 37, 13–17. [Google Scholar] [CrossRef]
  45. Newman, M.E.J. The Structure and Function of Complex Networks. SIAM Rev. 2003, 45, 167–256. [Google Scholar] [CrossRef]
  46. Perera, S.S.; Bell, M.G.; Piraveenan, M.; Kasthurirathna, D.; Parhi, M. Topological structure of manufacturing industry supply chain networks. Complexity 2018, 2018, 3924361. [Google Scholar] [CrossRef]
  47. Yang, L.; Liu, Y. The impact of digital infrastructure on industrial chain resilience: Evidence from China’s manufacturing. Technol. Anal. Strateg. Manag. 2024, 37, 1112–1128. [Google Scholar] [CrossRef]
  48. Yu, Y.; Ma, D.; Wang, Y. Structural resilience evolution and vulnerability assessment of semiconductor materials supply network in the global semiconductor industry. Int. J. Prod. Econ. 2024, 270, 109172. [Google Scholar] [CrossRef]
  49. Yu, Y.U.; Daipeng, M.A.; Xianmei, W. International trade network resilience for products in the whole industrial chain of iron ore resources. Resour. Sci. 2022, 44, 2006–2021. [Google Scholar] [CrossRef]
  50. Cheng, X. Research on the Statistical Properties and Stability of Complex Interindustrial Networks. Complexity 2024, 2024, 9220756. [Google Scholar] [CrossRef]
  51. Ouyang, X.; Liu, L.; Chen, W.; Wang, C.; Sun, X.; He, C.; Liu, G. Systematic risks of the global lithium supply chain network: From static topological structures to cascading failure dynamics. Environ. Sci. Technol. 2024, 58, 22135–22147. [Google Scholar] [CrossRef] [PubMed]
  52. Zheng, X.; Li, H.; Liu, X.; Wang, X.; Zhang, Y.; Tang, Q.; Ren, B. Supply risk propagation in international trade networks of the tungsten industry chain. Humanit. Soc. Sci. Commun. 2025, 12, 54. [Google Scholar] [CrossRef]
  53. Chrysos, G.G.; Wu, Y.; Pascanu, R.; Torr, P.; Cevher, V. Hadamard product in deep learning: Introduction, Advances and Challenges. IEEE Trans. Pattern Anal. Mach. Intell. 2025, 47, 6531–6549. [Google Scholar] [CrossRef]
  54. Wang, Z.; Feng, Y.; Yao, N.; Lin, O.; Li, Q.; Liu, B. Impact of policy interventions on low-carbon technology innovation diffusion in supply networks. Manag. Decis. Econ. 2024, 45, 5040–5053. [Google Scholar] [CrossRef]
  55. Zhu, Z.; Hua, Q.; Xu, S.; Lin, W. The mechanism of green finance in promoting China’s new quality productive forces: Technological innovation and data factor. Res. Int. Bus. Financ. 2025, 79, 103038. [Google Scholar] [CrossRef]
  56. Ma, L.; Li, X.; Pan, Y. Global industrial chain resilience research: Theory and measurement. Systems 2023, 11, 466. [Google Scholar] [CrossRef]
  57. Yang, M.; Wang, G. Based On “Long Tail” Theory to Solve Finance Difficulties of SMEs with Internet Finance. Adv. Econ. Manag. Res. 2023, 6, 382. [Google Scholar] [CrossRef]
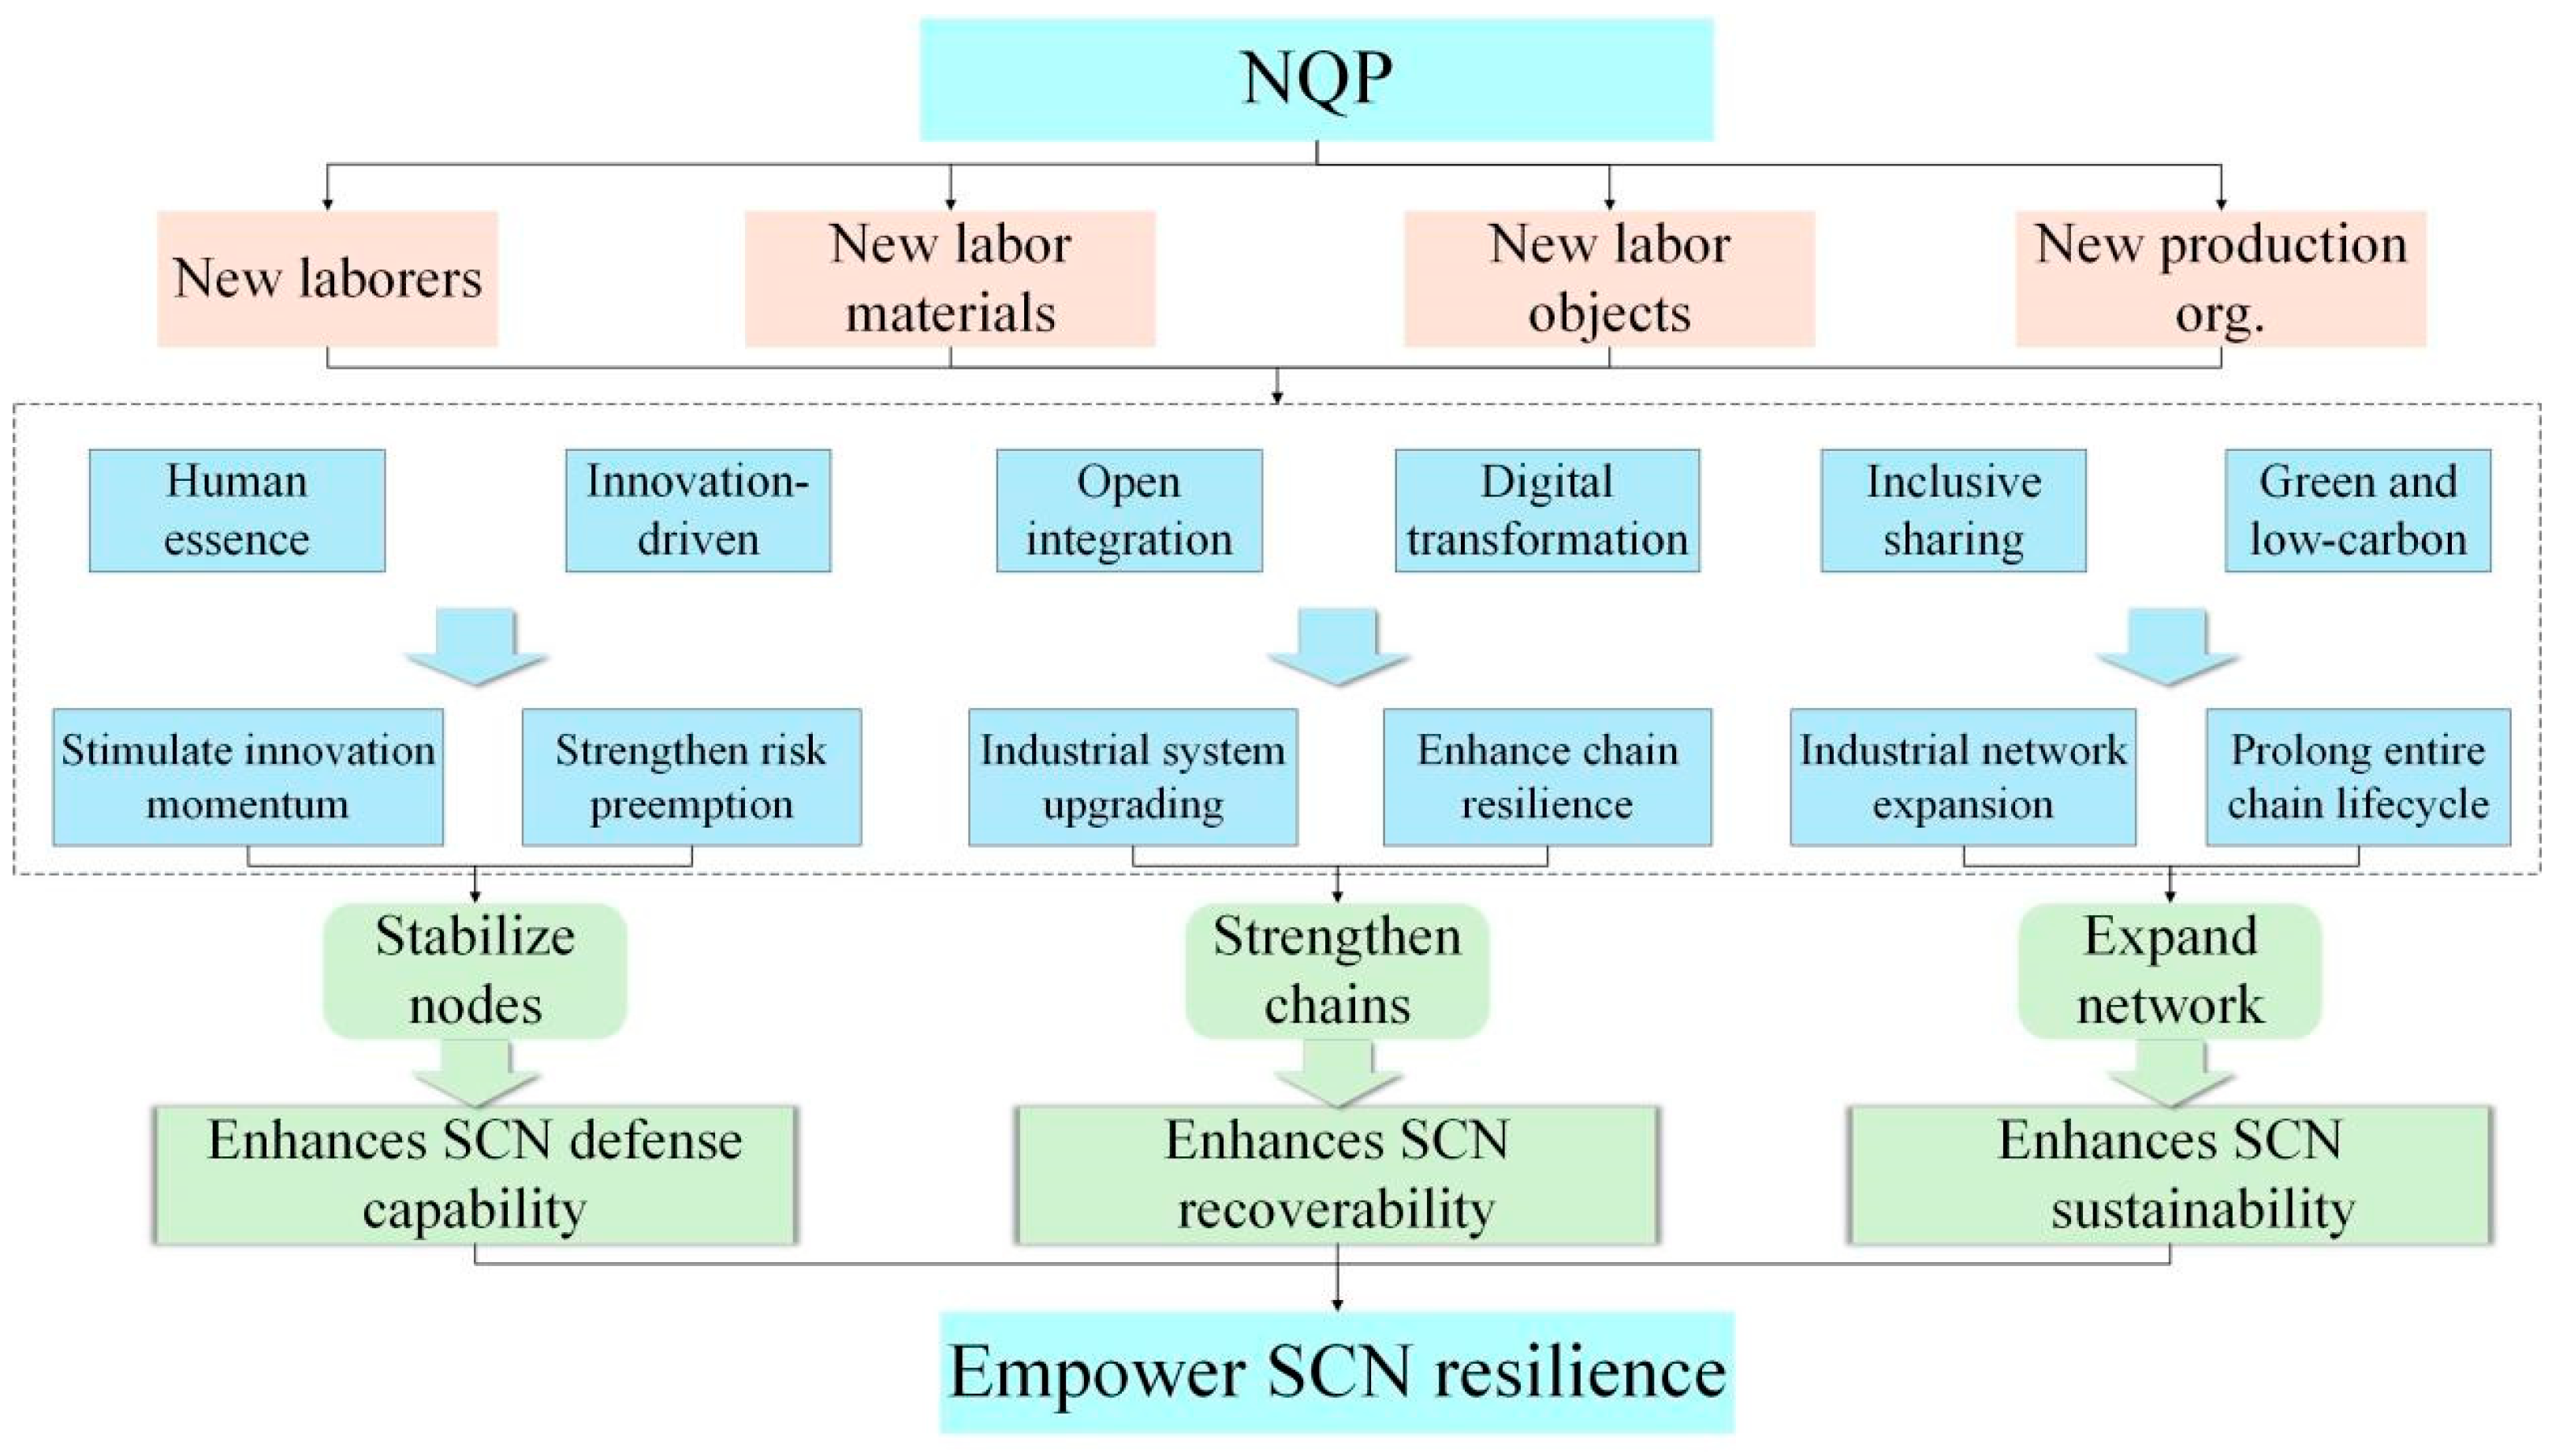
Figure 1. Schematic diagram of the role of NQP in enabling SCN resilience. (The orange elements represent the connotations of NQP, the blue elements indicate the pathways of influence, and the green elements illustrate the directions and outcomes of these effects).
Applsci 15 11193 g001
Figure 2. Diagram of risk propagation cascade failure. (The lines represent the relationships between nodes, and the arrows indicate the direction of product or service flow. Gray denotes normal nodes, while red represents infected or abnormal nodes.).
Applsci 15 11193 g002
Figure 3. Comparison of the impact of NQP on SCN defense capabilities between 2012 and 2014, the horizontal axis represents the proportion of attacked nodes in the risk simulation experiment, while the vertical axis shows the variation in defensive capacity. DA (dashed line) and RA (solid line) denote deliberate and random attack scenarios, respectively. The blue and orange lines indicate the SCN’s defensive capacity before and after NQP adjustment, respectively. (Note: detailed result data are provided in Supplementary Material S4).
Applsci 15 11193 g003
Figure 4. Comparison of the impact of NQP on SCN defense capabilities from 2015 to 2020.
Applsci 15 11193 g004
Figure 5. Comparison of the impact of NQP on SCN defense capabilities before and after 2021–2023.
Applsci 15 11193 g005
Figure 6. Comparison of the impact of NQP on SCN resilience between 2012 and 2014, The horizontal axis represents the propagation steps of risk within the SCN, while the vertical axis shows the variation in the scale of risk transmission. r1 (dashed line) and r2 (solid line) denote high-risk and low-risk shock scenarios, respectively. The blue and orange lines indicate the SCN’s recovery capacity before and after NQP adjustment, respectively.
Applsci 15 11193 g006
Figure 7. Comparison of SCN resilience under the influence of NQP from 2015 to 2020.
Applsci 15 11193 g007
Figure 8. Comparison of SCN resilience under the influence of NQP from 2021 to 2023.
Applsci 15 11193 g008
Figure 9. Comparison of the impact of NQP on the sustainability of SCN between 2012 and 2014, the horizontal axis represents the proportion of attacked nodes in the risk simulation experiment, while the vertical axis shows the variation in defensive capacity. DA (dashed line) and RA (solid line) denote deliberate and random attack scenarios, respectively. The blue and orange lines indicate the SCN’s sustainability before and after NQP adjustment, respectively. (Note: detailed result data are provided in Supplementary Material S4).
Applsci 15 11193 g009
Figure 10. Comparison of the impact of NQP on the sustainability of SCN from 2015 to 2020.
Applsci 15 11193 g010
Figure 11. Comparison of the impact of NQP on the sustainability of SCN between 2021 and 2023.
Applsci 15 11193 g011
Table 1. Overview of Research Methods in Supply Chain Resilience Studies.
Research MethodLiteratureResearch Focus
Structural equation modeling (SEM)[4,6,12,19,20,21,22,23,24]Causal path analysis and empirical mechanism testing
Panel regression analysis[9,25,26,27,28]Dynamic heterogeneity and long-term resilience evolution
Configurational analysis (fsQCA)[10,29,30]Multiple pathways and complex conditional configurations
Complex network modeling[8,31,32]Topological structure and risk propagation characteristics
Table 2. Overview of Research Perspectives on Supply Chain Resilience.
Research PerspectiveLiteratureResearch Content
Digitalization and intelligence[19,22,24,25,26,27,28]Digital transformation, AI empowerment, and information interconnectivity for enhancing resilience
Greening and sustainability[21,30]Green innovation, eco-logistics optimization, and boundary effects of environmental complexity
Knowledge capital, flexibility, and organizational capability[20,23,33]Intellectual capital, knowledge sharing, and dynamic organizational capability for risk mitigation
Complex systems perspective[29,32,34]Structural holes, multi-path networks, and system openness for resilience improvement
Table 3. Overview of network data.
Time PeriodEnterpriseNumber of TransactionsAverage Transaction ValueIndustry
2012–20141296172822,984.761
2015–20201448206822,859.5864
2021–20231206133638,280.7359
Table 4. Calculation results of SCN resilience before adjustment.
2012–20142015–20202021–2023
DARADARADARA
NEMax0.240.241.111.110.620.62
Min0.010.110.010.160.020.29
Mean0.030.180.050.400.070.39
CSIMax22,997.727,891.722,912.923,863.238,346.338,908.8
Min5169.719,409.05992.618,645.89752.032,016.9
Mean11,224.622,100.19951.121,027.315,679.534,632.5
Risk scenarior1r2r1r2r1r2
CFSMax-failed nodes11823131710
Mean-failed nodes4.283.567.523.806.814.95
Failure step 658676
Disclaimer/Publisher’s Note: The statements, opinions and data contained in all publications are solely those of the individual author(s) and contributor(s) and not of MDPI and/or the editor(s). MDPI and/or the editor(s) disclaim responsibility for any injury to people or property resulting from any ideas, methods, instructions or products referred to in the content.