Article

Enhancement of Visual Feedback Ownership in Hand Mirror Therapy Using Automated Control of Electrical Muscle Stimulation Based on Healthy Hand Movement

by
Adhe Rahmatullah Sugiharto Suwito P
,
Ayumi Ohnishi
,
Tsutomu Terada
* and
Masahiko Tsukamoto
Graduate School of Engineering, Kobe University, 1-1 Rokkodaicho, Nada, Kobe 657-8501, Japan
*
Author to whom correspondence should be addressed.
Appl. Sci. 2025, 15(20), 11179; https://doi.org/10.3390/app152011179
Submission received: 18 September 2025 / Revised: 30 September 2025 / Accepted: 13 October 2025 / Published: 18 October 2025
(This article belongs to the Special Issue Current Advances in Rehabilitation Technology)

Abstract

Mirror therapy (MT) has been recognized for its potential to harness neuroplasticity and improve recovery in post-stroke patients. In MT, a mirror tricks the brain into thinking that the weak or paralyzed side of the body is moving when the healthy side moves, thereby helping to stimulate healing and relearn movement after a stroke or injury. However, MT is limited in addressing the sensory impairment and visual feedback ownership on the affected hand. A combination of MT and electrical muscle stimulation (EMS) is believed to enhance muscle strength and sensory perception, but lacks synchronization with the movement intention of the healthy hand. This study aims to advance MT to further promote neuroplasticity through movement synchronization in both hands. A stretch-sensor glove was used on the unaffected hand to capture finger movement kinematics, controlling the electrical intensity of an EMS device on the assumed affected hand. Thereby, a proportional control of electrical intensity and synchronous movement of both hands was achieved. This study compared four types of electrical intensities, spanning from baseline (no stimulation) to higher intensities (S0–S4). As a result, body representation perception showed an overall negative correlation with the level of comfort associated with the stimulus. Enhancements in body representation perception were significantly confirmed (p < 0.01) in stronger stimulus types, notably S4 and S4F of the spontaneous movement scheme, compared to the baseline stimulus S0 and the weak intensity S1. There may be a possibility of enhancing neuroplasticity by strategically using various electrical intensities. The proposed system shows promising performance by enhancing body representation through improved visual feedback ownership at higher electrical intensities.

1. Introduction

Stroke is one of the major global health issues, with over 13 million new cases annually, and represents the second leading cause of mortality and disability worldwide. According to the World Stroke Organization, the global stroke burden is projected to increase significantly by 2050, with the number of incident strokes more than doubling from 2010 levels [1]. By 2050, there may be 21.43 million new stroke cases, 159.31 million survivors, and 12.05 million deaths annually [2]. Risk factors like hypertension, diabetes, and obesity are expected to become more prevalent [3]. Following a stroke, muscle dysfunction is the most common type of impairment, which greatly heightens the likelihood of arm paralysis. This muscle dysfunction often leads to greater levels of impairment, decreased work capacity, and a lower quality of life [4,5]. These projections and consequences highlight the urgent need for targeted prevention and intervention strategies globally.
Rehabilitation is a common approach for treating muscle injuries, combining medical care with social, educational, and vocational strategies to help regain functional capabilities [6]. Conventional stroke rehabilitation has mainly concentrated on employing compensatory techniques to address the impacts of impairments instead of addressing their underlying causes. However, there is a growing recognition within the scientific and medical fields that neuroplasticity plays a crucial role in recovery. This acknowledgment has led to a significant change in stroke rehabilitation, focusing more on utilizing neuroplasticity to enhance functional recovery and attain lasting progress in long-term outcomes for stroke survivors [7].
One of the treatments known for promoting neuroplasticity is mirror therapy (MT) [7,8]. In MT, a mirror is positioned between the arms (or legs), creating the illusion that when the healthy side moves, the weak or paralyzed side appears to be moving as well. This visual trick deceives the brain into believing that the weaker side is functioning normally. Over time, this visual mechanism can stimulate neuroplasticity in the brain, allowing for the relearning of movement and enhancing recovery following a stroke, injury, or nerve issue [7]. Several studies demonstrated the efficacy of MT on improving upper limb motor function and activities of daily living [9,10]. In addition, MT can be used in all stages of stroke recovery and even in completely paralyzed patients [10,11].
The key point in MT is to ensure the mirror reflection of the unaffected limb acts as a body representation of the affected limb, thereby creating the illusion that the affected limb is moving normally [7]. This condition is correlated with the concept of a sense of agency, which is the fundamental subjective component in body representation, defined as the awareness of oneself as the initiator of one’s actions [12]. Unfortunately, a sufficiently perceived body representation remains a challenging requirement in the implementation of MT. Several studies have reported that the mirror reflection in MT is limited in treating sensory impairments and spatial awareness, where the patient’s spatial awareness on the affected side of the body is insufficient [10,13]. Another study reported that MT induced side effects such as confusion and dizziness in some patients, which is most likely due to a lack of body representation through the visual mirror feedback [14]. A possible reason for this is the lack of a sense of body representation, where the patient fails to feel the movement of the unaffected limb reflected in the mirror as an action of the affected hand. In accordance, it is crucial to improve MT implementation to promote the body representation through visual mirror feedback.
Electrical muscle stimulation (EMS), also sometimes interchangeably called neuromuscular electrical stimulation (NMES), has shown great potential when combined with MT (MT–EMS) in both lower and upper limbs [15,16,17,18,19,20,21]. EMS treatment alone has several advantages, including muscle strengthening, motor reeducation, and enhancing sensory perception, which MT lacks [22]. Since a proper application of EMS is crucial, the combination of MT and EMS is a complementary approach to promote both neuroplasticity and muscle strengthening. Despite its great potential, the feasibility of MT–EMS in enhancing the body representation on the affected limb has received little examination. To date, most MT–EMS approaches utilize a predetermined parameter of electrical stimulus with active–resting window mechanisms of stimulus delivery (e.g., 5 s active and 5 s rest) [15,16,17,18,19,20,21]. This condition requires the patient to adhere to a predetermined cycle, overlooking the synchronization between their movement intentions and the applied electrical stimulation, which may compromise their sense of agency. Furthermore, there is no control over the electrical intensity level integrated with the movement of the unaffected limb, which can worsen the body representation due to a static parameter. Therefore, a system that enhances the body representation ownership of visual feedback is necessary to address the MT’s spatial awareness issue and further promote neuroplasticity.
In accordance, this study proposed a system that enhances body representation ownership in the visual feedback of the MT. This study designed an EMS application approach by automating the control of the electrical intensity level, integrated with the movement of the unaffected (healthy) hand, which is wearing a stretch-sensor glove. Our novel approach involves synchronizing healthy hand movement, as reflected in visual reflection, with the applied electrical intensity level on the assumed affected hand. Thereby, facilitating patients’ engagement in the therapy session to promote a more accurate perceived body representation and enhance the neuroplasticity effect. Lastly, this study also evaluated several electrical intensity levels under directed and spontaneous timing of the open–close finger movement task toward the perceived body representation.

2. Related Research

2.1. Neuroplasticity in Rehabilitation

Neuroplasticity is a continuous process that occurs even in the adult brain, enabling it to adjust to new circumstances, learn new information, and improve skills [23]. There are two primary mechanisms of neuroplasticity: synaptic plasticity and functional reorganization [24]. In synaptic plasticity, the activity related to neuronal impulse transmission is altered by increasing the receptors in postsynaptic neurons, which lowers the threshold for transmitting impulses and makes it easier for presynaptic neurons to convey signals. The other mechanism involves concepts such as equipotentiality, vicariation, and diaschisis to help compensate for damage in specific brain areas. In rehabilitation, neuroplasticity-based interventions capitalize on the brain’s ability to reorganize and adapt following injury or new experiences [7,25]. The main strategies include intensive and repetitive training, task-specific practice, and environmental enrichment [26,27]. Understanding the mechanisms of neuroplasticity can guide the development of more effective rehabilitation interventions. In correlation with MT, an ideal condition of body representation may contribute to cortical reorganization, which constitutes neuroplasticity through improvements in the Mu and beta bands of EEG, even in healthy subjects [28]. Therefore, as the key point in MT, it is crucial to maximize the perception of body representation during the therapy.

2.2. Mirror Therapy and Electrical Muscle Stimulation

Several studies have explored the combination of MT with EMS. In upper-limb applications, while both MT and NMES individually improved the function and quality of life in subacute stroke patients, their combination showed enhanced effects [18,19,20,21]. A similar outcome in lower-limb applications reported an improvement in walking ability, ankle dorsiflexion, and balance compared to conventional therapy or MT alone [15,17]. However, some research indicated mixed results, with one study finding superior outcomes for functional electrical stimulation compared to MT alone [19]. A systematic review and meta-analysis revealed a lack of direct scientific evidence supporting the combined therapy’s effectiveness for upper-limb motor function recovery [29]. More importantly, the synergistic effects and optimal protocols for combining MT with ES/NMES in stroke rehabilitation insisted on a comprehensive observation [30]. As previously stated, an engagement with visual mirror feedback may enhance the neuroplasticity stimulation [7,12,28]. However, despite the potential of the MT-EMS approach to improve the body-functional outcome, it remains uncertain whether the improvement is due to the combination of MT and EMS or EMS alone. These facts imply that an improvement in the EMS protocol is deemed urgent for supporting the MT through an enhancement in body representation perception.

2.3. Assessment of Perceived Body Representation Ownership Through Visual Feedback in Mirror Therapy

As presented in Section 2.2, most of the related studies only focus on motor functional evaluation as the primary outcome of MT with/without EMS combination. One of the related studies evaluated the patient’s visuospatial condition as the secondary outcome through the start cancellation test [19]. However, the start cancellation test is unable to evaluate the perception of body representation through visual mirror feedback.
Alternatively, motor-imagery-based evaluation is one of the tools known to assess an individual’s ability to visualize and feel movements mentally [31,32,33]. The motor-imagery (MI) evaluation requires someone to imagine the visual and feeling of an action to be performed by the non-dominant limb, which was previously performed by the dominant hand. There are only a few who have observed the combined use of MT with MI-based evaluation [32]. Moreover, some studies adopted the scoring principles only to evaluate their personalized tasks [32,33]. Nevertheless, the concept of MI with the perceived body representation of MT is closely related, indicating a great potential as an evaluation tool to assess the patient’s immersion state toward visual mirror feedback while conducting the MT.
According to the aforementioned studies, the body representation through the engagement of the participant with the visual mirror feedback (i.e., a fundamental process in promoting the neuroplasticity process) has received little attention. Furthermore, an official assessment tool specifically for the body representation state in MT remains unestablished. In continuation with the primary purpose of this study, we focused on the impact of the proposed enhanced MT through proportional and synchronous control of EMS with a stretch-sensor glove on the body representation state. Additionally, this study adopted and tailored the MI-based questionnaire as an alternative tool for assessing the body representation state of MT.

3. Methods

3.1. Participants

This study was in the initial stage, focusing on how personalized electrical intensity influences perceived body representation. To investigate this, healthy participants were recruited to examine the effects of the proposed system in individuals with normally functioning bodies. Most importantly, the utilization of a personalized electrical intensity may accommodate variations in participants’ characteristics, which is also influential when applied to the abnormally functioning bodies of patients. Therefore, the outcomes may serve as a pivotal reference for the next stage of the study, involving actual patient observation.
Ten healthy participants, comprising nine men and one woman, were recruited (average age: 24.7 ± 3.8 years). Prior to recruitment, an initial screening was conducted to ensure the participant’s safety. Although this study included only healthy participants, the initial screening criteria were adopted and tailored from the selection criteria for ill patients [34]. Therefore, the participant’s safety was guaranteed. Participants with the following conditions will be excluded:
  • Age under 18 years old.
  • History of heart disease.
  • Blood hypertension status.
  • History of spinal cord/nerve injury.
  • History of forearm/hand muscular injury.
  • Having a metal implant, especially in the arm or hand.
  • Pregnancy for the woman participant.
Following the screening, an explanation was provided about the purpose and procedure of the experiment. Subsequently, the participants who were willing to participate in the experiment filled in the consent form. All experimental procedures were approved by the ethical committee of the Graduate School of Engineering, Kobe University on 8 September 2025 (No. 07–08).

3.2. Instrumentation

In this study, a wearable electrical muscle stimulation (EMS) device named the UnlimitedHand (H2L Inc., Tokyo, Japan) was employed to induce electrical stimulation to the forearm. As shown in Figure 1, the UnlimitedHand (UH) device consists of 8 EMS channels, ranging from channel 0 through 7, and 3 channels for ground (GND) [35]. This feature allows the user to select any forearm muscle as the stimulation target independently. Regarding the EMS specification, the UH device provides a range of digitally controllable parameters, approximately 20–120 Hz pulse frequencies (typically fixed at 40 Hz), 100–400 µs pulse width (typically fixed between 100 µs and 200 µs), and 0–20 mA pulse intensity, which is divided into 12 levels. Additionally, the UH device works in a monophasic waveform mechanism. The UH device provides a software development kit (SDK) containing an interactive control function that works on several platforms, including Arduino. This feature facilitates the interactive control of EMS parameters according to the preferred program. Moreover, the UH device facilitates wireless data communication, allowing for comfortable and flexible usage by the user.
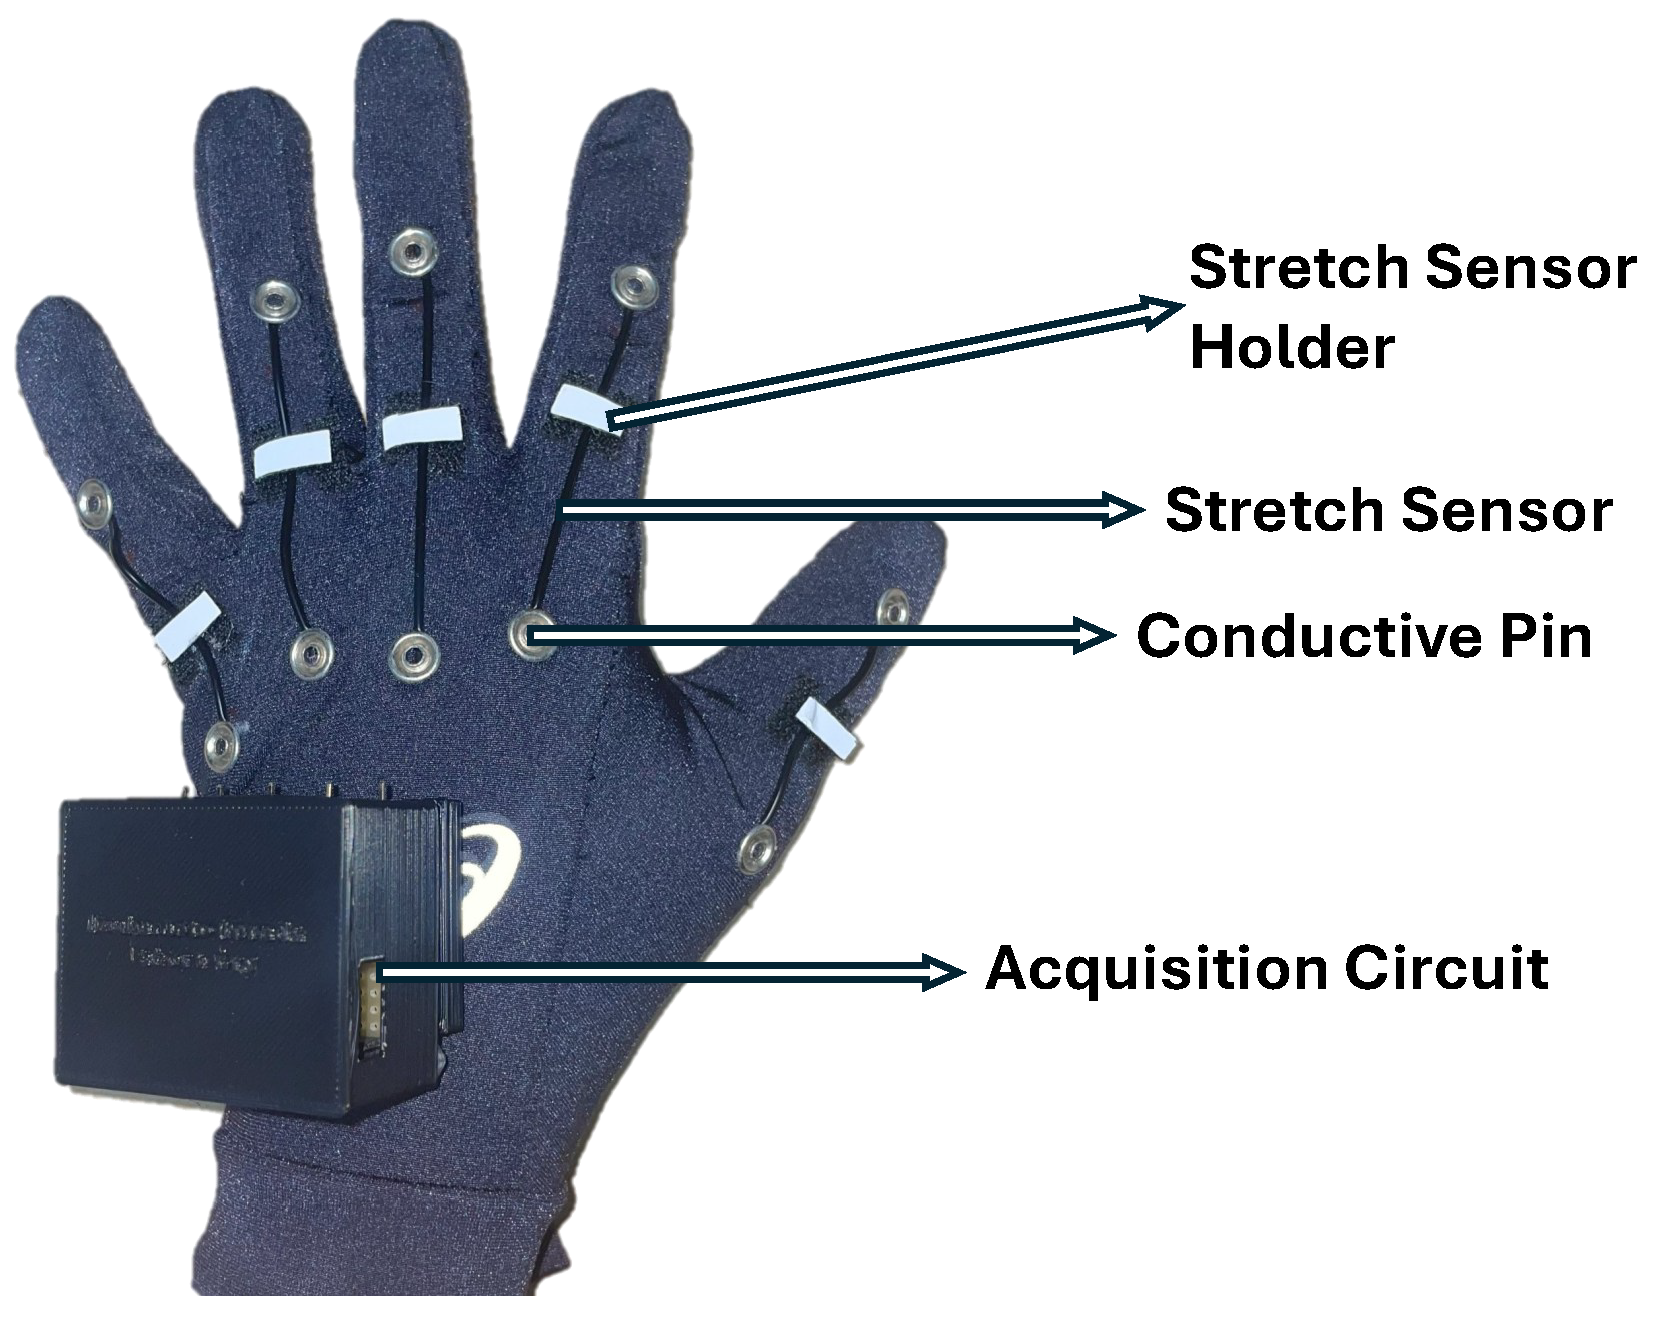
A stretch-sensor glove was utilized to control the EMS parameter of the UH device. As shown in Figure 2, the stretch-sensor glove comprised stretch sensors attached to each finger with the length tailored to cover the metacarpophalangeal (MCP) joint to the interphalangeal (IP) joint, for the thumb, and the MCP through proximal interphalangeal (PIP) for the rest of the fingers [36]. The resistance value of each stretch sensor was obtained through a voltage divider circuit, where Arduino Nano facilitated the ground and 5 V power source for all stretch sensors. The Arduino Nano was programmed to reach an approximate 100 Hz sampling rate. The characteristics of the employed stretch sensor are shown in Figure 3.
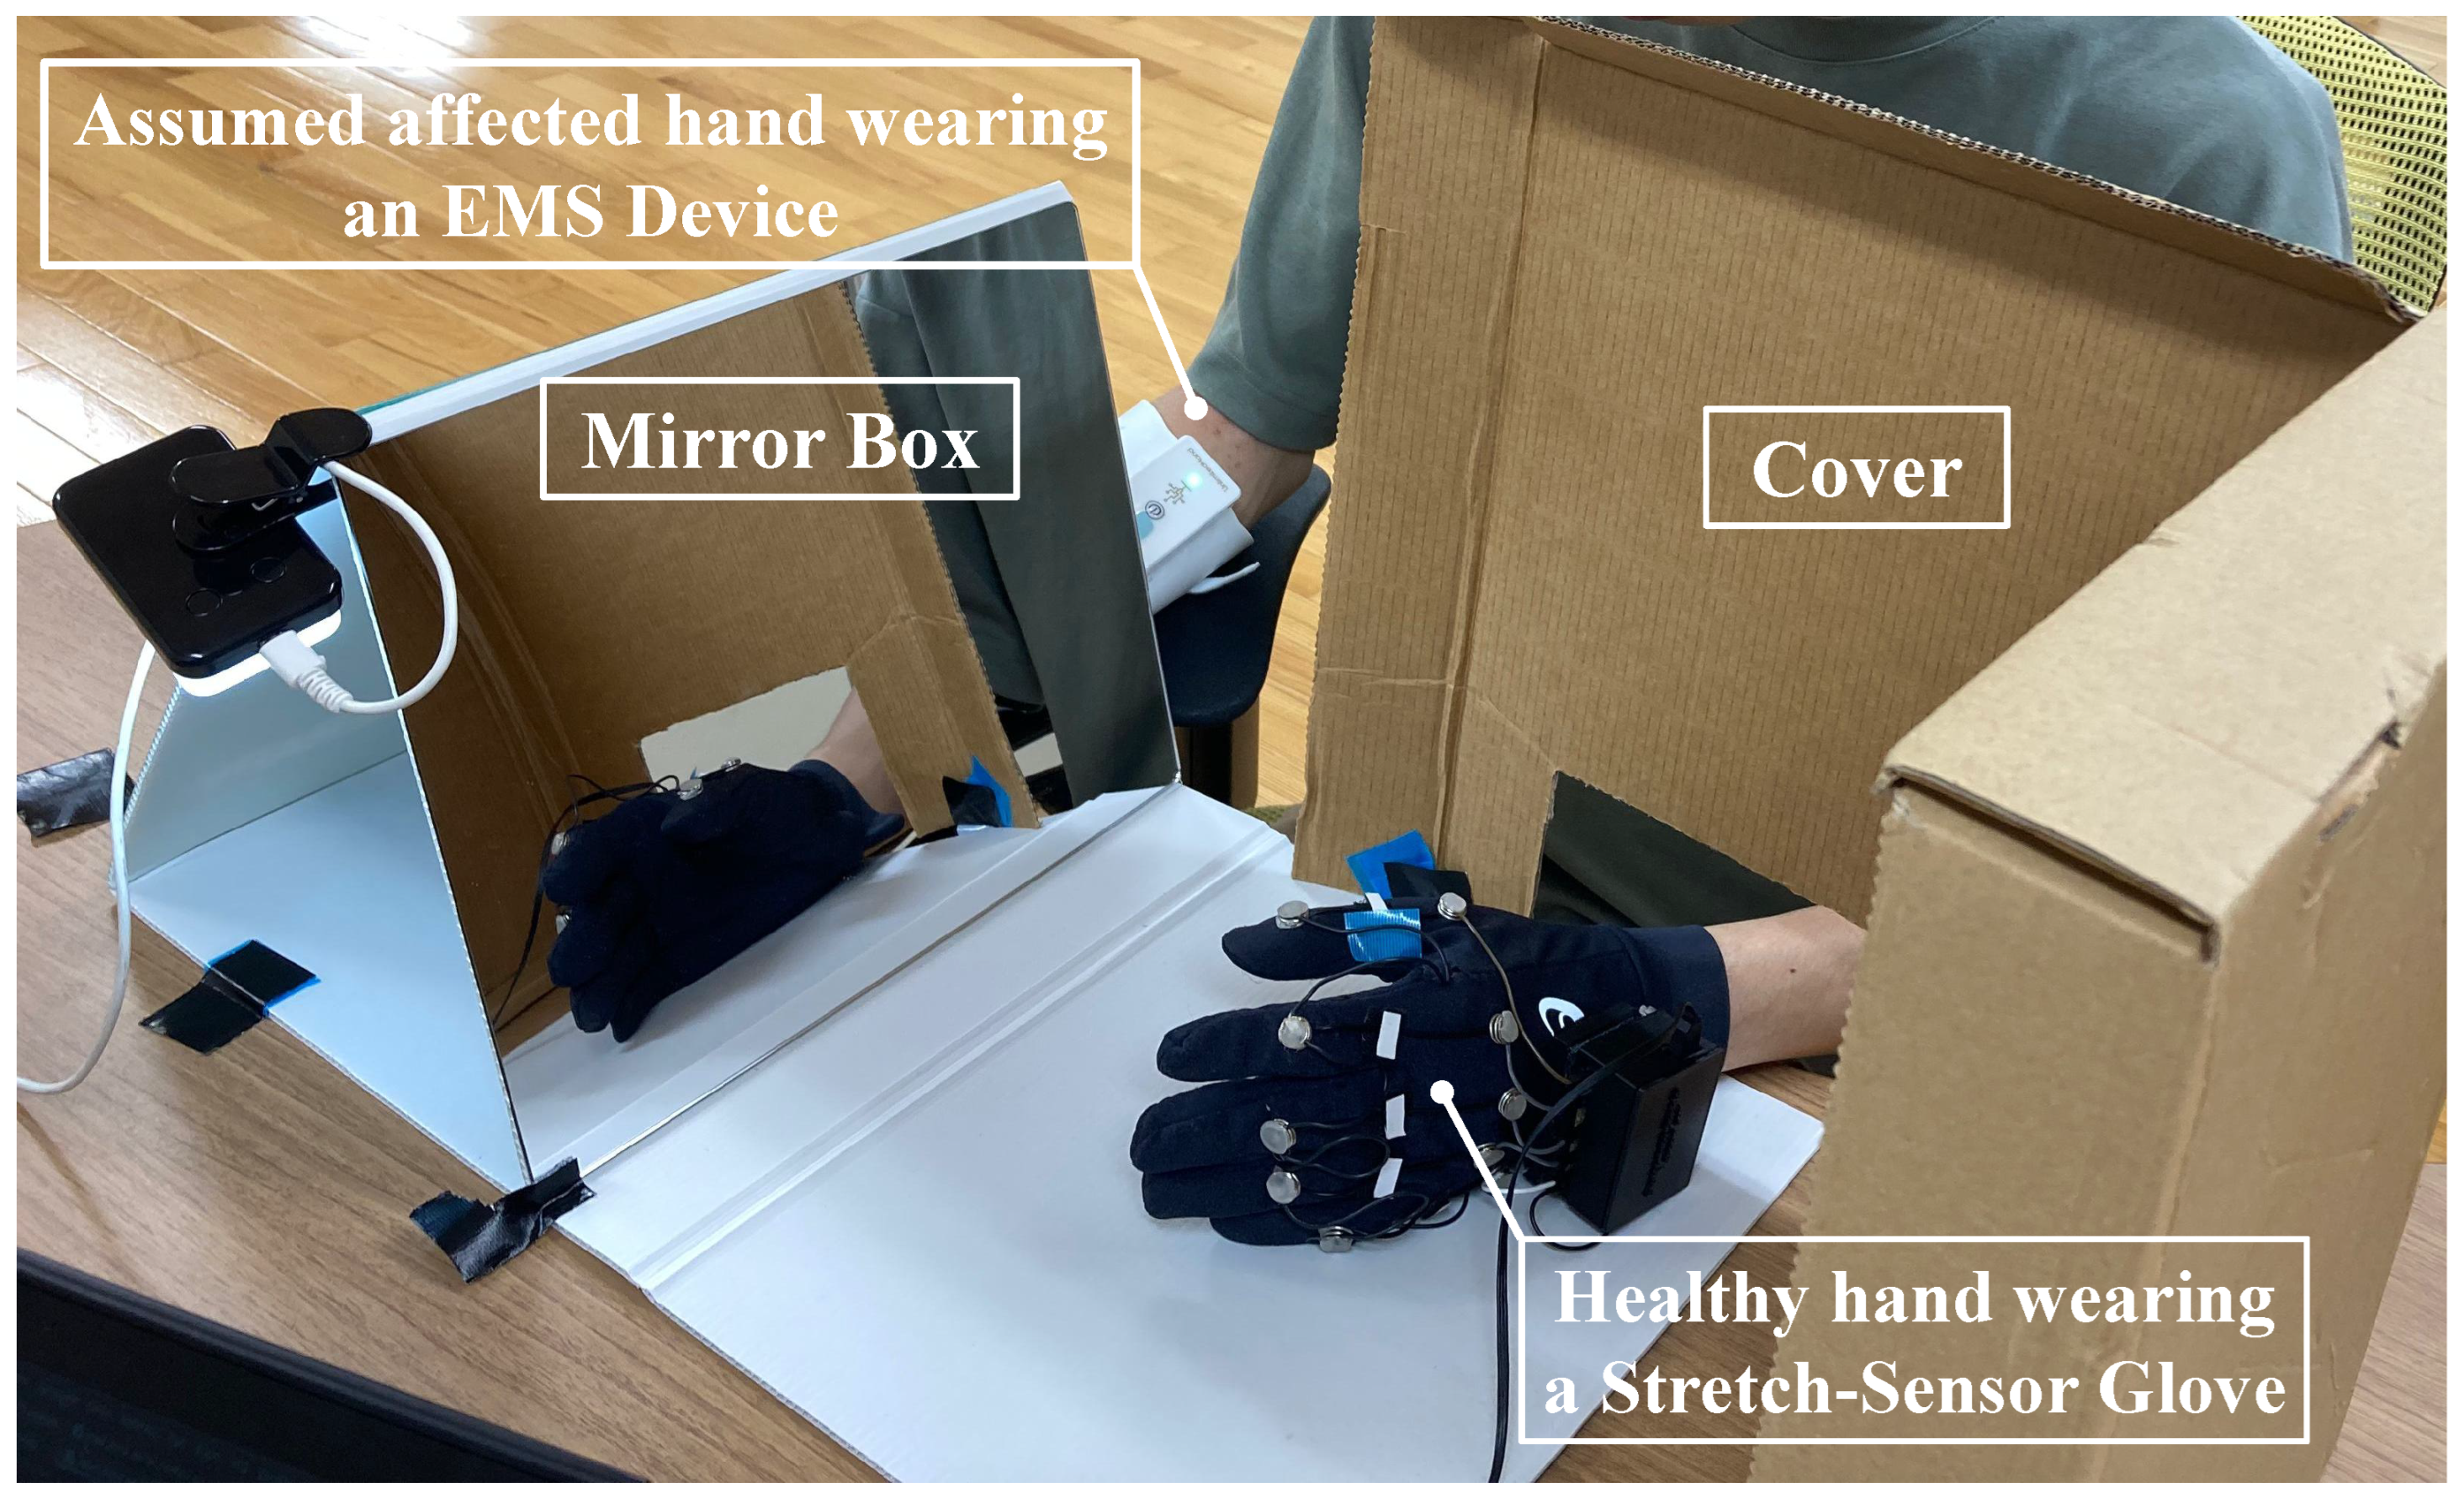
Subsequently, this study utilized a foldable and adjustable mirror box used in MT, as shown in Figure 4. The dimension of the mirror is 28 × 30 cm, providing a wide field of view and a spacious box area for a forearm to enter. Additionally, a cardboard cover was put in front of the participant, allowing for only the mirror reflection to be visible in the participant’s field of view. As stated in Section 1, the key point in MT is to ensure that the mirror reflection of the unaffected hand is perceived as the affected hand. Therefore, any disturbance, including direct vision of the unaffected hand movements, can be prevented. Other instruments were utilized to support the experiment, including a PC to process data flow and control the experiment process, a camera, and two types of questionnaires for evaluation.

3.3. Data Processing

3.3.1. Stretch-Sensor Glove Data

In this study, the stretch-sensor data served as an input to control the EMS device with a sampling frequency of 100 Hz. Signal normalization using the min–max scaling approach was performed on each sensor’s data. Additional rules were applied for any normalized data that fell outside the range of 0 to 1 to convert them into 1 and 0, respectively. Subsequently, the average value from 5 stretch-sensor data was calculated, resulting in an average value ranging from 0 to 1. This value was further utilized to control the EMS. Additionally, to facilitate participants reaching the maximum average value more easily, an optimization in average calculation was performed by adjusting the denominator value for each participant.

3.3.2. Decay Modeling of Stretch-Sensor Glove Data

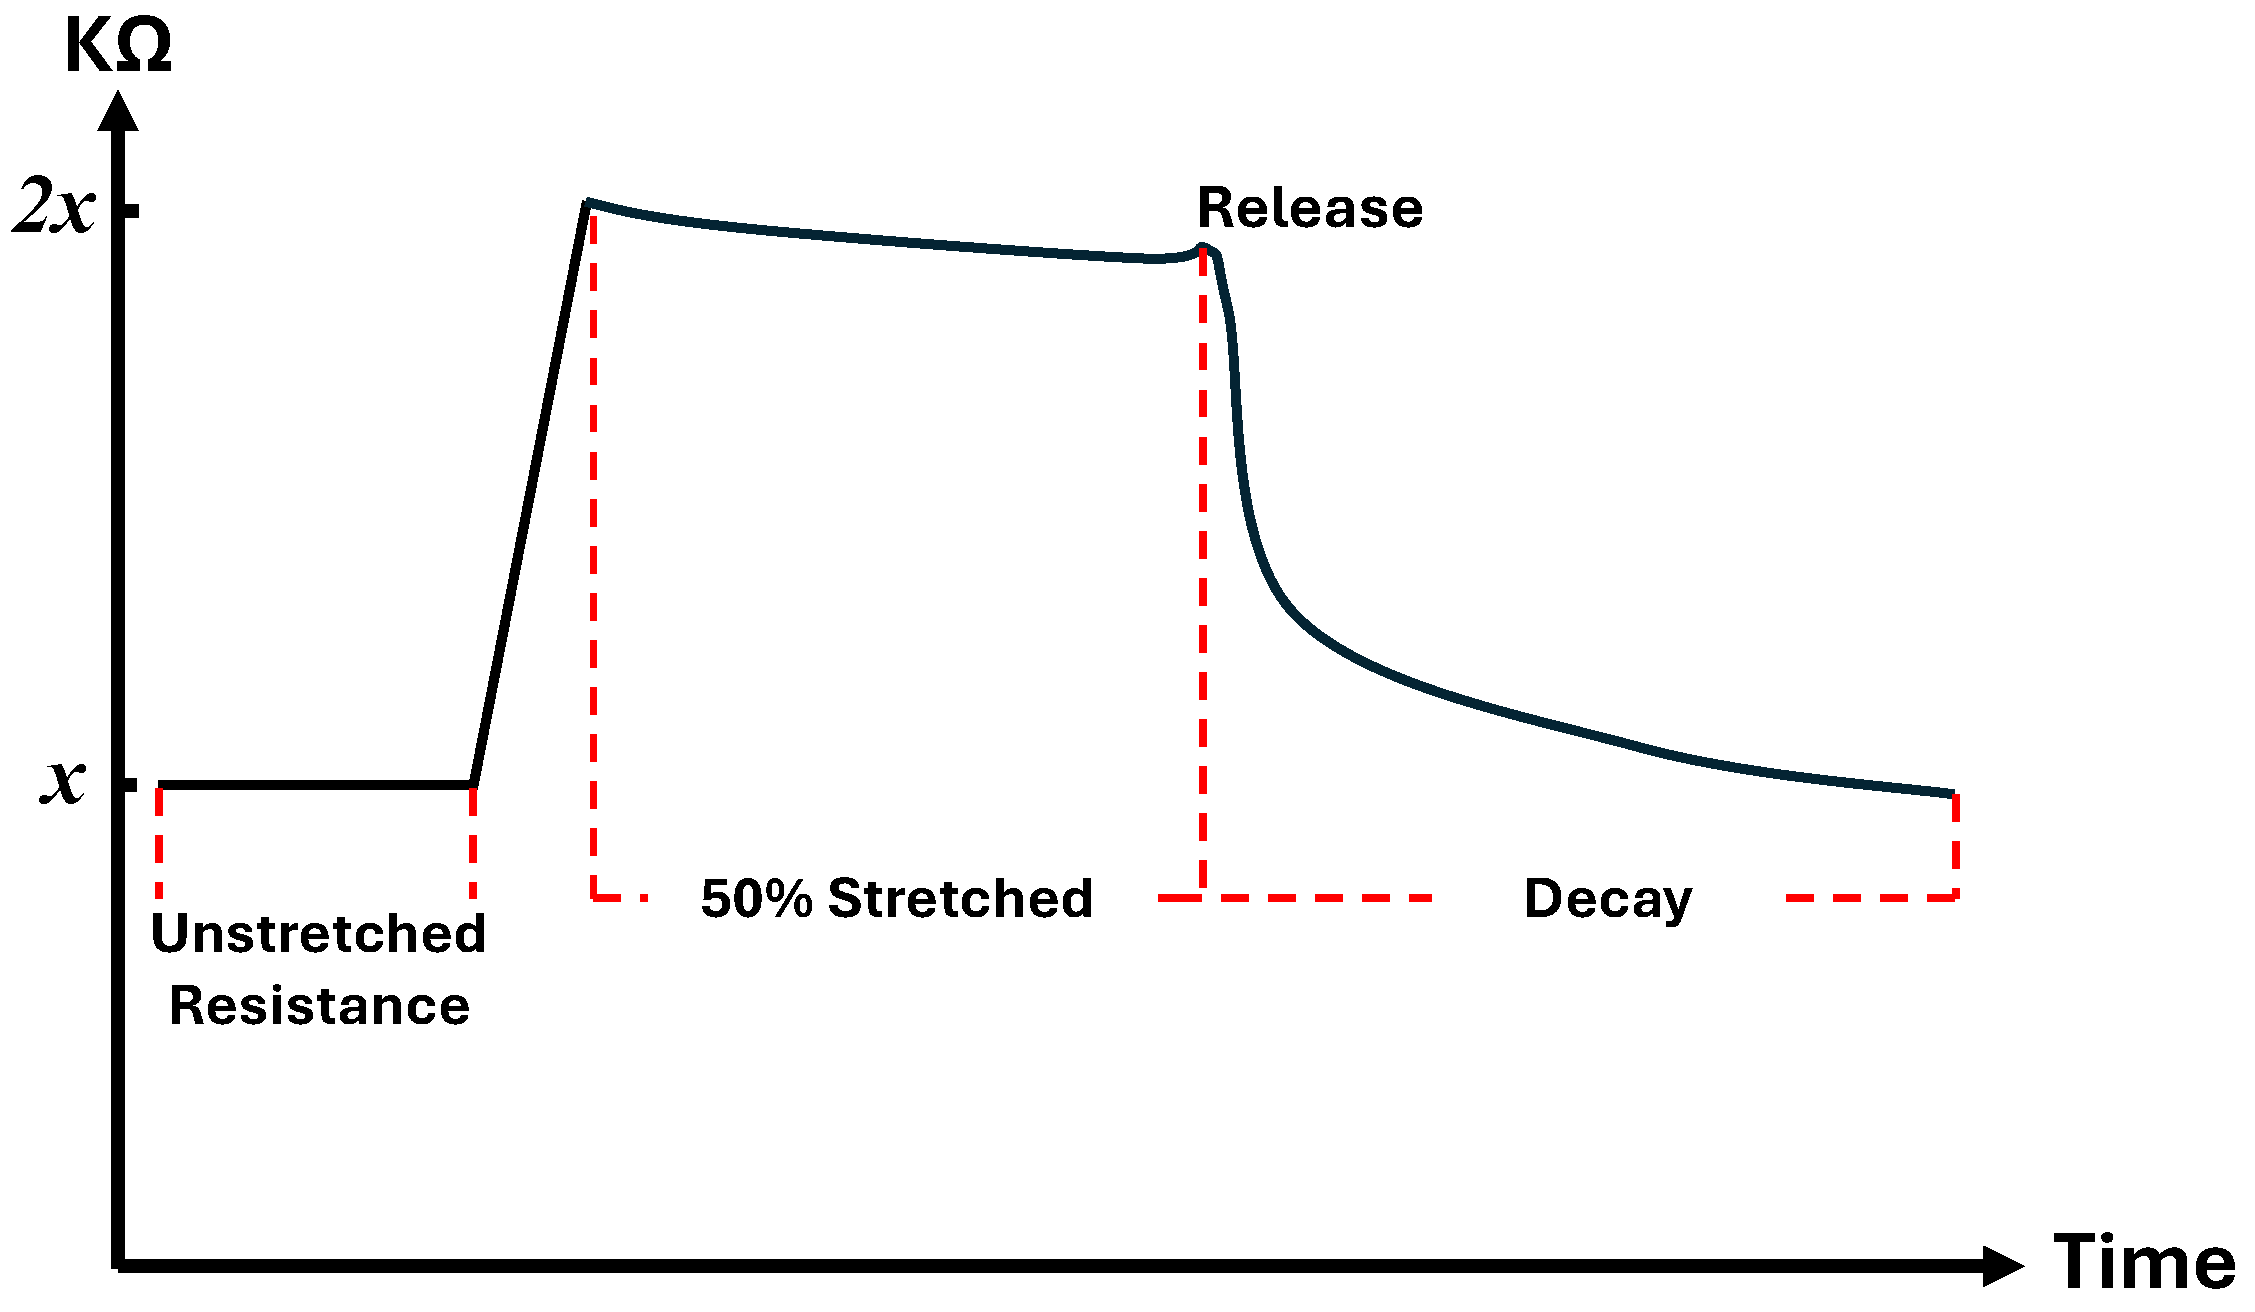
As shown in Figure 3, after being stretched and quickly released, the decay process requires a recovery time to reach the nominal resistance [37]. This condition presents a challenge for the implementation of stretch-sensor gloves. The releasing mechanism was activated when the participant executed an open-hand movement, requiring the nominal resistance to be attained. However, in a quick open movement following hand closure, the resistance was still in the decaying process, leading to a responsiveness issue due to the delay.
This study addressed the recovery time issue of the stretch sensor through an exponential decay model. Equation (1) is a standard exponential function, where y is the output, variable a is a constant, b is the rate of growth, and x is an independent variable (e.g., time change). In this study, modeling was applied to fix a slow decay process. Therefore, variable b was altered with 1 b as the rate of decay, as shown in Equation (2). The value of b is between 0 and 1, where the model is aggressive when b is close to 1.
y = a × b x
y = a × ( 1 b ) x
According to the requirement in this study, the selection of each variable for Equation (2) is essential. Equation (3) shows the selection of each variable with respect to Equation (2), where R r e l e a s e serves as the initial value before decay and x as the change in time indicated by the subtraction of the succeeding decay time from the time of R r e l e a s e . In this study, the decay model was intended to solve the slow recovery time following the quick release. Therefore, an aggressive model with 0.98 as the value of variable b was selected.
y = R r e l e a s e × ( 1 b ) x , where x = t n o w t R r e l e a s e
Subsequently, the decay model was applied in a closed-loop system. The closed-loop system consisted of raw-data-declining detection, decay modeling, and raw-data-inclining detection. Both declining and inclining detection utilized a threshold mechanism. Once the declining threshold was fulfilled, the decay model started generating the decaying average resistance data. The modeling process continued until the generated data reached 0. During the process, once the raw-data-inclining threshold was fulfilled, the modeling process immediately terminated, even before reaching 0.
Figure 5 shows the comparison between the average of the raw data and the corrected data through decay modeling. The first three curves correspond to the immediate open-finger movement following finger closure, and the subsequent five curves correspond to rapid open-closure finger movements. The figure shows the impact of the innate stretch sensor characteristic in the data acquisition process, where the slow recovery time in the raw data raised the responsiveness issue. Alternatively, the decay model in Equation (3), in combination with the closed-loop system, solved the corresponding issue by correcting the decaying process to quickly reach the minimum value in response to the immediate release of the stretch sensors.

3.3.3. EMS Data

In this study, the EMS parameters of pulse width and pulse frequency were set to fixed values. Therefore, only the value of electrical intensity would proportionally change according to the input value from the stretch-sensor glove (i.e., level 0 through 12). The pulse frequency was set at approximately 30 pulses per second, and the active pulse width was approximately 200 µs. In the case of critically ill patients, the employed parameters may reach up to 100 Hz of pulse per second, 400 µs active pulse width, and 25 mA pulse intensity [38]. Therefore, the adopted EMS parameters fell under safe usage. Furthermore, this study employs only healthy participants, which further avoids adverse effects with the safe EMS parameters. Subsequently, the normalized average of stretch-sensor data was converted into the electrical intensity target. Hence, it was possible to establish a proportional control between the stretch-sensor glove and the electrical intensity. The conversion of the stretch-sensor data into electrical intensity was performed on a computer before it was sent to the EMS device. This process allowed the EMS device to focus on executing the electrical intensity to the target channel.
The EMS of the UH device utilizes a multiplexer component in delivering electrical stimulation, allowing it to activate several EMS channels in alternating order. This study aimed to generate the fundamental finger movement of finger closure through the flexor digitorum muscle. Therefore, only one channel was activated during the experiment. Furthermore, activating multiple channels alternatively may pose a risk of distraction to the participant. This mechanism may lead to poor attention engagement with the visual mirror feedback of MT, which was avoided in this study.

3.4. Evaluation

As previously mentioned in Section 2.3, MI-based evaluation involves assessing the body representation state through the visual mirror feedback of MT. In this study, the motor imagery questionnaire revised second edition (MIQ-RS) was adapted to evaluate the participants’ perceived body representation level. The MIQ-RS consists of seven movement tasks, where, for each task, the participants are required to state their visual and kinesthetic imagery clarity level [39]. As indicated in Section 2.3, the participants are required to perform the task with their unaffected limb, then imagine how it is done with their affected limb. Following the imaginary task, the participant verbally rates their imagery condition according to the 7-item scale, ranging from level 1 (very hard to see) through level 7 (very easy to see), where level 4 is neutral (neither easy nor hard), for visual imagery. In kinesthetic imagery, level 1 is very hard to feel, level 7 is very easy to feel, and level 4 is neutral.
This study adopted the scoring principle of kinesthetic imagery of MIQ-RS and tailored the description according to the finger movement task used. Table 1 shows the detailed information for each scoring item. In this study, the participant performed open–close finger movements on the assumed unaffected hand, while the assumed affected hand (i.e., inside the mirror box) was passively moved by the EMS. Simultaneously, the participant looked into the mirror reflection and perceived it as the affected hand that was moving, as shown in Figure 4. After completing the session, they were asked to state the clarity in perceiving the reflected hand (assumed unaffected hand) to be the affected hand through Table 1. This study also observed the practicality of the employed intensity levels toward the comfort of the participant. Therefore, the 5-item scale of the participant’s perceived comfort level of the applied electrical stimulation was employed, as shown in Table 2. In addition, several studies have reported an influence of the thickness of subcutaneous tissue and the personalized electrical intensity of EMS [40,41,42,43,44]. Accordingly, this study evaluated the correlation between the participants’ body mass index (BMI) and the forearm circumference in relation to the personalized EMS intensity applied in this study.

3.5. Experiment

Prior to the intervention sessions, an explanation regarding the experimental procedures was provided. Afterwards, three pre-intervention procedures were conducted. The first procedure was the stretch-sensor glove signal normalization, followed by the electrical intensity selection of EMS. Subsequently, a familiarization with the experimental setting was conducted as the second procedure. Figure 6 depicts the flow of the experiment.

3.5.1. Stretch-Sensor Glove Normalization

As previously mentioned in Section 3.3.1, this study implemented a min–max normalization technique for the stretch-sensor data. Although the stretch-sensor glove used in this study was similar to that in prior research, which utilized a simple max value division for normalization, this method introduced a shortcoming in the normalized data [36]. While max value division is a low-computation approach due to its simplicity, especially for applications with multiple sensors, it has a significant limitation where it focuses solely on the upper bound while ignoring the lower bound. As a result, the normalization process produced minimum values that were significantly above 0. This situation can adversely affect the control of EMS intensity, particularly during the finger movement task, where no electrical stimulation is expected during the open hand gesture.
The min–max normalization approach optimized the calculation to produce a value between 0 and 1. Thereby, a synchronous and proportional control of electrical intensity by the stretch-sensor glove was feasible. To achieve the desired range of data, the normalization was conducted with a total time of 10 s. In the first 5 s, the participant performed an open-finger gesture to record the minimum value. Subsequently, the participant performed a closed-finger gesture for the next 5 s. As depicted in Figure 3, the employed stretch sensor has the characteristic of a slightly increased spike following a sudden stretch or release, which is unrelated to the finger movement task, but prompted its selection during normalization. Therefore, the selection of the maximum value was modified as the exact last data point (i.e., data at the last timestamp) in the normalization session following a 5 s open gesture and a 5 s close gesture.

3.5.2. Electrical Intensity Selection

This study compared and evaluated several electrical intensity levels toward the perceived body representation of visual mirror feedback, as stated in Section 1. Accordingly, the selection of personalized intensity levels was essential, since the participant’s body characteristics affected the required levels [40,41,42,43,44]. In the past five years, the EMS electrical intensity has been commonly categorized into three types, which are sensory level, motor threshold level, and functional contraction level, with the intensity level increasing in sequence [33,45,46,47,48]. The sensory level employs a low electrical intensity that surpasses the sensory threshold but does not induce any muscle contraction (i.e., tingling sensation on skin) [46,47]. The motor threshold level marks the beginning of muscle contraction, where the electrical stimulation starts inducing an involuntary, subtle finger movement (e.g., finger twitching) [33,46]. Subsequently, the functional contraction level employs electrical intensity above the motor threshold, where a robust and functional finger movement is visible [45,46]. According to the description, the implementation of sensory and motor threshold levels is limited with clear hints of no contraction/movement and finger twitching, respectively. In contrast, functional contraction level accommodates variation of finger movement conditions, with a slow and weak movement for the intensity just above motor threshold, then a fast and strong movement for higher intensities. Furthermore, higher intensities may lead to greater brain nerve excitation and sensorimotor adaptation, which may affect the perceived body representation in MT [46,48].
As depicted in Figure 6, this study employed the following electrical intensity levels in a randomized order:
  • Stimulation type 0 (S0) was the electrical intensity below the sensory level threshold, in which the stimulation was imperceptible (i.e., similar to MT only).
  • Stimulation type 1 (S1) was the electrical intensity that induced sensory sensation (i.e., above sensory threshold and below motor threshold).
  • Stimulation type 2 (S2) induced the motor threshold reaction.
  • Stimulation type 3 (S3) stimulated functional finger movement with the intensity level slightly above S2.
  • Stimulation type 4 (S4) applied a higher intensity level to induce fast and strong finger movement.
The above levels belonged to the intervention sessions, which the S4F then concluded. The S4F was purposely located at the last part, as it differed from other sessions, where it employed the stimulation type 4 but a spontaneous/free movement scheme (i.e., without audio direction), while others did not. In this study, the S0 was achieved via electrical intensity level 0 (i.e., no stimulation), which served as the baseline, where it included only the conventional MT. Afterwards, the electrical intensity selection for each participant started from the S2, where the evidence for the motor threshold was verifiable for both participants and the experiment supervisor. The electrical intensity started from level 0, then gradually increased by 1 level until the involuntary twitching of the finger was visible (S2). Subsequently, the electrical intensity was decreased by 1–3 levels to achieve the S1. In this process, the supervisor observed the finger condition to ensure no visible movement occurred and the electrical stimulation remained perceptible (i.e., above sensory threshold). To achieve S3, the intensity was gradually increased from S2 by 1–3 levels until the involuntary finger-close gesture was reached. Similarly, the S4 was achieved by increasing the intensity by 1–3 levels from S3. The mechanism of decreasing–increasing intensity by 1–3 levels was performed to accommodate a personalized level for each participant. Throughout the selection process, the supervisor consistently inquired whether the participant experienced any discomfort or pain in their skin or muscles. Once the participant reported pain or discomfort at a specific intensity level, a label was assigned to the corresponding level. Thereby, all the employed intensities were kept within safe intensities.

3.5.3. Familiarization

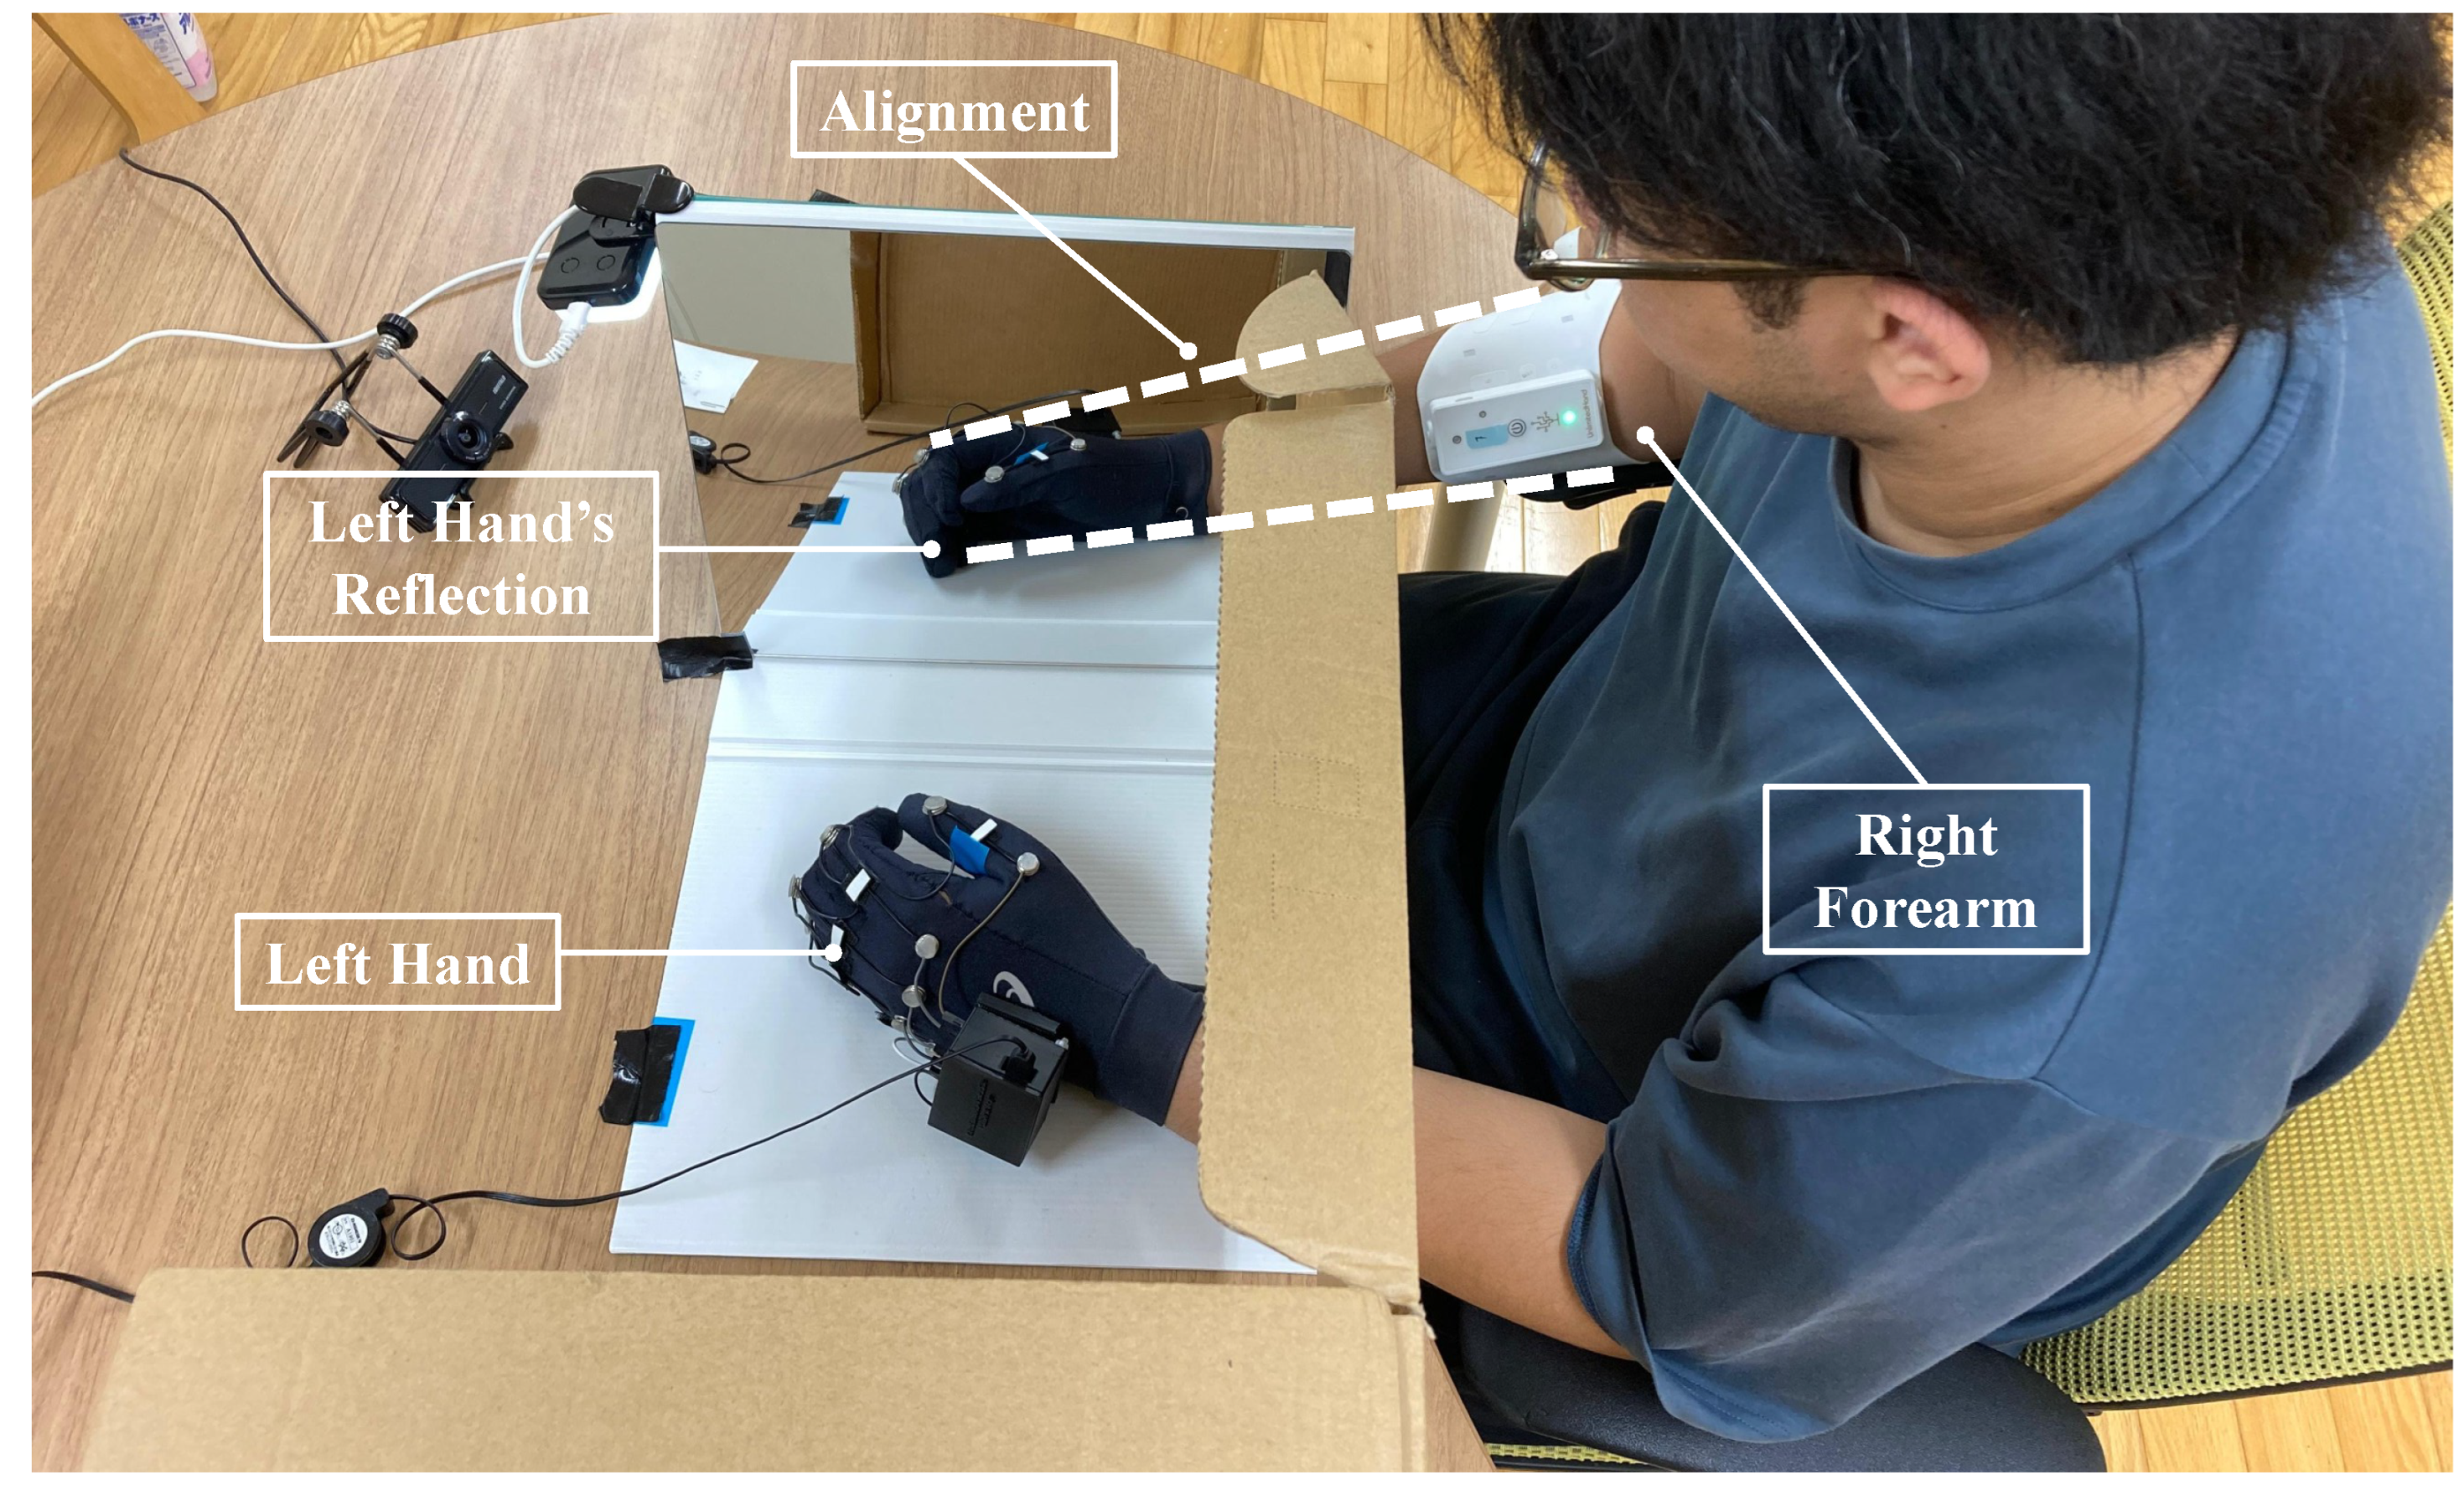
In this study, the participants are laypeople with no experience in MT. Therefore, a familiarization is essential to help them understand the working principle of conventional MT. As depicted in Figure 4, this session required the participant to sit comfortably, then put their right hand in front of the mirror box while their left hand was inside the mirror box. Subsequently, the participants were asked to align the reflection of the left hand with the forearm of the right hand according to their vision, to make it as one whole hand, as shown in Figure 7. This particular measure facilitated the participant in perceiving the ownership of the left hand’s reflection as the right hand (i.e., the assumed affected hand). Afterwards, the participant performed two sessions of the finger open–close movement task, each of which consisted of 10 movement tasks. Prior to the movement task of familiarization, the supervisor reminded them to always focus on the reflection and think of it as the right hand (i.e., the hand inside the mirror box). Additionally, the participant was reminded to perform the movement task naturally without exerting much power.
In the familiarization session, the participant was required to perform 10 open–close finger movements on both hands following audio direction. After finishing the first session, the participant rested for several seconds and was reminded to always focus on reflection and consider it as the hand inside the mirror box, prior to the next session. In the next session, the participant performed the 10-finger movement tasks only on the hand outside the mirror, following the audio direction. The audio direction consisted of a 10 s active buzzer for movement direction, which was repeated 10 times. The 10 s active buzzer comprised a 5 s ramp-up buzzer for close movement direction, a 3 s ramp-down for open movement direction, and a 2 s silence for resting. The participant was encouraged to match the audio direction tempo with the progress of the open–close finger movement.

3.5.4. Intervention

As shown in Figure 6, the intervention was composed of 6 sessions, where the first through fifth sessions applied the S0–S4 in random order and concluded with the S4F at the last session. Only the hand outside the box performed the finger movement task, which simultaneously served as the control of the EMS electrical intensity through the stretch-sensor glove. Subsequently, a similar audio direction to the one in the familiarization, comprising 10 movement direction buzzers, was applied to the first through fifth sessions only. Meanwhile, the S4F, as the last session, did not incorporate audio direction, as it corresponded to the free and spontaneous movement, where the participant performed the finger movement task at their own pace but were limited to 10 movements. The repetition of these 10 movements was intended to ensure the participant’s perceived body representation for the corresponding electrical stimulus type, thereby avoiding uncertainty when stating the perceived body representation level. After each session, the participant was required to fill in the body representation and stimulus comfort level questionnaire, as stated in Section 3.4. The order of the stimulus types was known only to the experiment supervisor to prevent bias when participants completed the questionnaire. During the intervention processes, the supervisor regularly asked whether the participant experienced any pain or discomfort in their skin or muscles, ensuring that the intervention could be stopped immediately if an adverse condition occurred.

3.5.5. Intervention Safety Measure

Even though all safety screening prior to recruitment and safe parameter selection of EMS were applied, further safety measures, especially during the intervention sessions, are essential to ensure the participant’s safety. Along with the safe EMS parameters and regular checks by the experiment supervisor, the system provided a software and hardware emergency shutdown. If the participant reports any pain or discomfort, the supervisor can immediately stop the system either by software or hardware, and automatically remove any electrical stimulus. In a clinical review study, various interventions for critically ill patients utilized electrical stimulation courses lasting for 30 min twice a day or 40 to 60 min per session or day [38]. As previously mentioned, this study utilized a 10 s audio direction for a finger movement. Each session involved 10 repetitions of the movement and a total of six sessions during the intervention phase. This resulted in approximately 10 min of electrical stimulation exposure for each participant. The duration of exposure was significantly shorter than that used for critically ill patients. Furthermore, this study involved healthy participants who underwent an initial screening to exclude any individuals at risk. Therefore, the employed intervention approach helped prevent any potential adverse effects.

3.6. Statistical Analysis

After completing the experiment for all participants, the obtained data and results were statistically analyzed to observe any correlation and significance of the proposed system’s outcome. In this study, the collected results comprised both qualitative and quantitative data. As mentioned in Section 3.4, the primary outcome was the 7-item scale of perceived body representation and the 5-item scale of applied electrical stimulation comfort level, each of which constituted a qualitative ordinal data type. Subsequently, the BMI and forearm circumference data corresponded to the quantitative continuous data. Additionally, several experiment parameters, including electrical intensity levels and stimulation order, belonged to the ordinal and nominal data types, respectively.
Considering the types of data, Spearman’s rank correlation test was applied to evaluate the relationships between BMI and forearm circumference for the employed intensity levels individually. Spearman’s rank correlation test was also applied to evaluate the relationship between the order of individual stimulus types and the perceived body representation score. The significant difference in the primary outcomes was analyzed using Kruskal–Wallis and post hoc Dunn’s tests. A Bonferroni correction was employed to reduce the risk of Type 1 error of false positives.

4. Results

A system has been proposed to enhance the sense of body ownership through visual mirror feedback in MT. This section demonstrates the behavior related to the primary outcomes. Additionally, we analyze how participants’ characteristics affect the applied electrical intensity. The effect of the order in which the electrical intensity is implemented on the body representation score is also reflected upon.

4.1. Correlation of Physical Characteristics and Personalized Electrical Intensity

Table 3 shows the participants’ physiological data and the personalized electrical intensity. The intensities from the stimulus types of S0 and S4 were excluded because they were uniformly zero and identical to those of S4, respectively. As previously explained in Section 3.5.2, the selection of personalized electrical intensity was performed through increasing–decreasing the intensity by 1–3 levels. The corresponding approach proved to facilitate the flexibility in the selection process, as demonstrated in Table 3. Participant 1 showed an intensity difference of 1, emphasized by the variance of intensity difference, indicating a uniform difference. A similar result occurred in participant 7 with a uniform intensity difference of 2. A higher variance in the intensity difference indicated a larger difference in the intensity trend. As shown in participant 6, the gap between S1 through S3 was 3, but dropped to 1 upon S4. Therefore, an appropriate personalized electrical intensity with variation in the participant’s characteristics was achieved.
Subsequently, Table 4 demonstrates the correlation scores between participants’ physical data and electrical intensities. All scores indicated a relatively weak positive correlation and were statistically insignificant (p > 0.05), with a decreasing trend upon higher stimulus types on both metrics. In this table, the non-significant result was largely due to the small sample size (N = 10) . However, the important point is the correlation score between BMI and forearm circumference that determines the personalized electrical intensity the most. The forearm circumference showed a stronger correlation than BMI in influencing the personalized electrical intensity selection. The influence of the forearm circumference was related to the attachment accuracy of the EMS device, while the BMI corresponded to the body composition. Even though body composition has an association with forearm circumference (ρ = 0.93; p < 0.01), the accurate position of the EMS channel on the target muscle has a higher impact on the personalized intensities.

4.2. Perceived Body Representation and Electrical Stimulus Comfort

The behaviors within the perceived body representation and the electrical stimulus comfort level, and their correlation, were analyzed. While both variables served as the primary outcomes, the underlying influence differed. Table 5 presents the randomized stimulation order for each participant, primary outcomes, and the corresponding Spearman’s correlation coefficient. The body representation perception scores showed an increasing trend with higher stimulus types, while electrical stimulus comfort showed a reversed trend. These findings highlight the reliability of the adopted questionnaire in providing clear information to the participant. The trends were emphasized with the overall coefficient value showing a negative correlation. All correlation coefficients showed relatively high values, with participants 3 and 6 being significantly contradictory ( p < 0.05 ) and participants 1 and 5 being significantly strongly contradictory ( p < 0.01 ), between the perceived body representation and stimulus comfort level. These primary outcomes shared the same underlying influence of the particular applied electrical stimulus. The Kruskal–Wallis test resulted in a significance value below 0.01 on both primary outcomes, indicating that the median of at least two groups had a significant difference. To further determine the specific groups having significant differences, a post hoc Dunn’s test was employed.
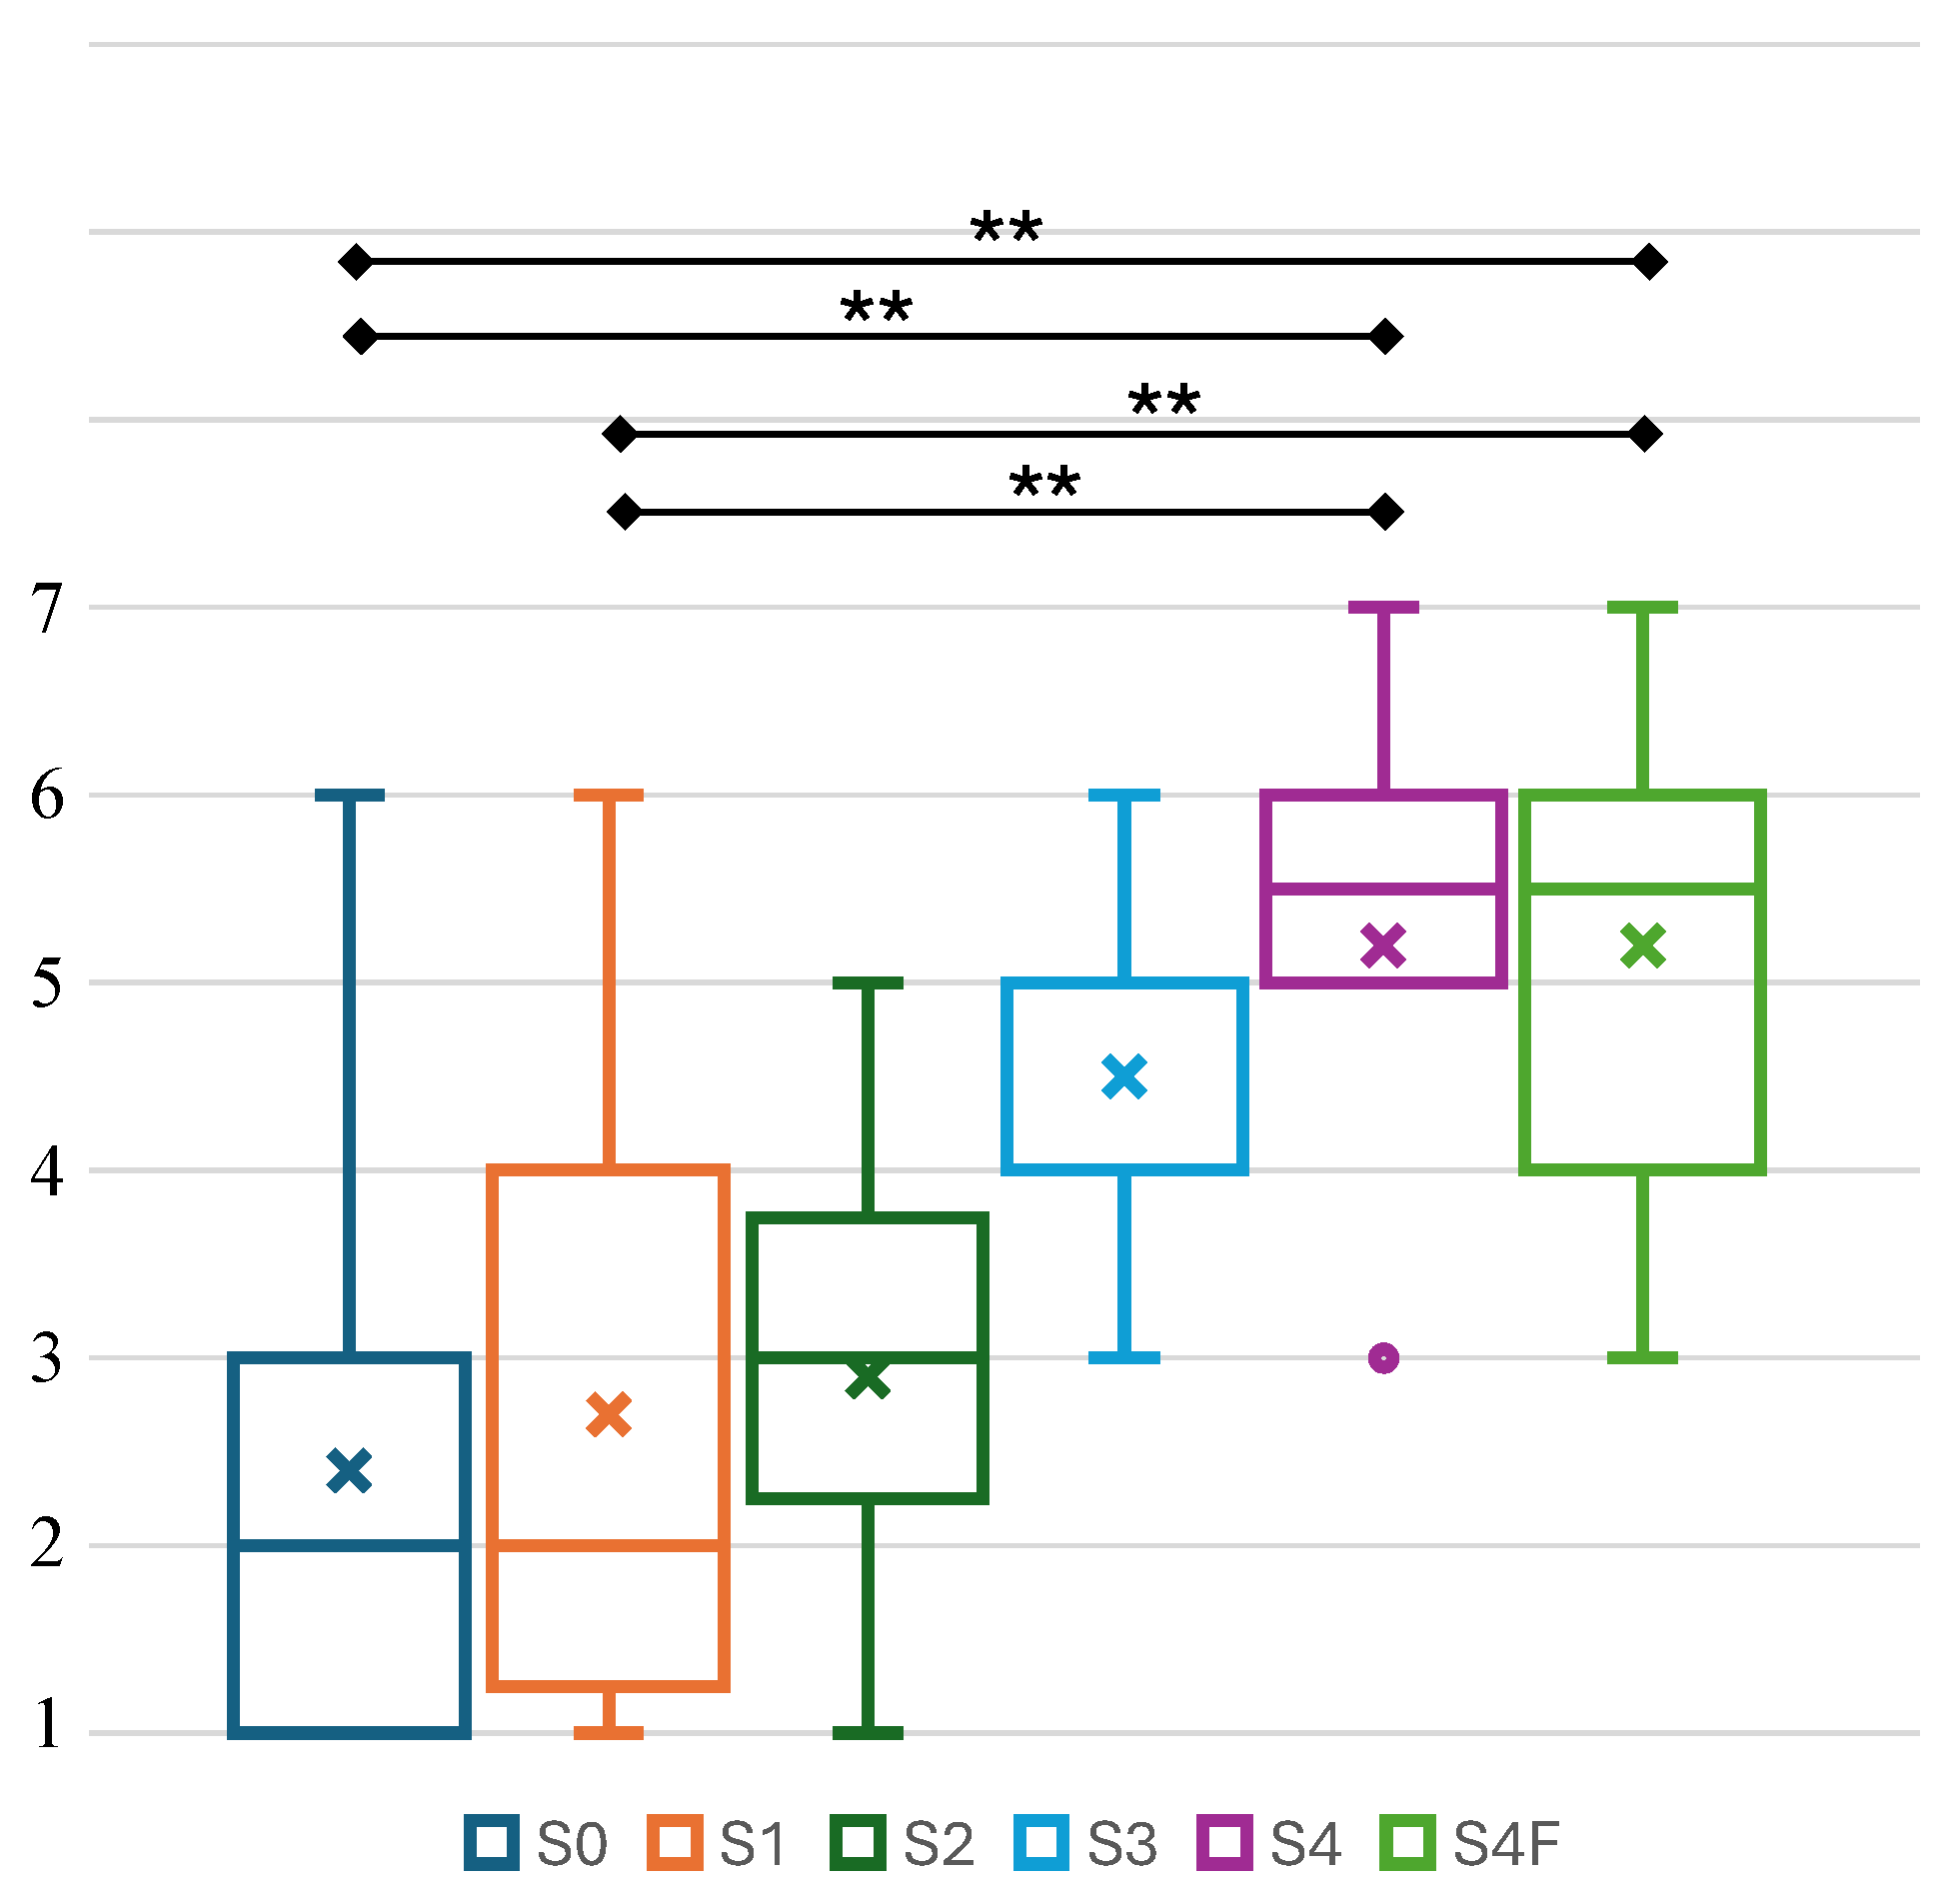
Table 6 presents the post hoc Dunn’s statistical analysis result within primary outcomes. The result is presented in a confusion-matrix-like table to show the p-value relation between electrical stimulus types. The diagonal cell was highlighted in black, as it has no meaning due to similar stimulus types, while cells in yellow colors corresponded to p-value below 0.01. In body representation perception, a clear separation occurred between low- and high-intensity stimuli, where the S2 and S3 served as the separation stimulus.
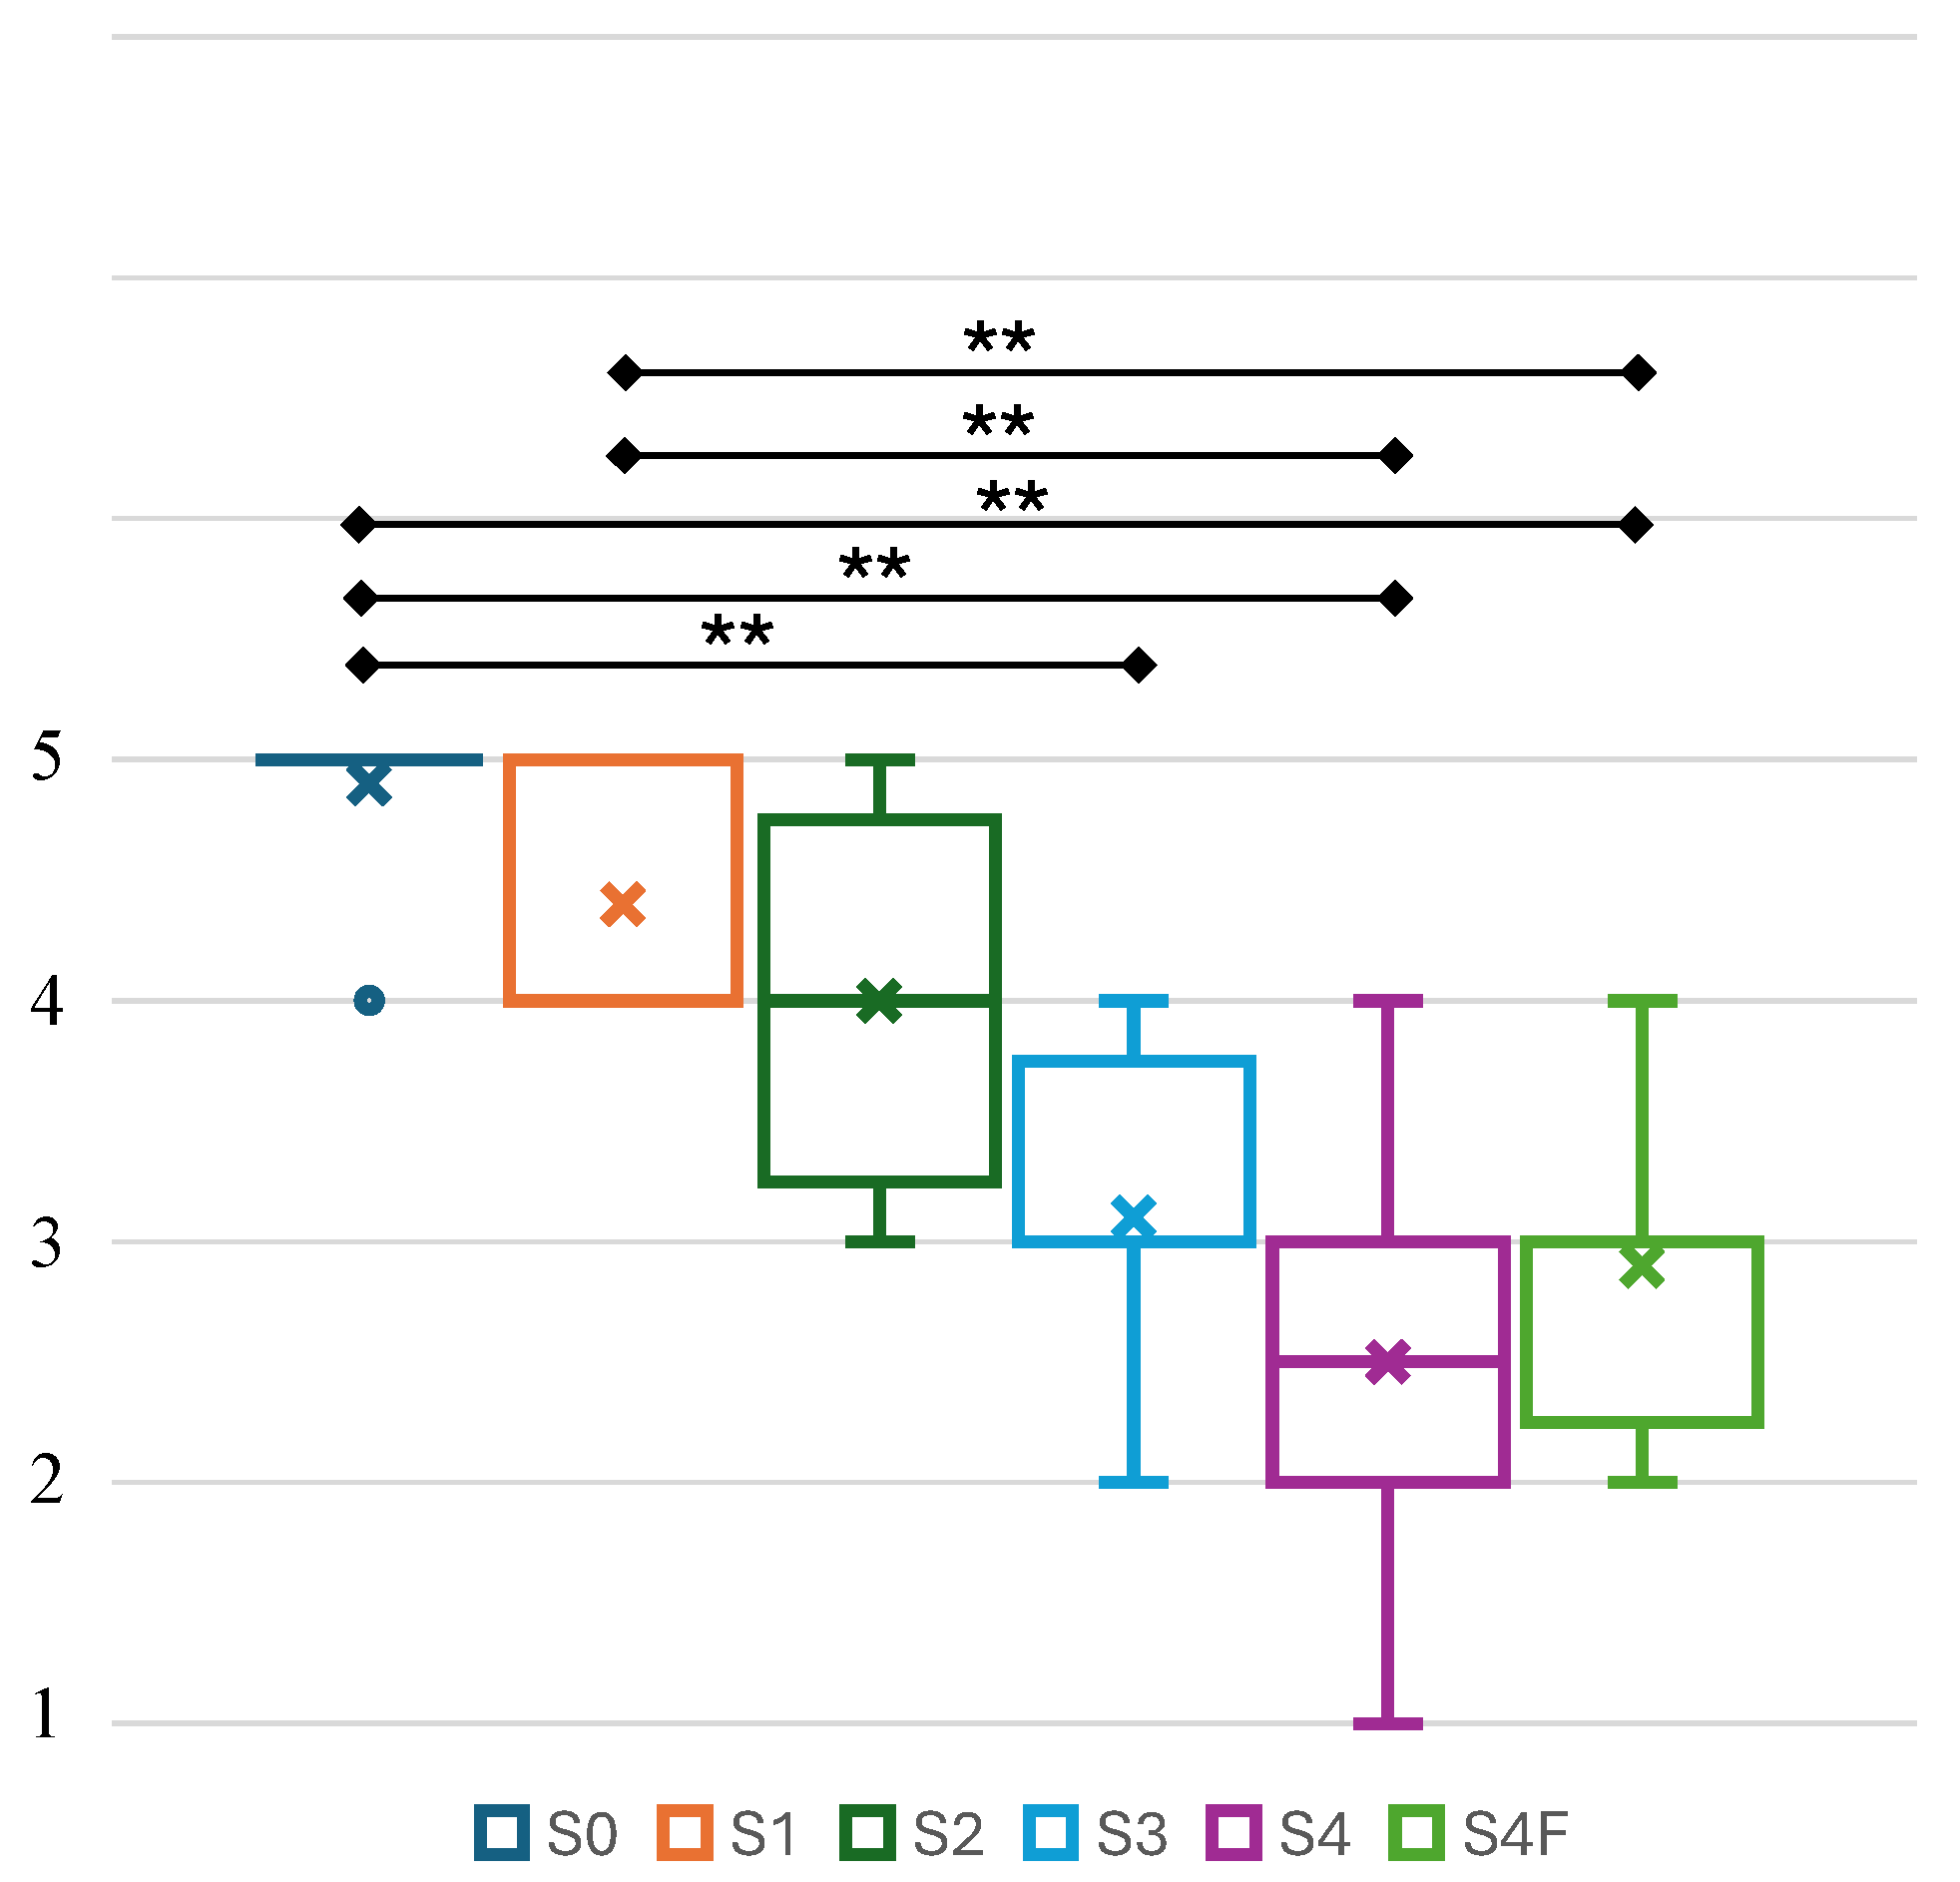
An interesting finding resided within low and high intensities, each of which showed no significant difference. A similar condition occurred in the electrical stimulus, characterized by a separation of perceived comfort between low- and high-intensities, where only the S2 served as the separation point. Additionally, a significant difference occurred between S0 and S3. In relation to Table 5, claiming the increasing–decreasing trend upon higher stimulus types, the statistically significant difference between stimuli was further emphasized in Figure 8 and Figure 9. In addition to the significance test result, Figure 8 depicted an apparent gap between low–moderate and moderate–high types of stimuli, represented by S0–S2 and S3–S4F, respectively. On the other hand, Figure 9 showed a degenerate distribution in S0, with all participants having exactly identical scores, and an overlapping distribution, especially between S4 and S4F.

4.3. The Influence of the Individual Stimulation Order on the Perceived Body Representation

In the previous section, it was explained that the primary outcomes shared the same underlying influence, which was the applied individual electrical stimulus. However, the body representation perception was also exposed to the influence of stimulation order. As shown in Table 5, the S0 that corresponded to the electrical intensity level 0 (i.e., no electrical stimulus) showed a perceived body representation score trend below 4, which was difficulty in perceiving the body representation, as explained in Table 1. Similar results on the S4, as the strongest intensity level, showed a score trend of 4 and above. However, there were instances in which both stimulus types showed opposite results to the trend. As shown in Table 5, participant 4 had an S0 score of 6, while participant 10 showed an S4 score of 3, each of which had a stimulus located at the fifth and first orders, respectively. These findings elicited a possibility of stimulation order influence on body representation perception.
Table 7 shows the correlation coefficient values of body representation perception with stimulation order for each stimulation type. The S4F stimulus type was always positioned at the last order (i.e., non-randomized order); therefore, it was excluded. All coefficients showed an overall relatively small value with no statistically significant difference. The sparsity nature of this particular behavior instilled a small number of instances with an opposing direction to the trend, which may influence the statistical analysis. According to the result, S0 and S4 showed positive coefficients, while S1, S2, and S3 showed negative coefficients. Subsequently, S0 through S3 showed small coefficient values, while a moderate value in the S4. Additionally, the average correlation coefficient value showed a very weak correlation, indicating that the employed stimulation order did not affect the perception of body representation.
According to the current study, a positive coefficient indicates a linear direction with the increasing stimulation order, and vice versa. Subsequently, small coefficient values indicate a weak correlation of a particular stimulus type toward the increasing stimulation order. A positive and large coefficient value implies that the influence of a specific type of stimulus on body representation perception is volatile, as it depends on the stimulation order to influence body representation, where weak body representation is produced when located at an early order and strong body representation at a later order. In contrast, a small coefficient value, regardless of the direction, depicts a weak influence of stimulation order on body representation perception. Accordingly, Table 8 demonstrates the interpretation of the correlation coefficient for each stimulus type.

5. Discussion

A system that enhances visual mirror feedback ownership and body representation perception in MT through proportional control of EMS electrical intensity has been proposed. The EMS implementation in the proposed system has been focused on enhancing the conventional MT to facilitate easy perception of body representation. As previously stated in Section 2.2, it remains dubious whether the addition of the EMS in previous studies may improve the visual feedback ownership aspect of MT, or instill an independent influence on body functional outcome. Unfortunately, there is a lack of related studies that focus on evaluating this issue. Furthermore, the fixed active–resting EMS stimulation window implemented in previous studies may violate the participant’s movement intention, which can induce a negative influence on body representation perception. In contrast, this study encourages the participant’s independent movement intention through synchronization of both hands, where the involuntary movement of the assumed affected hand is electrically controlled in proportion by the healthy hand.

5.1. Personalization of Electrical Intensity

Previous studies employed EMS combined with MT, but the fundamental mechanism significantly differed from the current study. The previous studies applied the EMS through an active–rest stimulation window mechanism, in which the participant was forced to match the movement of the healthy hand with the pre-programmed EMS courses. Consequently, an optimal protocol of MT–EMS was deemed mandatory to enhance synergistic effect and further promote neuroplasticity [29,30]. In contrast, the current study utilizes healthy hand movement to generate involuntary finger movement on the assumed affected hand, which is considered a synergistic mechanism of both hands, prioritizing it according to the participant’s will. Furthermore, this study employed a free and spontaneous movement session, where the participant performed the task at their own pace. As demonstrated in Section 4.1, personalization of electrical intensity was provided to optimize the body representation perception through the generated finger movement for each participant. Therefore, the selected intensities for each stimulus type were arranged to match the hint as mentioned in Section 3.5.2.
To further observe the selected intensities with possible underlying influences, a correlation analysis was conducted between each stimulus type and the participants’ physical data of BMI and forearm circumference. As mentioned in Section 4.1, both physical data showed a weak correlation with the stimulus types, but forearm circumference showed a higher correlation than BMI. As explained in Section 3.4, the BMI corresponds to body composition, especially the subcutaneous tissue, which may affect the personalized electrical intensity [40,41,42,43,44]. However, the thickness of subcutaneous tissue can be bypassed if sufficient electrical intensity is applied to stimulate proper involuntary movement. In correlation with the actual patient’s case, a personalized electrical intensity may be able to address both body composition variation and reduced sensory function issues.
On the other hand, forearm circumference is correlated with the accuracy of attachment of the EMS device to the target muscles. Inaccurate attachment may induce improperly stimulated involuntary movement, regardless of the intensity level. As shown in Table 3, participant 4 showed a higher BMI than participant 10, but weaker personalized electrical intensities. This condition was also influenced by the inaccurate attachment of the EMS channel to the target muscle, where participant 10 required overall higher electrical intensities to match the hint of S1 through S4. However, body representation perception does not necessarily require higher intensities or a complete form of the stimulated gesture, as each person has their own preferences and sensitivities.

5.2. Implication of Body Representation Perception and Electrical Stimulus Comfort Level

The correlation between primary outcomes is explained in Section 4. The primary outcome has an overall opposite direction. This finding provides guidance for future experiments with actual patients when selecting the electrical intensity. According to the results, applying a lower intensity maintains a comfortable sensation for the participant, but ineffectively enhances body representation perception and provides only sensory-level stimulation (i.e., a tingling sensation on the skin). On the contrary, applying a higher intensity may induce an uncomfortable feeling in the participant, but it effectively enhances body representation perception and adequately stimulates involuntary finger movement.
One important thing to note is that throughout the experiment processes, it was ensured that all participants experienced no pain when the stimulation was applied. Therefore, the uncomfortable sensation in the current study indicates how vivid a stimulus was perceived compared to S0, which serves as the baseline (i.e., no perceptible electrical stimulus) within a safe range of stimuli. While this study compared several intensity levels, the trend indicates that lower intensities correspond to S0 through S2, and higher intensities to S3 and S4. Notably, S4F represents the electrical intensity of S4 in the spontaneous movement scheme, as shown in Figure 8. Additionally, there was no significant difference between S3 through S4F, indicating that a patient may employ electrical intensity between these stimulus types to acquire body representation perception.

5.3. The Influence of Stimulation Order in Altering the Perceived Body Representation

Another interesting finding of this study was the influence of the stimulation order on the perceived body representation, as explained in Section 4.3. This finding was further emphasized with the correlation analysis, showing a linear direction of S0 and S4 with the ascending order of stimulation (i.e., first through fifth order), each with a low and moderate correlation, respectively. In the case of participant 10, the perceived body representation for S4 was likely weak due to the inability to compare it with other stimulus types, as it was presented first. Conversely, the higher-intensity stimuli of S3 and S4F were associated with higher perceptions of body representation, as they were positioned fourth and last in the order, respectively.
Subsequently, for participant 4, S0 was likely influenced by prior exposure to the high-intensity stimuli of S3 (in the second order) and/or S4 (in the fourth order). The nervous system’s homeostatic mechanisms might underlie this effect, as neurons tend to maintain stable activity in response to external disturbances, such as electrical stimulation of the peripheral nervous system [49]. Under this homeostatic mechanism, the participant’s body may have become accustomed to higher electrical intensities, which could create a pseudo-memory for the same intensity level in subsequent sessions. Additionally, based on the average score, the combination of stimulation order from all stimulus types employed in this study could not explain the acquired body representation. While the finding of individual stimulus types suggests a potential to develop a structured stimulation order to enhance neuroplasticity, further investigation is necessary to understand the impact of higher-intensity stimuli on subsequent lower-intensity applications.

5.4. Limitation and Future Works

The small number of participants limited our ability to generalize the effects of the stimulation order on body perception, which showed a behavior of uncertain occurrence. Subsequently, this study disregarded the influence of incomplete involuntary finger movement on body representation under a higher electrical intensity, which may serve as a sensory alteration of the body. To address these limitations, we plan to make further improvements, including the use of a stretch-sensor glove on the affected hand to monitor involuntary gestures for comparison with those of the healthy hand and the resulting body representation perception. More importantly, the good performance of the proposed system in this study serves as a suggestion for conducting the next stage of the study, which involves observing the system’s performance on actual patients.

6. Conclusions

The proposed system represents a significant advancement in enhancing the visual feedback ownership and body representation perception through a proportional and synchronous control of EMS using healthy hand movements. While showing an opposite trend direction in stimulus comfort level, the proposed system enhances body representation perception for higher stimulus types. It has been observed that stronger stimulus types, particularly S4 and S4F, mark improvements in body representation perception, as evidenced by the strong statistical significance when compared to baseline stimulus S0 and the weakest stimulus, S1. Additionally, there is a small chance to promote neuroplasticity further by utilizing higher electrical intensities in a strategic order, which compels further investigation. These findings underscore the potential for improved body representation through enhanced visual feedback ownership when employing higher electrical intensities. The proposed system demonstrates a promising performance, especially when applied to healthy participants. Therefore, further observation of the proposed method in actual post-stroke patients is necessary.

Author Contributions

Conceptualization, A.R.S.S.P., A.O., T.T., and M.T.; methodology, A.R.S.S.P., A.O., and T.T.; validation, A.R.S.S.P.; formal analysis, A.R.S.S.P. and T.T.; investigation, A.R.S.S.P.; resources, A.R.S.S.P.; data curation, A.R.S.S.P.; writing—original draft preparation, A.R.S.S.P.; writing—review and editing, A.R.S.S.P., A.O., and T.T.; visualization, A.R.S.S.P.; supervision, A.O., T.T., and M.T.; project administration, A.R.S.S.P., A.O., T.T., and M.T. All authors have read and agreed to the published version of the manuscript.

Funding

This work was supported in part by JST Moonshot R&D Program Grant Number JPMJMS239F.

Institutional Review Board Statement

This study was conducted following the guidelines of the Declaration of Helsinki and approved on 8 September 2025 by the Ethics Committee of the Graduate School of Engineering, Kobe University (No. 07–08).

Informed Consent Statement

Informed consent was obtained from all participants involved in the study.

Data Availability Statement

The data are not publicly published due to ethical restrictions.

Acknowledgments

The authors sincerely appreciate the cooperation from all participants.

Conflicts of Interest

The authors declare no conflicts of interest.

Abbreviations

The following abbreviations are used in this manuscript:
EMSElectrical Muscle Stimulation
BMIBody Mass Index
S0Stimulus Type 0
S1Stimulus Type 1
S2Stimulus Type 2
S3Stimulus Type 3
S4Stimulus Type 4
S4FStimulus Type 4 Free Movement
UHUnlimited Hand

References

  1. Howard, G.; Goff, D.C. Population Shifts and the Future of Stroke: Forecasts of the Future Burden of Stroke. Ann. N. Y. Acad. Sci. 2012, 1268, 14–20. [Google Scholar] [CrossRef]
  2. Cheng, Y.; Lin, Y.; Shi, H.; Cheng, M.; Zhang, B.; Liu, X.; Shi, C.; Wang, Y.; Xia, C.; Xie, W. Projections of the Stroke Burden at the Global, Regional, and National Levels up to 2050 Based on the Global Burden of Disease Study 2021. J. Am. Heart Assoc. 2024, 13, e036142. [Google Scholar] [CrossRef] [PubMed]
  3. Joynt Maddox, K.E.; Elkind, M.S.V.; Aparicio, H.J.; Commodore-Mensah, Y.; de Ferranti, S.D.; Dowd, W.N.; Hernandez, A.F.; Khavjou, O.; Michos, E.D.; Palaniappan, L.; et al. Forecasting the Burden of Cardiovascular Disease and Stroke in the United States Through 2050—Prevalence of Risk Factors and Disease: A Presidential Advisory From the American Heart Association. Circulation 2024, 150, e65–e88. [Google Scholar] [CrossRef]
  4. Marciniak, C. Poststroke Hypertonicity: Upper Limb Assessment and Treatment. Top. Stroke Rehabil. 2011, 18, 179–194. [Google Scholar] [CrossRef]
  5. Gladstone, D.J.; Danells, C.J.; Black, S.E. The Fugl-Meyer Assessment of Motor Recovery after Stroke: A Critical Review of Its Measurement Properties. Neurorehabil. Neural Repair 2002, 16, 232–240. [Google Scholar] [CrossRef]
  6. Dombovy, M.L.; Sandok, B.A.; Basford, J.R. Rehabilitation for Stroke: A Review. Stroke 1986, 17, 363–369. [Google Scholar] [CrossRef]
  7. Selohandono, A.; Zamroni, Z.; Budi Rahayu, A. Emerging Neuroplasticity-Based Therapies in Stroke Rehabilitation: Literature Review. Ahmad Dahlan Med. J. 2024, 5, 204–218. [Google Scholar] [CrossRef]
  8. Michielsen, M.E.; Selles, R.W.; van der Geest, J.N.; Eckhardt, M.; Yavuzer, G.; Stam, H.J.; Smits, M.; Ribbers, G.M.; Bussmann, J.B.J. Motor Recovery and Cortical Reorganization After Mirror Therapy in Chronic Stroke Patients. Neurorehabil. Neural Repair 2011, 25, 223–233. [Google Scholar] [CrossRef] [PubMed]
  9. Thieme, H.; Mehrholz, J.; Pohl, M.; Behrens, J.; Dohle, C. Mirror Therapy for Improving Motor Function after Stroke. Cochrane Database Syst. Rev. 2018, 2018, 1–154. [Google Scholar] [CrossRef] [PubMed]
  10. Gandhi, D.B.; Sterba, A.; Khatter, H.; Pandian, J.D. Mirror Therapy in Stroke Rehabilitation: Current Perspectives. Ther. Clin. Risk Manag. 2020, 16, 75–85. [Google Scholar] [CrossRef]
  11. Khan, M.; Mazhar, S.; Ur-Rahman, M.; Jan, M.B.A.; Khan, Y.; Rahman, Z.; Habib, S.H.; Huma, Z.; Ghandapur, M.S.J.; Ali, Y. The Effectiveness of Mirror Therapy in Stroke Rehabilitation: Current Perspective Review. EC Neurol. 2020, 12, 69–80. [Google Scholar]
  12. Gallagher, S. Philosophical conceptions of the self: Implications for cognitive science. Trends Cogn. Sci. 2000, 4, 14–21. [Google Scholar] [CrossRef]
  13. Lisalde-Rodríguez, M.E.; Garcia-Fernández, J.A. Mirror Therapy in Hemiplegic Patient. Rev. Neurol. 2016, 62, 28–36. [Google Scholar]
  14. Casale, R.; Damiani, C.; Rosati, V. Mirror Therapy in the Rehabilitation of Lower-Limb Amputation. Am. J. Phys. Med. Rehabil. 2009, 88, 837–842. [Google Scholar] [CrossRef]
  15. Salhab, G.; Sarraj, A.R.; Saleh, S. Mirror Therapy Combined with Functional Electrical Stimulation for Rehabilitation of Stroke Survivors’ Ankle Dorsiflexion. In Proceedings of the 2016 38th Annual International Conference of the IEEE Engineering in Medicine and Biology Society (EMBC), Orlando, FL, USA, 16–20 August 2016. [Google Scholar]
  16. Xu, Q.; Guo, F.; Salem, H.M.A.; Chen, H.; Huang, X. Effects of Mirror Therapy Combined with Neuromuscular Electrical Stimulation on Motor Recovery of Lower Limbs and Walking Ability of Patients with Stroke: A Randomized Controlled Study. Clin. Rehabil. 2017, 31, 1583–1591. [Google Scholar] [CrossRef]
  17. Oh, Z.-H.; Liu, C.-H.; Hsu, C.-W.; Liou, T.-H.; Escorpizo, R.; Chen, H.-C. Mirror Therapy Combined with Neuromuscular Electrical Stimulation for Poststroke Lower Extremity Motor Function Recovery: A Systematic Review and Meta-Analysis. Sci. Rep. 2023, 13, 20018. [Google Scholar] [CrossRef] [PubMed]
  18. Yun, G.J.; Chun, M.H.; Park, J.Y.; Kim, B.R. The Synergic Effects of Mirror Therapy and Neuromuscular Electrical Stimulation for Hand Function in Stroke Patients. Ann. Rehabil. Med. 2011, 35, 316–321. [Google Scholar] [CrossRef]
  19. Mathieson, S.; Parsons, J.; Kaplan, M.; Parsons, M. Combining Functional Electrical Stimulation and Mirror Therapy for Upper Limb Motor Recovery Following Stroke: A Randomised Trial. Eur. J. Physiother. 2018, 20, 244–249. [Google Scholar] [CrossRef]
  20. Kharka, M.; Singh, P. A Study to Compare the Effectiveness of Mirror Therapy and Neuromuscular Electrical Stimulation on Upper-Extremity Motor Recovery, Motor Function, and Quality of Life in Subacute Stroke Subjects. Med. J. Dr. D.Y. Patil Vidyapeeth 2021, 14, 318–326. [Google Scholar] [CrossRef]
  21. Paik, Y.-R.; Lee, J.-H.; Lee, D.-H.; Park, H.-S.; Oh, D.-H. Effect of Mirror Therapy and Electrical Stimulation on Upper Extremity Function in Stroke with Hemiplegic Patient: A Pilot Study. J. Phys. Ther. Sci. 2017, 29, 2085–2086. [Google Scholar] [CrossRef] [PubMed]
  22. Petrofsky, J.S. Electrical Stimulation: Neurophysiological Basis and Application. Basic Appl. Myol. 2004, 14, 205–213. [Google Scholar]
  23. Kesselring, J. Neuroplasticity – Basis for Lifelong Learning. Eur. Neurol. Rev. 2015, 9, 143. [Google Scholar] [CrossRef]
  24. Puderbaugh, M.; Emmady, P.D. Neuroplasticity-StatPearls-NCBI Bookshelf. Available online: www.ncbi.nlm.nih.gov/books/NBK557811 (accessed on 30 July 2025).
  25. Singh, S. Neuroplasticity and Rehabilitation: Harnessing Brain Plasticity for Stroke Recovery and Functional Improvement. Univers. Res. Rep. 2024, 11, 50–56. [Google Scholar] [CrossRef]
  26. Luft, A.R. Rehabilitation and Plasticity. In Clinical Recovery from CNS Damage; Naritomi, H., Krieger, D.W., Eds.; S. Karger AG: Basel, Switzerland, 2013; pp. 88–94. [Google Scholar]
  27. Straudi, S.; Basaglia, N. Neuroplasticity-Based Technologies and Interventions for Restoring Motor Functions in Multiple Sclerosis. In Multiple Sclerosis: Bench to Bedside; Asea, A.A.A., Geraci, F., Kaur, P., Eds.; Springer: Cham, Switzerland, 2017; pp. 171–185. [Google Scholar]
  28. Jarmolowska, J.; Miladinović, A.; Valvason, E.; Busan, P.; Ajčević, M.; Battaglini, P.P.; Accardo, A. Effects of Mirror Therapy on Motor Imagery Elicited ERD/S: An EEG Study on Healthy Subjects. In Proceedings of the 8th European Medical and Biological Engineering Conference (EMBEC), Portorož, Slovenia, 29 November–3 December 2020. [Google Scholar]
  29. Saavedra-García, A.; Moral-Munoz, J.A.; Lucena-Anton, D. Mirror Therapy Simultaneously Combined with Electrical Stimulation for Upper Limb Motor Function Recovery after Stroke: A Systematic Review and Meta-Analysis of Randomized Controlled Trials. Clin. Rehabil. 2021, 35, 39–50. [Google Scholar] [CrossRef] [PubMed]
  30. Kojima, K.; Ikuno, K.; Morii, Y.; Tokuhisa, K.; Morimoto, S.; Shomoto, K. Feasibility Study of a Combined Treatment of Electromyography-Triggered Neuromuscular Stimulation and Mirror Therapy in Stroke Patients: A Randomized Crossover Trial. Neurorehabilit. Int. Interdiscip. J. 2014, 34, 235–244. [Google Scholar] [CrossRef]
  31. Hall, C.R.; Martin, K.A. Measuring Movement Imagery Abilities: A Revision of the Movement Imagery Questionnaire. J. Ment. Imag. 1997, 21, 143–154. [Google Scholar]
  32. Iwanami, J.; Mutai, H.; Sagari, A.; Sato, M.; Kobayashi, M. Relationship between Corticospinal Excitability While Gazing at the Mirror and Motor Imagery Ability. Brain Sci. 2023, 13, 463. [Google Scholar] [CrossRef]
  33. Kusano, K.; Hayashi, M.; Iwama, S.; Ushiba, J. Improved Motor Imagery Skills after Repetitive Passive Somatosensory Stimulation: A Parallel-Group, Pre-Registered Study. Front. Neural Circuits 2025, 18, 1510324. [Google Scholar] [CrossRef] [PubMed]
  34. Gerovasili, V.; Stefanidis, K.; Vitzilaios, K.; Karatzanos, E.; Politis, P.; Koroneos, A.; Chatzimichail, A.; Routsi, C.; Roussos, C.; Nanas, S. Electrical Muscle Stimulation Preserves the Muscle Mass of Critically Ill Patients: A Randomized Study. Crit. Care 2009, 13, R161. [Google Scholar] [CrossRef]
  35. H2L Inc. UnlimitedHand Developer’s Site. Available online: http://dev.unlimitedhand.com/devise/ (accessed on 7 August 2025).
  36. P, A.R.S.S.; Ohnishi, A.; Terada, T.; Tsukamoto, M. Estimation of Cylinder Grasping Contraction Force of Forearm Muscle in Home-Based Rehabilitation Using a Stretch-Sensor Glove. Appl. Sci. 2025, 15, 7534. [Google Scholar] [CrossRef]
  37. Images Scientific Instruments, Inc. Flexible Stretch Sensor. Available online: https://www.imagesco.com/sensors/stretch-sensor.html (accessed on 20 March 2025).
  38. Sachetti, A.; Carpes, M.F.; Dias, A.S.; Sbruzzi, G. Safety of Neuromuscular Electrical Stimulation among Critically Ill Patients: Systematic Review. Rev. Bras. Ter. Intensiv. 2018, 30, 219–225. [Google Scholar] [CrossRef]
  39. Gregg, M.; Hall, C.; Butler, A. The MIQ-RS: A Suitable Option for Examining Movement Imagery Ability. Evid. Based Complement. Altern. Med. 2010, 7, 249–257. [Google Scholar] [CrossRef]
  40. Miller, M.G.; Cheatham, C.C.; Holcomb, W.R.; Ganschow, R.; Michael, T.J.; Rubley, M.D. Subcutaneous Tissue Thickness Alters the Effect of NMES. J. Sport Rehabil. 2008, 17, 68–75. [Google Scholar] [CrossRef] [PubMed]
  41. Petrofsky, J. The effect of the subcutaneous fat on the transfer of current through skin and into muscle. Med. Eng. Phys. 2008, 30, 1168–1176. [Google Scholar] [CrossRef] [PubMed]
  42. Medeiros, F.V.; Vieira, A.; Carregaro, R.; Bottaro, M.; Maffiuletti, N.; Durigan, J. Skinfold thickness affects the isometric knee extension torque evoked by Neuromuscular Electrical Stimulation. Braz. J. Phys. Ther. 2015, 19, 466–472. [Google Scholar] [CrossRef] [PubMed]
  43. Bolfe, V.J.; Ribas, S.I.; Montevelo, M.I.L.; Guirro, R.R.J. Electrical Impedance Behavior of Biological Tissues During Transcutaneous Electrical Stimulation. Braz. J. Phys. Ther. 2007, 11, 135–140. [Google Scholar]
  44. Park, J.; Hopkins, J. Quadriceps activation normative values and the affect of subcutaneous tissue thickness. J. Sport Rehabil. 2011, 21, 136–140. [Google Scholar] [CrossRef]
  45. Kim, J.Y.; Noh, H.; Park, J. Effects of Functional Electrical Stimulation Intensity Level on Corticomuscular Coherence during Action Observation. J. Kor. Phys. Ther. 2020, 32, 307–311. [Google Scholar] [CrossRef]
  46. Insausti-Delgado, A.; López-Larraz, E.; Omedes, J.; Ramos-Murguialday, A. Intensity and Dose of Neuromuscular Electrical Stimulation Influence Sensorimotor Cortical Excitability. Front. Neurosci. 2021, 14, 593360. [Google Scholar] [CrossRef]
  47. Paillard, T. Neuromuscular or Sensory Electrical Stimulation for Reconditioning Motor Output and Postural Balance in Older Subjects? Front. Physiol. 2022, 12, 779249. [Google Scholar] [CrossRef]
  48. Shindo, M.; Isezaki, T.; Aoki, R. Electrical Stimulation Intensity to Induce Sensory Reweighting Dynamics While Standing on Balance Board. In Proceedings of the 2023 45th Annual International Conference of the IEEE Engineering in Medicine & Biology Society (EMBC), Sydney, Australia, 24–27 July 2023. [Google Scholar]
  49. Poso, K.; Goda, Y. Unraveling Mechanisms of Homeostatic Synaptic Plasticity. Neuron 2010, 66, 337–351. [Google Scholar] [CrossRef] [PubMed]
Figure 1. UnlimitedHand (UH) device and the EMS channel location on the backside [35].
Applsci 15 11179 g001
Figure 2. Stretch-Sensor Glove [36].
Applsci 15 11179 g002
Figure 3. The employed stretch sensor characteristic [37].
Applsci 15 11179 g003
Figure 4. Experiment environment.
Applsci 15 11179 g004
Figure 5. Comparison of RAW data and the decay–modeled RAW data.
Applsci 15 11179 g005
Figure 6. Experiment flow (S0–S4: Stimulation type 0 (baseline) through type 4, respectively; S4F: Stimulation type 4: free session).
Applsci 15 11179 g006
Figure 7. Alignment process between the left hand’s reflection and the right forearm.
Applsci 15 11179 g007
Figure 8. Boxplot of body representation perception (** p < 0.05).
Applsci 15 11179 g008
Figure 9. Boxplot of electrical stimulus comfort (** p < 0.05).
Applsci 15 11179 g009
Table 1. The employed scoring principle for perceived body representation of MT.
1234567
Very hard
to feel
Hard to
feel
Somewhat
hard to feel
UncertainSomewhat
easy to feel
Easy to
feel
Very easy
to feel
Table 2. Five-item comfort scale of the applied electrical stimulation.
12345
Very uncomfortableUncomfortableUncertainComfortableVery comfortable
Table 3. Participants’ physical data and personalized electrical intensity.
ParticipantBMI
(kg/m2)
Forearm Circumference
(cm)
S1S2S3S4Intensity
Difference
Variance
125.0624.5556780.00
217.4024.3023580.67
332.9128.85679110.22
429.8627.6025790.22
517.3122.40469100.67
617.2122.404710110.89
719.8822.2013570.00
820.2023.6024560.22
923.1124.7024670.22
1021.8024.406911120.67
Table 4. Spearman’s rank correlation coefficient (ρ) between participant’s physical data and electrical intensities.
Stimulus
Type
BMIForearm Circumference
S10.260.38
S20.170.26
S30.020.17
S40.010.19
Table 5. Summary of stimulation order and correlation between primary outcomes. (* p < 0.05; ** p < 0.01).
ParticipantStimulation OrderBody
Representation
Perception
Electrical
Stimulus
Comfort
Correlation of Body Representation
and Stimulus Comfort
(ρ)
S0S1S2S3S4S4FS0S1S2S3S4S4F
1S2-S4-S0-S3-S1-S4F122666544213−0.94 **
2S4-S2-S0-S3-S1-S4F114357553324−0.63
3S2-S4-S0-S3-S1-S4F123333544333−0.82 *
4S1-S3-S2-S4-S0-S4F644577555444−0.70
5S1-S3-S2-S4-S0-S4F243566544422−0.94 **
6S0-S2-S3-S4-S1-S4F323455444432−0.84 *
7S0-S2-S3-S4-S1-S4F365564543212−0.40
8S3-S1-S2-S0-S4-S4F211454543323−0.66
9S3-S1-S2-S0-S4-S4F111564555343−0.79
10S4-S2-S0-S3-S1-S4F443536555333−0.40
Table 6. Post hoc Dunn’s test result (yellow cell: p < 0.01).
Primary OutcomeStimulus
Types
S0S1S2S3S4S4F
Body
Representation
Perception
S01.0001.0001.0000.1450.0080.009
S11.0001.0001.0000.4120.0310.036
S21.0001.0001.0000.6060.0520.060
S30.1450.4120.6061.0001.0001.000
S40.0080.0310.0521.0001.0001.000
S4F0.0090.0360.0601.0001.0001.000
Electrical
Stimulus
Comfort
S01.00001.00000.63820.00130.000030.0002
S11.00001.00001.00000.07740.00420.0220
S20.63821.00001.00000.87020.09480.3391
S30.00130.07740.87021.00001.00001.0000
S40.000030.00420.09481.00001.00001.0000
S4F0.00020.02200.33911.00001.00001.0000
Table 7. Spearman’s correlation coefficient (ρ) of stimulation order and body representation for each stimulus type.
S0S1S2S3S4Average
0.14−0.03−0.17−0.140.460.05
Table 8. Interpretation of Spearman’s correlation coefficient between stimulation order and body representation for each stimulation type.
Stimulus TypeInterpretation
S0Small chance to induce higher body representation when located at the later order, and vice versa
S1Small chance to induce higher body representation when located at the earlier order, and vice versa
S2Small chance to induce higher body representation when located at the earlier order, and vice versa
S3Small chance to induce lower body representation when located at the later order, and vice versa
S4Moderate chance to induce lower body representation when located at the earlier order, and vice versa
Disclaimer/Publisher’s Note: The statements, opinions and data contained in all publications are solely those of the individual author(s) and contributor(s) and not of MDPI and/or the editor(s). MDPI and/or the editor(s) disclaim responsibility for any injury to people or property resulting from any ideas, methods, instructions or products referred to in the content.