Article

Partitioning Early Warning in the Mining Process of Residual Ore Bodies via Microseismic Monitoring—Taking the Xianglushan Tungsten Mine as an Example

1
State Key Laboratory of Safety Technology of Metal Mines, Changsha Institute of Mining Research Co., Ltd., Changsha 410012, China
2
College of Resources and Environmental Engineering, Jiangxi University of Science and Technology, Ganzhou 341000, China
3
School of Resources and Safety Engineering, University of Science and Technology Beijing, Beijing 100083, China
4
China Academy of Safety Science and Technology, Beijing 100012, China
5
School of Resources and Safety Engineering, Central South University, Changsha 410083, China
*
Author to whom correspondence should be addressed.
Appl. Sci. 2025, 15(20), 11172; https://doi.org/10.3390/app152011172
Submission received: 6 September 2025 / Revised: 28 September 2025 / Accepted: 16 October 2025 / Published: 18 October 2025
(This article belongs to the Topic Advances in Mining and Geotechnical Engineering)

Abstract

The regular ore body of the Xianglushan tungsten mine has been completely exploited. The remaining residual ore bodies face numerous hidden dangers, such as large and numerous abandoned mining areas, disorderly and small-scale mining sequences, delayed filling processes, and poor effectiveness. To achieve the zoning warning of ground pressure disasters such as roof caving, caving, and pillar collapse during the mining process of the hidden-danger ore body in the mine, a targeted warning technology system is proposed. We use microseismic monitoring systems to analyze events in the main monitoring areas and summarize specific ground pressure manifestation areas and event characteristics. Based on microseismic monitoring data that identified areas of significant ground pressure, a zoning model was constructed for risk rating and area locking. Based on this model, a safety warning technology for mining residual ore bodies with hidden dangers was established. Summarizing and analyzing, it is found that the disaster warning mode for controlling hidden dangers and residual ore body mining processes through microseismic monitoring is effective and has played a certain demonstration role, providing reference value for other similar mines.

1. Introduction

With the continuous development of global metal mineral resources, mining activities are gradually moving towards deep mining. At the same time, humans are also seeking more possibilities for resource extraction, such as the secondary recovery of residual trace ore bodies in tailings ponds, dam bodies, and goaf areas. The residual ore bodies that have undergone mining work, especially, still have significant development value. However, the production activities of such metal mines are limited by special environments such as goaf, resulting in frequent disasters [1,2,3,4,5], mainly including roof caving, rockburst, pillar instability, and goaf collapse. With the improvement in and technological advancement of remote online monitoring technology, filling process, and safety supervision, many analyses and studies have been conducted on such disasters, and some results have been achieved [6]. In recent years, many scholars have proposed various monitoring and early warning methods [7] and related technical measures for disasters such as ground pressure in goaf. These have achieved some results in preventing the collapse of goaf and the instability of mining pillars.
The research and application of high-precision microseismic monitoring systems for underground metal mines are flourishing domestically and internationally [8,9,10,11]. The sensitivity of picking up seismic source sensors is gradually improving, and the layout and installation methods of the network are gradually optimizing [12]. At the same time, high-signal-to-noise-ratio transmission technology has been introduced, improving the anti-interference ability of the product in complex working environments [13]. In addition, at the interactive level, the microseismic monitoring system has the function of three-dimensional interaction with the mine [14,15,16], which improves the integration of the microseismic monitoring system with the mining process and the humanization of software use. Overall, a comprehensive ground pressure-monitoring solution has been developed, including efficient monitoring, automatic processing, in-depth analysis, early warning and forecasting, and disaster prevention and control. Significant progress has also been made in microseismic monitoring regarding the monitoring and the early warning of mining goaf and related disasters [17,18,19,20,21,22,23]. Lebert F. et al. [24] used microseismic monitoring technology for underground mining collapses to record microseismic precursor signals that may indicate the beginning of rock failure in order to determine stability. Furthermore, Liu J. et al. [25] believe that the goaf near the working face is the dominant factor in disaster occurrence, posing a serious threat to mine safety. It mainly combines microseismic monitoring technology and numerical simulation methods to systematically analyze the stress law of surrounding rock in the mining area, and reveal the precursor characteristics of ground pressure disasters in the adjacent working faces of goaf.
In recent years, with the near depletion of mining resources, the mining of residual ore bodies has brought more mining disasters. The large amount of goaf left behind tends to cause roof collapse and the shear failure of mining pillars [26,27]. Microseismic monitoring can assist in regional grading warnings, thereby establishing a warning mechanism for ground pressure disasters and microseismic monitoring parameters. On the one hand, the development of multi-parameter comprehensive early warning technology based on microseismic monitoring is more suitable [28,29,30]. Researchers in ground pressure prevention and control have constructed a monitoring and warning index system based on the three field monitoring principles of vibration, energy, and stress, and developed a multi-field, multi-parameter weight-adaptive spatiotemporal strong comprehensive warning model. They have also established a comprehensive theory and technology for intelligent identification of and warning about ground pressure risks. By collecting real-time monitoring data, the areas and intensities of rockburst hazards can be accurately analyzed, and the trend of rockburst hazards in mines can be predicted by zoning and grading, effectively guiding mines to formulate scientific prevention and control plans. On the other hand, various comprehensive monitoring and early warning platforms play a crucial role [31,32,33,34], such as the China Coal Science and Industry Group Mining Research Institute Co., Ltd. in Beijing, China (https://kc.ccteg.cn/contents/4640/19761.html (accessed on 30 August 2025)). The comprehensive monitoring and early warning platform developed for coal mine rockburst source weights can achieve the integrated display of multiple types of data and overall fusion early warning based on source weights. This relies on the Coal Science and Technology Research Institute Co., Ltd in Beijing, China (https://ccri.ccteg.cn/contents/6835/1000180.html (accessed on 30 August 2025)). The multi-parameter comprehensive warning platform for rockburst “well ground” information developed normalizes and comprehensively analyzes different types of data. The Jiang Fuxing team [35,36] developed a multi-parameter joint monitoring impact ground pressure-monitoring and early warning platform based on cloud platform technology, which enabled the remote mining and analysis of multi-parameter monitoring data. The remote warning platform for mining earthquake impact disasters and the expert diagnosis system for impact hazards developed by Dou Linming’s team [37] have achieved remote monitoring and the diagnosis of mining earthquakes. Overall, microseismic monitoring technology has made significant progress in the zoning warning of ground pressure disasters in mines [38,39]. Through the development and application of multi-parameter comprehensive warning technology and high-precision microseismic monitoring systems, the effective warning and prevention of ground pressure disasters have been achieved.
In summary, this study investigates the methods and mechanisms of microseismic monitoring and zoning warning during the mining process of residual ore bodies, with a specific focus on the analysis of microseismic monitoring parameters. Taking the Xianglushan Tungsten Mine as a case study, we developed a microseismic warning model based on multi-index scoring and zoning thresholds and conducted empirical validation in its residual mining area. This approach addresses the scientific challenge of achieving operable and reliable zoning early warning under complex geological and mining conditions. Through typical case analysis using localized, small-scale microseismic event parameters, we practically verified the proposed warning methods for potential ground pressure disasters during residual ore extraction. The findings provide a valuable reference and basis for stability analysis and disaster warning in large and complex goaf areas during residual ore body mining [40].

2. Ground Pressure Characteristics of Residual Ore Recovery in Goaf

2.1. Engineering Background

2.1.1. Project Overview

Xianglushan Tungsten Mine is located in the northwest of Jiangxi Province, China, as shown in Figure 1a. It is known for its abundant tungsten resources. The main ore body occurrence environment is shown in Figure 1b; this determines the particularity of the structural stress environment of its ore body. With the near depletion of the main ore bodies, in recent years, the mining of residual ore bodies in the surrounding rock of goaf has become the main theme. This leads to a more dangerous stress distribution in the entire mine, as shown in Figure 1c,d. Therefore, we use microseismic data to monitor and warn of ground pressure in mines and analyze and study disaster warning and control technologies for residual hidden-danger ore body mining [41].

2.1.2. Residual Ore Recovery Analysis

As of the end of 2012, the Xianglushan tungsten mine held 11.4 million tons of residual ore in its eastern area, accounting for 61.4% of its total reserves and possessing a potential value of CNY 10.6 billion. This highlights the immense economic significance of recovering these resources.
The Xianglushan tungsten deposit is characterized by a gently inclined and thick (2–40 m) anticline-type occurrence (Figure 1b), with an overall shape resembling a “pot lid”. The ore rock is hard and stable, with good mining technology conditions, but due to historical mining, a complex pillar void structure has been formed. The recovery rate of the eastern residual mining area is as high as 82.7%, with only about 13% of the ore body forming the pillars supporting the roof.
The mining area is facing two major ground pressure disasters: firstly, the continuous increase in the exposure time of the empty area leads to weakened stability. The second reason is the redistribution of stress under complex structures. This includes (1) the disturbance caused by mining in the western mining area. (2) The impact of deep hole blasting in the western region (with a charge of 1–2 tons) is much greater than that of shallow hole blasting in the eastern region. (3) Surface rainfall changes the mechanical properties of overlying rock layers through infiltration.
The western mining area has become the main production area and is located at the key load-bearing part of the arch bottom of the anticline ore body. Its large-scale continuous mining will trigger the continuous adjustment and concentration of stress throughout the mine. If small-scale ground pressure activities accumulate to a qualitative change within the current IV level airspace, this may trigger large-scale ground pressure disasters, seriously affecting the sustainability of production and the recovery of high-quality resources.
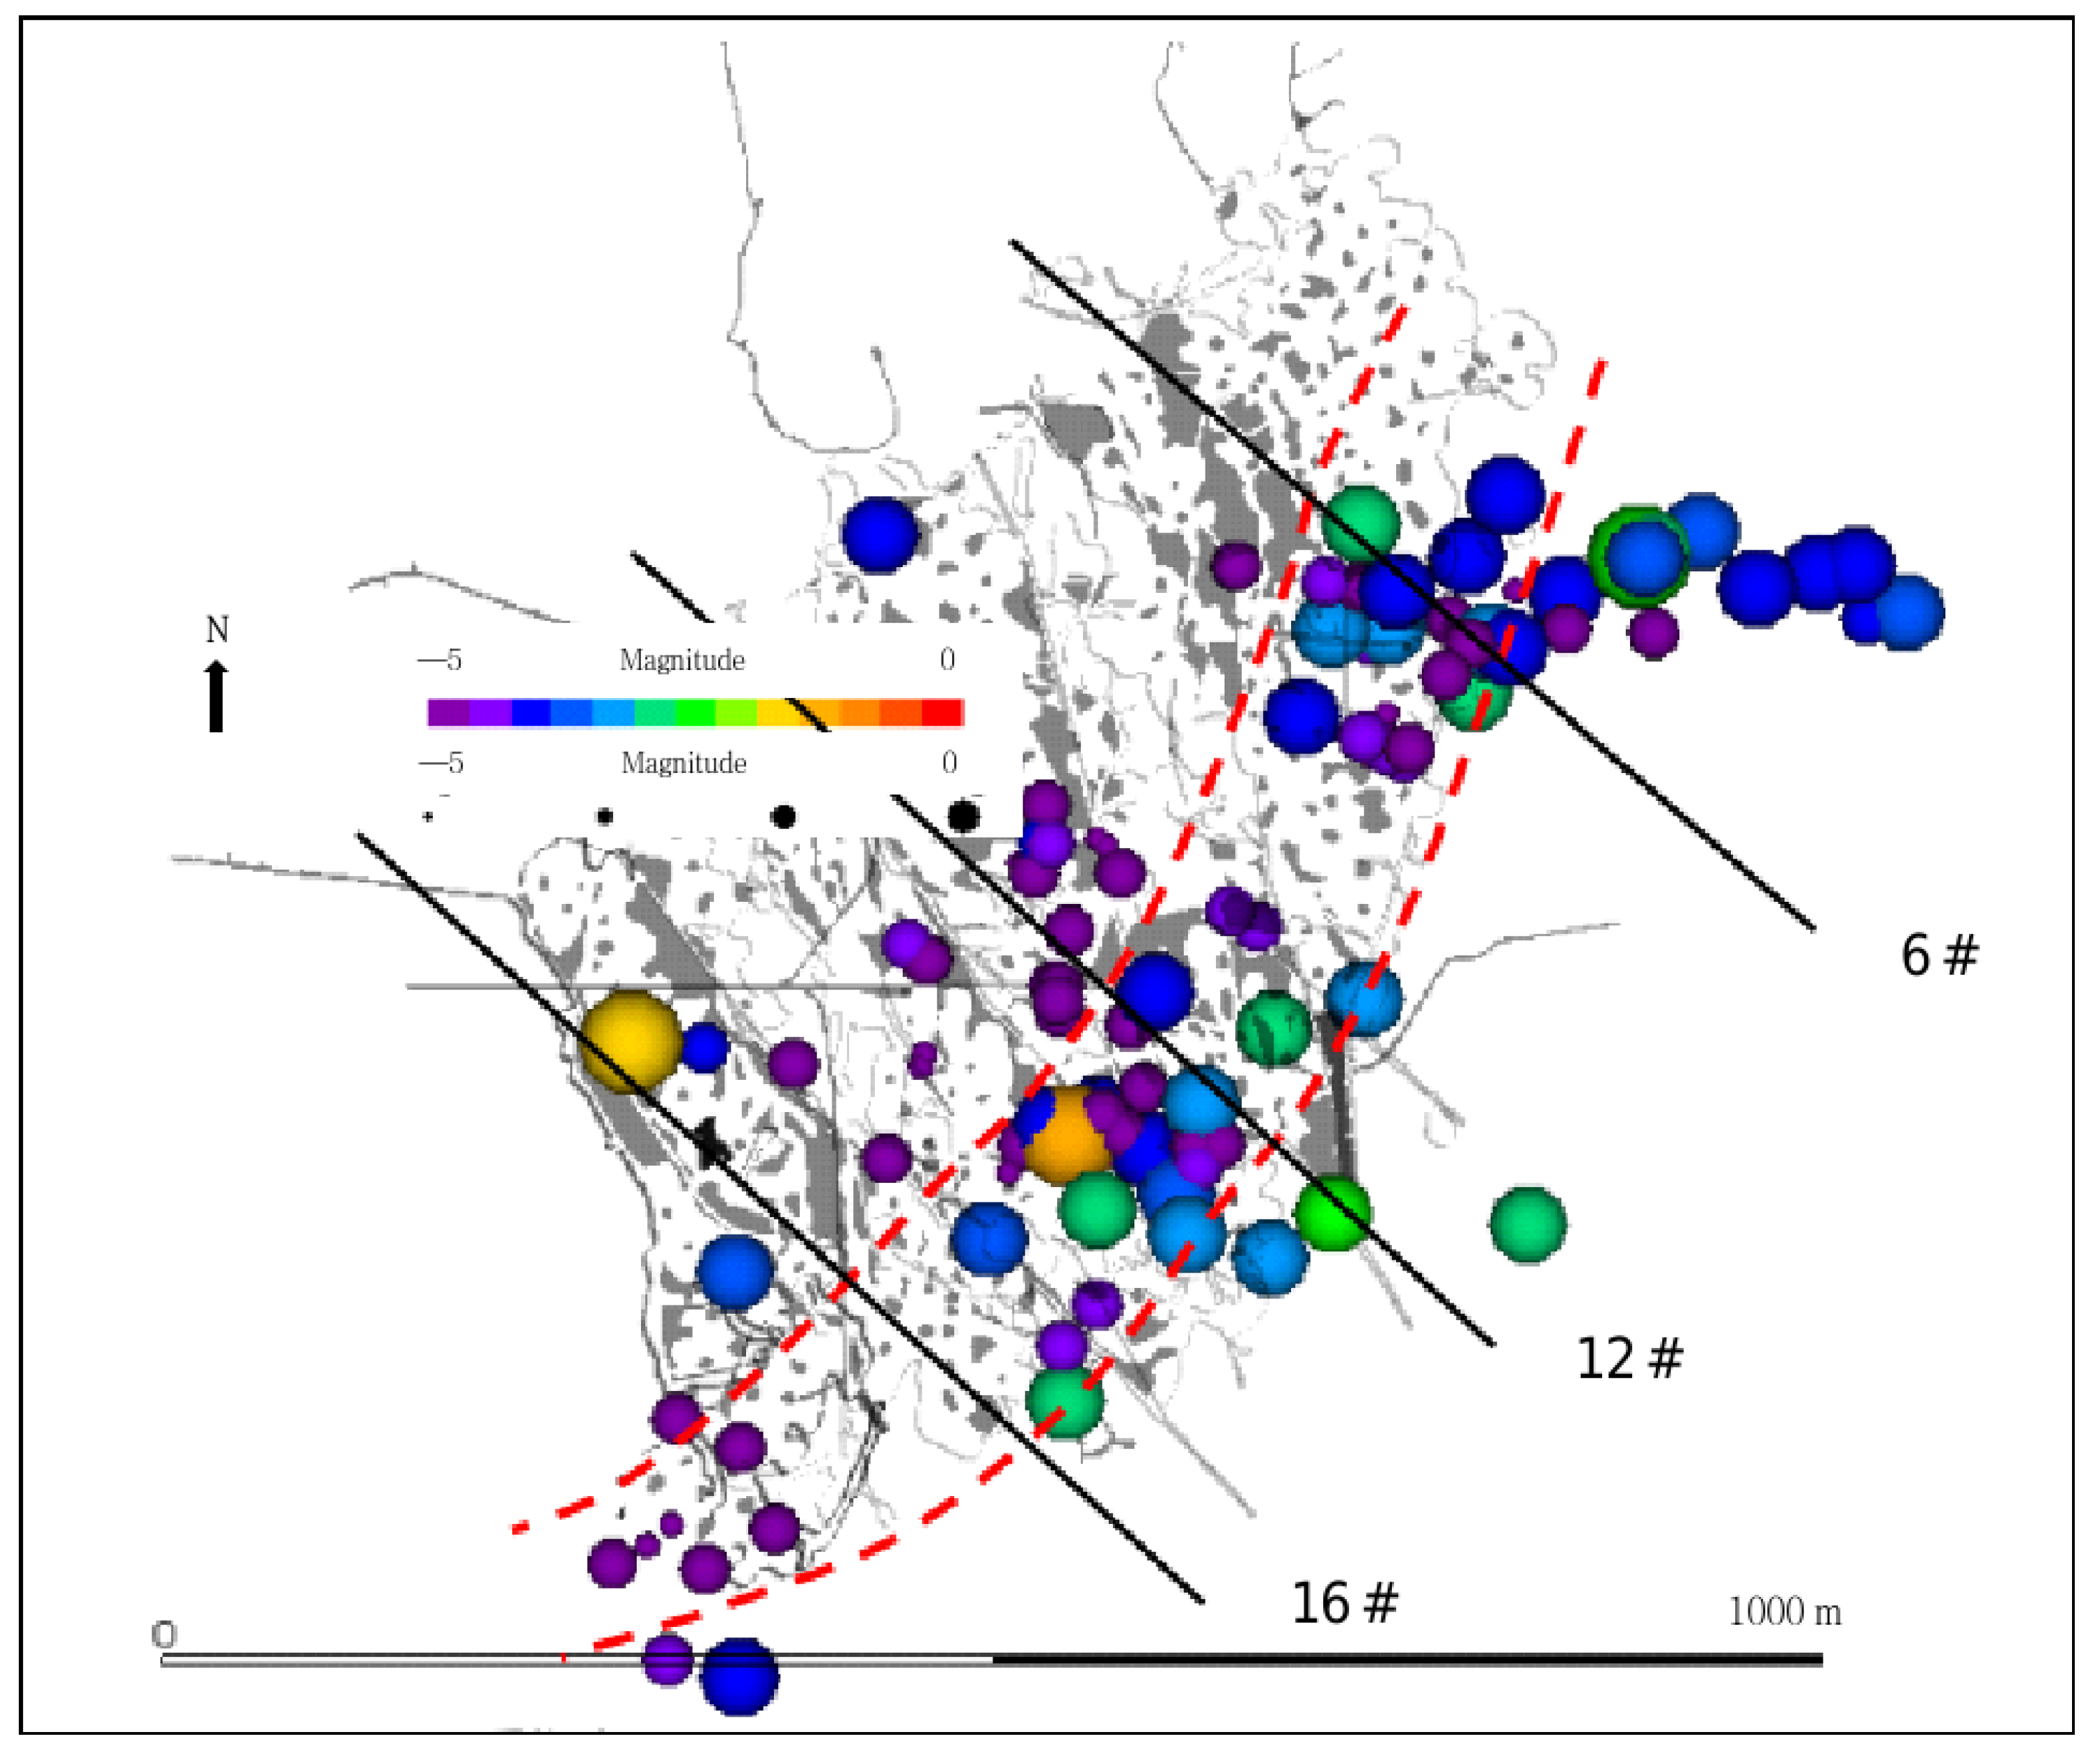
Microseismic monitoring shows that with the recovery of residual mines in the east, the goaf continues to expand, and microseismic activity shows an increasing trend in Figure 2. The overall ground pressure tends to be active, and local ground pressures such as roof collapse and pillar rupture have appeared on site. Recent data has confirmed that the number of microseismic events in the entire mine is positively correlated with ore production.

2.2. Analysis of Ground Pressure Manifestation During Residual Mining and Filling Process

Before and after the collapse of large-scale goaf, the frequency of underground ground pressure shows a fluctuating upward trend. Taking the large-scale collapse on 28 June of that year as the node, the number of ground pressure manifestations reached a peak in July and August, and the overall data volume significantly exceeded the historical high before the collapse. Within three months after collapse, stress redistribution and concentration enter a peak period, followed by the gradual recovery of ground pressure activity to the average level before collapse.
The main manifestations of underground ground pressure are roof collapse in production areas, the chain reaction of pillar collapse, cracking, peeling, and the bursting of pillars. The triggering reasons can be summarized as follows: ① there is production disturbance (stress redistribution caused by mining, blasting dynamic load); ② there is long-term weathering (groundwater and weakened rock mass due to filling and dehydration); ③ the pressure control effect of the filling body is limited.
The data shows that about 77% of the active ground pressure areas and 63.6% of the ground pressure manifestation areas are affected by mining disturbances, and 72.7% of the manifestation areas are located in the filling area and adjacent areas. The filling body mainly plays a role in wrapping, repairing, and laterally supporting some of the pillars, and it has little effect on the roof and non-filling pillars. Through an analysis of 11 areas of ground pressure manifestation, 8 are located in the filling area and surrounding areas, and only 3 are located in the unfilled area, further confirming that the ground pressure activity in the filling area has not significantly weakened, and the overall and local ground pressure control effects still need to be improved and optimized.

2.3. Relationship Between Microseismicity and Ground Pressure

To reproduce and analyze the ground pressure manifestation patterns in key areas of the mine, we built and optimized a microseismic monitoring system at Xianglushan Tungsten Mine. In terms of horizontal distribution, it mainly includes two major regions: the eastern and western regions. Based on the occurrence characteristics of the ore body and the mining area, division into four more detailed regions is performed. According to the stage and scale of mineral extraction, the east and west areas are divided based on exploration line 16. A total of 24 new sensors are added. The amplification and installation of 18 sensors occurs between lines 16 and 18 in the western region. We install 6 sensors east of line 16 for amplification. The sensors in the eastern area mainly cover the pillars of thick and large goaf areas. The expanded microseismic monitoring network has a total of 84 sensors [41].

2.3.1. Microseismic Event Situation

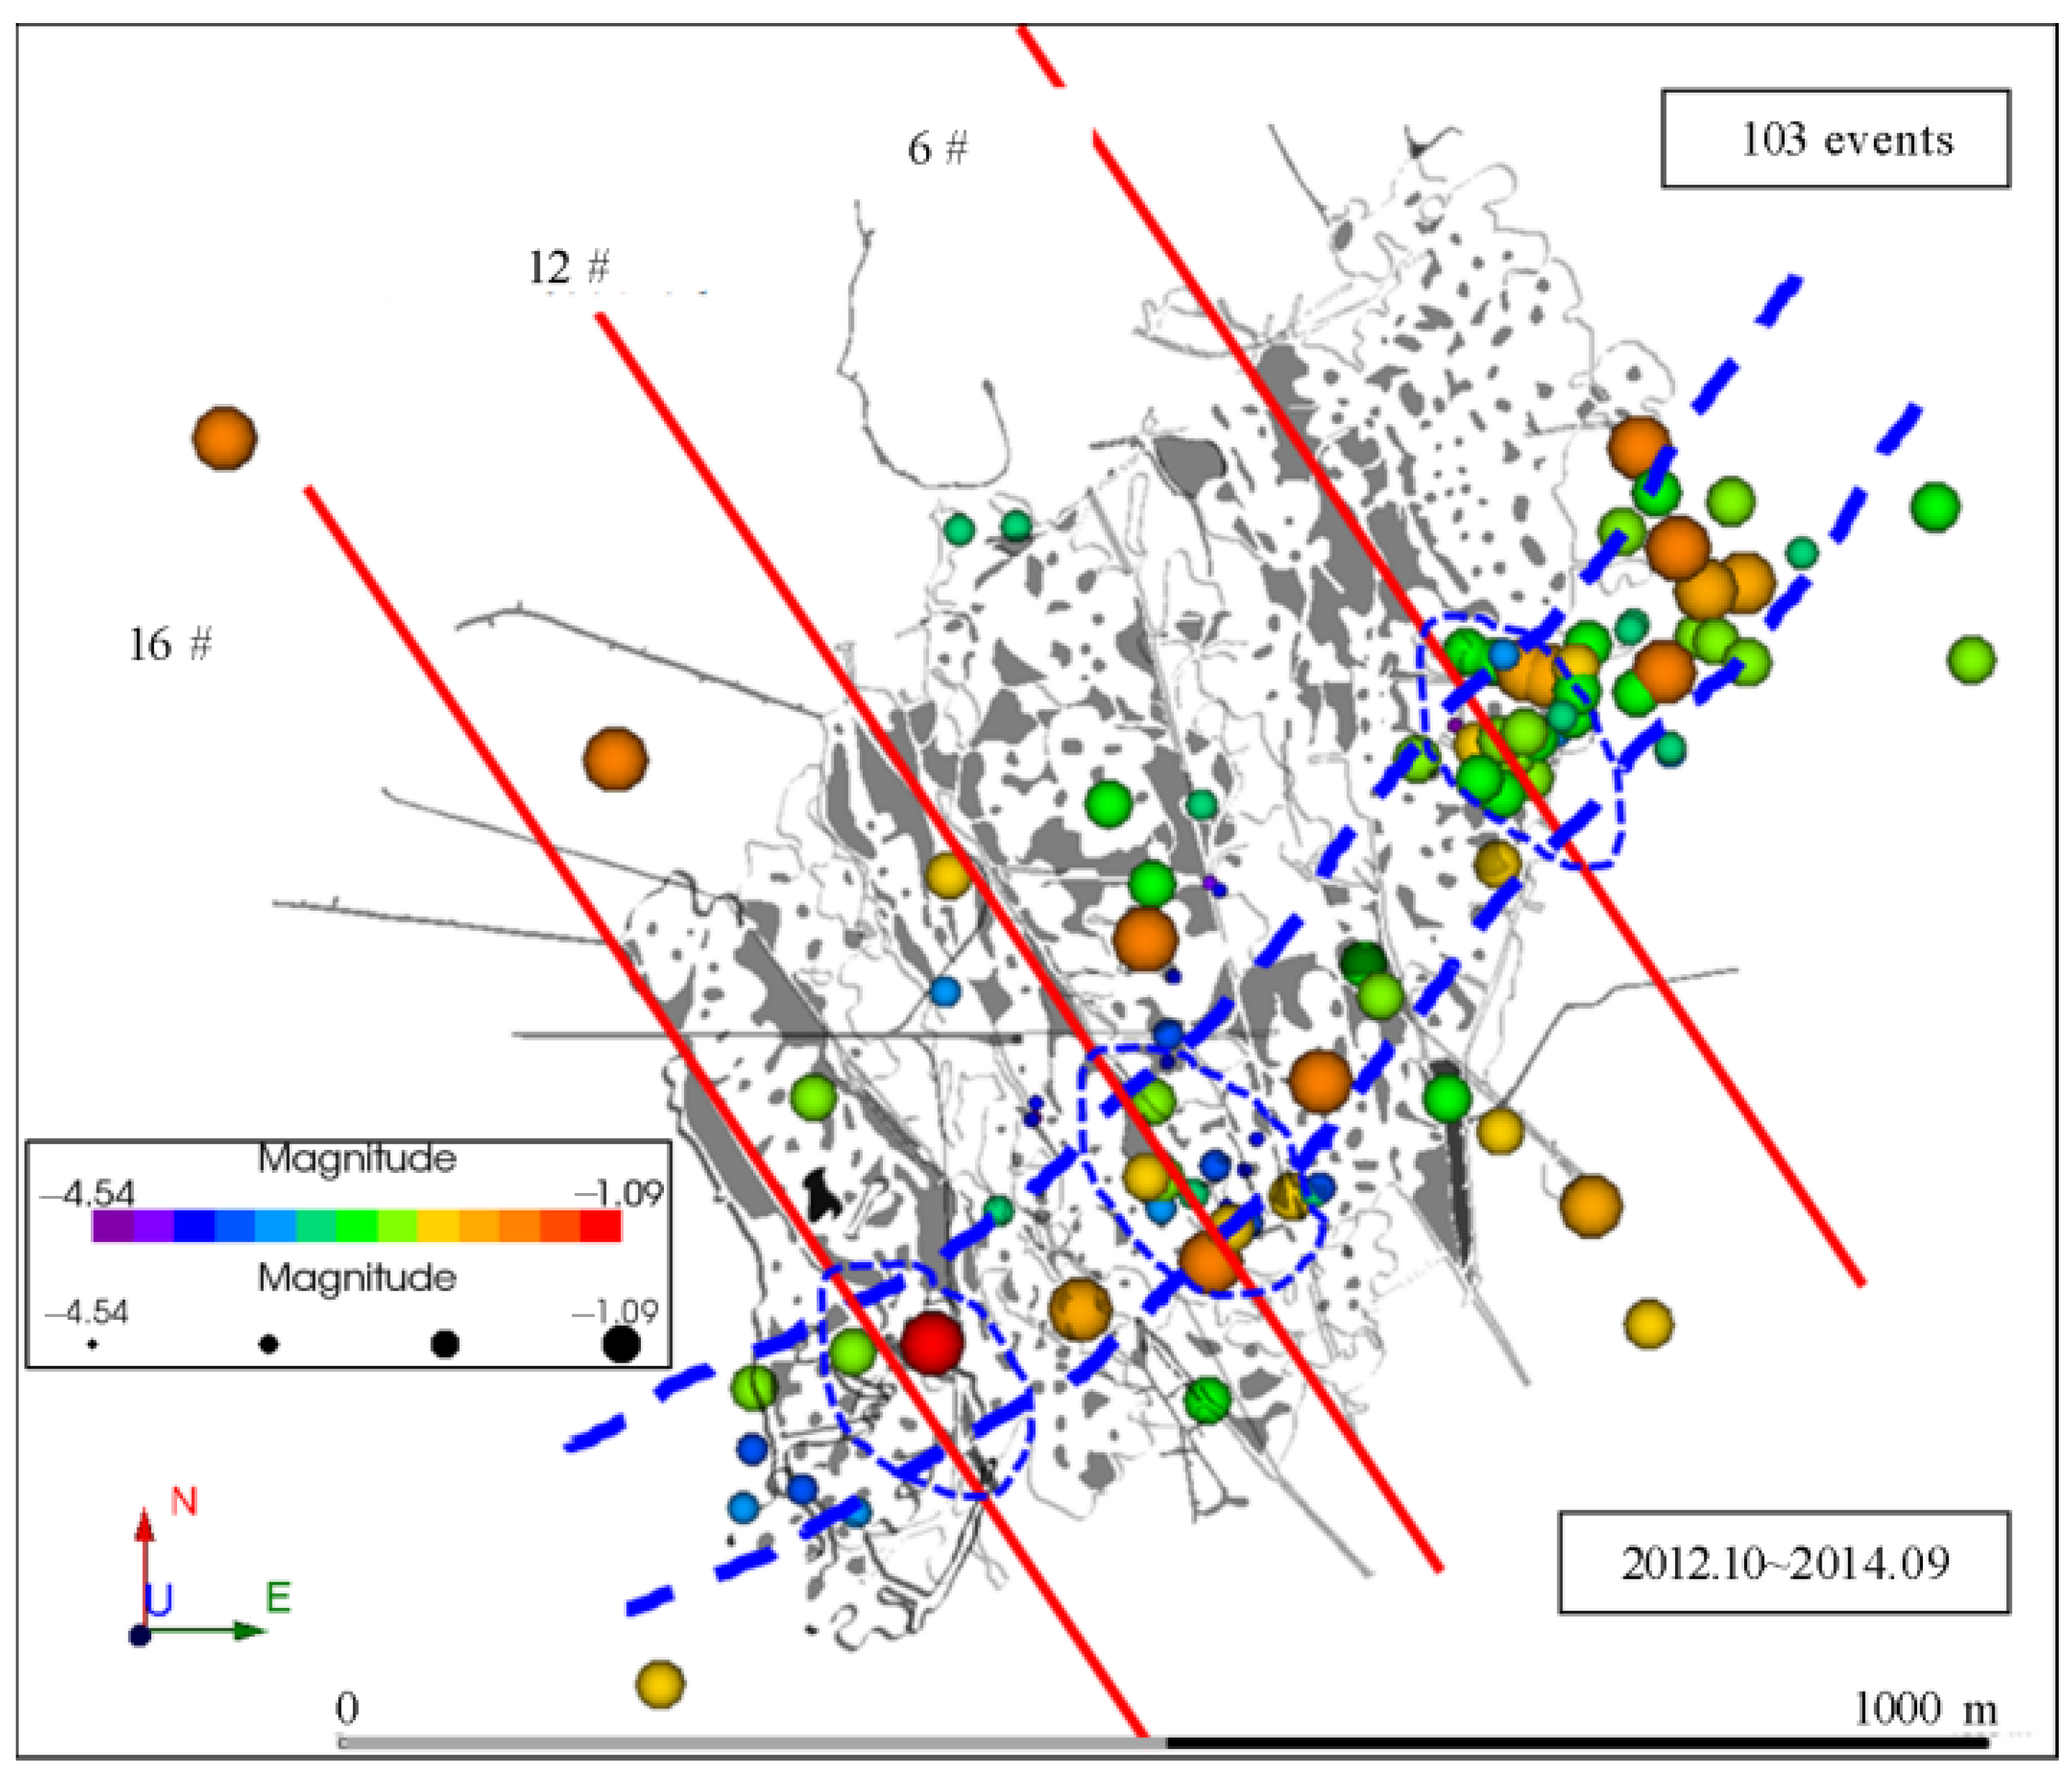
As shown in Figure 3, microseismic localization events were monitored from October 2012 to September 2014. The microseismic localization events are mainly concentrated and distributed within the two blue-line areas in the figure. The general direction of the area is consistent with the direction of the ore body. In addition, the location of microseismic localization events was also delineated in the profiles of exploration lines 6 and 16. It can be seen that these positions are basically located in the areas with the highest burial depth in the goaf, at the core of the “anticline-type” ore body, with a maximum burial depth from 200 m to 300 m. The blue elliptical area delineated on # 12 is generally located at the top of the ore body, showing the relatively dense occurrence of microseismic events. The above two areas are the most concentrated areas of microseismic activity in the entire mine, and also the areas with the highest degree of stress concentration. This reminds us that the areas where future ground pressure activities and large-scale goaf collapses are most likely to occur in mines are highly likely to occur in this region. This is a key area for mine safety management.

2.3.2. Distribution of Stress in Mines

(1)
Mining disturbance stress transfer
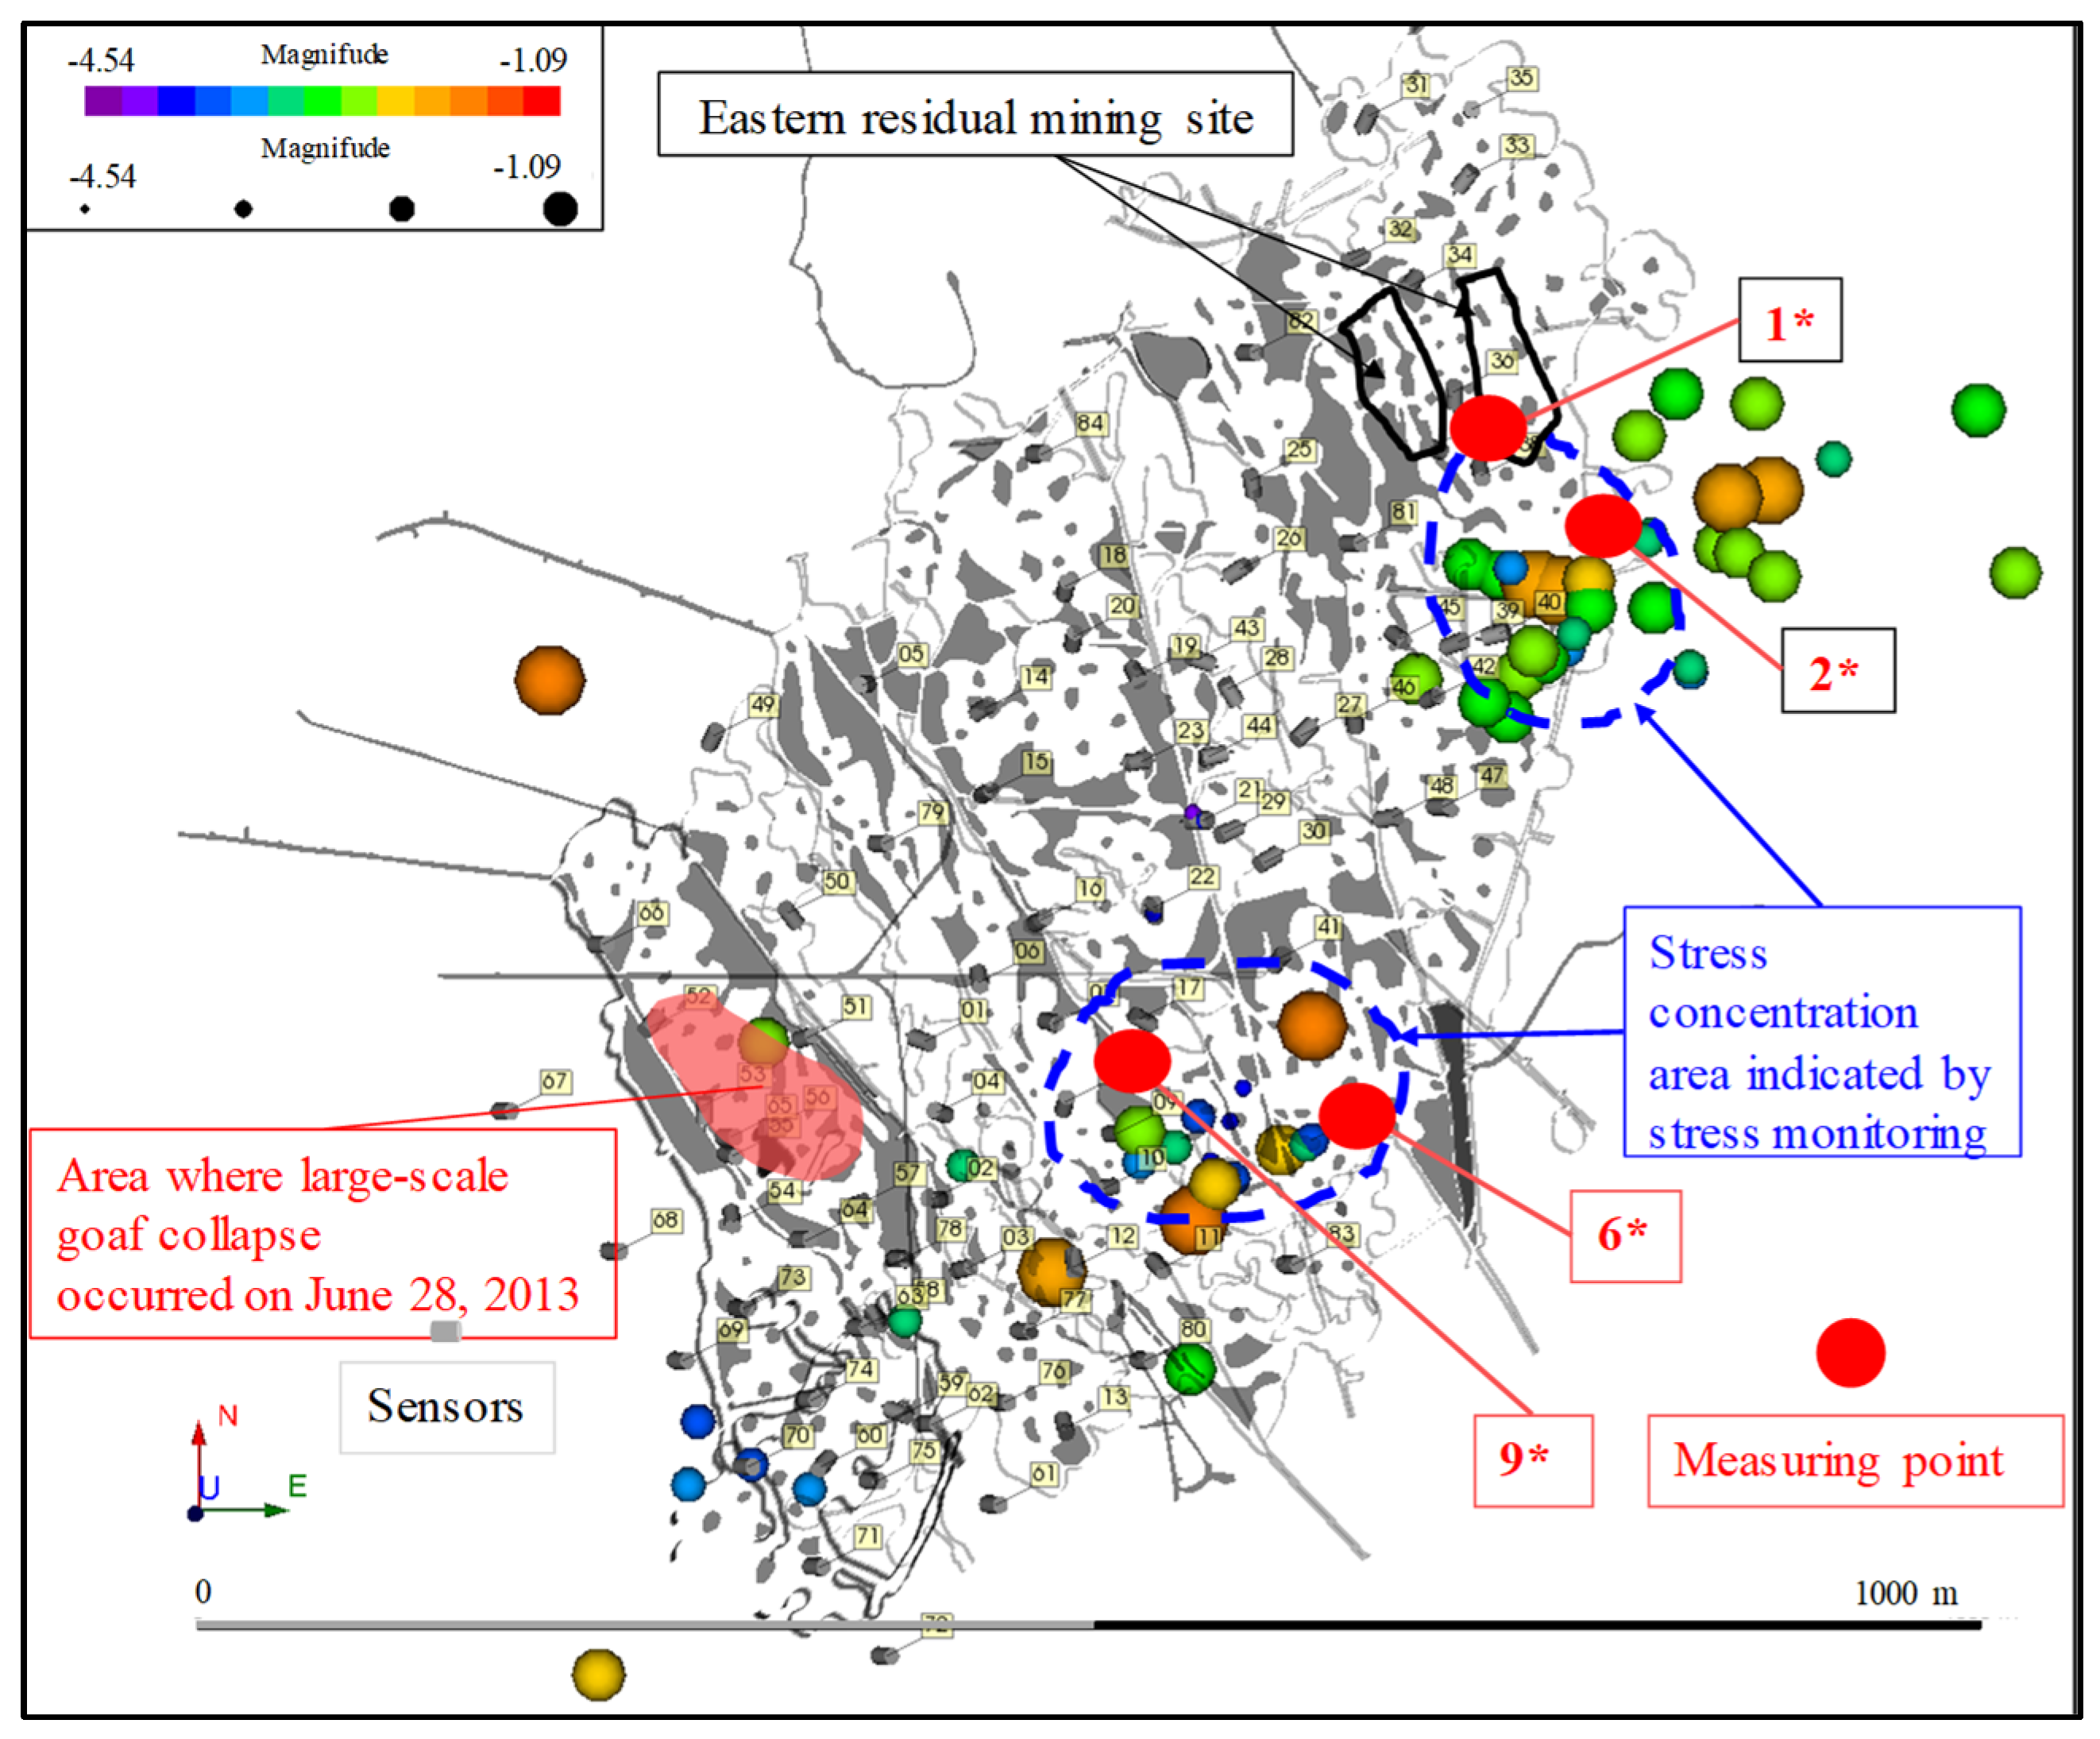
According to the analysis of the local underground stress monitoring results (as shown in Figure 4), the stress increase at measuring point 2 is the largest, with an increase of about 1.10 MPa. The degree of stress increase for 1 # and 9 # is slightly lower, with increases of 0.30 MPa and 0.34 MPa, respectively. The stress at measuring point 6 remains unchanged, with a slight decrease.
This indicates that there is a significant increase in stress in the western fourth mining area of the fifth pit mouth underground. The stress in mining areas 216, 585, and 126 has increased to a certain extent. The stress level at measuring point 9 is gradually stabilizing, while the stress levels at measuring points 1 and 2 are generally continuing to increase.
By comparing the mining area with the stress concentration area, it can be seen that the mining disturbance in the mining area has caused a certain degree of stress concentration in the surrounding area. Around the residual mining area, the stress of sensors 2 # and 1 # increased by 1.1 MPa and 0.3 MPa, respectively, which translates to an additional load of 110 tons and 30 tons per unit area on the ore pillar.
(2)
Overall stress transfer in the mine
After a large-scale collapse occurred in the goaf of the No. 4 wellhead in the eastern residual mining area on 28 June, the stress concentration area shown by stress monitoring highly matched the high-activity area of microseismic monitoring. These areas continue to experience small-scale ground pressure phenomena such as landslides, even after production restrictions in the eastern region, which verifies the reliability of the two monitoring methods.
The microseismic localization events mainly gather at the arch foot of the “anticline-type” ore body, indicating that the stress of the overlying rock strata has been transferred to and concentrated in this area after large-scale collapse. Therefore, the two mining areas currently mined using the room and pillar method should be identified as key areas for future ground pressure monitoring.

2.4. Analysis of Typical Ground Pressure Manifestation Cases

Through statistical analysis of typical ground pressure phenomena such as roof caving, there were 20 incidents of roof caving underground in 2017 and 2018. Among them, there were 9 incidents in 2017, with a roof collapse area of 60 square meters and the dropping of about 1000 tons of ore (in the 600 mining area). From May 2018 to the analysis deadline, there were a total of 12 typical phenomena. Among them, there were a total of 8 cases with microseismic precursor warning information and 4 cases without microseismic precursor warning information, with a microseismic omission rate of 33.4%. As shown in Table 1, there were 12 typical cases of ground pressure manifestation in 2018. Figure 5 shows typical on-site photos of ground pressure phenomena such as roof caving, pillar cracking, and sidewall peeling underground.

3. Ground Pressure Zoning Warning and Management

3.1. Partition Warning Method

3.1.1. Seismic Warning Value Zoning Impact Indicators

Due to the varying levels of microseismic activity, the distribution characteristics of goaf and pillars, the degree of disturbance caused by production operations, and engineering geological conditions in the mining areas of Xianglushan Tungsten Mine, using a unique microseismic warning value will affect the accuracy of ground pressure disaster warning. Therefore, we consider partitioning the warning values of different mining areas underground to improve the accuracy and reliability of ground pressure disaster monitoring and warning. After considering the various influencing factors comprehensively, three factors are used as zoning assessment indicators: the activity level of microseismic events, the stability level of the goaf roof, and the degree of disturbance caused by production operations. Furthermore, a microseismic warning scoring system and model were established, and the zoning results of underground microseismic warning values were provided.
(1)
Historical activity level of microseismic events
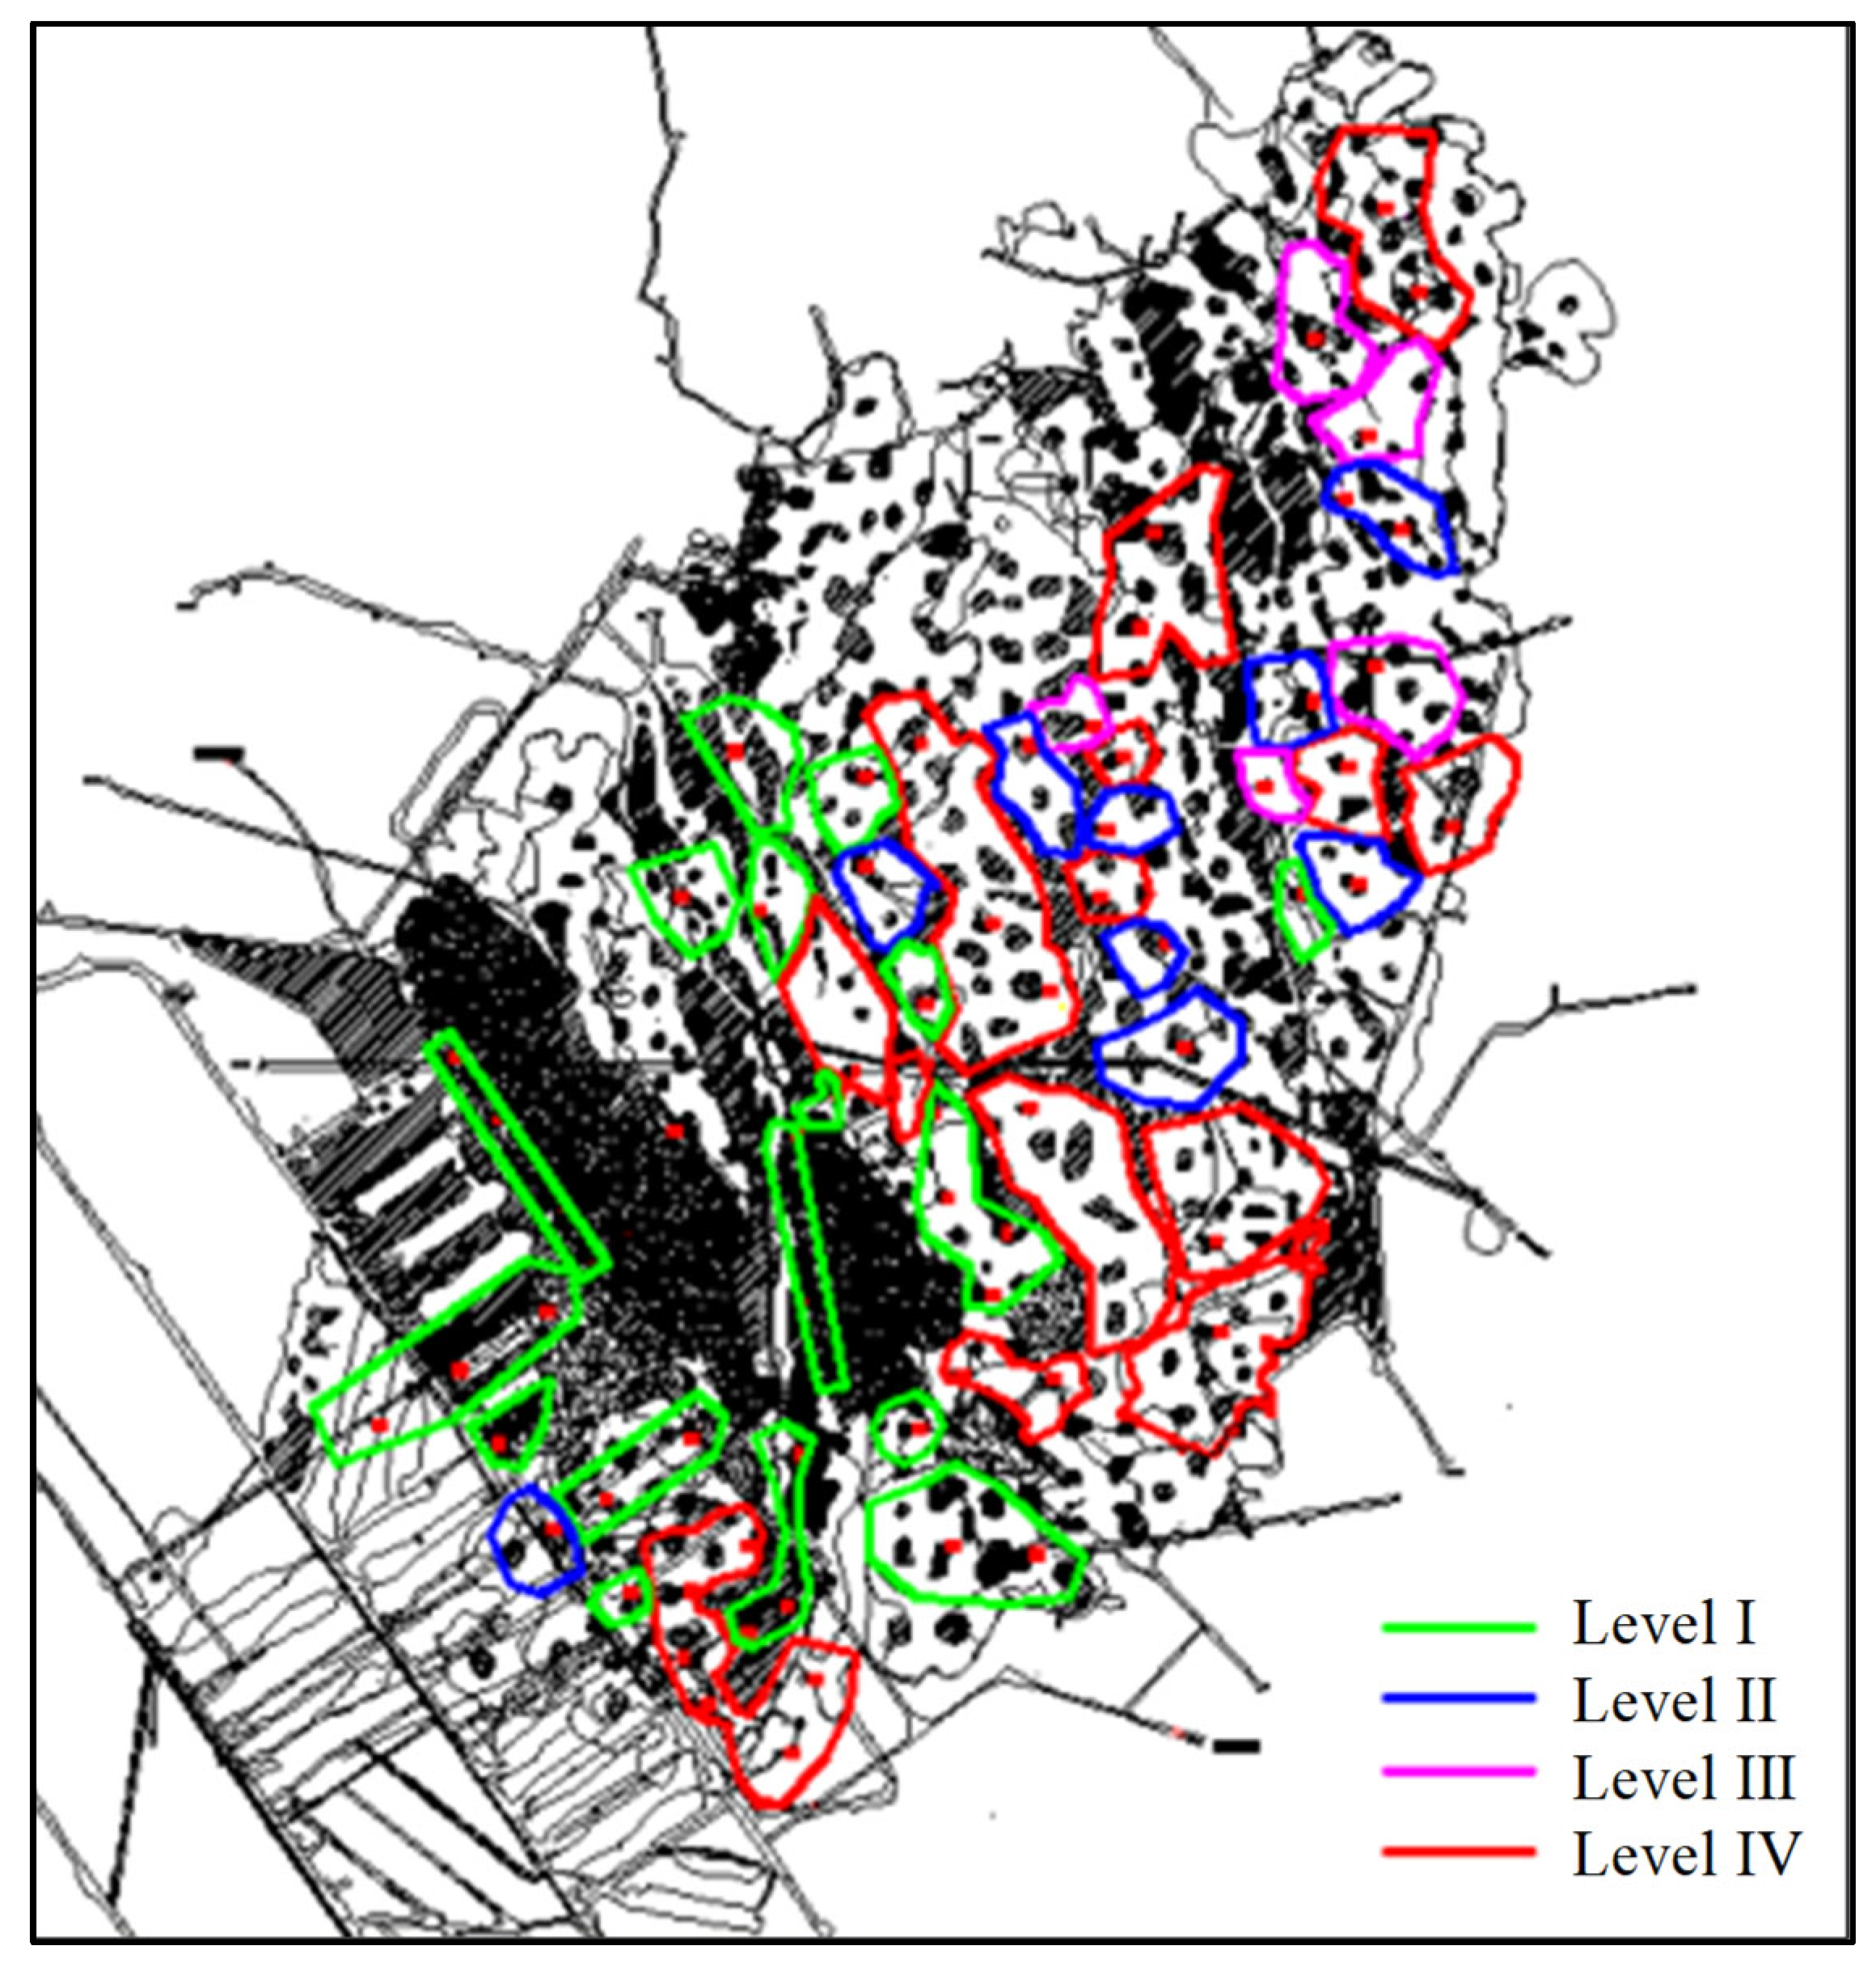
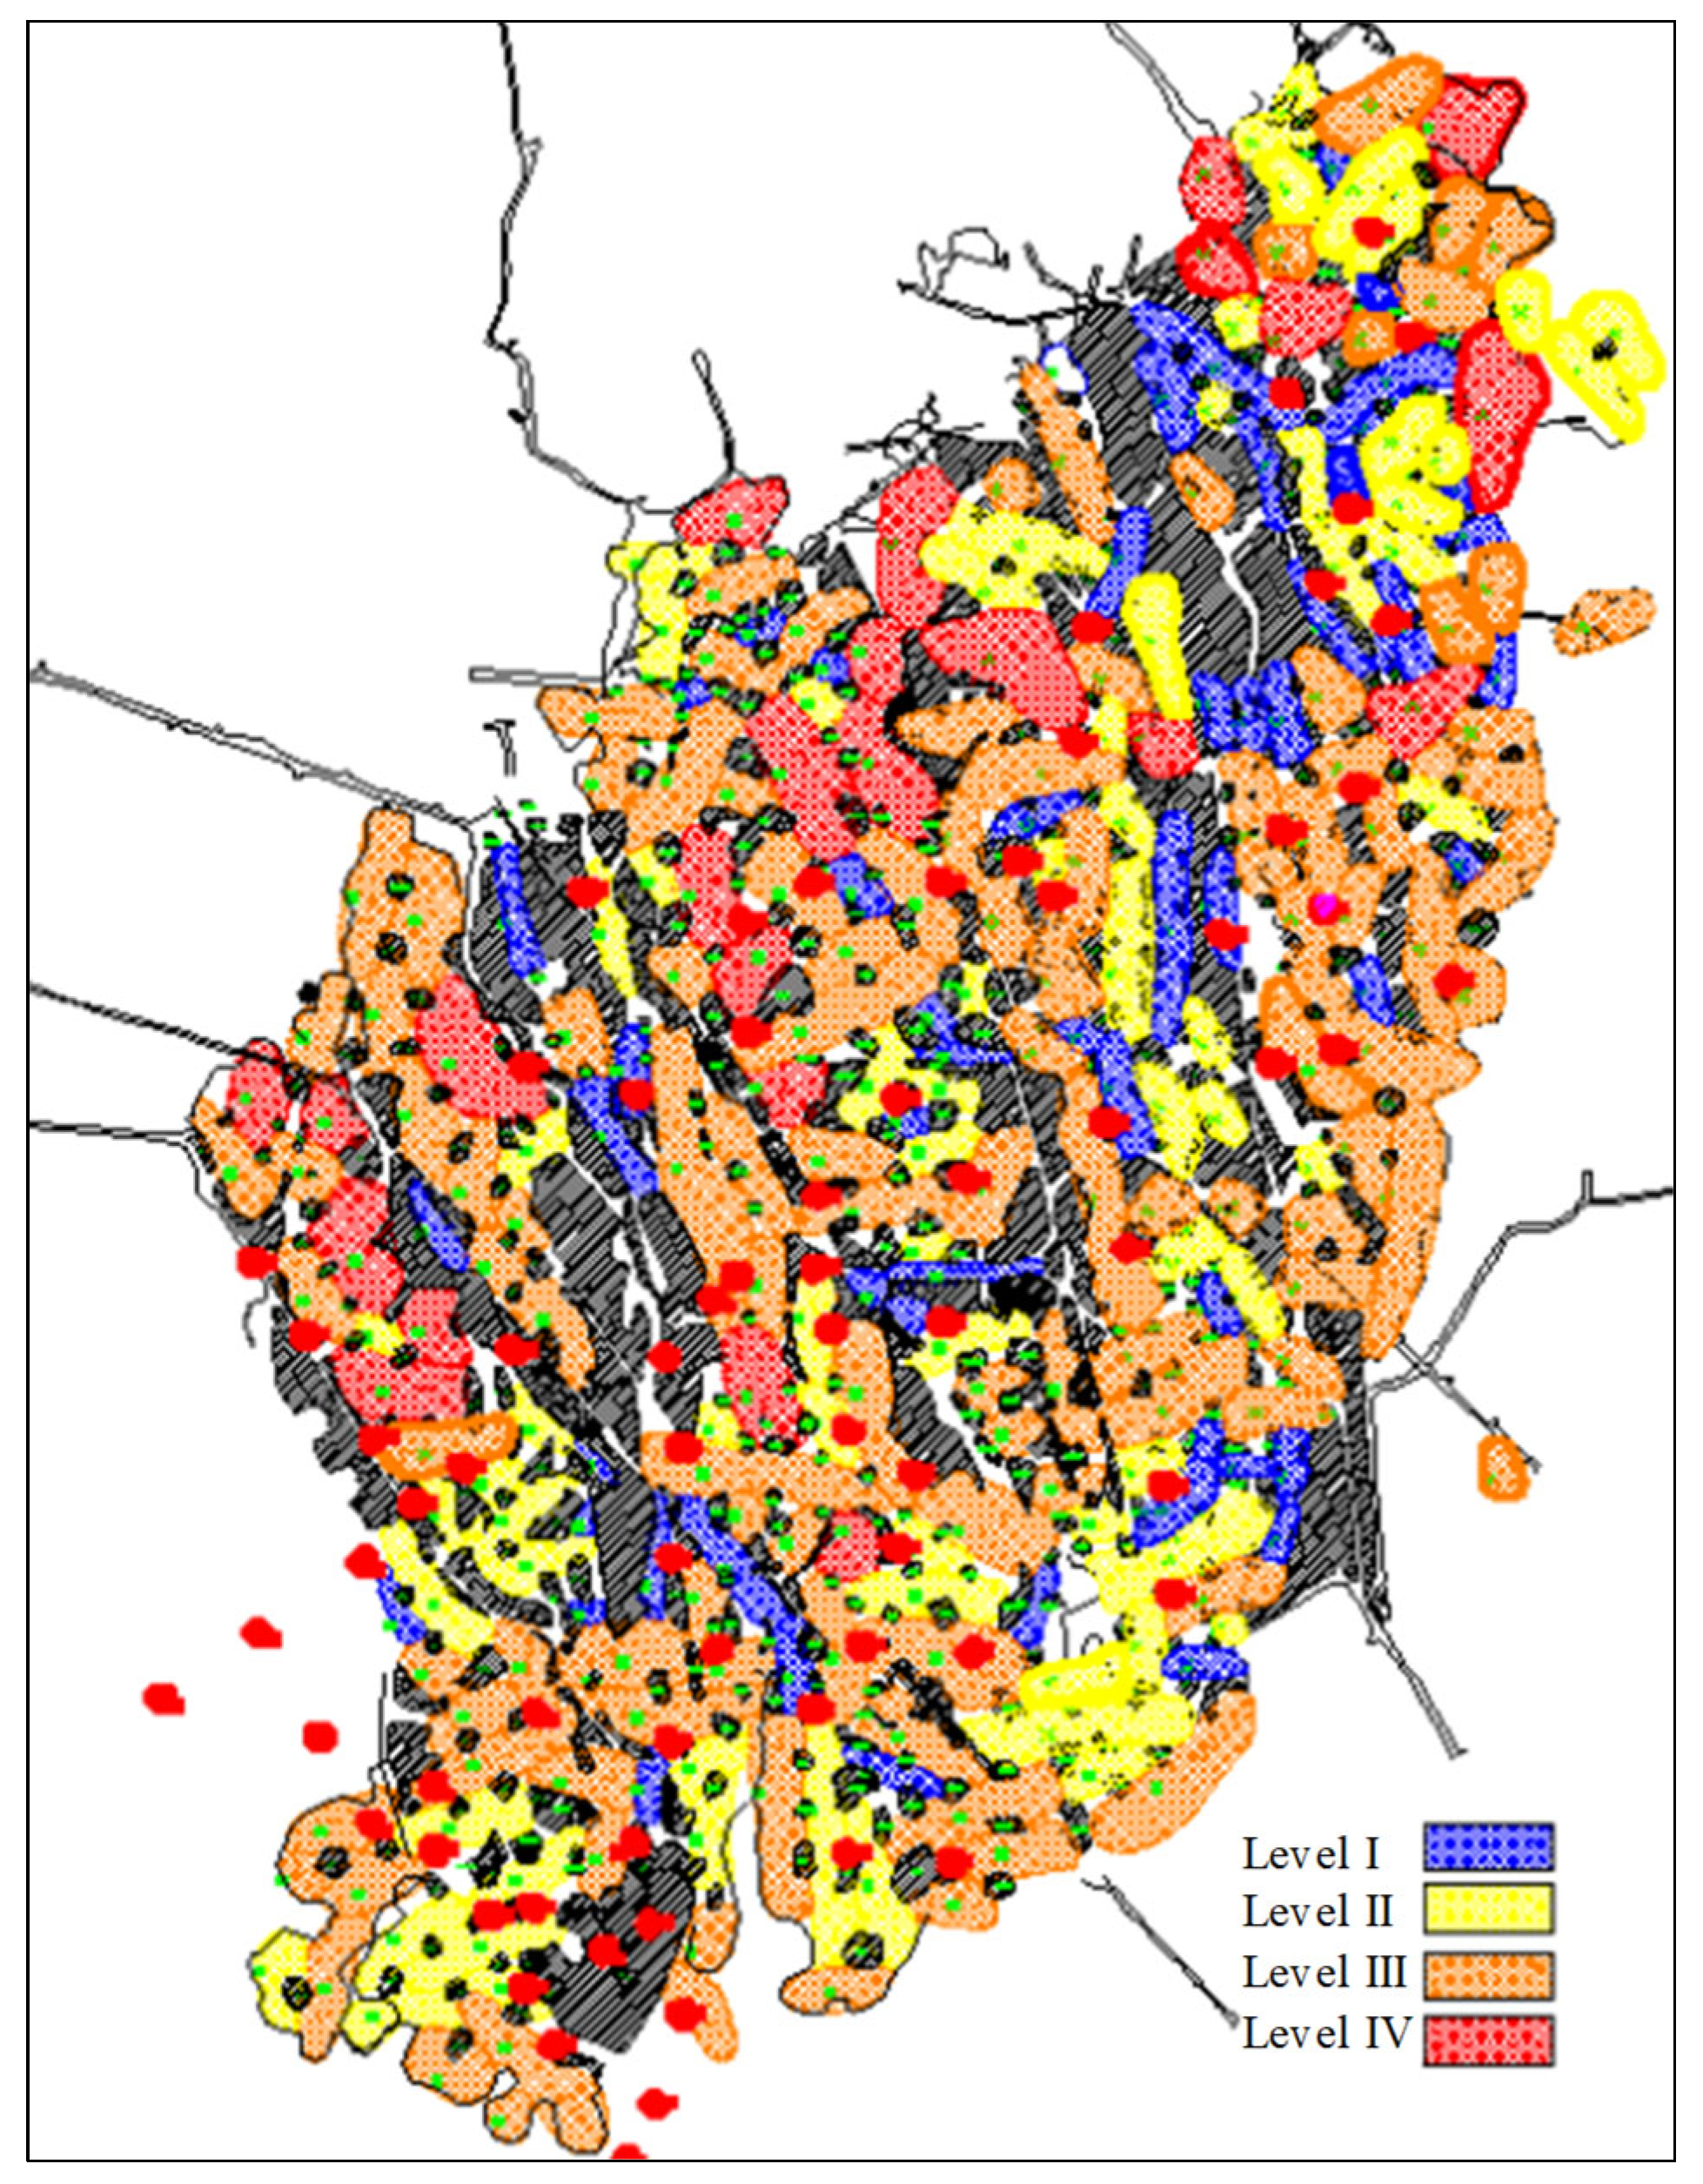
The activity level of microseismic events directly reflects the stability of the rock mass. Different stress states and stability levels in different mining areas can lead to varying levels of microseismic event activity in that region. Therefore, the activity level of historical microseismic events in the region is taken as the primary measure of microseismic warning values. According to years of microseismic monitoring data statistics, the activity level of microseismic events can be divided into four levels, as shown in Table 2. The positional relationship is shown in Figure 6.
(2)
Stability of goaf roof
The span of the goaf roof, the size of the exposed area, and the geological conditions of the roof engineering are also important factors affecting the activity level of microseismic events. Referring to the special demonstration report on the impact of ground pressure activities in mining goaf on safety production in the past, the stability of the roof is divided into four levels, and Table 3 is the reference standard for the classification of goaf stability.
(3)
The degree of disturbance caused by production operations
During the production process in the mining area, stress changes may occur in the area, which can easily lead to rock fracture and even instability during stress adjustment. Therefore, the disturbance caused by production operations is also a factor that should be considered in microseismic warning values.
Based on long-term data analysis and on-site engineering experience of the mine (Table 4), the degree of disturbance caused by production operations can be roughly divided into four levels, as shown in Figure 7.

3.1.2. Establishment of Zoning Model for Microseismic Warning Values

Based on the characteristics of ground pressure in Xianglushan tungsten mine, a microseismic warning value zoning model is established, as shown in Table 5, considering three warning value zoning impact indicators: microseismic event activity level, goaf roof stability, and production operation disturbance impact level.

3.1.3. Zoning Results of Underground Microseismic Warning Values

(1)
Zoning results of microseismic warning values without considering the impact of production operations
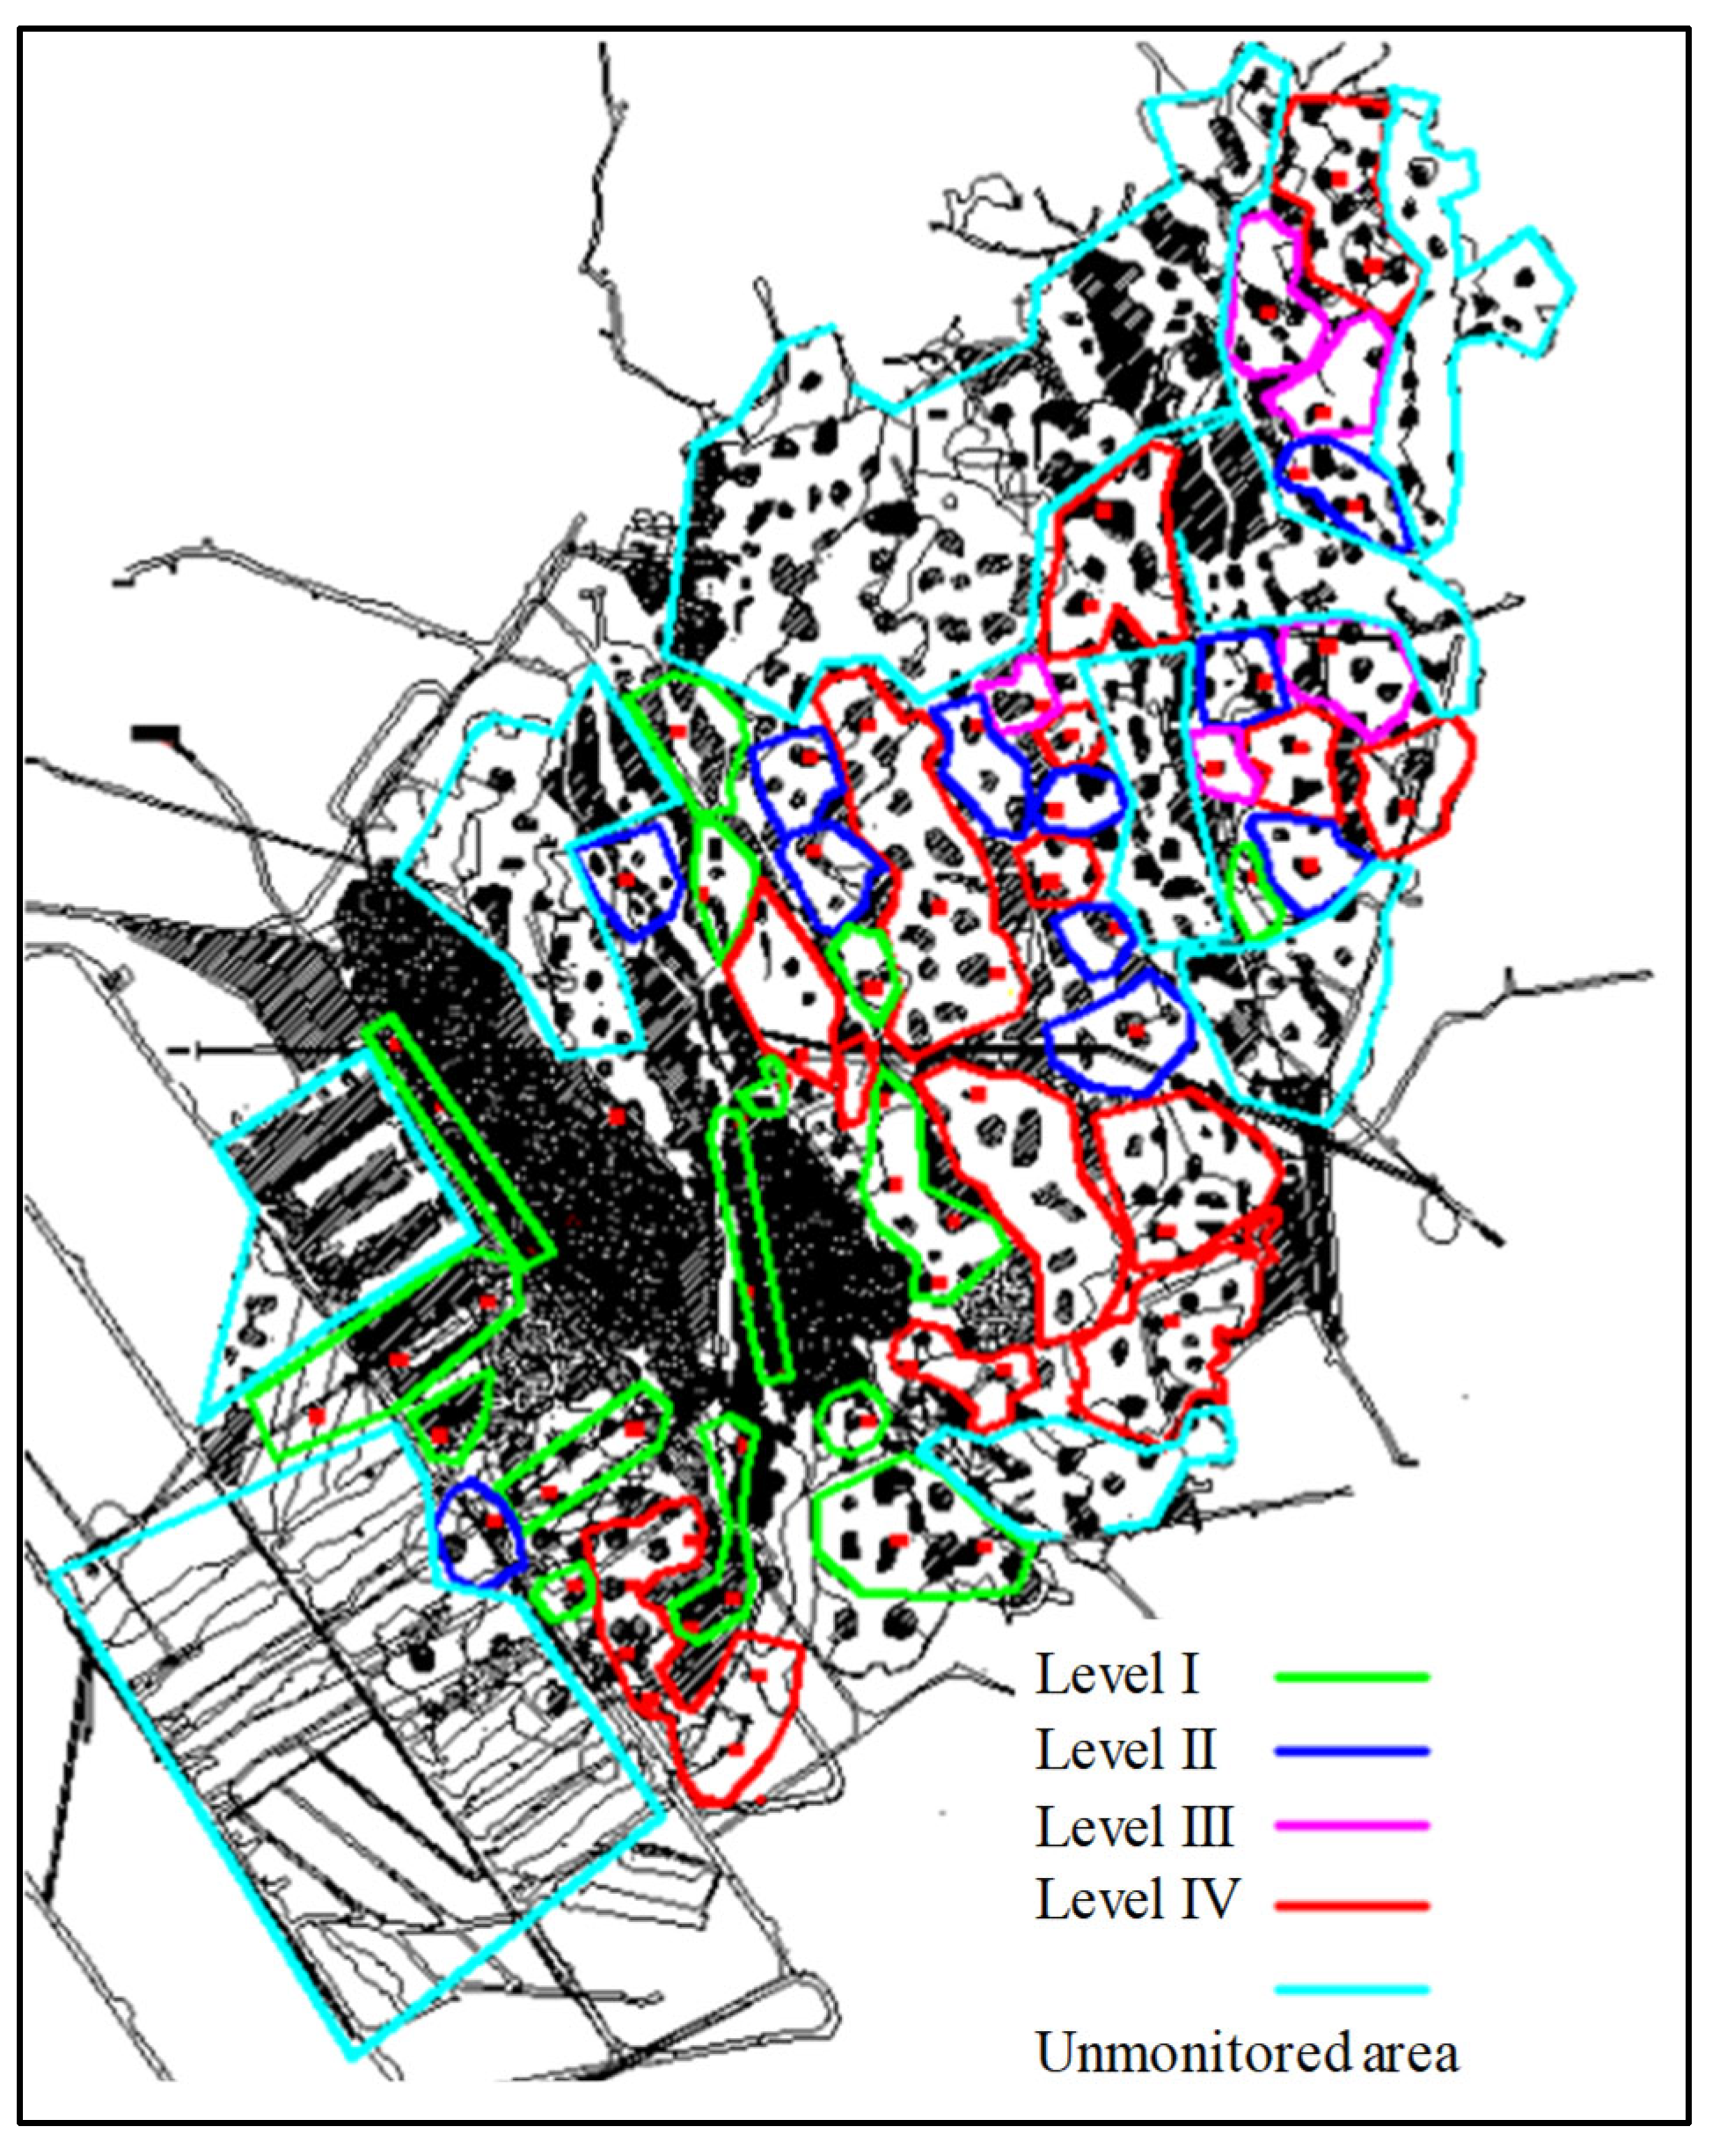
Due to the constantly changing location of underground production operations, as shown in Figure 8, the zoning results of microseismic warning values are obtained without considering the impact of production operation disturbances.
In addition, due to the large mining area underground and the limited number of microseismic sensors, it is impossible to monitor all areas; only key areas can be monitored. Therefore, there are still some unmonitored areas underground, which are temporarily not within the scope of this zoning exercise. Once production operations are carried out in these areas in the next step, sensors must be arranged for monitoring, and then zoning processing should be carried out according to the zoning processing method of this warning value.
(2)
Considering the zoning results of microseismic warning values under the influence of production operations
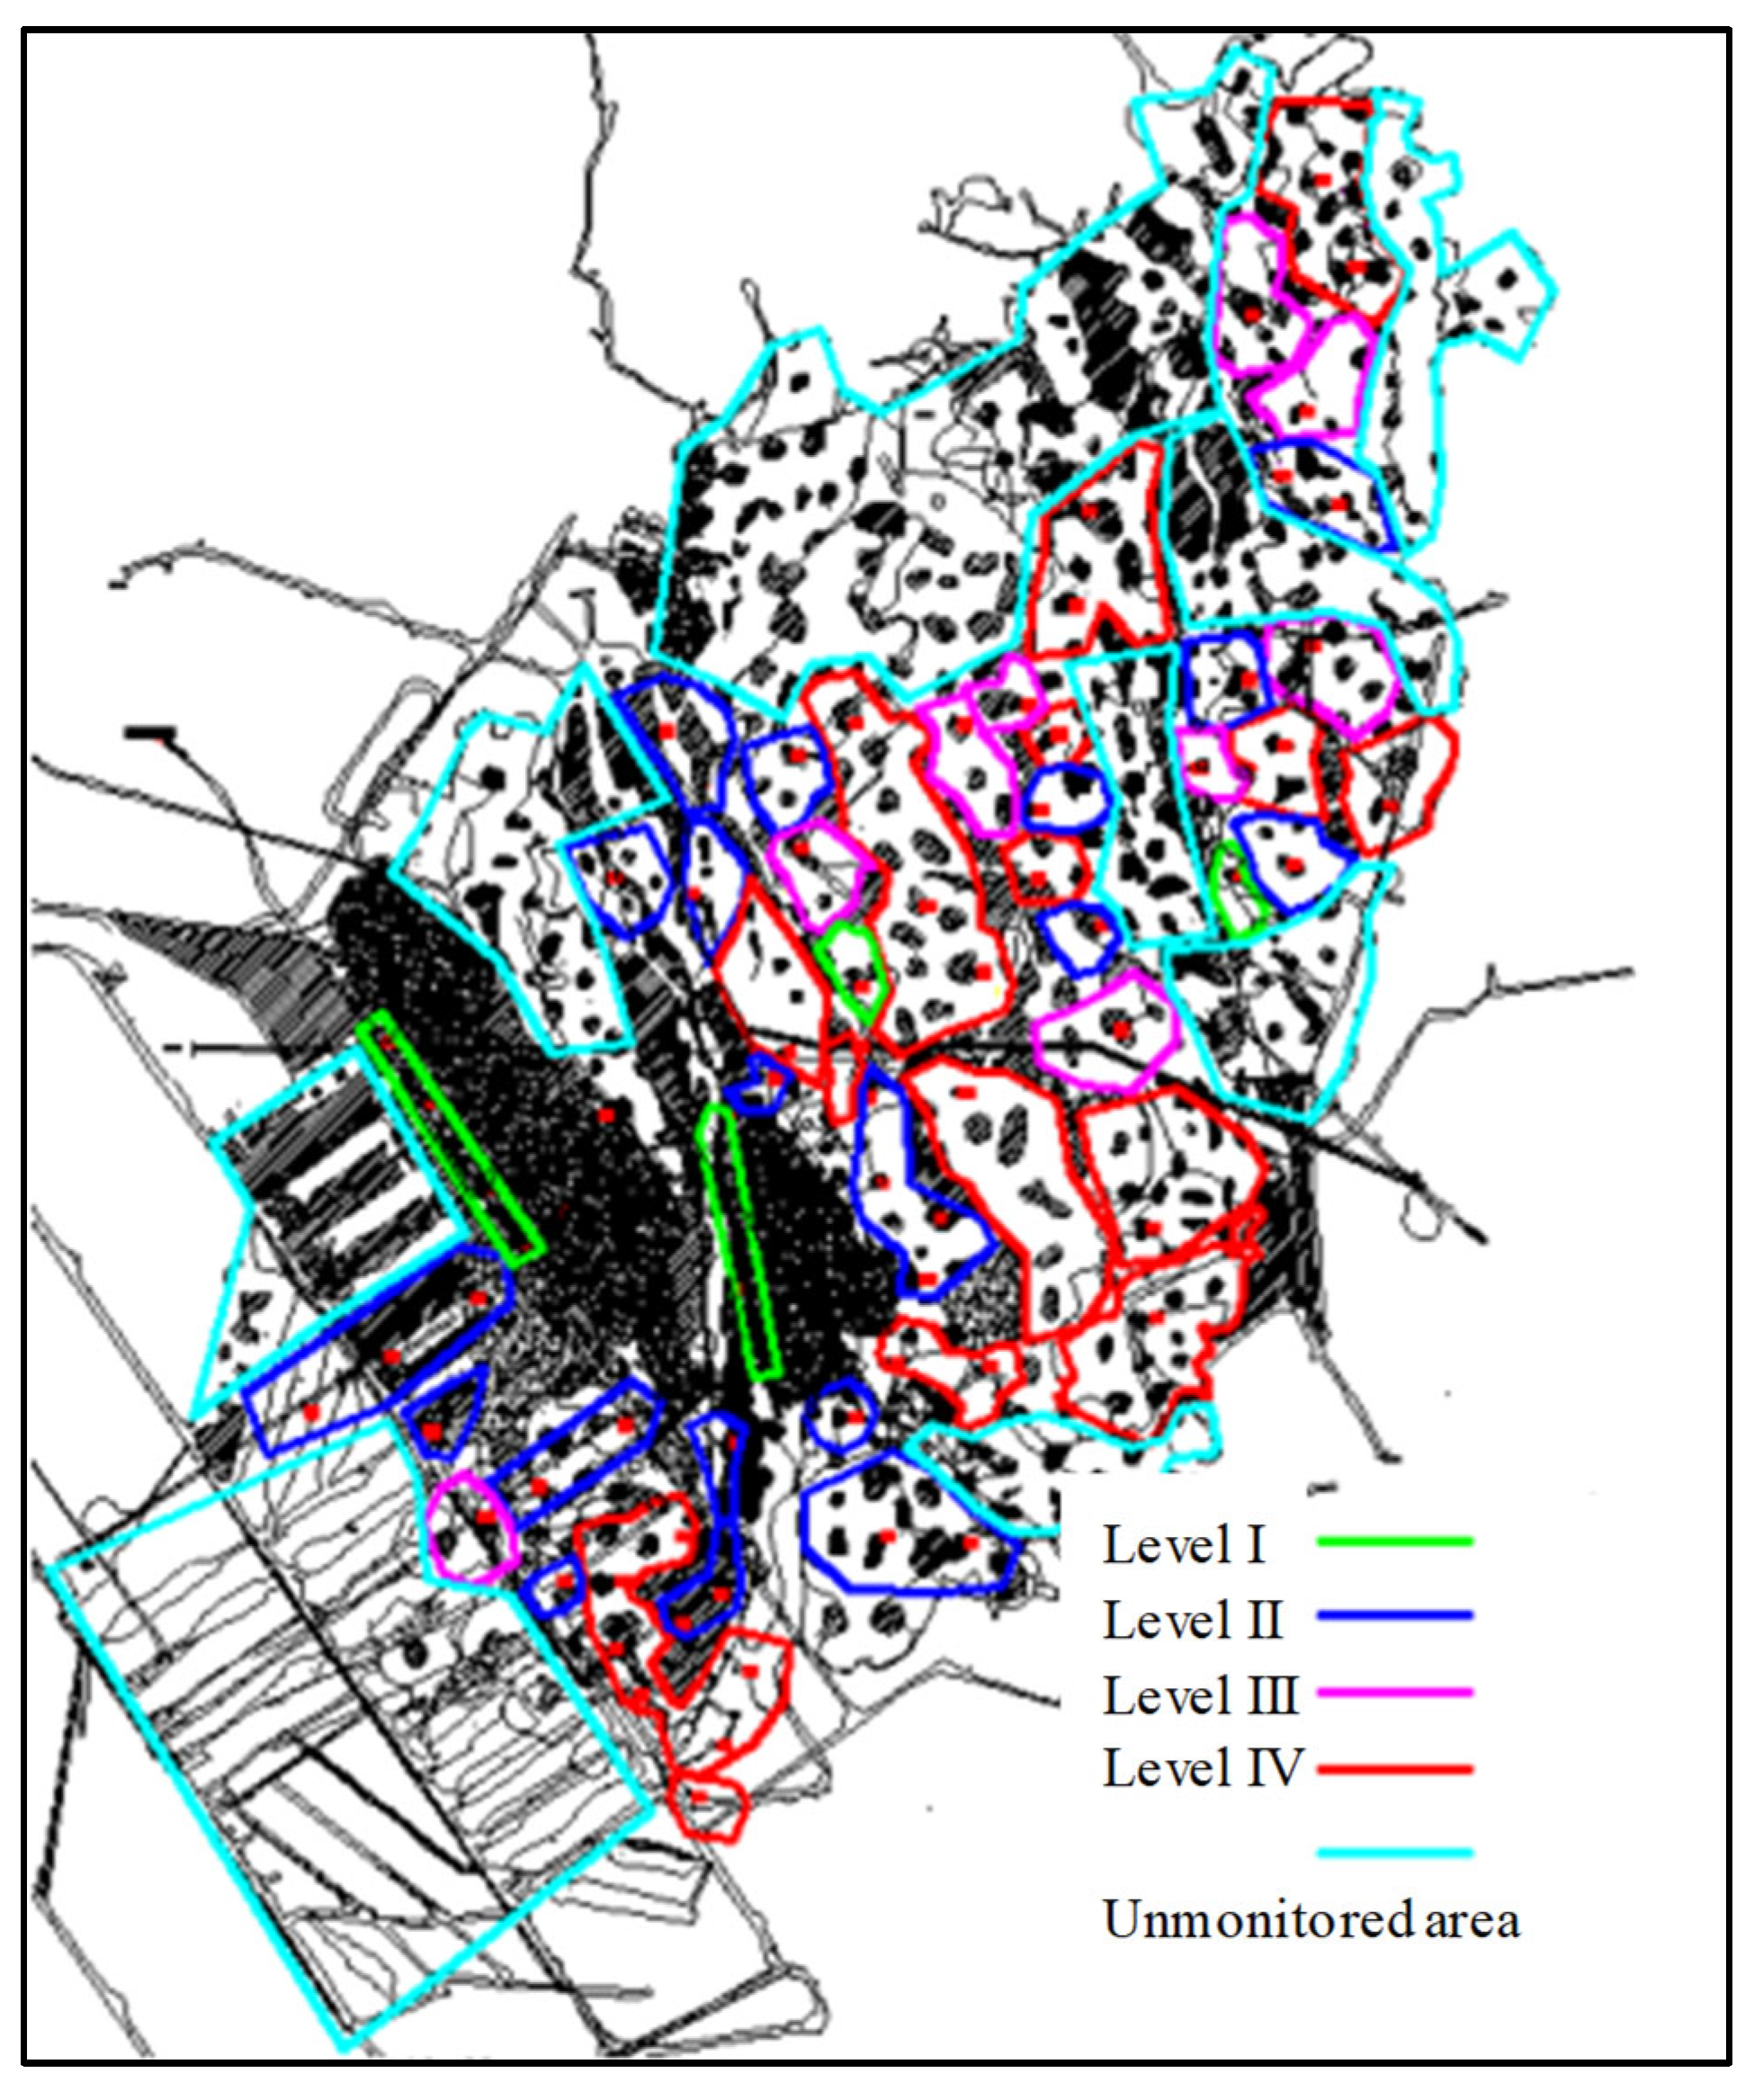
Taking the production operation situation in October 2013 as an example, consider the zoning processing of microseismic warning values under the influence of production operation disturbances. Figure 9 is the result of the degree of disturbance caused by production operations at the location of each sensor in October 2013. Consistent with the above, there are also unmonitored areas.

3.2. Warning of Ground Pressure Disasters

3.2.1. Issuance of Ground Pressure Disaster Warning Information

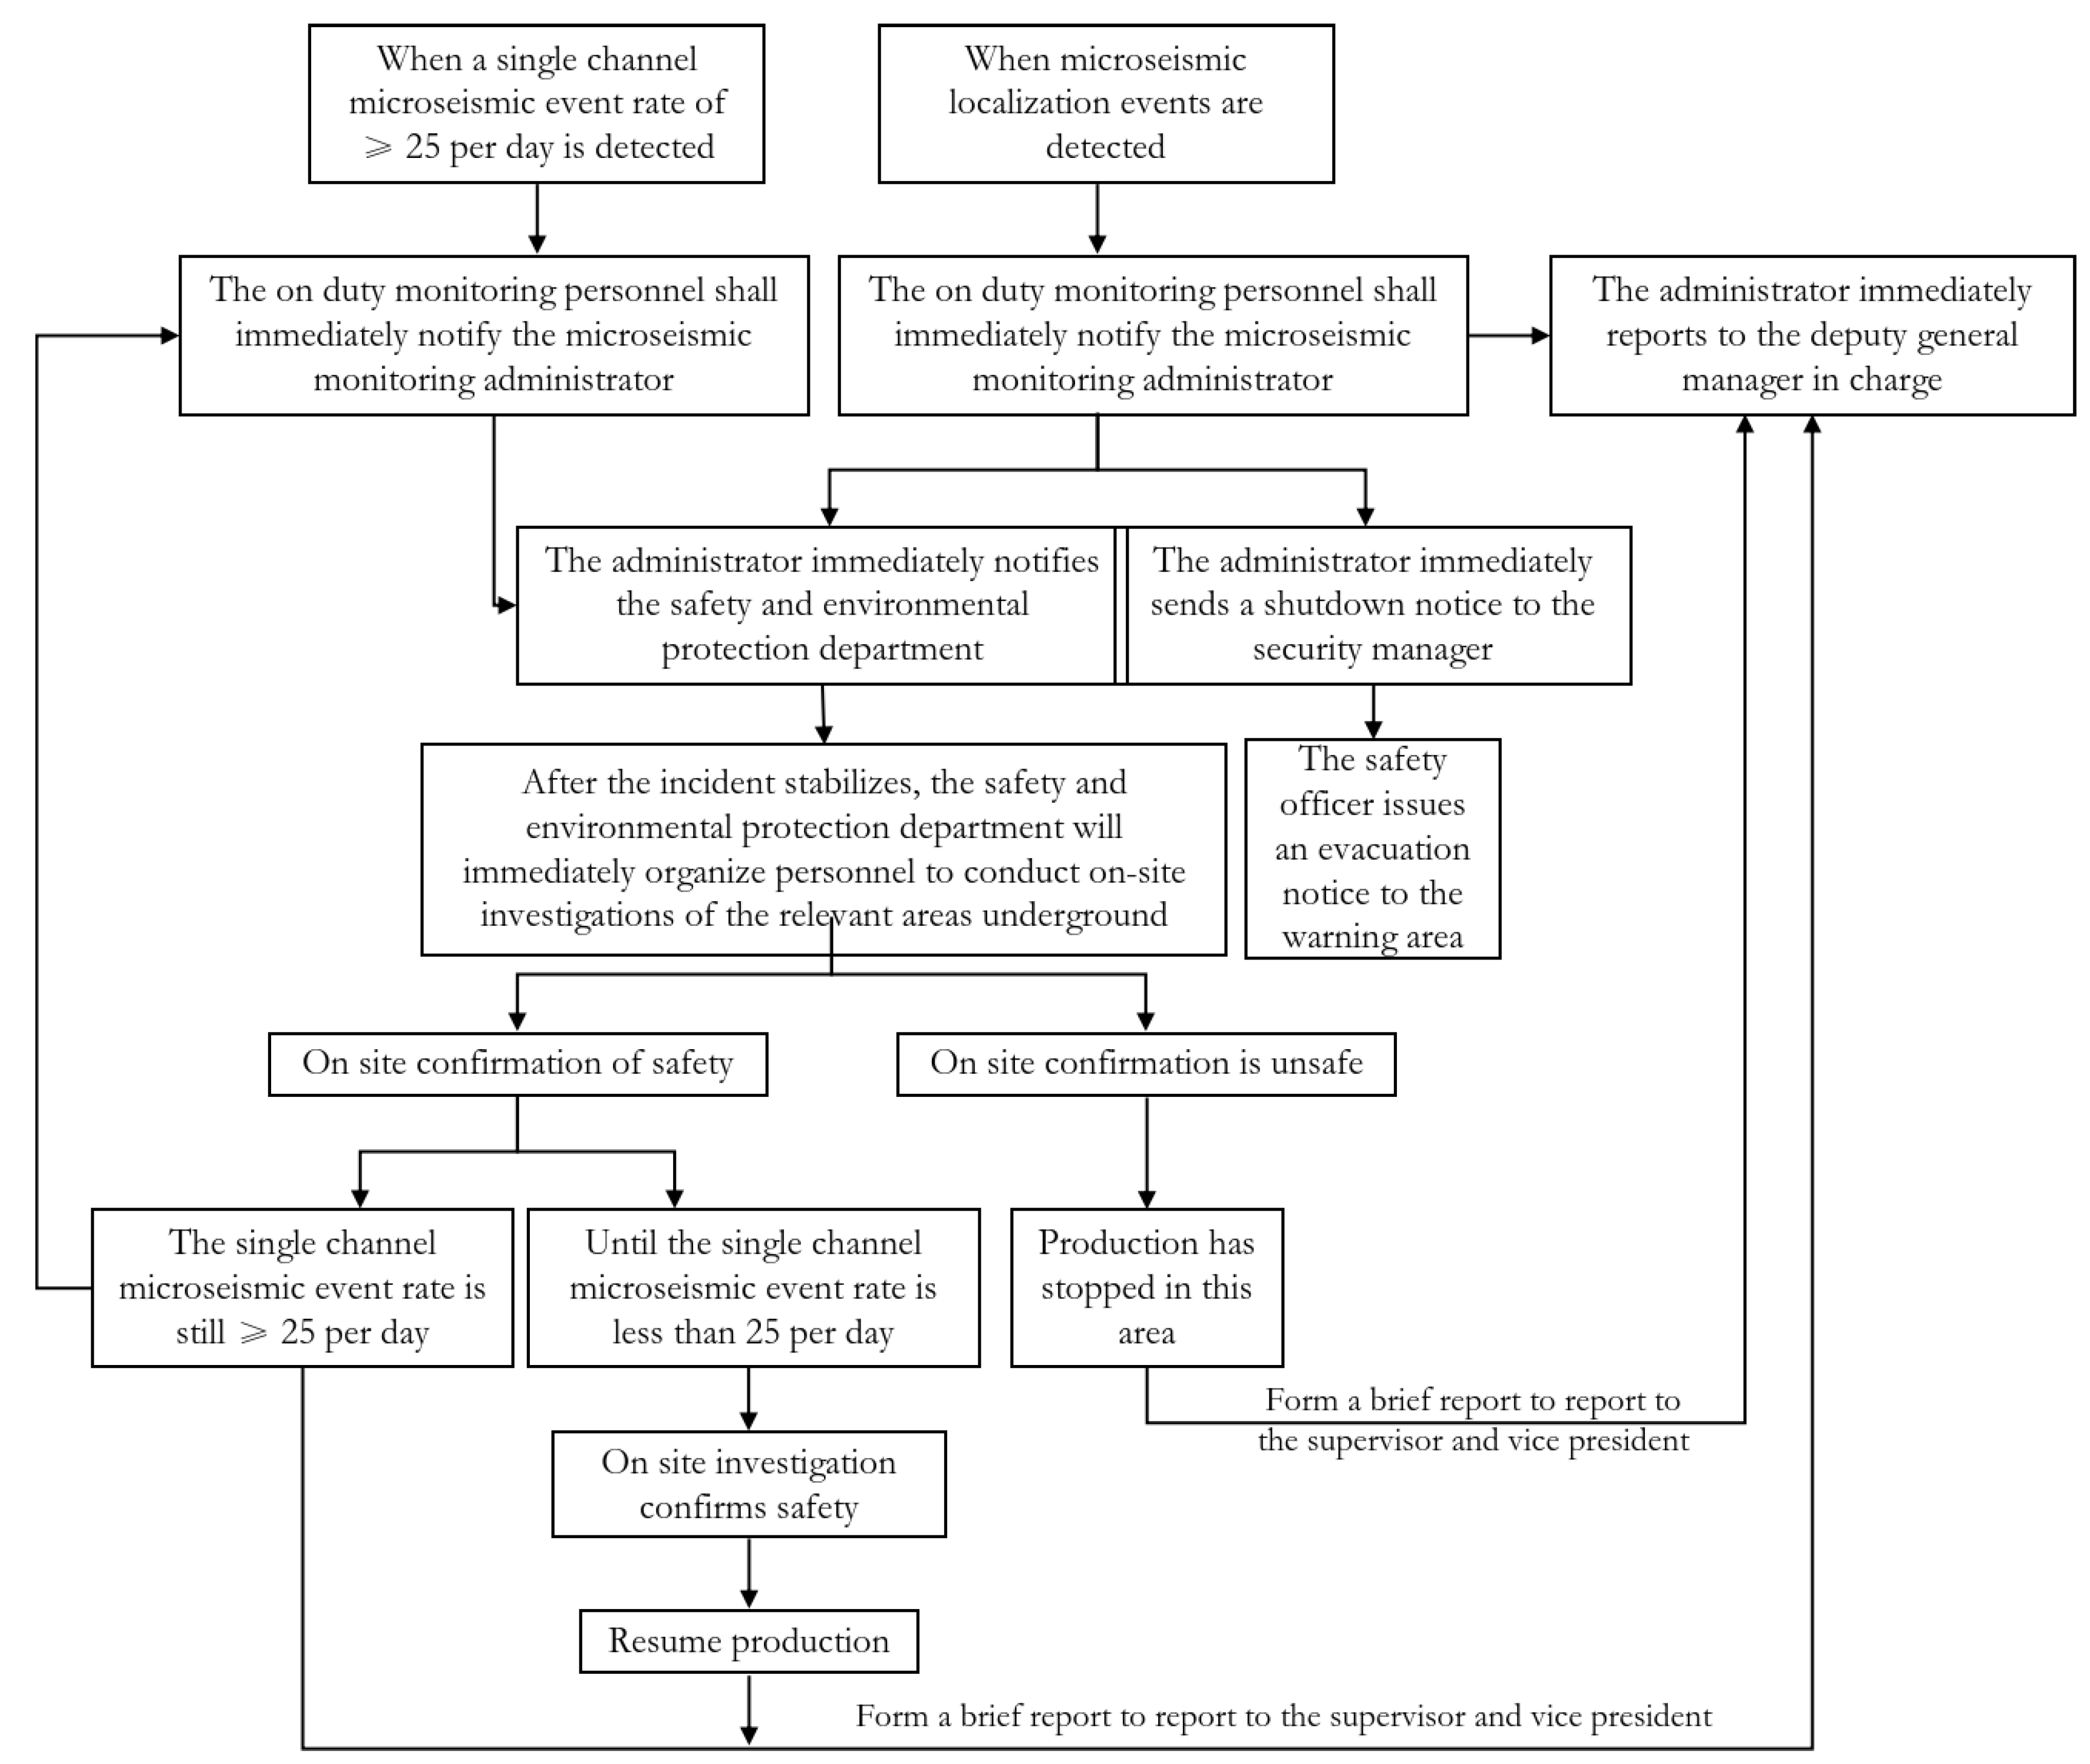
By using the Xianglushan microseismic monitoring system to monitor normal data, single-channel events and positioning events are recorded. Based on the theoretical methods of each parameter, the event rate ratio and energy ratio are calculated separately to locate the concentration of events. When at least one parameter meets the set partition warning value, ground pressure warning information is issued. It should be pointed out that these three parameters are not mandatory, as there may be a default parameter in a ground pressure disaster monitoring and warning. If the event cluster density cannot be calculated due to the small energy level of the event, spatial positioning cannot be implemented. Overall, this situation does not affect the above warning process. As long as one of the parameters meets the warning conditions, a ground pressure disaster warning message will be issued. The process of issuing warning information for ground pressure disasters in Xianglushan tungsten mine is shown in Figure 10.

3.2.2. Case Analysis: Ground Pressure Warning (64 Pcs)

Based on the existing detailed data, we have created a more comprehensive and informative classification summary table (Table 6). Double classification is based on “mining area/middle section” and “event type”. It is necessary to add a column for “risk level” and conduct post evaluation based on event frequency and description to make the visibility of the danger level in the area more intuitive; replace specific sensor numbers with “typical sensor response”; provide standardized descriptions of ‘follow-up measures’ and calculate the ‘regional blockade rate’; and retain the ‘success rate of early warning’ as the core performance indicator.
In 2018, a total of 64 warnings were issued, including 32 cases of warnings due to positioning events and 32 cases of warnings due to a single sensor’s daily event rate exceeding 25. Overall, the average warning period is 5.7 days. The above 64 warning cases occurred in 13 mining sites, with a success rate of 95.3%.

4. Conclusions

An analysis and study were conducted on the stability of goaf based on the recovery of residual ore bodies in mines. From the perspective of improving the utilization rate of mining resources and ensuring operational safety, we carried out the backfilling of residual ore bodies in the mine. By the rational mining of residual ore bodies, resource waste has been reduced, and the real-time evaluation and optimization of the stability of goaf have been carried out, indirectly preventing potential geological disasters. Research has shown that different mining schemes for different residual ore bodies have varying impacts on the stability of goaf areas. Proper scientific analysis and disaster warning of goaf areas are necessary to ensure the safety of mining operations.
This study established a coupled analysis method of “microseismic precursor stress path” for residual ore recovery, identifying the deterministic precursor of the critical slowing-down phenomenon of fractured pillars before large-scale ground pressure activity. The practicality of the warning mechanism constructed based on this is reflected in its universal framework: it is not only applicable to this mine, but its core indicators and criteria can also be adapted to different geological and mining conditions, providing a replicable and portable innovative methodology for disaster prevention and control in similar mines at home and abroad.
By combining 64 specific disaster cases, the accuracy of the disaster warning mechanism in this article has been comprehensively verified, providing reliable warning results for mines. These cases cover different types of damage, including rock mass dynamic disasters such as roof collapse and mining pillar support. Through in-depth analysis of microseismic monitoring data, different risk level areas were delineated based on the location, time, energy, and physical parameters of the time feedback source signal, as well as the volume and mass of the roof collapse event. Combined with the verification of the warning mechanism in the aforementioned small areas, the scope of regional warning was expanded, providing a reference basis for large-scale rock mass damage warning in different areas and enhancing the guarantee of mine safety.
At the same time, there are also some limitations: early warning systems depend on sensor network density; the phenomenon of underreporting exists (such as a underreporting rate of 33.4% in 2018); the inference ability of the model in unmonitored areas is limited; at present, it is only applicable to scenarios with geological and mining conditions similar to this mine.

Author Contributions

Methodology, C.L. and G.L.; Software, C.Z. and Y.H.; Resources, C.L.; Data curation, C.Z. and G.L.; Writing—original draft, C.L. and G.L.; Writing—review & editing, C.Z. and Y.H.; Visualization, G.L.; Project administration, C.Z. and Y.H.; Funding acquisition, C.L. and Y.H. All authors have read and agreed to the published version of the manuscript.

Funding

This research was funded by State Key Laboratory Special Programs of China Minmetals Corporation (2024GZKJ04) and National Natural Science Foundation of China grant numbers 52334003 and 52274249.

Institutional Review Board Statement

Not applicable.

Informed Consent Statement

Not applicable.

Data Availability Statement

The data presented in this study are available on request from the corresponding author. The data are not publicly available due to the specificity of mineral resources in the target mine.

Conflicts of Interest

Authors Chang Liu, Yinghua Huang and Guanying Lyu were employed by the company Changsha Institute of Mining Research Co., Ltd. The remaining authors declare that the research was conducted in the absence of any commercial or financial relationships that could be construed as a potential conflict of interest.

References

  1. Feng, X.-T.; Young, R.P.; Reyes-Montes, J.M.; Aydan, Ö.; Ishida, T.; Liu, J.-P.; Liu, H.-J. ISRM Suggested Method for In Situ Acoustic Emission Monitoring of the Fracturing Process in Rock Masses. Rock Mech. Rock Eng. 2019, 52, 1395–1414. [Google Scholar] [CrossRef]
  2. Zhou, Z.; Chen, L.; Cai, X.; Shen, B.; Zhou, J.; Du, K. Experimental Investigation of the Progressive Failure of Multiple Pillar-Roof System. Rock Mech. Rock Eng. 2018, 51, 1629–1636. [Google Scholar] [CrossRef]
  3. Zhou, Z.; Zhao, Y.; Jiang, Y.; Zou, Y.; Cai, X.; Li, D. Dynamic behavior of rock during its post failure stage in SHPB tests. Trans. Nonferrous Met. Soc. China 2017, 27, 184–196. [Google Scholar] [CrossRef]
  4. Cai, X.; Zhou, Z.; Tan, L.; Zang, H.; Song, Z. Water Saturation Effects on Thermal Infrared Radiation Features of Rock Materials During Deformation and Fracturing. Rock Mech. Rock Eng. 2020, 53, 4839–4856. [Google Scholar] [CrossRef]
  5. Wang, F.; Ren, Q.; Jiang, X.; Jiang, A.; Zhao, C.; Liu, W. Engineering geology and subsidence mechanism of a mountain surface in the Daliang Lead-zinc Ore Mine in China. Bull. Eng. Geol. Environ. 2022, 81, 488. [Google Scholar] [CrossRef]
  6. Yuan, Z.; Ban, X.; Han, F.; Zhang, X.; Yin, S.; Wang, Y. Integrated three-dimensional visualization and soft-sensing system for underground paste backfilling. Tunn. Undergr. Space Technol. 2022, 127, 104578. [Google Scholar] [CrossRef]
  7. Bednarczyk, Z. Identification of flysch landslide triggers using conventional and ‘nearly real-time’ monitoring methods—An example from the Carpathian Mountains, Poland. Eng. Geol. 2018, 244, 41–56. [Google Scholar] [CrossRef]
  8. Fuxing, J.; Genxi, Y.E.; Cunwen, W.; Dangyu, Z.; Yongqiang, G. Application of High-Precision Microseismic Monitoring Technique to Water Inrush Monitoring in Coal Mine. Chin. J. Rock Mech. Eng. 2008, 27, 1932–1938. [Google Scholar]
  9. Li, D.; Zhang, J.-F.; Wang, C.-W.; Jiang, F.-X. Propagation patterns of microseismic waves in rock strata during mining: An experimental study. Int. J. Miner. Metall. Mater. 2019, 26, 531–537. [Google Scholar] [CrossRef]
  10. Ling-hai, K.; Fu-xing, J.; Jie, L.I.U.; Gen-xi, Y.E.; Cun-wen, W.; Guang-dong, S. High-precision microseismic monitoring system to reasonable width of segment coal pillar in extra-thick coal seam fully mechanized top-coal caving mining. J. China Coal Soc. 2009, 34, 871–874. [Google Scholar]
  11. Qiao, S.; Zhang, Q.; Zhang, Q. Mine Fracturing Monitoring Analysis Based on High-Precision Distributed Wireless Microseismic Acquisition Station. IEEE Access 2019, 7, 147215–147223. [Google Scholar] [CrossRef]
  12. Zhou, Z.; Zhao, C.; Huang, Y. An Optimization Method for the Station Layout of a Microseismic Monitoring System in Underground Mine Engineering. Sensors 2022, 22, 4775. [Google Scholar] [CrossRef]
  13. Zhang, X.; Lin, J.; Chen, Z.; Sun, F.; Zhu, X.; Fang, G. An Efficient Neural-Network-Based Microseismic Monitoring Platform for Hydraulic Fracture on an Edge Computing Architecture. Sensors 2018, 18, 1828. [Google Scholar] [CrossRef]
  14. Dip, A.C.; Giroux, B.; Gloaguen, E. Microseismic monitoring of rockbursts with the ensemble Kalman filter. Near Surf. Geophys. 2021, 19, 429–445. [Google Scholar] [CrossRef]
  15. Ma, K.; Tang, C.-A.; Xu, N.-W.; Liu, F.; Xu, J.-W. Failure precursor of surrounding rock mass around cross tunnel in high-steep rock slope. J. Cent. South Univ. 2013, 20, 207–217. [Google Scholar] [CrossRef]
  16. Xu, N.; Tang, C.a.; Zhou, Z.; Sha, C.; Liang, Z. Stability Analysis of Hydraulic Rock Slope Based on Three-Dimensional Numerical Simulation and Microseismic Monitoring. Chin. J. Rock Mech. Eng. 2013, 32, 1373–1381. [Google Scholar]
  17. Mercerat, E.D.; Driad-Lebeau, L.; Bernard, P. Induced Seismicity Monitoring of an Underground Salt Cavern Prone to Collapse. Pure Appl. Geophys. 2010, 167, 5–25. [Google Scholar] [CrossRef]
  18. Occhiena, C.; Coviello, V.; Arattano, M.; Chiarle, M.; di Cella, U.M.; Pirulli, M.; Pogliotti, P.; Scavia, C. Analysis of microseismic signals and temperature recordings for rock slope stability investigations in high mountain areas. Nat. Hazards Earth Syst. Sci. 2012, 12, 2283–2298. [Google Scholar] [CrossRef]
  19. Siddhamshetty, P.K. Modeling of Hydraulic Fracturing and Design of Online Optimal Pumping Schedule for Enhanced Productivity in Shale Formations. Ph.D. Thesis, Texas A&M University, College Station, TX, USA, 2020. [Google Scholar]
  20. Zhai, J.; Wang, Q.; Yuan, D.; Zhang, W.; Wang, H.; Xie, X.; Shahrour, I. Clogging Risk Early Warning for Slurry Shield Tunneling in Mixed Mudstone-Gravel Ground: A Real-Time Self-Updating Machine Learning Approach. Sustainability 2022, 14, 1368. [Google Scholar] [CrossRef]
  21. Wang, X.Y.; Ma, Z.; Zhang, Y.T. Research on Safety Early Warning Standard of Large-Scale Underground Utility Tunnel in Ground Fissure Active Period. Front. Earth Sci. 2022, 10, 828477. [Google Scholar] [CrossRef]
  22. Kuldeev, E.I.; Rysbekov, K.B.; Donenbayeva, N.S.; Miletenko, N.A. Modern Methods of Geotechnic—Effective Way of Providing Industrial Safety in Mines. Eurasian Min. 2021, 2, 18–21. [Google Scholar] [CrossRef]
  23. Zhang, P.; Chen, R.-P.; Wu, H.-N.; Liu, Y. Ground settlement induced by tunneling crossing interface of water-bearing mixed ground: A lesson from Changsha, China. Tunn. Undergr. Space Technol. 2020, 96, 103224. [Google Scholar] [CrossRef]
  24. Lebert, F.; Bernardie, S.; Mainsant, G. Hydroacoustic monitoring of a salt cavity: An analysis of precursory events of the collapse. Nat. Hazards Earth Syst. Sci. 2011, 11, 2663–2675. [Google Scholar] [CrossRef]
  25. Liu, J.-P.; Si, Y.-T.; Wei, D.-C.; Shi, H.-X.; Wang, R. Developments and prospects of microseismic monitoring technology in underground metal mines in China. J. Cent. South Univ. 2021, 28, 3074–3098. [Google Scholar] [CrossRef]
  26. He, M.; Wang, Q.; Wu, Q. Innovation and future of mining rock mechanics. J. Rock Mech. Geotech. Eng. 2021, 13, 1–21. [Google Scholar] [CrossRef]
  27. Wang, Y.; Zheng, G.; Wang, X. Development and application of a goaf-safety monitoring system using multi-sensor information fusion. Tunn. Undergr. Space Technol. 2019, 94, 103112. [Google Scholar] [CrossRef]
  28. Song, D.; He, X.; Qiu, L.; Zhao, Y.; Cheng, X.; Wang, A. Study on real time dynamic monitoring and early warning technology of regional and local outburst danger. Coal Sci. Technol. 2021, 49, 110–119. [Google Scholar]
  29. Dou, L.; Cai, W.; Cao, A.; Guo, W. Comprehensive early warning of rock burst utilizing microseismic multi-parameter indices. Int. J. Min. Sci. Technol. 2018, 28, 767–774. [Google Scholar] [CrossRef]
  30. Zeng, Q.; Zhu, S.; Li, Z.; Wu, A.; Wang, M.; Su, Y.; Wang, S.; Qu, X.; Feng, M. Research on Real-Time Monitoring and Warning Technology for Multi-Parameter Underground Debris Flow. Sustainability 2023, 15, 15006. [Google Scholar] [CrossRef]
  31. He, S.; He, X.; Song, D.; Li, Z.; Chen, J.; Xue, Y.; Li, Y. Multi-parameter integrated early warning model and an intelligent identification cloud platform of rockburst. J. China Univ. Min. Technol. 2022, 51, 850–862. [Google Scholar]
  32. Indukala, P.K.; Gosh, U.G.; Ramesh, M.V. IoT-Driven Microseismic Sensing System and Monitoring Platform for Landslide Detection. IEEE Access 2024, 12, 97787–97805. [Google Scholar] [CrossRef]
  33. Li, J.; Stankovic, L.; Pytharouli, S.; Stankovic, V. Automated Platform for Microseismic Signal Analysis: Denoising, Detection, and Classification in Slope Stability Studies. IEEE Trans. Geosci. Remote Sens. 2021, 59, 7996–8006. [Google Scholar] [CrossRef]
  34. Li, T.; Xu, W.; Ma, C.; Zhang, H.; Zhang, Y.; Dai, K. Research of technology and system of tunnel microseismic monitoring and rockburst early warning based on deep learning. Chin. J. Rock Mech. Eng. 2024, 43, 1041–1063. [Google Scholar]
  35. Jiang, F.; Miao, X.; Wang, C.; Song, J.; Deng, J.; Meng, F. Predicting research and practice of tectonic-controlled coal burst by microseismic monitoring. J. China Coal Soc. 2010, 35, 900–903. [Google Scholar]
  36. Wei, Q.; Jiang, F.; Yao, S.; Wei, X.; Shu, C.; Hao, Q. Real-time monitoring and early warning of rock burst risk in dip coal pillar area of extra-thick coal seam. J. Min. Saf. Eng. 2015, 32, 530–536. [Google Scholar]
  37. Dou, L.; Feng, L.; Cai, W.; Wang, H.; He, H.; Jiao, B.; Zhang, M. Seismo-acoustic precursor identification and comprehensive warning model for the catastrophic failure process of coal and rock. J. Min. Saf. Eng. 2020, 37, 960–968. [Google Scholar]
  38. Qin, M.; Liu, C. Analysis of Early Warning Parameters for Ground Pressure Disaster Based on Microseismic Monitoring. Min. Metall. Eng. 2022, 42, 35–40. [Google Scholar]
  39. Zhou, Z.; Huang, Y.; Zhao, C. Microseismic Monitoring and Disaster Warning via Mining and Filling Processes of Residual Hazardous Ore Bodies. Minerals 2024, 14, 948. [Google Scholar] [CrossRef]
  40. Ayad, A.; Bakkali, S. Economic impact of derangements on mining process—Case study: Sidi Chennane. J. Min. Environ. 2022, 13, 989–996. [Google Scholar] [CrossRef]
  41. Zhou, Z.; Huang, Y.; Zhao, C. Distribution Law of Mine Ground Pressure via a Microseismic Sensor System. Minerals 2023, 13, 649. [Google Scholar] [CrossRef]
Figure 1. Project overview. (a) Mine location. (b) Orebody occurrence. (c) Goaf. (d) Pillar (Red collapse area).
Applsci 15 11172 g001
Figure 2. Spatial distribution map of all microseismic positioning events underground from 2013 to 2018 (annotation ① top view; ② The “#” symbol combined with the black line collectively represents the exploration line; ③ Spheres of different colors and sizes represent the strength of energy in microseismic events).
Applsci 15 11172 g002
Figure 3. Distribution of microseismic monitoring events and their concentration bands and their relationship with the location of major ground pressure manifestation points (see Reference [40], Figure 7). (annotation ① top view; ② The “#” symbol combined with the black line collectively represents the exploration line; ③ Spheres of different colors and sizes represent the strength of energy in microseismic events).
Applsci 15 11172 g003
Figure 4. Regional distribution of stress transfer and concentration after large-scale collapse events (See Reference [40], Figure 8). (This “*” represents the suffix of the destruction point number, which is a common usage in China).
Applsci 15 11172 g004
Figure 5. Typical cases of various underground ground pressure manifestations: (a) pillar cracking and roof caving, (b) after the item board appears, (c) the collapsed rock mass, (d) pillar cracking, (e) pillar spalling rib and falling. (The red dashed line represents the damaged area).
Applsci 15 11172 g005
Figure 6. Distribution map of microseismic event activity level.
Applsci 15 11172 g006
Figure 7. Distribution map of stability classification of goaf in mining area. (Green represents regular and online monitoring points, while red represents damaged or repaired pillars).
Applsci 15 11172 g007
Figure 8. Distribution map of microseismic warning values zoning without considering the impact of production operation disturbances. (Red represents damaged or repaired pillars).
Applsci 15 11172 g008
Figure 9. Distribution map of microseismic warning value zoning results in October 2015. (Red represents damaged or repaired pillars).
Applsci 15 11172 g009
Figure 10. Process of issuing ground pressure disaster warning information.
Applsci 15 11172 g010
Table 1. Statistical table of underground ground pressure manifestations in 2018.
No.TimePositionTypeScaleGoaf Stability LevelReasonCause SortLocation RelationshipWarning PrecursorSafety Accidents
14.14.W3 mining sitepillar
spalling rib
1~2 m3IIIThe collapsed pillars are located on top of the filling material, and the surrounding rock mass stress is redistributed due to the filling of the mining areaProduction siteNearbyYesNo
25.15.407 mining sitePillar explosion/IVThe mining operation in the mining site caused stress accumulation and release in the surrounding rock mass of sensor 44 #Production siteNearbyYesNo
35.18.+597 m third mining siteRoof collapse3 m3IIIThe mining operation in the mining site caused stress accumulation and release in the surrounding rock mass of sensor 10 #Production siteNearbyYesNo
46.10.W2 mining siteRoof collapse1 m3IVUnderground operations have caused stress accumulation and mild release in nearby rock massesProduction siteNearbyYesNo
57.16.+600 m W4 mining sitePillar explosion/IIIUnderground operations cause stress redistribution and concentrated release in the surrounding rock massProduction siteNearbyNoNo
67.20.128 mining siteRoof collapse1 m3IIIProduction siteNearbyNoNo
78.2.+600 m mining siteRoof collapse1 m3IIIProduction siteNearbyYesNo
88.8.Shiyan ore pillarPillar explosion/IIIClosed areaFarawayNoNo
98.20.+610 m mining siteRoof collapse2 m3IVProduction siteNearbyNoNo
108.28.Third mining sitePillar spalling rib/IIIClosed areaFarawayNoNo
119.28.W9 mining siteRock burstMinor rock burstIIIProduction siteNearbyYesNo
1210.27.+597 m mining siteRoof collapse10 m3IVFilling areaNearbyYesNo
“/” represents no data.
Table 2. Classification criteria for activity level of microseismic events.
Activity Level of Microseismic EventsInactiveMore ActiveActiveAbnormal Activity
Classification criteriaAccumulated single-channel events in the current month ≤ 3030 < Accumulated single-channel events in the current month < 50Accumulated single-channel events in the current month ≥ 50Single-channel event exceeds warning value or location event occurs
Activity levelIIIIIIIV
Table 3. Classification criteria for stability of goaf.
Security SituationNot meeting the conditions for roof collapse and local collapse, with no signs of deformation or damageOnly capable of generating local roof collapse conditions, with no obvious signs of deformation or damageOwn the conditions to form small-scale roof collapse and local collapse, with obvious signs of deformation and damage in some areasOwn the conditions for generating large-scale roof collapse and local collapse, with significant deformation and damage
Disposal and Management RequirementsProduced normallyRectify within a limited time and eliminate potential safety hazardsStop production, take measures, and eliminate dangerous situations within a specified time limitImmediately cease production, eliminate potential risks, report to relevant departments, and activate emergency plans
Safety LevelSecurityMore secureLess secureUnsafe
Activity LevelIIIIIIIV
Table 4. Classification criteria for the degree of disturbance impact on production operations.
The Degree of Disturbance Caused by Production OperationsMinimal ImpactLess ImpactSignificant ImpactMore Significant Impact
Classification criteriaThe distance between the sensor and the operating point is ≥ 150 m100 < Monthly cumulative single-channel events < 15050 < Sensor distance from work point position ≤ 100 mThe distance between the sensor and the operating point is ≤ 50 m
LevelIIIIIIIV
Table 5. Microseismic pre equivalent zoning scoring model.
Impact IndicatorsActive Microseismic EventsStability of Goaf RoofThe Degree of Disturbance Caused by Production Operations
Weight Value0.60.20.2
Warning value zoning scoring and standardsSubitem scoreIIIIIIIVIIIIIIIVIIIIIIIV
6045301520151052015105
Comprehensive scoreAccumulate the scores of each subitem to obtain a comprehensive score
Partition criteria100~8685~7170~5150~25
Partition levelIIIIIIIV
Ratio3.503.002.502.00
Partition warning valueParameter benchmark value × ratio
Table 6. Ground pressure warning cases in Xianglushan tungsten mine in 2018. (“/” represents no data; “#” has been explained earlier).
Location/ZoneEvent TypeRisk LevelNumber of EventsTypical Sensor ResponseTypical Manifestation & Follow-Up ActionsArea Closure RateWarning Success Rate
Pit 4# 18# e6High activityVery high12N/a (value-based)Very high possibility of wall and roof collapse. Continuous monitoring.0%100%
Pit 2# 407High activityVery high8N/a (value-based)High possibility of wall and roof collapse. Area frequently evacuated and closed.100%87.5%
Pit 2# 407PositioningCritical3Multi-sensor (13–23 triggers)Confirmed rock fall after closure. Entry prohibited.100%100%
Pit 2# 597/600PositioningHigh9Multi-sensor (7–23 triggers)No personnel onsite. Roof caving found at 600. Area restricted; safety confirmation required before entry.100%100%
Pit 2# 585/603High activityMedium5N/a (value-based)High possibility of wall and roof collapse.0%40%
W18#/w16# w7PositioningHigh8Multi-sensor (9–12 triggers)Area designated as dangerous zone; personnel prohibited from passing. No operations.100%100%
W9/w20#/w22#PositioningHigh5Multi-sensor (12–15 triggers)Included a confirmed rock burst event at w9. Dangerous zone established. “Knocking asking” System implemented.100%100%
Pit 5#PositioningMedium5Multi-sensor (3–15 triggers)No personnel onsite. Recommended safety check before entry. One rock mass caving (1–2 m3) caused by backfilling stress.0%80%
Pit 5#/e pit 5#High activityLow3N/a (value-based)High possibility of wall and roof collapse.0%66.7%
Total/average 64 /73.4%95.3%
Disclaimer/Publisher’s Note: The statements, opinions and data contained in all publications are solely those of the individual author(s) and contributor(s) and not of MDPI and/or the editor(s). MDPI and/or the editor(s) disclaim responsibility for any injury to people or property resulting from any ideas, methods, instructions or products referred to in the content.