1. Introduction
The problem of non-contact, non-destructive quality control is currently relevant. This problem finds its application in additive manufacturing [
1], microelectronics [
2], precision machinery manufacturing [
3], and turbine blade manufacturing [
4]. Quality control methods can be classified into different categories, including division by maximum measurable depth ranges.
When classifying by the measured depths, there are systems that consider the nanometer, micrometer, millimeter, centimeter, and meter ranges. When using classical methods of digital holographic interferometry, measurements of height differences are carried out mainly in the nanometer range, corresponding to the wavelength of laser radiation [
5]. Millimeter and centimeter ranges are covered by systems based on visual control or ultrasonic visualization [
6]. One of the methods of visualization and measurement of defects in the range from 10 to 100 µm is two-wave holographic interferometry.
The defect range, from 10 to 100 µm, is in demand not only in industrial production [
1,
3,
4,
7], but also in the analysis of microplastic particles [
8], and in the analysis of cells and organ tissues [
9]. However, it is important to find a compromise between the accuracy of measurements and the final cost of the device, which may be relevant for performing defect measurement tasks in conditions of limited resources.
Modern digital holographic systems often use two separate laser sources to provide the necessary long-wavelength interference while extending the measurement range [
10]. However, this leads to a more complex optical scheme, increased cost, and the risk of mismatched phase distortions between the channels. In contrast, the use of a tunable source combines the possibility of a wide range of measurable height differences and minimizes artifacts associated with the use of two sources, such as artifacts associated with uncorrelated wavefronts scattered from the object. This is possible with insufficient alignment of the holographic scheme and leads to different interference patterns, which are fraught with a significant drop in the quality of the reconstruction. In particular, a tunable source provides continuous wavelength adjustment within a single emitter, which eliminates the need for precise synchronization of two lasers and eliminates phase mismatches that lead to measurement distortions. Thus, in article [
11], the development of an industrial device with an adaptive operating mode for surfaces with different albedo was considered. At present, laser diodes are rapidly developing, which are compact, portable, widely available, and efficient radiation sources. Unfortunately, they have low coherence, so the study of holography with low-coherence sources is of great importance in industry.
The technology of dual-wavelength digital holography is based on the use of two or more lasers with wavelengths close enough for their beats to lie in the micrometer range [
11,
12,
13,
14,
15]. In this case, technologies for recording dual-wavelength holograms in one frame by separating the beams and then passing them through delay lines or polarization separation [
12] have become widespread. In the field of polarization separation, the study of birefringent dynamic samples by combining polarization holography with microscopy using microspheres is relevant [
13].
Other existing methods of visualization and measurement of micrometer defects are associated with such difficulties as the duration of measurement (e.g., probe microscope), requirements for sample size, requirement for ensuring contact with the sample, requirements for applying certain substances to the sample, inability to ensure automation of measurements, or systems based on other technologies have a high cost. Thus, the method considered in this article is a compromise in relation to the above. The method demonstrates the possibility of obtaining a three-dimensional surface profile using inexpensive and accessible equipment.
However, technologies with two consecutive frames have also become widespread, since technologies for recording holograms in one frame are complicated by additional elements in the optical scheme. For example, such systems are used to visualize cells of organisms [
14]. This technology is also used in the production of metal products, for example, in additive manufacturing [
15]. Thus, the systems based on recording two consecutive holograms have a simple design and are relatively cheap to manufacture and produce, which is a competitive advantage in the metal surface flaw detection market. In addition, this design can be assembled in the future into a device with overall dimensions of 250 × 200 × 100 mm.
Low-coherence light sources are also used in holographic systems based on the Mach-Zehnder interferometer to control the quality of light-transmitting optical elements. In this case, axial transmission holography is considered [
16].
In the article [
17], the authors demonstrated the possibility of forming a height map of a flat surface by changing the phase by changing the angle of incidence of radiation on the object. Within the framework of this issue there was a question of increasing the accuracy of the surface height map without directly measuring the sizes of defects.
The closest work to the one presented in this article is article [
18]. The setup presented in their paper has a lateral resolution of 9.1 µm and a depth range of 50 µm. They achieved this range using two lasers with wavelengths of 633 and 637 nm. To expand the measurable depth range without using phase unwrapping algorithms, alternative laser sources are required.
In
Table 1, we briefly summarize all current developments for comparison with those presented in our current work. Measurement setups are generally expensive (over
$10,000) and may be inapplicable for industrial applications. One way to reduce the cost of setups is to use a single tunable light source.
In this paper, we developed and tested a micrometer-range depth measurement system for flat metal surfaces based on a single low-coherence tunable source with a central wavelength of 407 nm. Using trapezoidal profile measures [
19] as examples, the results of three-dimensional visualization and measurement of height differences in ranges from 24.5 to 100 μm and widths from 65 to 150 μm are presented. Two-dimensional visualization of such a sample in the form of standard strokes with measurement of stroke widths up to 25 μm is also demonstrated.
2. The Principle of Dual-Wavelength Digital Holography
The current article describes a digital dual-wavelength holography system designed for three-axis imaging and height difference measurement. The digital hologram itself is notable for the fact that its reconstruction results in a complex amplitude of the object wave, which carries information not only about the intensity values, but also about the phase values [
20]. This makes it possible to measure the value of the heights and depths of the surface.
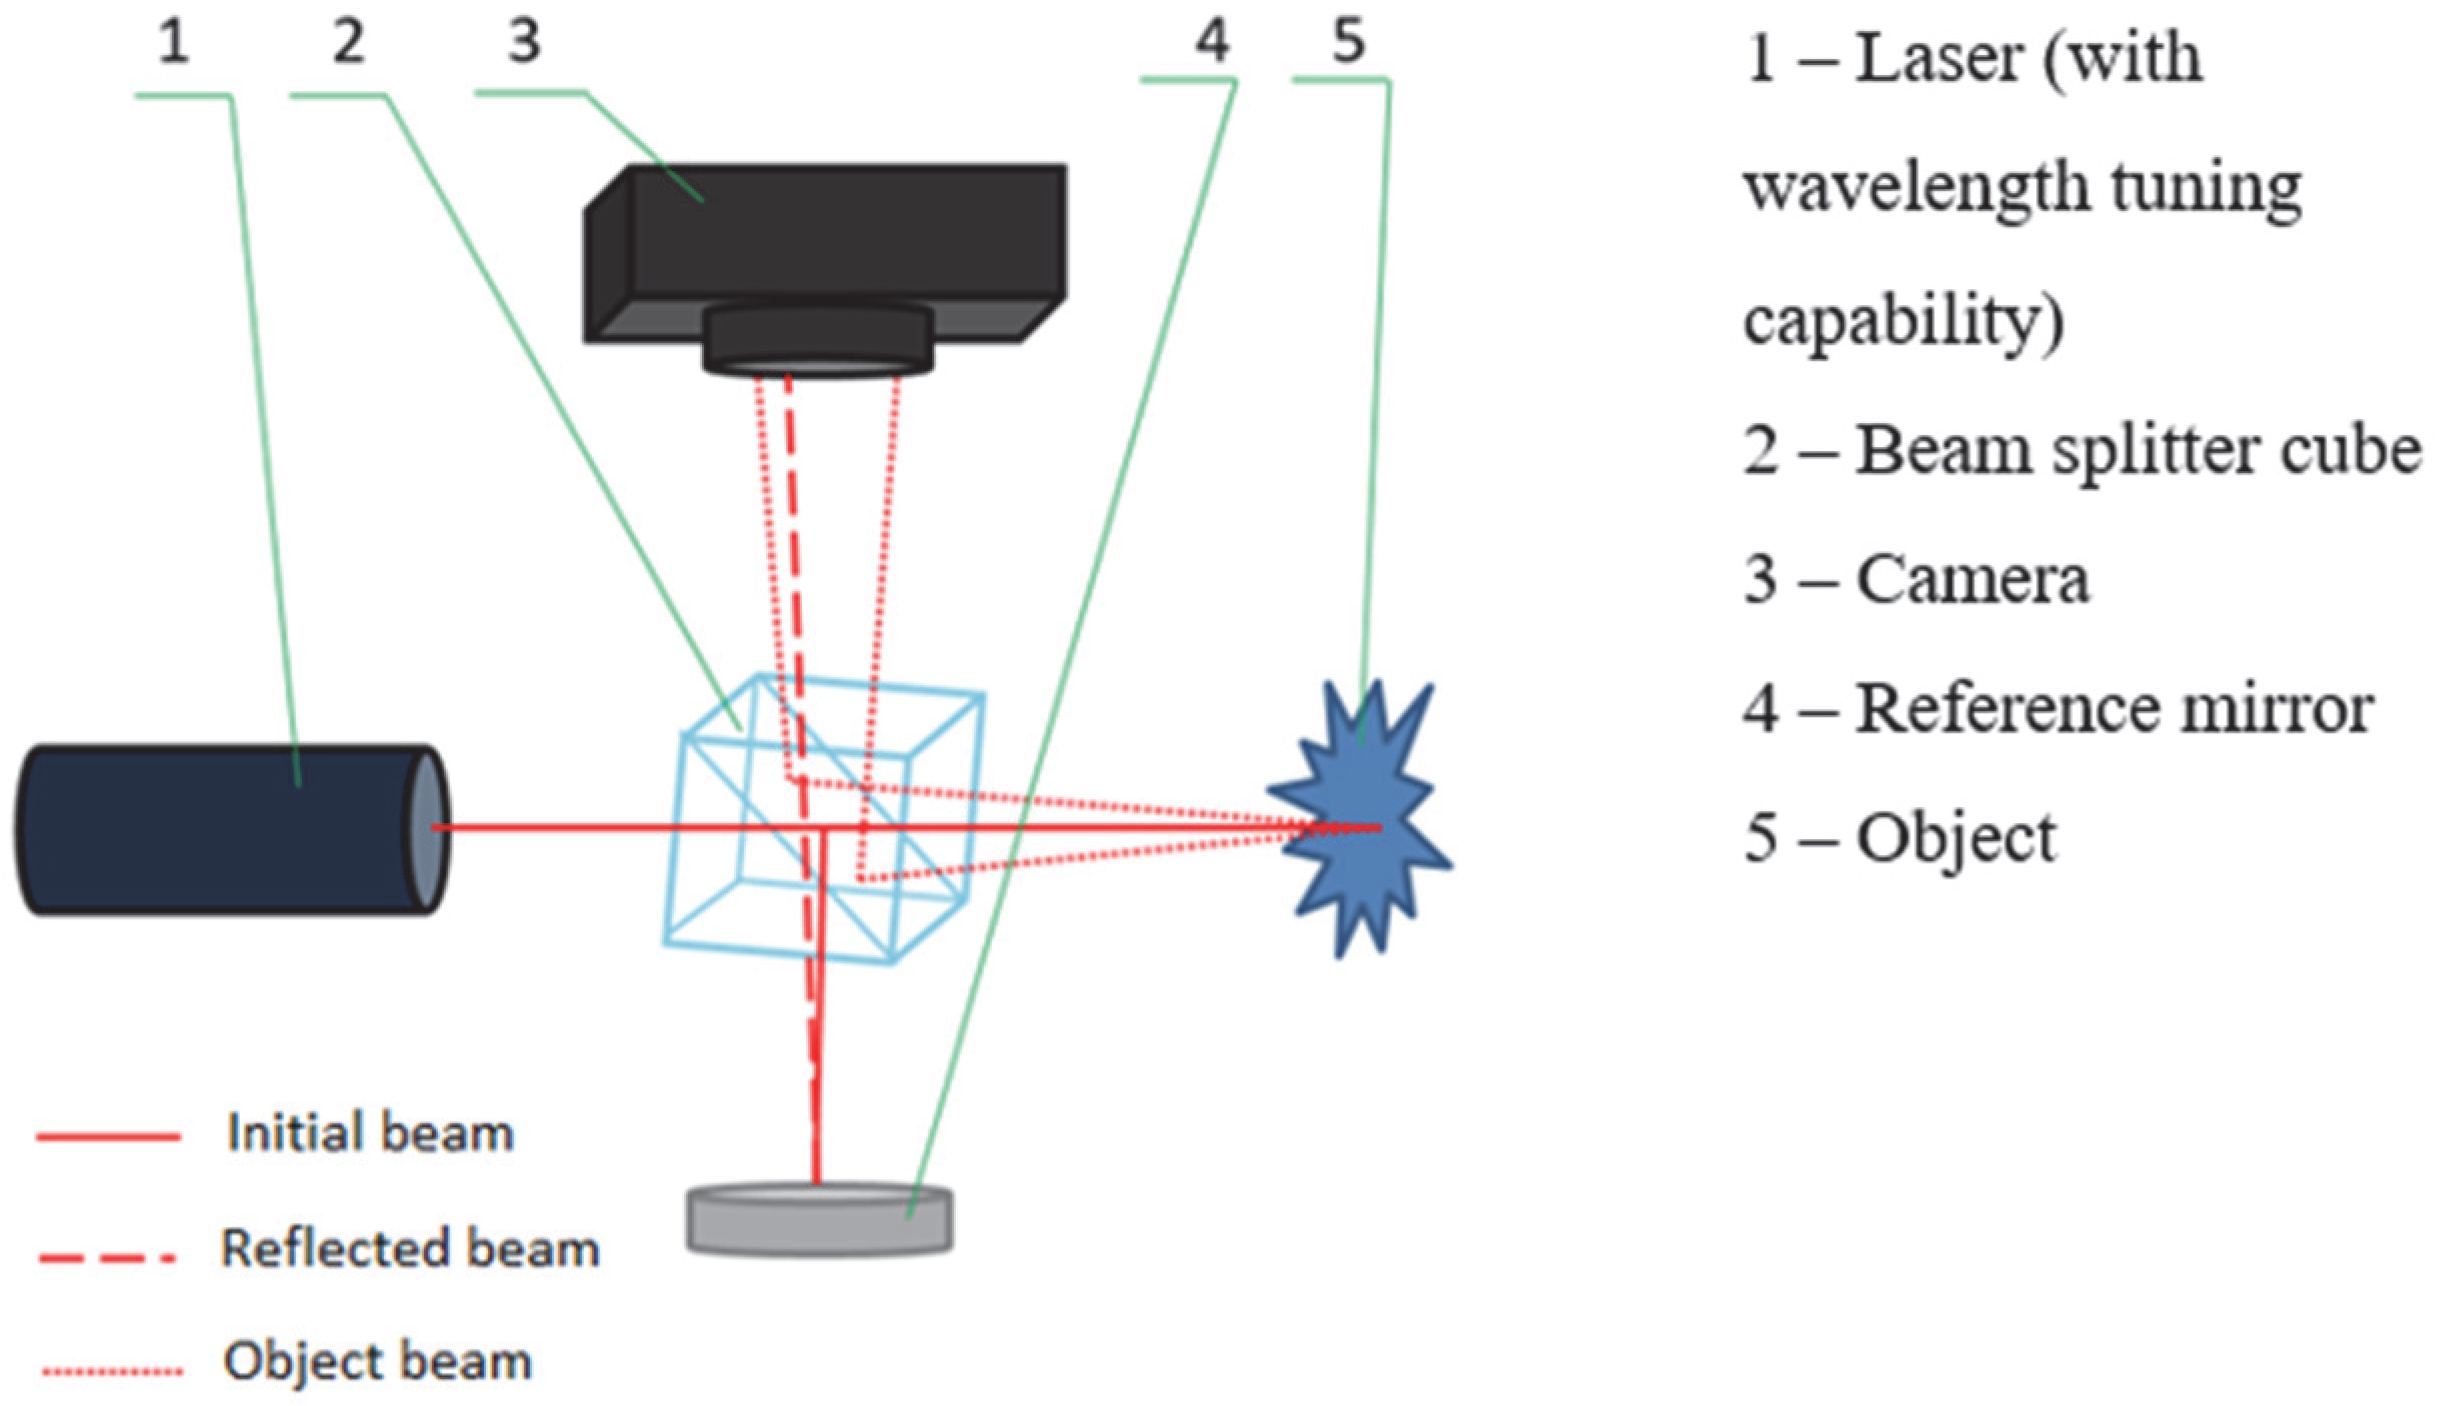
The digital hologram recording scheme is based on the Michelson interferometer, since this interferometer ensures a small angle between the reference and object beams (
Figure 1).
A small angle between the beams is necessary due to the relatively low resolution of digital radiation receivers (up to 300 mm
−1) compared to analog receivers-plates based on photosensitive materials (up to 5000 mm
−1) [
21].
The width of the interference pattern fringes is determined by the angle between the reference and object beams. The angle between these two beams was determined by the angle of rotation of the beam-splitting cube relative to the plane of the receiver. The width of the fringes and the angle between the beams are displayed by the following relationship [
22]:
where
λ is the wavelength of the hologram recording and
Δd is the width of the interference pattern fringes. Thus, to achieve the maximum resolution of digital receivers of 300 mm
−1 and for a wavelength of 0.5 μm, the angle between the beams should not exceed 8.7°.
In the digital implementation, the restoration is carried out by mathematical modeling of the reference wave, which is integrated together with the digital hologram (the matrix of the interference pattern intensities) to obtain a matrix of values of the complex amplitude of the object wave as follows [
23]:
where
Uh(x,y) is a digital hologram,
Ur(x,y) is a function describing the reference wave,
ξ′,η′ are the coordinates of the object wave in the reconstruction plane, and
ρ′ is the distance between a point in the hologram plane and a point in the reconstruction plane.
The distance between a point in the hologram plane and a point in the reconstruction plane affects the size of the reconstructed object relative to the receiver field (proportional dependence). For a square field, the linear size of the object corresponding to one pixel of the receiver is determined by the following Formula:
where
λ is the wavelength of the hologram recording,
N is the number of receiver pixels, and
Δx is the distance between two adjacent pixels, which corresponds to the size of one pixel.
The obtained complex amplitude of the object wave allows us to mathematically determine the intensity and phase of the object wave. The intensity will be determined by the modulus of the complex amplitude, and the phase by the complex part at each point in the hologram space as the following:
Since the light scattered from the object arrives at each pixel of the receiver with a different phase, the maximum height difference is determined within one wavelength. This range is expanded using a synthetic wave, which is obtained by the difference of two closely spaced wavelengths, and for micrometer defects a difference in wavelengths of about 1 nm is sufficient as the following [
24]:
where
Δφ is the phase difference matrix obtained as a result of reconstructing the two-wavelength hologram.
Such a restructuring can be achieved using a low-coherence source with a large radiation spectrum width, within which restructuring is possible.
The difference in surface heights when using dual-wavelength hologram recording is defined as the following:
The height values calculated at each element of the CMOS sensor form a surface height map, which is a histogram—a three-axis visualization of the surface.
A phase ambiguity problem is also possible if the height difference is greater than the synthetic wavelength. In this case, phase unfolding algorithms can be used [
25]. However, it is important to consider when designing the system that the receiver resolution allows distinguishing the contours of the folded phase image.
The phase unwrapping algorithm for the one-dimensional case is shown in
Figure 2.
This algorithm eliminates phase ambiguity, and is well suited for objects of predictable shape, but may be unsuitable for analyzing micrometer defects. In addition, the phase unwrapping algorithm in the case of a reconstructed hologram requires additional filtering due to random phase spikes. These spikes, firstly, lead to a deterioration in the quality of the reconstructed hologram (since the phase image filtering algorithms rely on median filtering), and secondly, distort the measurements of height differences (since a thin comb can also be subject to filtering). Thus, this problem is solved either by improving the phase image filtering algorithms and phase unwrapping algorithms, or by using tunable lasers that will allow varying the maximum measurable range of height differences. In particular, the phase unwrapping algorithms are improved using artificial intelligence and convolutional neural networks (for example, the DeepLabV3+ neural network) [
26].
3. Methods
The research was conducted on an experimental setup for recording digital holograms based on a Michelson interferometer. Roughness standards with a height difference not exceeding 100 μm were used as an object for measuring the height difference.
A LUF303 diode laser with a central wavelength of 407 nm and a coherence length of about 1 mm were used as sources. The Michelson interferometer arms are supported with an accuracy of 1 mm for maximum contrast of interference fringes by a micrometer movement with a step of 20 µm. Otherwise, the contrast of the interference pattern will be insufficient for measurements. The wavelength was adjusted by changing the supply voltage of the pointer, within the range from 407.4 nm to 408.4 nm [
27]. Clearly, the coherence length exceeds the maximum detectable height difference. A low-coherence source has the advantage of a wide wavelength tuning range, allowing for a wider range of heights to be covered, depending on the specific sample. Furthermore, using a low-coherence source reduces speckle noise [
28] and parasitic interference [
29]. The wavelength was monitored using an Aurora-4000 spectrometer.
The angle between the reference and object beams during the measurements was 1.6°.
The receiver was a USB camera E3ISPM20000KPA with a resolution of 5440 × 3648, a color depth of 24 bits, and the distance between the centers of two pixels both horizontally and vertically was 2.4 μm (the same value corresponds to the width of one pixel). The exposure time varied depending on the albedo of the objects under study from 30 to 500 ms.
To ensure the greatest contrast of the interference pattern, the intensities of the reference and object beams were equalized by attenuating the reference beam using neutral filters, with the absorption coefficient varying depending on the albedo of the object under consideration. The beam was also expanded using a telescope to a diameter of 25 mm, and transverse mode filtration was performed using a pinhole with a diameter of 100 μm.
To obtain three-axis visualization, a series of ten images was taken for one wavelength (λ1 = 407.4 nm), then the same number of images for another wavelength (λ2 = 407.65 nm or λ2 = 408.4 nm, depending on the object under consideration). Ultimately, the complex amplitude of the object wave was averaged for both wavelengths.
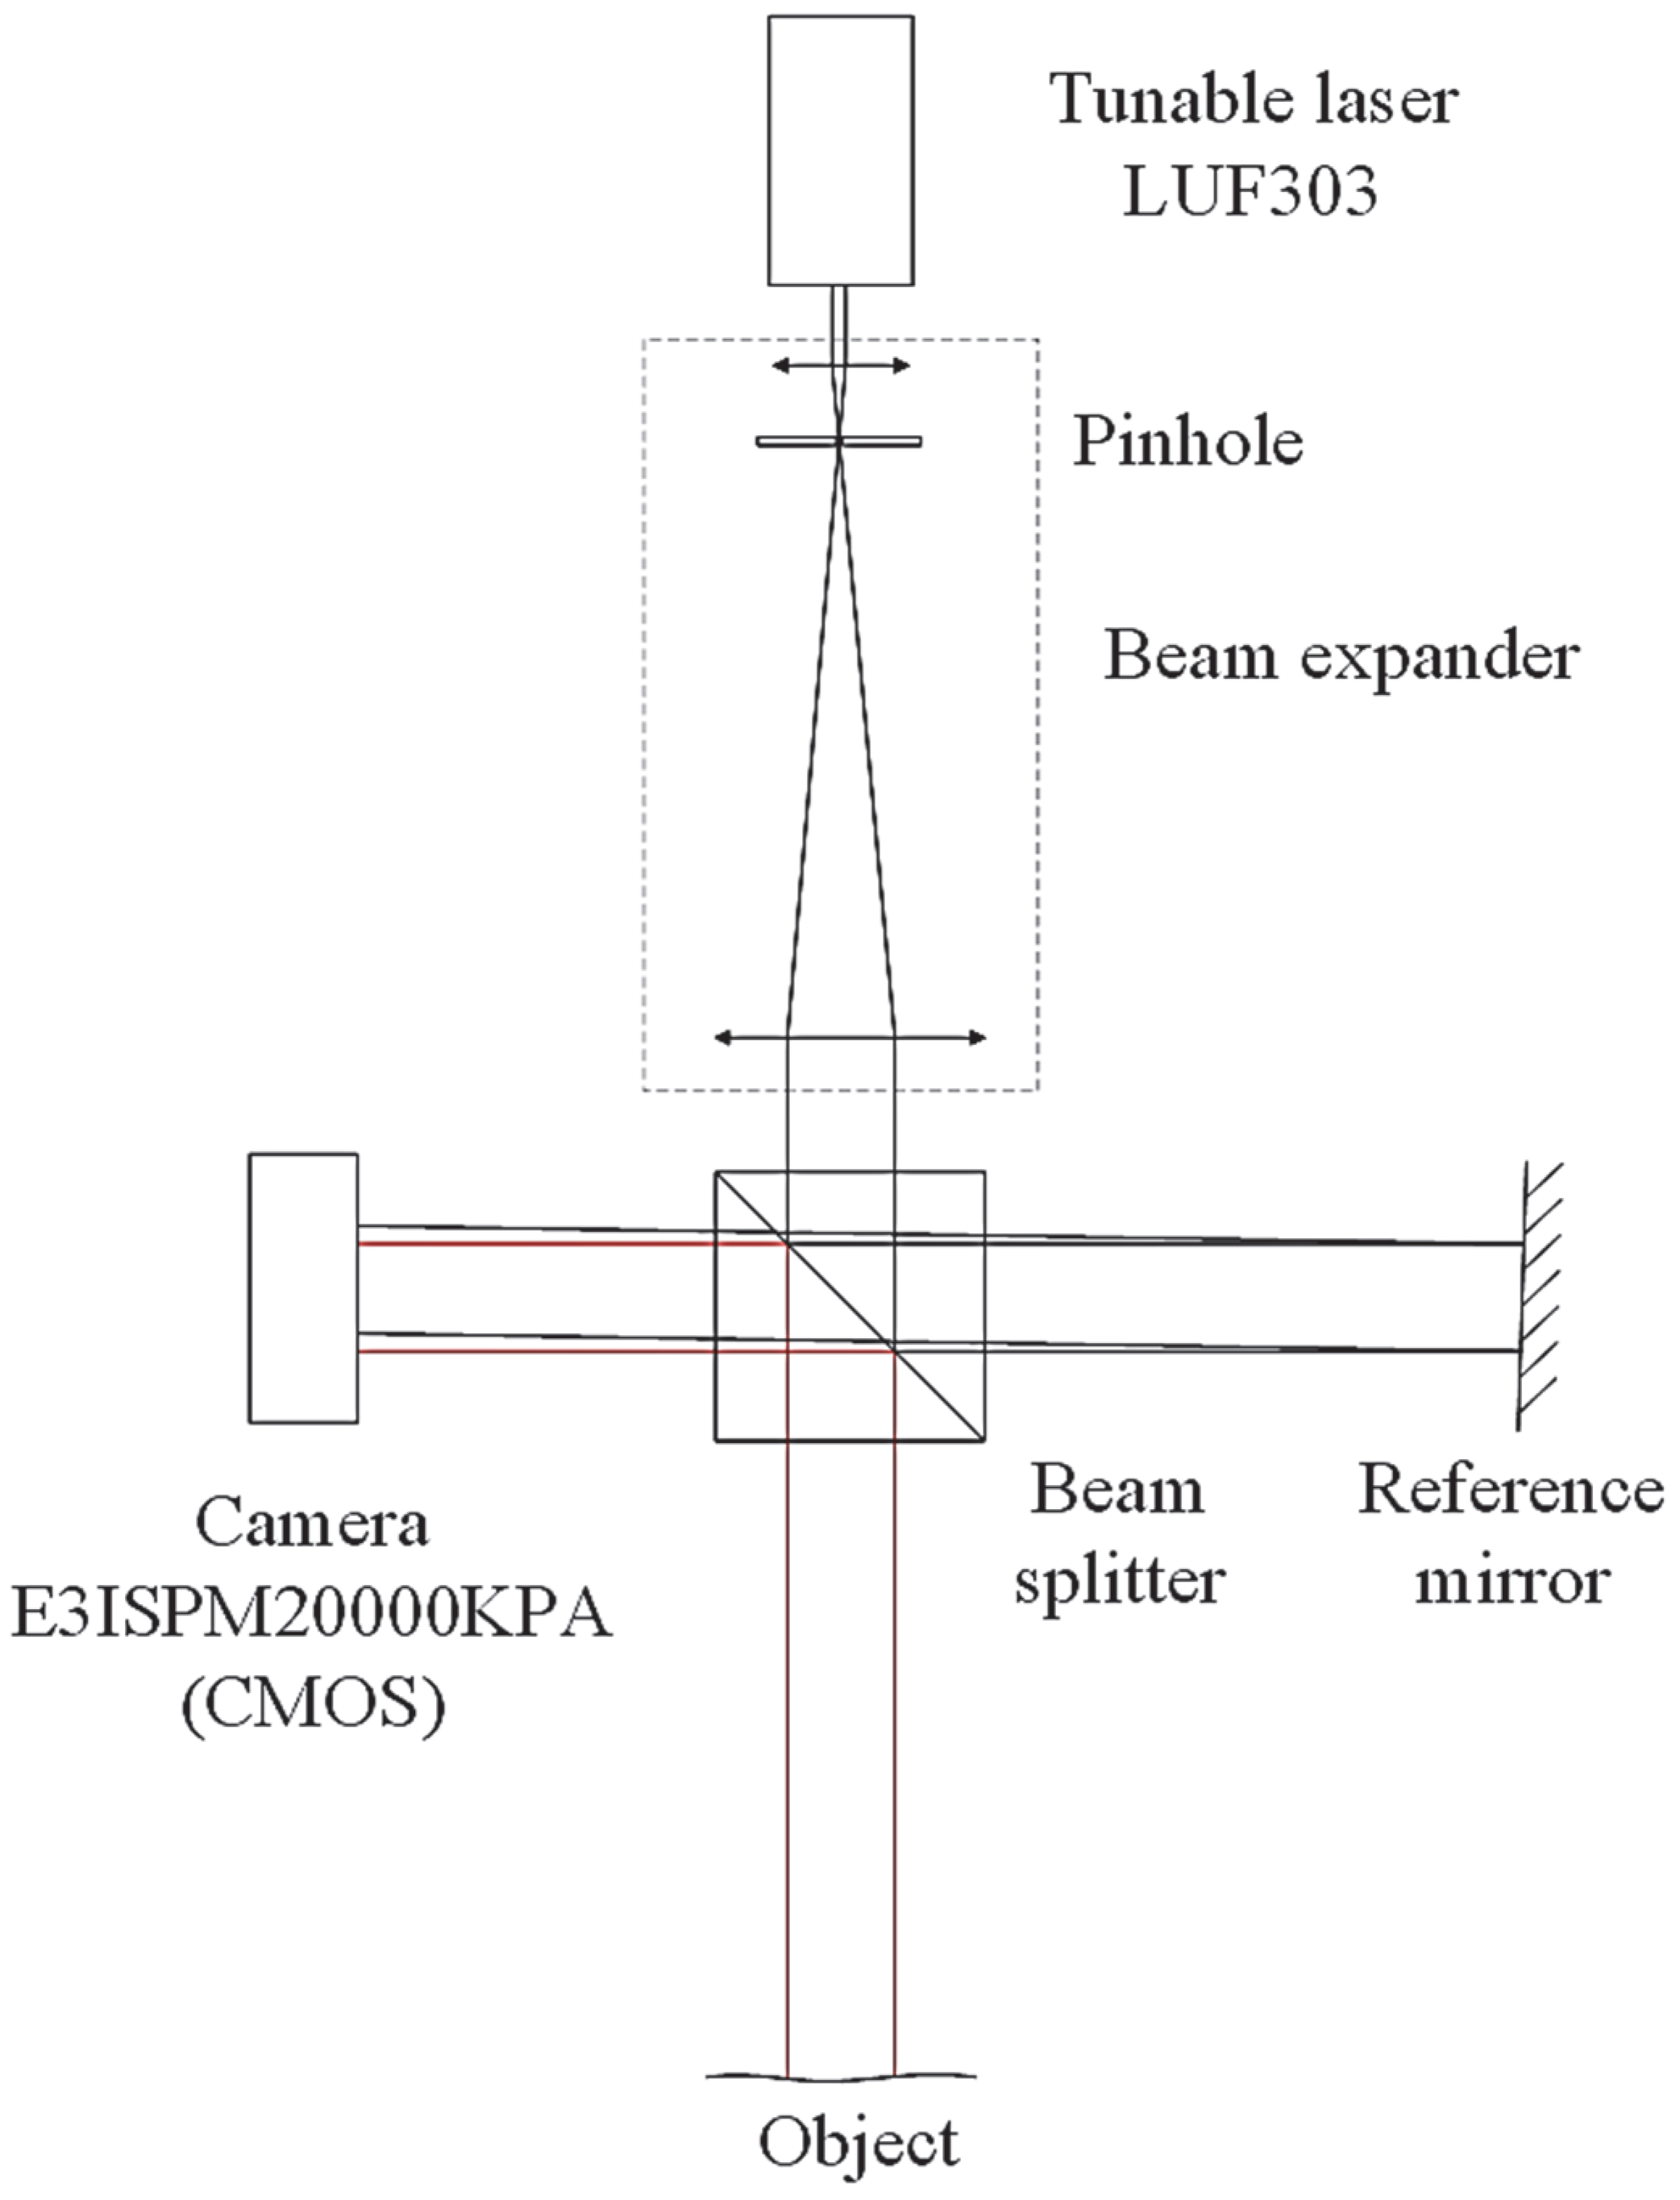
The functional diagram is shown in
Figure 3.
Hologram reconstruction was performed using software written in Python 3.8, and three-dimensional visualization was performed using software written in MATLAB R2016b. In this paper, the Fresnel reconstruction was performed. The parameters of the computer on which reconstruction and visualization were performed are Intel Core i5-10600KF processor, 6 cores, 12 threads, with a clock frequency of 4.1 GHz, RAM 32 GB, ROM SSD 2 TB, and video adapter Intel Arc A380.
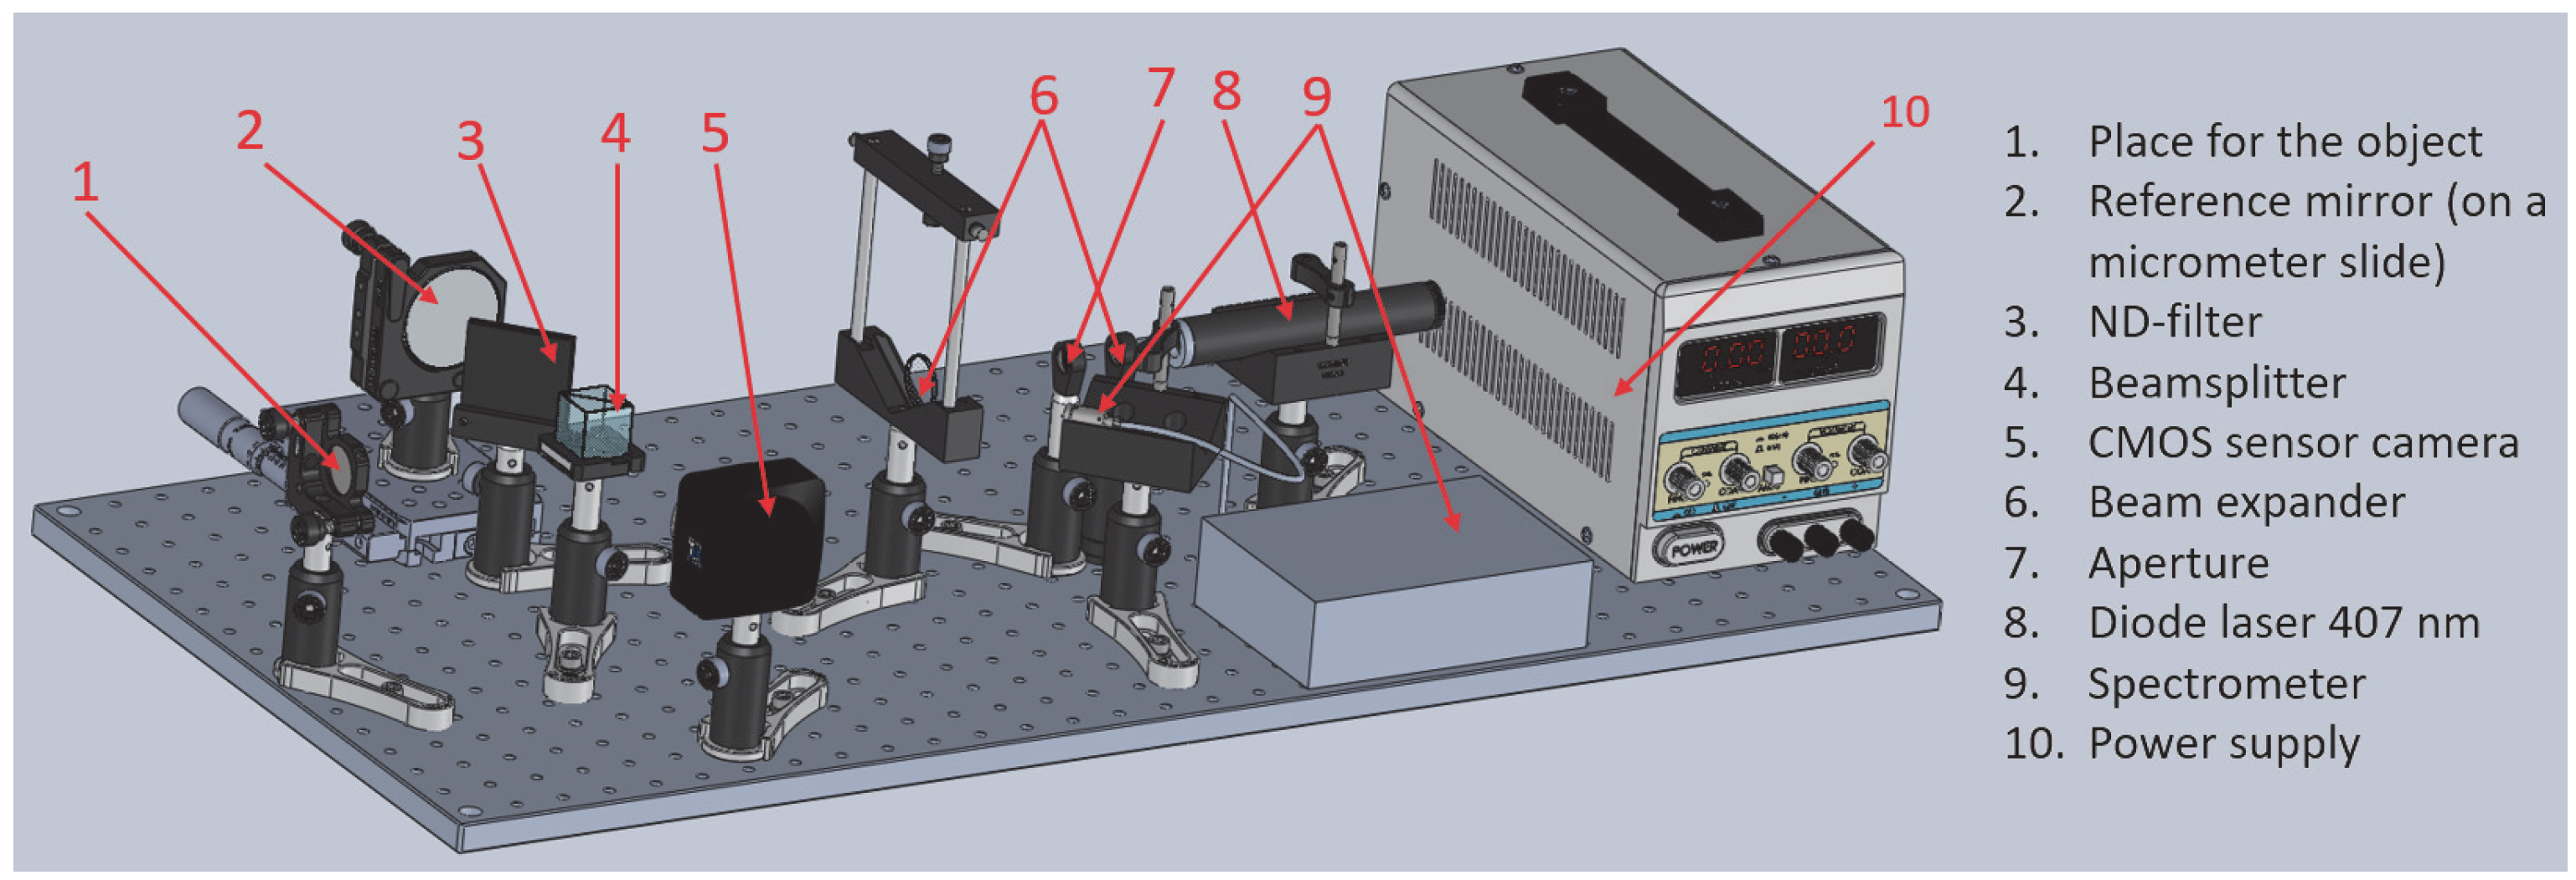
The appearance of the experimental stand is shown in
Figure 4.
The software written for reconstructing digital holograms is not optimized for high speed operation. To reconstruct a digital hologram (to obtain the complex amplitude of the object wave), three parameters must be known: the wavelength λ, the distance between the centers of two adjacent pixels of the receiver Δx (for square pixels, this value is the pixel size), and the distance between the receiver and the object ρ′ (assuming a flat wave front; for a spherical wave front, this parameter will differ from the actual one).
During the reconstruction, the modulus and complex part of the complex amplitude of the object wave are calculated, which correspond to the intensity and phase of the radiation at each point of the receiver.
Then, the reconstruction of the hologram recorded at a different wavelength is repeated, after which the difference between the two phase images is calculated to obtain a phase image of the synthetic wave. The resulting phase difference displays the pattern of change of two phases within the phase of the synthetic wave. To obtain the height value at each point of the image, we multiplied the resulting matrix of phase differences by the coefficient from Formula (7).
Three-axis visualization of the surface was performed using a cropped height map, in which the virtual image of the reconstruction was cropped (minus the first order of diffraction), since the resulting height map contained the entire spatial region of the reconstruction, including the zero and first orders of diffraction.
The measurements were carried out under the following conditions: room, illumination-no more than 0.1 lux, temperature-18 °C, relative humidity-50%, and atmospheric pressure-101 kPa.
To test the system, two roughness measures with a trapezoidal surface profile with a groove depth of 24.5 μm and 100 μm and a profile width of 65 μm and 150 μm, respectively, were obtained. They represent a trapezoidal profile with a groove depth of 100 μm and 24.5 μm, respectively, and a protrusion width of 150 and 65 μm, respectively. A macrophotograph of the measures against a caliper (for dimensional evaluation) is shown in
Figure 5a,b.
A fragment of the drawing of the measure and the profile shape are shown in
Figure 6a and
Figure 6b, respectively.
The height differences were measured using these standards. For the standard with a groove depth of 100 µm, the wavelengths λ1 = 407.4 nm and λ2 = 407.65 nm were used, which correspond to a synthetic wavelength of 633.8 µm. For the standard with a groove depth of 24.5 µm, the wavelengths λ1 = 407.4 nm and λ2 = 408.4 nm were used, which correspond to a synthetic wavelength of 158.6 µm.
The resulting phase difference, reduced to the height dimension, is a three-dimensional height histogram. To minimize noise and random outliers, median filtering is performed before further processing and three-dimensional visualization. Considering the peculiarity of the standards under study, a median filter with a rectangular vertical core with dimensions of 9 by 35 elements, oriented along the grooves, was chosen.
The distance ρ′ between the receiver and the measure is 120 mm, which means that the pixel size in the reconstructed image is 5.6 μm. Thus, one pixel of the image corresponds to 5.6 μm of the real part of the complex amplitude of the object wave in the horizontal plane.
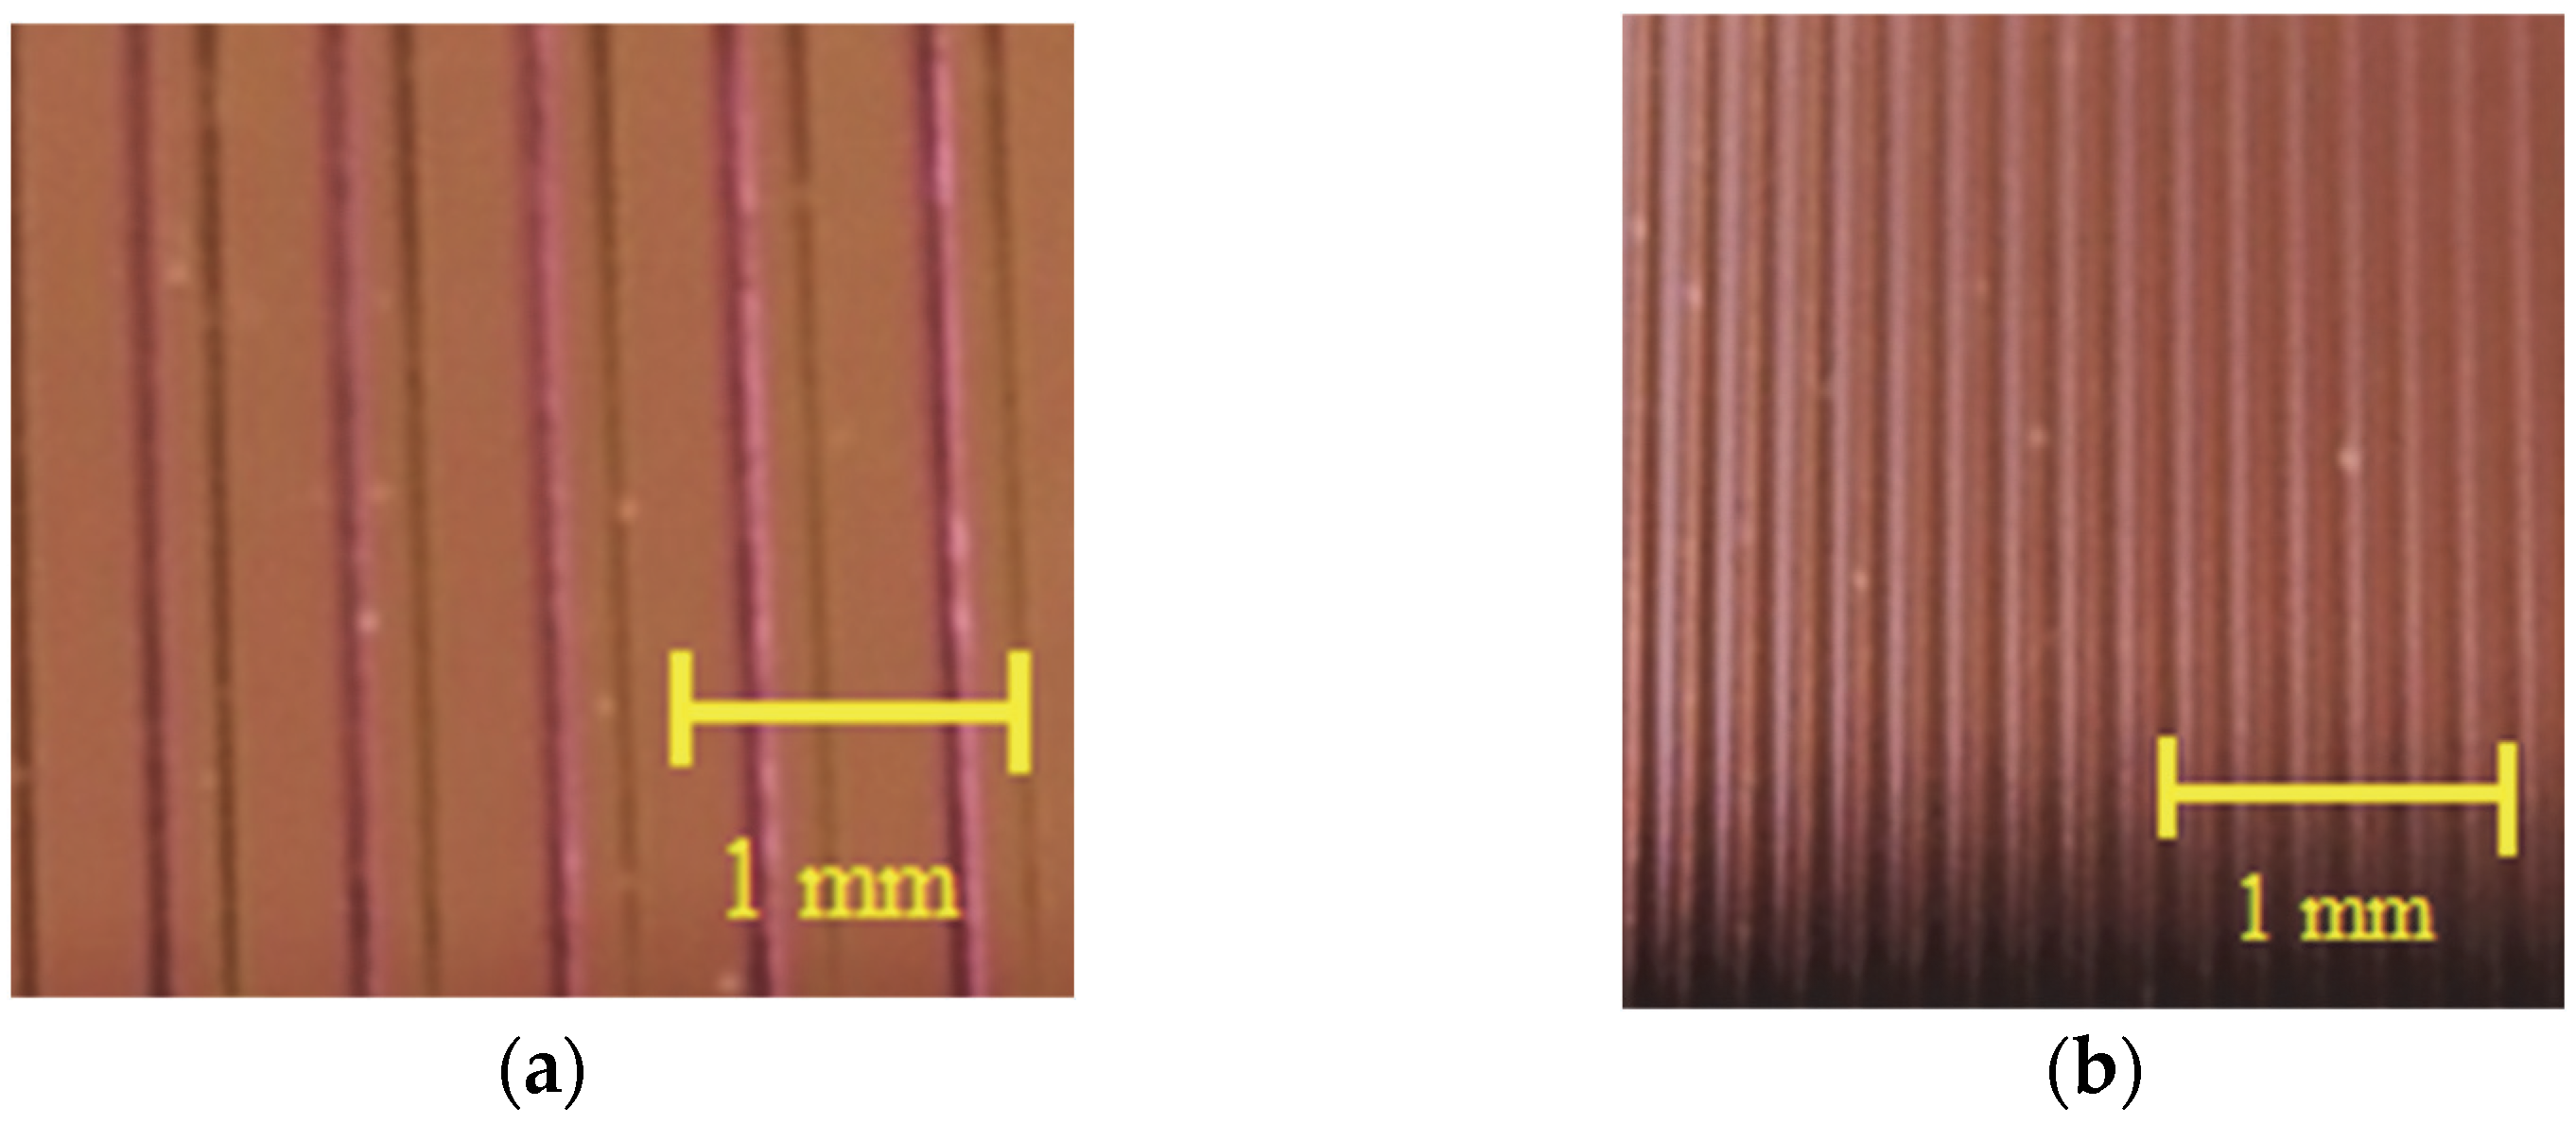
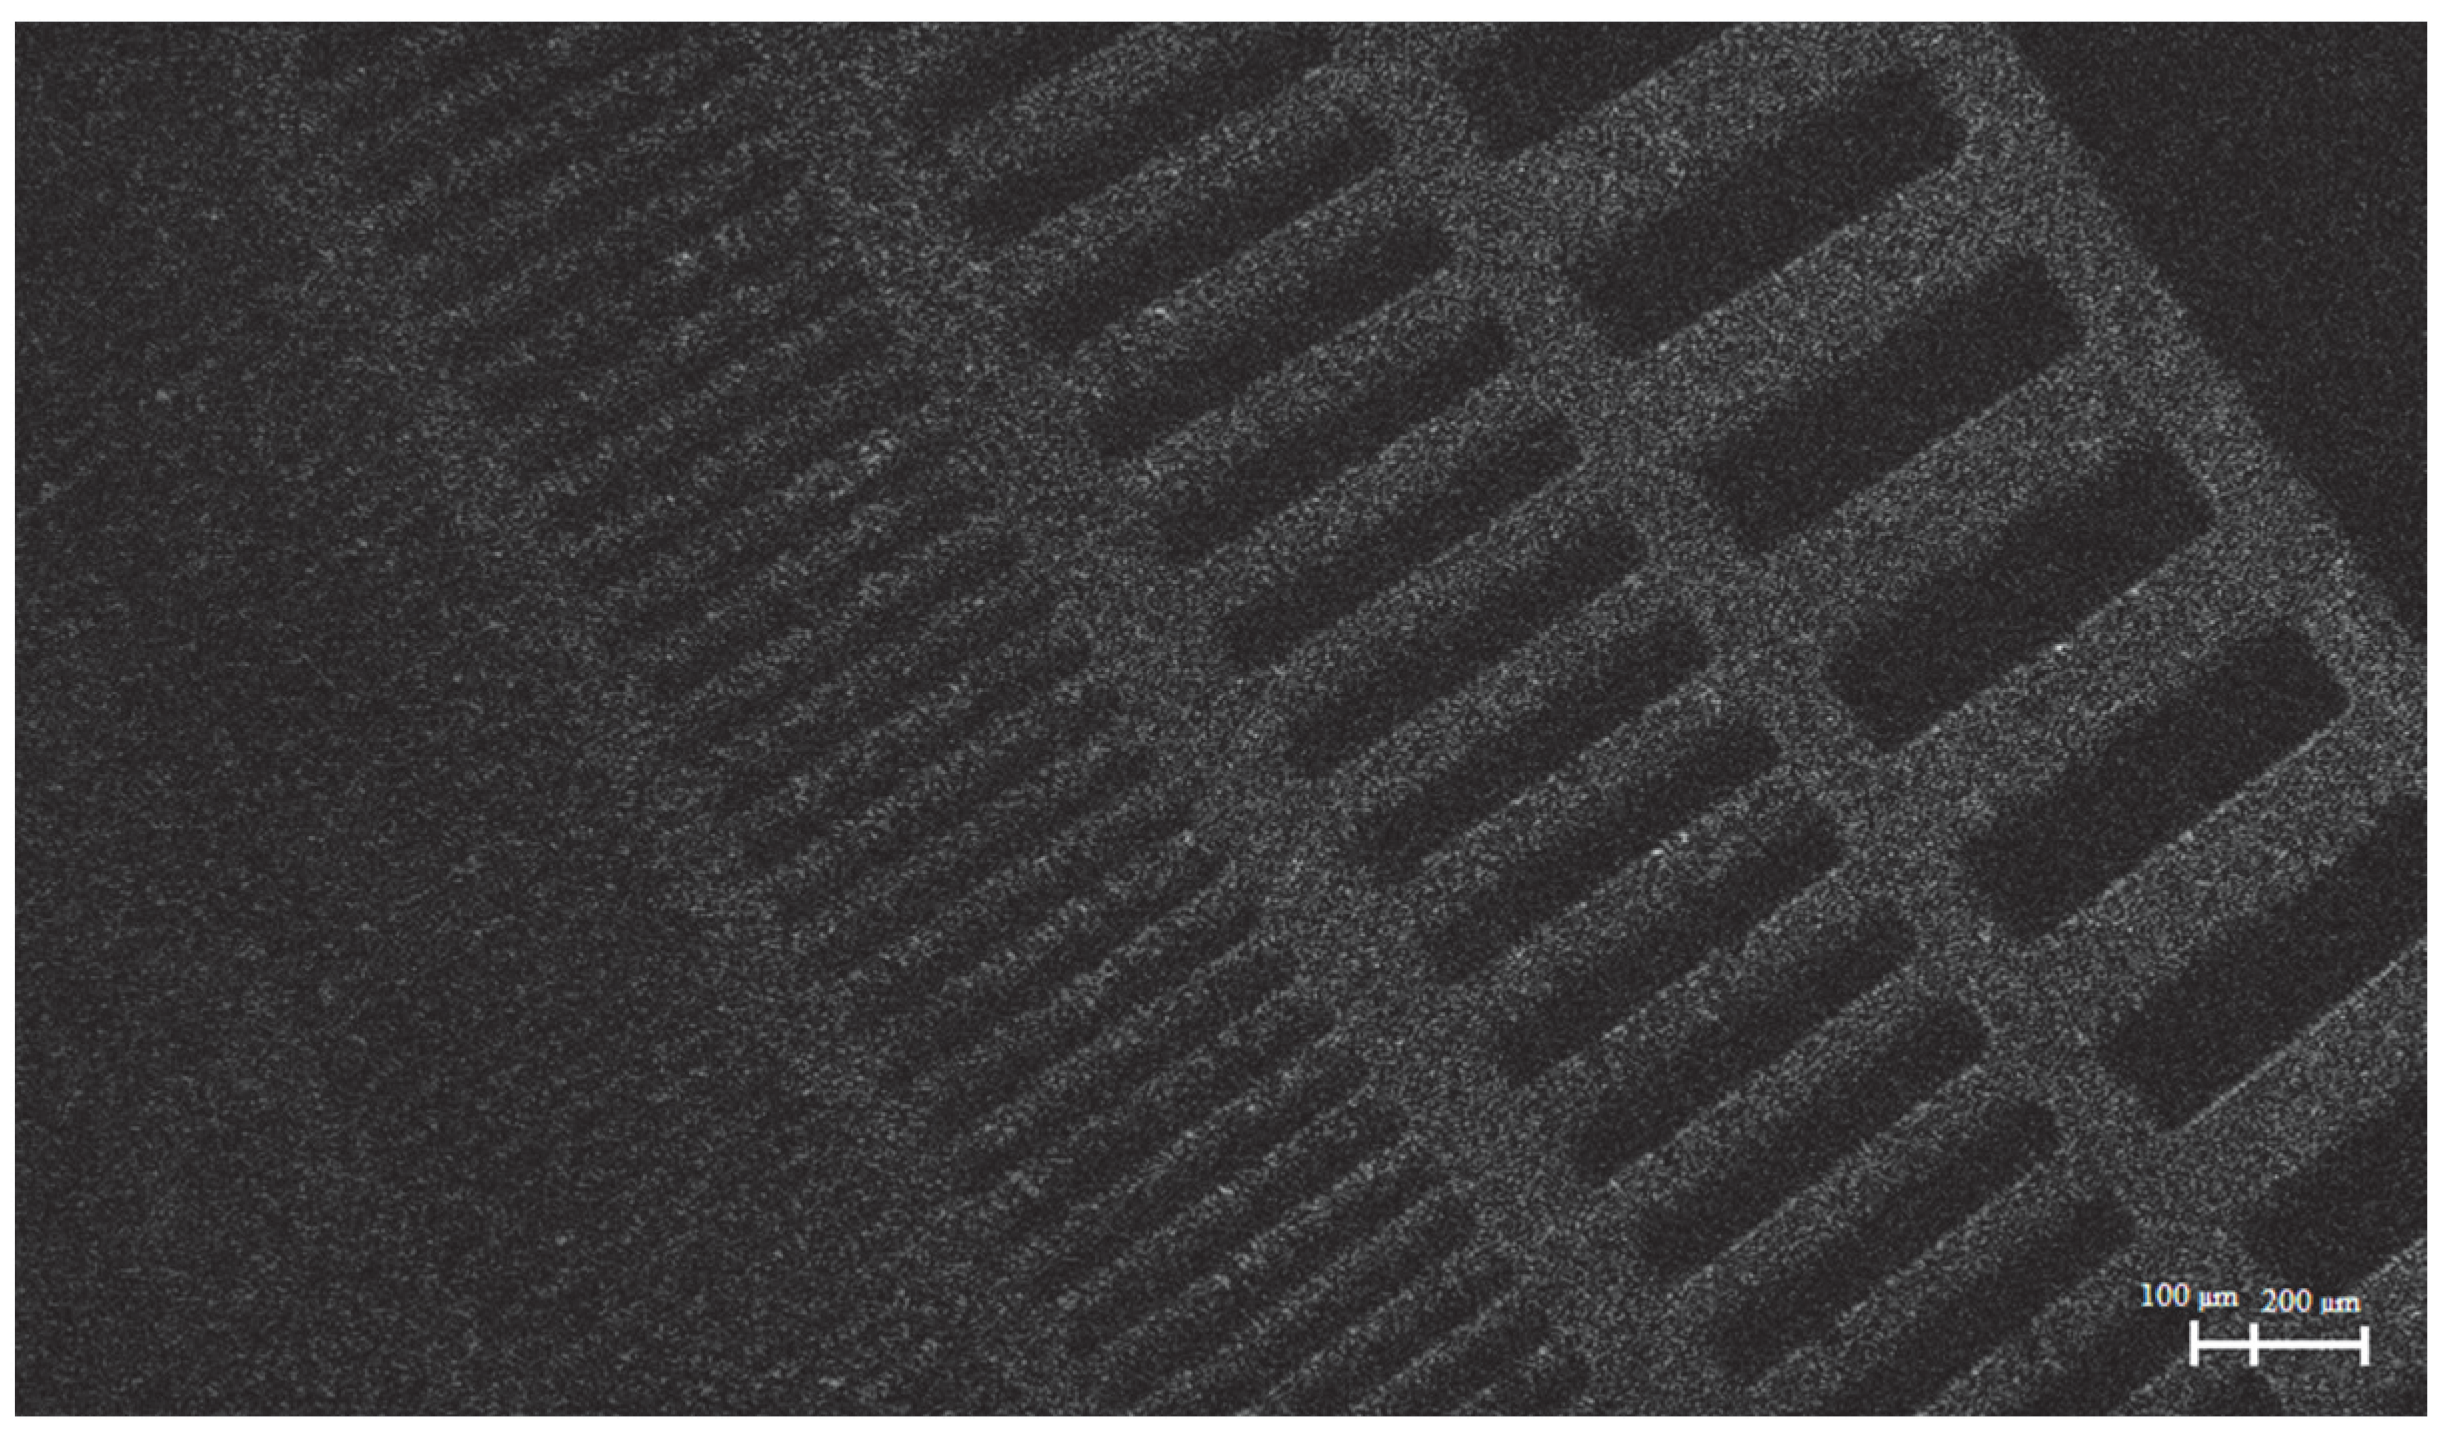
Also, a measure with strokes, designed to check the resolution of optical systems, was used to conduct tests and check the measurements of defects in the horizontal plane. A macrophotograph of the measure is shown in
Figure 7.
The width of the interference fringes allows us to clearly determine the resolution of the system. The size of one pixel of the receiver is 2.4 μm. Considering the Nyquist-Shannon sampling theorem, the minimum measurable pitch is two pixels and equals 4.8 µm. Thus, the width of the fringe is 14.4 ± 4.8 μm.
The size in the horizontal plane was determined by recalculating the pixel size in the reconstructed image using Formula (3). With the specified parameters of the stand (the distance between the receiver and the object is 120 mm, the receiver width is 3,648 pixels, the size of one pixel is 2.4 μm), the pixel size in the reconstructed image will be 5.6 μm.
To detect and measure the size of defects in the horizontal plane, it is sufficient to reconstruct a single-wave digital hologram, since the intensity of the object wave contains information about the width of the reconstruction plane. Thus, the minimum measurable pitch is two pixels and equals 11.2 µm.
4. Results
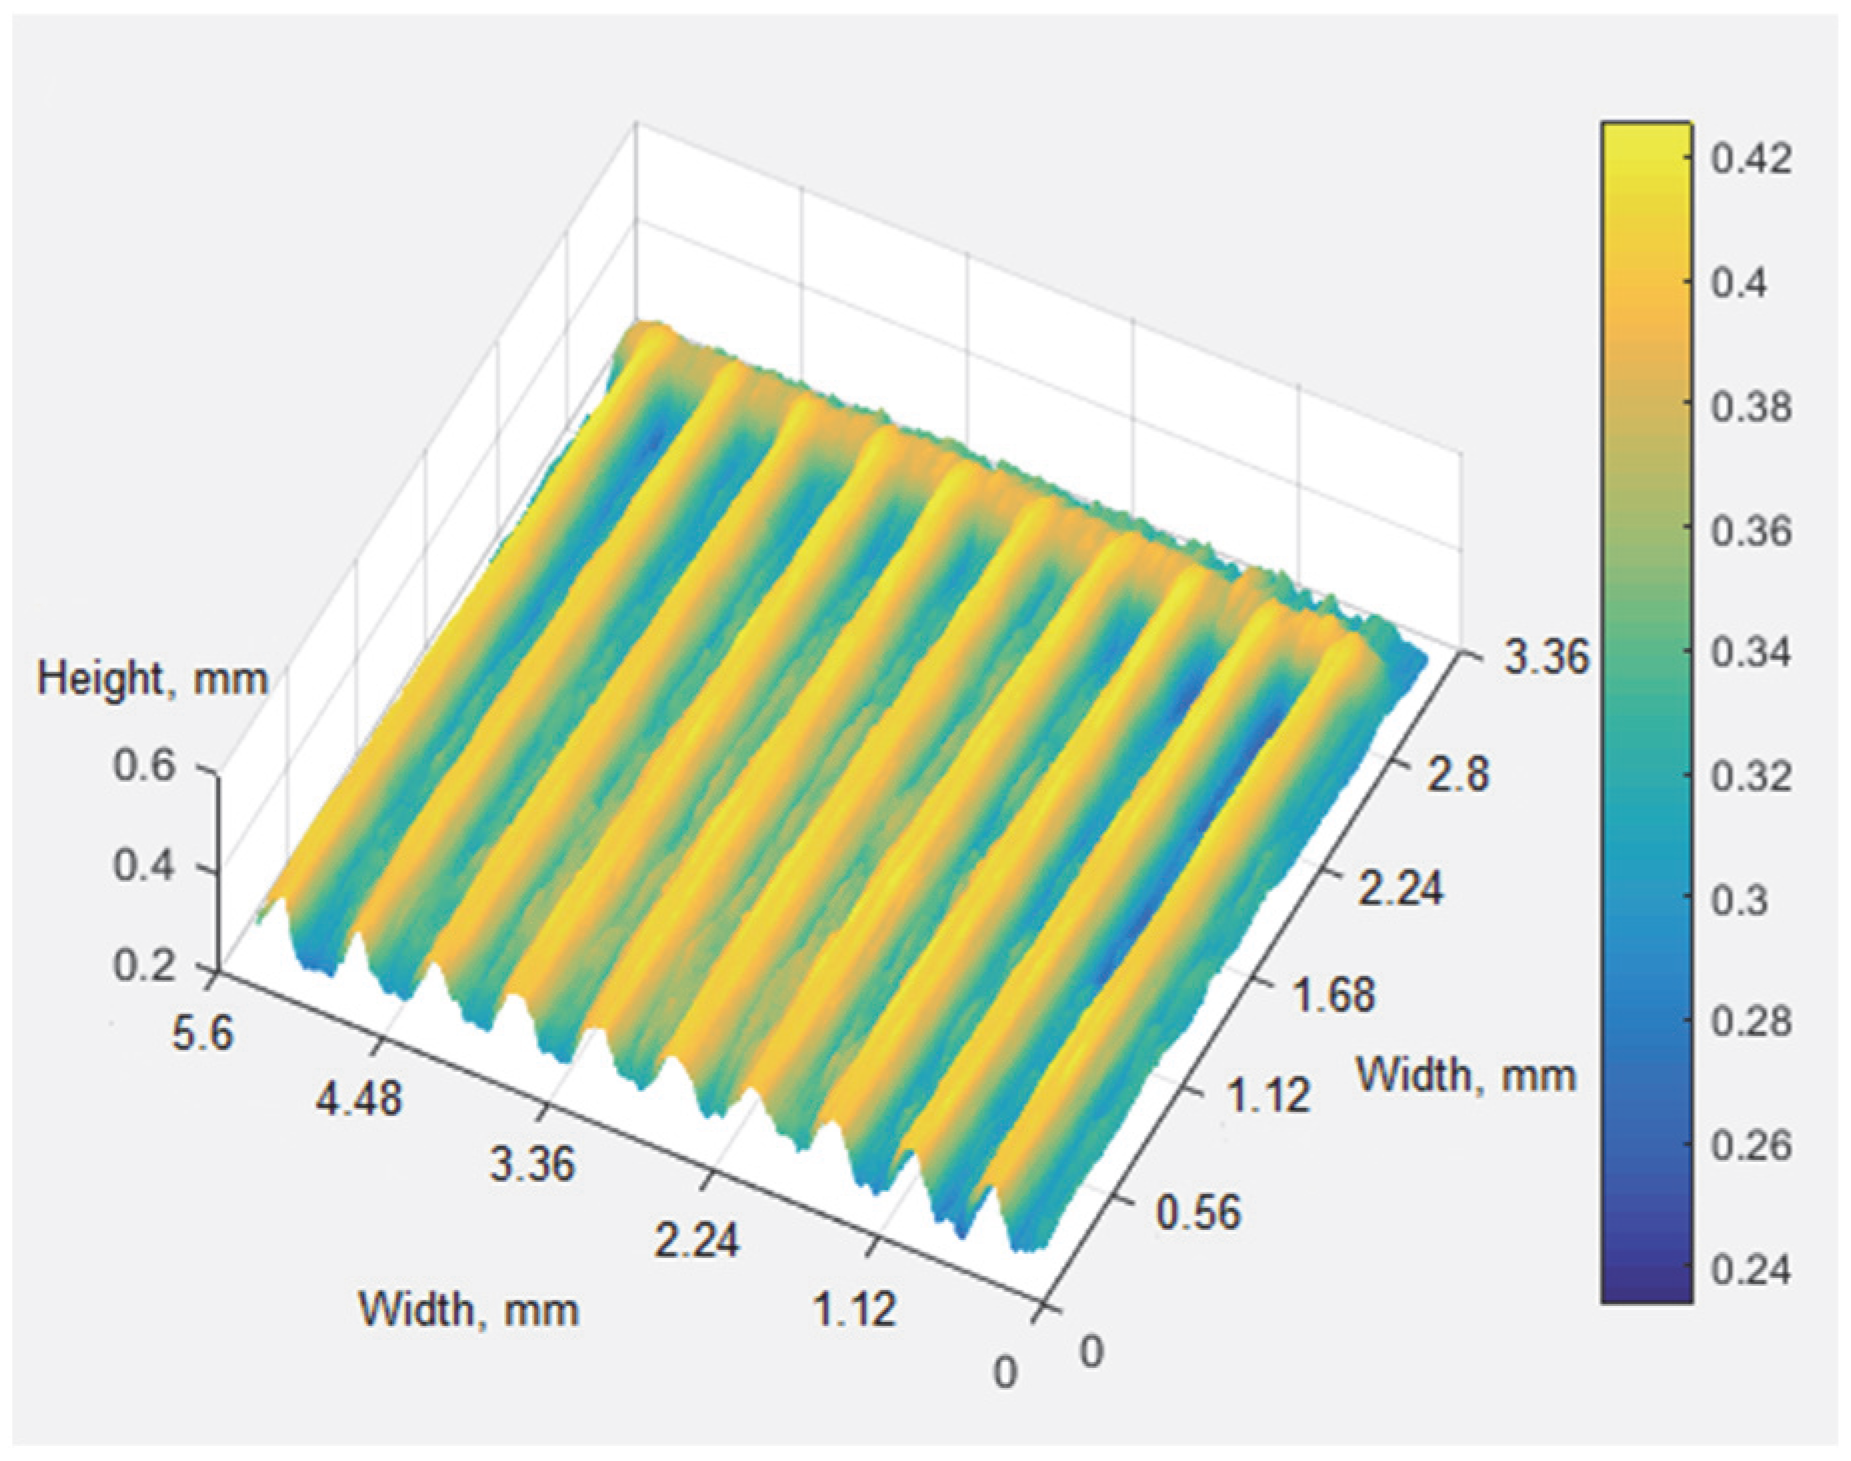
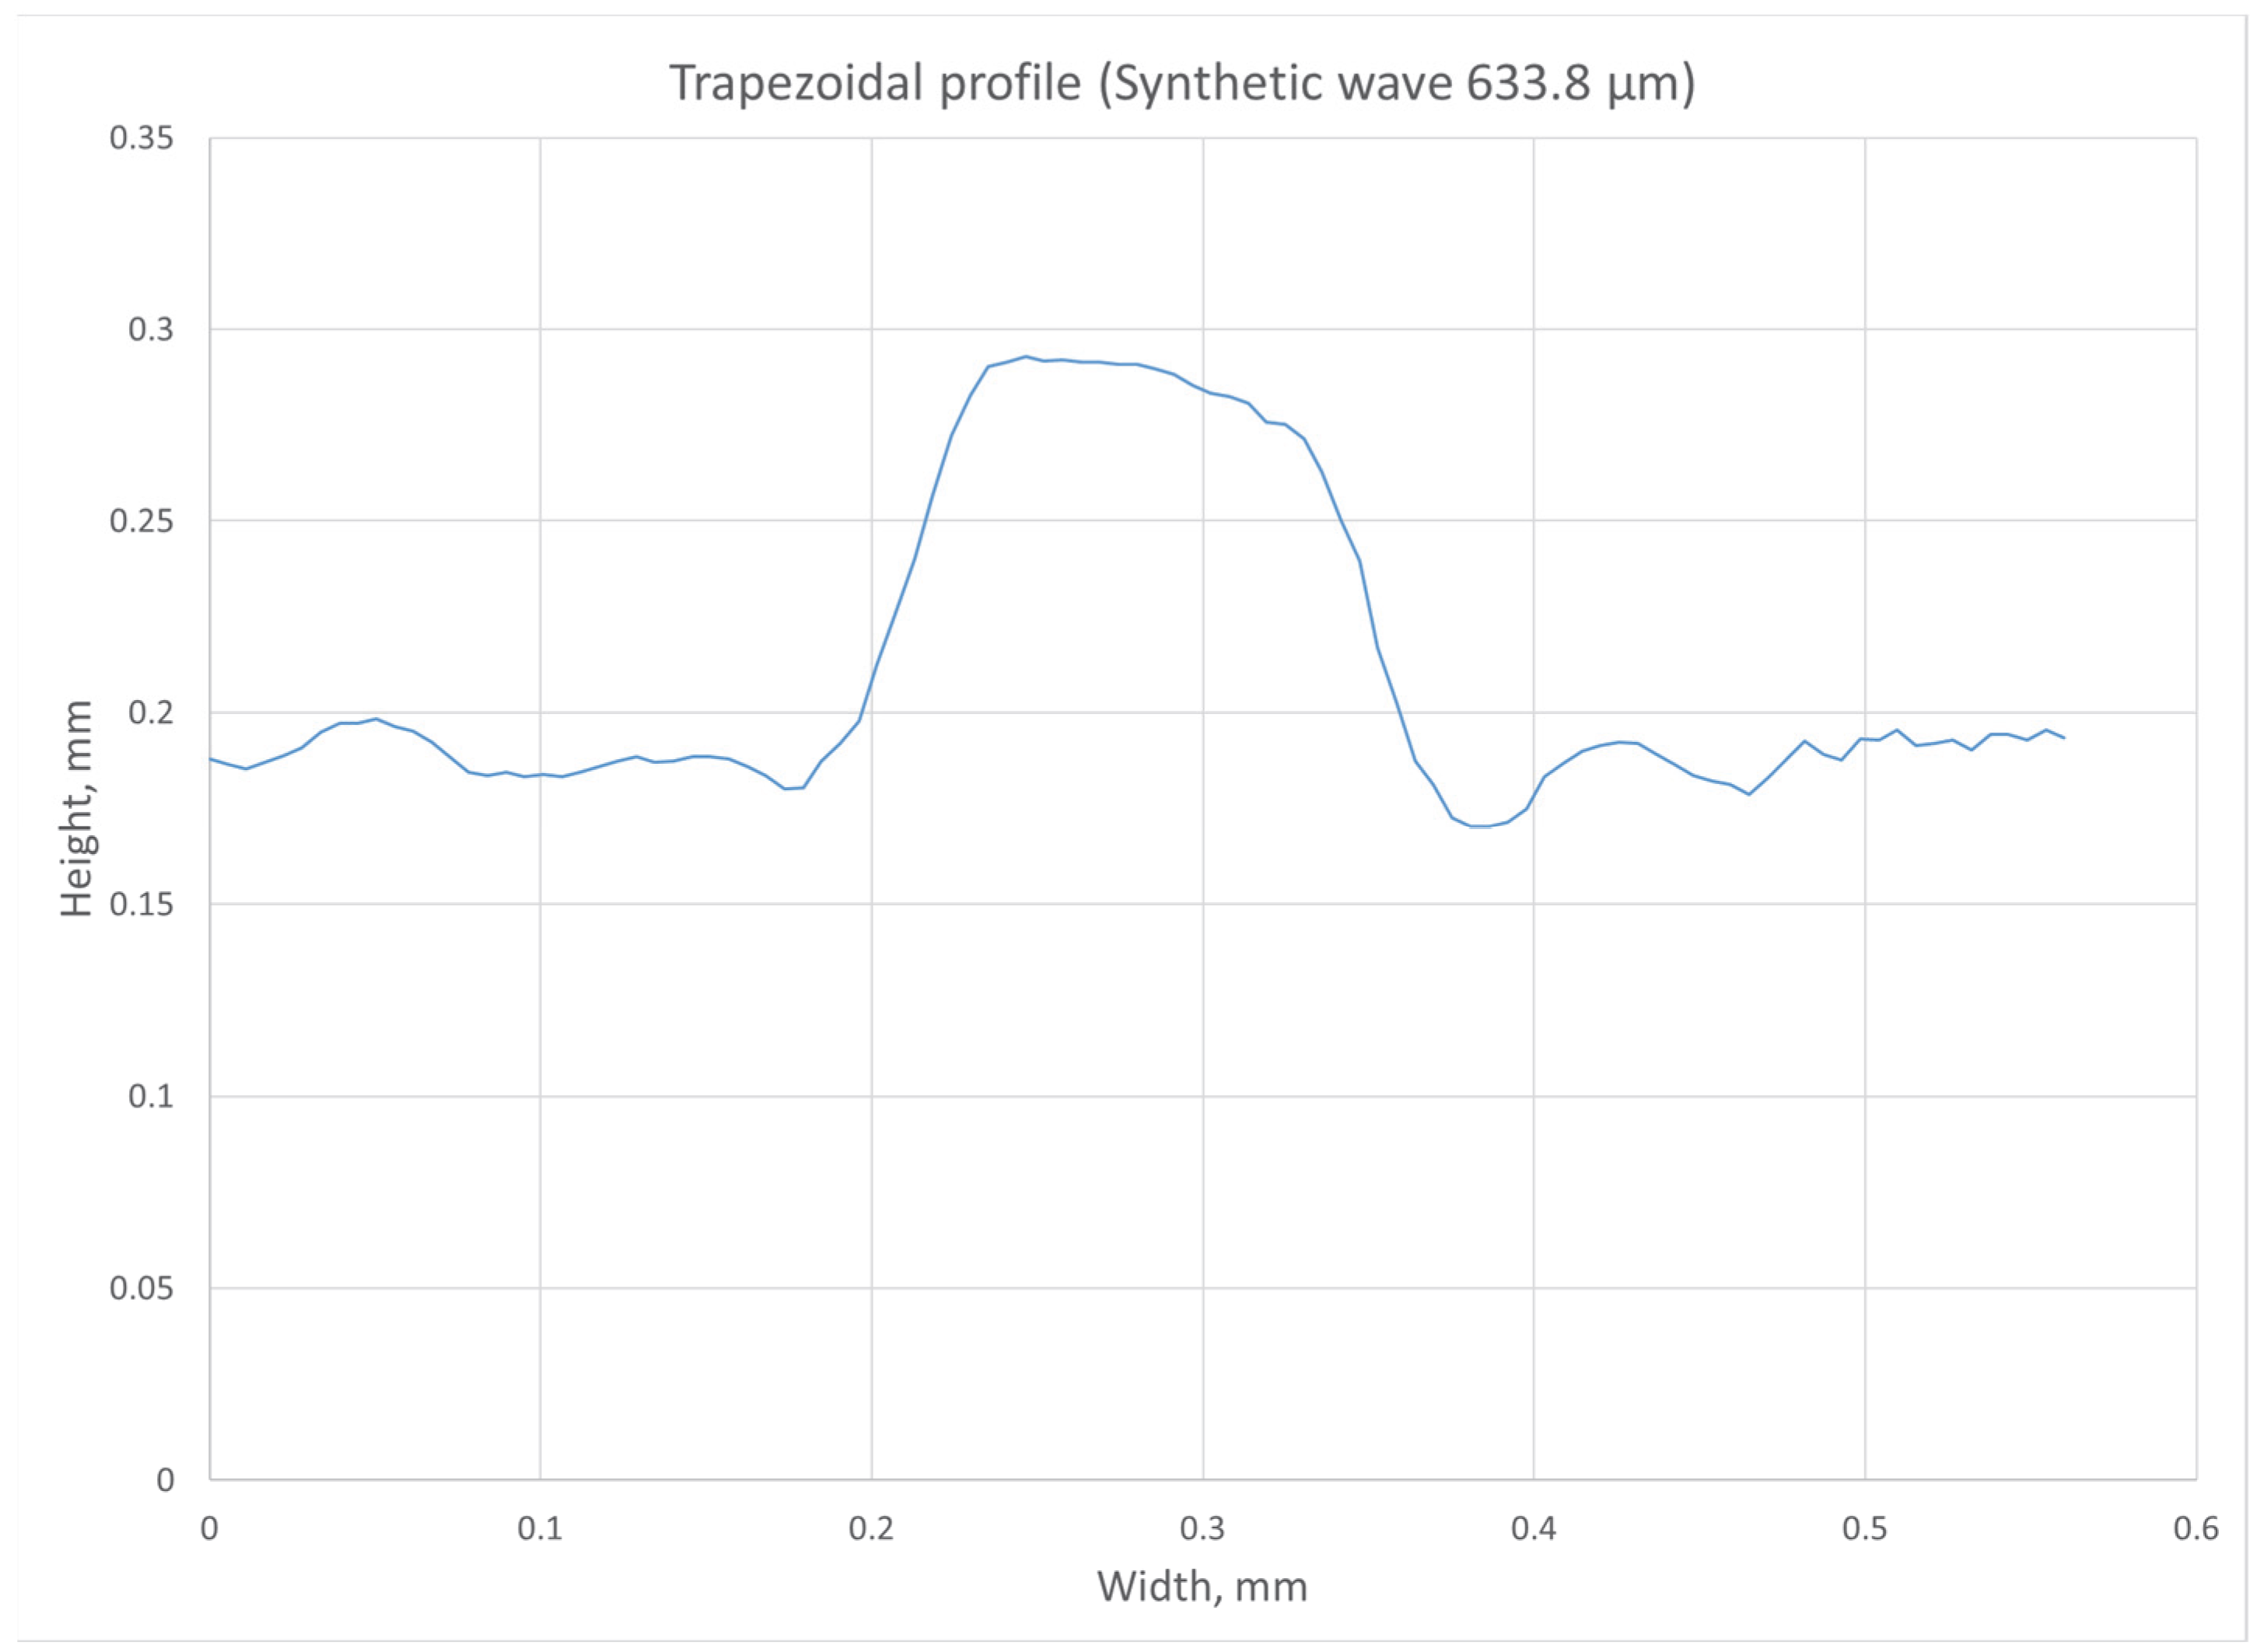
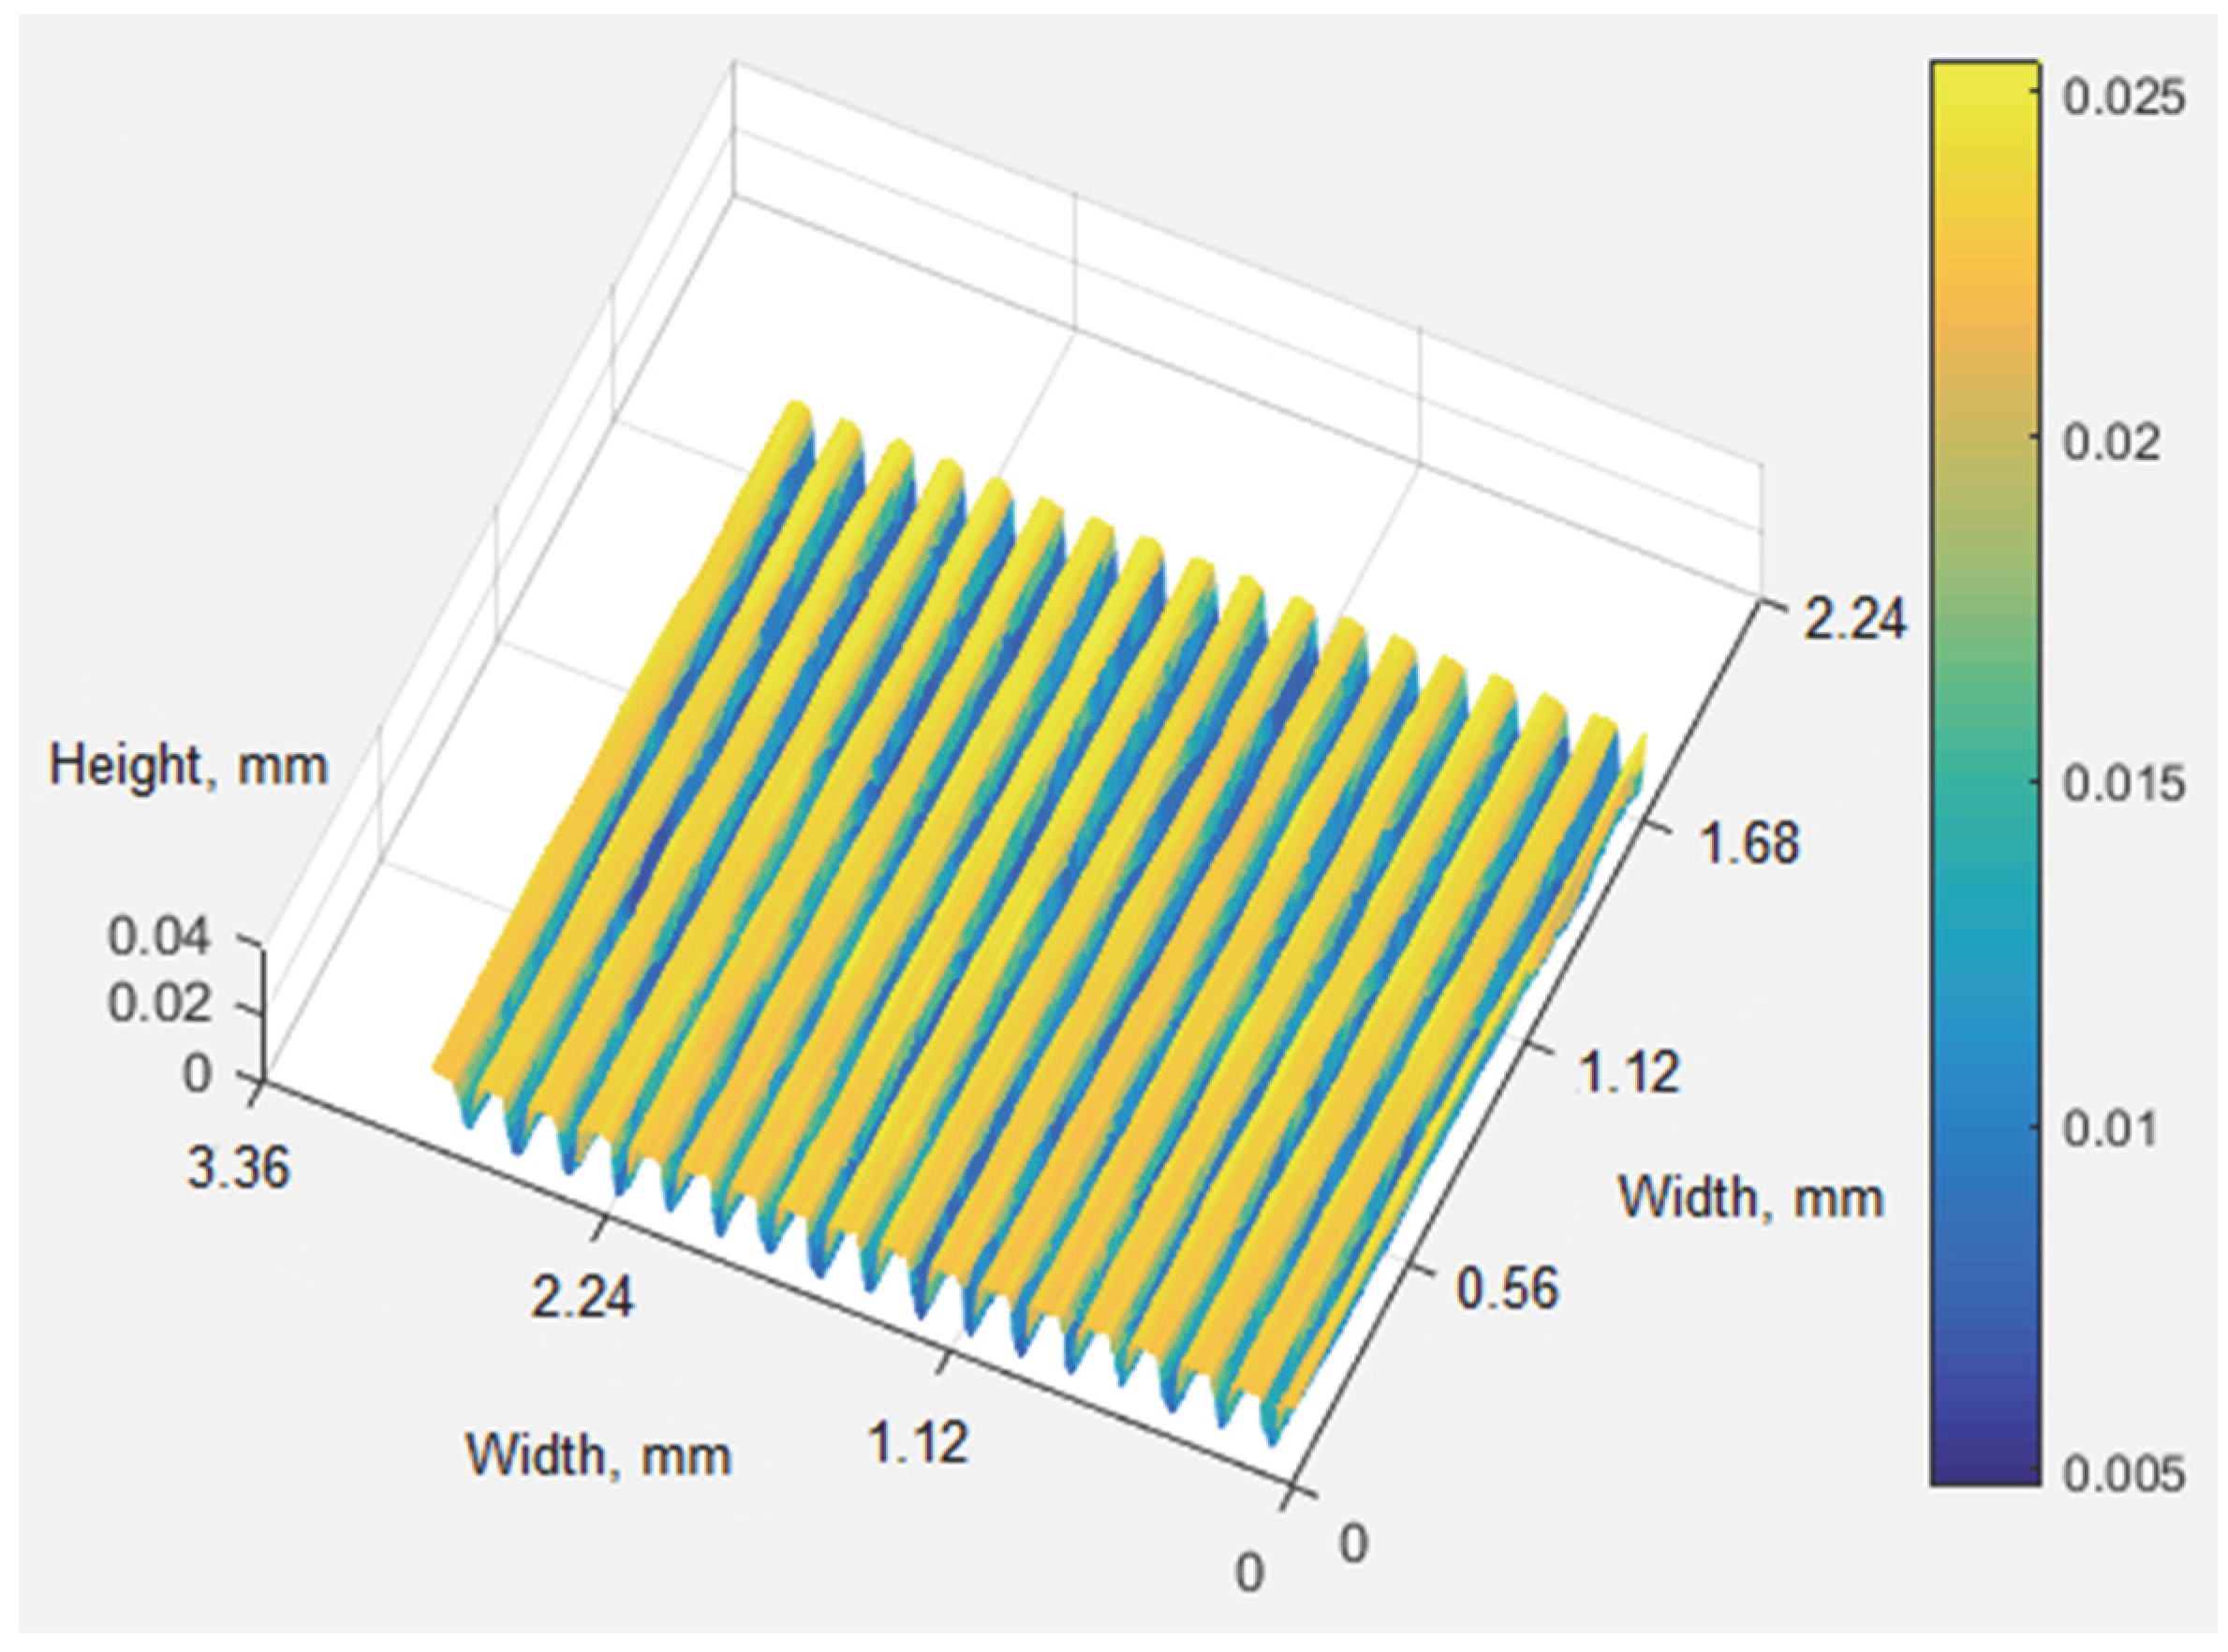
Table 2 shows the actual and measured dimensions of the 100 μm and 24.5 μm groove depth references on the experimental setup, respectively. The data were obtained by averaging over ten frames. The synthetic wavelength was 633.8 μm for the 100 μm groove depth reference and 158.6 μm for the 24.5 μm groove depth reference. The 3D visualization and profile slice are shown in
Figure 8 and
Figure 9, respectively, for the 100 μm groove depth reference and in
Figure 10 and
Figure 11, respectively, for the 24.5 μm groove depth reference.
The accuracy of the system in determining elevation differences was calculated as the standard deviation of the measured data. The assessment is presented in
Table 3.
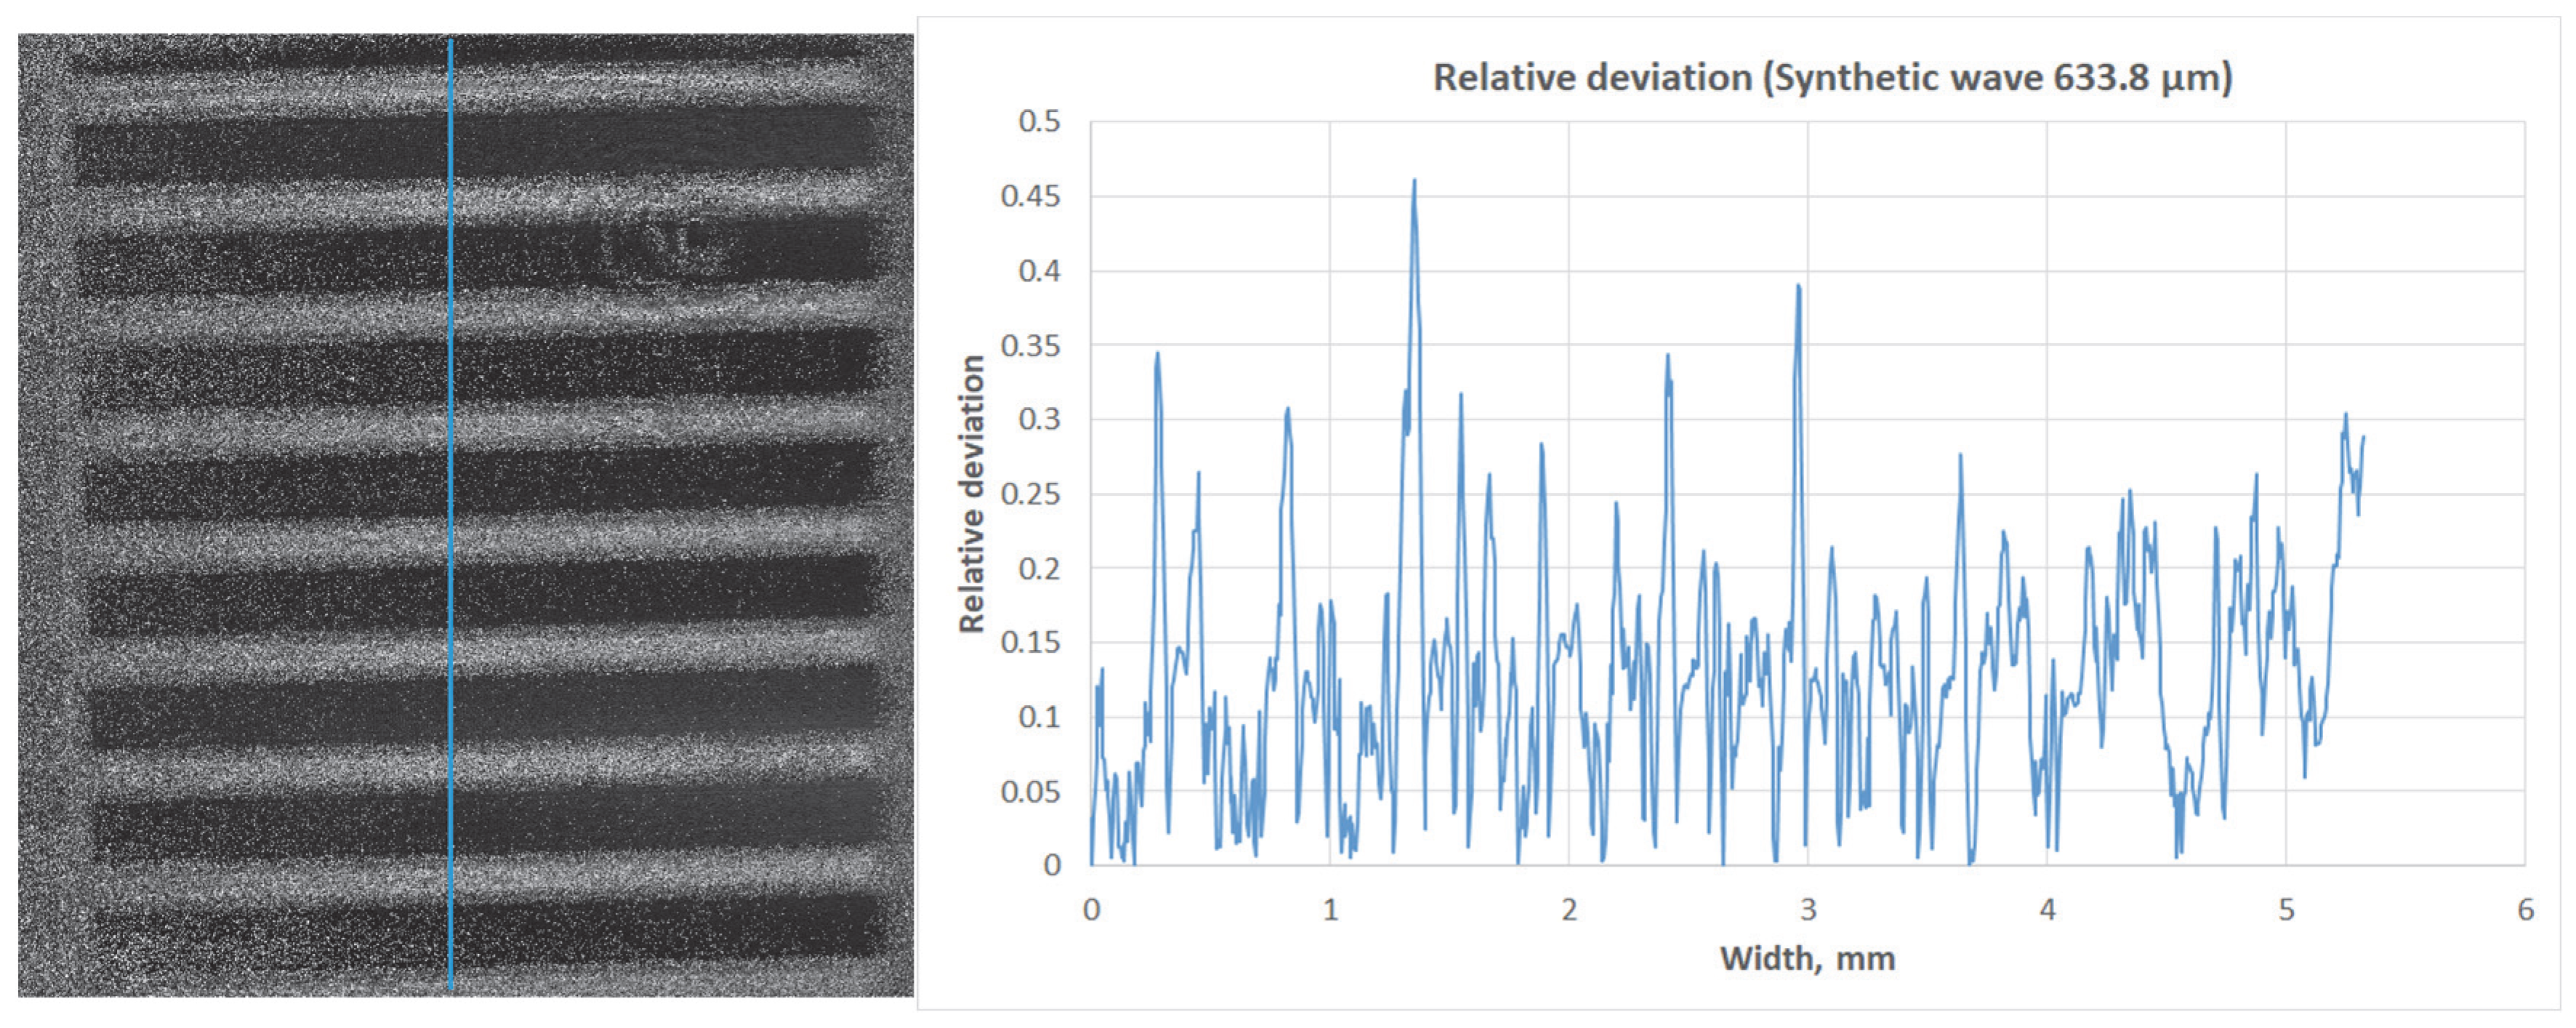
Figure 12 shows a graph of the relative deviation along a profile section of a standard with a height difference of 100 µm. According to calculations, the average relative error of the height differences across the profile width is approximately 11.6%.
The lateral deviation of 18.6% is quite high due to the spatial median filter used to generate the height map, as well as the selected receiver with a specific pixel size and reconstruction distance. The accuracy of lateral measurements can be improved by reducing the reconstruction distance (then the object field will be larger during Fresnel reconstruction), selecting a receiver with a smaller pixel size (or using subpixel sampling [
30]).
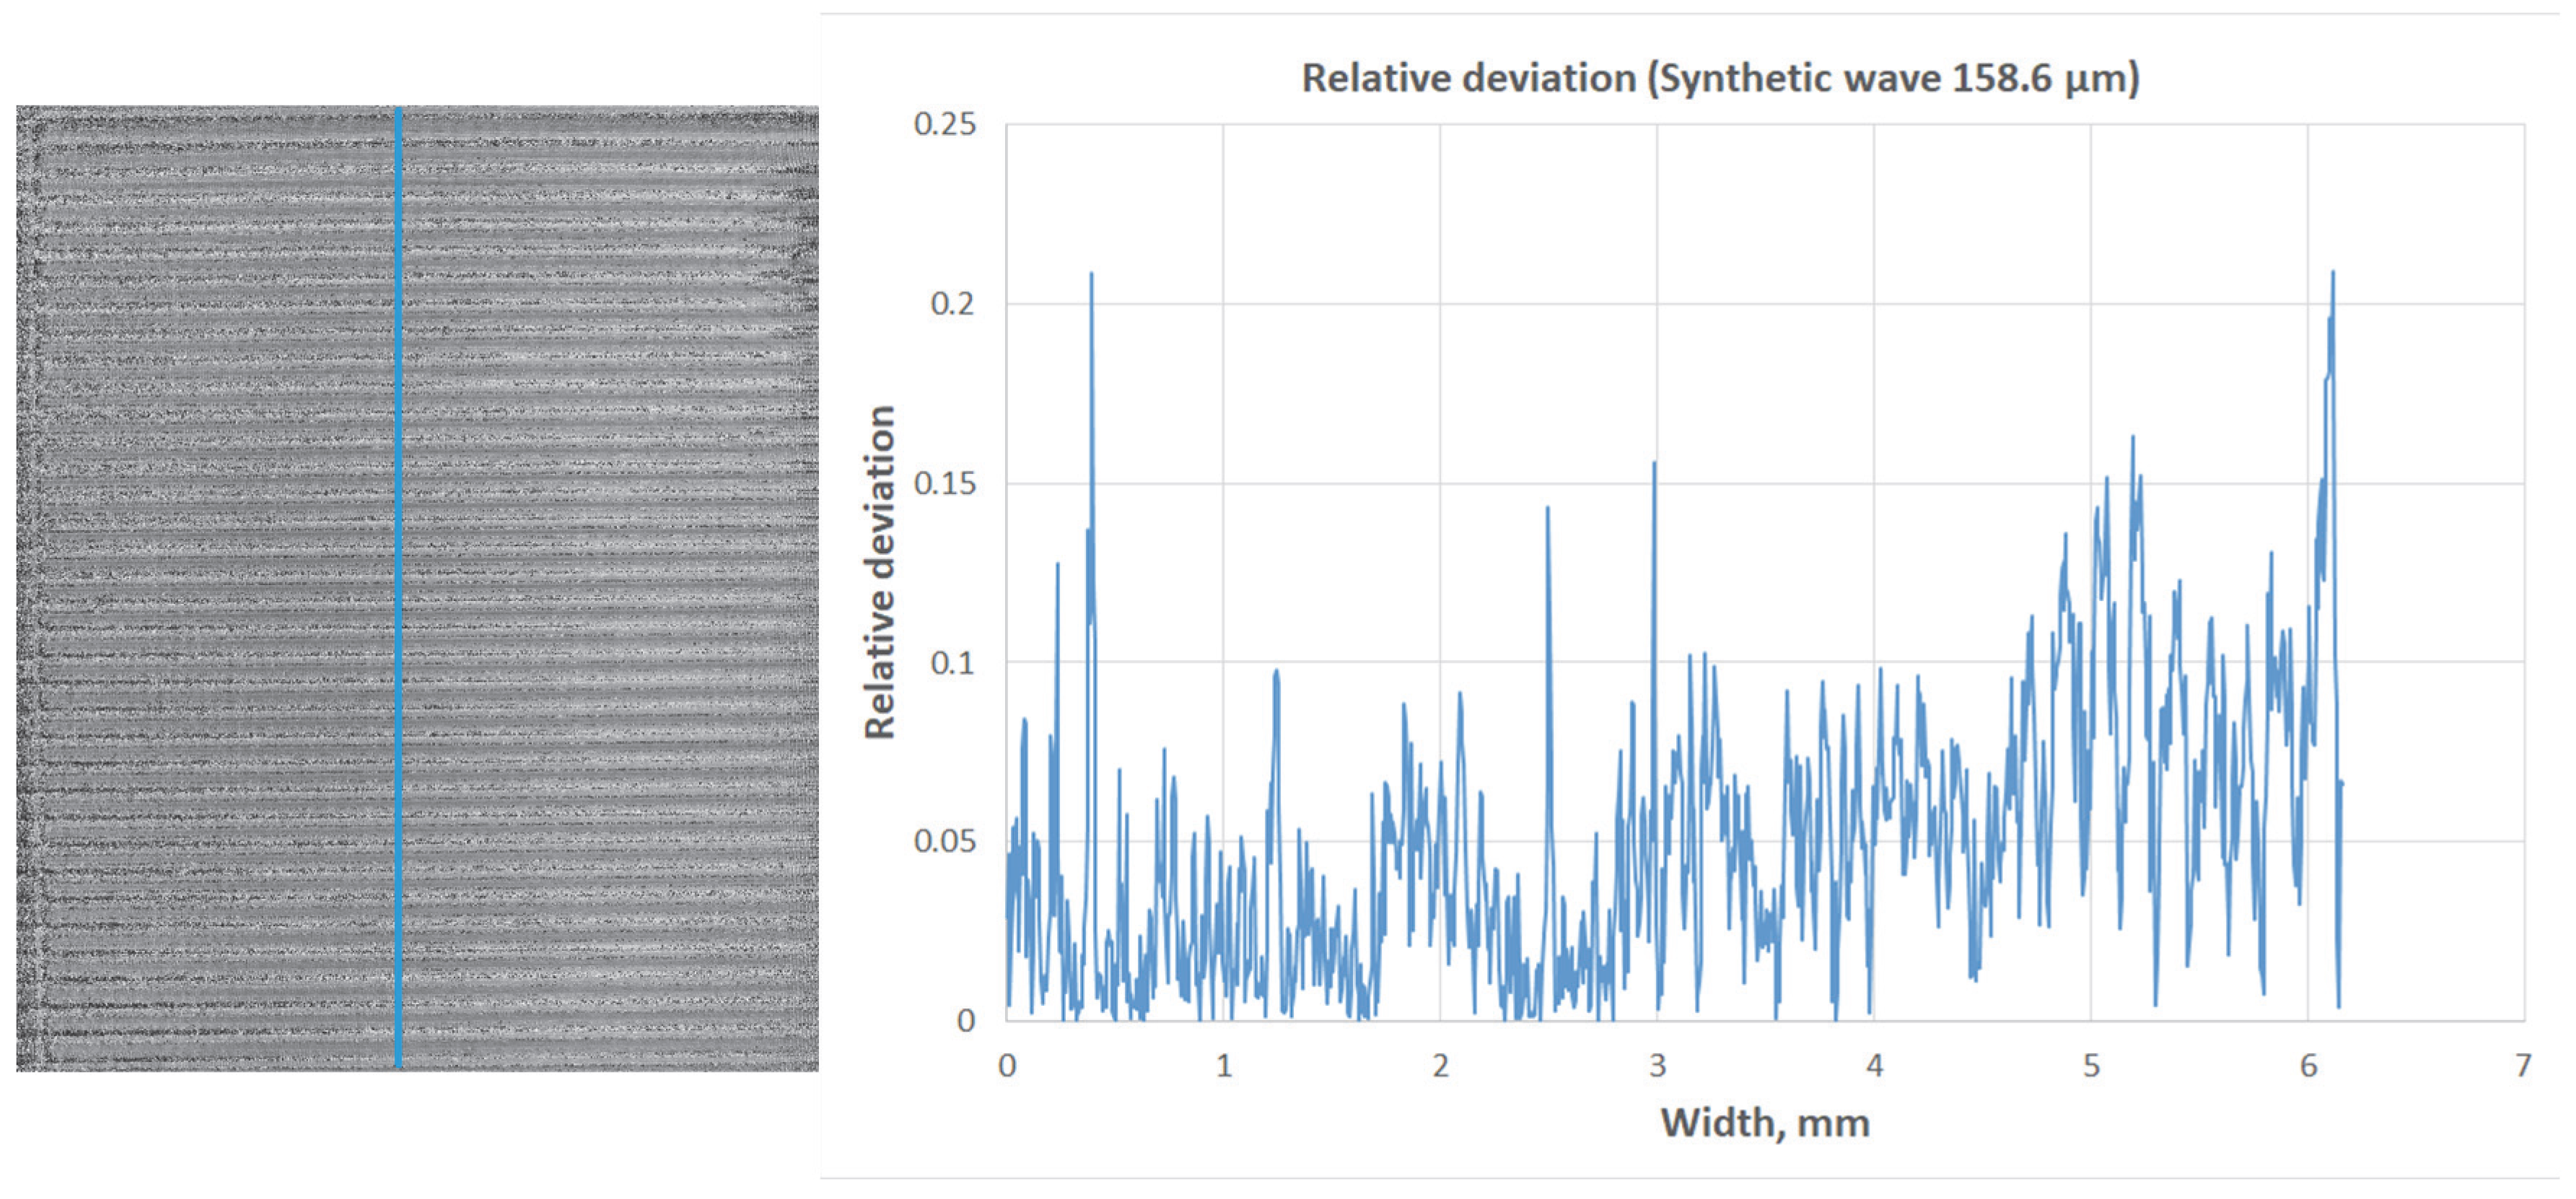
Figure 13 shows a graph of the relative deviation along a profile section of a standard with a height difference of 24.5 µm. According to calculations, the average relative error of the height differences across the profile width is approximately 5.3%.
Minimization of defocus noise is necessary to improve the quality of three-axis visualization and can be implemented, among other things, using deep learning networks, for example, U-net, proposed in the article [
31].
To check the measurability of horizontal dimensions, a measure with strokes, designed to check the resolution of optical systems, was also used. Averaging and measurement were performed for ten images. The measurement results were determined by manually counting pixels in the spatial domain as the following:
- (1)
25 μm stripe has a size of 30.7 ± 11.2 μm
- (2)
50 μm stripe has a size of 58.1 ± 11.2 μm
- (3)
100 μm stripe has a size of 103.3 ± 11.2 μm
- (4)
200 μm stripe has a size of 209.3 ± 11.2 μm.
It is demonstrated that despite the measurement error of 11.2 μm, the range of 50–100 μm was recognized well. Even smaller defects were recognized.
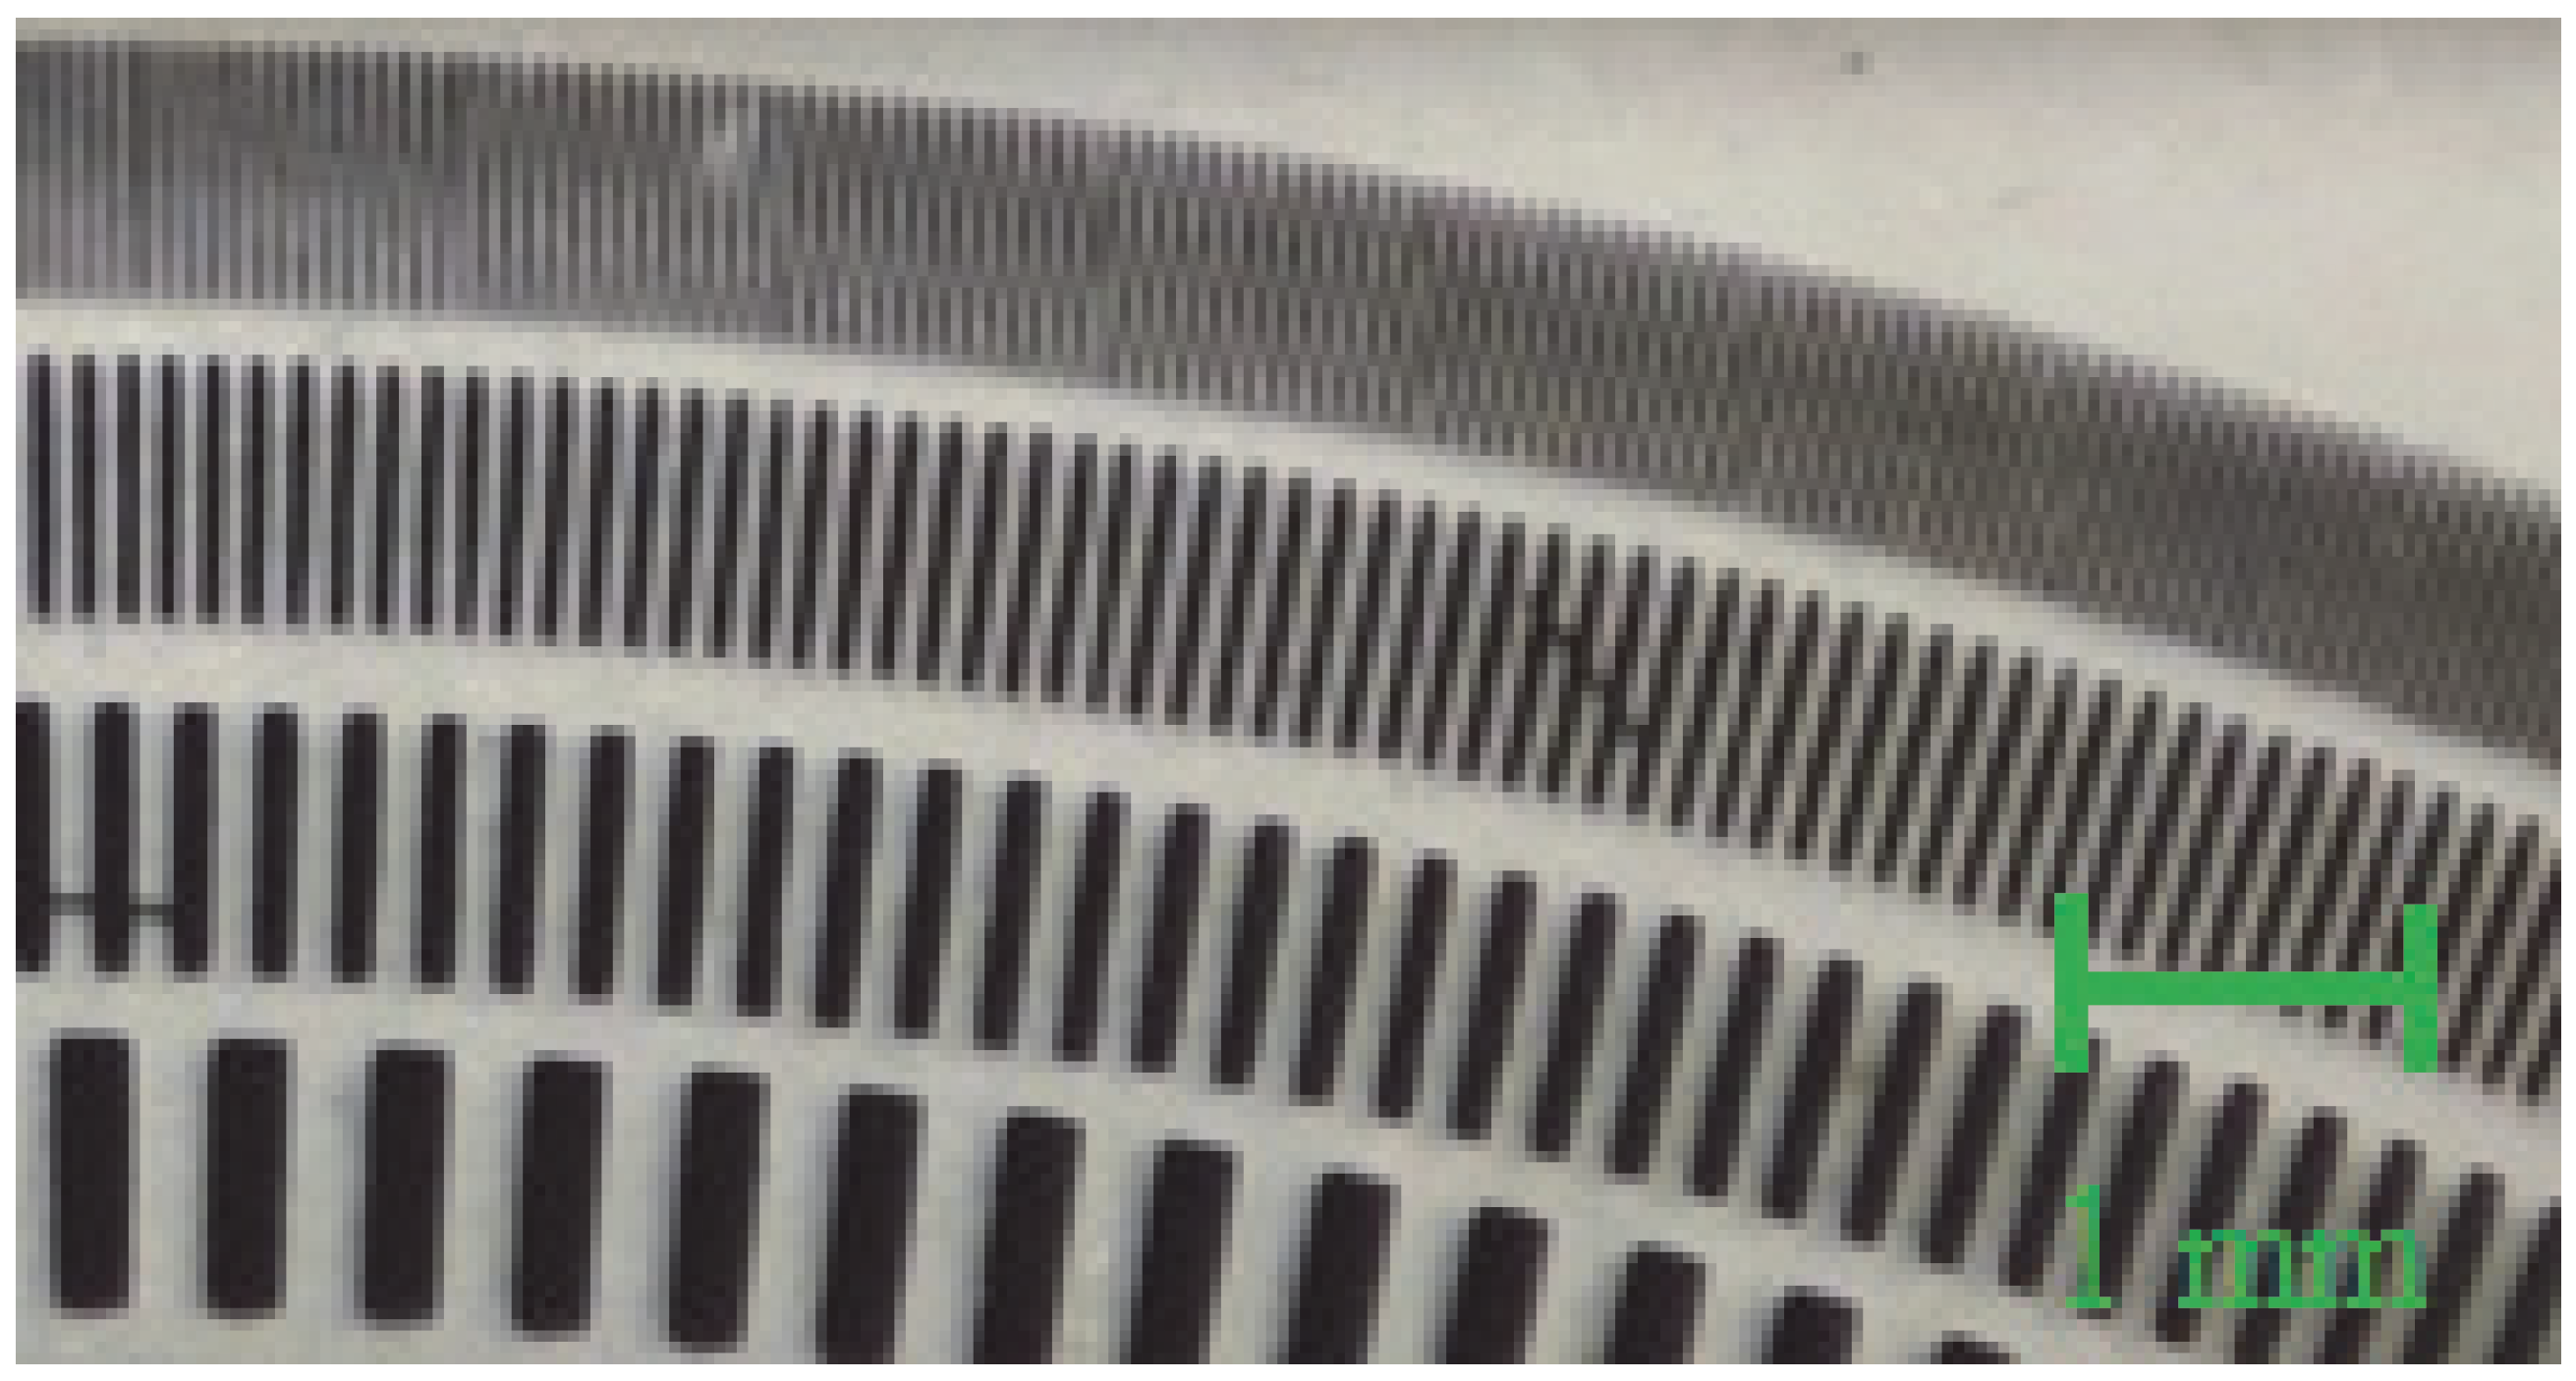
Figure 14 shows a snapshot of the spatial region with an indication of the scale.
5. Discussion
The results obtained in the work confirm the possibility of using dual-wavelength digital holography for non-destructive testing of surface microgeometry in the range of tens of micrometers. This expands the scope of application of digital holography, traditionally used mainly for measurements in the nanometer range. Unlike classical single-wavelength methods, the use of two close wavelengths made it possible to significantly increase the measured height range, while maintaining acceptable accuracy of phase measurements without the need to use phase unwrapping algorithms. A similar approach has already been discussed in the works of Di et al. [
24], but in this article, the system was implemented and tested on real samples with reproducible results.
At the moment, the developed system operates in laboratory conditions and is not intended for field use. Measurements may be affected by vibrations, wind influence, and temperature changes. These problems are solved by developing the housing and design, which are not the objectives of this work.
The detected relative measurement errors are within the limits comparable to the accuracies achieved in optical microscopy and visual analysis methods, but the proposed method does not require direct contact with the sample and can be used for objects with a complex surface shape. It is also important to note that the system allows visualizing not only height differences, but also the width of defects in the horizontal plane, which makes it a universal tool for a comprehensive assessment of the surface condition in a three-axis view.
From a practical point of view, the method can be useful in quality control tasks in the production of micromechanical components, microelectronic elements, jewelry, and precision surfaces. Particularly promising is the application of the developed technology within the framework of inline control on production lines, subject to further automation of image processing and an increase in the speed of obtaining holograms.
Future research directions include optimization of software for phase image reconstruction and filtering, as well as development of compact and integrable modifications of the experimental setup. Also of interest is adaptation of the method to a wider wavelength range and investigation of its applicability to translucent or multilayer materials, where phase ambiguity may be more pronounced.
