1. Introduction
The term “sentiment analysis” refers to deriving quantitative or objective results from a text by applying data analytics techniques such as natural language processing (NLP), machine learning, and statistical testing. Sentiment analysis, a subfield of text mining, determines whether a given text contains positive or negative emotions [
1]. It appears as a comment or reaction to any post on social networks. It is usually labeled as positive, negative, or neutral [
2]. To react to a post shared on a social network, the “Like” button can be pressed, or an option such as love, sad, anger, etc. can be used as a reaction by pressing a button. However, emojis on social media are not uniform and have differences. These buttons/emojis help indicate the emotional state of the post in question. They contain expressions that show whether we like the post or how much we like it. A similar reaction is shown only with “like” on Twitter (now X), a social network where written texts are shared. There are also “retweet” and “quote tweet” buttons. However, some social networks, such as LinkedIn and Facebook, use different emojis that reflect or are thought to reflect emotions when users long-press the “Like” button. Usually, these are reactions from readers to the shared post.
With the rapid spread of the COVID-19 pandemic, daily social activities such as business life, education and shopping, cinema and theatre visits, and museum visits have shifted towards social networks worldwide [
3]. Although restrictions have been imposed on daily life due to the pandemic, people have begun to meet their daily tasks and social needs through social networks. For this reason, the increased use of social networks has brought various problems [
4]. At the forefront of these problems are behaviors that aim to deceive and mislead people, such as sharing fake news, false information, and disinformation. This sharing of false information on social networks can cause serious harm [
5].
On the other hand, the shift of social life to digital platforms in parallel with the cheapening of internet access [
6], an increase in the use of social networks and the resulting inadequacy of digital media literacy [
7], and a misunderstanding of technological developments by society [
8] have created an opportunity to misinform and mislead the masses. In this context, many studies have been conducted on fake news spreading through social networks [
9,
10]. While the spread of fake news harms society, the emotional state of the people spreading it is also important [
11]. However, there is a lack of sentiment analysis of social network users in the spread of fake news in the literature. For example, news that includes hate speech or attacks on personal rights or obscene news will certainly affect social media users negatively [
12]. Thus, users will respond to this by giving abusive responses, threatening, or encouraging other users to turn to similar toxic content [
13]. At this stage, it is important to be able to analyze the sentiment of social media users. It is insufficient to evaluate them only under three main headings such as positive, negative, and neutral. However, in the literature, most of the studies used only these three main headings [
14]. In this context, the main focus of the study is to carry out a sentiment analysis of the people spreading these messages during the spread of fake news. In some studies on the emotional state of fake news shared on social networks, fear, hatred, surprise, and disgust modes emerged in misinformation and false stories, while joy, expectation, sadness, and trust were detected in proven real news [
15]. As a result, the content that most researchers [
16,
17,
18] used in their studies on any topic on a social network can only be instantly classified as positive, negative, or neutral in the literature. However, it is clear from the literature that studies in this direction are not sufficient, and more studies are needed. Therefore, this study analyzed tweets in seven different categories and differs significantly from other studies in this field. At the same time, studies in the literature cannot instantly categorize sentiment analysis in detail. Based on these deficiencies in the literature, an attempt was made to reveal emotions in the sharing of fake news spreading on social networks by conducting text mining with natural language processing (NLP) methods. In addition, the advantage of the BERT bidirectional encoder and transformers used in this study is that they analyze tweets by considering their relationship both forward and backwards, unlike other models that process texts sequentially. In the same vein, transformers implement a deep learning approach to process sequential data.
The main purpose of this research is to conduct a sentiment analysis of fake news spread on Twitter, one of the microblog social networks, and to reveal which mood is more effective with respect to spreading fake news. For this reason, a comprehensive study was conducted by conducting a sentiment analysis using a real-time fake news detection system created on a cloud computing system. Thus, an attempt has been made to eliminate the lack of research in this field in the literature. The main element that makes this study unique is that it does not only analyze texts shared on social networks in negative, positive, or neutral terms but also divides them into seven categories. These categories are hate, sexism, politics, insult, obscenity, toxicity, and threat, which indicate neutrality. In addition, the developed system was able to determine the sentiments of people sharing fake news on Twitter.
The research questions created within this framework are as follows:
2. Related Works
The effects of fake news and sentiment analysis with respect to social networks have been growing areas of research in recent years. Fake news is shared specifically to manipulate online social network users on a certain topic [
19] and direct them to a certain emotional state [
20]. Thus, users will tend to spread news more with the emotional state they are in. For example, fake news containing hate speech will quickly turn into sharing on social networks due to the effect it has on the user, possibly creating a general mood disorder in society [
21]. In this respect, it is important to undertake a sentiment analysis of fake news. Several studies have focused on identifying fake news using various machine learning and deep learning techniques. For instance, [
22] provided a comprehensive overview of fake news detection approaches, highlighting the importance of social context and propagation patterns. Similarly, [
23] analyzed the spread of true and false news on Twitter, emphasizing the role of social interactions. Sentiment analysis has been used to explore user reactions to fake news. For example, [
24] examined the emotional impact of fake news during the COVID-19 pandemic, revealing how misinformation amplifies negative emotions. Another study by [
25] employed sentiment analysis to detect fake news spreaders on Twitter. The adoption of transformer models like Bidirectional Encoder Representations from Transformers (BERT) has revolutionized text classification tasks. Ref. [
26] introduced BERT as a pre-trained language model, which has been widely applied in fake news detection. Integrating BERT with deep learning techniques has led to further enhancements in fake news detection, achieving high accuracy on benchmark datasets. The scalability of fake news detection systems has been addressed using cloud computing. Ref. [
5] proposed a cloud-based architecture that enables real-time processing of large datasets for misinformation detection, showcasing the advantages of distributed systems.
To improve the accuracy rates obtained, the performances of different machine learning and deep learning algorithms have also been compared in the literature.
Beyond traditional deep learning architectures, researchers have also explored factorization-based methods, such as Sparse and Graph Regularized CANDECOMP/PARAFAC (SGCP), to detect fake news in social networks. The researchers model the users and news using a third-order tensor to maintain sparseness and graph structures in the news factor matrix. It outperforms fake news detection thanks to the association structures in the original data space. Extensive experiments on datasets have shown that SGCP can be efficiently and successfully adapted. The authors suggest a novel solution that integrates content and link approaches [
27].
In addition to models specifically designed for low resource scenarios, related task-agnostic models, such as KALD (Knowledge Augmented Multi-Contrastive Learning) [
28], can also adapt to sentiment analysis tasks with the benefit of its multi-contrastive learning and lexicon-based knowledge integration. The model is trained with category-wise contrastive learning (CCL) to disentangle both emotions and concepts, like sentiment polarity. This knowledge-based approach is able to achieve better abusive content classification performance in low-resource settings than traditional approaches.
Also, [
29] presents an improved method for sentiment analysis of short texts. The study used a hybrid machine learning model, the Enhanced Vector Space Model (EVSM), and Hybrid Support Vector Machine (HSVM) classifiers. The main objective is to understand the semantic relationships between words by transforming social media texts into high-dimensional vector spaces. In addition, there are sentiment dictionaries and enhancement. Sentiment dictionaries were extended using the Stanford GloVE tool. These dictionaries were used to increase the sentiment weights within a text. Successful hybrid models, SVM, and decision tree algorithms were combined, and this method improved sentiment classification in short texts. In terms of dataset and application area, positive, negative, and neutral sentiment classifications were performed using short text datasets such as Twitter and SMS. The study achieved an accuracy rate of 92.78%. This study demonstrated the importance of using advanced methods such as EVSM to emphasize the semantic dimensions of texts and increase the accuracy of sentiment analysis.
Moreover, [
30] aimed to contribute to the development of public health policies based on sentiment analysis by analyzing public opinions about monkeypox via Twitter. In this study, data labeling with VADER and TextBlob tools, text vectorization with CountVectorizer and TF-IDF techniques, and a combination of algorithms such as SVM, Logistic Regression, Multilayer Perceptron (MLP), and Naïve Bayes were used. An accuracy rate of 93.48% was achieved with the combination of TextBlob annotation, lemmatization, and CountVectorizer.
On the other hand, the aim of the study in [
15] is to evaluate and compare machine learning (ML) and deep learning (DL) methods used to perform sentiment analysis on Twitter data related to the COVID-19 pandemic. A systematic literature review was conducted and 40 studies that performed sentiment analysis on Twitter datasets were examined. The techniques used were divided into three categories: lexicon-based, traditional ML-based, and DL-based methods. Among the algorithms used for sentiment analysis classification, models such as BERT, RoBERTa, and XLNet were found to be particularly successful. BERT-based models provided the highest accuracy rate in sentiment analysis tasks (93.89%). While dictionary-based approaches offer convenience at the beginner level since there is no need for labeled data, they were insufficient in context-sensitive analyses. DL models performed better on context and linguistic features, but the need for large-scale labeled data was stated as a significant challenge.
Furthermore, in the study of [
31], a Gated Attention Recurrent Network (GARN) was used to classify positive, negative, and neutral emotions in Twitter data. The model adopted a hybrid approach with attention mechanisms and RNNs (Recurrent Neural Networks) to capture the semantic features of the texts. In this study, classical preprocessing steps such as tokenization, stopword extraction, and lemmatization were applied in the data preprocessing stage. Then, text features were extracted with a new weighting method called LTF-MICF (Log Term Frequency-based Modified Inverse Class Frequency). The effect of unnecessary features was reduced by using a Hybrid Mutational White Shark Optimizer (HMWSO). The model used in the study was used for emotion classification with GARN, which is a combination of hybrid Bi-GRU and an attention mechanism. GARN outperformed other methods (Bi-GRU, Bi-LSTM, CNN) with an accuracy rate of 97.86%. With the LTF-MICF method, the attention mechanism increased classification accuracy and sensitivity. This study aims to fill this gap and provide a wider application area by using a BERT-based model and cloud infrastructure.
Also, [
17] analyzed the emotional reactions of users during the third COVID-19 national lockdown in the United Kingdom using Twitter data. The main focus of this study is to compare lexicon-based tools (TextBlob, VADER, SentiWordNet) and machine learning models (Random Forest, Multinomial Naïve Bayes, Support Vector Classification (SVC)). In this context, 77,332 tweets based on geolocation were collected using Twint and Twitter Scholar API. Tweets were classified as positive, negative, or neutral with lexicon-based tools. Data preprocessing and feature extraction methods such as BoW, TF–IDF, and Word2Vec were performed in machine learning models. Models were evaluated in terms of accuracy, F1 score, and other metrics. The SVC model achieved a 71% accuracy rate with TF–IDF feature extraction. In lexicon-based tools, VADER provided higher accuracy due to its compatibility with social media texts. While lexicon-based approaches are fast and easy to implement, they are less context-sensitive. While machine learning methods provide higher accuracy with large datasets, the need for labeled data is a limiting factor.
The aim of the study by [
16] is to analyze people’s emotional reactions in real time during the pandemic. In this study, in addition to analyzing positive, negative, and neutral emotions, six types of emotions were classified as surprise, disgust, anger, happiness, fear, and sadness. A total of 153,528 tweets and COVID-19 case data obtained from ECDC were analyzed. The tool used in the study, VADER, is a widely used lexicon-based tool for analyzing social media texts. The Nkryst lexicon is an extended dictionary that can classify emotions specific to the language structure of Greek. The correlation of both lexicons with COVID-19 cases was evaluated. The processing times of Python (3.10) and VB.NET tools were compared, according to which Python gave slower results and VB.NET gave much faster results. Negative emotions, especially surprise and disgust, were the most dominant emotions associated with COVID-19. Significant differences were found in the positive, negative, and neutral polarity analyses between VADER and the Nkryst lexicon. It was observed that people’s interest in COVID-19 decreased over time, and this affected the intensity of the emotional response.
Moreover, [
18] conducted both sentiment and text analysis using Twitter data to examine the public discourse on COVID-19 and MPox. Accordingly, the author analyzed the emotional reactions and general text content of the discussions on COVID-19 and MPox simultaneously on Twitter. The aim of this study is to fill the current research gap in analyzing tweets that discuss COVID-19 and MPox together. A total of 61,862 tweets published between 7 May 2022 and 3 March 2023 were analyzed using the Hydrator application. For sentiment analysis, VADER (Valence Aware Dictionary for sEntiment Reasoning) was used. For text analysis, steps such as tokenization, removal of stop words, and word frequency analysis were performed. The study found that 46.88% of the tweets contained negative sentiments, 31.97% contained positive sentiments, and 21.14% contained neutral sentiments. Keywords such as “COVID19” and “monkeypox” were used extensively in the analyzed tweets. In the tweets, references were found for Biden, Ukraine, HIV, and other topics. This study is notable for being the first to conduct sentiment analysis on COVID-19 and MPox simultaneously. In addition, its position in the literature was strengthened by comparing it with 49 previous studies.
Ref. [
32] examined the current trends and challenges of TSA by classifying Twitter-based sentiment analysis methods in detail in terms of machine learning, lexicon-based, and hybrid approaches. The aim of this study is to classify and compare the methods used in the field of TSA, such as machine learning, lexicon-based, and hybrid approaches. In addition, it explains the basic concepts of TSA and examines the current trends. In the study, more than 60 studies on TSA were categorized and analyzed. TSA approaches are divided into three main groups. These are, respectively, machine learning-based approaches; supervised and unsupervised learning methods such as Naïve Bayes, SVM, Neural Networks, lexicon-based sentiment dictionaries, and corpus-based methods; and systems where machine learning and lexicon-based methods are combined as a hybrid approach. In addition, the study addressed problems such as sentiment analysis of short texts, lack of context sensitivity, and insufficient labeled data. In the machine learning-based approach, supervised learning methods provided the best results in terms of sentiment. In particular, SVM stands out with its high accuracy rate. Lexicon-based approaches provide fast results without the need for labeled data, but have low context sensitivity. Hybrid approaches, although they provide higher accuracy, are limited in terms of scalability due to high processing costs. While providing a detailed review of the current state of TSA, it also offers guiding suggestions for future studies.
More recently, the causal-themed keyword-based text classification method has been promoted in the literature. This approach leverages causality-informed keyword extraction with the feedback mechanisms from large language models (LLMs) for enhancing classification quality and reliability. The fundamental concept is to see if certain words in the text lead to one class or another, and to concentrate on those keywords that have a direct impact, not just statistical correlations. This method makes a decision more trustworthy and interpretable in terms of sentiment analysis, abusive text classification, or social media content analysis [
33].
This study differs from other studies in terms of focusing on cloud infrastructure, using the BERT algorithm in real-time analysis, and in terms of speed as well as scalability. For example, although the studies discussed above used Twitter data, it can be seen that the datasets are limited and small. In addition, when we look at the purpose of the mentioned studies, instead of conducting detailed sentiment analysis, they examined the existing three categories in the literature as positive, negative, or neutral. In this context, comparisons were made by measuring the performance of different models. In this study, a large dataset was created by collecting 99 million tweets. With this dataset, sentiment analysis was carried out in real time, not only with respect to positive, negative, or neutral sentiments but also in terms of the seven different categories of hate, insult, obscenity, politics, sexism, threat, and toxicity. Another difference related to this study is that in addition to all these detections being real-time detections, they were also protected from cyber threats by using cloud computing infrastructure.
Table 1 provides a summary of the purposes of the studies discussed above, the datasets used, and their success rates.
3. Research Method
In this study, the Cross-Industry Standard Process for Data Mining (CRISP-DM) methodology [
34] was employed to ensure a structured and iterative approach to the development and evaluation of the sentiment analysis model. CRISP-DM is a widely recognized framework in data science and analytics, consisting of six key phases: Business Understanding, Data Understanding, Data Preparation, Modeling, Evaluation, and Deployment. Each phase was adapted to the specific requirements of this research, as follows:
Phase 1—Business Understanding: The primary objective of this research is to develop a cloud-based sentiment analysis system using the BERT algorithm to detect fake news and analyze sentiments in Twitter data. This phase involved defining research goals, identifying key stakeholders, and determining the scope of the analysis, including the integration of real-time data processing and scalability within a cloud environment.
Phase 2—Data Understanding: Data was collected from Twitter using Twitter API, focusing on tweets related to (mention topics, such as Coronavirus, Corona, covid-19,etc.). Initial exploration included an analysis of data volume, data distribution, and key linguistic characteristics such as hashtags, mentions, and URLs, as these elements significantly influence text preprocessing and feature extraction.
Phase 3—Data Preparation: During this phase, raw Twitter data was preprocessed to ensure consistency and quality. This step included tokenization, lemmatization, and the removal of noise such as emojis, stop words, and special characters. Additionally, the dataset was annotated for sentiment polarity (hate, sexism, politics, insult, obscenity, toxicity, and threat) and fake news categorization using both automated and manual methods.
Phase 4—Modeling: The BERT-based sentiment analysis model was developed in this phase. Pre-trained BERT models were fine-tuned on the annotated dataset to enhance the model’s ability to detect contextual sentiments and classify fake news accurately. Hyperparameter tuning and cross-validation were applied to optimize the model’s performance.
Phase 5—Evaluation: The model’s performance was evaluated using metrics such as accuracy, precision, recall, and F1 score to ensure robustness. Comparative analysis was conducted against baseline models, highlighting the advantages of the BERT-based approach.
Phase 6—Deployment: The final phase involved deploying the sentiment analysis system in a cloud environment to enable real-time processing and scalability. Tools such as MS Azure were used for deployment. The system was tested for latency, throughput, and reliability under various load conditions.
By following the CRISP-DM methodology, this research ensured a systematic approach to the development of the sentiment analysis system, addressing both technical and practical challenges in data preprocessing, modeling, and deployment.
4. Proposed Work
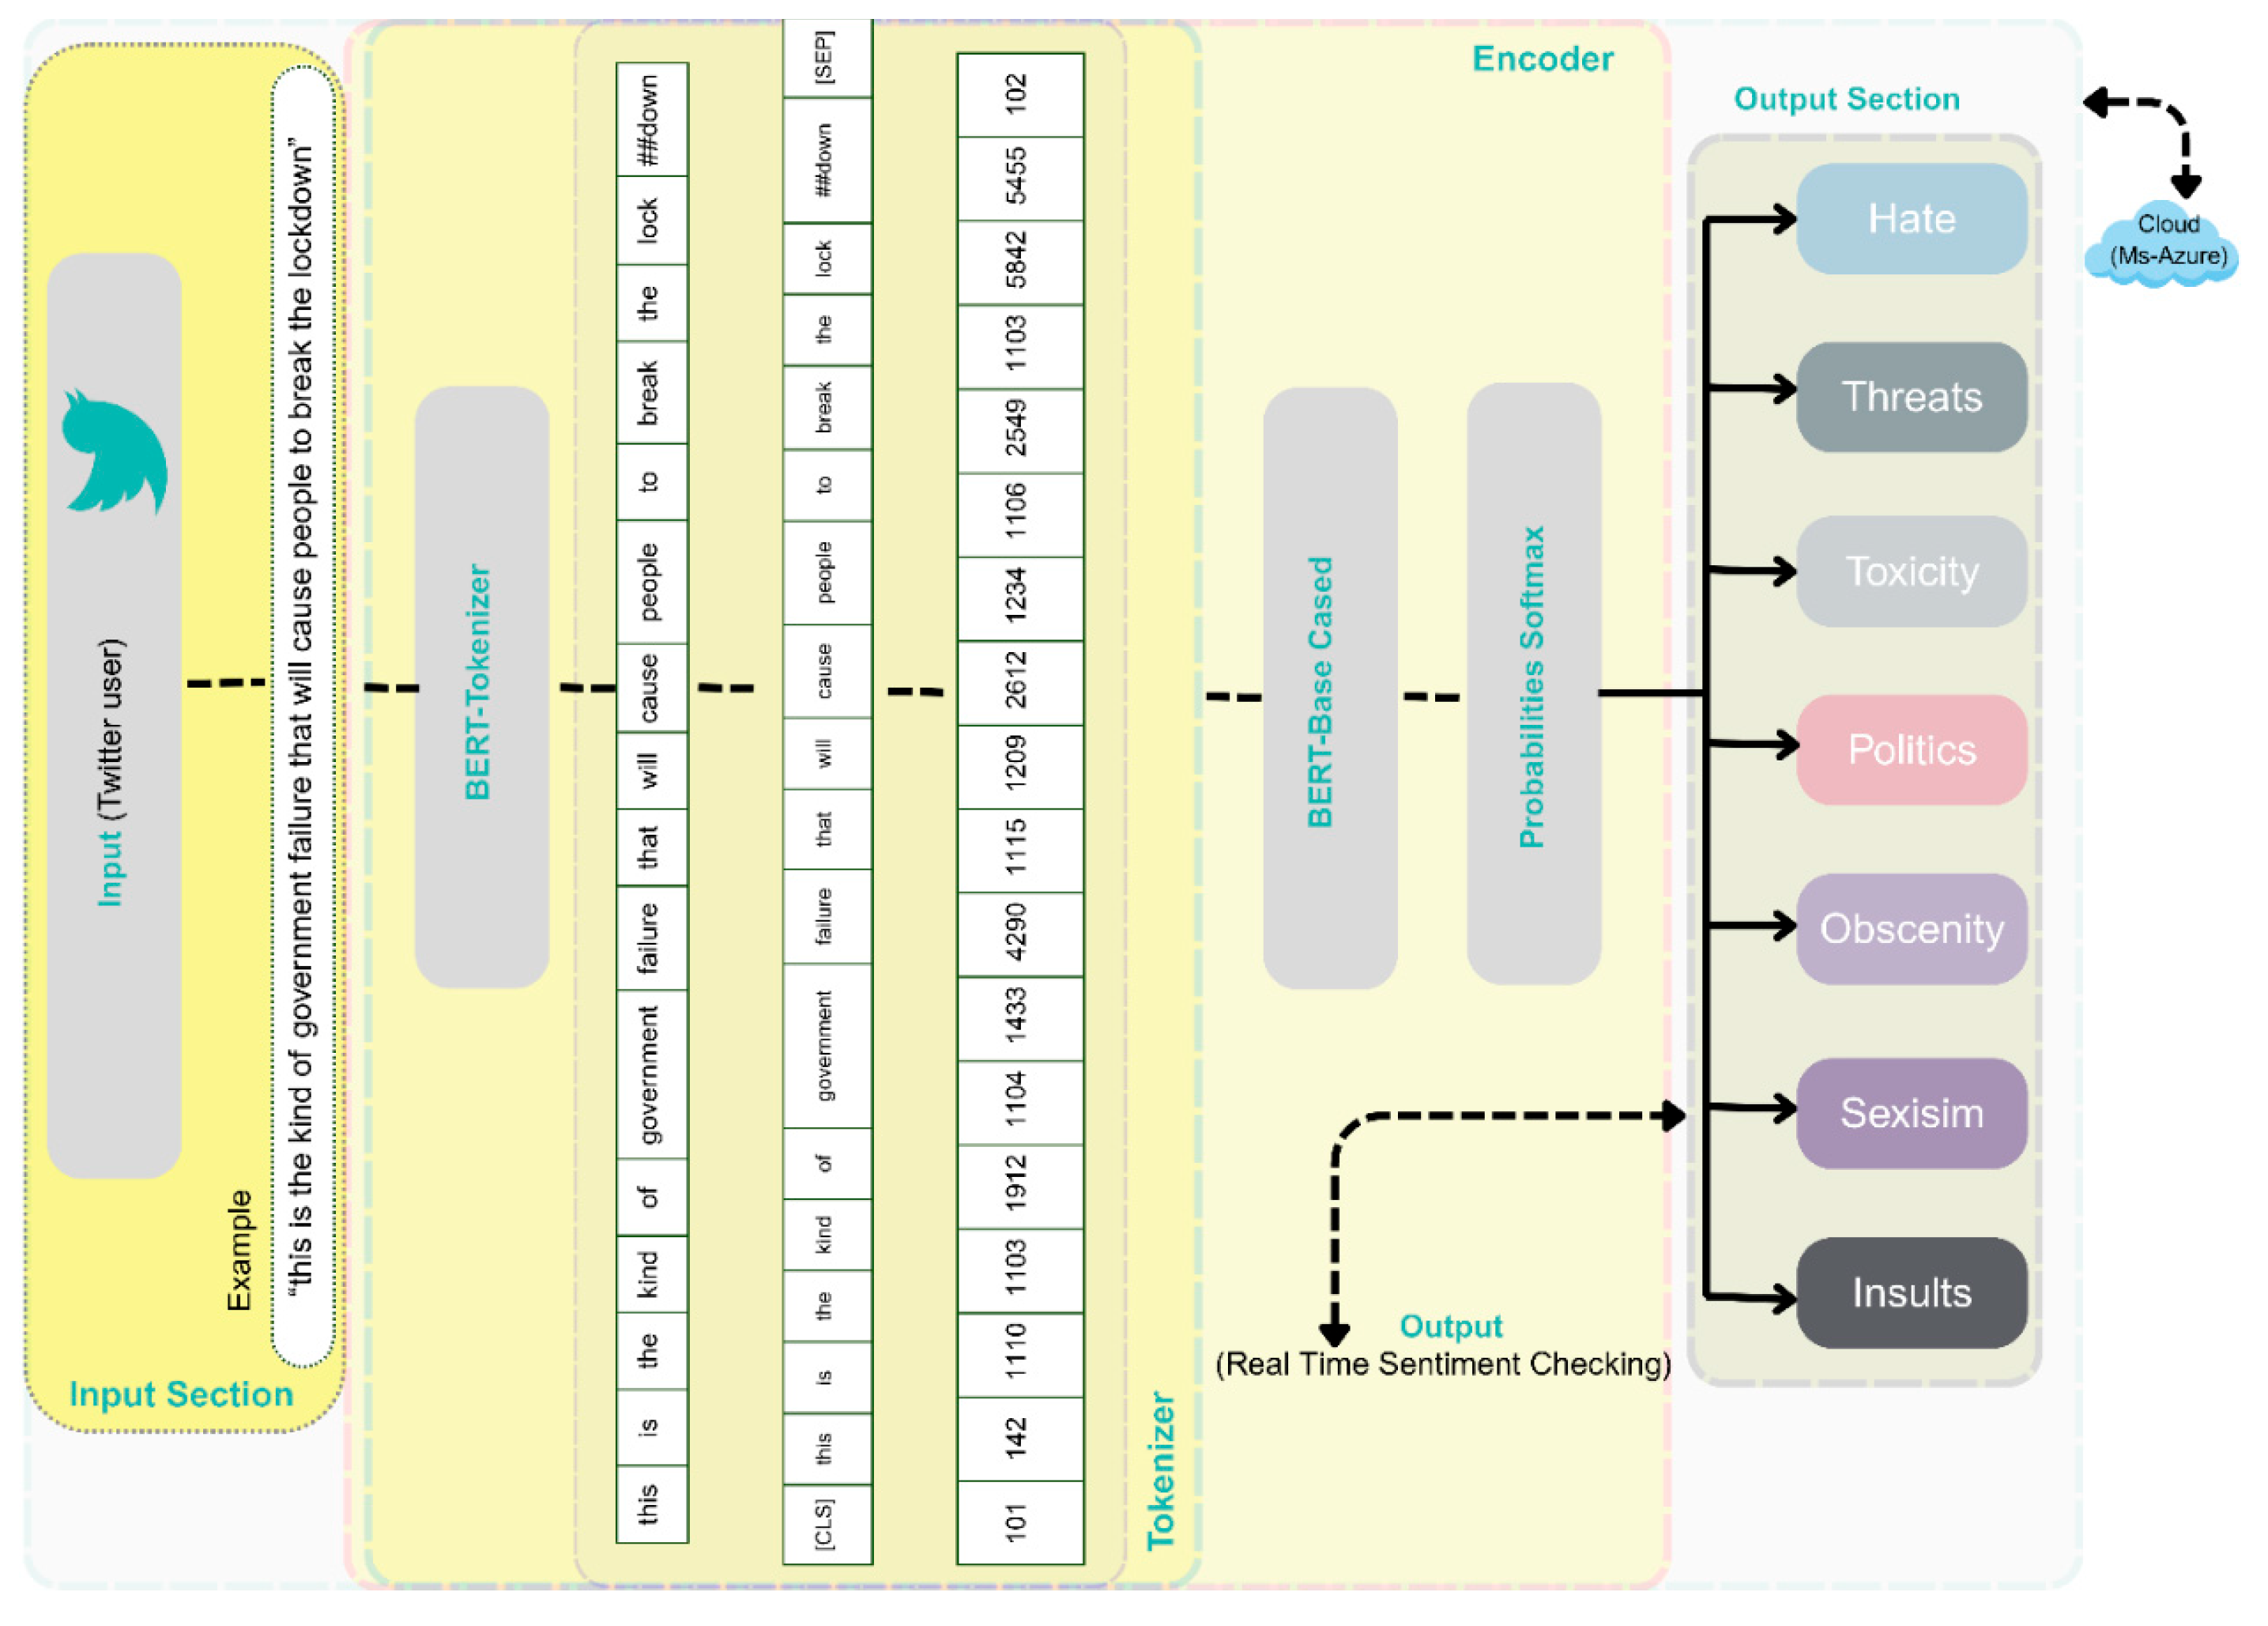
The Sentiment Analysis Estimate model (SA-ES) provides an analysis of a post or news to reveal the mood of text-type posts shared on social networks. It achieves this using the BERT algorithm. In this framework, the words in the text are analyzed bidirectionally and the natural language inference method is used to provide complex semantic interactions.
The model is bootstrapped from the HuggingFace BERT-base-cased checkpoint and fine-tuned on English. We trained for two epochs with a batch size of 16 by using AdamW (learning rate 2 × 10⁻⁵, correct_bias = False) and a linear decaying learning rate schedule (warmup = 0). Our loss function was CrossEntropyLoss and we clipped the gradient to 1.0. Undersampling and an 80/10/10 train/validation/test split were performed to compensate for the class imbalance. The maximum length of a model sequence was set to 120 tokens. The best model on validation set was saved and performance was summarized as test data accuracy, classification report, and confusion matrix. Training was performed on an eight-core auto GPU-accelerating system equipped with 20 GB RAM and a 500 GB SSD drive.
During training, for sentences that come in pairs, it is predicted whether the second sentence is a continuation of the first sentence. Before this technique, 50% of second sentences were randomly changed while 50% were left the same. The optimization made during training minimizes the loss that occurs when these two techniques are used. When data is entered into the system for SAi analysis, instead of evaluating the words in the sentences one by one, they are evaluated together with the words before and after them or with similar and synonymous words. A pre-trained BERTsa model is used to perform the sentiment analysis task. The output of BERT is Sa0 = (Sa1, …, Sa7). An average evaluation is used on the pre-trained sentence representation vector (Sat). The Sentiment Analysis–Evaluation System (SA-ES) is applied to obtain the emotional sentiment of both source and target sentences in seven different dimensions. In the results, the categories of query results from SA-ES are discussed. The developed SA-SE system architecture can be seen in
Figure 1.
5. Dataset Selection and Preprocessing
Data between January 2020 and May 2020 was collected with the limited API provided by Twitter. The tweets were gathered from the dataset in [
35], which is available on GitHub (
https://github.com/echen102/COVID-19-TweetIDs, (accessed on 3 August 2021)) and is licensed under the Creative Commons Attribution-NonCommercial-ShareAlike 4.0 International Public License. As a result, because Chen’s data was published with tweet IDs, we accessed the data via the tweet API. Within the framework of ethical rules, a total of 99 million pieces of data were collected between January 2020 and May 2020, but after the data preprocessing stages, model training was performed with a dataset of 248,262.
The received tweets were first collected in MongoDB, an open-source database on a local server, and then these data were transferred to the SQL server. The data collection phase took about three months. Since the SQL server is accepted in the software community due to its performance [
36], and a code written in .NET can be run, it was preferred for this study. Our goal with the data transferred to the SQL server was to label data on the used dataset based on synonyms (abomination, aversion, etc. for hate; smut, vulgarity, etc. for obscenity; polity, statecraft, etc. for politics; chauvinism, racism, etc. for sexism; compulsion, constraint, etc. for threats; harmfulness, injuriousness, etc. for toxicity) related to the seven categories being used for sentiment analysis and to preprocess the data as shown in
Table 2; they were extracted from the
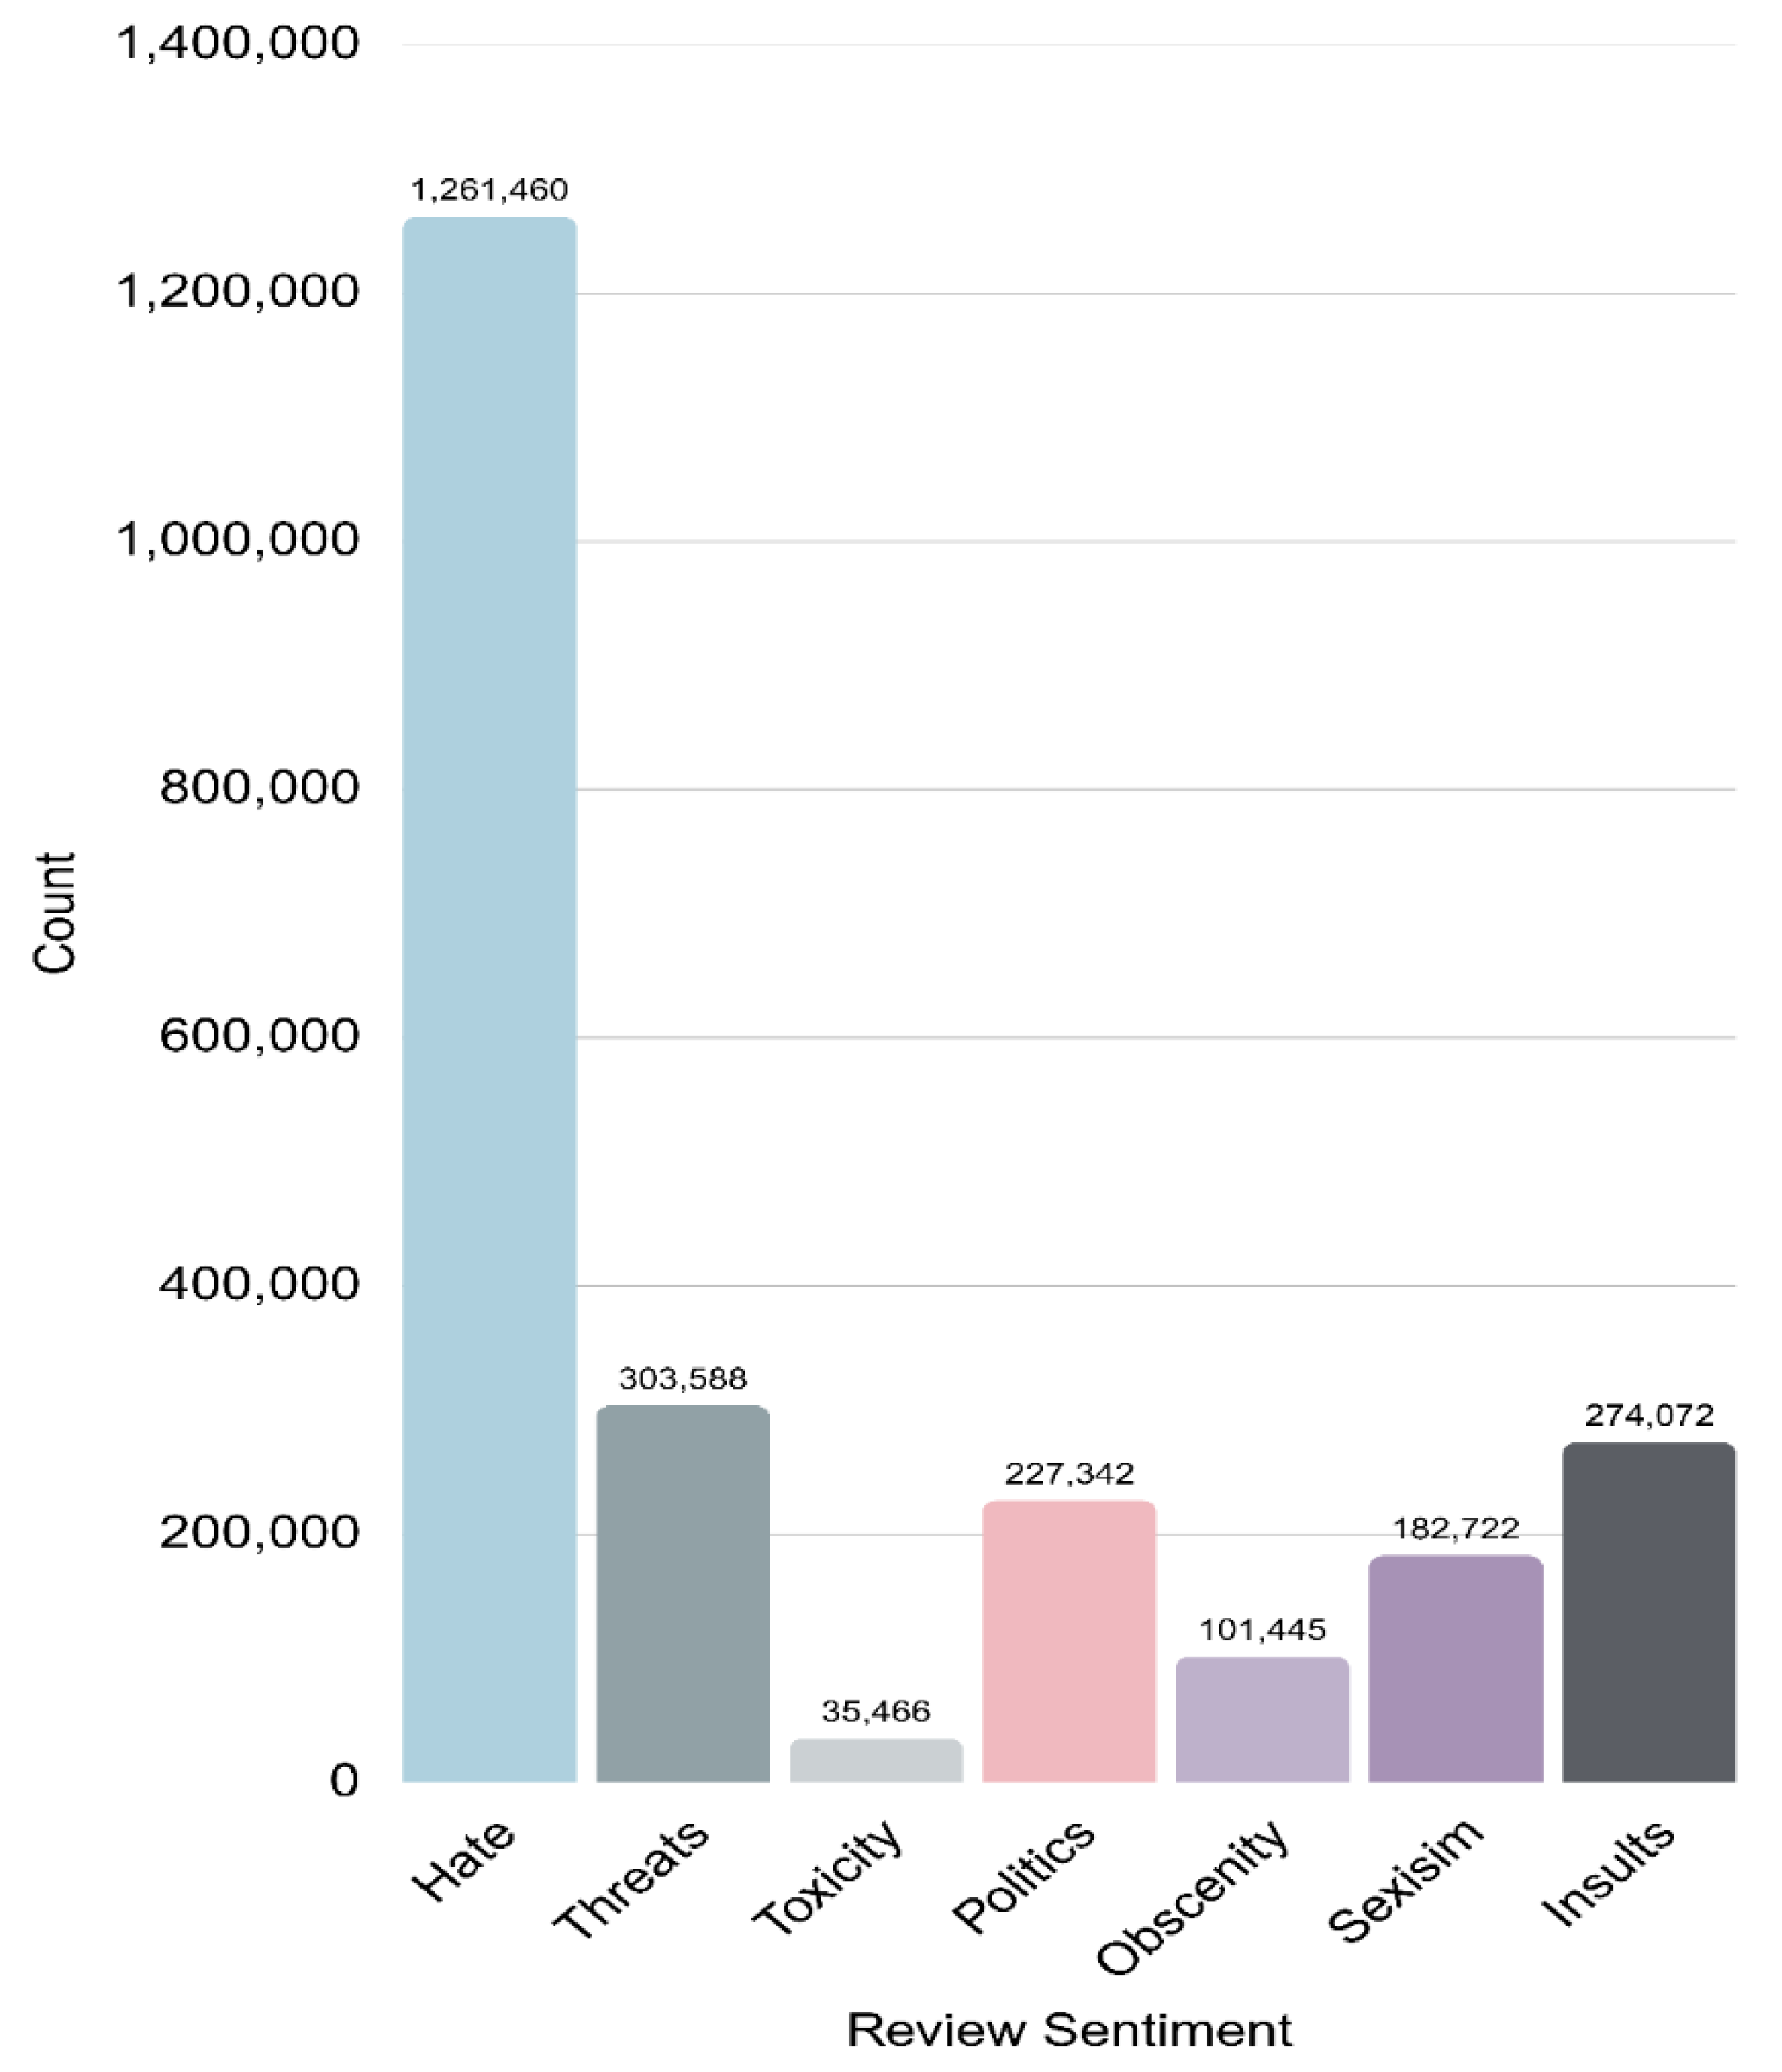
https://www.wordhippo.com (accessed on 9 October 2021) website. A custom algorithm was developed on the .NET platform and used to bring the data to the desired criteria in SQL queries, and to procedures for punctuation, deleting mentions, removing special characters, etc. The purpose of such operations is to make machine learning faster and to increase the success rate. Next, a label was applied to all shared data using the full-text search structure of the SQL server, and about two million (2,168,509) pieces of data were tagged, as can be seen in
Figure 2, out of a total of 99 million pieces of data. Tweets in more than one category in the obtained training data were not included in this dataset. This provided information about the quality of the resulting dataset and contributed both to the model’s ease of learning and to the success rate in the machine learning process.
6. Feature Extraction Using BERT
Some 2,386,099 pieces of data were obtained from the dataset for the study. As shown in
Table 3, the dataset, which has been made open source on GitHub (for data security reasons, the dataset contains only Twitter ID), is transferred to a local computer using the C# programming language and the API provided by Twitter, in compliance with ethical rules.
Some data manipulations are made to optimize the sentiment analysis classification performance of data preprocessing methods. First, the dataset was purified from punctuation marks and expressions containing ID and URL. Afterward, abbreviations and acronyms were normalized. After cleaning the stop words and common words, which are the other steps of the data preprocessing stage, stemming and lemmatization processes were performed and then all words were converted to lowercase letters, and data manipulation was completed.
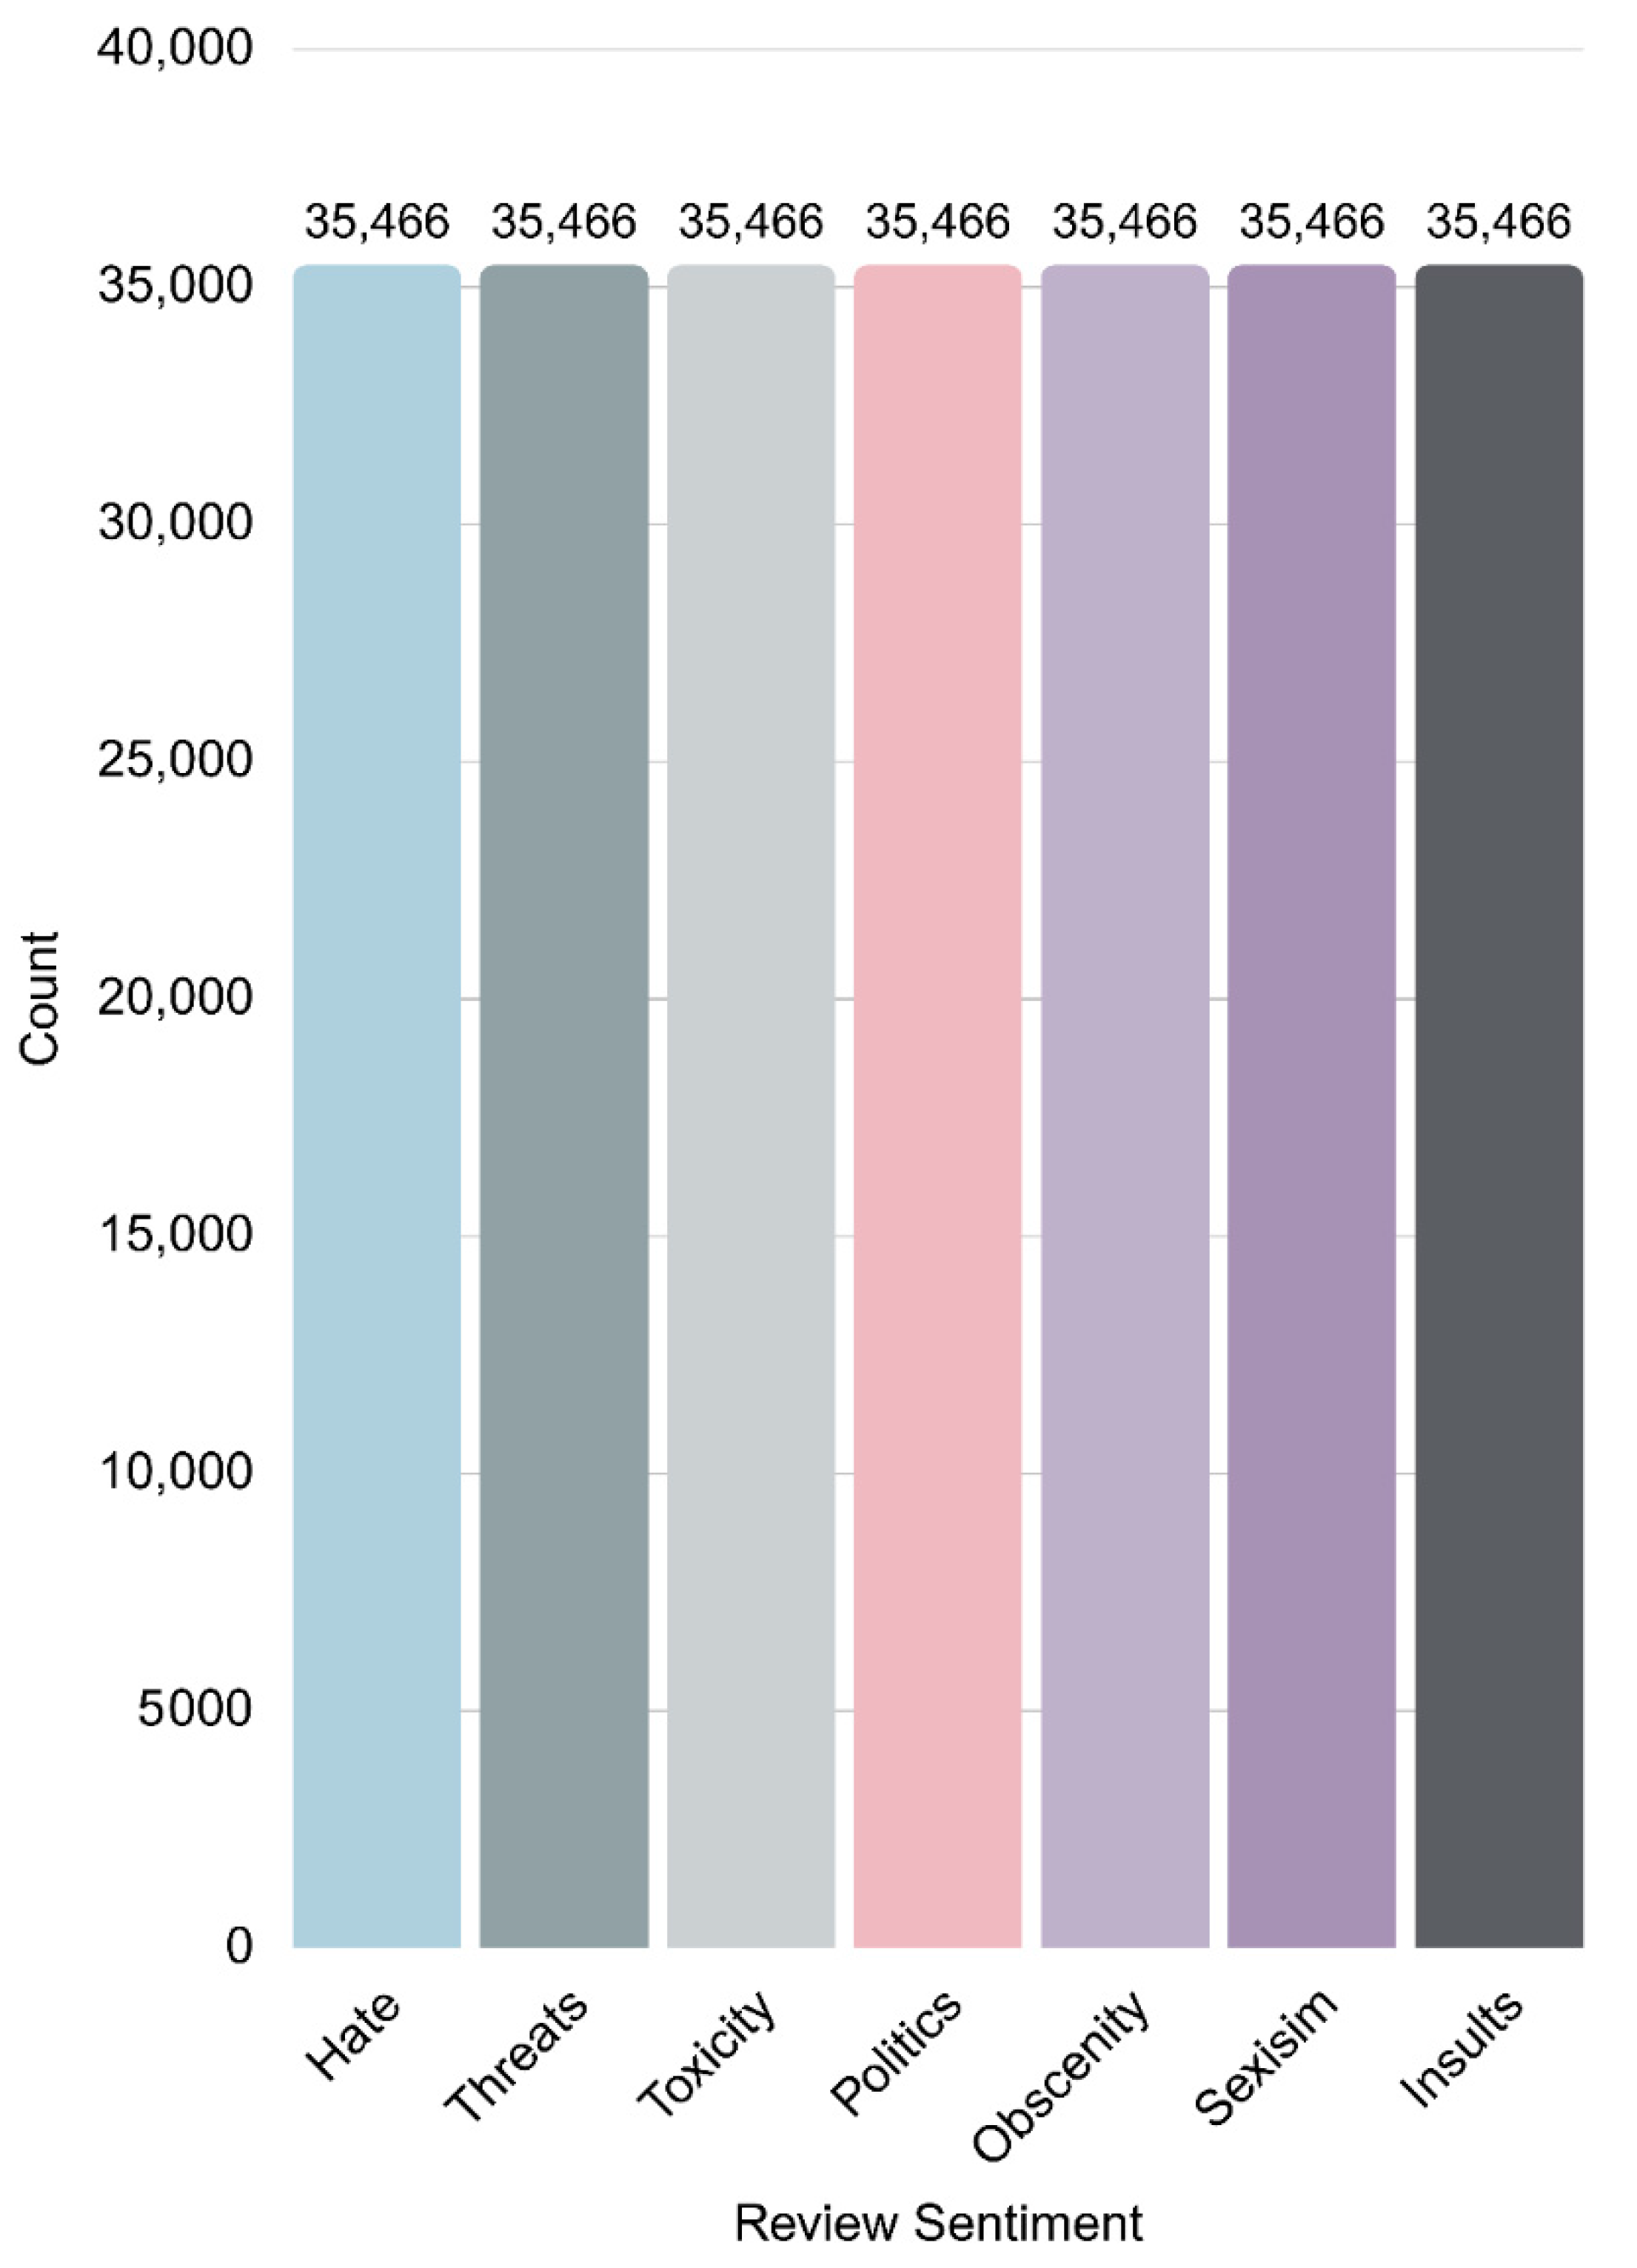
The training was started with about 248,262 pieces of data (dataset split with 80% training, 10% validation, 10% test) created. Because training two million pieces of data takes a long time, approximately one month, the data in
Figure 3 was decreased from two million to 248,262 because there would be variances in the answers due to the large number of data depending on the hatred category in the dataset.
In the machine and DNN-based classification problems, the class distribution of the dataset has an important effect on the model performance. In such imbalanced datasets, the model often learns the majority classes and performs poorly in the minority classes, with low accuracy, low recall, and low F1 score. This can result in notable performance loss, especially for multi-class cases related to toxicity, hate speech, or similar instances, where it is relevant to identify sensitive and rare classes.
In our analysis, we experimented with balanced and unbalanced distributions of the dataset. We can see that in balanced data distribution, the model learns equally all the classes and does much better with minority classes. The balanced dataset can improve the generalization of the model and make it more reliable for classifying various examples in the real world.
Balancing the class distribution is thus a preliminary step to enhance overall accuracy and performance in the minority classes. Hence, preprocessing the dataset to balance it before training the model seems necessary to construct a trustworthy and fair classification system.
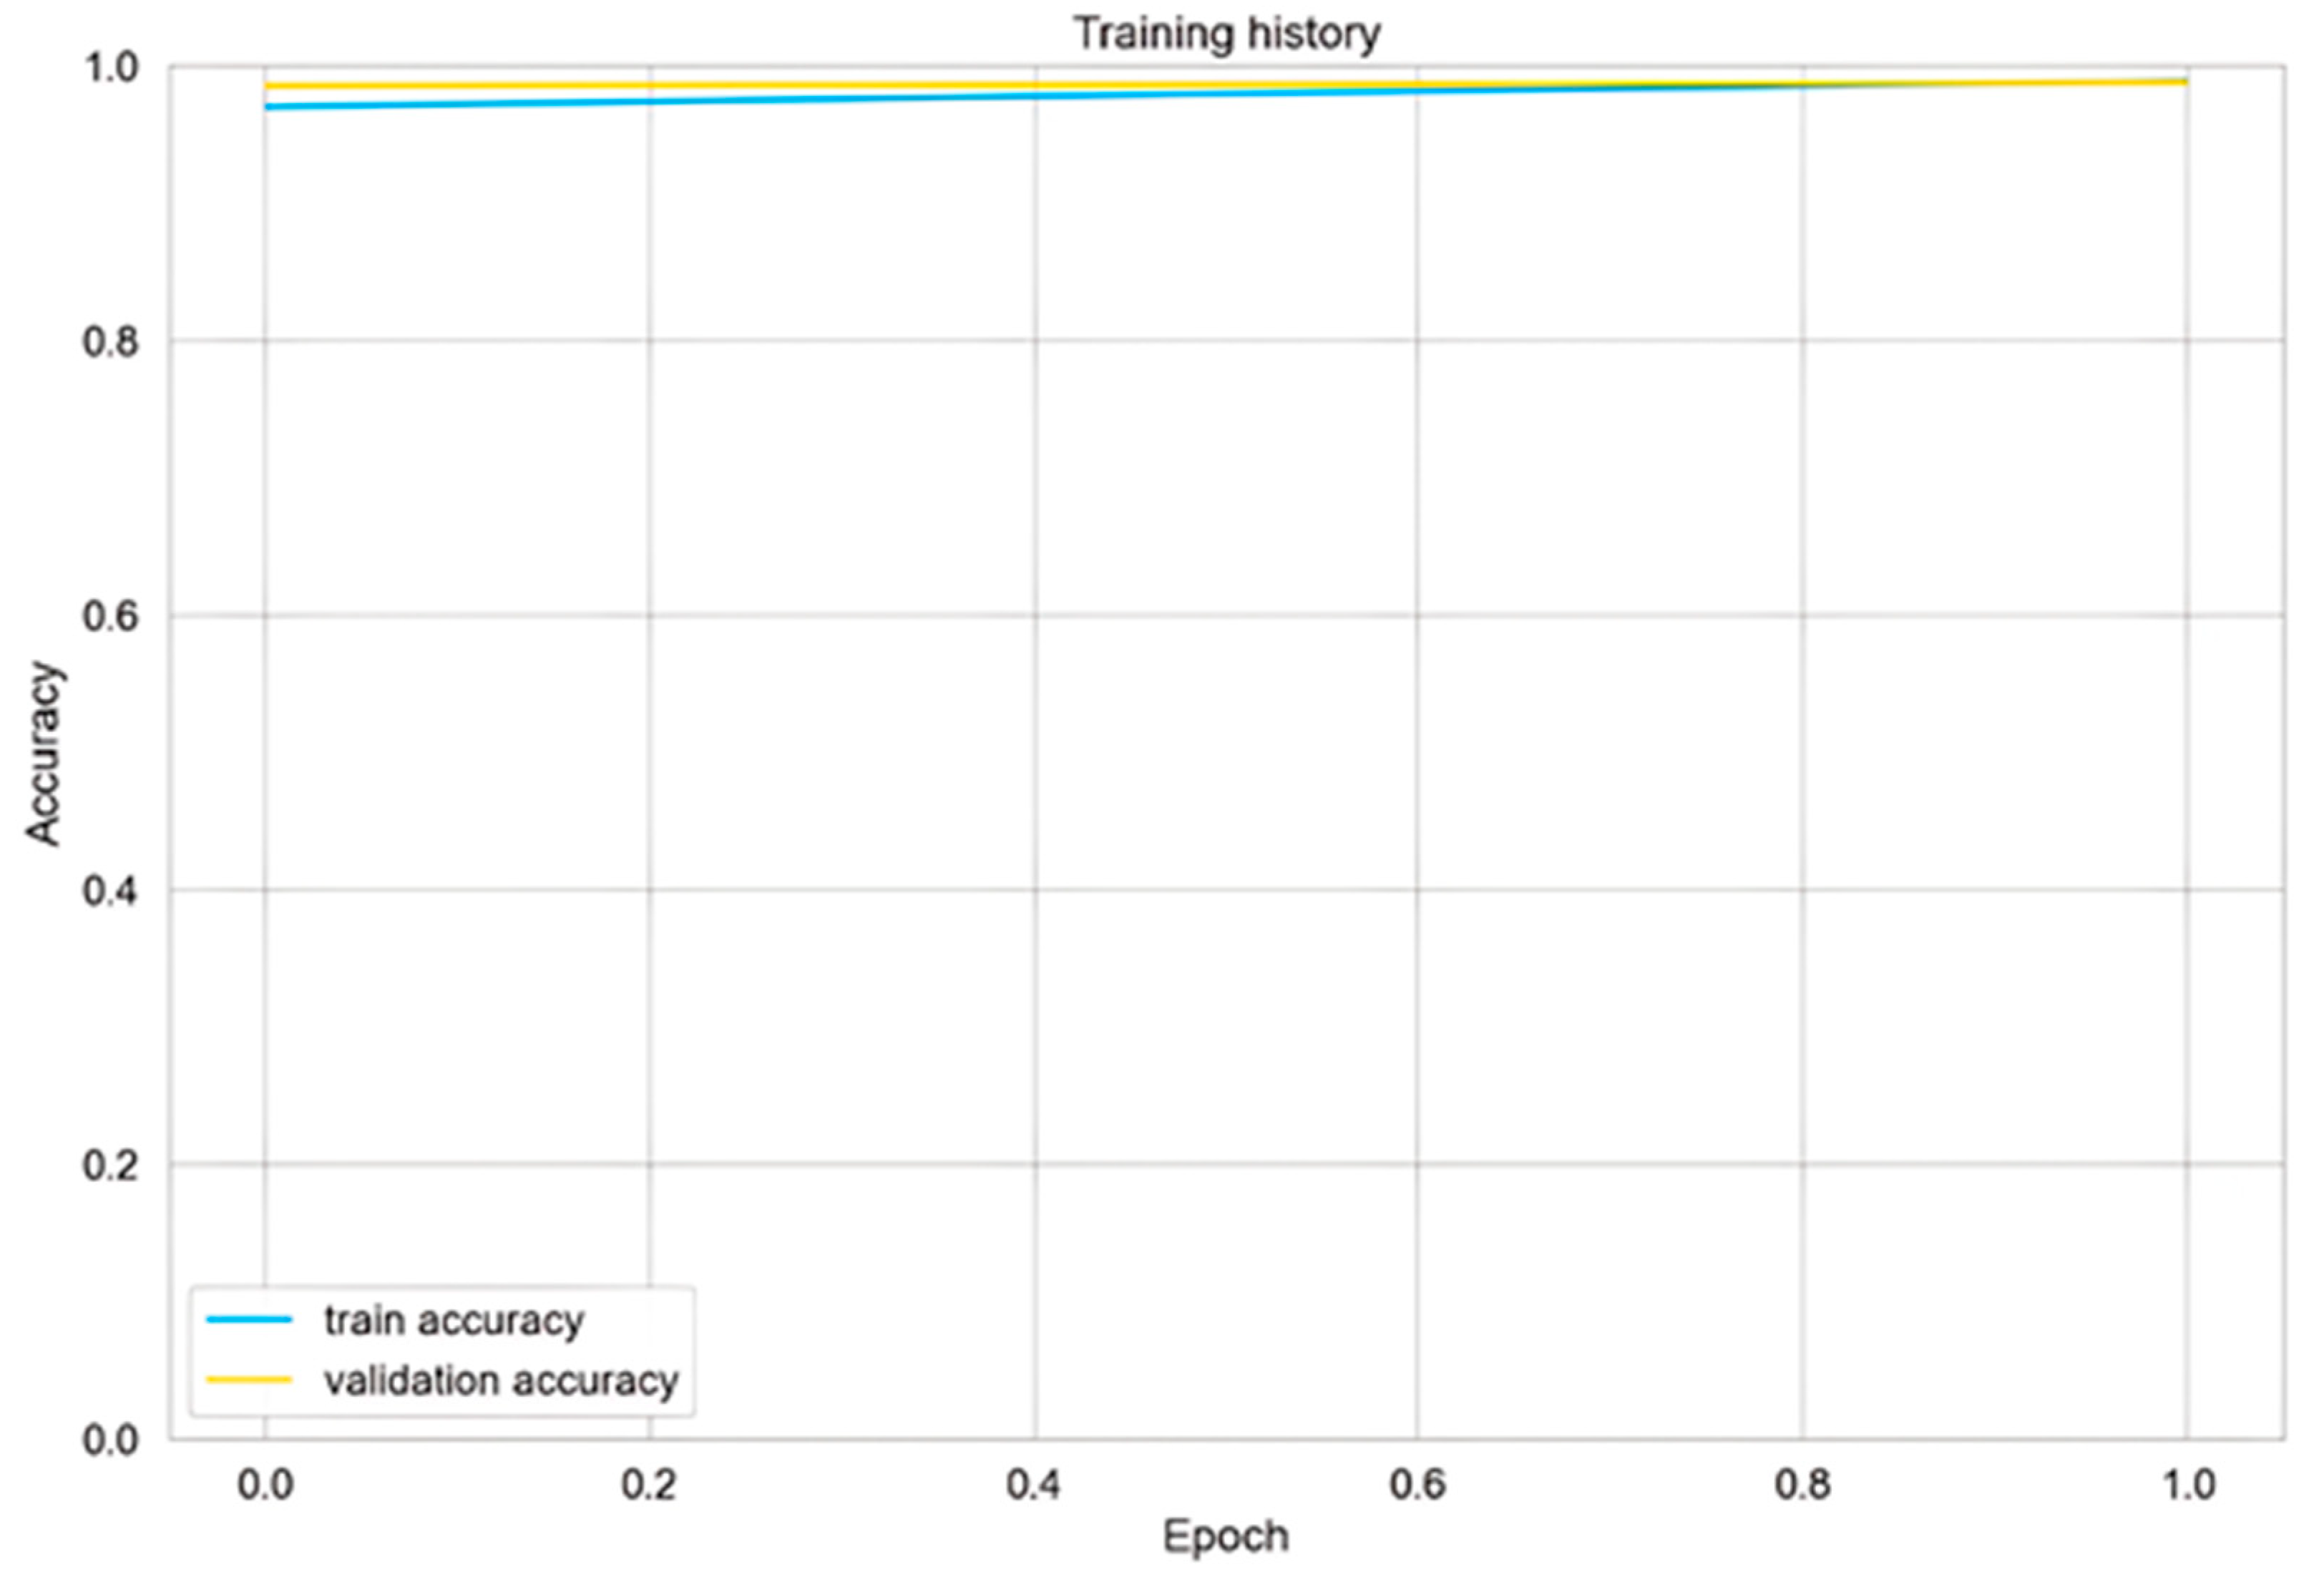
In this research, the dataset was trained and created with the BERT algorithm. The training process of the model was monitored in terms of accuracy and validation accuracy, as shown in Figure 4. The BERT algorithm stands out from many other similar algorithms in this context because it is a bidirectional encoder–transformer. After performing all these processes on a local server, the created SA-ES system was moved to the cloud (MS Azure) in order not to be affected by possible cyber-attacks and data loss that may occur at this stage.
The literature discusses the advantages of cloud computing, namely high flexibility, low hardware costs and scalability, as well as its drawbacks, like security and internet connection dependence [
37]. The model was deployed to the Microsoft Azure cloud, associated with a Docker container and deployed as a service in the Azure App Service. The deployment was implemented on an MS Azure cloud computing system with 20 GB RAM, 500 GB SSD HDD, and eight-core CPU processing power. The model is provided to the users through a web application. The architecture accepts HTTPS requests from the App Service level of products, forwards them to the prediction engine, scales seamlessly, and is highly suitable for high-availability operations. The Azure App Service provides autoscaling based on the number of traffic visits, and its data transfer process is encrypted by HTTPS and the application authentication method, which also makes it more convenient to deploy projects in terms of performance and safety.
Since it is believed that the system in question could disrupt some circles in the era of disinformation we are in, one of our priority goals is to work on cloud computing with redundancy and the ability to perform repetitive operations in all types of attacks.
Evaluation metrics: Various evaluation criteria were used to measure the performance of the BERT algorithm used to perform sentiment analysis in social networks. We examined these metrics in this section. Ref. [
38] referenced the below formulas for accuracy, precision, recall, and other evaluation criteria, such as F1 scores, as shown in Equations (1)–(7).
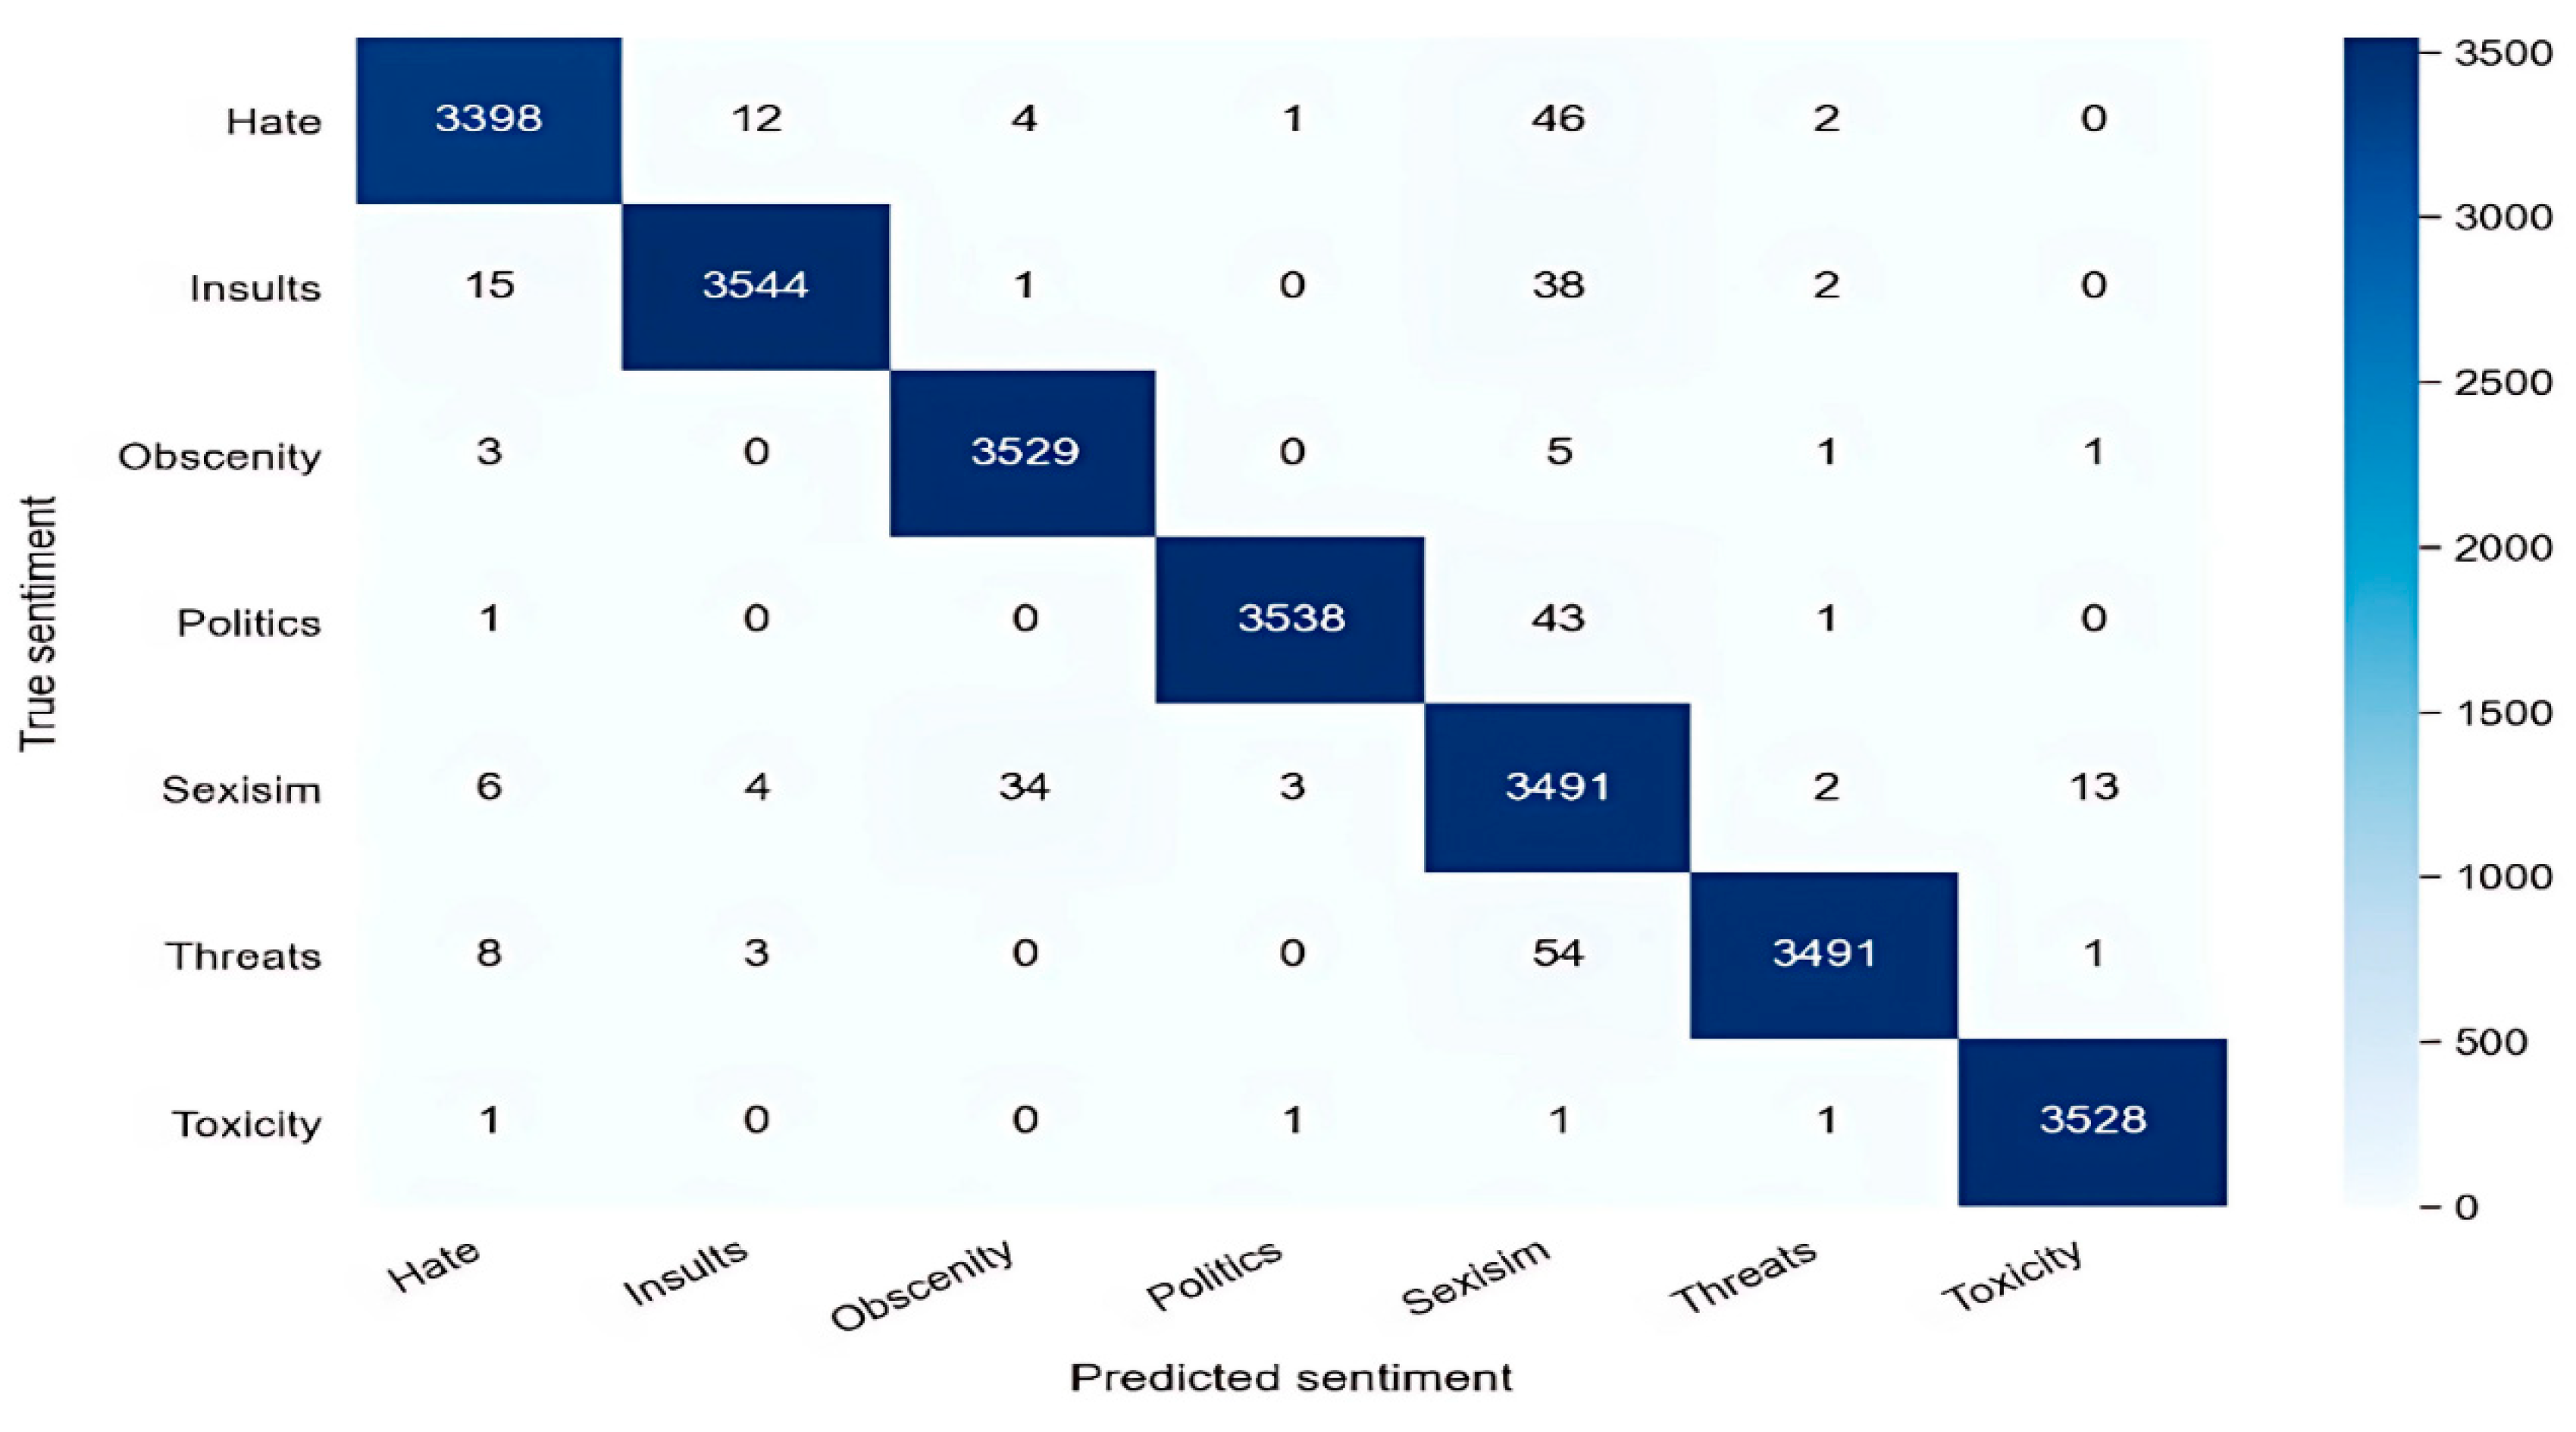
where TP means True Positive; TN means True Negative; FP means False Positive; and FN means False Negative. These are all defined in the confusion matrix.Since the datasets to be analyzed for sentiment analysis are generally skewed, high precision can be easily achieved by making fewer positive predictions. Therefore, recall measures the sensitivity or rate of the predicted annotated sentiment analysis data. F1 score provides overall prediction performance for sentiment analysis by combining precision and recall. The higher the value of precision, recall, F1 score, and accuracy, the better the performance. The Receiver Operating Characteristic (ROC) curve is a graph showing the performance of a two-parameter classification model between True Positive Rate (TPR) and False Positive Rate (FPR) at all classification thresholds. TPR and FPR are provided as follows. Area Under the ROC Curve (AUC) measures the entire two-dimensional area under the ROC curve. The confusion matrix of the system after training for training and testing errors can be seen in Figure 5. The obtained results are expressed in the macro average row in
Table 4.
7. Experimental Results
As can be seen in
Figure 4, the learning history is plotted as a graph that summarizes the accuracy values when fitting on the trained dataset. Both training and validation accuracy started at very high levels, reaching more than 98% at the end of the first epoch, and around 99% by the end of second. This indicates that the representation capability of pre-trained BERT is relatively strong and also converges very quickly. As well, the similar nature of the training curve and validation curve shows you have a well-generalized model, without any overfitting. As a result, the high accuracy in just two epochs validates the efficiency of such a model and the data balancing.
The classification report shows precision, recall, and F1 scores for each of the categories. Overall, precision and recall values are all over 99%, indicating that the model’s correct prediction rate and sensitivity are really high. The politics, toxicity, and threats categories display values close to 100%. The sexism category showed a slightly less impressive performance, with precision at 95% and recall at 98%, while the F1 score maintained a value of 97%. This reduction is a result of cross-language misclassifications. The 99% macro and weighted average values indicate that the general model is strong and stable. These results indicate the strong robustness and good generalization properties of the proposed method for different types. The results are shown in
Table 4.
As can be seen in
Figure 5, the confusion matrix presents a seven-category model classification performance. Values close to those on the diagonal indicate better predictive performance for each class. For instance, in the hate class, there were 3,398 instances classified correctly versus a tiny fraction that were incorrectly classified among others. Likewise, the rate of correct classification for politics, toxicity, and threats was nearly perfect. The largest mistake was evident in the sexism category, where a very small number of examples were misclassified as obscenity or hate. The similar linguistic status of these categories might be the reason. In summary, the results in the matrix reveal that the model can discriminate all classes correctly and that misclassifications caused by semantic correlation of targets are few.
At this stage of the study, the SA-ES sentiment analysis system we created was tested with the dataset created by [
39] regarding COVID-19. The dataset in question consists of 10,202 rows. The categories of some randomly selected news from this dataset were examined. Below are the sentiment analysis results for the seven categories analyzed with SA-ES: hate, sexism, politics, insult, obscenity, toxicity, and threat.
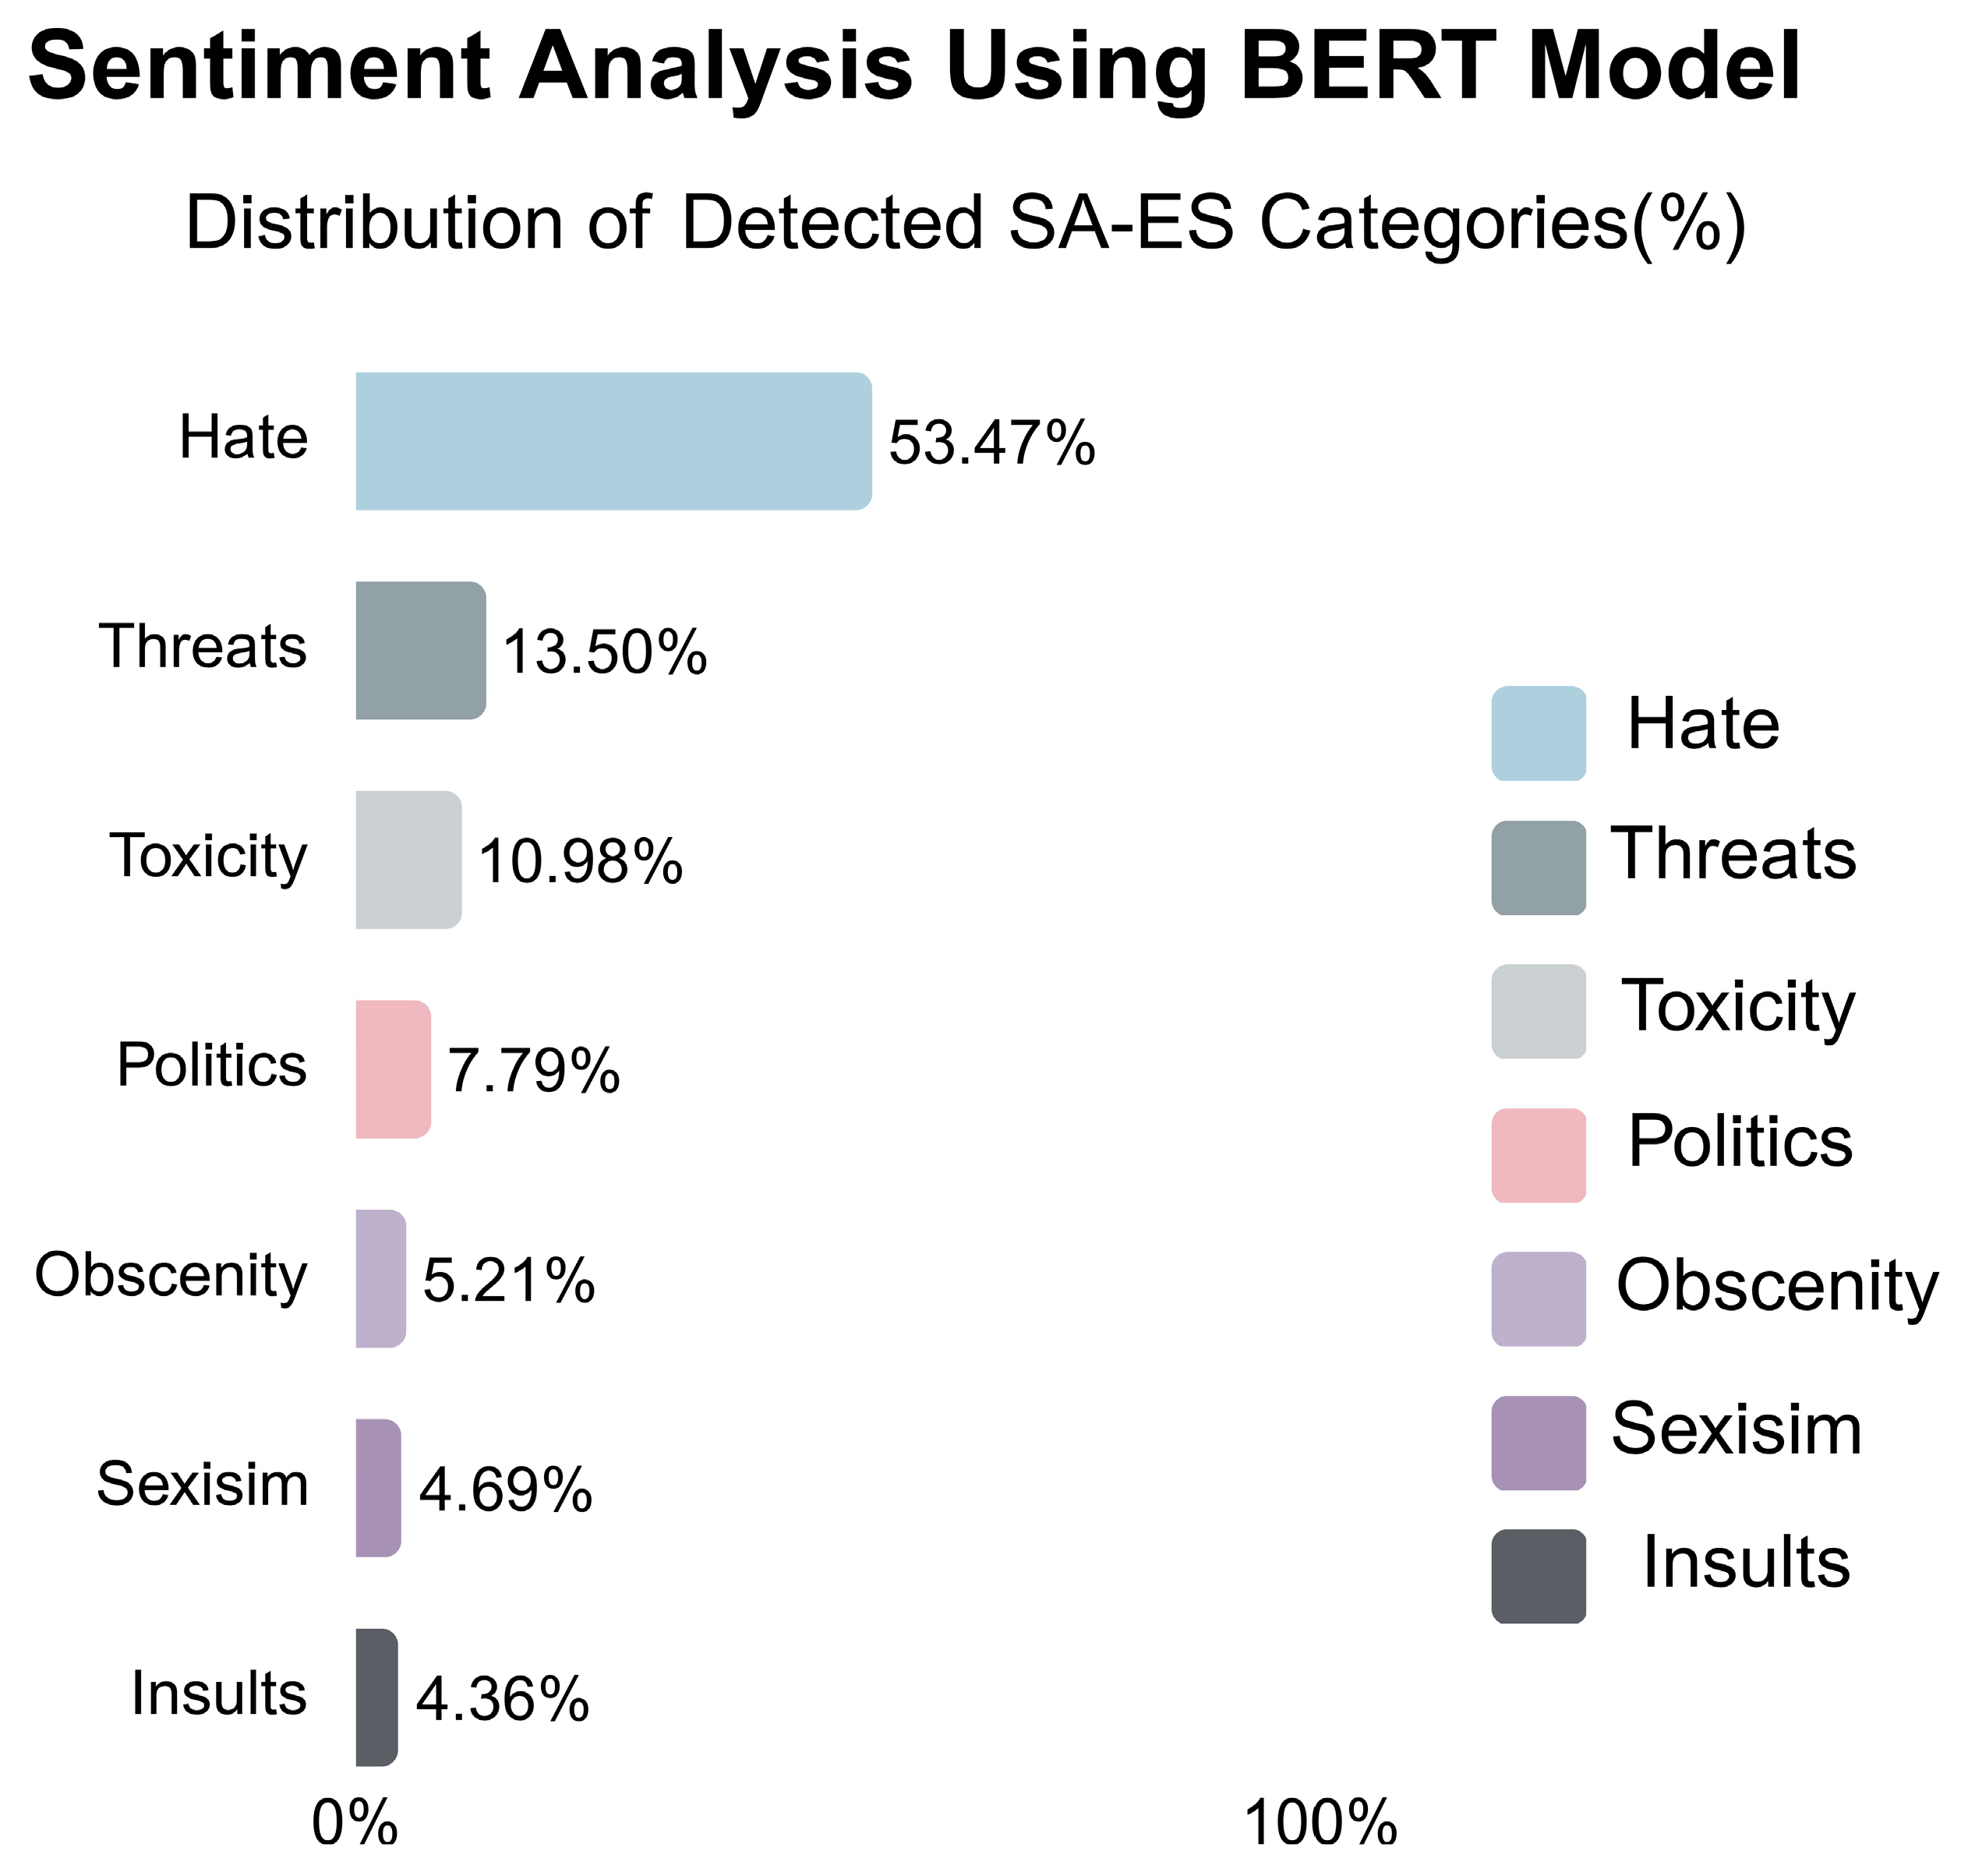
The first content example is “New York City could pay to house its homeless population in hotel rooms currently sitting vacant, but Mayor Bill de Blasio “has absolutely to this point refused to do that””. Also, in
Figure 6, it can be seen that the SA-ES system analyzes the content “hate” at a rate of 53.47 percent, but “threat” and “toxicity” are also included because of the sentence structure.
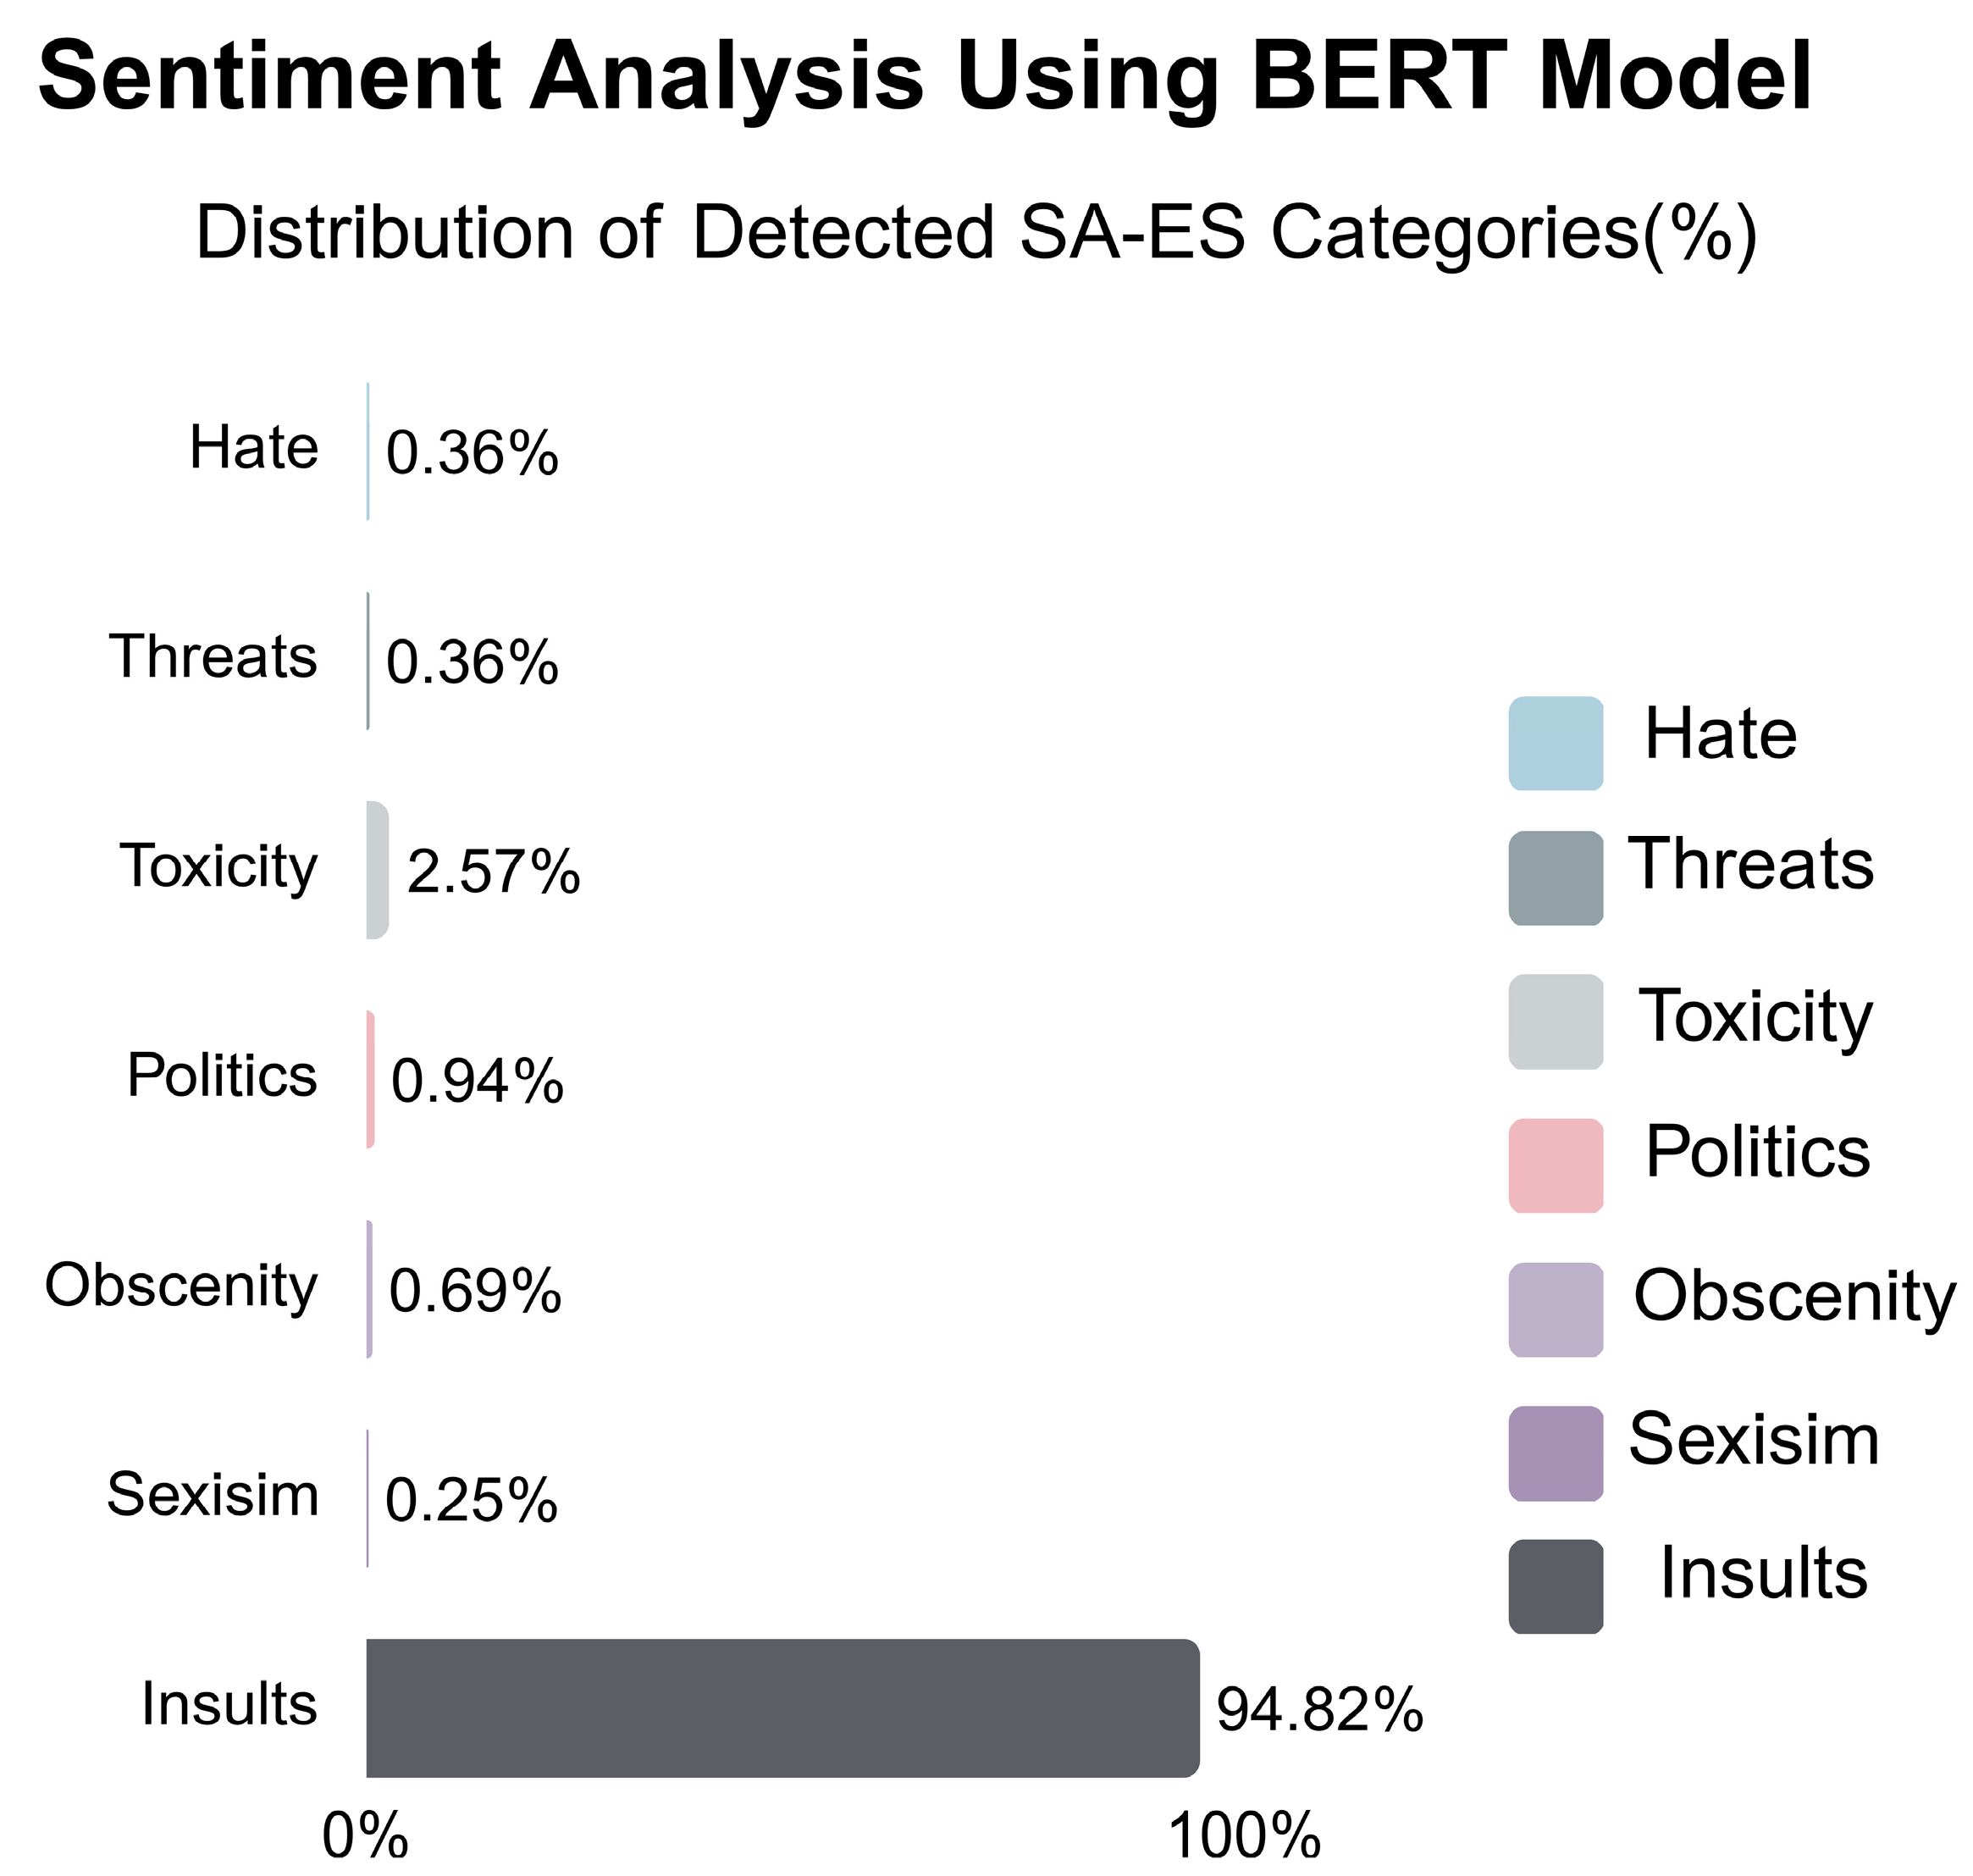
The second content example is “Two-thirds of Americans disapprove of Donald Trump not wearing a face mask in public”. Moreover, in
Figure 7, it can be seen that the SA-ES system contains an “offensive” comment 94.82 percent of the time. This shows that the system is about “Insults”.
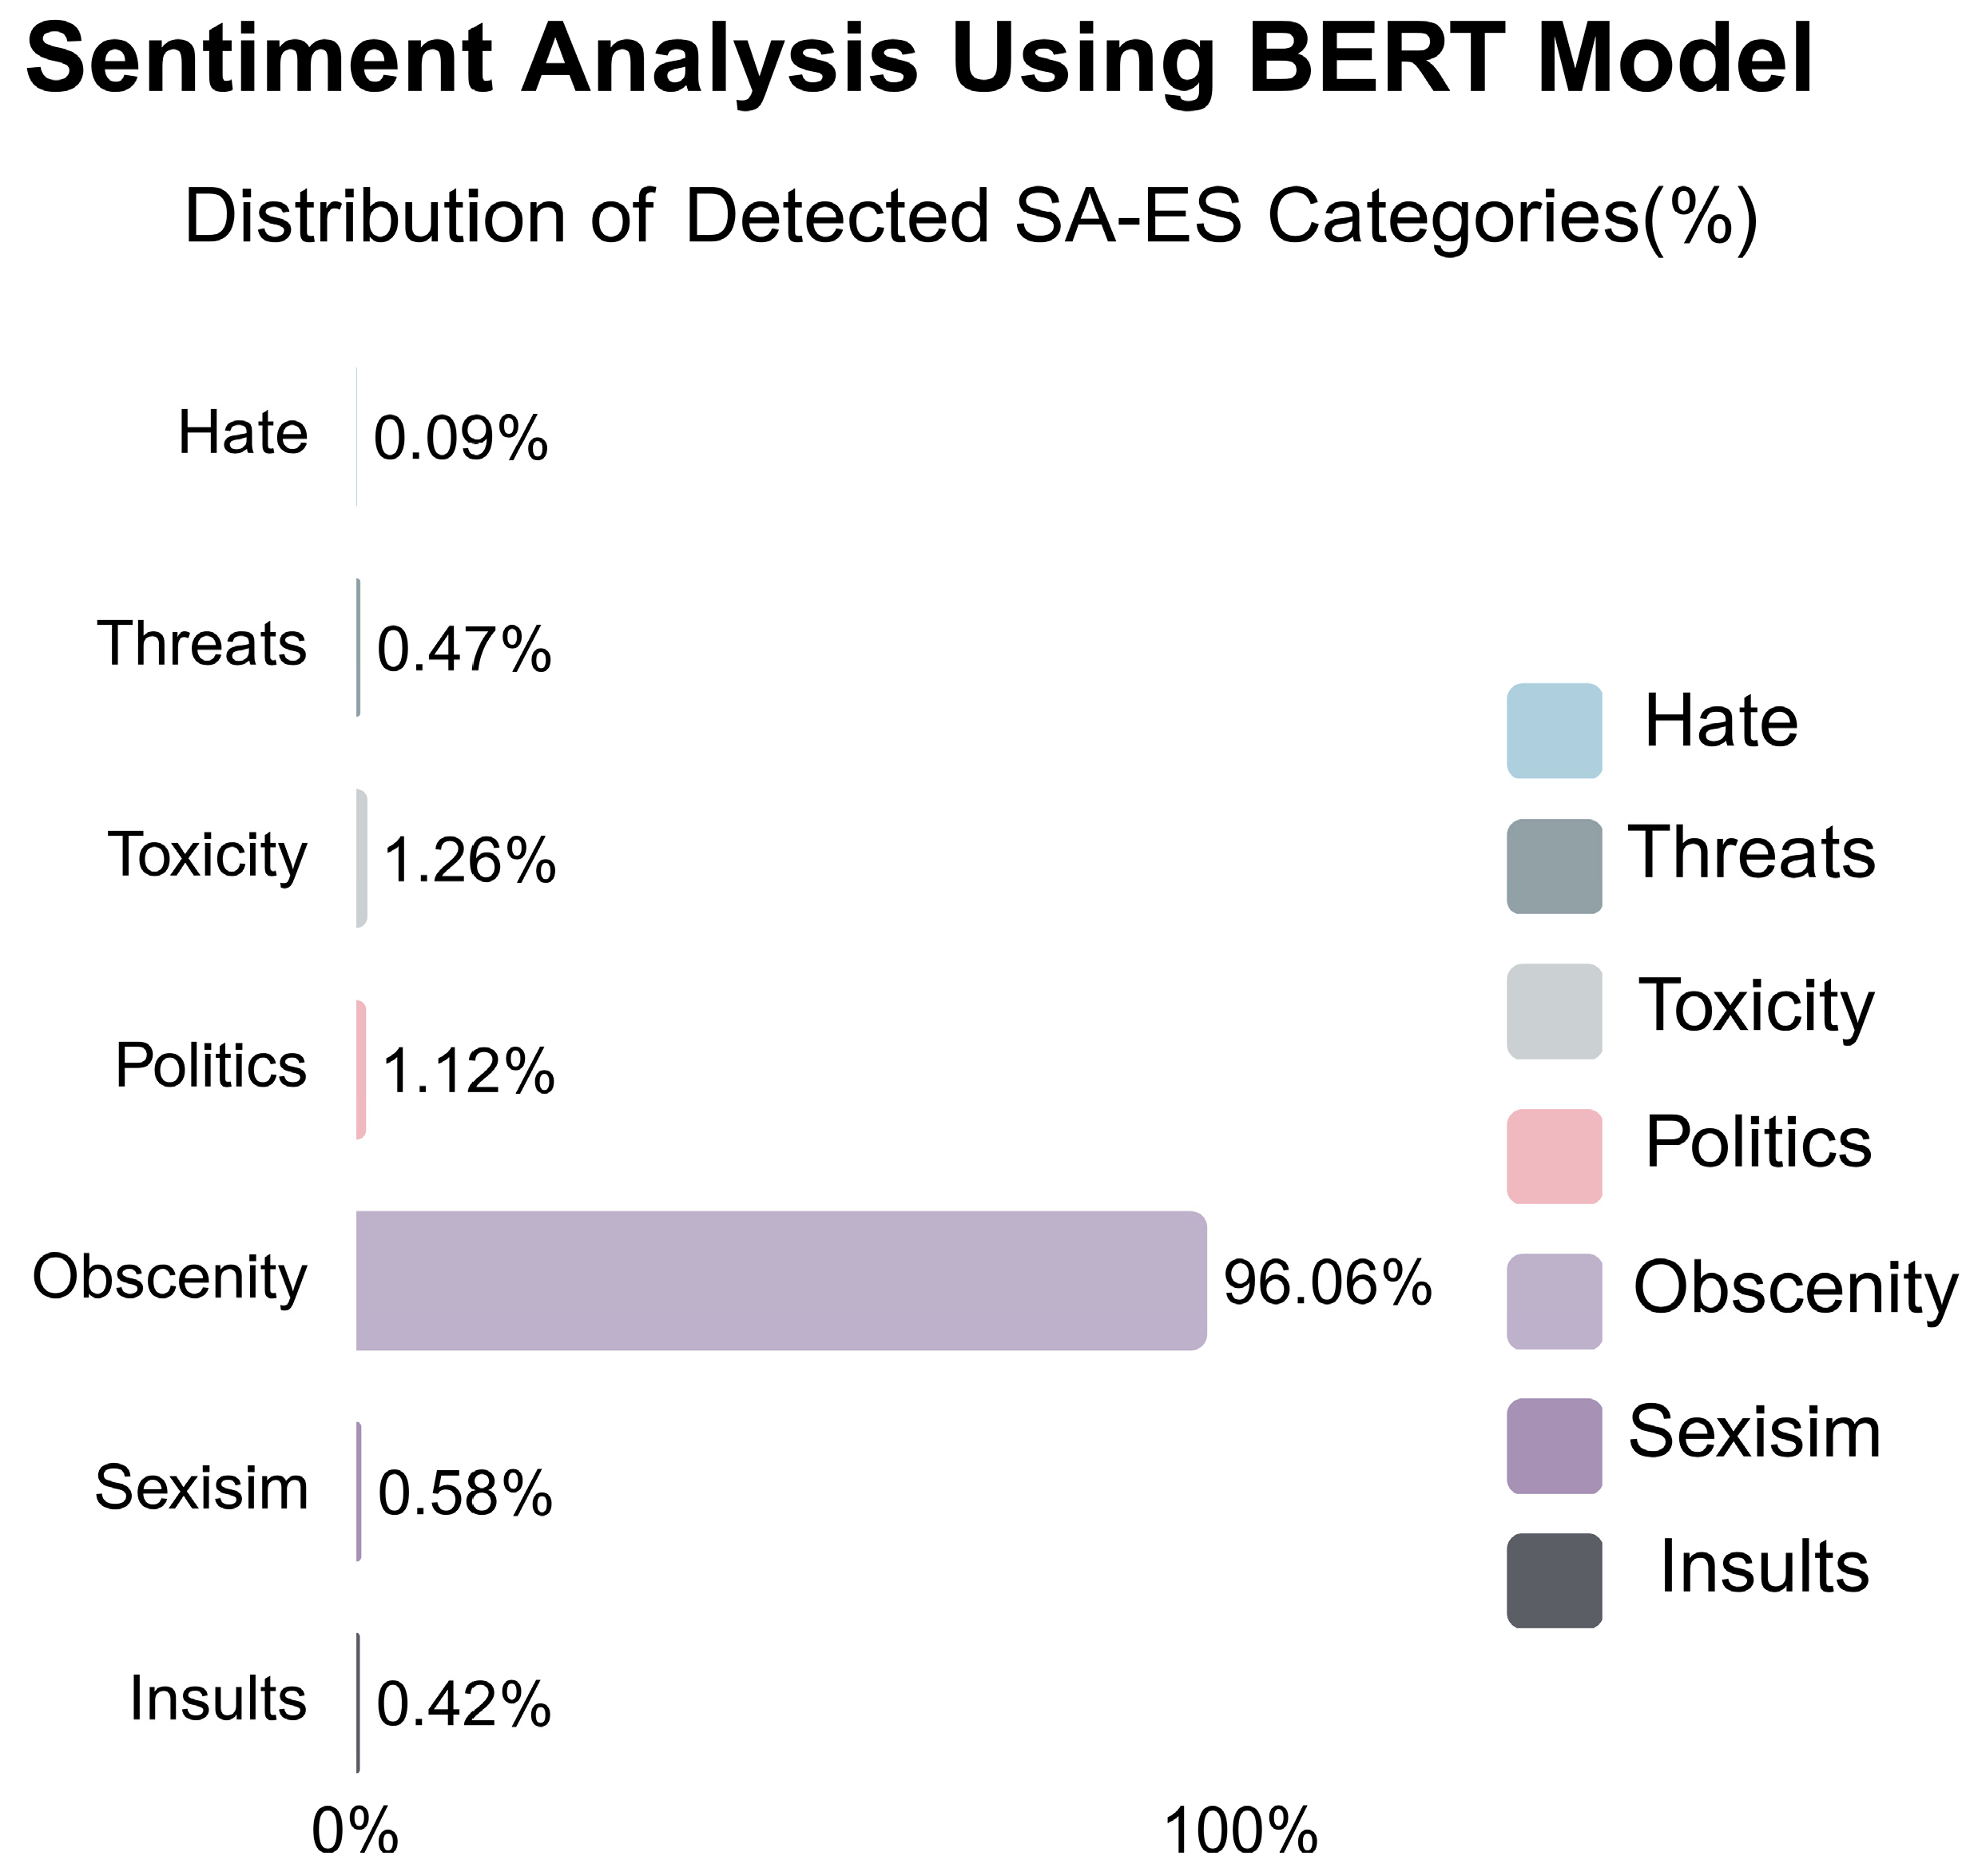
The third content example is “Says President Trump said coronavirus testing makes the U.S. look bad, “so I said to my people, ‘Slow the testing down””.
Figure 8 shows that the result contains 96.06 percent “obscenity” and violates the general rules of decency. Labeling such a post as “negative” creates a negative bias among social network users and hinders the desired outcome.
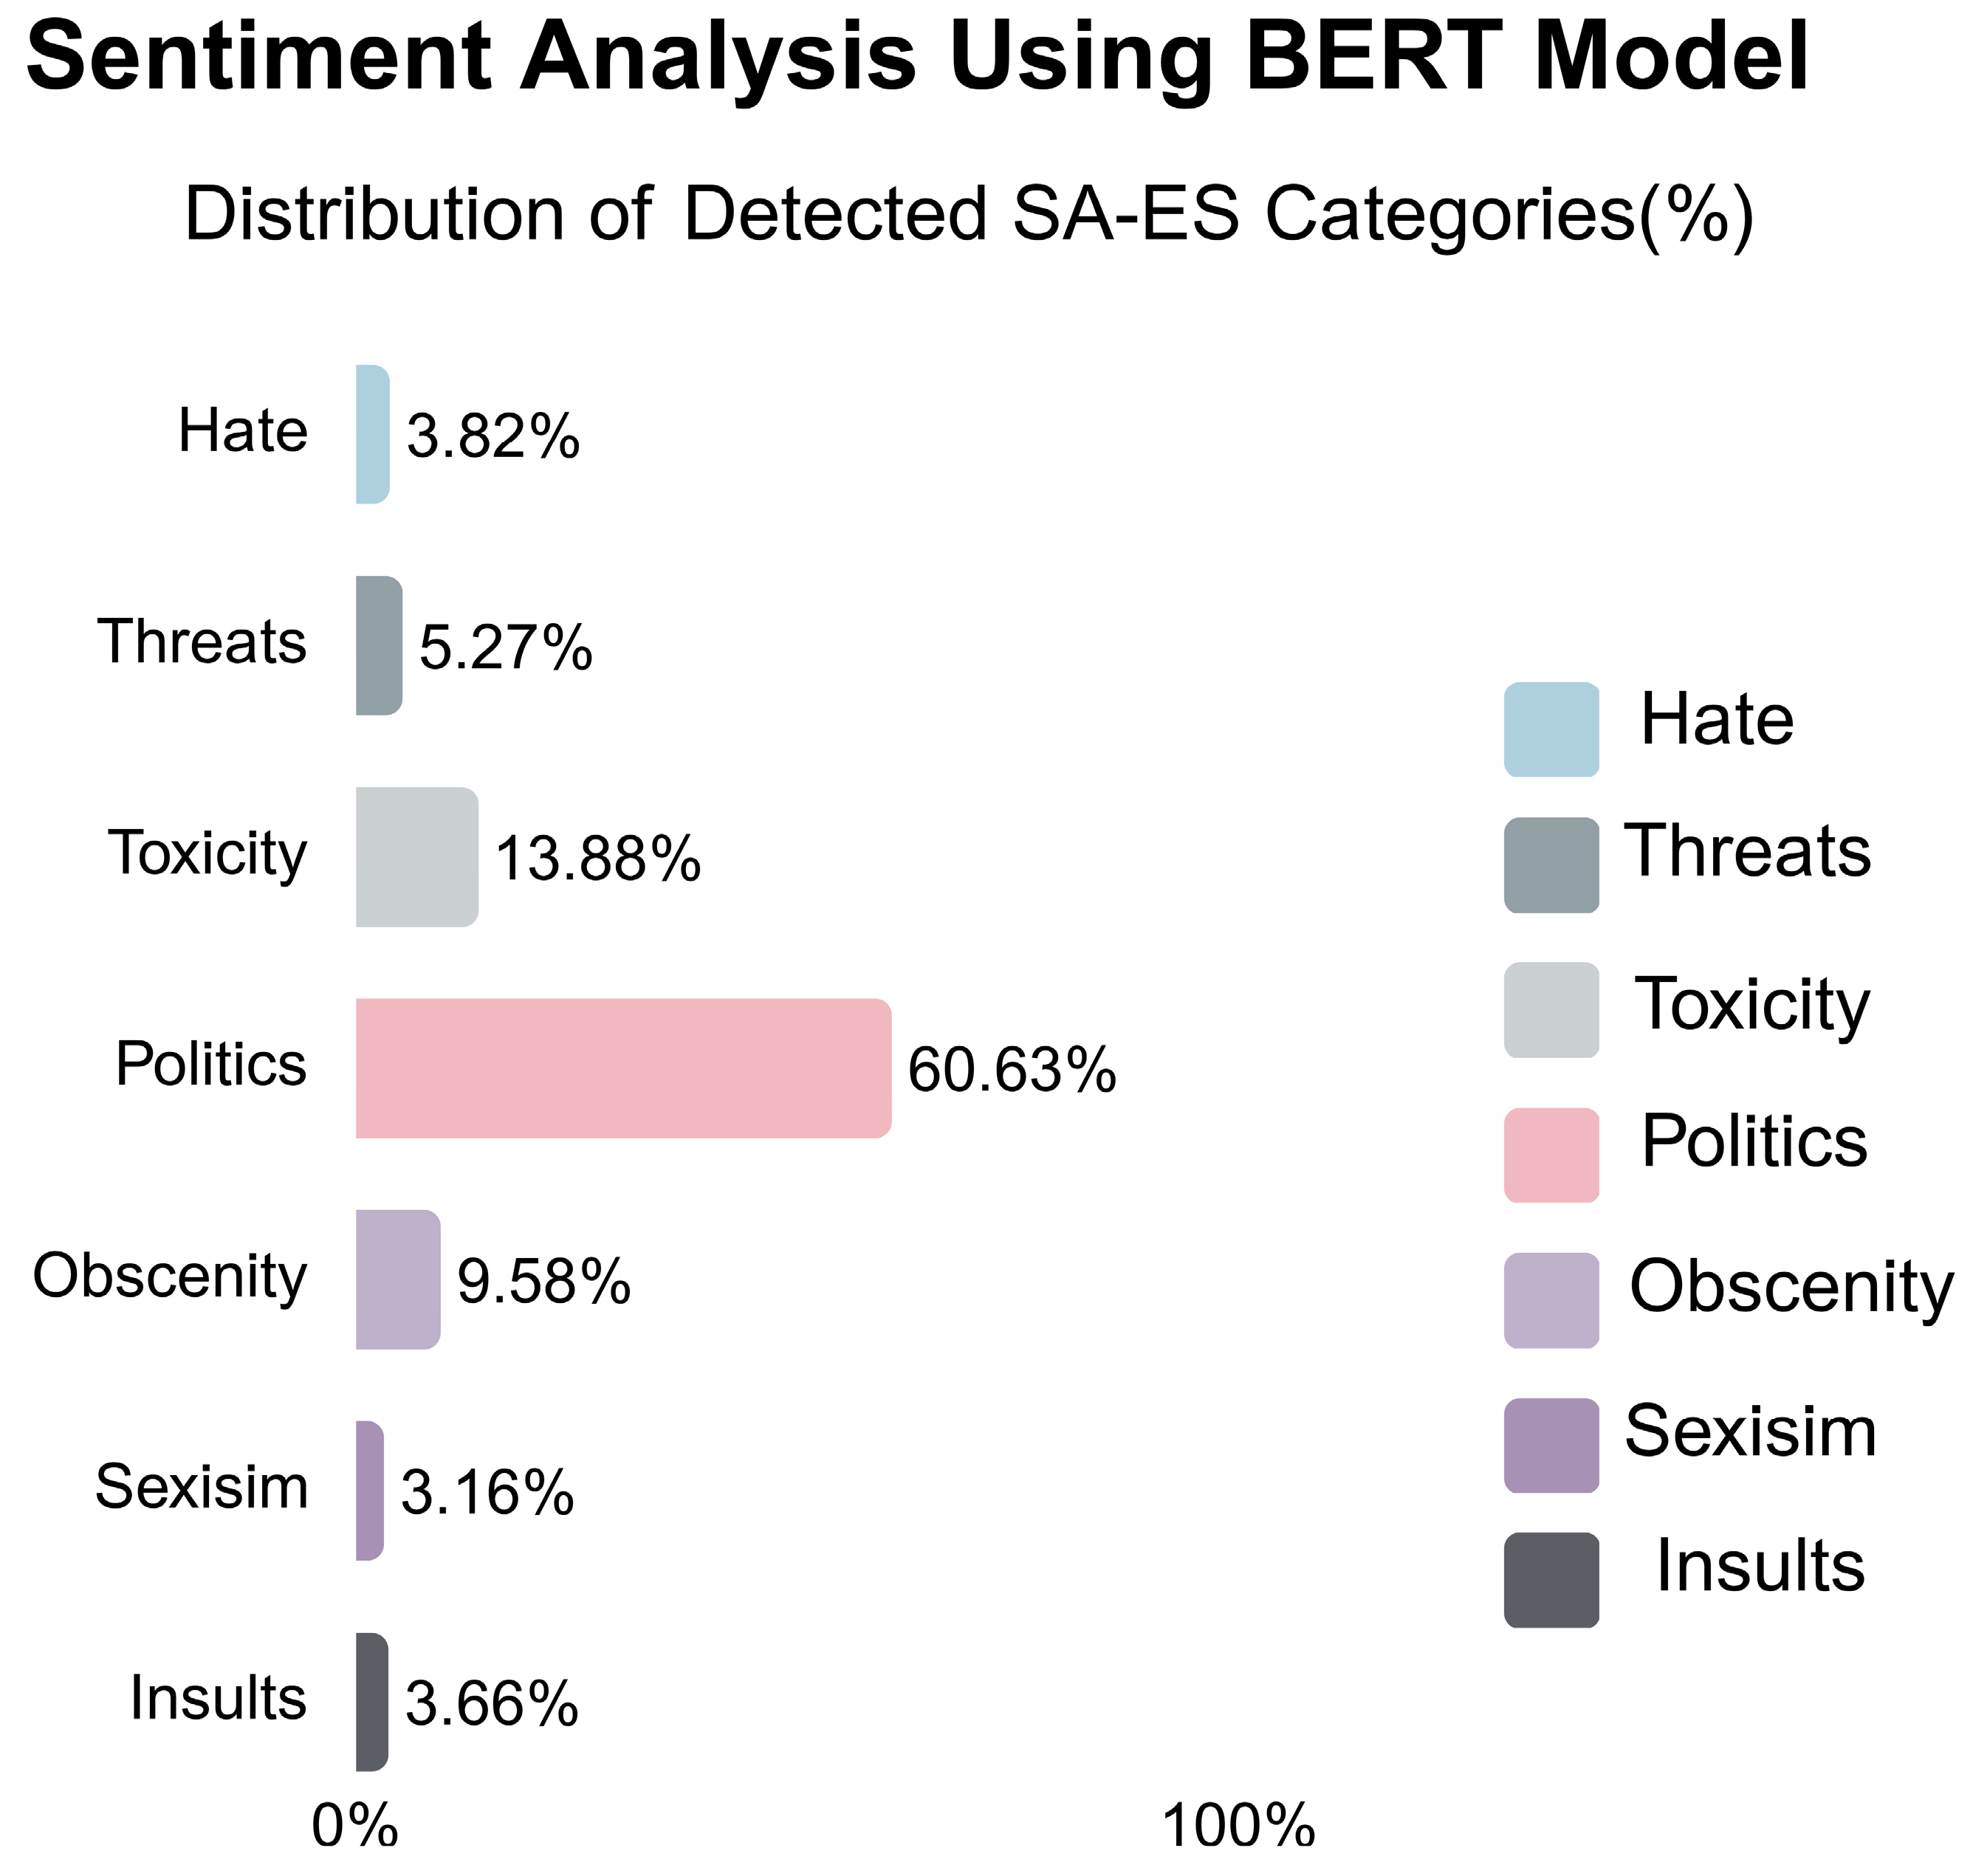
The fourth content example is “North Carolina is ‘in the small minority of states that requires an absentee ballot to be signed by two witnesses or a notary public”. As can be seen in
Figure 9, when the words in the sentence are analyzed, 60.63 percent of the sentences are analyzed as “politics” in the context of words such as notary and ballot. This shows that the system is working correctly.
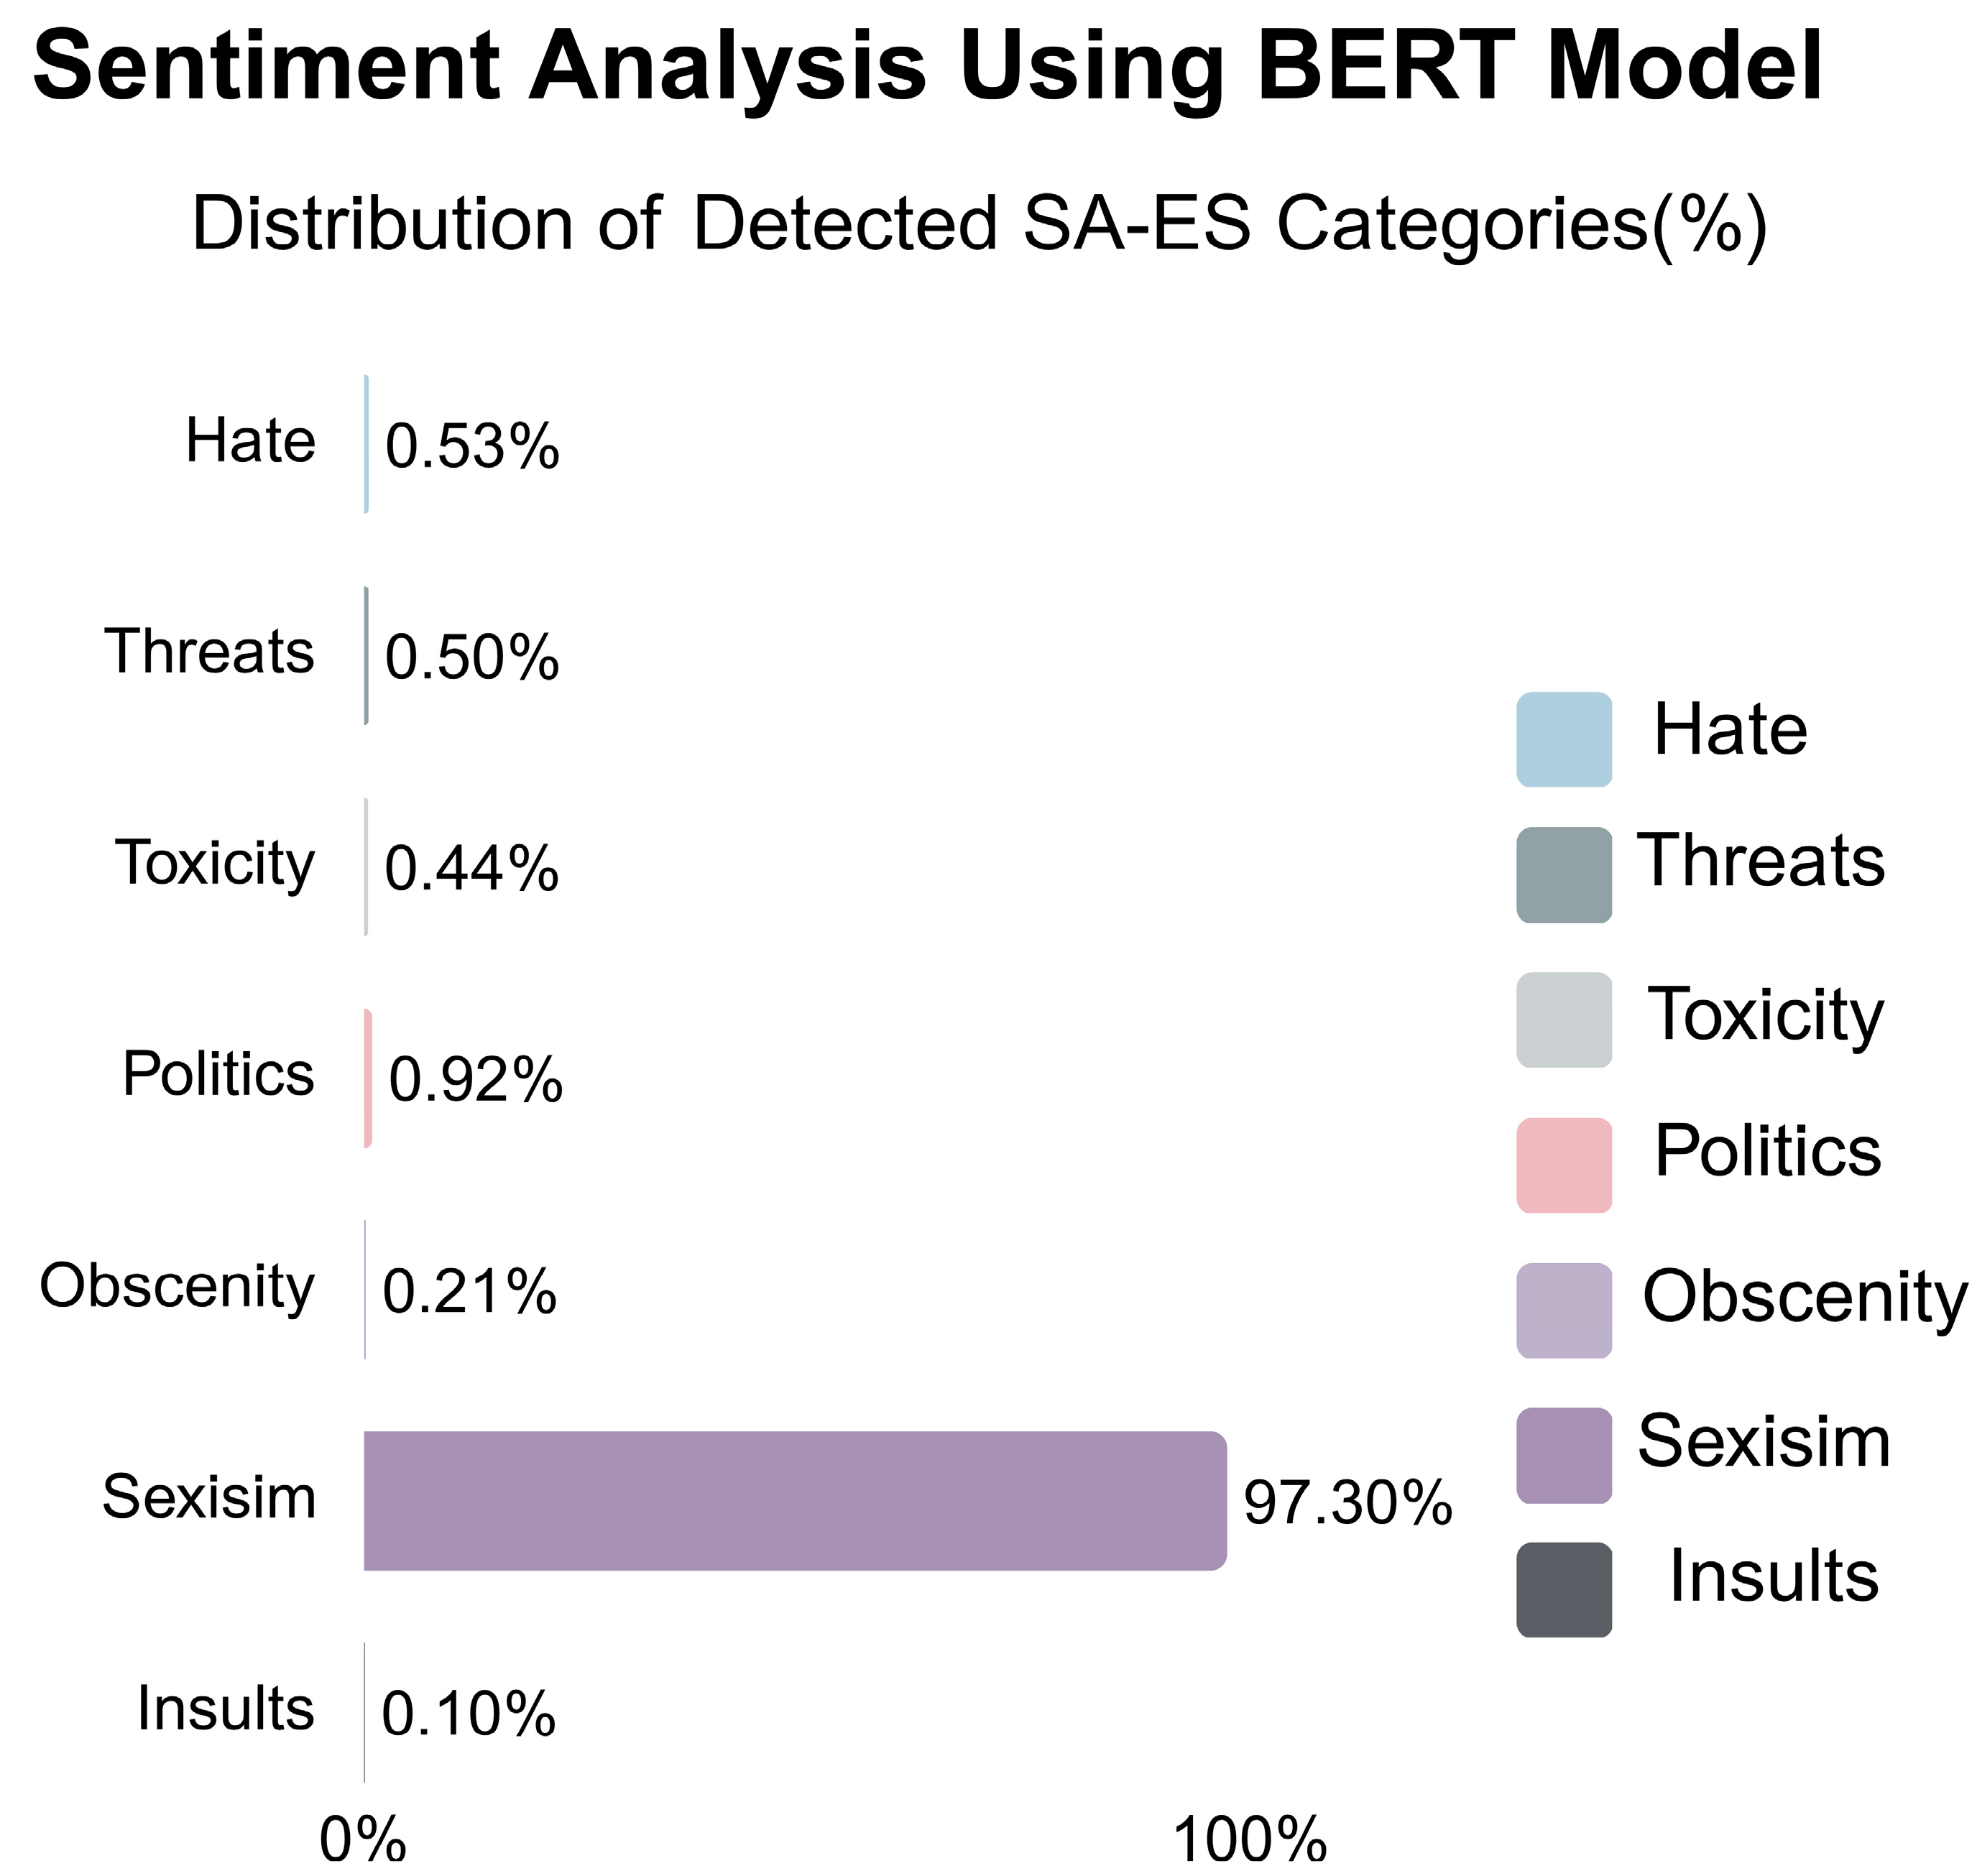
The fifth content example is “Africans living in China now being forced to sleep outside in the cold” as “Chinese nationals blame them for the rising number of new coronavirus cases in the country”. The language used and the mood of the user are analyzed with SA-ES, as can be seen in
Figure 10. It can be seen that the result contains “sexism” in 97 percent of the cases.
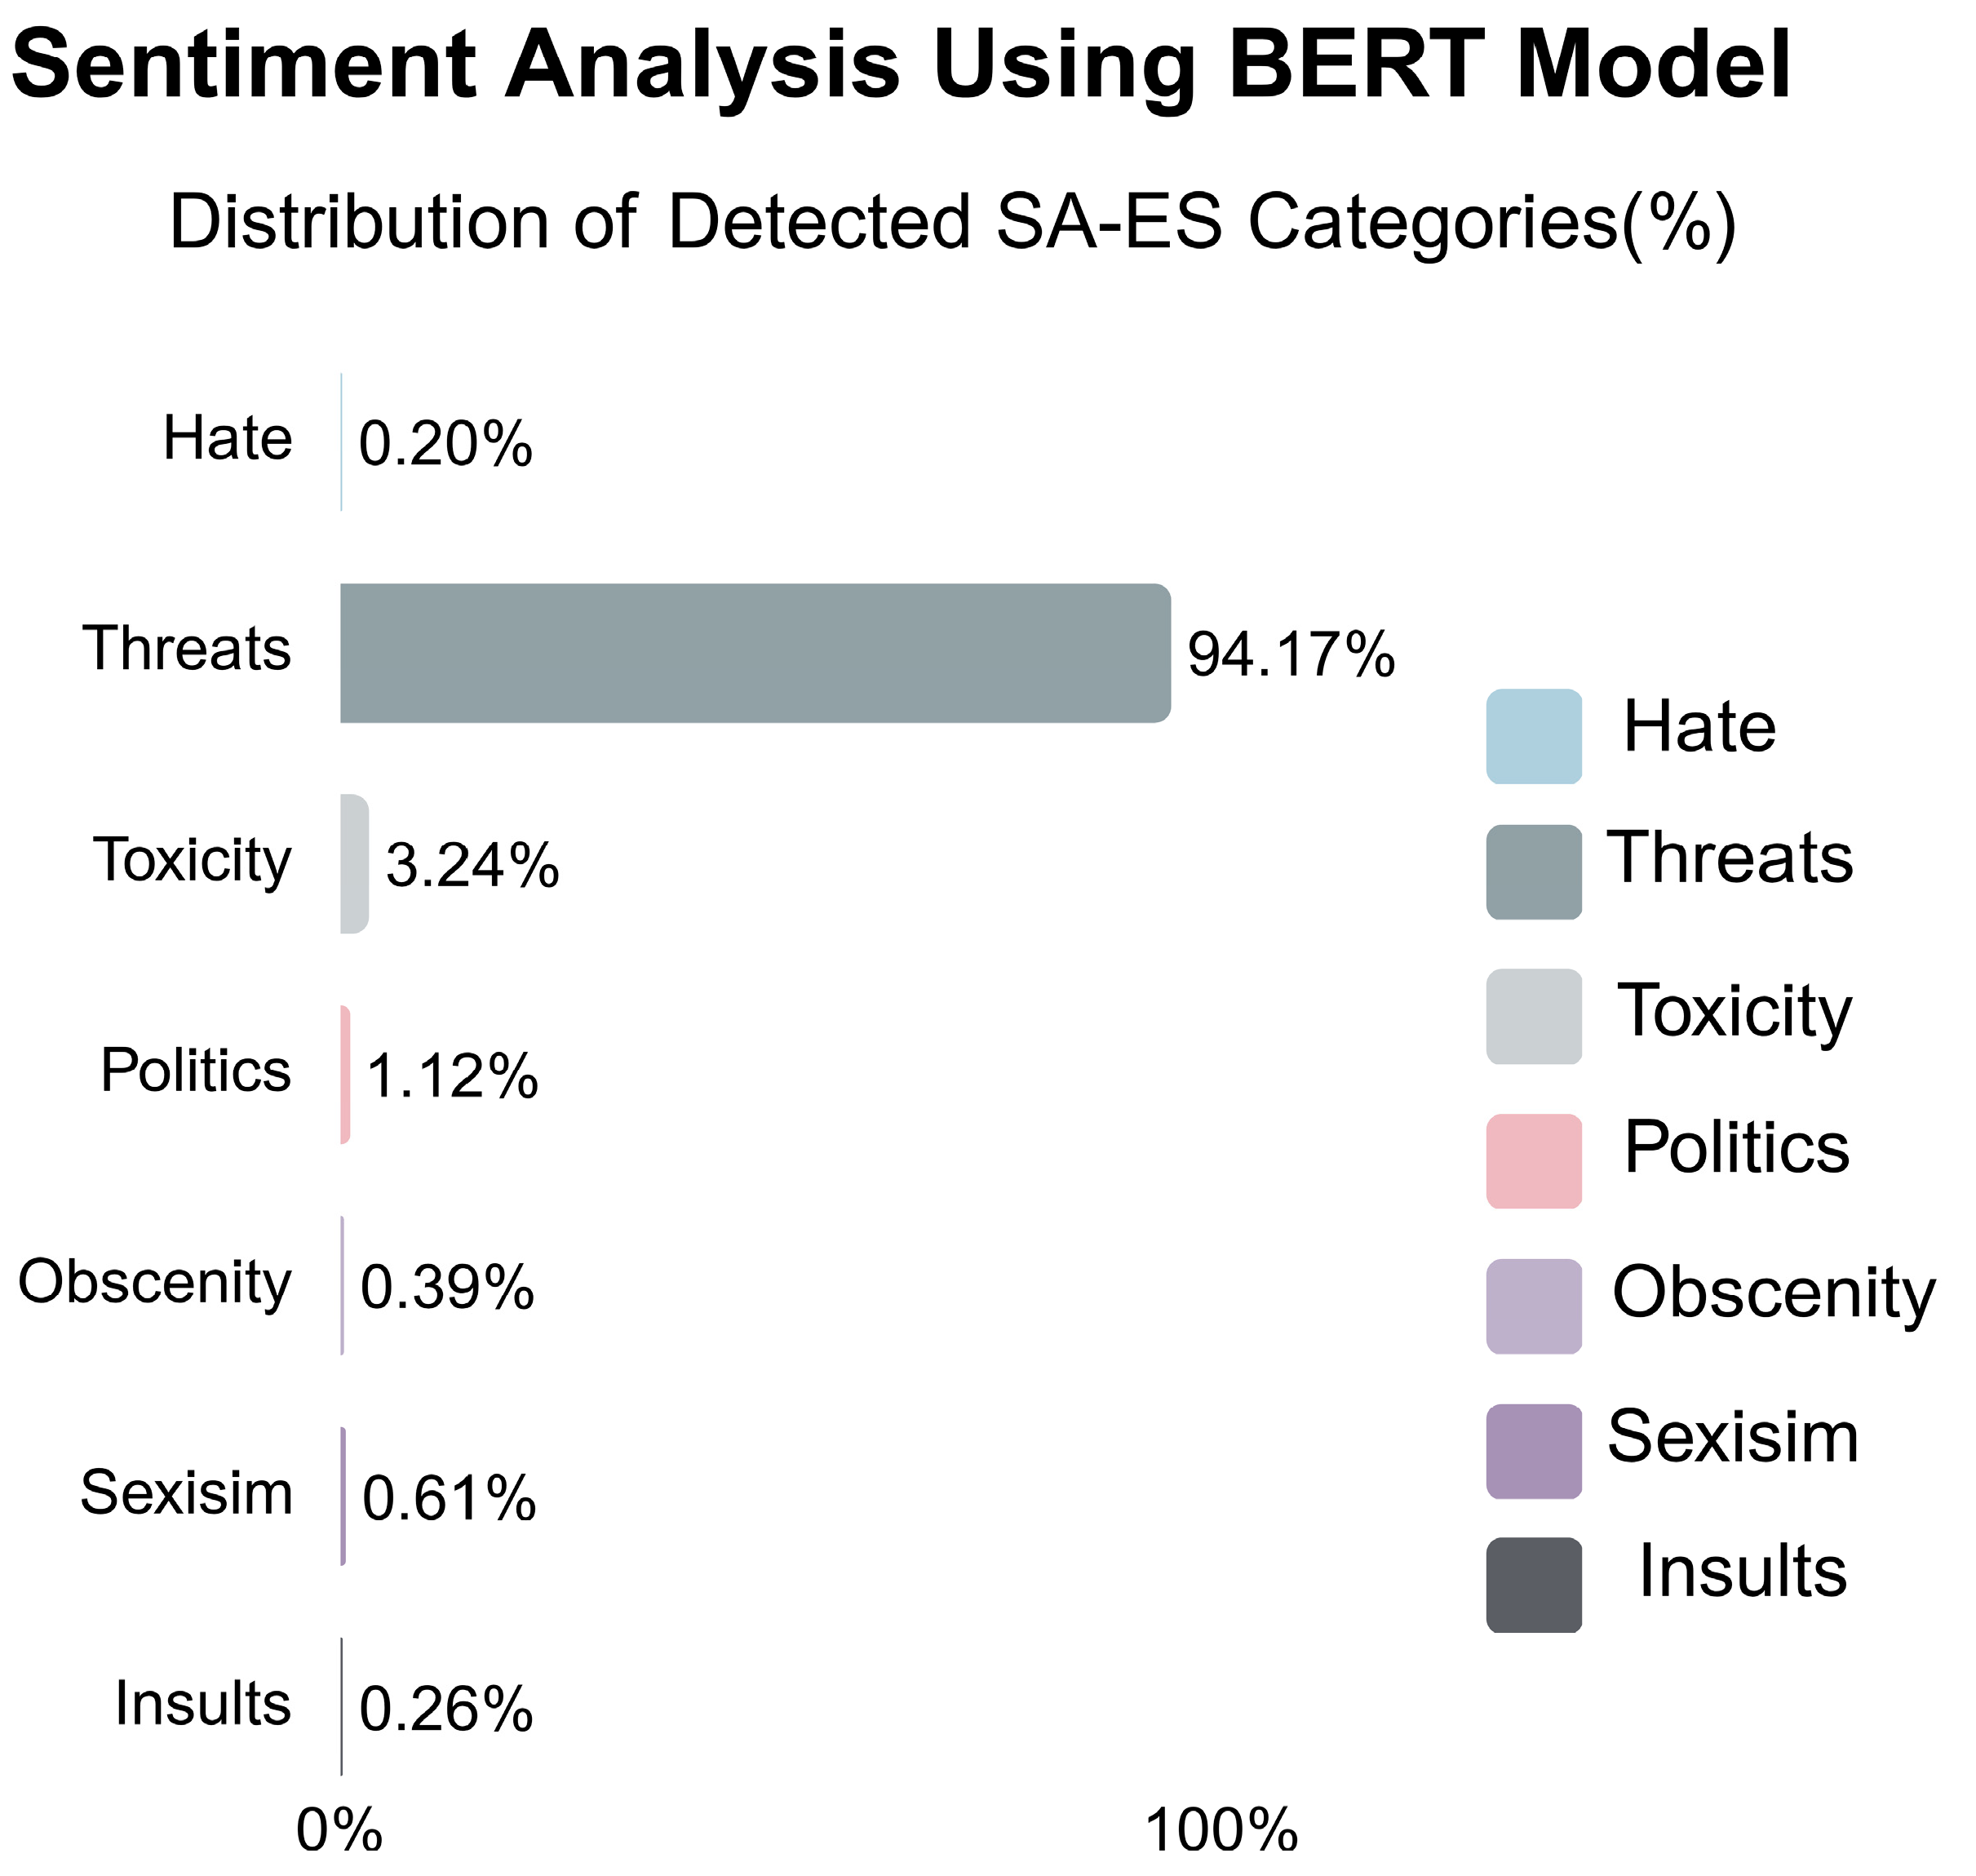
In
Figure 11, the sixth content example is “During the flu pandemic of 1918, some cities lifted social distancing measures too fast, too soon, and created a second wave of pandemic”. When the content of the sentence is examined, it has been analyzed as a 94.71 percent “threat” in terms of the possibility of a second wave of the pandemic and is considered extremely accurate.
The last content example is “Photo of an Italian doctor waving goodbye to co-doctors as he is about to die due to coronavirus”. Also, in
Figure 12, 18 SA-ES results contain “toxicity” at 84.71 percent; it is not clear if the doctor died from the coronavirus, but the action was carried out to scare people and such behaviors were used to inform social networks. It is believed that this is carried out to generate pollution.
The SA-ES system, which was created by prioritizing user needs within the framework of the CRISP-DM methodology, used cloud computing in a distributed and inclusive structure to avoid cyber-attacks. In addition, the BERT algorithm, a proven NLP algorithm in the field, was preferred. Since the SA-ES system works with large data, an evaluation was made in terms of computational power since the storage capacity and processor of a computer would be insufficient. Therefore, the study was implemented in the cloud. The cloud-based approach worked on MS Azure cloud computing with 20 GB RAM, 500 GB SSD HDD, and eight-core CPU processing power.
The results obtained in this study provided feedback to social network users not only in terms of positive, negative, and neutral sentiments but also in seven subcategories while performing sentiment analysis. These analyses, which can be evaluated with a high accuracy of 99%, perform sentiment analysis of social network users instantly. The main focus of this study is to perform detailed and real-time sentiment analysis of social network users against fake news.
8. Discussion
Nowadays, the popularity of social media is increasing [
40], and easy access, low cost, and quick dissemination of information are among the main advantages of social media that enjoy such reputations [
41]. Social media, which is a worldwide phenomenon with millions of members, allows users to freely distribute the information they publish to millions of people in minutes [
42]. Social media facilitates the rapid dissemination of information. The dissemination of non-scientific information through social media platforms such as Twitter has the potential to have harmful consequences. Situations such as the COVID-19 pandemic provide a favorable environment for misinformation to thrive.
Many studies have been conducted in the literature on sentiment analysis and fake news findings. One of the most popular social tools in sentiment analysis studies, Twitter, was discussed by Vershinin and Mustafina [
43]. In their study, solutions were generated for spam messages sent to users in real time via Twitter. Some 95% of tweets shared in real time were accurately estimated using a big dataset. According to a review conducted in the literature, most of the studies [
44,
45] were conducted with experimental data and the accuracy rates of the studies reached 70% or 90% accuracy. This means that the evaluation made has a margin of error of 30% or 10%. These ratios are important in such systems. High accuracy rates mean higher reliability of the system. For this reason, it can be said that it is necessary to develop systems with high accuracy. Instead, this study was conducted using the natural language processing technique of the BERT algorithm and the success rate was 99% by training the model with big data.
In addition, the most important aspect of this study is the examination of fake news spread on social networks with respect to the following seven categories: hate, sexism, politics, insult, obscenity, toxicity, and threat. For this purpose, a sentiment analysis rating system was created, consisting of a dataset of about 248,262 pieces of data analyzed with the BERT algorithm. Since this assessment also takes into account cyber threats, the system is a cloud computing-based system. It also provides various solutions that can be queried online through the cloud computing system infrastructure and updates the literature on social networks in terms of new technologies. As a result of the research and evaluations, the performance of the system was about 99 percent accurate. Moreover, in line with the information from the literature review, this study is the first and most recent study to conduct an in-depth sentiment analysis of fake news and shares on Twitter, which is considered a social microblog network, using a fully cloud-based system.
Furthermore, several studies have demonstrated that fake news can be analyzed through multi-category sentiment classification, providing nuanced insights into the emotional underpinnings of misinformation. For instance, the work in [
42] successfully employed BERT-based models to classify emotions into seven distinct categories, such as joy, anger, sadness, fear, guilt, shame, and surprise. Similarly, [
46] conducted sentiment analysis on news data, capturing a range of emotional states, including joy, anger, sadness, disgust, fear, and surprise. While these studies established the feasibility of multi-class sentiment classification, their focus remained on general emotional categories. In contrast, our study introduces a more domain-specific classification, grouping sentiments into sociopolitical (hate, sexism, politics) and psychological (threats, toxicity, obscenity, insults) content categories. This focused approach enhances the granularity of sentiment detection in fake news contexts. Furthermore, unlike previous studies that rely on pre-compiled datasets, our system utilizes real-time Twitter data processed through a cloud-based sentiment analysis engine, achieving a remarkable 99% accuracy. The real-time and high-performance nature of our system represents a significant advancement over earlier approaches, allowing for scalable and timely classification of fake news across the seven defined emotional categories. The comparison of these studies and their main methodological characteristics is summarized in
Table 5.
Similarly, understanding which emotional states drive the virality of fake news is essential for counteracting its spread. Research such as [
47] highlighted that incorporating sentiment as a feature improves fake news detection accuracy, implying a strong correlation between emotional tone and misinformation. Similarly, [
41] noted that emotionally charged political content, often associated with anger and polarization, tends to gain more traction on social platforms. However, these studies generally treat sentiment as a binary or general feature without delving into specific emotional states. Our study builds on this foundation by identifying seven distinct sentiment categories, allowing for a more targeted analysis of which emotions are most linked to fake news propagation. We find that sociopolitical sentiments like hate and sexism, as well as psychological sentiments like toxicity and threats, are particularly potent in influencing content virality due to their provocative and polarizing nature. This level of sentiment granularity is not addressed in previous models. Moreover, with the integration of a cloud-based architecture and real-time processing, our system not only detects fake news with 99% accuracy but also dynamically reveals which emotional states dominate the landscape of misinformation sharing. In doing so, our work advances prior research, such as [
41] and [
47], by offering an operational system that pinpoints the emotional triggers behind the viral spread of fake content.
Consequently, this study has its limitations. The first is its use of only a BERT model. Similarly, only data between January 2020 and May 2020 during the pandemic were obtained for this study. Furthermore, only English content tweets were obtained from Twitter and analyzed. However, this study proposes that future studies make use of a dataset beyond the 5-month peak period, which is January to May 2020. In addition, future comparative studies should adopt the use of hybrid models instead of standalone models such as BERT, which can improve this model’s ability to represent sentiment changes over time. In the same vein, future research should endeavor to train their models on a variety of datasets in other languages beyond just the English language, which will provide multilingual capabilities for sentiment analysis, making it possible to perform a thorough analysis of cultural differences among users across social media. Equally, future studies should make use of datasets posted in other social media platforms such as Facebook, Instagram, etc. Consequently, future research should make use of multi-label tweets and train them using multi-label classification methods such as multi-label BERT fine-tuning and multi-task learning to achieve a better performance compared to the existing single-label model.
9. Conclusions
Social networks, which have grown in popularity in recent years, have now become the main tools of online communication. The spread of fake news has gradually increased with the increased use of social networks, especially during the pandemic period, and has affected the emotional states of individuals. In this context, the effects of users’ emotions on fake news sharing have also increased in parallel. In the literature, most researchers focus on only classifying texts as positive, negative, or neutral. However, it is important to examine these emotional states in more detail, not just in terms of positive, negative, or neutral. With the developed SA-ES system, which encompasses big data from Twitter and MS Azure cloud computing real-time analyses and evaluations of query processes via Twitter connections, detailed and instant answers with respect to the end user related to seven different categories (hate, sexism, politics, insult, obscenity, toxicity, and threat), are provided in the sentiment analysis of fake news.
Moreover, issues still exist in the related literature in terms of instantly categorizing sentiment analysis in detail. For this reason, text mining with natural language processing (NLP) methods was conducted in this study to reveal emotions in the sharing of fake news on Twitter. Consequently, the implementation of BERT’s bidirectional encoder and transformers used in the study was useful in analyzing tweets in a forward and backward relationship approach, unlike other models in this study that process texts sequentially. Similarly, the deep learning approach of transformers was used to process sequential text data.
The performance evaluation of the developed SA-ES system showed that it outperformed exiting systems by achieving 99% accuracy. Also, it can be said that the developed system is effective in terms of performing sentiment analysis of users’ tweets as well as text sentiment analysis beyond Twitter (now X). Hence, the gap in the literature on sentiment analysis will be fixed by the developed system.
The study is limited to the data collected from Twitter and also to the MS Azure cloud computing system with 20 GB RAM, 500 GB SSD HDD, and eight-core CPU processing power. We hope that, given the results of this study, both the social media platforms and the public in general question the truth of the news distributed on social media sites, and also that the relevant authorities in society take the measures necessary for a healthier society.
