1. Introduction
Driven by soaring demand for technologies such as artificial intelligence (AI) and 5G, the global semiconductor industry’s expansion has spurred a need for new fabrication plants (fabs) [
1]. These highly complex and capital-intensive facilities require precise environmental controls and system integration. Situated at the intersection of computational design and design automation in the architecture, engineering, and construction (AEC) fields, this study leveraged building information modeling (BIM)-based algorithms to address the gap between traditional AEC design methodologies and the unique technological demands of the semiconductor industry [
2,
3].
The design and construction of modern fabs face increasing pressures. Technically, advancing chip technology imposes increasingly complex requirements on equipment layout, utility networks, and environmental controls [
4]. Socioeconomically, geopolitical competition and the “Chip War” have led governments to subsidize domestic fab construction, yet a global shortage of skilled professionals causes significant project delays [
5]. This environment creates immense pressure to design and build fabs faster and more efficiently with limited resources.
This study addresses the “Design Bottleneck” stemming from the mismatch between modern demands and legacy design methods. This bottleneck is characterized by three key factors: First, traditional manual and iterative design processes are inefficient because they explore only a limited number of alternatives while being time-consuming and expensive. Second, a conflict exists between the prolonged timeline required for fab construction and the ever-shortening lifecycle of cutting-edge chips, creating a substantial investment risk. Third, data discontinuities throughout the complex design process lead to a high potential for errors and costly rework during construction.
To resolve the Design Bottleneck, this research proposes a methodological framework using Dynamo-linked generative design (GD) [
6]. This approach marks a paradigm shift from manual design to a process where designers define “Goals” and “Constraints,” allowing an algorithm to autonomously explore and evaluate thousands of alternatives [
7]. The motivation is to transition from slow, intuitive practice to a data-driven, automated process that delivers the speed and precision required by the semiconductor industry. To ensure practical applicability in this high-security sector, the methodology is based on generalized models, enabling its application without sensitive project data [
8]. The proposed framework aims to minimize design risks and facilitate the construction of high-performance fabs within a shorter timeframe.
This study demonstrates the application of the GD framework to key fab design challenges: (1) overall facility layout optimization and (2) automated routing of complex utilities. The findings demonstrate how the framework balances conflicting objectives, such as spatial efficiency, workflow, and safety, to derive optimal solutions. This study concludes that GD is a strategic necessity and not just a productivity tool for rapidly changing industries. Its primary contribution is to provide a practical blueprint for applying this new design paradigm to the specialized field of semiconductor fab design.
2. Literature Review
This chapter reviews the existing body of knowledge pertinent to the automated design of complex facilities, with a focus on the research gap that necessitates the proposed framework for semiconductor fab optimization. The review follows a funnel structure, starting from broad concepts in design automation and GD, narrowing to automated space planning in complex facilities, and pinpointing specific unmet needs in semiconductor fab design.
2.1. Evolution of Design Automation and GD in AEC
The AEC industry is undergoing significant transformation driven by the adoption of automation technologies [
9]. This shift is a response to the mounting pressure from escalating project complexity, condensed timelines, stringent sustainability mandates, and the persistent need to mitigate risks and reduce costs. Automation is no longer viewed as a futuristic ideal but as an essential strategy for enhancing efficiency, minimizing human error in repetitive tasks such as data entry and routine design modifications and, importantly, liberating design professionals to focus on strategic innovation and high-value problem-solving [
10]. The adoption of automation yields tangible benefits, including improved project quality, streamlined workflows, and accelerated project delivery timelines, largely facilitated by enhanced coordination and real-time collaboration enabled by technologies such as BIM automation [
11]. This imperative for greater efficiency and control in the face of increasing demands has driven the development and adoption of more sophisticated automation methodologies.
In this context, GD has emerged as a promising subset of computational design [
12]. In a GD process, designers define initial parameters, overarching goals, and critical constraints; subsequently, algorithms iteratively generate and evaluate a multitude of potential design options [
13]. This rule-based approach allows the systematic exploration of a vast design space, far exceeding the scope of manual human capabilities, thereby enabling the discovery of novel and highly optimized solutions. The historical roots of contemporary GD can be traced back nearly two decades to early architectural applications of scripting—programming to manipulate geometry within computer-aided design (CAD) environments. These pioneering efforts paved the way for current GD strategies, making it possible to design and construct highly complex forms and intricate construction sequences. This evolution signifies a fundamental paradigm shift in the AEC design process, from merely making data (e.g., creating static CAD drawings) to actively using data (i.e., employing computational power to generate, manipulate, and apply data to improve outcomes). This transition implies that the intrinsic value of a design is increasingly linked to the intelligence embedded within its generation and optimization process, rather than solely its final physical form, laying the groundwork for more advanced concepts, such as Digital Twins [
14].
Furthering this evolution, GD is rapidly progressing beyond simple form-finding or the generation of numerous options toward a more sophisticated paradigm known as “performance-based generative design” [
15]. In this advanced approach, the primary focus is optimizing designs against a range of quantifiable objectives. These objectives include structural performance, energy efficiency, material usage, lifecycle costs, occupant thermal comfort, daylighting, and acoustic performance. Achieving this requires tight integration of GD workflows with specialized simulation tools and sophisticated multi-objective optimization (MOO) algorithms [
16]. These MOO techniques are critical for navigating the inherent tradeoffs that arise among multiple, often conflicting, design goals. Although GD offers substantial advantages, its efficacy is critically dependent on the quality of the input parameters, precise definition of goals, and robustness of the underlying algorithms. This dependency underscores the growing necessity for well-defined methodologies to establish these inputs effectively and for the development of user-friendly interfaces that empower designers to harness GD capabilities without requiring extensive programming expertise.
2.2. Prior Research on Automated Space Planning for Complex Facilities
GD principles and automated space planning techniques have been investigated for a variety of complex facilities that share certain characteristics with semiconductor fabs. These analogous building types include hospitals that demand intricate layouts for services and strict departmental adjacencies; data centers, where the optimization of power distribution and cooling systems is paramount; research laboratories, characterized by specialized equipment, controlled environments, and specific utility requirements; and other large-scale commercial or institutional buildings, such as conferences, exhibiting halls, and office complexes [
17]. For example, in the healthcare sector, Li et al. proposed a performance-based GD framework for hospitals that optimizes both adjacency for day-to-day operational efficiency and infection control pathways, demonstrating a method to balance conflicting objectives between normal and pandemic scenarios [
18]. Studies in these areas typically aim to optimize facility layouts according to criteria such as circulation efficiency, adjacency requirements, resource utilization, and overall functional performance.
A review by Zhuang et al. highlights a significant trend, distinguishing between traditional rule-based GD and the emerging paradigm of machine learning (ML)-assisted generative design, emphasizing a broader industry shift toward data-driven approaches [
19]. Computational methodologies frequently employed in these studies encompass a range of techniques. Genetic algorithms, such as NSGA-II, are typically used to explore vast design spaces and determine near-optimal solutions, as demonstrated by Noorzai et al. in a framework for 3D building volumetric optimization that balances space utilization, thermal comfort, cost, and rental value within a BIM environment [
20]. To handle complex geometric and topological relationships inherent in automated design, novel data structures are being developed; for instance, Gan developed a BIM-based graph data model to specifically support the automated generative design of modular buildings [
7]. Furthermore, ML approaches have been increasingly employed for tasks such as pattern recognition in existing layouts, prediction of performance metrics, and guiding the design generation process [
21]. For example, generative adversarial networks have been utilized to balance daylighting and thermal-comfort objectives in building design, and reinforcement learning has been used to optimize factory layout planning [
22].
Despite these advancements, a critical review of the existing research on automated space planning reveals significant limitations, particularly considering the extreme and unique demands of semiconductor fabs. A discernible pattern emerges where the complexity of complex facilities is often abstracted or simplified to render automated layout generation computationally tractable. This frequently involves focusing on two-dimensional floor-plan layouts or simplified three-dimensional (3D) massing, often for single-story buildings or structures with little vertical system integration. Such approaches typically fail to address the intricate, multistory, and 3D interplay of spaces and critical systems that characterize modern semiconductor fabs.
A major deficiency in the current body of research is the general failure to holistically integrate automated routing and the optimization of dense, multilayered utility and mechanical, electrical, and plumbing (MEP) systems with the primary spatial planning process [
23]. While studies such as that by Pestana et al. focus specifically on leveraging GD for MEP design optimization in the early stages of AEC projects, their deep integration into a comprehensive facility layout-generation framework tailored for highly specialized environments, such as fabs, remains underdeveloped [
8]. The complexity of these facilities has evolved rapidly, particularly in terms of the density and interdependency of systems, arguably outpacing the application of these optimization techniques in a truly holistic manner for this specific domain.
Furthermore, existing general-purpose layout algorithms often do not adequately incorporate unique and stringent constraints specific to semiconductor manufacturing. These include adherence to rigorous ISO cleanroom classifications and the complex airflow patterns they dictate, the necessity for precise vibration control measures, the management of complex and hazardous chemical and gas delivery systems, and the critical need for exceptional design adaptability to cope with the rapid technological obsolescence of manufacturing equipment [
24]. Finally, many academic models for GD assume access to detailed project data—a premise that is often infeasible in the high-security environment of the semiconductor industry, where intellectual property and process information are closely guarded. The increasing reliance on complex algorithms also brings forth the “black box” problem, where the algorithm’s decision-making logic may be opaque to human designers. This opacity is a significant concern for high-stakes designs such as semiconductor fabs, necessitating explainable AI (XAI) in GD for AEC to ensure that designers can understand, trust, and effectively guide these automated processes [
25].
2.3. Objectives and Contributions of This Study
This study proposes a methodological framework for optimizing semiconductor fab design using dynamo-based GD within a BIM environment. The primary objectives are as follows:
To develop algorithms for the proactive, clash-free generation of facility layouts and utility routing, moving beyond reactive clash detection.
To propose a user-friendly, BIM-based framework (Autodesk Revit and Dynamo) accessible to designers, which utilizes “generalized models” to address data security.
To establish a data-driven evaluation process that supports decision-making by ranking design alternatives according to multiple performance criteria, such as spatial efficiency, safety, and cost.
The main contribution of this study is a standardized data-agnostic GD framework tailored for the complexities of semiconductor fabs. This framework offers a practical solution to the Design Bottleneck by enhancing design quality and efficiency, and it establishes a foundation for future Digital Twin integration in high-tech facility management.
3. Methodology
This paper proposes a GD framework utilizing Dynamo within a Revit BIM environment to solve the Design Bottleneck in semiconductor fab design. The core of this methodology is to define the design goals and key constraints as parameters, allowing an algorithm to generate and evaluate numerous design alternatives to derive an optimal solution, rather than having a designer draw manually.
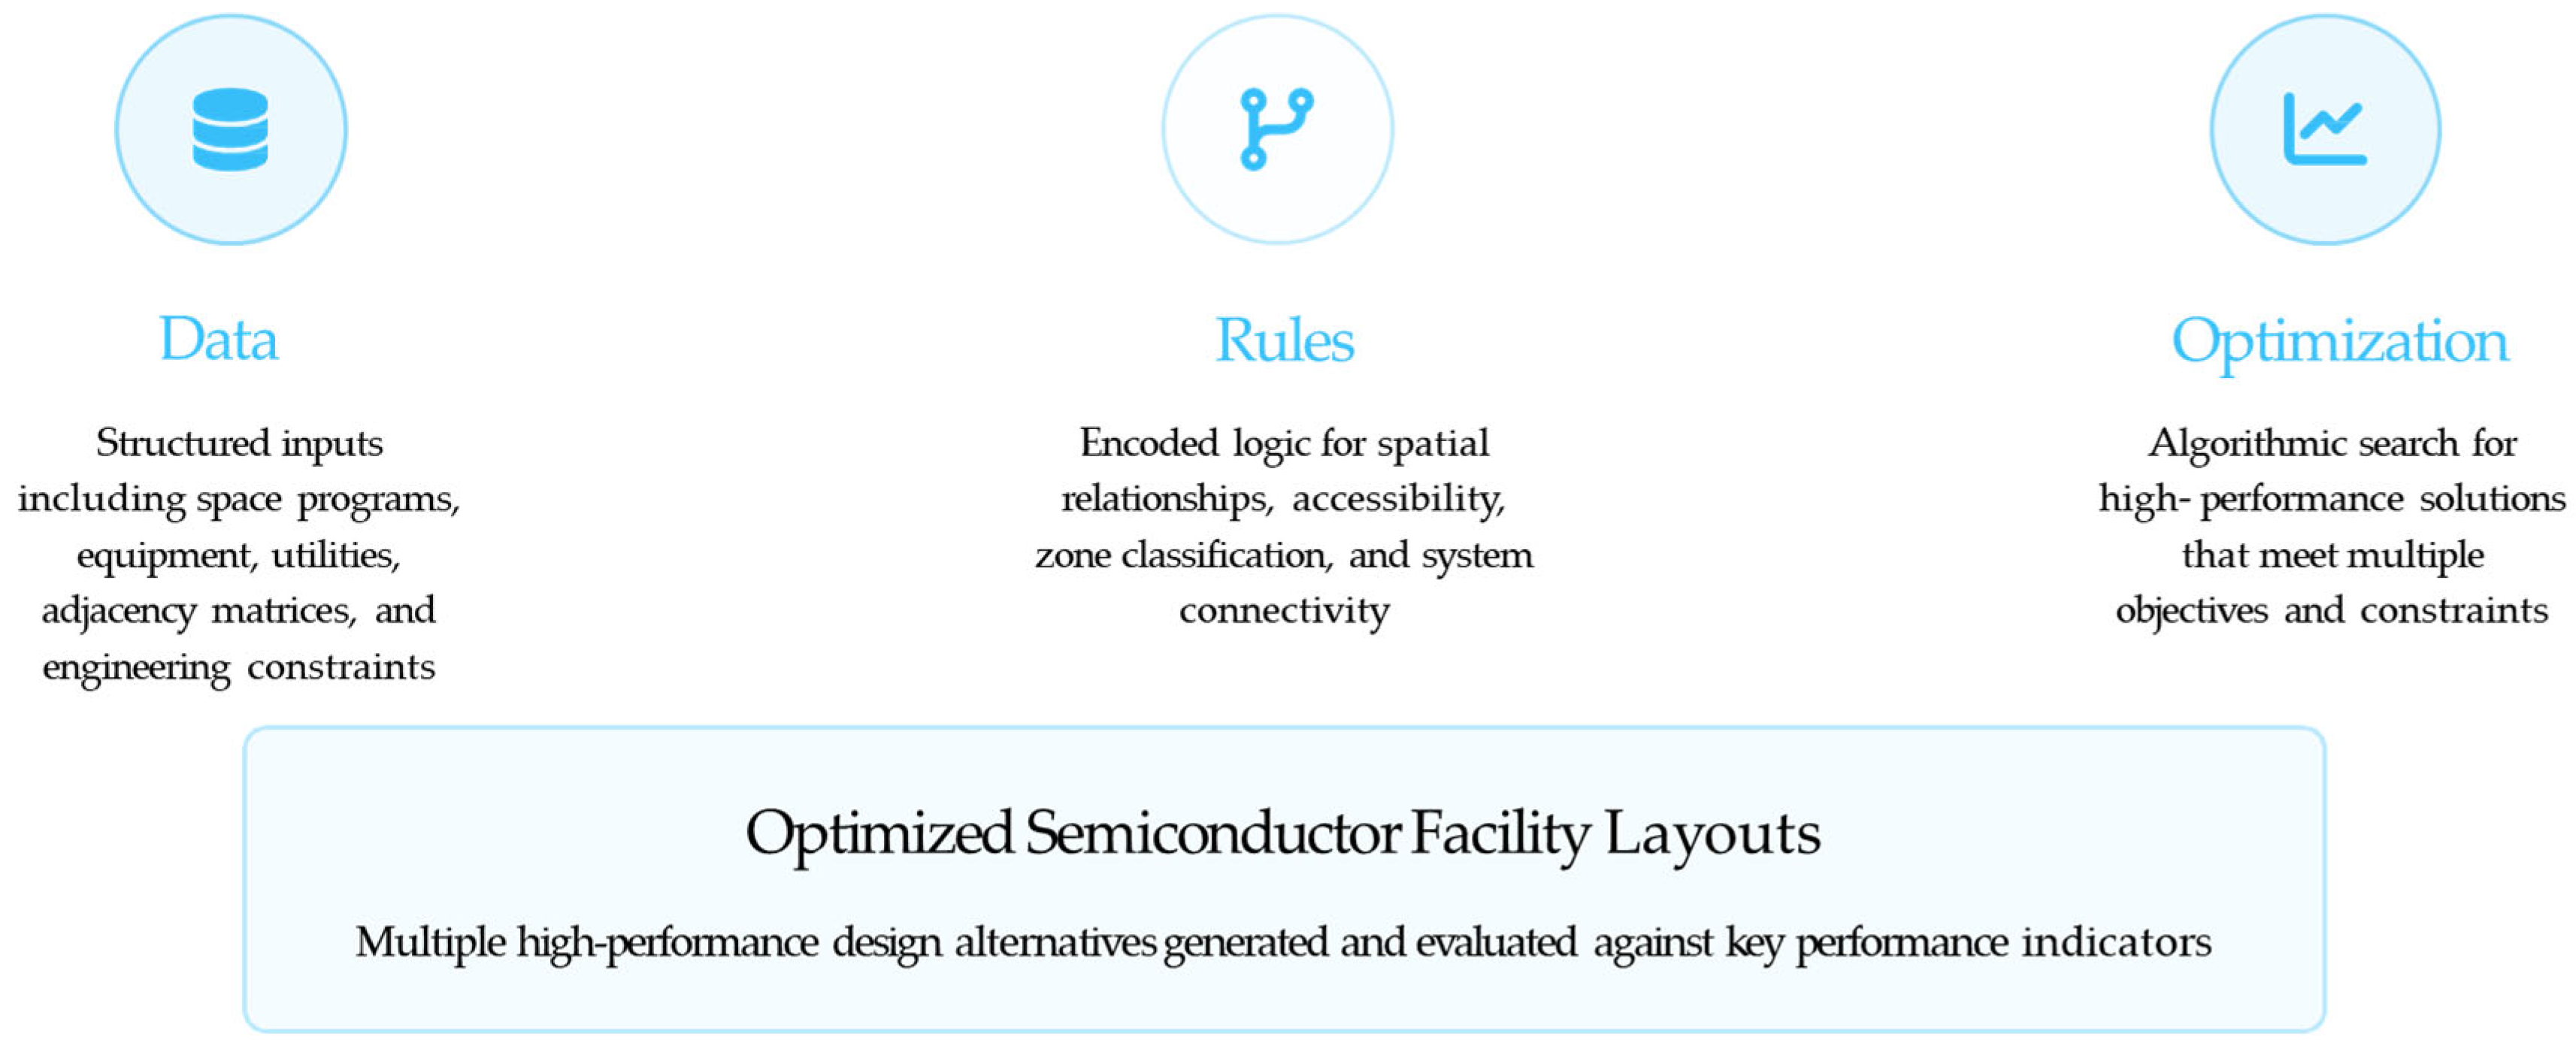
This framework is founded on three essential pillars: Data, Rules, and Optimization, as shown in
Figure 1. The entire process begins with the input of structured Data, such as space programs, equipment lists, utility requirements, and adjacency conditions. Next, Rules are defined to encode the logic governing the facility, including spatial relationships, maintenance accessibility, and cleanroom classifications. Finally, in the Optimization stage, the algorithms search a vast design space for high-performance solutions that satisfy multifaceted objectives and constraints. This process allows multiple high-performance alternatives to be generated and evaluated against key metrics, leading to rapid design iterations, cost reduction through optimized utility paths, enhanced operational efficiency, and improved space utilization.
Based on this approach, the entire process consists of two main stages: (1) macro-level space planning and equipment layout optimization and (2) automated routing of complex utility systems. This methodology is customized to reflect the unique characteristics of the highly controlled and complex environment of a semiconductor fab.
3.1. Software and Digital Environment
The proposed GD framework is implemented within a parametric BIM environment by integrating Autodesk Revit, Autodesk Dynamo, and Python 3.12 scripts based on GD, as shown in
Figure 2. Autodesk Revit functions as the primary BIM authoring tool, where the site boundary, structural grids, and cleanroom requirements are defined as parametric Mass elements. In Revit, the researcher creates parametric families for semiconductor tools, utility units, and structural components and embedded attributes such as physical dimensions, utility connection points, maintenance clearance, weight, and cost information. These parametric families serve as the building blocks that the generative algorithm places and evaluates, ensuring that every element carries the metadata required for automated decision-making.
Autodesk Dynamo, which is fully integrated into Revit, functions as a generative engine. Using Dynamo’s node-based visual scripting, the parameter values and geometric data are extracted from the Revit model and fed into a series of logical routines. These routines encode all the design rules and constraints, such as site boundaries, adjacency relationships, cleanroom class requirements, and budget limitations, and iterate through potential design variants. For example, Dynamo scripts generate multiple site layout options, apply zoning and packing algorithms for equipment placement inside each building, and compute optimal bridge routes between structures. Designers can adjust the node parameters and inspect visual data flows without writing code, while Dynamo handles the automated generation of candidate layouts and updates the Revit model using each iteration’s geometry.
Python is used within Dynamo to perform computational tasks that exceed the native capabilities of the Dynamo nodes. Complex operations, such as multi-constraint optimization, shortest-path routing under cleanroom adjacency restrictions, and multi-objective KPI calculations, are delegated to Python scripts. Dynamo passes the input data (such as lists of object dimensions, adjacency matrices, and weight factors) to a Python script node that executes the necessary numerical algorithms and returns the results. This hybrid approach allows researchers to maintain a largely visual, node-based workflow, while leveraging Python’s flexibility for advanced calculations.
In combination, these three tools create a continuous digital workflow: Revit defines the parametric geometry and metadata; Dynamo organizes the control flow of the generative algorithm, applying rules and constraints to produce and modify alternatives; and Python executes high-performance numerical and optimization routines behind-the-scenes. This integrated environment enables the automatic generation of numerous valid design options and the reintegration of chosen alternatives into a final Revit BIM model, streamlining the iterative design and reducing manual effort.
3.2. Prerequisites for Input Models
Before executing the GD algorithm, three essential inputs must be prepared: a parametric site mass model, an intelligent Revit Family library, and a structured user input data file.
First, the parametric site mass model in Revit is used to define a buildable envelope. This includes the site footprint, height parameters, cleanroom area constraints, and structural grids. This model establishes a spatial boundary, ensuring that all generated alternatives adhere to the site limits.
Second, an intelligent Revit Family library contains parametric definitions for all project elements. Each Family embeds key attributes such as dimensions, clearance needs, connection points, and cost. These data enable the algorithm to perform automated checks and calculations and allow the precise placement of BIM instances in the final selected design.
Third, a user input data file (e.g., Excel) structures all the design goals and constraints. It typically includes an equipment list, adjacency rules defining spatial relationships, and global objectives such as budget limits and performance weighting factors.
Together, these three inputs provide a comprehensive foundation for the generation process. The site mass defines the spatial boundaries, the family library defines the building blocks, and the data file defines the project-specific rules and objectives, ensuring that all generated alternatives are valid and aligned with the project goals.
3.3. GD Algorithm Procedure
The GD workflow begins when the user executes the project and loads an Excel spreadsheet containing all design requirements. This spreadsheet encapsulates the list of equipment to be placed, adjacency rules between pieces of equipment, overall budget constraints, and various optimization weightings. Once Dynamo imports the spreadsheet, it performs a parsing routine to verify that every required field is present and correctly formatted. If any mandatory entry is missing or improperly formatted, the algorithm immediately halts and reports the error to the user, preventing further computations with incomplete data. By validating the input data at the outset, the framework shown in
Figure 3 ensures that every subsequent step operates with accurate and reliable information.
After successful validation, the main workflow calls Subroutine_A, as shown in
Figure 4. In this subroutine, the algorithm references the parametric site mass and structural grid defined in Revit to enumerate all the feasible site layout scenarios. Using grid coordinates and geometric constraints, Subroutine_A computes every combination of building placements that neither violates the site boundary nor allows interbuilding collisions. Each valid layout is recorded, completed with geometric metadata, and returned as a candidate for a detailed design. These candidate layouts represent all the spatially permissible arrangements of the fab’s main building, utility structures, and ancillary facilities.
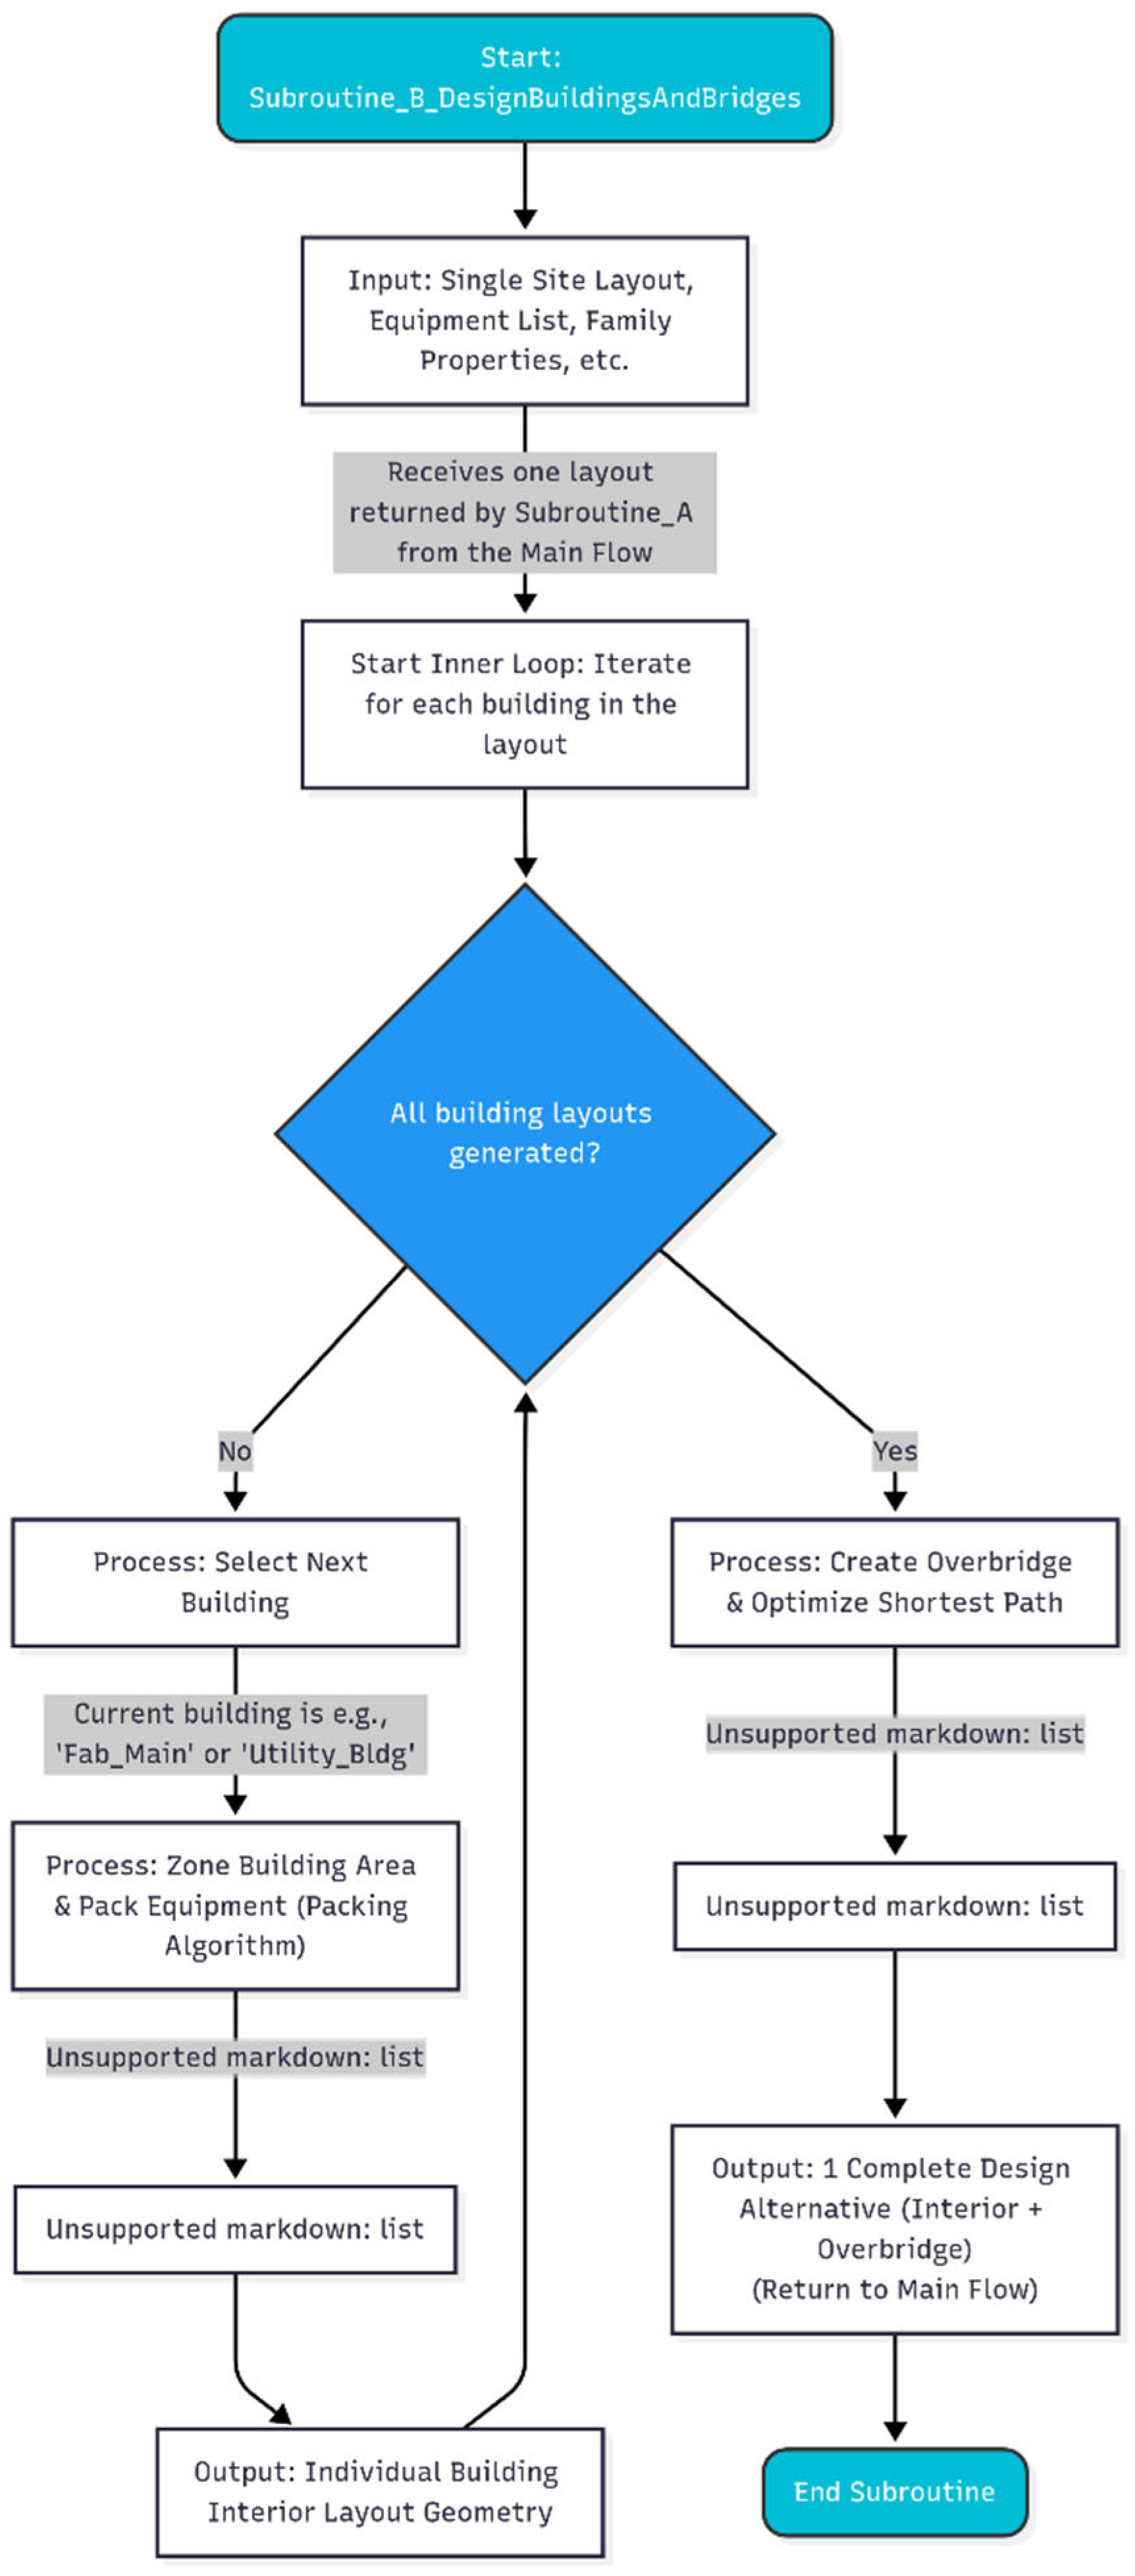
With a list of site layouts, the main workflow enters an iterative loop that processes each candidate layout sequentially. For each selected layout, Subroutine_B, as shown in
Figure 5, is invoked to generate an internal building plan and interbuilding connections. Subroutine_B begins by iterating through every building in the layout of the current site. For each building, it subdivides the interior into functional zones and then applies a packing algorithm that allocates equipment to those zones while respecting the clearance requirements, utility connection points, and adjacency rules. This packing operation relies on a Python script to manage complex spatial computations and ensure that no two pieces of equipment collide with each other. Once all buildings have been populated with equipment, Subroutine_B computes the overbridge connections between the structures. By evaluating cleanroom adjacency constraints and calculating the shortest-path routing, it generates a bridge geometry that efficiently links buildings. Each completed design alternative, comprising zoned interiors and an overbridge geometry, is then returned to the main workflow for evaluation.
After Subroutine_B produces a comprehensive design for every initial layout, the main workflow aggregates all alternatives and calls Subroutine_C, as shown in
Figure 6. In this subroutine, the algorithm iterates over each combined layout, calculating key performance indicators (KPIs) such as total utility line length, estimated cost, equipment adjacency score, and cleanroom compliance. Each KPI is computed using a Python routine that processes the geometry and metadata of the alternatives. Once all the KPIs are measured, Subroutine_C applies user-defined weightings, reflecting priorities such as cost minimization, circulation efficiency, and energy performance, to compute a total score for each alternative. The alternatives are subsequently sorted in descending order of the total score, and the top N candidates are returned to the main workflow.
Finally, when the top N alternatives arrive in the main workflow, the user reviews the visual summaries and KPI data to select a single optimal design. Then, Dynamo automatically generates the corresponding Revit BIM model, and each parametric family is instantiated at its computed coordinates and completed with all associated metadata. At this point, the GD process is complete, yielding a fully detailed BIM that satisfies the original design objectives and constraints.
4. Results
In this chapter, the core functions and automated processes of the proposed GD algorithm are demonstrated. Because of the high security and copyright constraints inherent in semiconductor fab design, the demonstration utilizes a simplified conceptual model rather than sensitive real-world project data. This approach showcases how the framework addresses the Design Bottleneck by proving its operational capabilities without depending on proprietary information, thereby highlighting its key contribution as a data-agnostic optimization process. The use of a conceptual model allows this study to focus on validating the logic and automation of the generative process, rather than the specifics of a single design outcome. This aligns with the paper’s aim to present a methodological framework, verifying the core competencies of automation, rule-based generation, and BIM integration in a controlled, replicable manner. Therefore, the “results” presented herein do not represent a final, optimized fab design. Instead, they signify a successful demonstration of the framework’s primary stages, from initial data input and linkage through algorithmic design generation to the final conversion of a selected alternative into a BIM model. The following sections detail these key stages sequentially, presenting the automated processes and their outputs using visual aids.
4.1. Conceptual Model Setup and Data Linkage Demonstration
4.1.1. Model Configuration and Data Linkage
The initial step in design automation involves gathering and linking user requirements and design variables into a format that the system can understand. This section defines the key assumptions and components of the conceptual model used for the demonstration and illustrates the process of linking and processing external data (from Excel) within the dynamic environment. The purpose is to clarify how the proposed framework accommodates and processes the initial information in a real-world design project.
A conceptual model was constructed using the minimal elements necessary to demonstrate the core functions and interactions between the buildings in a semiconductor fab. The basic assumption involves arranging four key building types—fab (manufacturing), complex (support facilities), green (environmental/safety facilities), and ultrapure water plants within a virtual site boundary. These building types were selected as representative examples of actual semiconductor facilities, each with distinct functional requirements and interdependencies, to simulate various design constraints and interactions. As shown in
Figure 7, a key feature of this parametric model is its ability to configure the shape and arrangement of these building types in numerous ways. Components such as the “Complex,” “SUB” area, and “MAIN” Fab can be dynamically rearranged and resized. This inherent flexibility is crucial for the generative process because it empowers the algorithm to explore a wide spectrum of massing strategies in its search for an optimal configuration.
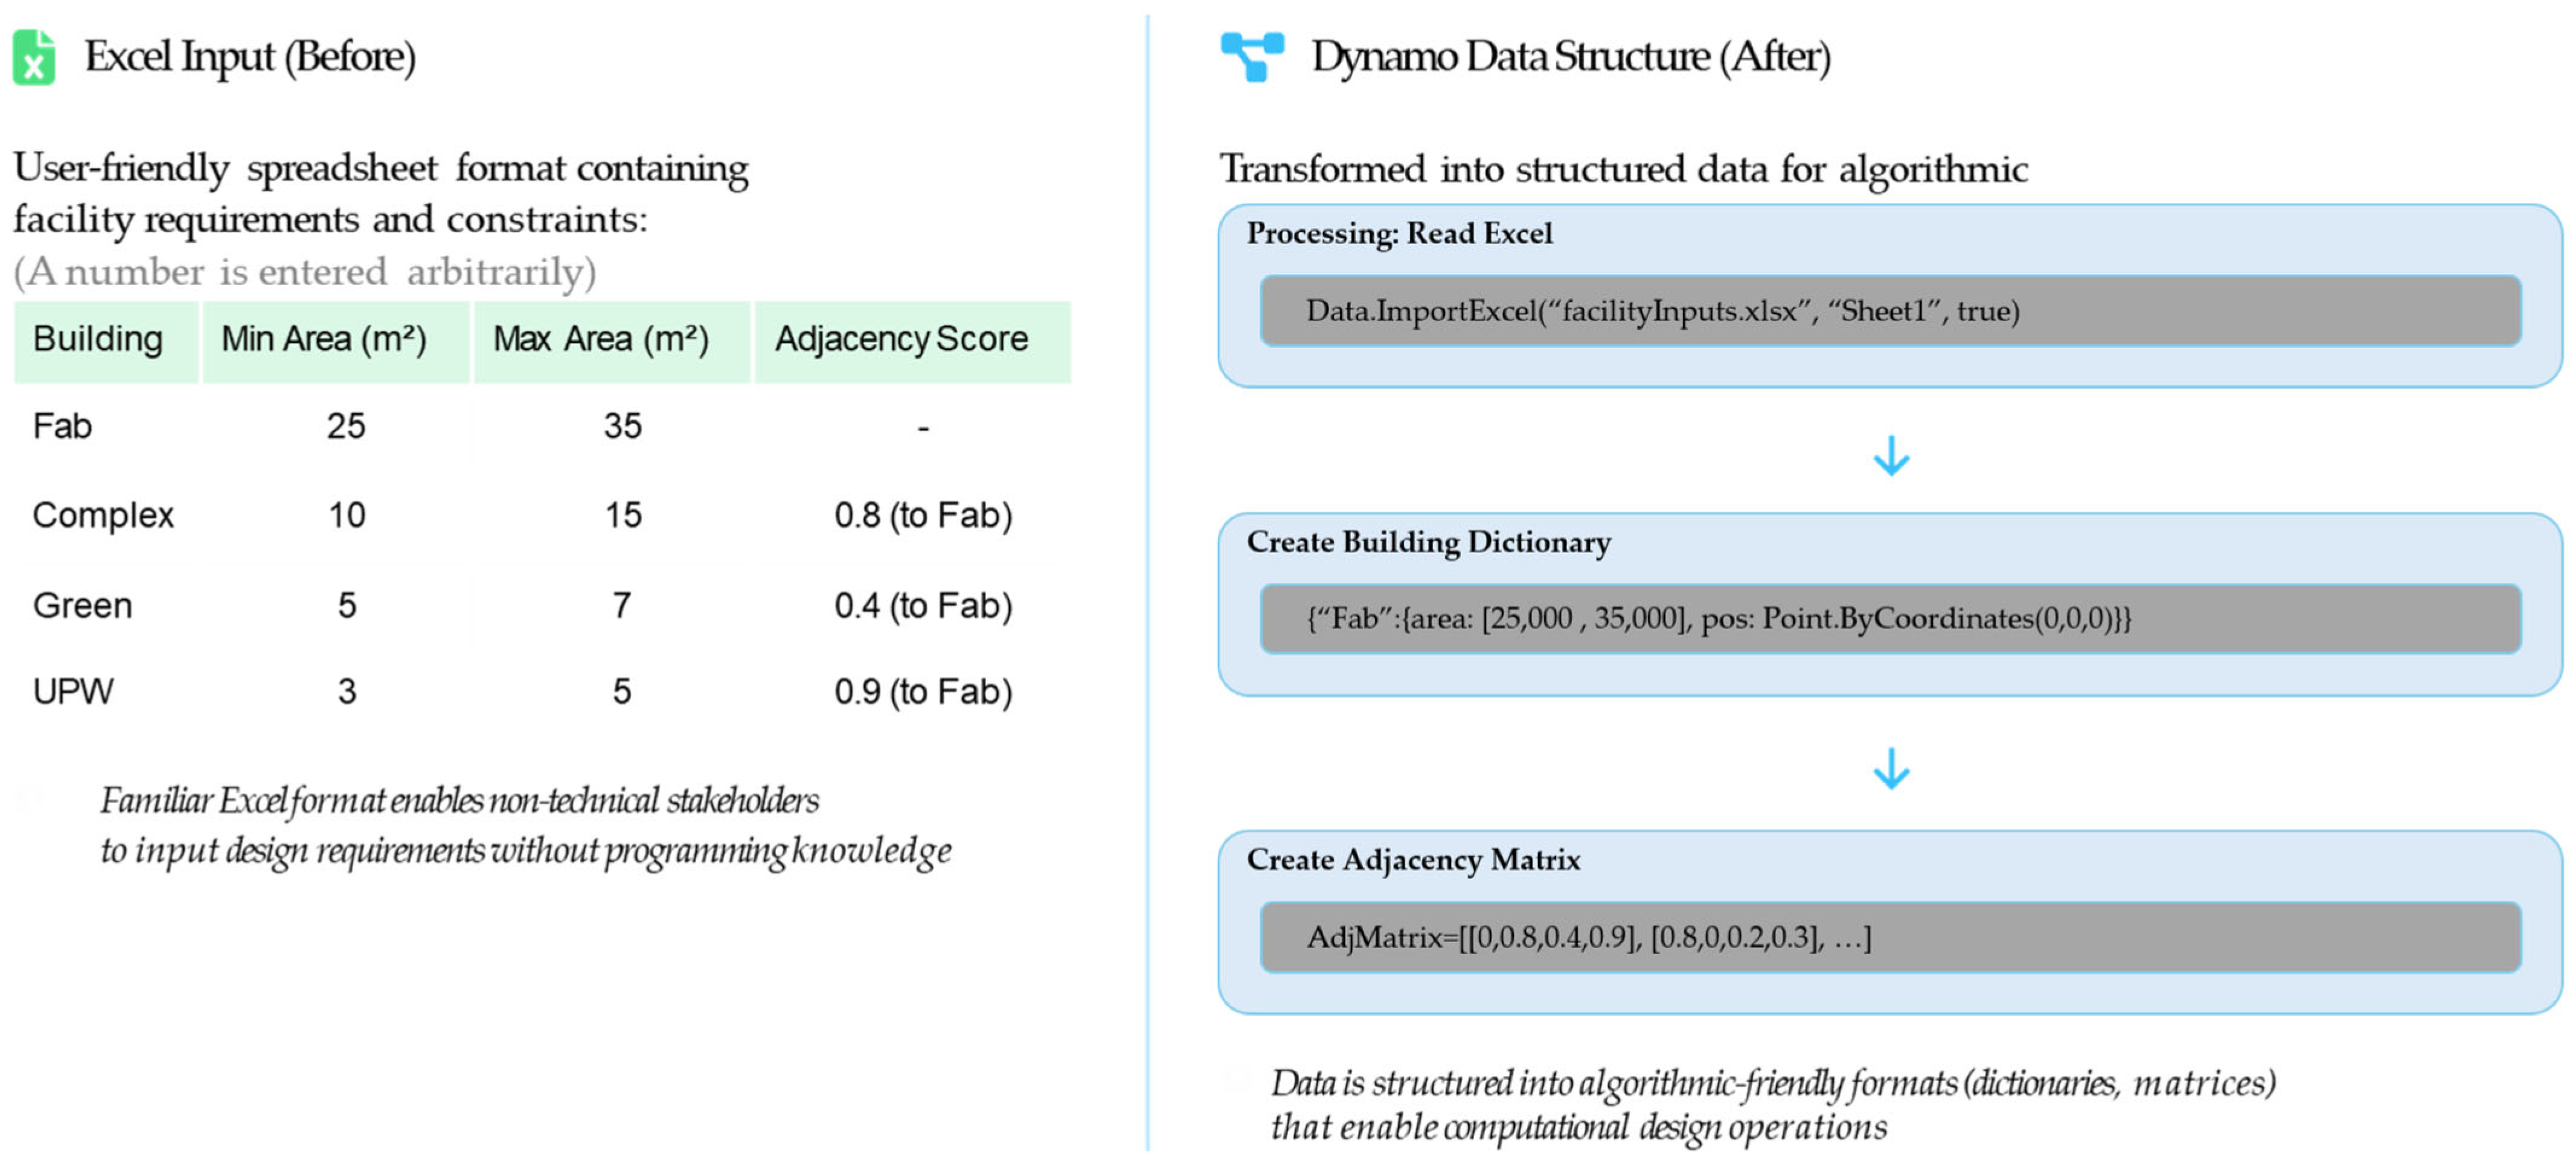
The data-linkage process is shown in
Figure 8. The core strength of this workflow is its accessibility: familiar tools such as Microsoft Excel are used as the primary interface for data input, which makes it usable for non-technical stakeholders. The figure shows a sample Excel input file (“Before”), where project stakeholders can easily define facility requirements, such as the minimum and maximum areas for each building, along with desired adjacency scores. This serves as a concrete example of the “user input data file” described in
Section 3.2. On the right (“After”), the figure shows how Dynamo ingests and processes these data. A node reads the Excel file directly, and the information is transformed into algorithm-friendly data structures, such as dictionaries and matrices. This seamless data linkage powers the subsequent computational design operations. This visualization directly demonstrates the data transfer between Excel and Dynamo, proving that the design variables can be effectively input into the system through a familiar tool without extensive programming knowledge. This enhances the user accessibility of the proposed framework, aligning with the research objective stated in
Section 2.3: to “propose a user-friendly BIM-based framework accessible to designers without extensive programming expertise”.
This demonstration of the data input and linkage process underscores the importance of structured data as the foundation of the computational design process. Because the algorithm requires precise and structured inputs, the initial data aggregation and conversion phase, which clearly communicates the user intent and requirements, is a critical prerequisite that governs the reliability and efficiency of the entire automation workflow. The Excel-based input method provides user convenience, whereas data structuring via Dynamo establishes a robust data foundation for the subsequent generation and evaluation algorithms (Subroutines A, B, and C from
Section 3.3) to operate consistently and reliably.
4.1.2. Justification of Conceptual Model Parameters
To ensure the validity and representativeness of the conceptual model despite the absence of proprietary data, its parameters were rigorously designed to align with established industry standards and general practices in semiconductor fab design. This alignment enhances the credibility of the simulation and ensures that the optimization logic addresses realistic constraints.
The zoning and adjacency rules encoded in the model (represented by the Adjacency Matrix in
Figure 8) are not arbitrary but are grounded in the principles of the ISO 14644-1 cleanroom standards [
26]. For instance, the conceptualization distinguishes between areas requiring high cleanliness levels for core processes (e.g., Fab Main, typically ISO Class 3–5 [
26]) and support areas with lower requirements (e.g., ISO Class 6–8 [
26]). The algorithm utilizes these classifications by assigning penalties in the adjacency score calculation to minimize potential cross-contamination between zones of differing classifications, thereby reflecting a critical aspect of real-world fab layout and contamination control. Furthermore, the parametric equipment library (Revit Families) used in the simulation represents generalized characteristics of typical semiconductor process equipment (e.g., lithography, etching). While not modeling specific vendor equipment, the parameters define representative physical dimensions, weights, and, crucially, the required service clearances for maintenance access. This ensures that the packing algorithms (Subroutine B) solve spatial allocation problems that accurately reflect the density and accessibility challenges found in actual facilities.
Similarly, the optimization goals for utility routing (demonstrated in
Section 4.2.3) reflect realistic engineering trade-offs. The criteria used in the optimization (e.g., shortest distance vs. minimum bends) simulate the balance between minimizing piping material costs (shortest distance) and maximizing operational efficiency by reducing pressure drop and improving constructability (minimum bends).
Table 1 summarizes the alignment between the key parameters of the conceptual model and the corresponding industry standards or rationale, reinforcing the model’s representativeness for demonstrating the proposed framework.
4.2. GD Algorithm Execution and Alternative Generation
This section visually demonstrates how the GD algorithm described in Chapter 3 generates and explores multiple design alternatives. Building on the conceptual model and the linked input data described in
Section 4.1, this section presents an automated alternative generation process for each stage, from the overall site layout to individual building interiors, interbuilding connections, and utility routing, accompanied by specific visual materials.
4.2.1. Automated Site Layout Generation and Alternative Creation
This subsection demonstrates the execution of Subroutine_A, as detailed in
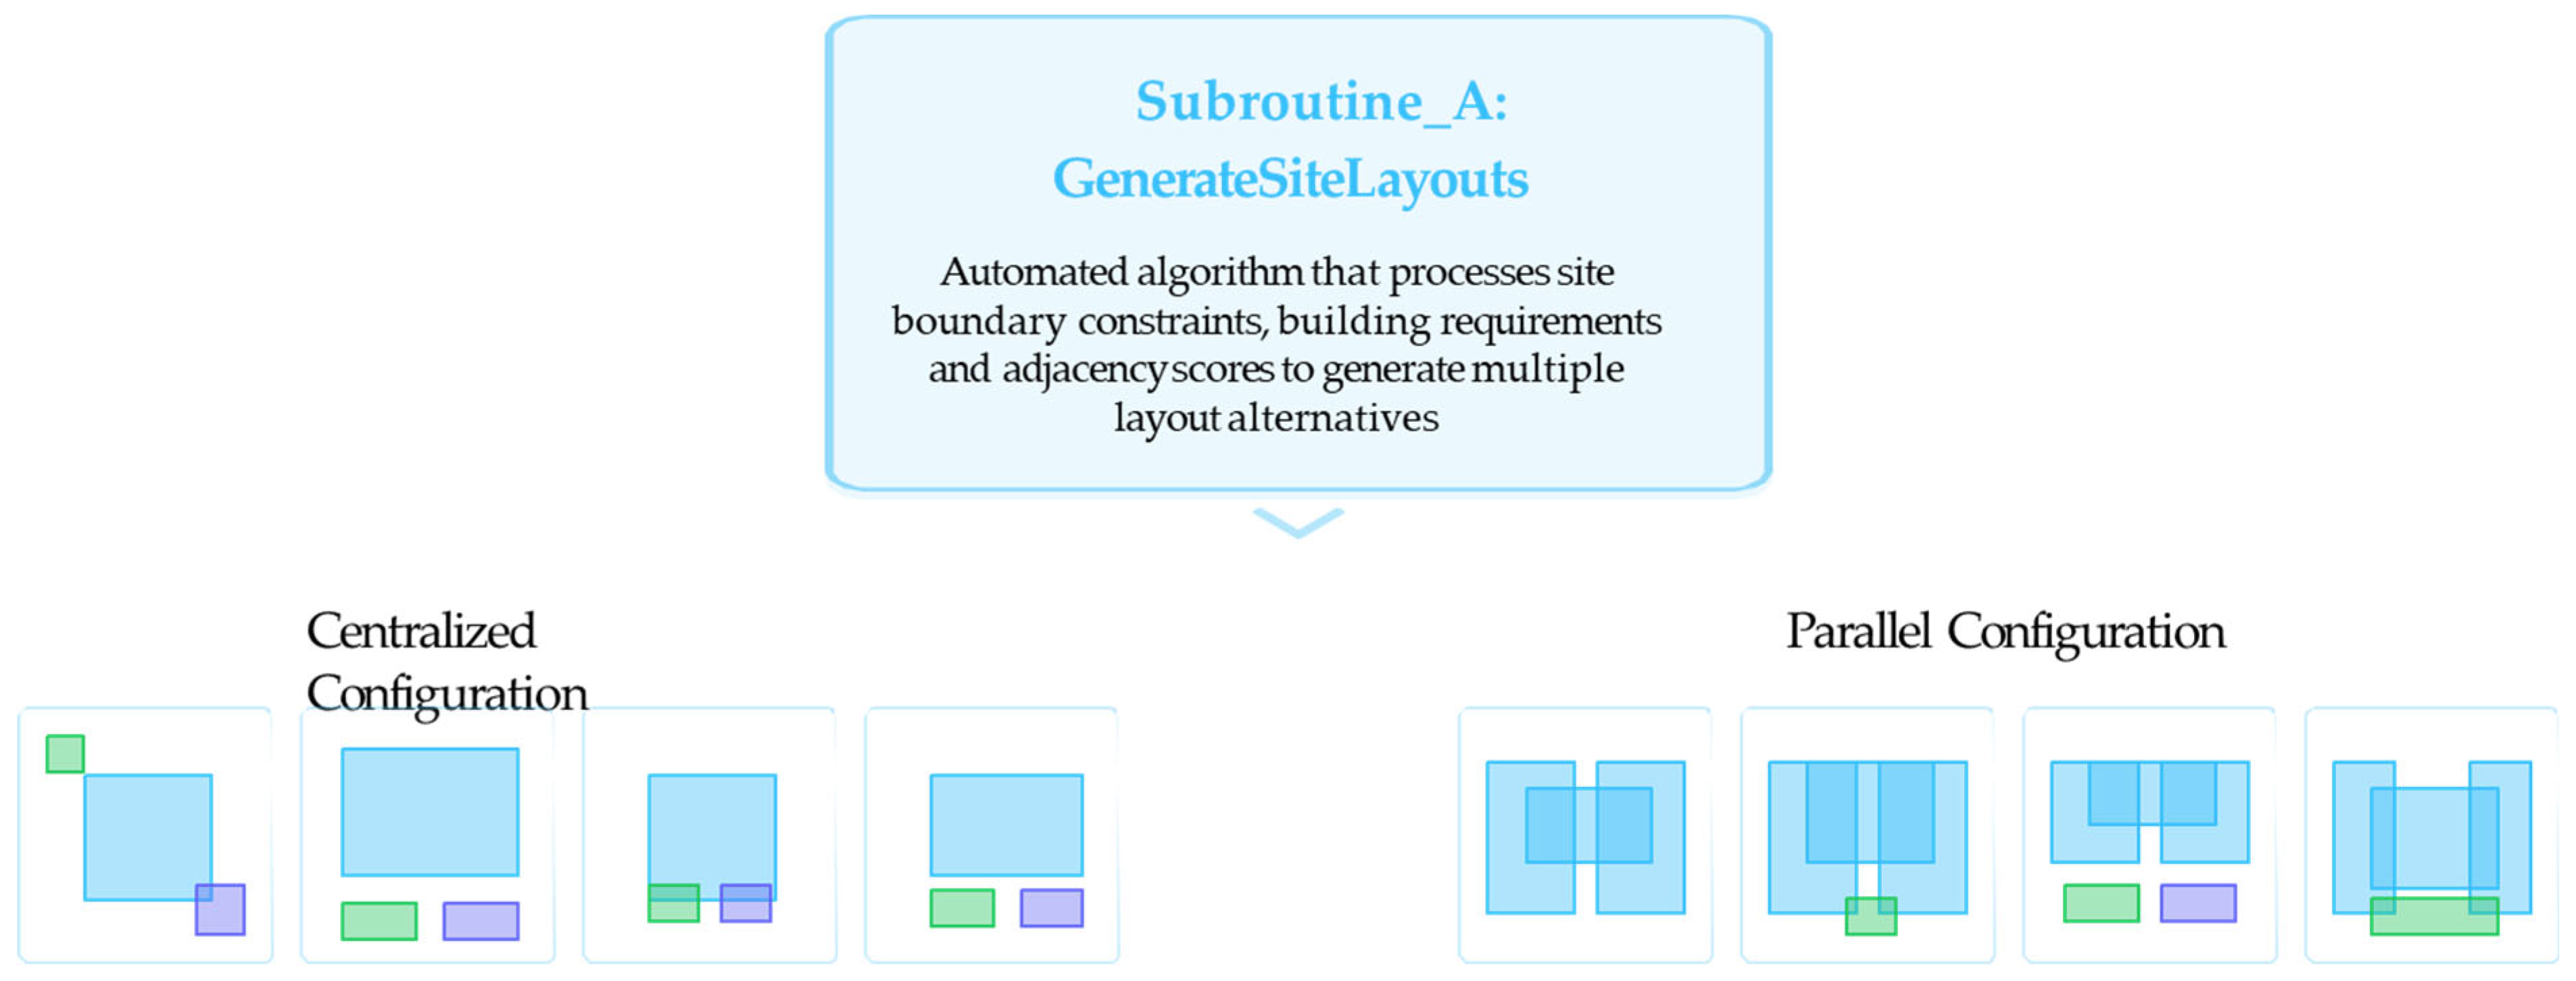
Section 3.3, which is where the generation process begins. The algorithm processes all inputs—site boundaries from the conceptual model, building requirements from Excel, and adjacency scores—to generate multiple valid site layout alternatives automatically.
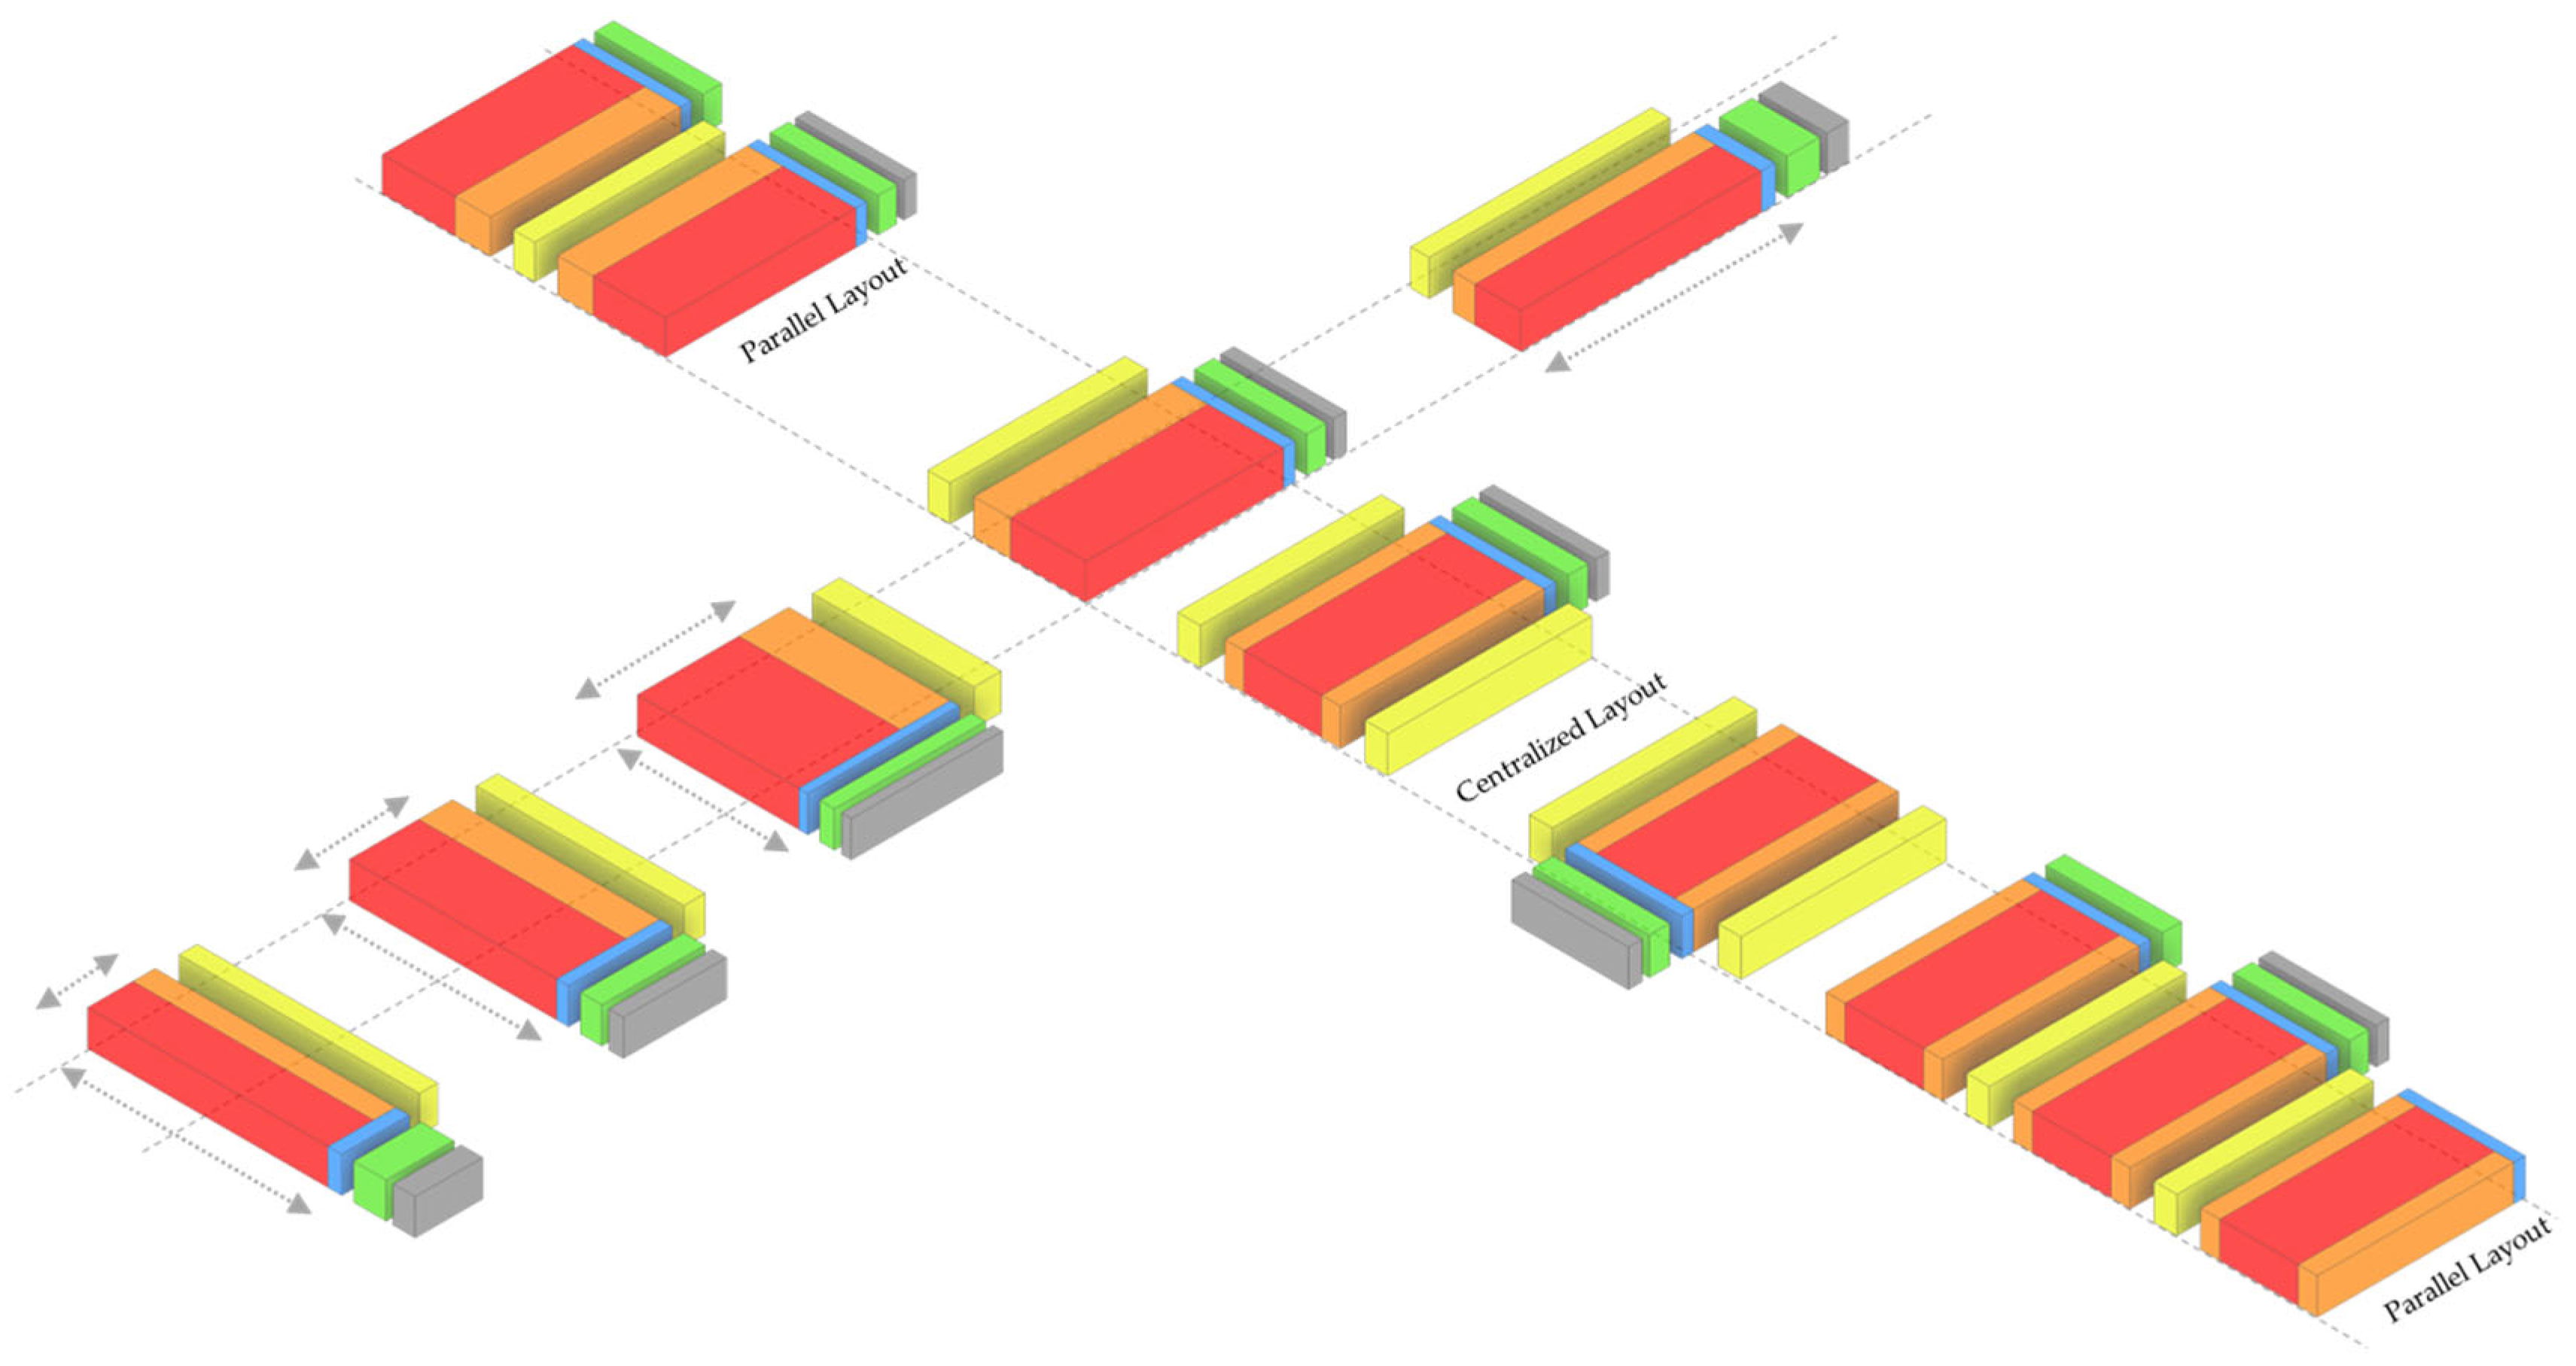
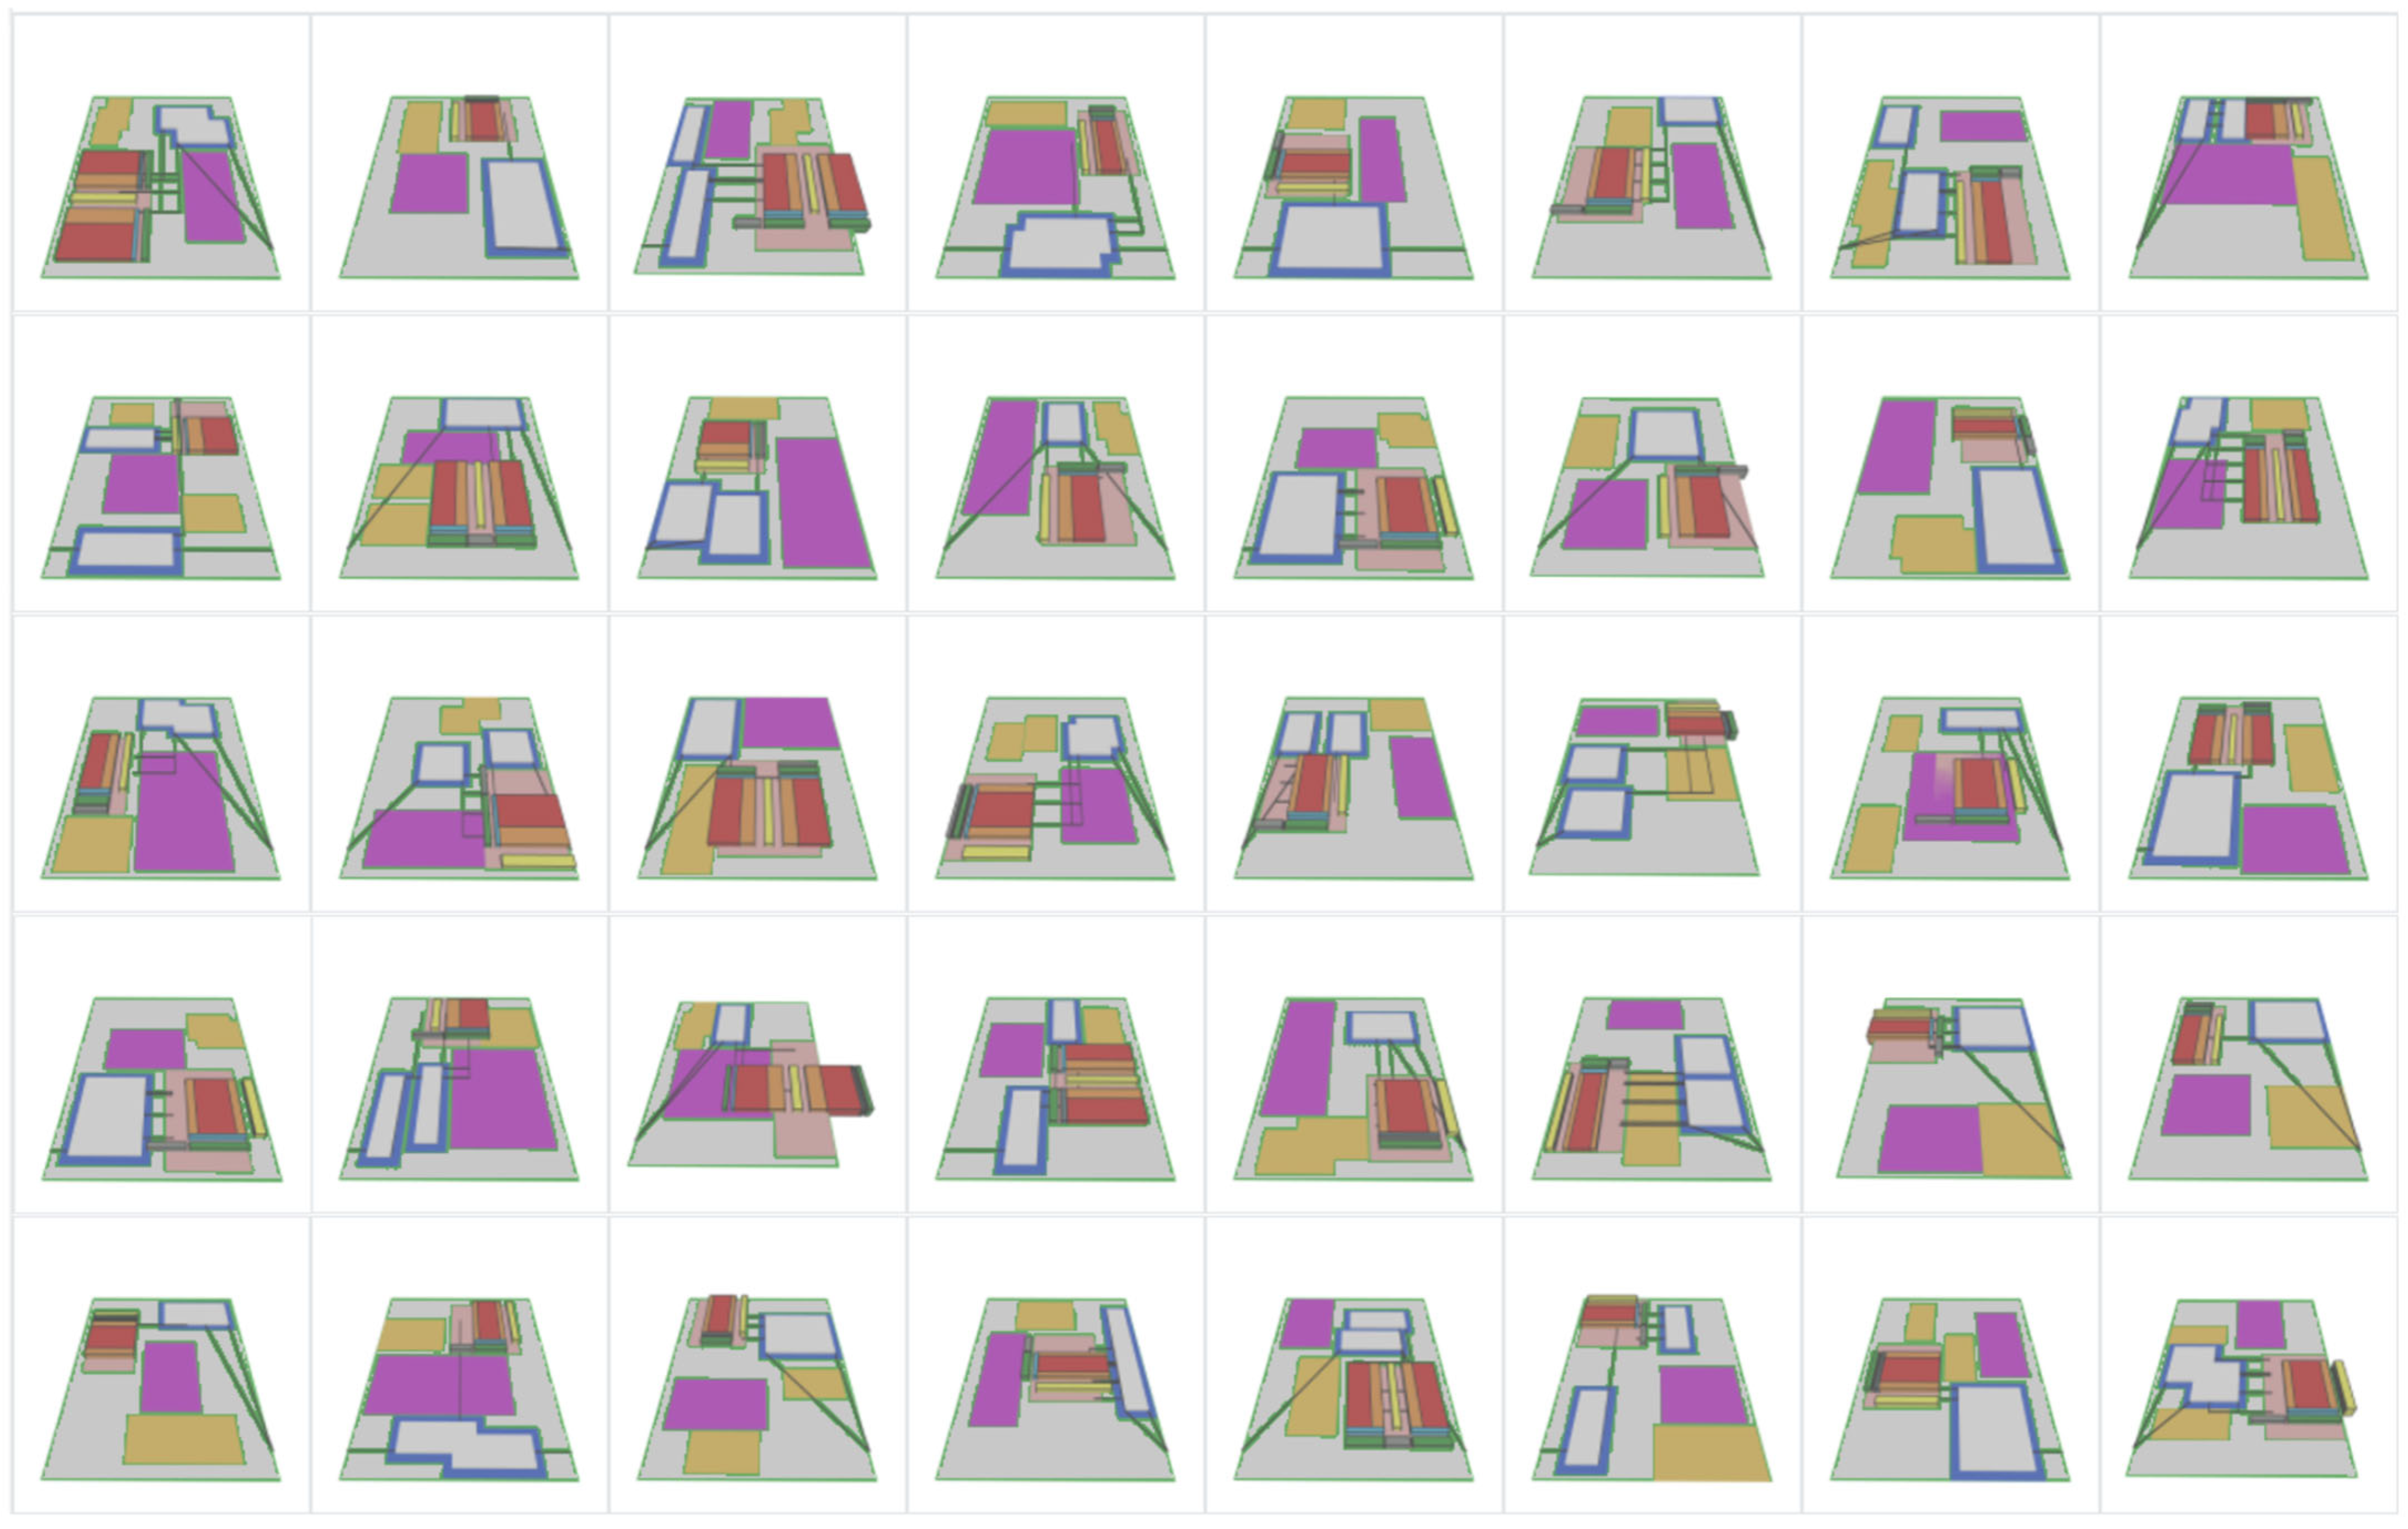
Figure 9 and T illustrate this process. The algorithm explores different strategic configurations, such as the “Centralized” and “Parallel” options shown in
Figure 9. As
Figure 10 visually demonstrates, the subroutine parametrically adjusts the size and position of the key building masses to create a wide variety of layouts while maintaining essential connectivity. This visualization clearly shows how the algorithm efficiently explores a vast design space—a task difficult to achieve manually in a short time—thus realizing the core GD feature of producing numerous alternatives. Each generated layout is algorithmically verified to satisfy basic constraints, such as adhering to site boundaries and maintaining minimum separation distances to prevent collisions.
This automated generation of alternatives during the initial stage allows designers to review a broad range of options during the most impactful decision-making phase. In contrast to traditional manual methods, which are often limited to exploring only a few familiar options, this automated approach systematically explores diverse possibilities. Crucially, it can uncover unfamiliar yet high-performance configurations that may not have been considered otherwise. Furthermore, the use of defined rules such as “Centralized” and “Parallel” configurations indicates that the generation process is not a random, uncontrollable “black box.” By setting such high-level strategic rules, designers can guide the algorithm’s exploration toward intended outcomes. This positions GD not merely as an experimental tool but also as a practical design support system that explores variations within a specific design paradigm reflecting the designer’s strategic intent.
4.2.2. Automation of Fab and Complex Building Layouts
Once the overall site plan is determined, the next step is to partition the internal spaces of individual buildings and arrange the key equipment and functional areas. This subsection demonstrates how the interior layout generation function of Subroutine_B (
Section 3.3) operates, based on one of the site layout alternatives generated in
Section 4.2.1. The focus is buildings with high internal complexity, such as a fab.
Figure 11 provides a conceptual visualization of the interior layout automation strategies employed by Subroutine_B. It showcases different spatial division algorithms, such as a grid-based layout with uniform modular spaces, functional clustering where related functions are grouped, and a rectangular packing algorithm that efficiently fits various spaces together. These examples illustrate how the subroutine’s packing algorithm and zonal logic can arrange internal elements, considering simplified requirements in the conceptual model that represent real-world constraints such as equipment size, cleanroom classifications, circulation paths, and maintenance access. This process signifies the deepening of design automation from the macro-scale (site) to the meso-scale (building interior), demonstrating the framework’s capability to handle detailed design problems.
Although generating thousands of options is a key advantage, the next crucial step is to filter and select the best alternatives.
Figure 12 illustrates the variety of interior layout alternatives for a fab building generated using Subroutine_B. While the figure shows the generated output, featuring thumbnail views and a parallel coordinate plot, alludes to the subsequent evaluation stage where these numerous options are mapped against key performance metrics. This allows designers to filter the results and isolate the highest-performing options, demonstrating that the goal is not just generation but also informed selection.
This hierarchical approach—site layout followed by building interior layout—is an effective strategy for decomposing a complex design problem into manageable sub-problems. Such staged generation, in which the site plan sets the context for the interior layout, allows focused problem solving and iterative refinement at each scale.
4.2.3. Optimization of Overbridge and Utility Routing
In addition to interior layouts, efficient connections between buildings and optimization of major utility routes are critical elements in semiconductor fab design. This subsection demonstrates the process of generating and optimizing overbridges that connect buildings as well as the paths for utility piping and wiring, showcasing the relevant functions of Subroutine_B (overbridge geometry generation) and Subroutine_C (path optimization logic and evaluation) described in
Section 3.3.
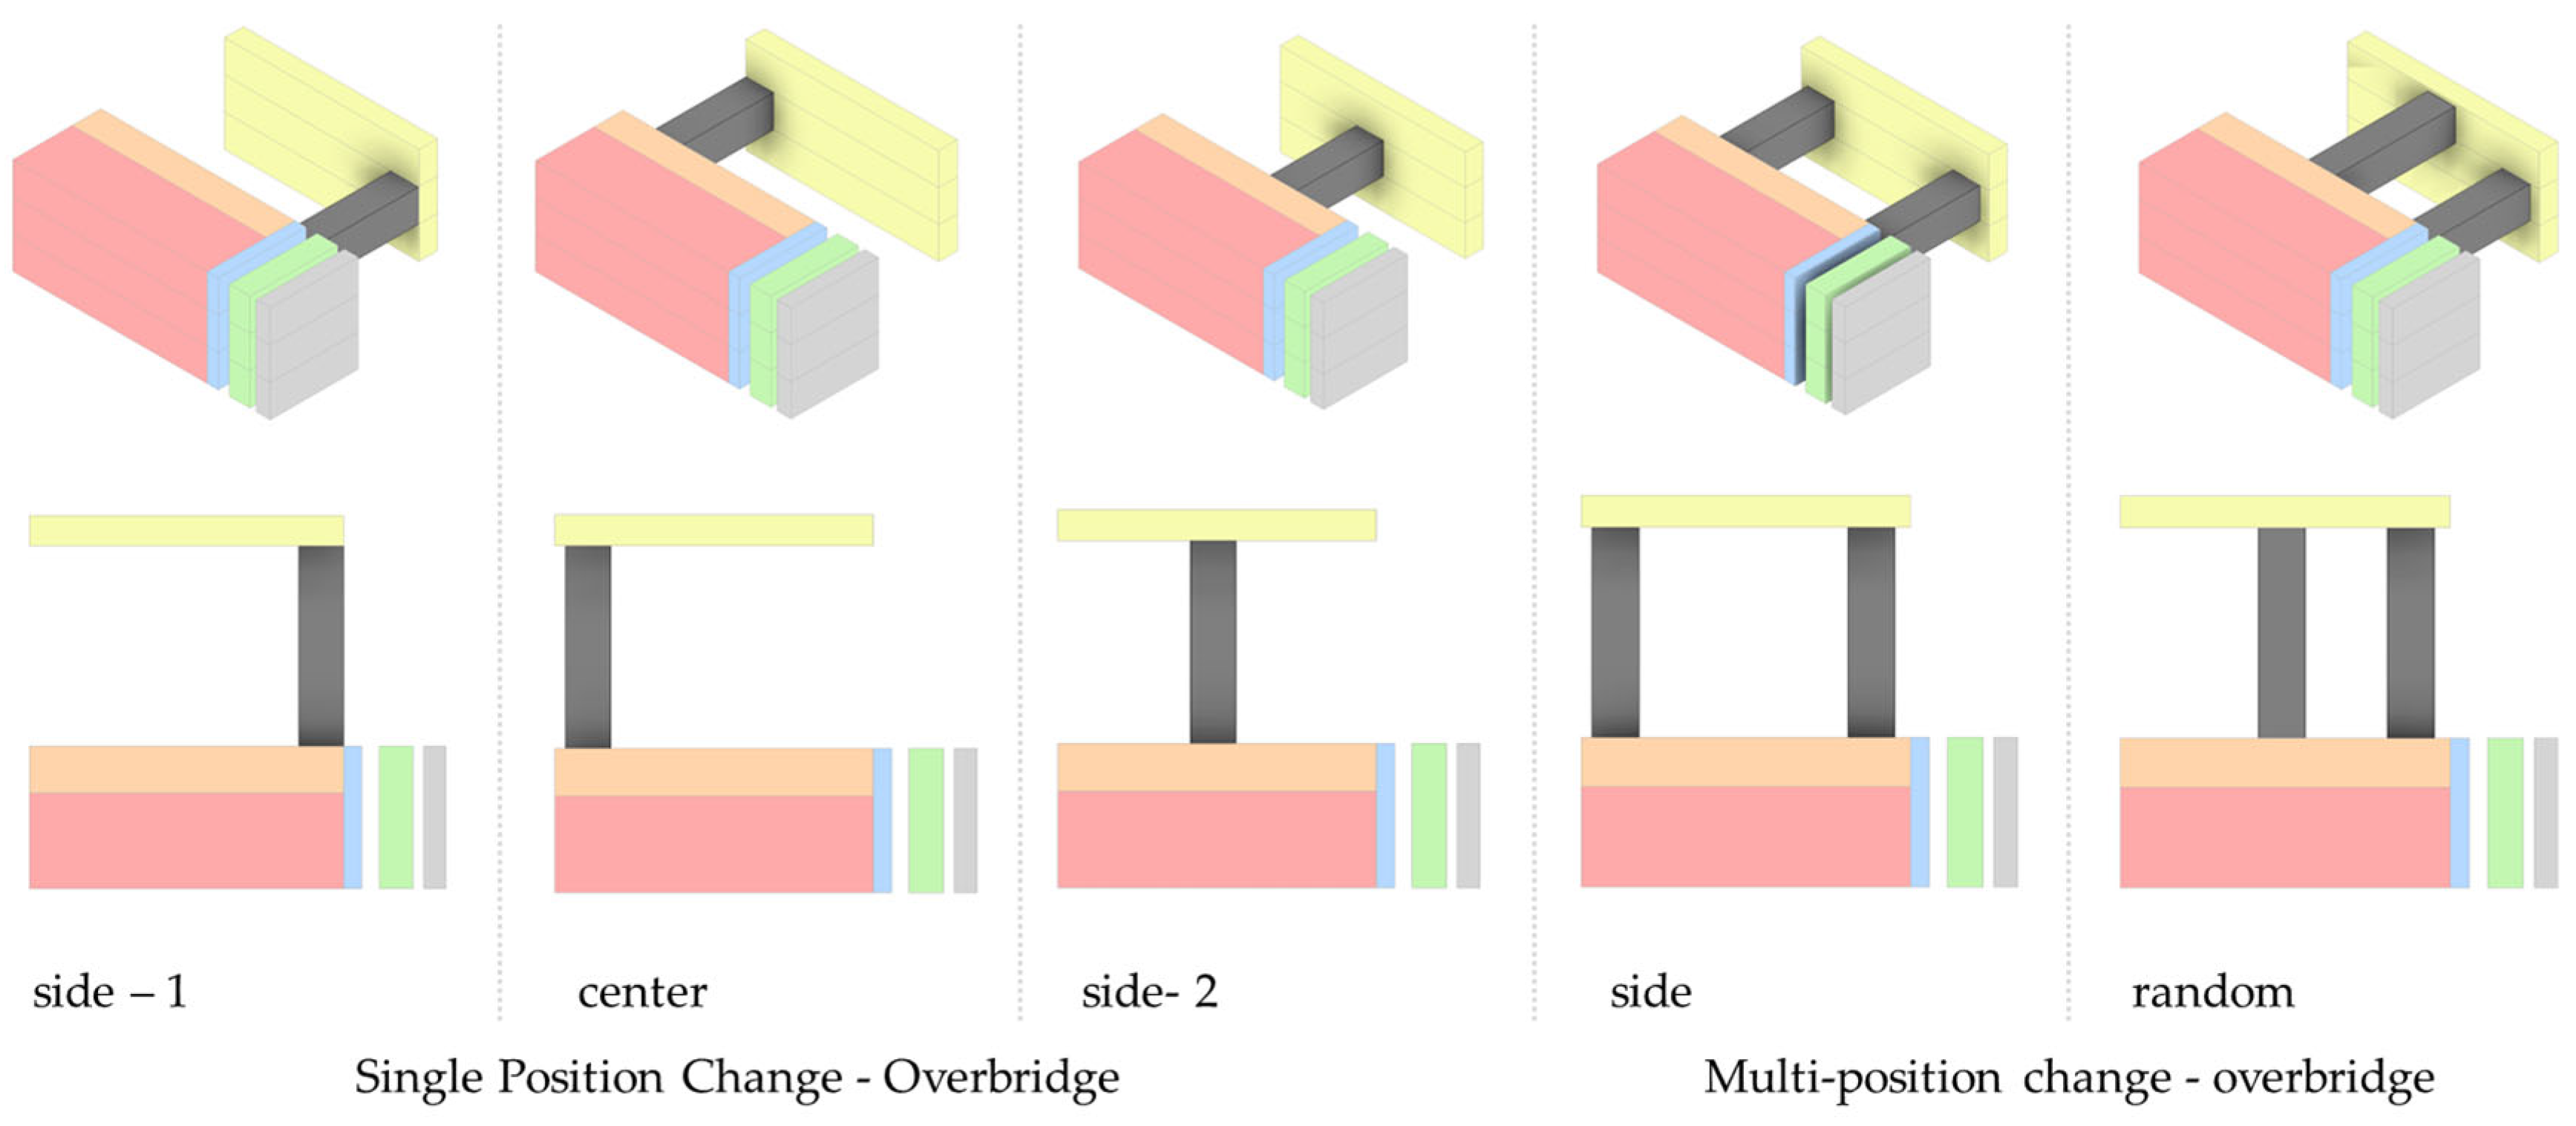
To facilitate this process, the framework first automates the placement of overbridges. As shown in
Figure 13, the system can test different connection-point locations and explore single-position changes, or even multi-position changes, where the algorithm tests random placements or adds multiple overbridges. By automating the counting and repositioning of these overbridges, the system can systematically examine the best path alternatives for all required process connections between buildings.
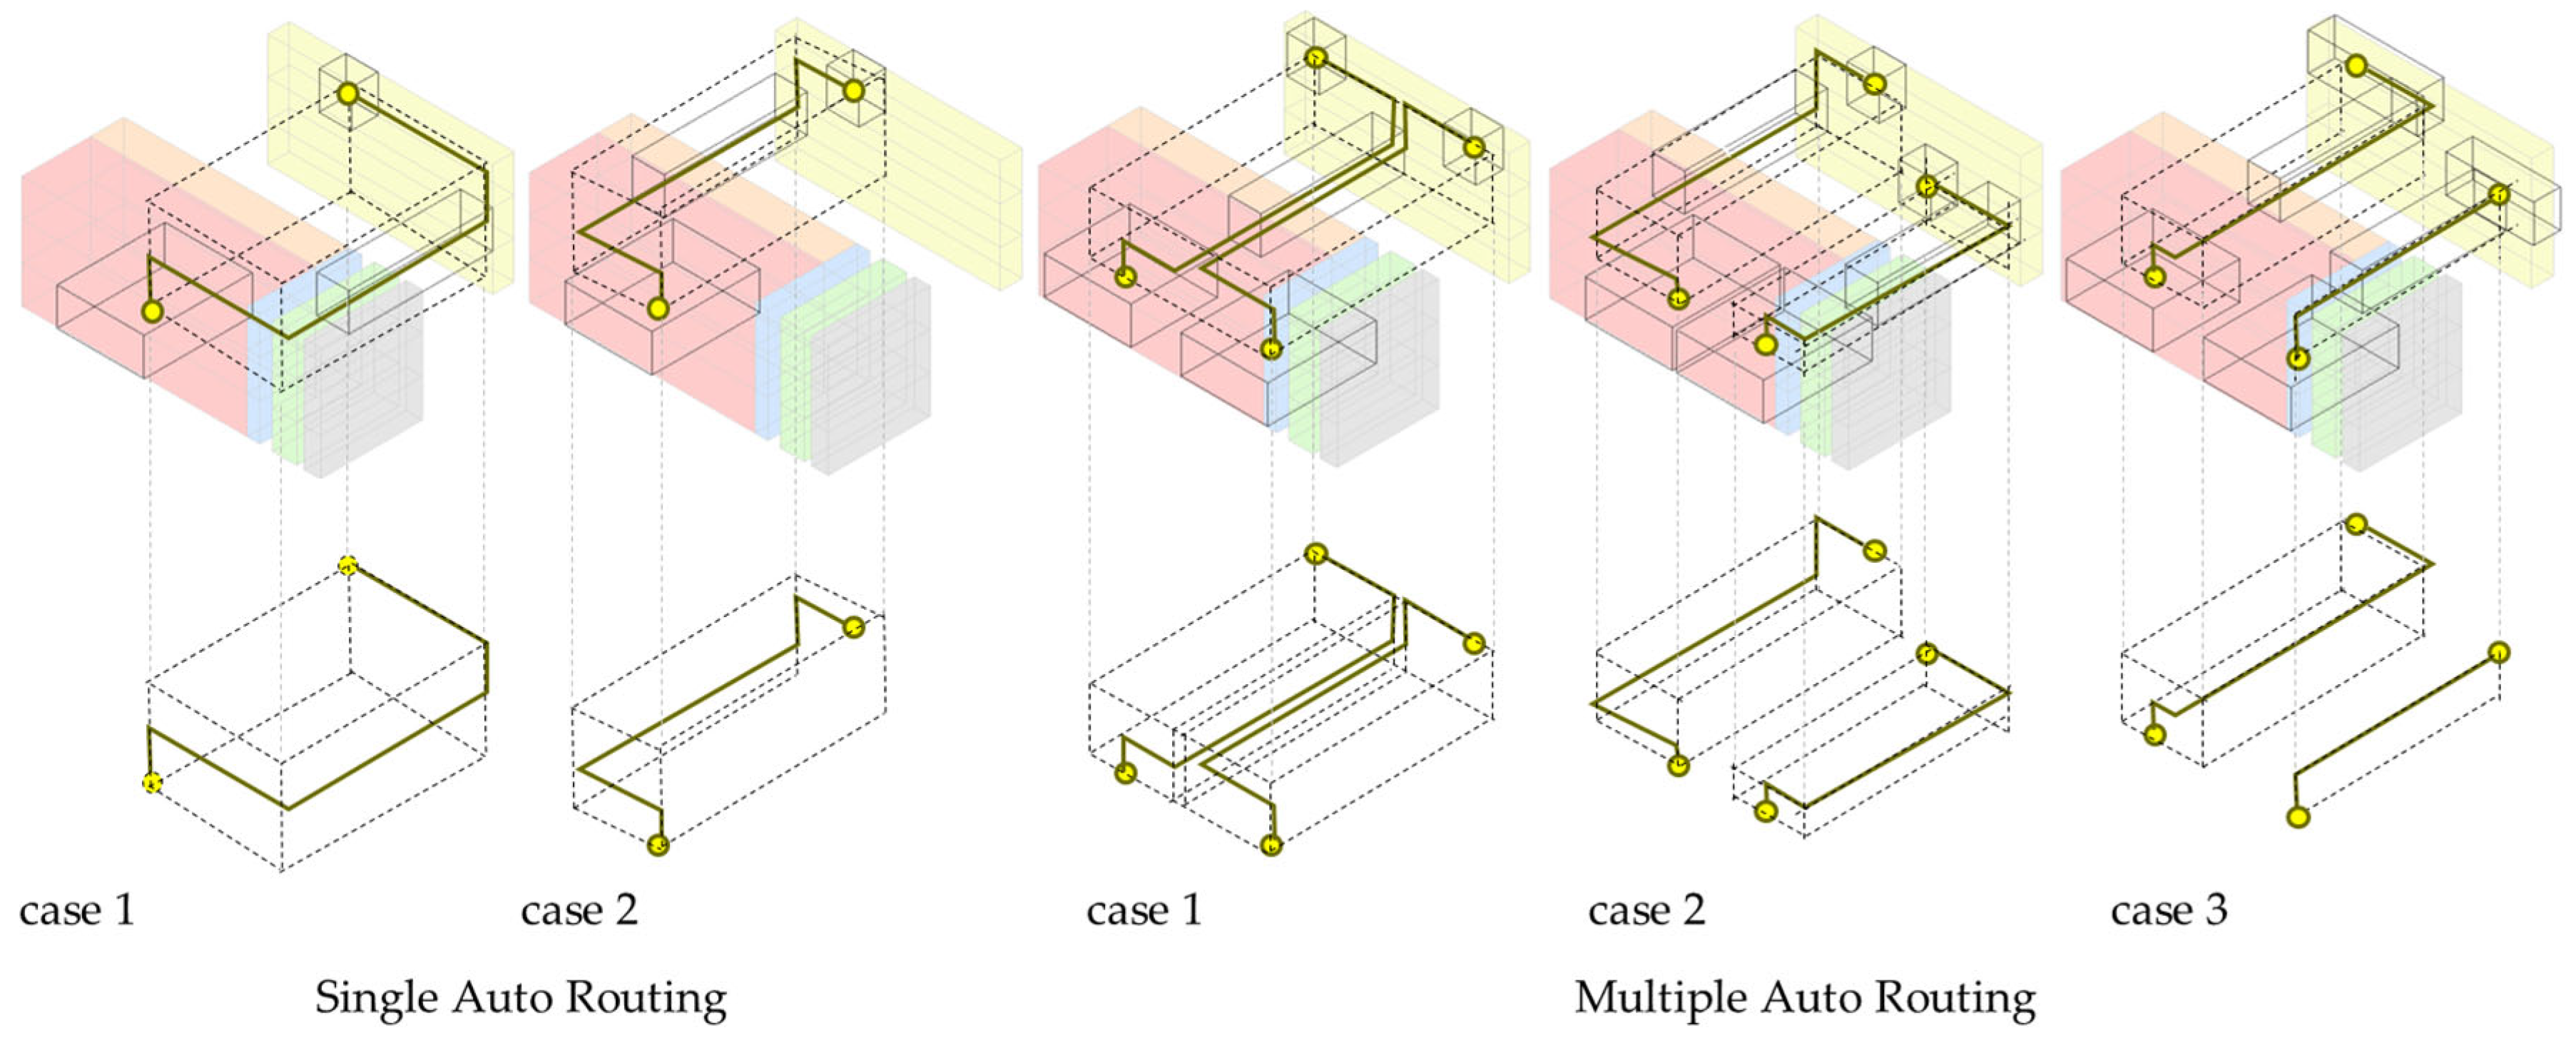
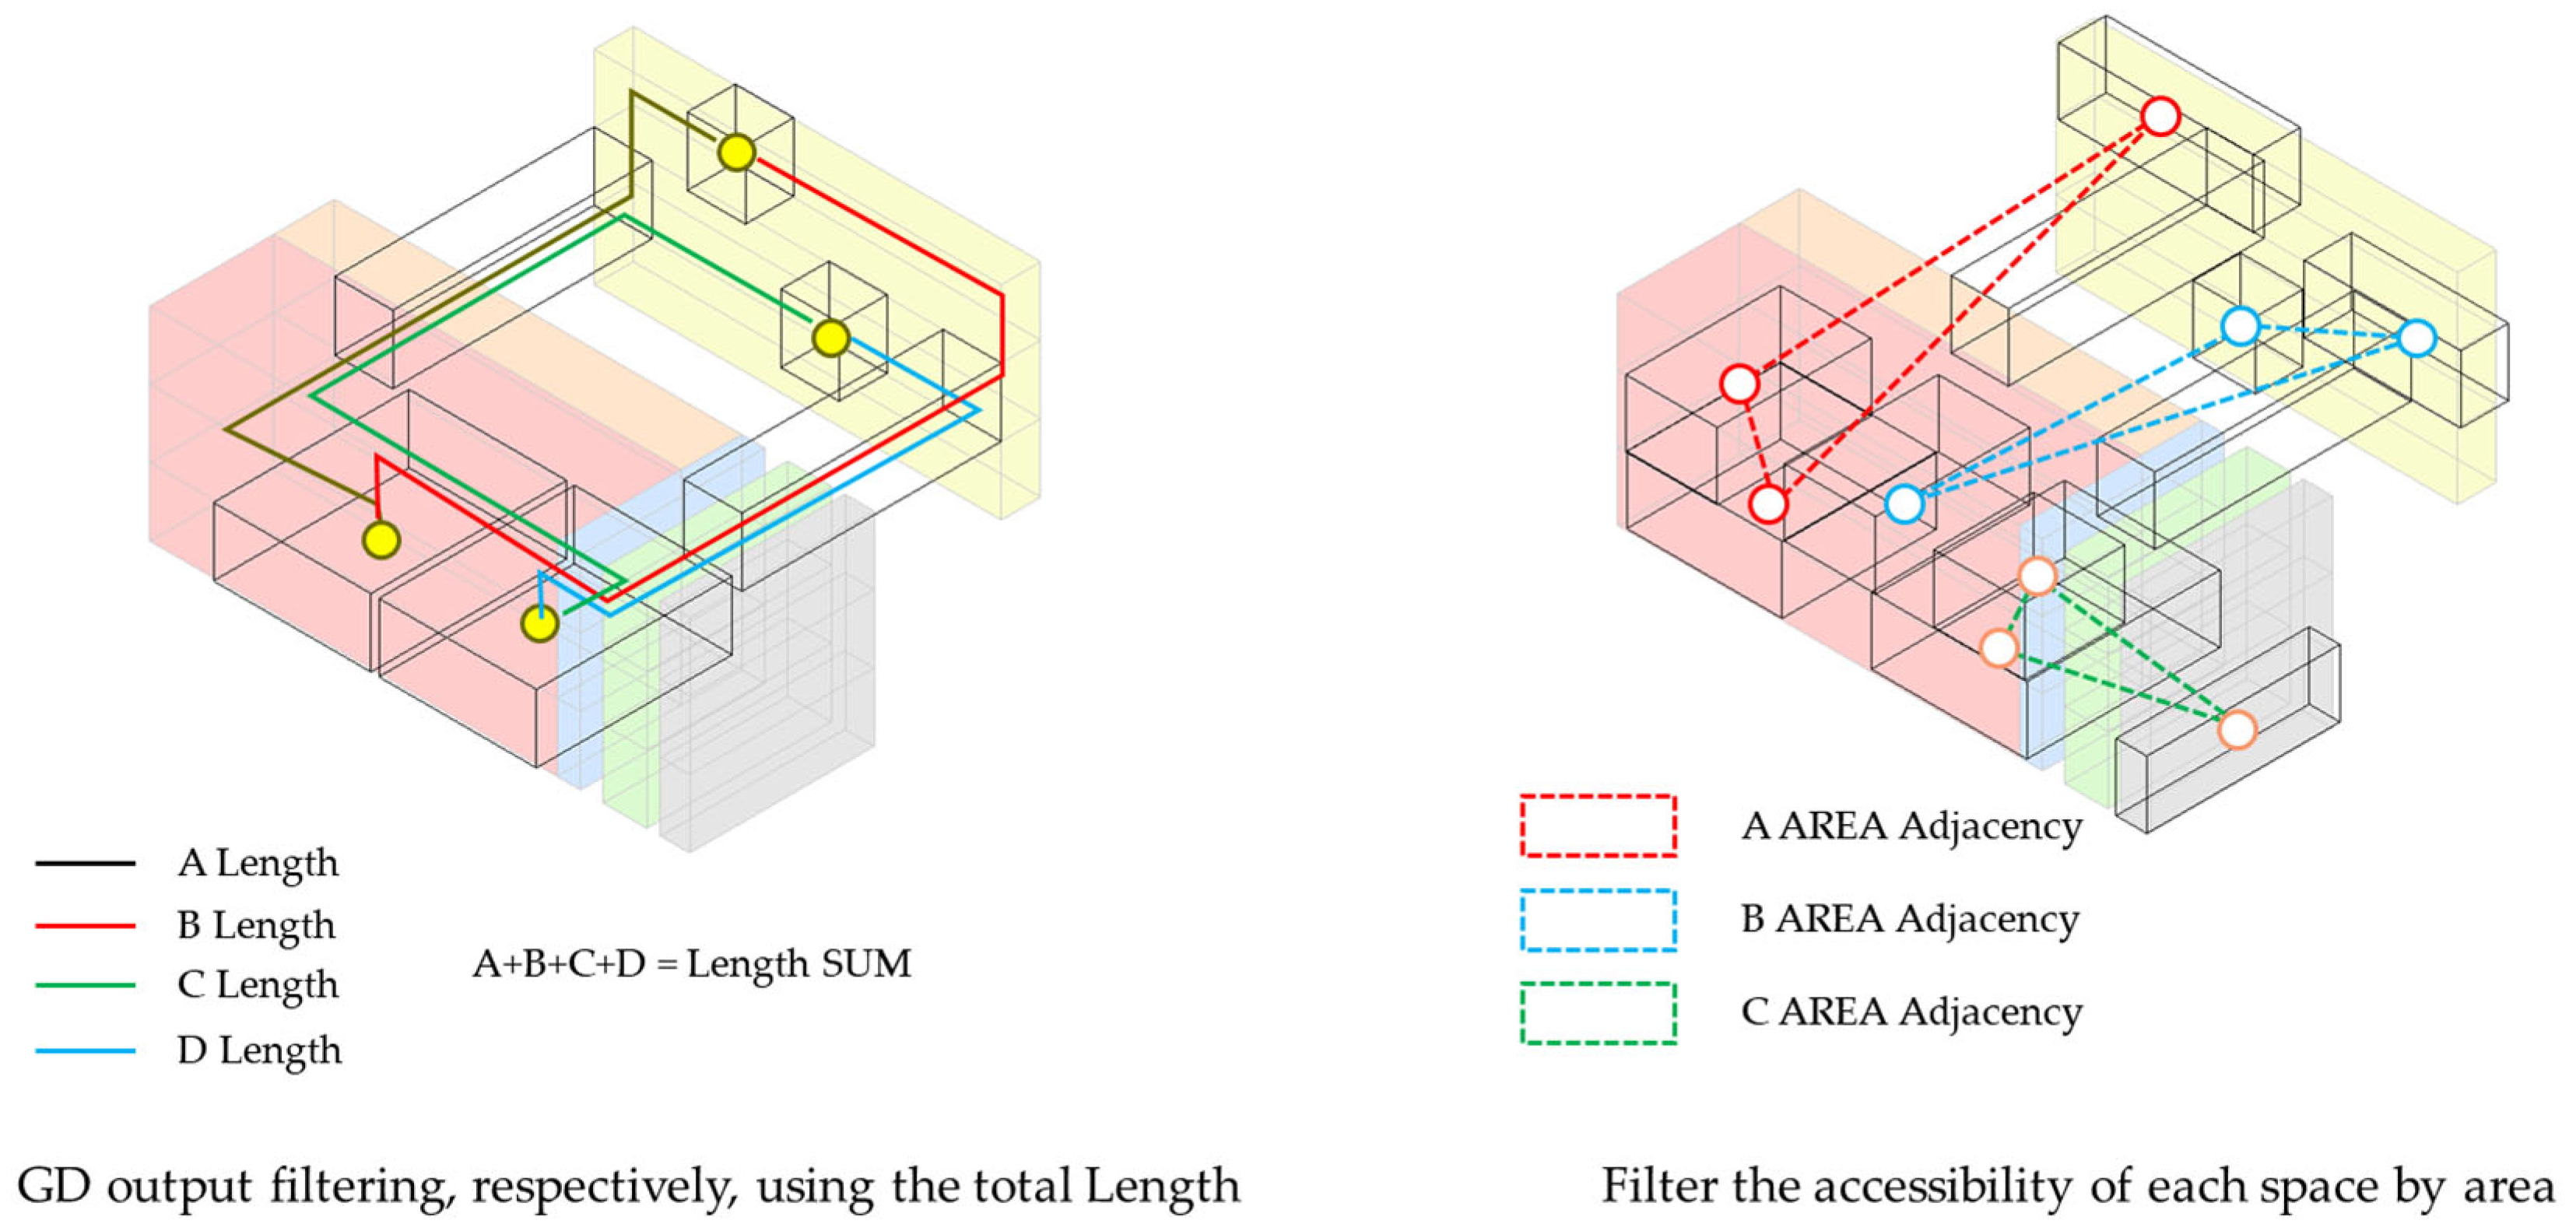
Once the connection points are established, the framework visualizes several optimized alternatives for a route, e.g., between a fab and a complex building. In
Figure 14, different colored lines represent the path options generated according to the different optimization criteria. For example, one colored line may represent a path optimized for the “shortest distance,” while another could represent a path optimized for “minimum bends”.
Figure 14 provides a clear visualization of the “minimum bends” strategy, where the algorithm calculates the optimal path that minimizes the number of turns, resulting in simple, straight sections that simplify fabrication. This clearly demonstrates that the framework can “optimize” connection paths based on user-selected criteria, beyond simple point-to-point connection.
Showcasing paths optimized according to different criteria (e.g., shortest distance vs. minimum bends) is a concrete demonstration. As shown in
Figure 15, the framework is capable of true optimization, balancing competing goals to find a holistic solution. In practice, design often involves finding tradeoffs between conflicting objectives rather than a single “best” solution. For instance, the shortest utility pipe path may minimize material costs but may involve many bends, increasing installation difficulty or pressure loss. Conversely, a path with fewer bends may be longer but superior in terms of operational efficiency. By generating and visualizing alternatives based on different optimization goals, as shown in
Figure 15, the framework helps designers understand these tradeoffs, explicitly compare outcomes according to priorities, and make informed decisions. This proactive, “correct-by-construction” approach significantly reduces the likelihood of clashes and the need for extensive rework, improving design efficiency and helping to resolve the core Design Bottleneck.
4.3. Final BIM Conversion and Data Scalability
The value of the GD process is fully realized when the selected abstract alternative is translated into a concrete data-rich building information model. This final step demonstrates the ability of the framework to convert an optimized design into actionable building information and extract quantitative data for further analysis, such as preliminary cost estimation.
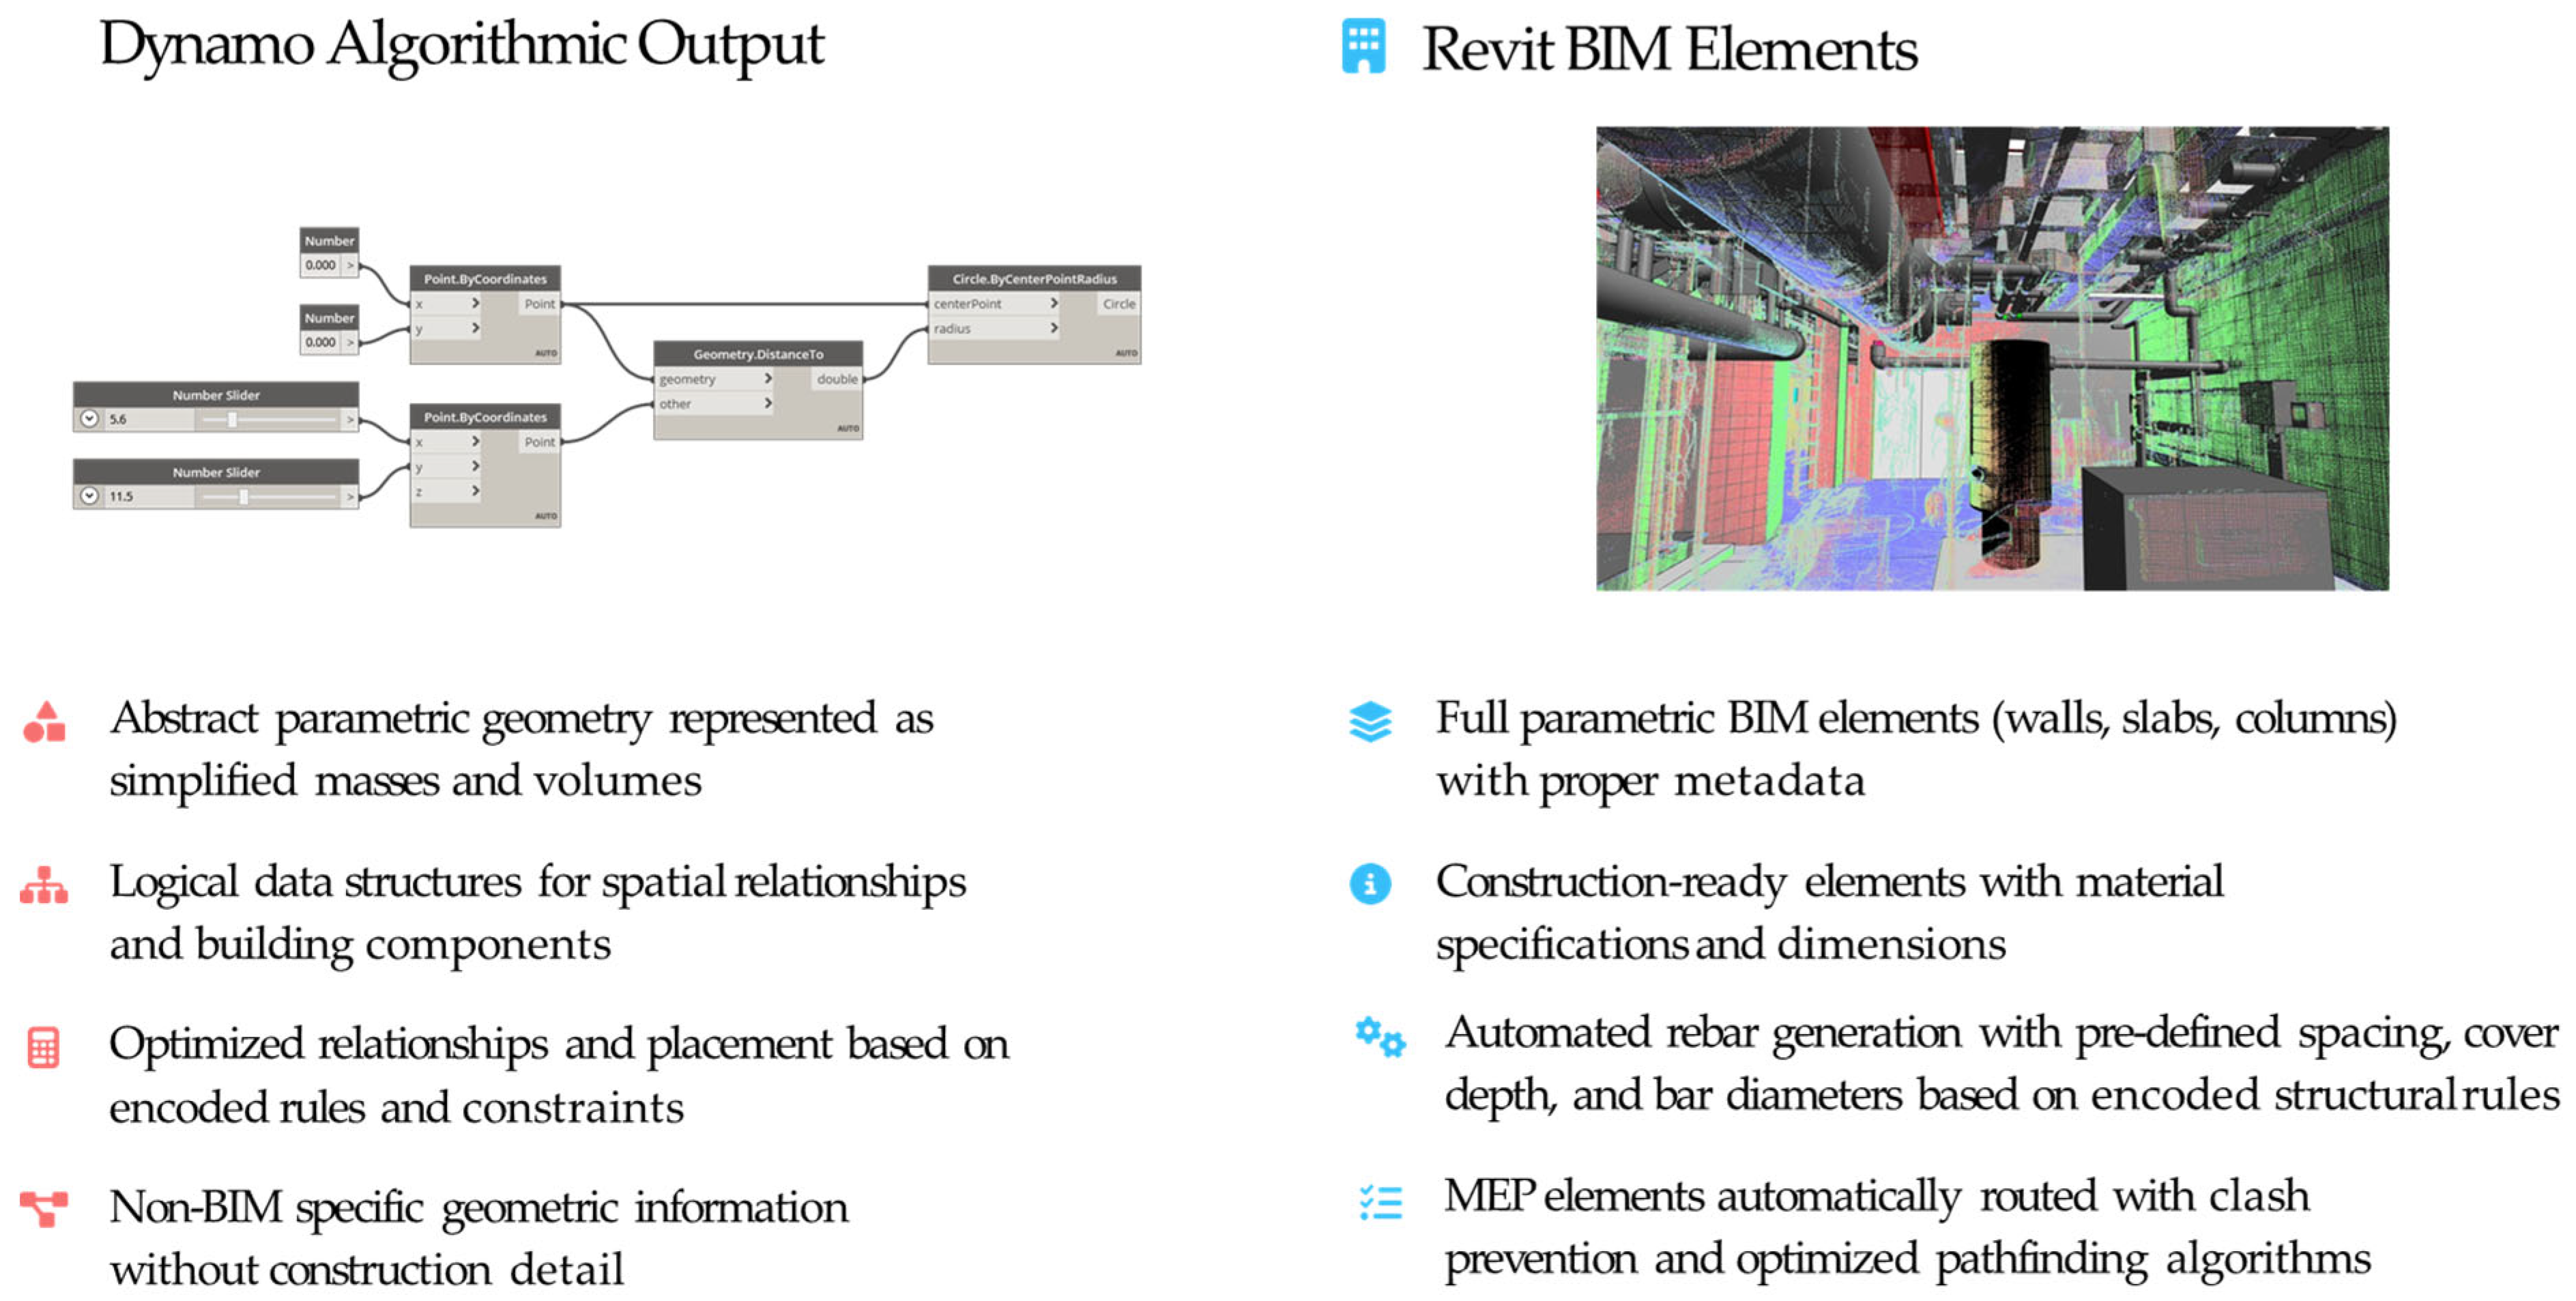
This transformation is a critical step that bridges the gap between algorithmic exploration and a standard AEC workflow. As shown in
Figure 16, the process begins with an abstract parametric geometry from the Dynamo output—simplified masses representing the optimized spatial relationships. Through automation scripts, this abstract geometry is then converted into full-parametric Revit BIM elements, such as walls, slabs, and columns, populated with the correct metadata. This automated conversion goes beyond simple massing to include construction-ready details, with potential for advanced applications such as rule-based rebar generation, ensuring that the optimized design is seamlessly transferred into a high-fidelity model.
Once the alternatives are generated as BIM elements, the framework enables powerful data-driven evaluation. As shown in
Figure 17, because the output comprises true BIM elements, a wide variety of results and documentation can be automatically extracted. This includes checking the volume and quantity of materials for each alternative, which can then be automatically populated into schedules to generate construction documents. This capability allows stakeholders to compare alternatives in terms of not only spatial efficiency but also tangible metrics, such as material quantities and potential costs, facilitating rapid and informed decision-making. Ultimately, this seamless pipeline, from abstract generation to data-rich BIM, provides a powerful feedback loop that accelerates the early stages of project development and directly addresses the Design Bottleneck in complex, capital-intensive projects.
5. Conclusions
5.1. Summary of Findings
This study concludes that Dynamo GD is not merely an optional efficiency tool but also a core strategic methodology for designing next-generation semiconductor fabs. It offers the most viable solution to the Design Bottleneck arising from the mismatch between traditional AEC industry design methods and the speed, precision, and complexity demanded by the semiconductor industry. The proposed framework was demonstrated to successfully automate the design workflow in distinct, integrated stages, from macroscale site layout exploration and mesoscale interior planning to multi-objective utility routing optimization and the final conversion into data-rich, construction-ready BIM models. This data-driven approach allows the exploration of thousands of design options that balance conflicting objectives, leading to optimal solutions that are nearly impossible to find through conventional means.
5.2. Contributions and Innovations
The primary contribution of this study lies in the development of a specialized methodological framework that significantly advances the state-of-the-art in high-tech facility design, distinguishing itself from both traditional methods and existing generative design (GD) research.
Compared to traditional manual and conventional BIM workflows, which rely heavily on manual iteration and are often reactive (e.g., performing clash detection after design completion), this framework is proactive. It integrates rule-based automation and multi-objective optimization from the earliest stages, generating inherently clash-free and performance-optimized layouts and utility routing. This shift fundamentally addresses the inefficiencies, error potential, and limited design space exploration inherent in legacy methods.
When compared to existing GD research in the broader AEC field, this study offers several key innovations that address critical gaps identified in the literature:
- -
Semiconductor Fab-Specific Adaptation: Many existing GD studies focus on generalized architectural space planning, often abstracting complexity to two-dimensional layouts or structures with limited vertical system integration. This framework specifically tackles the extreme demands of semiconductor fabs by holistically integrating the optimization of dense, multi-layered utility systems (MEP) with spatial planning—an area critically underdeveloped in prior research. It addresses the intricate, three-dimensional interplay of spaces and critical systems under stringent constraints such as cleanroom protocols.
- -
Data Security and Generalized Models: Recognizing the high-security nature of the semiconductor industry, this framework utilizes a “data-agnostic” approach based on generalized models. This allows the methodology to be validated and applied without requiring sensitive proprietary project data, overcoming a major practical barrier faced by many academic GD models that assume full data access.
- -
Foundation for XAI and Human–Machine Collaboration: While many GD approaches prioritize full autonomy and overlook the “black box” problem, this study explicitly identifies the necessity of Explainable AI (XAI) for high-risk designs. It lays the groundwork for future integration by proposing concrete strategies (detailed in
Section 5.3), such as “designer intervention nodes.” This emphasis on a traceable, collaborative approach distinguishes it from purely automated frameworks and positions it as a practical, trustworthy tool for complex decision-making.
In summary, the innovation of this study is the creation of a specialized, data-secure, and holistic framework tailored to the unique technical and operational challenges of the semiconductor industry.
5.3. Limitations and Future Research
This study has several limitations. The most significant aspect is that it presents a methodological framework based on a conceptual model rather than actual project data, owing to the high security of semiconductor facilities. Consequently, while the framework was shown to establish an essential data pipeline for quantitative analysis, such as cost estimation, the final effects on cost or schedule could not be verified for a real-world project. Furthermore, the proposed framework was primarily implemented within the Autodesk ecosystem (Revit and Dynamo), creating a technological dependence on specific software. While the core algorithmic logic is theoretically plat-form-agnostic, the implementation is tightly coupled with the Revit API and Dynamo’s visual programming for geometry manipulation and data integration. Integrating the framework with other mainstream tools (e.g., Bentley Systems or Rhino/Grasshopper) would require significant redevelopment of these integration layers. Furthermore, while open standards like IFC (Industry Foundation Classes) could facilitate interoperability, they often present challenges in maintaining the parametric fidelity required for complex generative workflows. Additionally, the scope is limited to the conceptual and de-tailed design phases and not to the entire facility lifecycle. This means the optimization currently focuses on spatial and technical performance during design, without explicitly integrating downstream data for construction scheduling (4D/5D) or long-term operations and maintenance (O&M). Furthermore, the optimization scope is currently focused on spatial and geometric logic. It does not yet incorporate critical physical factors essential for semiconductor manufacturing, such as precise vibration control, dynamic cleanroom airflow analysis (e.g., using Computational Fluid Dynamics, CFD), and electromagnetic compatibility (EMC). The complexity and computational expense of these simulations present a significant barrier to direct integration within the generative loop. A critical limitation concerns the inherent “black box” nature of complex generative algorithms. The opacity of the decision-making logic can hinder designer trust and adoption, which is particularly problematic in high-risk environments like semiconductor fabs, as the current framework does not yet integrate explicit Explainable AI (XAI) mechanisms.
Further research is needed to overcome these limitations. Most urgently, a phased roadmap for empirical validation should be established. Phase 1 involves retrospective validation, applying the framework to a recently completed project to benchmark the algorithmically generated solutions against the actual constructed design, focusing on metrics such as design duration, material quantities, and spatial efficiency. Phase 2 will focus on a live pilot project implementation for a non-critical subsystem, allowing for real-time refinement of the human–machine collaborative workflow. Phase 3 aims for full-scale deployment on a new fab design. To evolve the framework towards true multi-physics optimization, future research must explore pathways for integrating the complex physical factors mentioned above. This will likely require a hybrid approach. One promising strategy is the development of AI/ML-based surrogate models. These models can be trained on high-fidelity simulation data (CFD, Finite Element Analysis—FEA) to provide rapid predictions of physical performance (e.g., airflow patterns, vibration propagation) within the optimization loop, mitigating the prohibitive computational cost of direct simulation. Alternatively, a hierarchical optimization strategy can be employed, where the GD framework generates a shortlist of spatially optimal candidates, which are then subjected to detailed physical simulation. Integrating these pathways will substantially increase the algorithm’s complexity and demand significant computational resources, particularly for model training and validation. In addition, the framework must be advanced to address the challenge of algorithmic opacity and ensure accountability. Future development should focus on integrating XAI principles through two key strategies. First, implementing specific XAI techniques—such as sensitivity analysis or visualization of the optimization trajectory—to help designers understand why the algorithm favors certain solutions. Second, establishing a robust “Human–Machine Collaboration” mechanism. This must include “designer intervention nodes” within the algorithmic iteration process, allowing experts to adjust parameters, screen intermediate schemes based on experience, and guide the search process, thereby avoiding fully autonomous decision-making by the algorithm. Furthermore, recording every intervention is essential to improve the traceability of the final design. Ultimately, research should aim to extend the design model to a complete Digital Twin, for which this framework provides the foundational layer by automatically generating the detailed, data-rich, and accurate BIM models essential for such an initiative.
5.4. Broader Implications
The applicability of this framework is not confined to semiconductor fabs; it can be extended to other high-tech industrial facilities with similar complexities. Representative fields include pharmaceutical plants requiring strict cleanroom standards, hyperscale data centers where power and cooling optimization are critical, and battery gigafactories where efficient spatial planning of large-scale automated processes is essential.
Researchers conducting related studies should pay careful attention to these aspects. First, the success of the GD depends on the quality of the input data and de-fined constraints, and the importance of precise parameter settings cannot be over-looked. Furthermore, researchers must be wary of the “black box” problem and should consider the elements of XAI (such as those mentioned above) to ensure that designers can trust the results. This is consistent with the principle that technology should function as a tool that augments an expert’s capabilities, not as a replacement. Therefore, it is paramount to establish an effective collaborative workflow between human experts and AI systems.
