Article

Analysis of the Effects of Weld Melt Duration on Joint Integrity and Surface Quality During Profile Milling

Faculty of Civil and Transport Engineering, Institute of Machines and Motor Vehicles, Poznan University of Technology, 60-965 Poznan, Poland
*
Author to whom correspondence should be addressed.
Appl. Sci. 2025, 15(20), 11024; https://doi.org/10.3390/app152011024
Submission received: 20 August 2025 / Revised: 8 October 2025 / Accepted: 13 October 2025 / Published: 14 October 2025

Abstract

Research into technological processes, such as welding, provides the basis for optimising the strength and quality of PVC joints, which are becoming increasingly important in the context of sustainable construction. The study analysed the influence of welding parameters on the quality and strength of the welds of PVC window profiles reinforced with glass fibre composite. The variable parameters were welding time (21–25 s) and composite milling depth (up to 1 mm). The constant parameters were a welding temperature of 264 °C and a head feed rate of 0.25 mm/s. The results showed that the most favourable results were achieved with a composite milling depth of 1 mm and a melting time of 22 s, which provided the highest average failure load values and met the strength requirements. Additionally, the white welds confirmed that the welding process had been carried out correctly, with no depolymerisation or material degradation occurring. In contrast, milling depths of less than 1 mm or no milling depth at all resulted in problems with dimensional tolerance. In addition, overloading of the welding machine during the welding process was observed for composite milling depths of less than 1 mm and a melting time of 22 s. The results of the study highlight the need for further analysis of the influence of other process parameters, including welding temperature.

1. Introduction

Plastics, which are synthetic polymers, entered mass production only about seven decades ago but have already outperformed most other man-made materials [1]. Although there is a wide range of polymers, up to 95% of all plastics produced are made from eight of them. By the end of 2017, the total amount of virgin plastic exceeded nine billion tonnes. Of the seven billion tonnes of plastic waste produced to date, only 10% has been recycled, 14% incinerated and as much as 76% remains in landfills or the natural environment [2]. If the current rate of growth in the production of these materials continues, global annual production of virgin plastics could reach 1.1 billion tonnes by 2050 [2]. Synthetic polymers produced artificially in laboratories are also known as man-made polymers [3]. Examples of such materials include polyethylene, polystyrene, poly (vinyl chloride) (PVC), polyamides, synthetic rubber, Teflon and epoxy resin [3,4].
Synthetic polymers are typically produced from crude oil under controlled conditions, with their primary structure consisting of carbon-carbon bonds. The process involves the application of heat and pressure in the presence of a catalyst, which initiates or accelerates chemical reactions between the monomers [4,5]. This creates new bonds that form larger polymer structures. Synthetic polymers are widely used in everyday life. The products made from them can be divided into thermoplastics, thermosets, elastomers and synthetic fibres, each of which performs specific functions in different areas of industry and everyday life [6].
The durability and reliability of building structures depend mainly on the quality of the materials used and their joints. PVC plays an important role in this area, as it is one of the main materials used in the production of window profiles, which form the basis of modern building technology [7,8]. In 2019, 6 million tonnes of PVC were produced in the EU, of which more than 85% is non-plasticised PVC [9]. PVC is valued for its properties such as corrosion resistance, thermal insulation, and ease of processing. These properties make it competitive with other materials widely used in the manufacture of PVC joinery. Such as wood, aluminium, or steel. In addition, its recyclability and favourable price strengthen its position in sustainable construction. PVC production is growing rapidly in response to the increasing demand for energy-efficient and sustainable solutions.
One of the key technological processes associated with PVC is welding [10], which ensures the durability and strength of the joints. Process parameters such as welding temperature, melting time, or clamping pressure are critical to the properties of the welds [11,12,13]. In the newer generation of welding machines, the feed rate of the welding heads is also an important parameter. Adjustment of process parameters when using glass fibre-reinforced composites remains a significant challenge [14]. Differences in the melting temperatures of PVC and composites can affect the welding process.
Numerous studies have focused on welding parameters such as corner strength or temperature effects on the welding process. Alternative methods have also been described, including ultrasonic welding [15,16,17], resistance welding [18,19,20,21] or friction stir spot welding [22] for polymeric materials. This research contributes to a better understanding of welding processes and the possibilities for their optimisation. In particular, many attempts have been made to apply innovative solutions, such as the use of additional heating elements in the form of a metal mesh [23].
In addition to its technological role [24,25], PVC also has an environmental role. Its recyclability makes it ideally suited to the trend towards sustainable construction. Its use in building structures such as window profiles and other structural elements [26,27] underlines the versatility and innovative potential of this material. Also, in maintaining high energy efficiency [28,29,30,31,32].
The issue of window profiles has been widely studied in the scientific community. One study to date has looked at the cumulative environmental impact of the so-called ‘embodied impacts’ of materials used in window manufacture, specifically PVC profiles, and their impact on the overall environmental impact compared to other materials such as wood, aluminium, and fibreglass [32]. The aim was to determine the environmental impact of different window frame materials and glazing solutions to support the design of energy-efficient and environmentally friendly windows. The results showed that PVC is a greener alternative to aluminium, which has the highest environmental impact, mainly due to its energy-intensive manufacturing process. PVC frames, although more damaging than wood, have a lower impact than aluminium and are widely used because of their good insulating properties. For PVC windows, frames are responsible for most of the environmental impacts for single- and double-glazed windows (between 46% and 86%), but their share decreases for triple-glazed windows (22–40%). The results provide a better understanding of the environmental impact of PVC and show that, with the right design, it can be a material with sustainable potential, combining performance with less environmental impact than more energy-intensive materials such as aluminium.
The mechanical properties of unplasticised poly(vinyl chloride) (UPVC) have also been the subject of other studies [25]. The research was carried out on samples taken from different parts of window frames and sashes manufactured by Weiss Profil (Bulgaria). The aim was to determine material parameters that can be used in numerical models to analyse stresses and strains in PVC supporting structures. The results showed that the mechanical behaviour of UPVC varies and requires more complex constitutive models than linear equations. The use of a multi-linear isotropic hardening model based on a stress–strain curve was proposed. The study showed that uPVC can be effectively modelled in strength analyses, which is important for optimising its use in windows. The results provide detailed data for accurate analysis, whilst highlighting the strength and potential of uPVC as a load-bearing material in window structures.
Another of the studies aimed to verify the thermal deformation of PVC window profiles, taking into account the influence of steel reinforcements in different fixing configurations [8]. The focus was on temperature distribution, flexural-torsional deformations, and mechanical properties of PVC under temperature. The research aimed to develop simplified engineering methods for calculating the thermal deformation of PVC windows. This was important because existing methods do not take into account the effect of thermal deformation, which can reach levels comparable to wind loads and reduce window performance. The research aimed to develop more accurate analytical and numerical tools for the design of PVC windows, which would avoid degradation of their technical properties and improve their reliability in the environmental conditions of Eastern and Northern Europe. The research resulted in the development of simplified methods for the calculation of thermal deformations of PVC profiles with a steel core. Analytical and numerical solutions were proposed for different fastening configurations to the steel core. It was shown that the most stressed points are the extreme points of the PVC profile fixings to the steel core, making their parameters the leading ones for limiting deformations. However, the study did not include glass fibre-reinforced profiles. These profiles are becoming more and more popular, and it seems necessary to carry out tests to know the deformation under stress, both thermal and mechanical.
Reference [14] analysed the influence of welding parameters, particularly the plasticising temperature, on the corner strength of glass fibre-reinforced polyvinyl chloride (PVC) window profiles. The study was conducted using a semi-automatic frame welding station, and the specimens were subsequently tested using a universal testing machine. Temperatures varied between 210 and 250 °C during the study, which affected the plasticisation time, clamping force, and fracture characteristics of the specimens. The results showed that a temperature of 210 °C was too low, resulting in weakened weld strength, while a temperature of 250 °C was too high, leading to cracking of the profile itself instead of the joint. The authors emphasised that the optimal range is 220–240 °C. This range ensures both good weld quality and the avoidance of excessive weakening of the material. However, the article states that the welding time was automatically selected by the machine. Consequently, there is no data on the effect of welding time on weld quality. This raises questions about the influence of this parameter on the quality of the welds, as well as on the welding process as a whole.
Reference [10] investigated the effect of the PVC corner welding process on quality and bending strength. Corner welds produced using three types of machines, single, double, and quadruple-headed, were tested, with differences in temperature distribution and heating uniformity analysed. The authors concluded that temperature control was a key parameter, as variations in temperature led to defects in the quality of the welds. Strength was tested using bending tests according to PN-EN 514:2002. Their conclusions indicated that precise temperature control and selecting the right machine can significantly improve the durability and reliability of PVC window frame corners. However, the article did not address the issue of welding time.
References [33,34] has shown that during the welding process of PVC profiles reinforced with a glass fibre composite insert with an applied fusion time of 30 s, the optimum value of the welding head feed rate is 0.25 mm/s. The research also showed that the highest values of average destructive loads can be obtained by performing the milling operation of the composite insert, reinforcing the profile at depths of 0.5 mm and 1 mm, and without milling the composite. However, the results of the study did not determine which milling value gave the best results. To address this problem, a study was carried out to reduce the melting time of glass fibre-reinforced profiles.
This study aimed to determine the minimum acceptable welding time for glass fibre composite-reinforced PVC profiles and to find the optimum milling parameter value for the composite insert.

2. Materials and Methods

2.1. Research Plan

Once the test methodology had been outlined and the required number of specimen sets had been prepared, the tests were carried out. The main areas of research included two issues that were investigated using strength testing. These are related to the reduction in melting time of the window profiles, taking into account different milling depth variations in the composite reinforcement. The tests were followed by a qualitative analysis of the welds and a discussion of the results.
The study was designed to use PVC window profiles together with a composite insert. It was planned to mill the inserts to two depths: 0.5 mm and 1 mm. The tests also included a variant without milling of the composite insert. In all tests, a welding head feed rate of 0.25 mm/s was used during the welding process.
The research was carried out in three main stages. The first stage was to determine the shortest possible melting time for sets of specimens where the composite reinforcement was milled to a depth of 1 mm. This involved checking the quality and strength of the welds when the melting time was reduced from 25 s to 21 s.
As this time was determined to be 22 s (as will be seen from the presentation of the results of the first stage of the test), the second stage of the test consisted of testing for such a melting time, but for profiles in which the composite was not milled (0.0 mm) and was milled but to a depth of 0.5 mm (Table 1).

2.2. Materials and Test Benches

A commonly used window profile with an installation depth of 85 mm and a width of 70 mm, characterised by a 6-chamber design, was used for the study. The material used for the profile was non-plasticised PVC.
Material properties include a coefficient of linear expansion of 7 × 10⁻⁵ K−1, a coefficient of thermal conductivity of 0.16 W/m·K, and a stability time at 200 °C of 40 ± 6 min [35].
A model of the profile used is shown in Figure 1a, while Figure 1b shows the composite insert area.
To ensure adequate stability in building structures, PVC profiles are often supplemented with steel reinforcements in the core of the profile. However, a possible solution is to replace the steel with a glass fibre-reinforced composite, which eliminates the need for additional reinforcement. The use of composites offers many advantages, such as better insulating properties, reduced thermal bridging, and a better heat transfer coefficient due to the elimination of steel. In addition, profiles with composite reinforcement have a significantly lower weight compared to those containing steel components.
For all types of tests, regardless of the milling depth parameter adopted for the composite reinforcement or the value of the melting time of the profiles, a minimum of 3 window frames was accepted for testing, representing 12 individual corner samples, according to the provisions of the standard [12]. Dimensional tolerance was then tested using a tape measure on each welded sample.
The profiles were cut using a WEGOMA Polska DS 150—Gamma automatic double-head cutting machine (WEGOMA Weiss Fensterbau Maschinen GmbH, Bietigheim, Germany) (Figure 2a). The cutting of the profiles was carried out in an automated way, preceded by the calibration of the cutting heads. During the operation, the profile was stabilised by clamping in two axes: vertical and horizontal, which ensured that it remained stationary. The parameters of the cutting tool were as follows: a disc equipped with carbide blades with a diameter of 550 mm and a thickness of 4.2 mm; the number of teeth was 120, and their shape was trapezoidal-flat. The disc speed was 3000 rpm, and the feed rate was set at 45 mm/s.
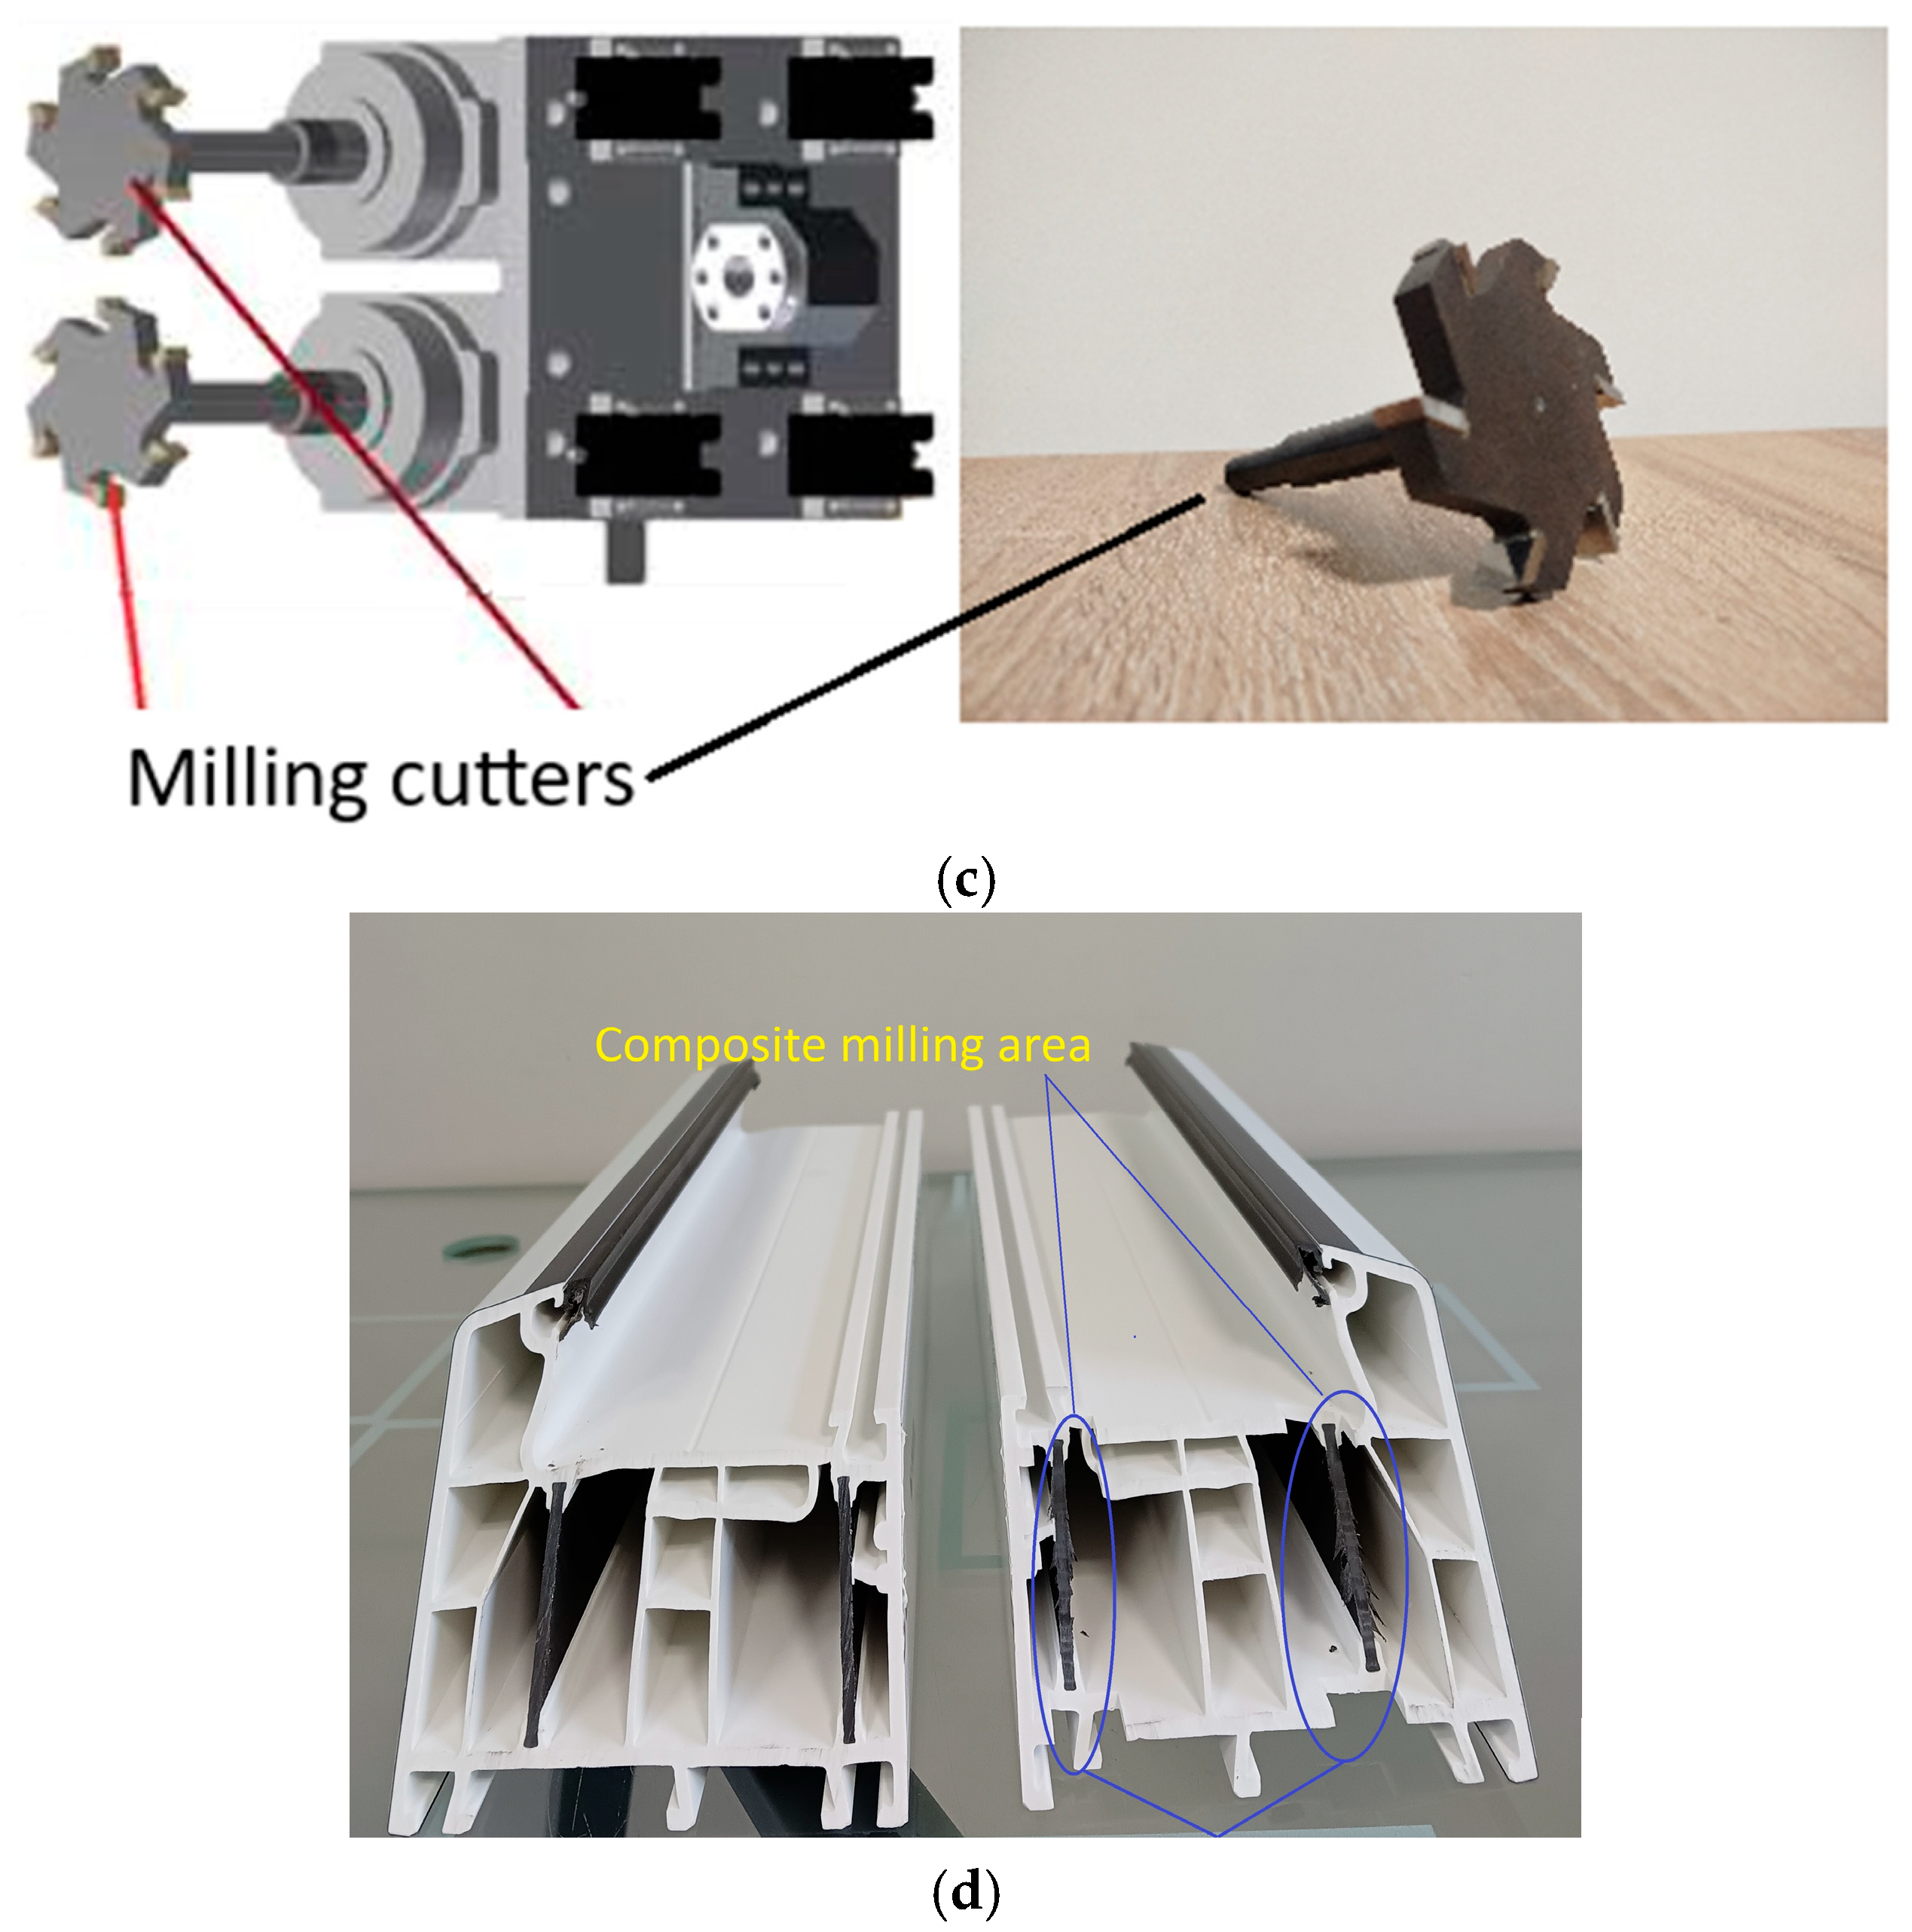
A DFM-202/4 automatic two-spindle milling machine (URBAN Polska Sp. z o.o., Żary, Poland), the milling head of which is shown in Figure 2b,c, was used to mill the composite reinforcing the profile. Once the profiles were correctly aligned, the composite was milled using carbide disc cutters. An 80 mm diameter disc cutter with a 12 mm insert width carbide blade was used. The process was carried out at a speed of 18,000 rpm and a feed rate of 20 mm/s. The profiles were held in a stable position during milling by pneumatic clamping in two axes. The milling process involves cutting the surface of the composite insert with glass fibre evenly to a specified depth relative to the front surface of the PVC profile. The depth of the cut cannot be too great, as the composite is an important structural element of the profile. Such cutting would reduce the destructive loads on the welds while lowering their quality. If the cut is too shallow, the composite insert will act as material resistance, preventing the maximum reduction in welding time. Figure 2d shows the profile before and after milling, with the milled area highlighted.
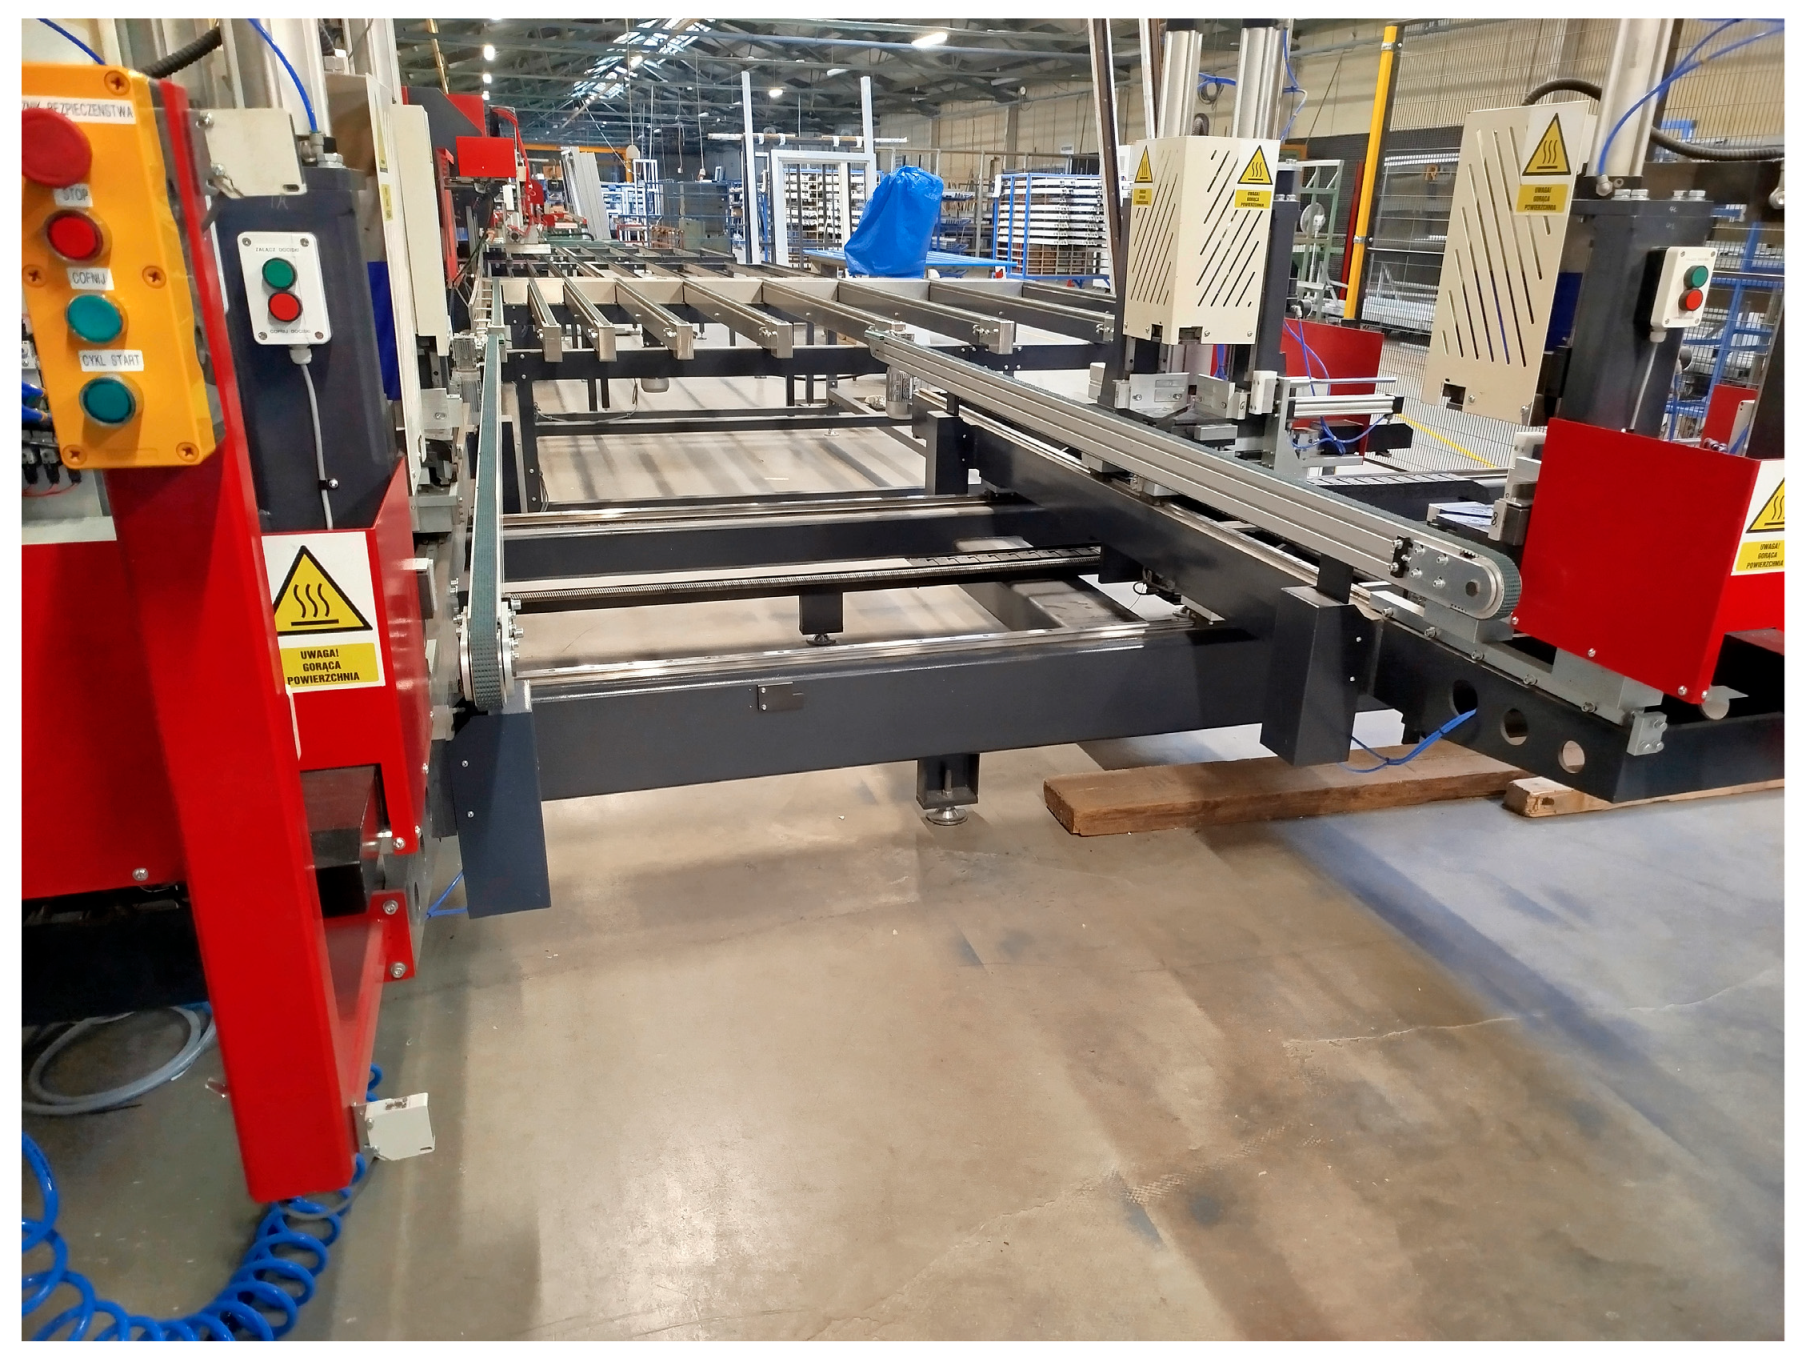
The WSA 4RH/LH automatic four-head welding machine, manufactured by WEGOMA Polska (WEGOMA Weiss Fensterbau Maschinen GmbH, Bietigheim, Germany), was used for the welding cycle, the diagram of which is shown in Figure 3. The tests were carried out at a welding temperature of 264 °C, a welding head feed rate of 0.25 mm/s, and a variable melting time according to the test plan. The machine allowed the selected welding parameters to be entered to two decimal places, while the other process parameters were set to one decimal place. The statistical analysis of the results was based on confidence intervals, assuming a certain number of samples and a confidence level of 95%. An automatic corner cleaner, WPCNC2/4, from WEGOMA Polska was used to clean the corners after the welding process.
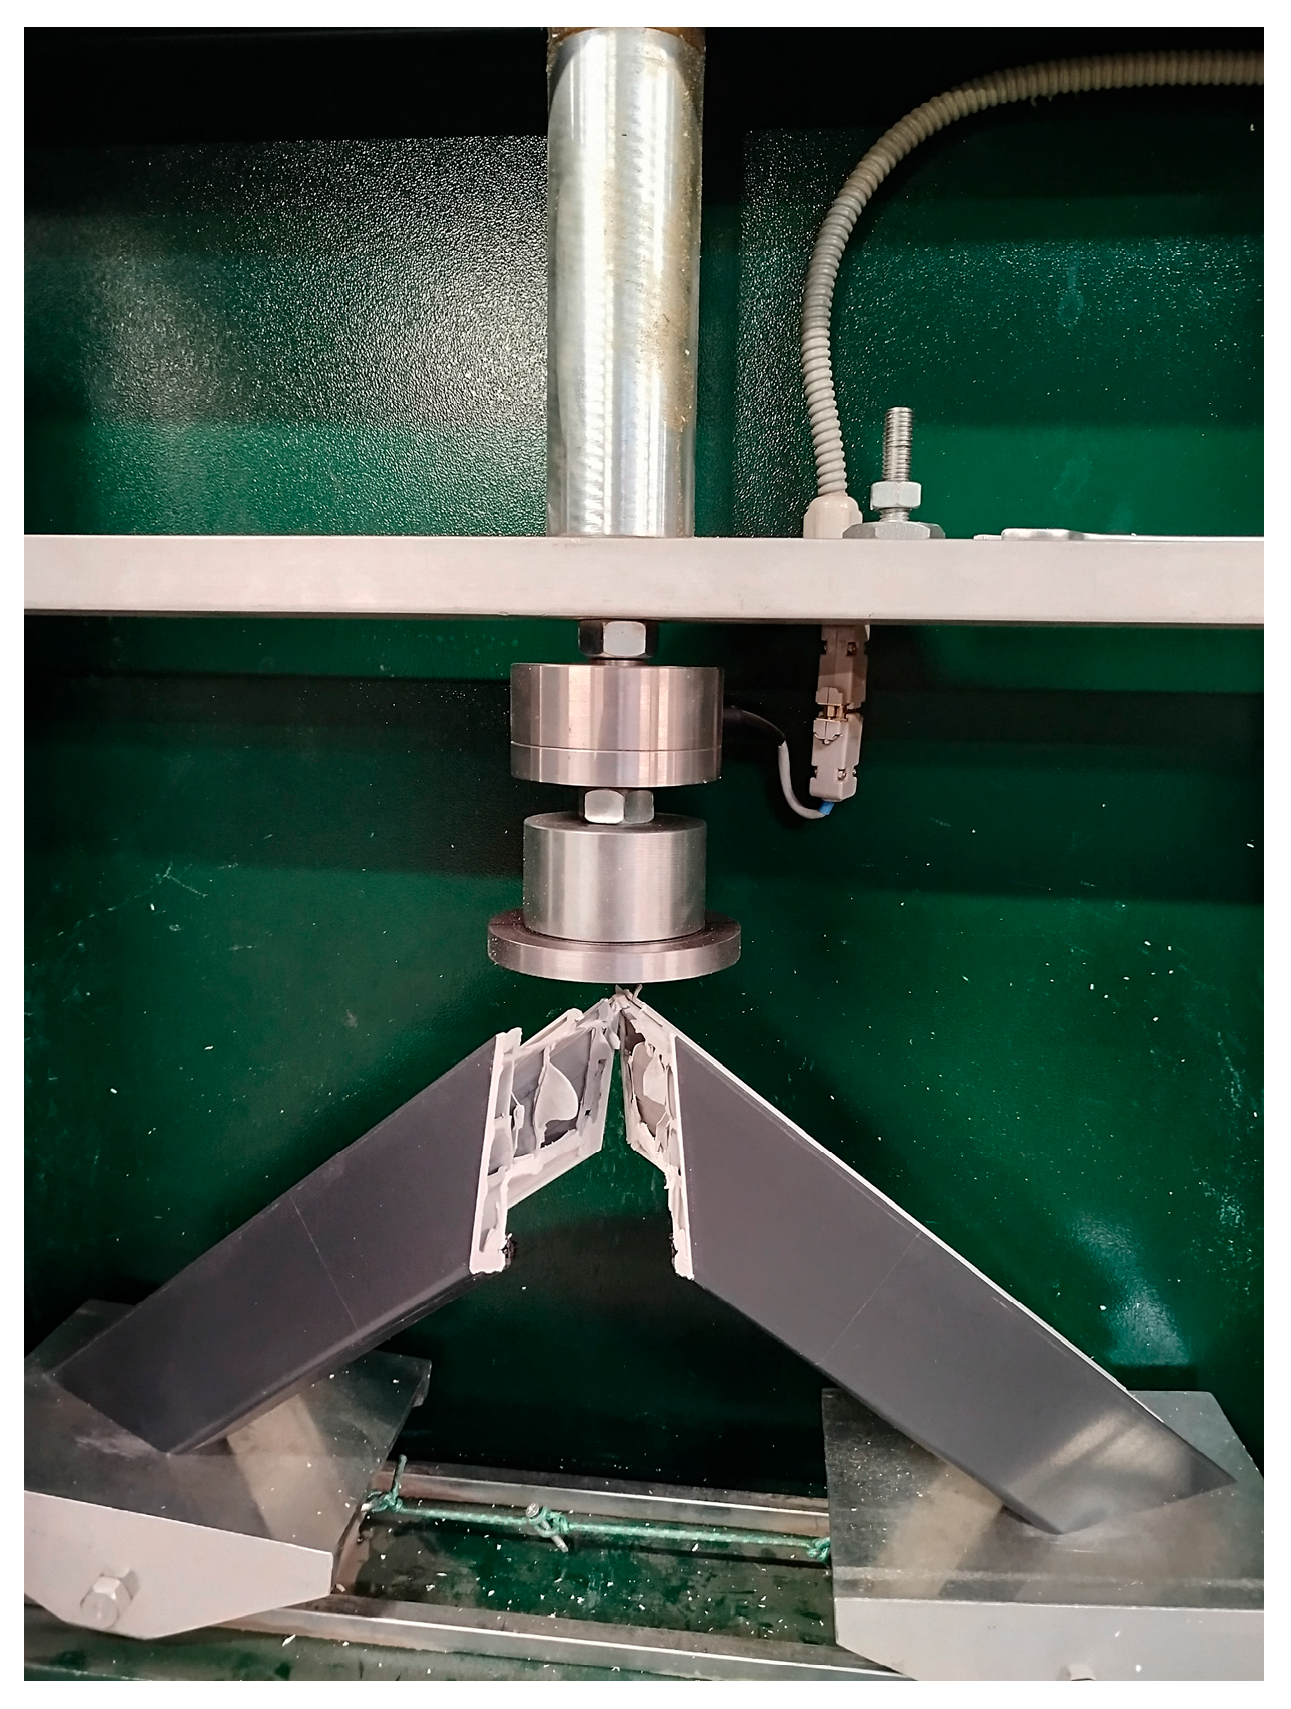
Compressive bending strength tests of the window corners were carried out using an LN2000 corner crusher (PPHU DELTA, Ksawerów, Poland) (Figure 4). The breaking force was measured directly on the breaker, which was equipped with a digital display showing the current value. The device also allowed the recording of the maximum force achieved during each test cycle. The load measuring range of the machine was 2 kN to 20 kN, and the speed of the punch was fixed at 50 mm/min. The accuracy of the tensile force measurement was 10 N.

3. Analysis of Results and Discussion

3.1. Comparison of the Average Failure Loads of Sets of Specimens, in the Context of a Given Melting Time, for a Milling Depth of 1 mm for the Glass Fibre-Reinforced Composite

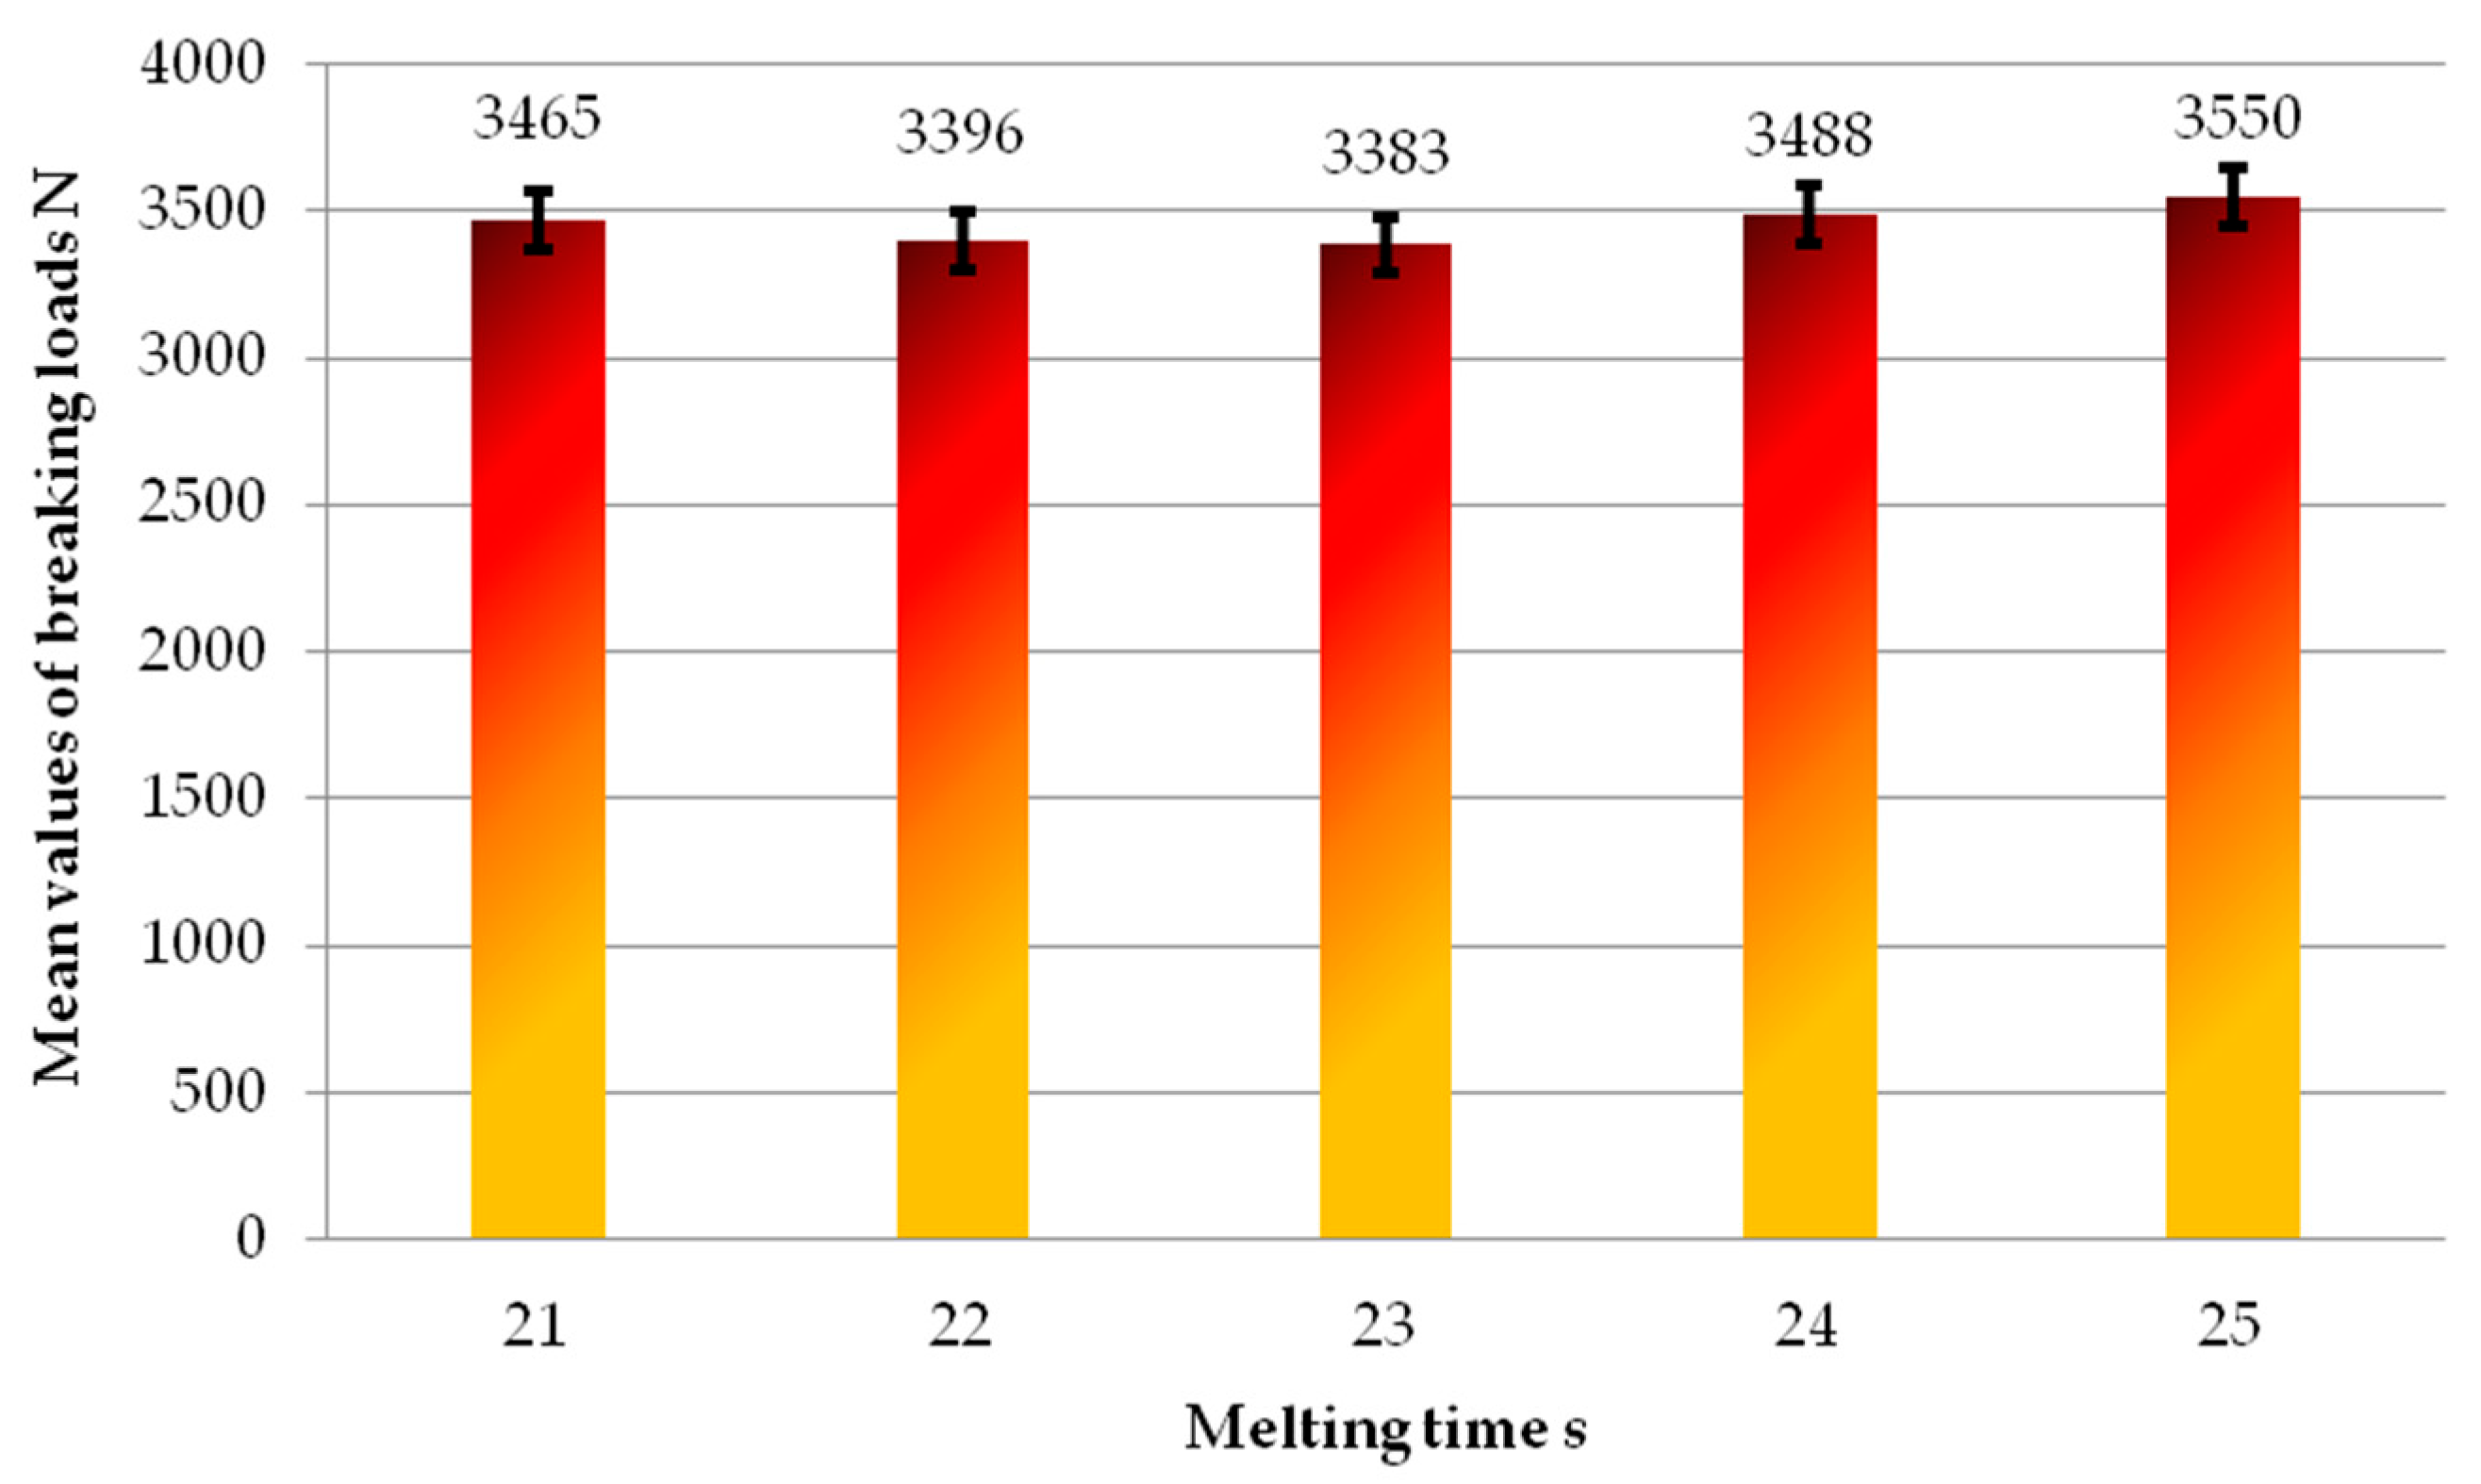
The figure (Figure 5) shows the average failure loads of sets of specimens for a given melting time for a milling depth of the glass fibre-reinforced composite of 1 mm. All specimen sets achieved average failure loads of at least 3300 N. This is well above the minimum expected value of 2760 N. The highest average value had a specimen set for the specified melt time of 25 s. This value was 3550 N. The lowest average value was for the specimen set for the specified melt time of 23 s. This value was 3383 N. This was slightly lower than the average values obtained from the sample sets for the set melt times of 22 s and 21 s. However, the tests showed that there were no significant differences in the mean values of failure loads between the specimen sets for the melt times set between 21 s and 25 s.
However, this does not mean that there are no other significant differences between the sample sets. A table (Table 2) summarises the results of the selected tests. Taking into account such important issues as the achievement of the expected final dimension and the achievement of the required failure loads of each weld, only the sets of specimens in the range of 22 s to 25 s set melting time passed the tests. Sample sets with a melting time of 21 s failed the tests. Thus, the lowest melt time value that meets the strength and quality criteria for milling the glass fibre-reinforced composite to a depth of 1 mm is a melt time of 22 s.
For sets of specimens with a melt time of 21 s and milling of the reinforcement to a depth of 1.0 mm, the deviation in mould dimensions was 2 mm in each set, which is twice the allowable tolerance of 1 mm. This was primarily due to the welding time being too short, which overloaded the machine and prevented the profile from being brought to its nominal dimensions. The material’s resistance disturbed the operation of the heating heads, resulting in a faulty process and products that did not reach the required dimensions. Photographs of the welds (Figure 6) reveal their bright colour and continuous material. However, visual signs of correctness did not overcome dimensional issues. Nevertheless, all specimen sets achieved relatively satisfactory failure forces of over 3200 N, while individual heads achieved over 3350 N, and the tests showed no significant differences between sets and heads. Thus, while the test variant demonstrated good weld load-carrying capacity, the critical problems remain: the welding time is too short, resulting in overload. Dimensional deviations exceed 2 mm. These critical aspects disqualify this type of weld.

3.2. Comparison of the Average Failure Loads of Sets of Specimens, in the Context of a Given Melting Time of 22 s, for Different Milling Depths of the Glass Fibre Reinforced Composite

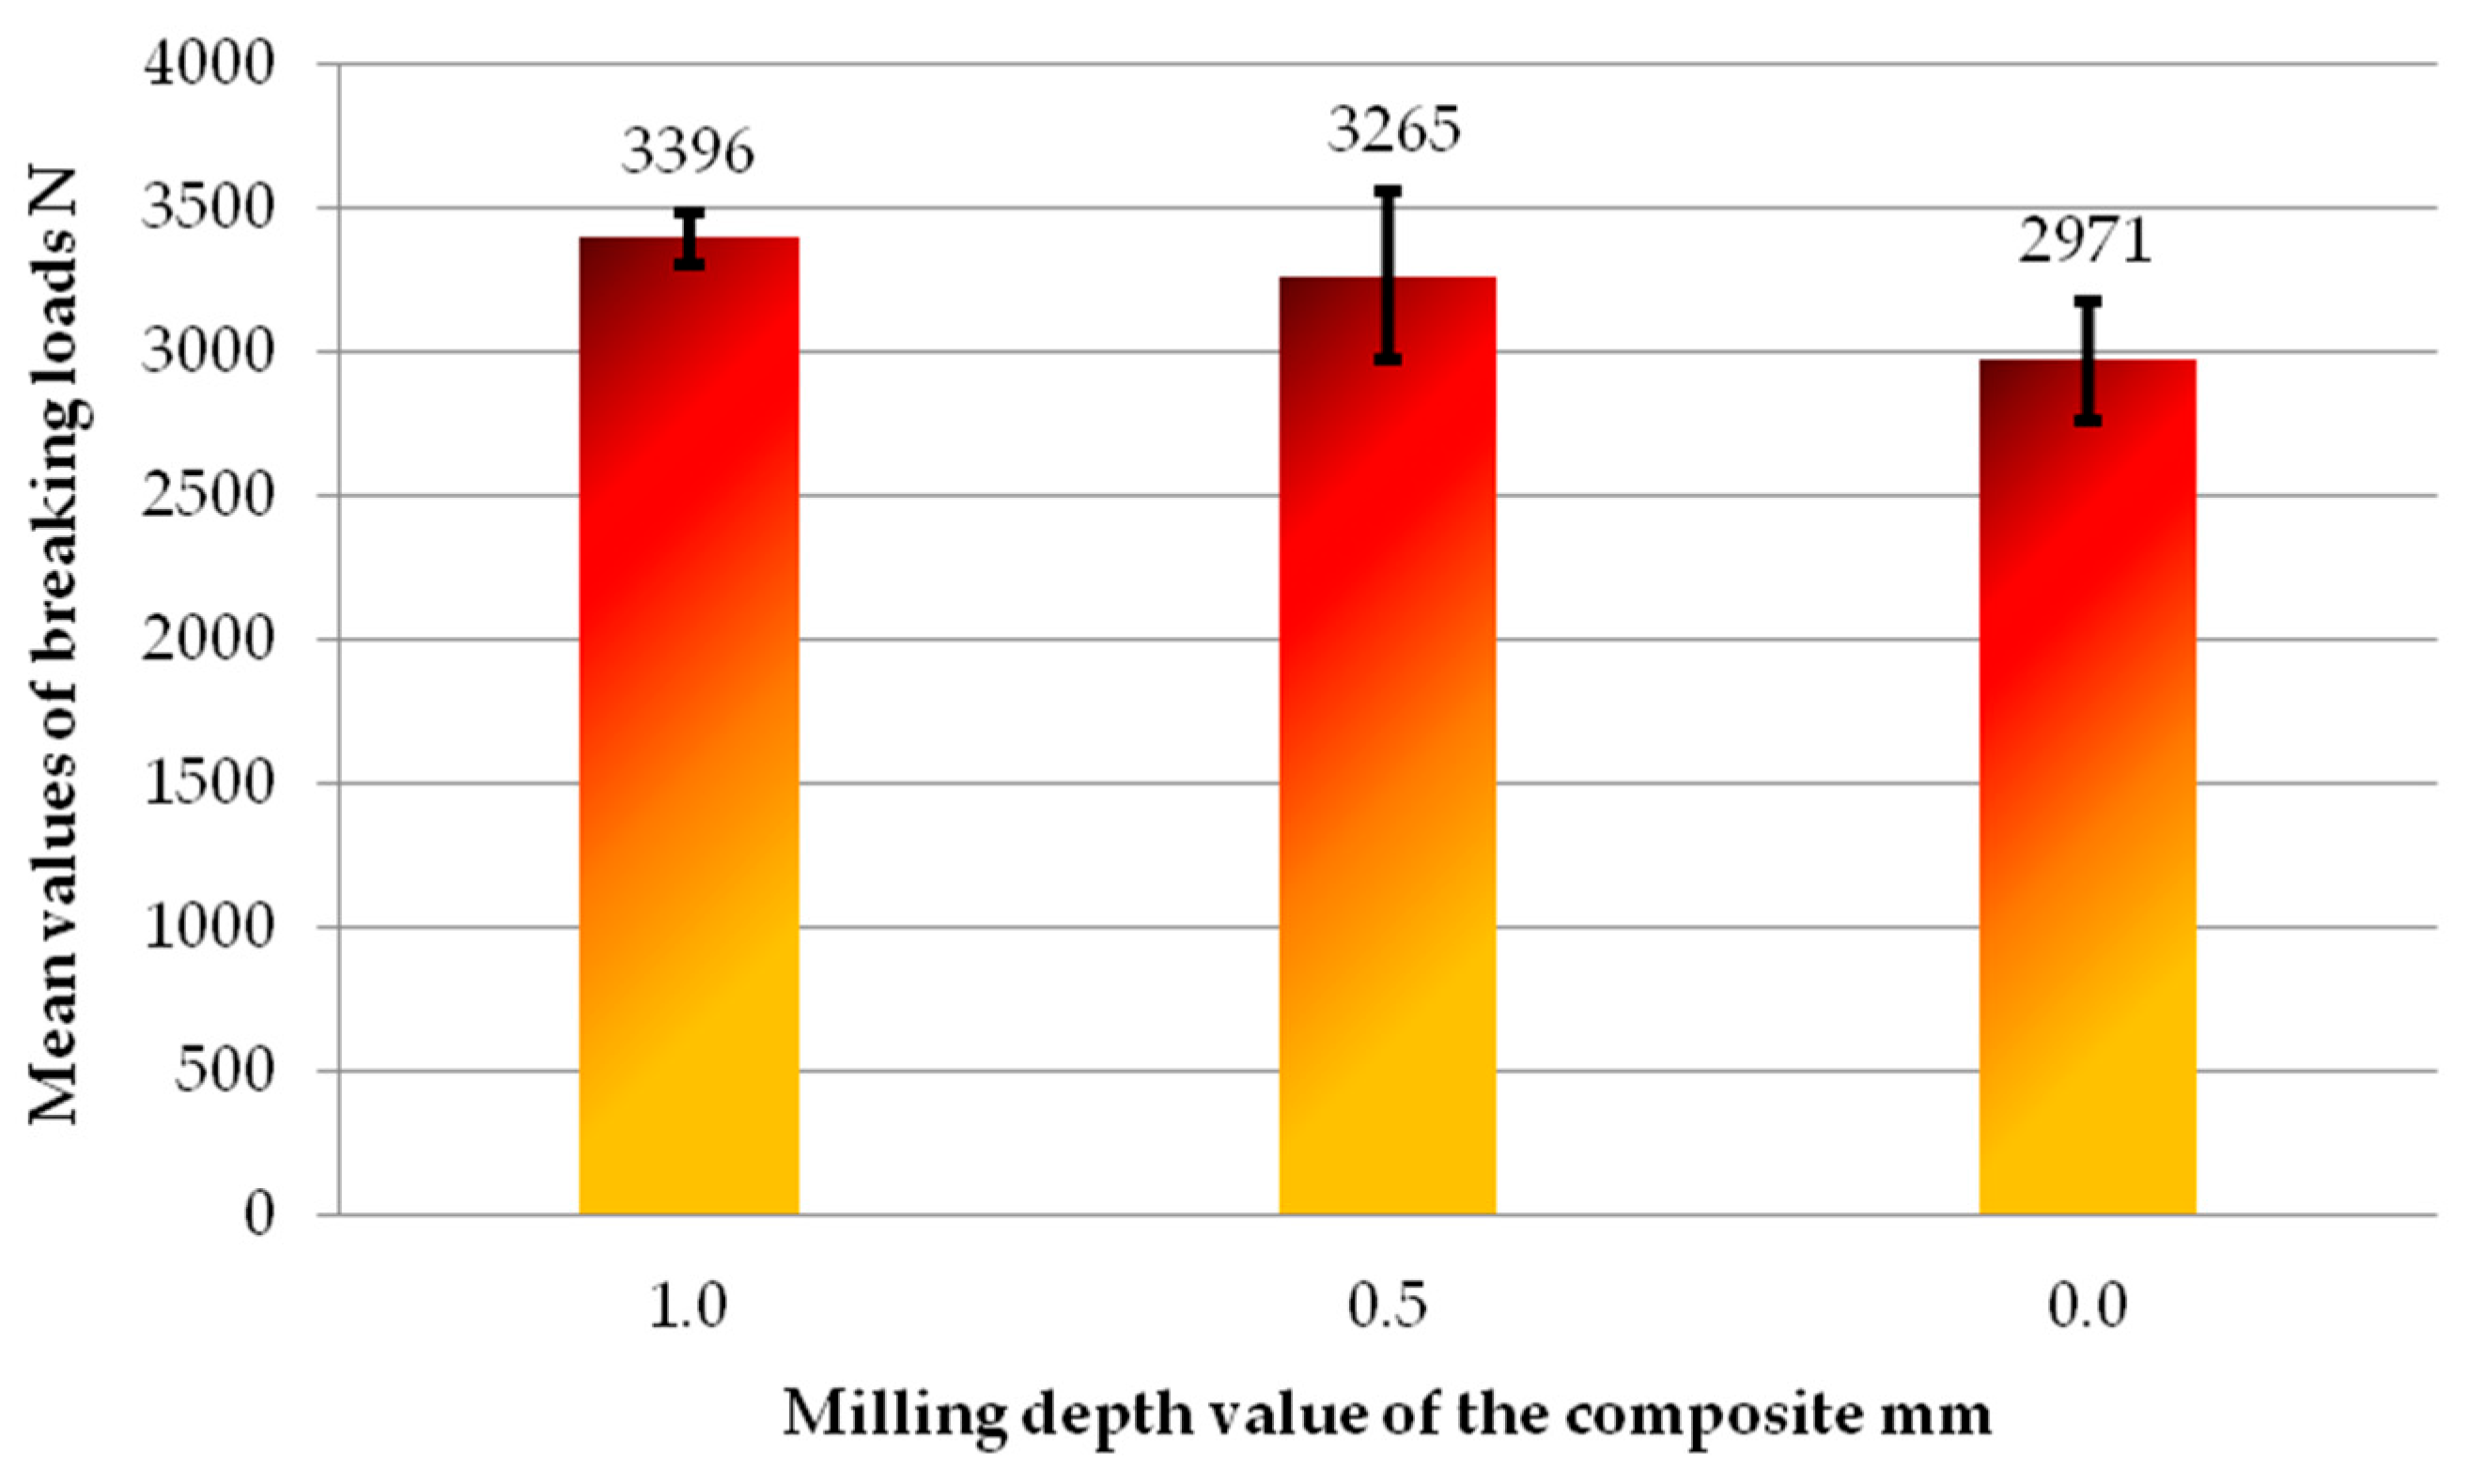
The figure (Figure 7) shows the average failure loads of the specimen sets for a given melting time of 22 s for milling depths of the glass fibre reinforced composite of 1 mm, 0.5 mm, and 0 mm. All specimen sets achieved mean failure loads of at least 2900 N. The highest value of mean failure load was achieved by the specimen set for the milling depth of the composite reinforcement of 1 mm. This was a value of 3396 N. On the other hand, the lowest value of mean failure load was achieved by the set of specimens without milling of the composite reinforcement. A regularity can be observed among the three variants of the results obtained. As the milling depth of the composite increases, the mean values of the failure loads increase. In addition, there is a significant difference in the mean failure load between the set of specimens with a milling depth of 1 mm and the no-milling variant. However, this cannot be observed between the set of specimens with a milling depth of 1 mm and those with a milling depth of 0.5 mm.
However, this does not exclude the possibility of other significant differences between the sample sets. A table (Table 3) summarises the results of selected tests discussed in the article. Taking into account the most important aspects, such as achieving the expected final dimension and meeting the failure load requirements for each weld, only one specific set of specimens passed the tests. This set of specimens is for a milling depth of 1 mm of the glass fibre composite reinforcement. The other two sets of specimens did not meet the required strength and quality expectations. Therefore, given the results of the tests carried out, it can be concluded that, with the lowest possible value of the melting time of 22 s, the only set of specimens that fully meets both the strength and quality criteria is the set for which the glass fibre reinforced composite reinforcement was milled to a depth of 1 mm.
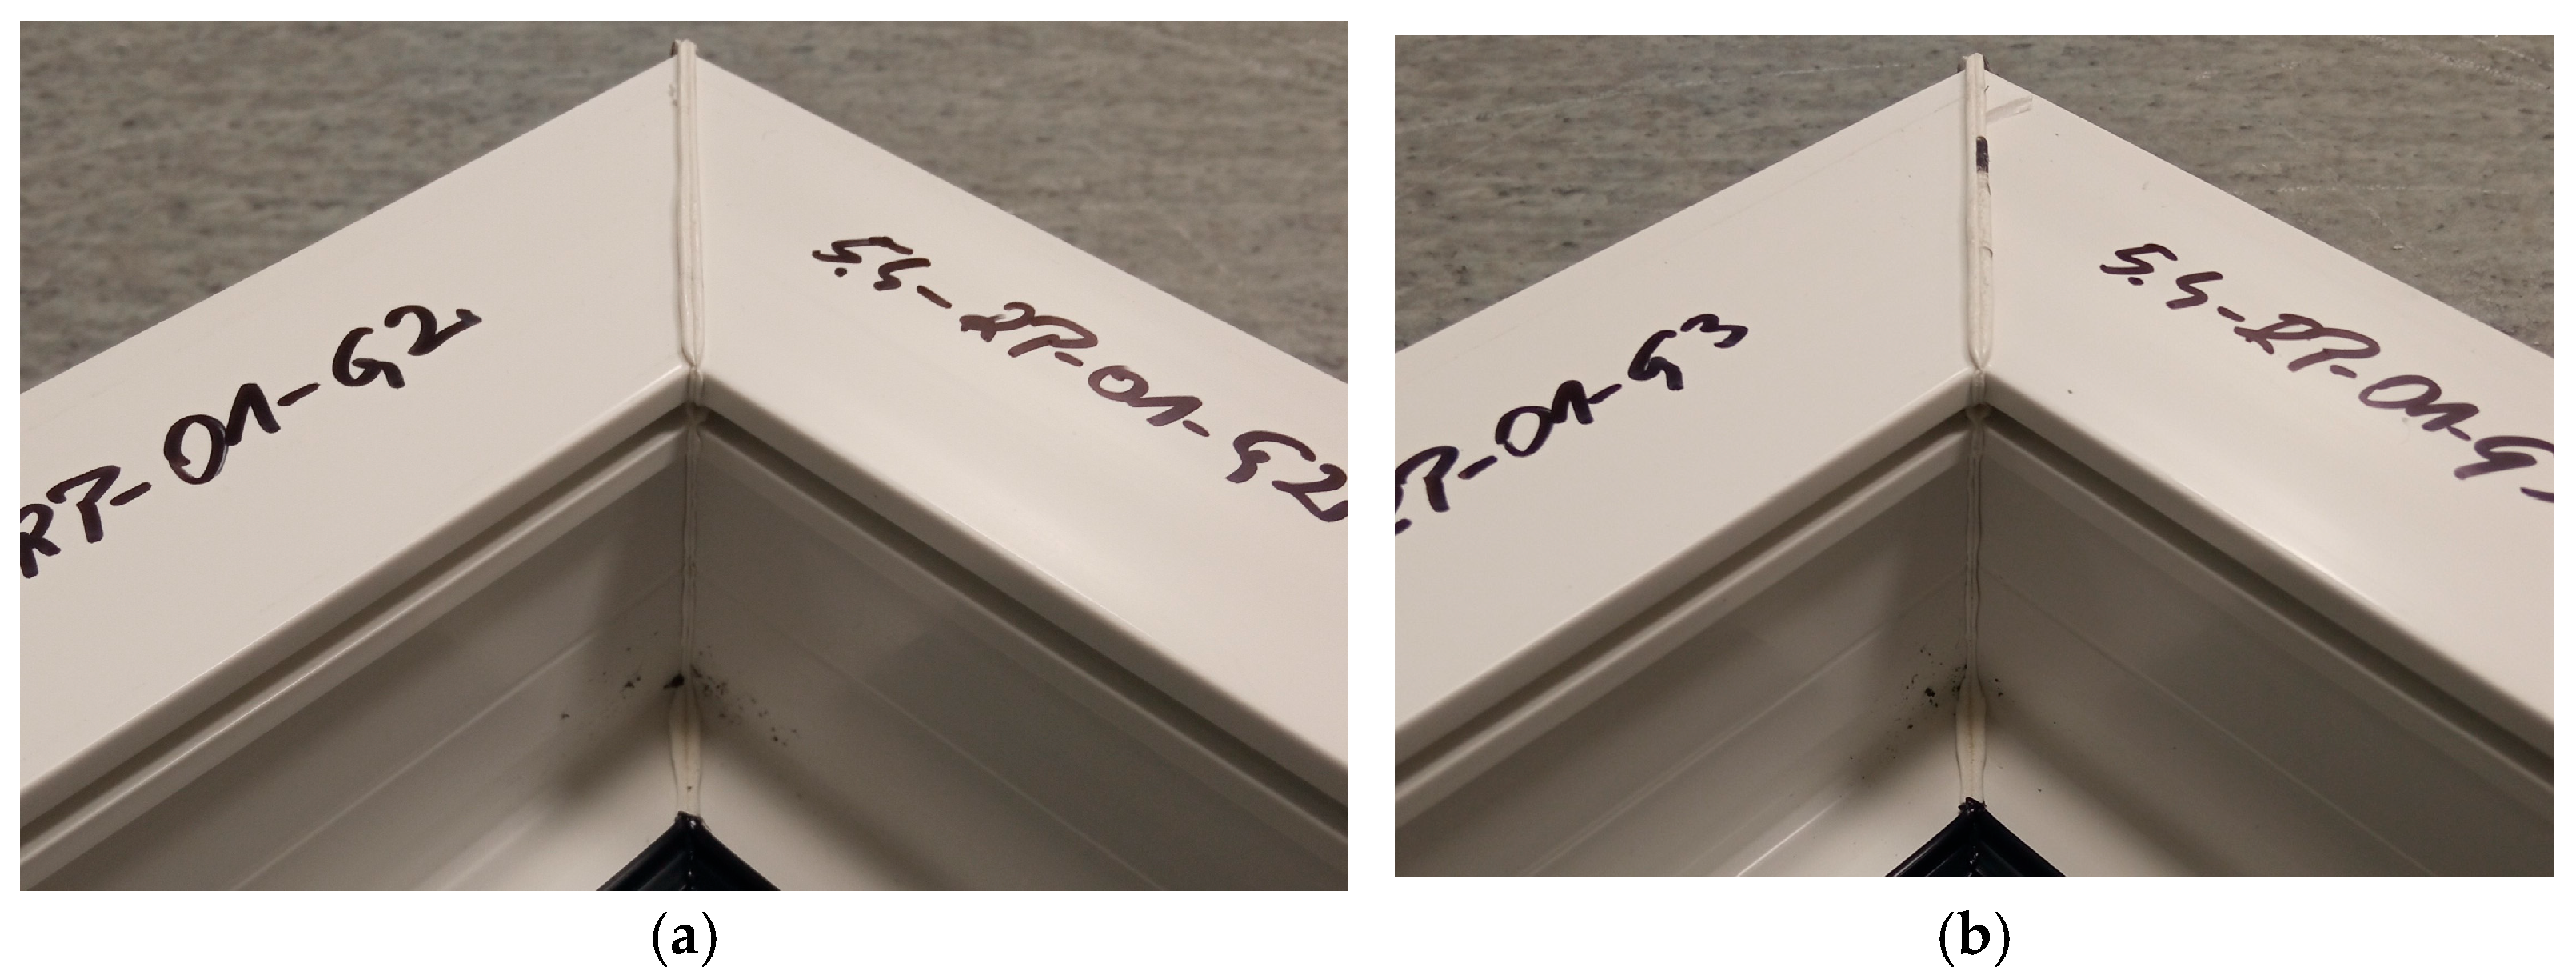
With a melting time of 22 s and a gain of 1 mm through milling, the deviation of the mould dimensions did not exceed 1 mm, confirming that the assumed tolerance was met. The average failure force for all sets exceeded 3100 N, with the second set achieving the highest value of 3570 N. Four of the six sets exhibited average loads above 3400 N, demonstrating no significant differences between sample groups. Each weld head achieved an average breaking force above 3250 N, with the fourth head exceeding 3500 N. The clear white body of the welds (Figure 8) indicates material continuity and that the process temperature was correctly selected. This had a positive effect on the strength of the joints.

3.3. Comparison of the Dimensional Tolerances of Individual Sample Sets

Table 4 shows the sets of samples for which the required dimensional tolerances have been achieved.
The data show a clear trend. For melting times of 22–25 s at a milling depth of 1 mm, slight deviations of 1:1 (occasionally 0:1) predominate, confirming dimensional conformity. However, for the shortest melting time of 21 s at a milling depth of 1 mm, all samples showed larger deviations of 2; 2, and reducing the milling depth to 0.5 mm at 22 s resulted in mixed deviations (2; 2 and 1; 2). In the absence of milling, the deviations were consistently large (2; 2). Therefore, it can be concluded that a melting time that is too short significantly impairs the dimensional integrity of the joints. Additionally, reducing the milling depth increases deviations, particularly in the second component (Y). The best dimensional results were obtained with a combination of a melting time of over 22 s and a milling depth of 1 mm.

4. Conclusions

The study investigated the influence of welding process parameters, with particular emphasis on welding time, on the strength and quality of window profile welds reinforced with glass fibre composites. The tests included different melting times and milling depths of the composite. The analysis focused on the failure loads of the welds and the dimensional tolerance, which were key to assessing the quality of the joint.
The results showed that for a melting time of 21 s and milling of the composite to a depth of 1 mm, the average failure loads of the specimen sets were higher than the required minimum. However, problems were found with the dimensional tolerance of the moulds after welding. This was an indication of errors in the welding process. Increasing the melting time to 22 s and further testing did not improve the mould dimensions when the composite was milled to a depth of 0.5 mm, nor when the composite was not milled. The key problem appeared to be the resistance of the material to the welding heads, which affected the quality of the welds. In addition to the fact that the melting time proved to be too short, the milling depth of the composite, which was too shallow, prevented a proper welding effect.
A comparative analysis of failure loads showed that the highest average failure loads were achieved with a milling depth of 1 mm. Strength and quality requirements were also met. The specimen sets for milling the composite to a depth of 0.5 mm, and without milling the composite, did not meet the quality expectations in terms of dimensional tolerance of the welds.
In summary, the research has shown that the best solution for achieving the required average destructive loads and maintaining the required weld quality at a welding temperature of 264 °C is to mill the reinforcing composite with a profile depth of 1 mm and a melting time of 22 s, based on the tests carried out and the sample sets examined.
It remains to be investigated how important a factor in the welding process, in terms of the results obtained and the solutions adopted, is the welding temperature. There is a legitimate need and desirability for research into its influence on the strength and quality of welds.

Author Contributions

Conceptualization, M.K.; Methodology, M.K., J.K. and M.P.; Validation, J.K. and M.P.; Resources, M.K.; Data curation, M.K.; Writing—original draft, M.K.; Writing—review & editing, J.K. and M.P.; Visualization, M.K. and J.K. All authors have read and agreed to the published version of the manuscript.

Funding

The presented research results were funded by grants for education allocated by the Ministry of Higher Education in Poland.

Data Availability Statement

The original contributions presented in this study are included in the article. Further inquiries can be directed to the corresponding author.

Conflicts of Interest

The authors declare no conflict of interest.

References

  1. Maria Obłój-Muzaj, M.; Świerz-Motysia, B. Polichlorek Winylu; WNT: Warsaw, Poland, 2016. [Google Scholar]
  2. Letcher, T. Plastic Waste and Recycling: Environmental Impact, Societal Issues, Prevention, and Solutions, 1st ed.; Academic Press: New York, NY, USA, 2020. [Google Scholar]
  3. Bhatia, S. Natural Polymers vs. Synthetic Polymer. In Natural Polymer Drug Delivery Systems; Springer: Cham, Switzerland, 2016. [Google Scholar] [CrossRef]
  4. Kumar, A.; Gupta, R.K. Fundamentals of Polymer Engineering, 3rd ed.; CRC Press: Boca Raton, FL, USA, 2018. [Google Scholar] [CrossRef]
  5. Shrivastava, A. Introduction to Plastics Engineering; William Andrew: New York, NY, USA, 2018. [Google Scholar]
  6. Carraher, C.E., Jr. Introduction to Polymer Chemistry, 4th ed.; CRC Press: Boca Raton, FL, USA, 2017. [Google Scholar] [CrossRef]
  7. Haque, M.S.; Siddiqui, M.A. Plastic Welding: Important Facts and Developments. Am. J. Mech. Ind. Eng. 2016, 1, 15–19. Available online: https://www.researchgate.net/publication/311544789_Plastic_Welding_Important_Facts_and_Developments (accessed on 15 March 2025).
  8. Konstantinov, A.; Aksenov, I. Engineering Method for Calculating Temperature Deformations of PVC Window Profiles with a Reinforcing Steel Core. Buildings 2023, 13, 1466. [Google Scholar] [CrossRef]
  9. Publications Office of the European Union. The Use of PVC (Poly Vinyl Chloride) in the Context of a Non-Toxic Environment; Publications Office of the European Union: Luxembourg, 2022. [Google Scholar]
  10. Wygoda, M.; Paprocki, M.; Adamczyk, W. Influence of the Welding Process on the Quality of PVC Frames. Manuf. Technol. 2022, 22, 356–366. [Google Scholar] [CrossRef]
  11. Potente, H.; Schnieders, J. Influence of Process Parameters on the Phenomenon of Stress Cracking during Hot Plate Welding. J. Reinf. Plast. Compos. 2002, 21, 489–496. [Google Scholar] [CrossRef]
  12. PN-EN 514:2018; Plastics–Poly(Winyl Chloride) (PVC) Based Profiles–Determination of the Strength of Welded Corners and T-Joints. Polish Committee for Standardization: Warsaw, Poland, 2018.
  13. PN-EN 12608-1:2016+A1:2020; Unplasticized Poly(vinyl chloride) (PVC-U) Profiles for the Fabrication of Windows and Doors-Classification, Requirements and Test Methods-Part 1: Non-Coated PVC-U Profiles with Light Coloured Surfaces. Polish Committee for Standardization: Warsaw, Poland, 2021.
  14. Postawa, P.; Stachowiak, T.; Gnatowski, A. Strength Analysis of Welded Corners of PVC Window Profiles. IOP Conf. Ser. Mater. Sci. Eng. 2017, 225, 012003. [Google Scholar] [CrossRef]
  15. Villegas, I.F. In situ monitoring of ultrasonic welding of thermoplastic composites through power and displacement data. J. Thermoplast. Compos. Mater. 2015, 28, 66–85. [Google Scholar] [CrossRef]
  16. Sánchez, H.; Sánchez, P.; Estrems, M. SCADA System Improvement in PVC High-Frequency Plastic Welding. Int. J. Adv. Manuf. Technol. 2009, 40, 84–94. [Google Scholar] [CrossRef]
  17. Tsujino, J.; Tanaka, R.; Ueoka, T.; Hongoh, M.; Onoguchi, R. Ultrasonic Plastic Welding Using Fundamental and Higher Resonance Frequencies. Ultrasonics 2002, 40, 375–378. [Google Scholar] [CrossRef]
  18. Hou, M.; Friedrich, K. Resistance Welding of Continuous Glass Fibre-Reinforced Polypropylene Composites. Compos. Manuf. 1992, 3, 153–163. [Google Scholar] [CrossRef]
  19. Ageorges, C.; Ye, L. Resistance Welding of Thermosetting Composite/Thermoplastic Composite Joints. Compos. Part A Appl. Sci. Manuf. 2001, 32, 1603–1612. [Google Scholar] [CrossRef]
  20. Ageorges, C.; Ye, L.; Hou, M. Experimental Investigation of the Resistance Welding for Thermoplastic-Matrix Composites. Part I: heating element and heat transfer. Compos. Sci. Technol. 2000, 60, 1027–1039. [Google Scholar] [CrossRef]
  21. Ageorges, C.; Ye, L.; Hou, M.; Mai, Y. Characteristics of Resistance Welding of Lap Shear Coupons. Part I: Heat transfer. Compos. Part A Appl. Sci. Manuf. 1998, 29, 899–909. [Google Scholar] [CrossRef]
  22. Dashatan, S.; Azdast, T.; Rash-Ahmadi, S.; Bagheri, A. Friction Stir Spot Welding of Dissimilar Polymethyl Methacrylate and Acrylonitrile Butadiene Styrene Sheets. Mater. Des. 2013, 45, 135–141. [Google Scholar] [CrossRef]
  23. Hou, M.; Beehag, A.; Mai, Y.; Yang, M. Resistance Welding of Carbon Fibre Reinforced Thermoplastic Composite Using Alternative Heating Element. Compos. Struct. 1999, 47, 667–672. [Google Scholar] [CrossRef]
  24. Rejman, E.; Kiełbasa, B.; Smusz, R. Influence of the Shape of Reinforcing Window Profiles on the Strength and Torsional Stiffness of Windows. Mechanik 2022, 95, 46–51. [Google Scholar] [CrossRef]
  25. Iliev, V.; Geshkova, Z.Y.; Ivanov, R.; Samichkov, V. Constitutive Model of Unplasticized Polyvinyl Chloride for Numerical Stress-Strain Analysis. Sci. Eng. Educ. 2020, 5, 3–8. Available online: https://www.researchgate.net/publication/347257058_Constitutive_Model_of_Unplasticized_Polyvinyl_Chloride_for_Numerical_Stress-Strain_Analysis (accessed on 15 March 2025). [CrossRef]
  26. Smusz, R.; Bałon, P.; Kiełbasa, B.; Rejman, E.; Bembenek, M.; Kowalski, Ł. Experimental and Numerical Characterization of Thermal Bridges in Windows. Adv. Sci. Technol. Res. J. 2023, 17, 315–331. [Google Scholar] [CrossRef]
  27. PN-EN 12519:2018-10; Windows and Doors—Terminology. Polish Committee for Standardization: Warsaw, Poland, 2018.
  28. Moumtzakis, A.; Zoras, S.; Evagelopoulos, V.; Dimoudi, A. Experimental Investigation of Thermal Bridges and Heat Transfer through Window Frame Elements at Achieving Energy Saving. Energies 2022, 15, 5055. [Google Scholar] [CrossRef]
  29. Aksenov, I.; Konstantinov, A.; Verkhovsky, A. Numerical Analytic Method for Calculation of PVC Window Profiles Temperature Deformation. Build. Reconstr. 2022, 102, 3–14. Available online: https://www.researchgate.net/publication/363814389_NUMERICAL_ANALYTIC_METHOD_FOR_CALCULATION_OF_PVC_WINDOW_PROFILES_TEMPERATURE_DEFORMATION (accessed on 15 March 2025). [CrossRef]
  30. Feng, F.; Kunwar, N.; Cetin, K.; O’Neill, Z. A Critical Review of Fenestration/Window System Design Methods for High-Performance Buildings. Energy Build. 2021, 248, 111184. [Google Scholar] [CrossRef]
  31. Aksenov, I.; Konstantinov, A. Temperature Deformations of PVC Window Profiles with Reinforcement. Int. J. Comput. Civ. Struct. Eng. 2022, 18, 98–111. [Google Scholar] [CrossRef]
  32. Saadatian, S.; Freire, F.; Simões, N. Embodied Impacts of Window Systems: A Comparative Assessment of Framing and Glazing Alternatives. J. Build. Eng. 2021, 35, 102042. [Google Scholar] [CrossRef]
  33. Kozielczyk, M.; Mencel, K.; Kowalczyk, J.; Paczkowska, M. Selection of Processing Methods and Parameters for Composite Inserts in Window Profiles with Regard to the Strength of Their Welds. Materials 2025, 18, 44. [Google Scholar] [CrossRef]
  34. Kozielczyk, M.; Mencel, K.; Kowalczyk, J.; Paczkowska, M. Analysis of the Strength and Quality Properties of Welded PVC Profiles with Glass Fiber Composite Reinforcement in the Context of Milling and Weld Head Feed. Materials 2025, 18, 1297. [Google Scholar] [CrossRef]
  35. IDEAL 7000; Aluplast GmbH Kunststoff-Fenstersysteme. Aluplast GmbH: Karlsruhe, Germany, 2020.
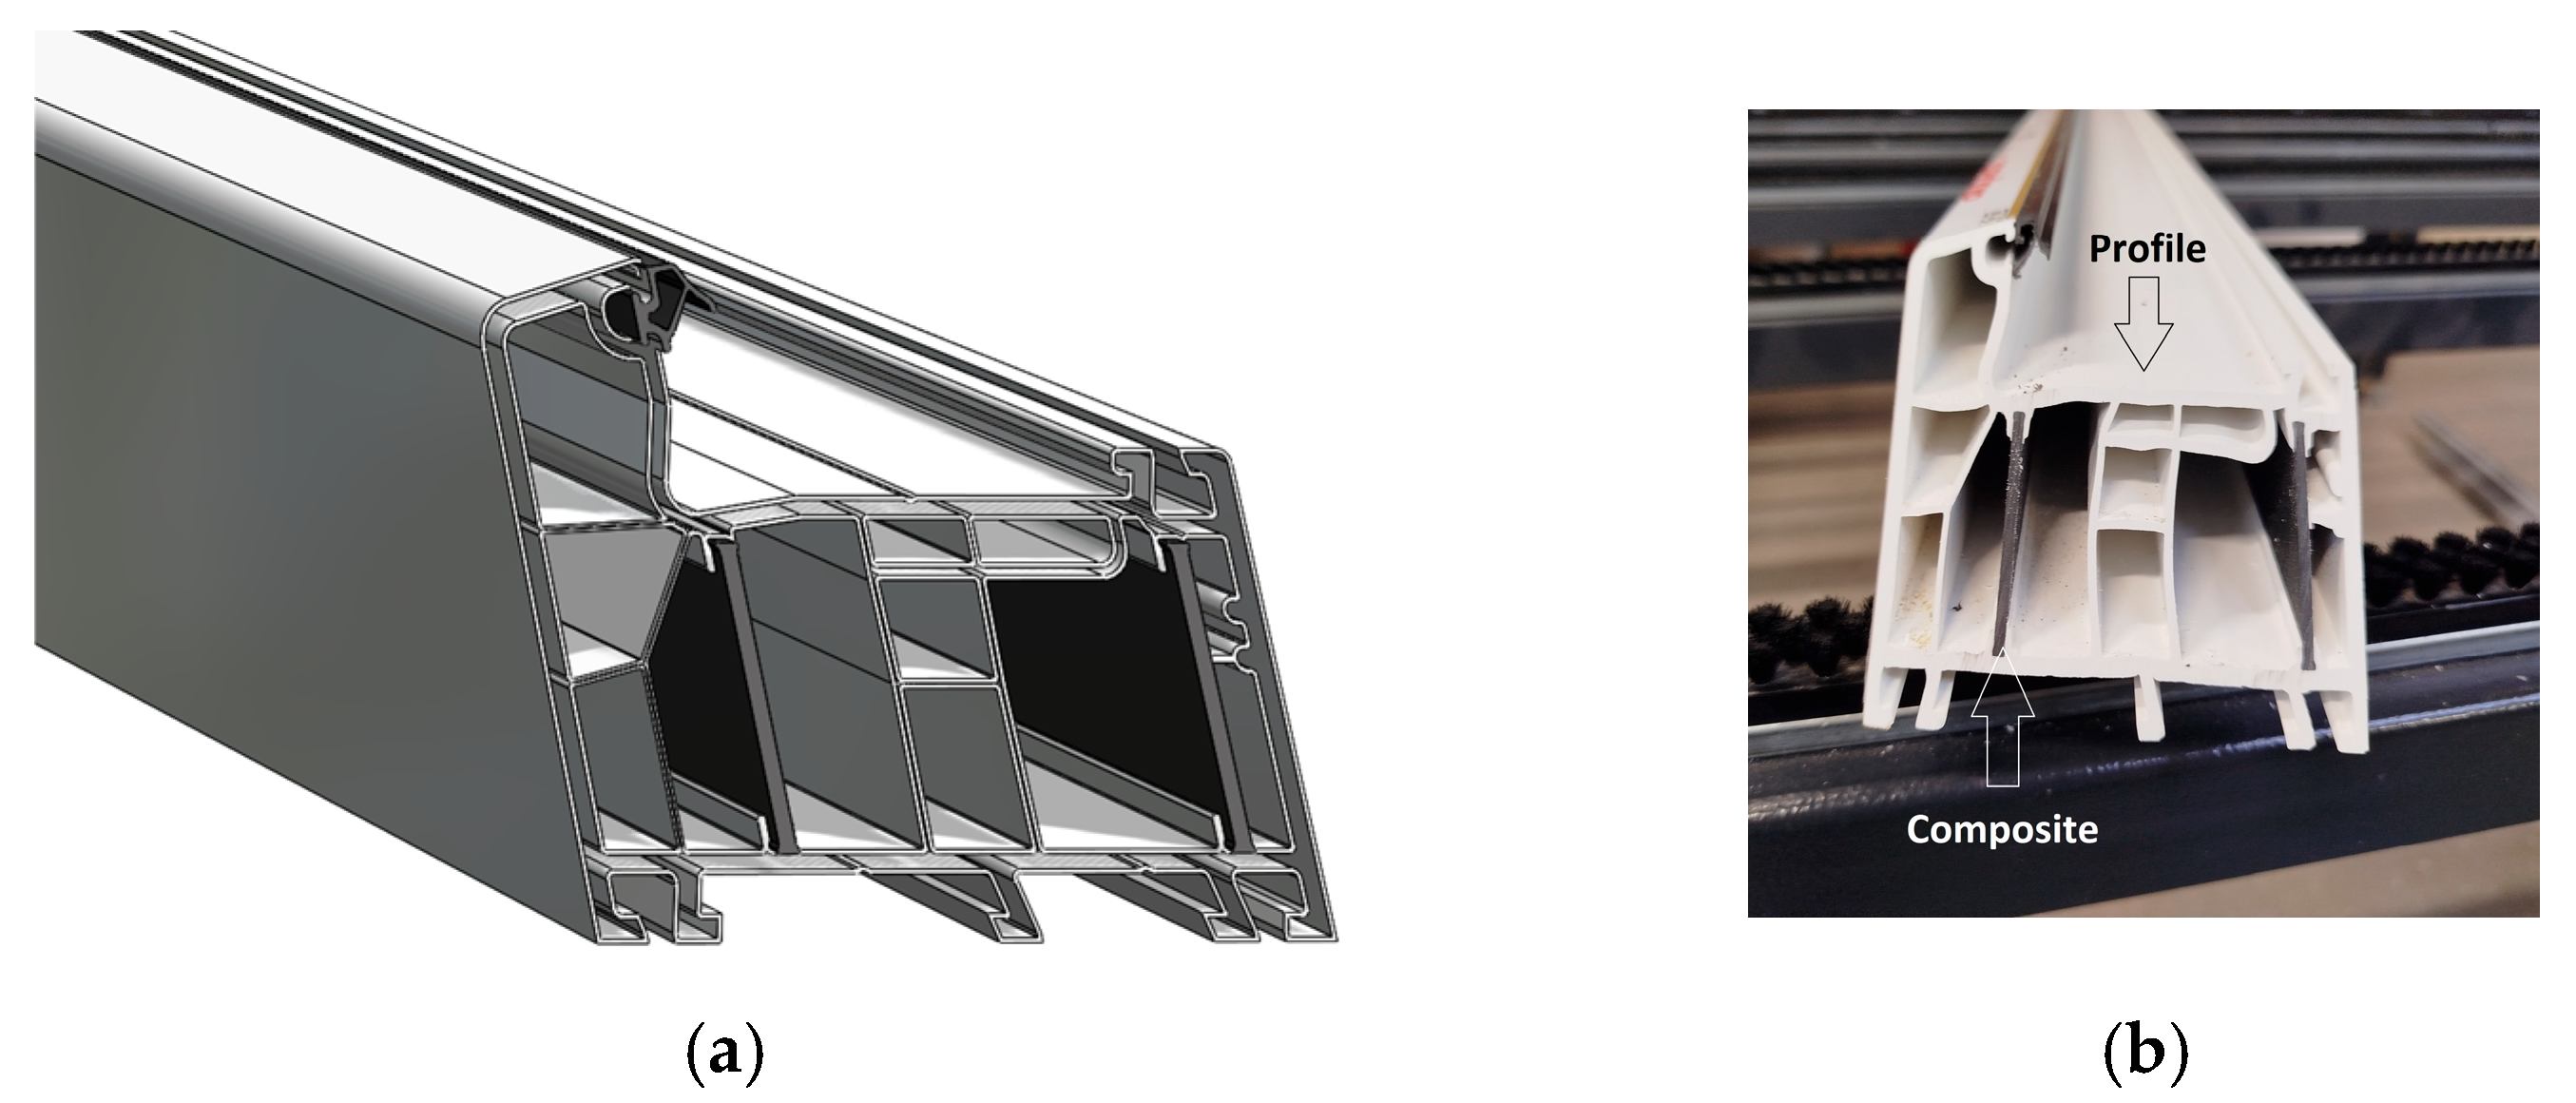
Figure 1. Model of the tested profiles (a) and view of the composite inserts (b).
Applsci 15 11024 g001
Figure 2. Machining the profile: cutting diagram (a), profile with composite milling head (b), visualisation of disc cutters on milling machine heads (c), profile with a fibreglass composite insert (left profile), and the area of the composite insert that has been milled is marked (right profile) (d).
Applsci 15 11024 g002aApplsci 15 11024 g002b
Figure 3. The 4-head welding machine used in the study.
Applsci 15 11024 g003
Figure 4. LN2000 corner breaker. View of the sample after testing.
Applsci 15 11024 g004
Figure 5. Comparison of the average failure loads of sets of specimens, in the context of a given melting time, for a milling depth of the glass fibre reinforced composite of 1 mm.
Applsci 15 11024 g005
Figure 6. View of welding seams of heads: first head (a), fourth head (b).
Applsci 15 11024 g006
Figure 7. Comparison of the average failure loads of sets of specimens, in the context of a given melting time of 22 s, for different milling depths of the glass fibre reinforced composite.
Applsci 15 11024 g007
Figure 8. View of welding seams of heads: second head (a), third head (b).
Applsci 15 11024 g008
Table 1. A set of research options carried out.
Set Melting Time s
2122232425
Milling depth of the composite mm0.0 X
0.5 X
1.0XXXXX
Table 2. Summary of selected weld quality results for a composite milling depth of 1 mm.
Melting Time [s]2524232221
Compliance with the expected value of minimum fracture loads on individual weldsYesYesYesYesYes
Dimensional conformityYesYesYesYesNo
Table 3. Summary of selected weld quality results for a given welding time of 22 s and different milling depths of the composite.
Milling Depth of Composite Reinforcement [mm]1.00.50.0
Compliance with the expected value of minimum
fracture loads on individual welds
YesNoNo
Dimensional conformityYesNoNo
Table 4. Dimensional tolerances of individual sample sets.
Welding Process Conditions
[Melting Time; Milling Depth]
Sample No.
Dimensional Deviations from Nominal Size in the X; Y Axes [mm]
123456
25 s; 1 mm1; 10; 11; 11; 11; 11; 1
24 s; 1 mm1; 11; 11; 11; 11; 11; 1
23 s; 1 mm1; 10; 11; 11; 11; 10; 1
22 s; 1 mm1; 11; 11; 11; 11; 10; 1
21 s; 1 mm2; 22; 22; 22; 22; 22; 2
22 s; 0.5 mm2; 21; 21; 2
22 s; 0 mm2; 22; 22; 2
Disclaimer/Publisher’s Note: The statements, opinions and data contained in all publications are solely those of the individual author(s) and contributor(s) and not of MDPI and/or the editor(s). MDPI and/or the editor(s) disclaim responsibility for any injury to people or property resulting from any ideas, methods, instructions or products referred to in the content.