1. Introduction
In many cases in scientific, engineering, and industrial fields, there is a need to test scaled-down real-life objects under laboratory conditions. When referring to aerodynamic phenomena, wind tunnels are inseparable from achieving the above-mentioned goal, enabling airflow simulation over an object and recreating the aerodynamic environment in a laboratory. These devices offer a controllable, repeatable, and adjustable flow environment. They are applicable across a wide range of fields, including aerospace, automotive, civil, and structural engineering, as well as biological research, sports science, and metrology. This diversity of applications necessitates variations in wind tunnel design, depending on the characteristics of the object under investigation. Research on wind tunnel performance, flow uniformity, calibration procedures, and measurement uncertainty remains an active field, as these factors directly affect the accuracy and reliability of experimental data. Recent studies have highlighted the importance of improved flow characterization and uncertainty quantification, particularly in the context of evolving testing standards and precision measurement requirements [
1,
2,
3].
The canonical configuration of a wind tunnel components, listed in the order through which the airflow passes, is the settling chamber, contraction, test sections diffuser, and drive section. Application-specific adaptations in wind tunnel design involve modifications to component geometry such as lengths, scales, and shapes, as well as the selection and integration of flow conditioning devices, including screens, honeycombs, and turbulence grids. Additional considerations include the choice of flow circuit configuration (open- or closed-circuit), the design of the test section (open-type or closed-type), and incorporation of environmental conditioning systems such as temperature control, low-pressure reservoirs for altitude simulation, and spray nozzles for icing studies.
The length of the nozzle influences boundary layer development along the nozzle walls and into the test section, making it a critical parameter for achieving flow uniformity. As explained in the research by Kosiak et al. [
4] and Kumar & Kumar [
5], long nozzles provided uniform flow but with higher losses and thicker boundary layers [
5]. Short nozzles had lower losses but more velocity variation and risk of flow separation [
4]. Durmus found that the nozzle contraction length of 2 times the inlet hydraulic radius provided the most effective configuration in terms of flow uniformity and boundary layer thickness [
6].
A contraction block is one of the critical components of a wind tunnel. Kao et al. investigated different types of contraction blocks and found that the octagonal cross-sectional shape offers the best performance, followed by circular and square shapes [
7]. The converging angle of a contraction nozzle plays a critical role in governing boundary layer development, flow stability, and overall aerodynamic resistance. Li et al. showed that the stability of the radial flow velocity increases as the contraction ratio decreases [
8]. However, to mitigate manufacturing complexity and cost, a contraction ratio of around 10 is commonly regarded as a practical compromise, providing high-quality flow in non-complex wind tunnel configurations. These findings are supported by Sabnis et al., who demonstrated that a converging angle of 15°, combined with a throat length equal to three times the outlet diameter, provides an optimal balance, minimizing flow resistance, reducing fluctuations, and generating a stable, extended flow core at low speeds [
9].
Another key consideration in wind tunnel design is the selection between open-loop and closed-loop configurations. Open-loop tunnels offer simpler design, easier maintenance, and lower construction costs; however, they typically exhibit reduced flow stability and higher turbulence levels [
10]. In contrast, closed-loop wind tunnels provide enhanced control and efficiency, enabling precise regulation of flow conditions while achieving significantly lower turbulence intensity and improved flow stability [
11].
Additionally, wind tunnels may feature open or closed-type test sections, each leading to significant performance and application potential differences. Open test sections allow the flow to develop without confinement by the walls, thereby better approximating free-stream conditions encountered in real-world environments. However, they are more susceptible to ambient disturbances, jet boundary instabilities, and increased sensitivity to environmental conditions, which lead to non-uniform flow distributions [
12].
In contrast, closed-test sections confine the flow within solid walls, enabling more precise control of airflow conditions and reducing external interferences. This configuration is advantageous for achieving high flow uniformity and measurement accuracy; however, it is more prone to blockage effects when inserting the test model (the device under test, DUT) inside, leading to flow distortion and pressure gradients [
11].
Depending on the test section design, circular, rectangular, or octagonal cross-sections are the most commonly used in wind tunnels [
13,
14,
15]. Circular cross-sections provide better flow homogeneity, enhancing measurement accuracy and reducing velocity variations compared to rectangular cross-sections [
13]. Octagonal cross-section also shows better flow homogeneity as this shape enhances flow uniformity by minimizing corner effects [
14]. Also, test sections may be larger than the inflow and outflow air pipes. They can be used where low wall interference, good optical access, or accommodation of bulky equipment outweighs the penalties in drive power and background turbulence [
16].
As can be seen from the literature review, wind tunnel performance depends on several design and operational parameters that influence flow quality, stability, and metrological reliability. As wind tunnels are used for various purposes, one of which is the accuracy of reproduction and measurement of air velocity, flow stability, and boundary layer development, play a crucial role, and design elements of the wind tunnel must be carefully chosen to maintain these parameters. In this context, the specialized Göttingen-type closed-circuit subsonic aerodynamic wind tunnel (AWT) with an expanded test section located at the designated institute, the Laboratory of Heat Equipment Research and Testing at the Lithuanian Energy Institute (
Figure 1) was adopted for tests.
In recent years, aerodynamic wind tunnels have been increasingly optimized and diversified to address a wide range of research problems—from metrological applications to automotive applications and emerging fields involving aerodynamics of small-scale and unmanned aircraft systems. Among these research directions, the state of the art of aerodynamic wind tunnels increasingly reflects the growing demand for accurate aerodynamic studies of small unmanned aerial vehicles (UAVs). Although many existing wind tunnels were initially designed for conventional industrial testing, their optimization and adaptation for UAV-scale flow conditions have become an important research topic due to the challenges posed by low-to-moderate Re and complex propeller–wake interactions. Achieving the necessary flow uniformity and precise control of boundary-layer behavior requires optimal CN geometries and advanced flow measurement methodologies [
17,
18]. Modern approaches employ CFD and AI-driven surrogate models to ensure geometry optimization and improve the accuracy of numerical results before physical testing [
19,
20]. From the experimental point of view, uncertainty quantification and cross-facility calibration frameworks are now essential to ensure data comparability between conventional wind tunnels and those meant for aerodynamic UAV testing [
21]. Furthermore, for UAV testing, the design of the AWT test section is undoubtedly important for achieving necessary flow conditions and accurate measurements [
22]. Recent studies demonstrate that integrating high-fidelity aero-structural optimization and adaptive testing can effectively extend the capabilities of existing facilities to UAV-scale experiments, thereby bridging the gap between classical aerodynamic research and emerging UAV technologies [
23]. Therefore, optimizing such AWTs significantly expands the experimental capabilities for future UAV aerodynamic research.
This study employs a combined CFD and experimental investigation across a velocity range of 0.05 to 20 m/s. Results demonstrated that a properly contoured convergent nozzle (CN) not only suppresses inlet turbulence but also renders the core flow largely insensitive to Reynolds-number variation across the entire operating range. Under CN-stabilized conditions, an optimum outlet-to-inlet diameter ratio of 1.10 was identified for the mildly divergent test section, effectively suppressing flow separation. This constitutes the first quantitative, geometry-dependent design guideline that fulfills flow stability criteria for this type of AWT with an expanded test section.
3. Results and Discussion
3.1. Velocity Distribution in AWT
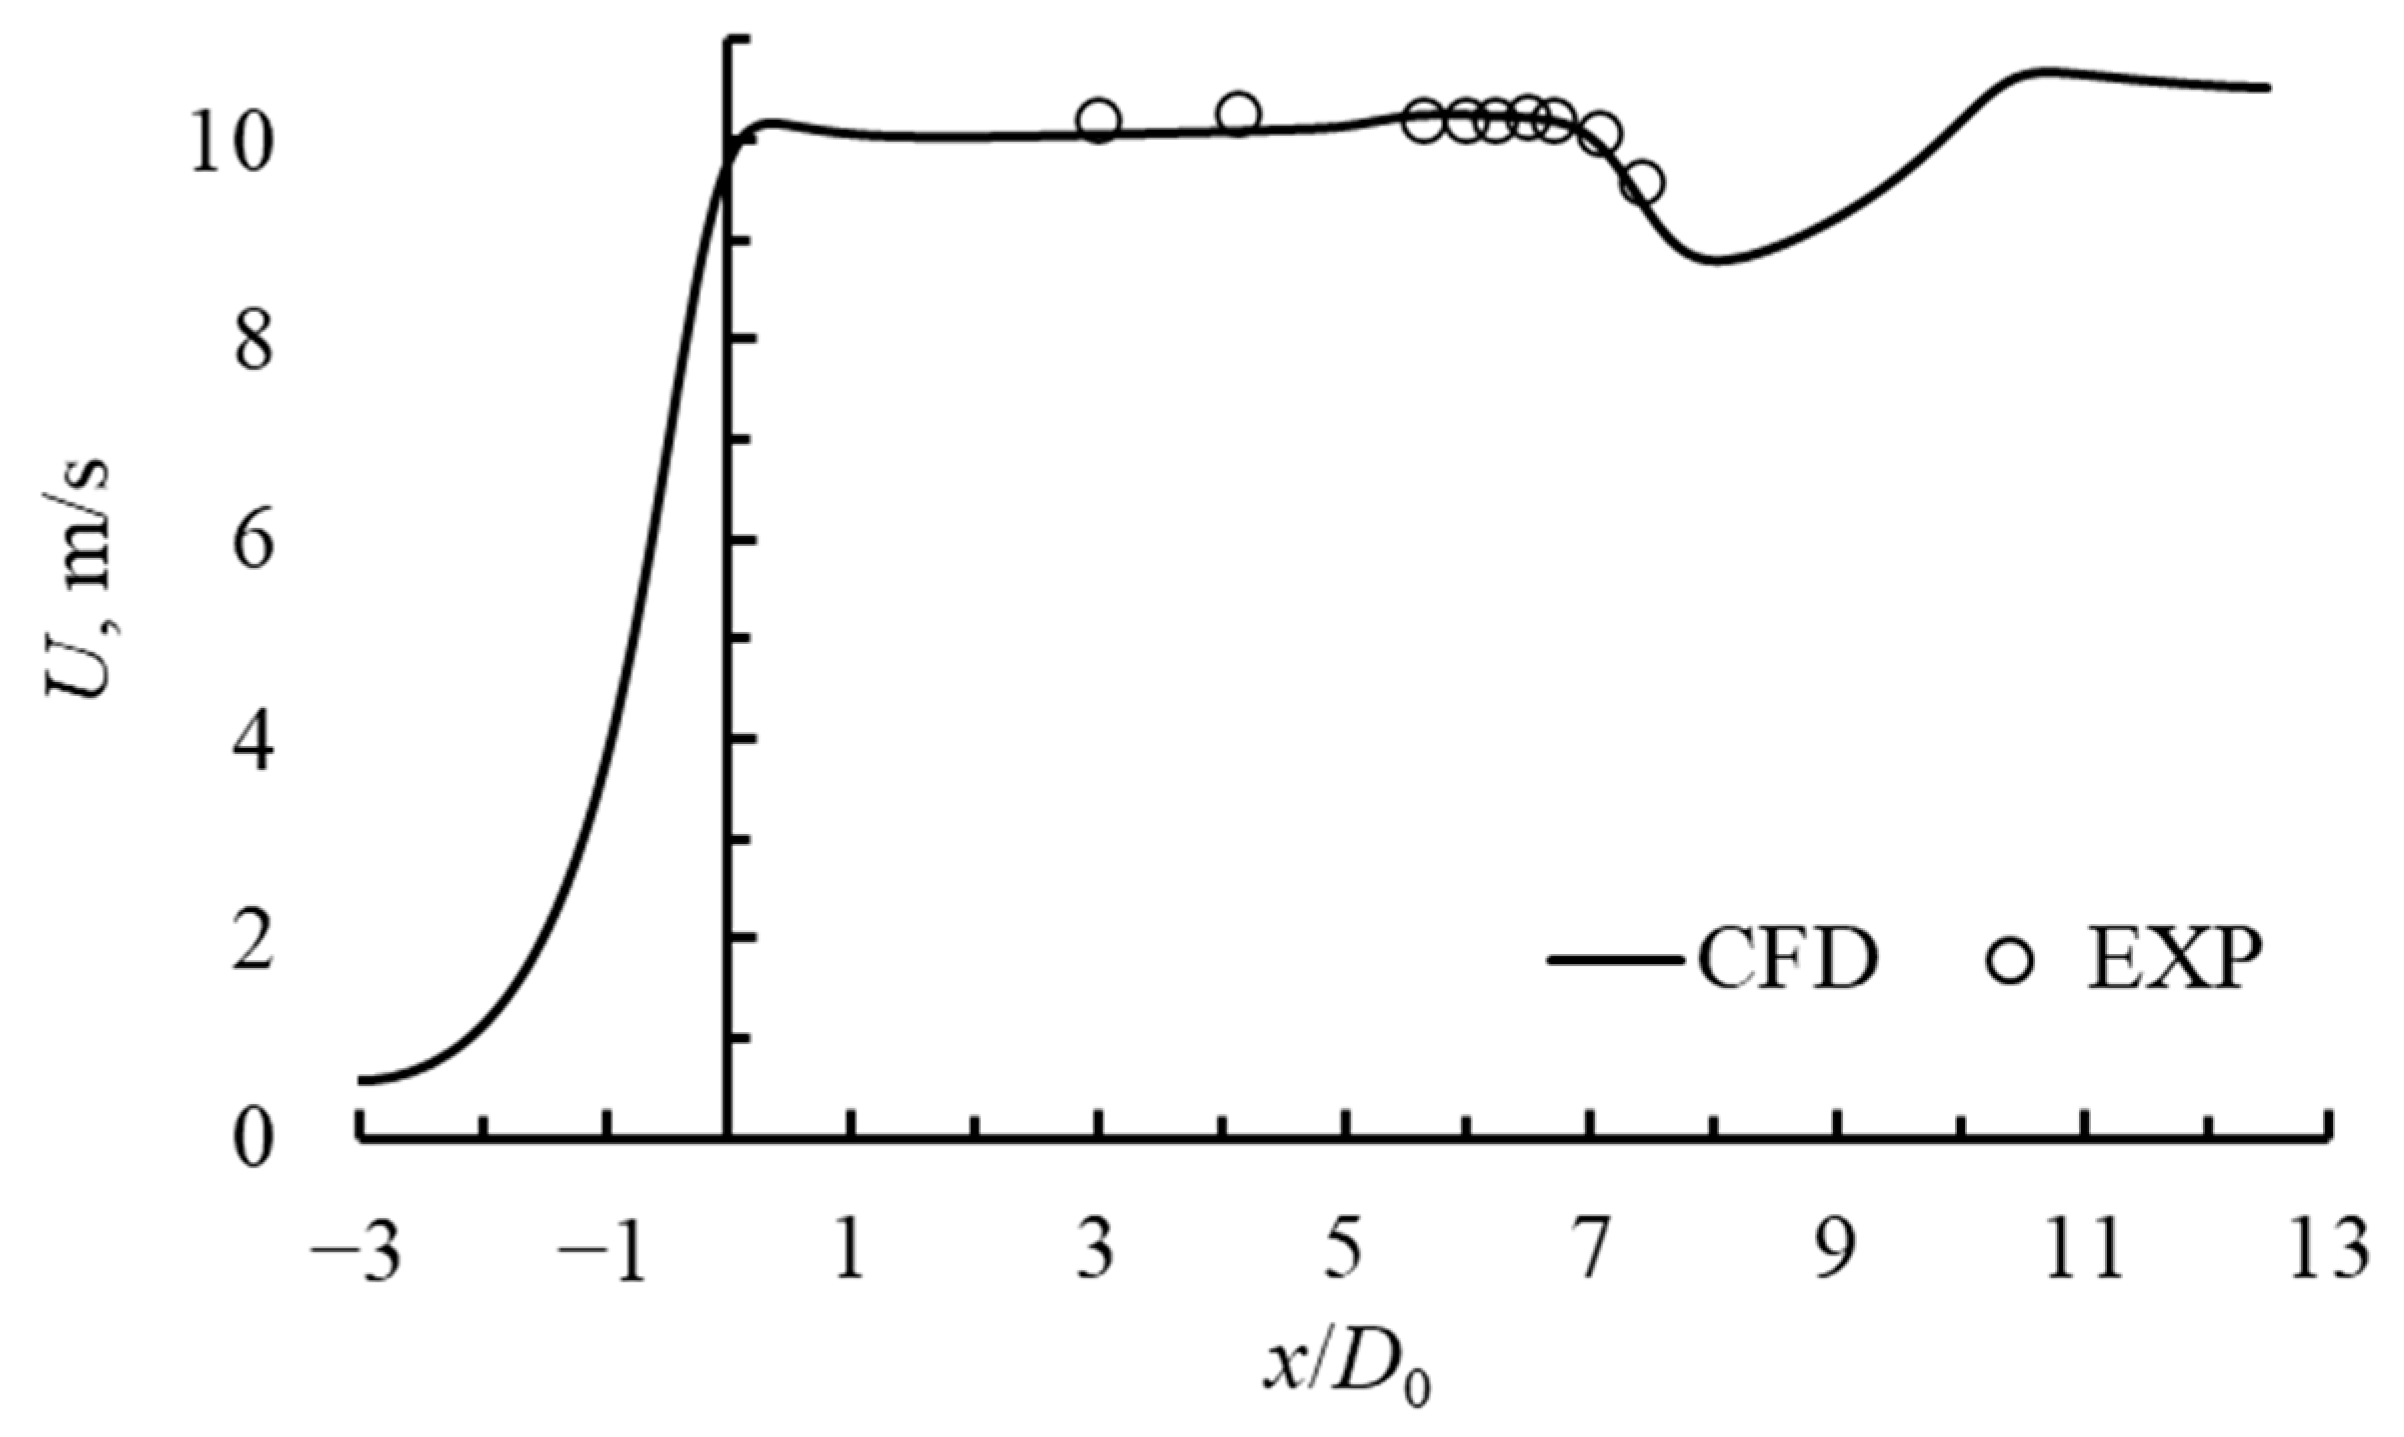
Both numerically simulated and experimentally measured axial velocity at the centerline of an aerodynamic wind tunnel (AWT) are demonstrated in
Figure 2. In the CN region −3 <
x/
D0 < 0, as the flow approaches the nozzle exit (at
x/
D0 ≈ 0), a significant acceleration occurs due to a pressure drop caused by the area reduction in this converging section. This leads to an increase in axial velocity, a known characteristic of CN. Immediately downstream of the nozzle, where the cross-section reaches a stable value, the boundary layer on the pipe wall is still developing. This explains the higher central velocity observed at 0 <
x/
D0 < 1. In the following UA measurement pipe region 1 <
x/
D0 < 5, the flow reaches a nearly uniform velocity, which indicates the establishment of a core region with minimal shear and turbulence.
The numerical simulation results almost perfectly capture the initial deceleration of the airflow when it enters the measurement chamber. The minor discrepancies observed at x/D0 ≈ 7 indicate the presence of flow disturbances in that area. However, these deviations remain within an acceptable error.
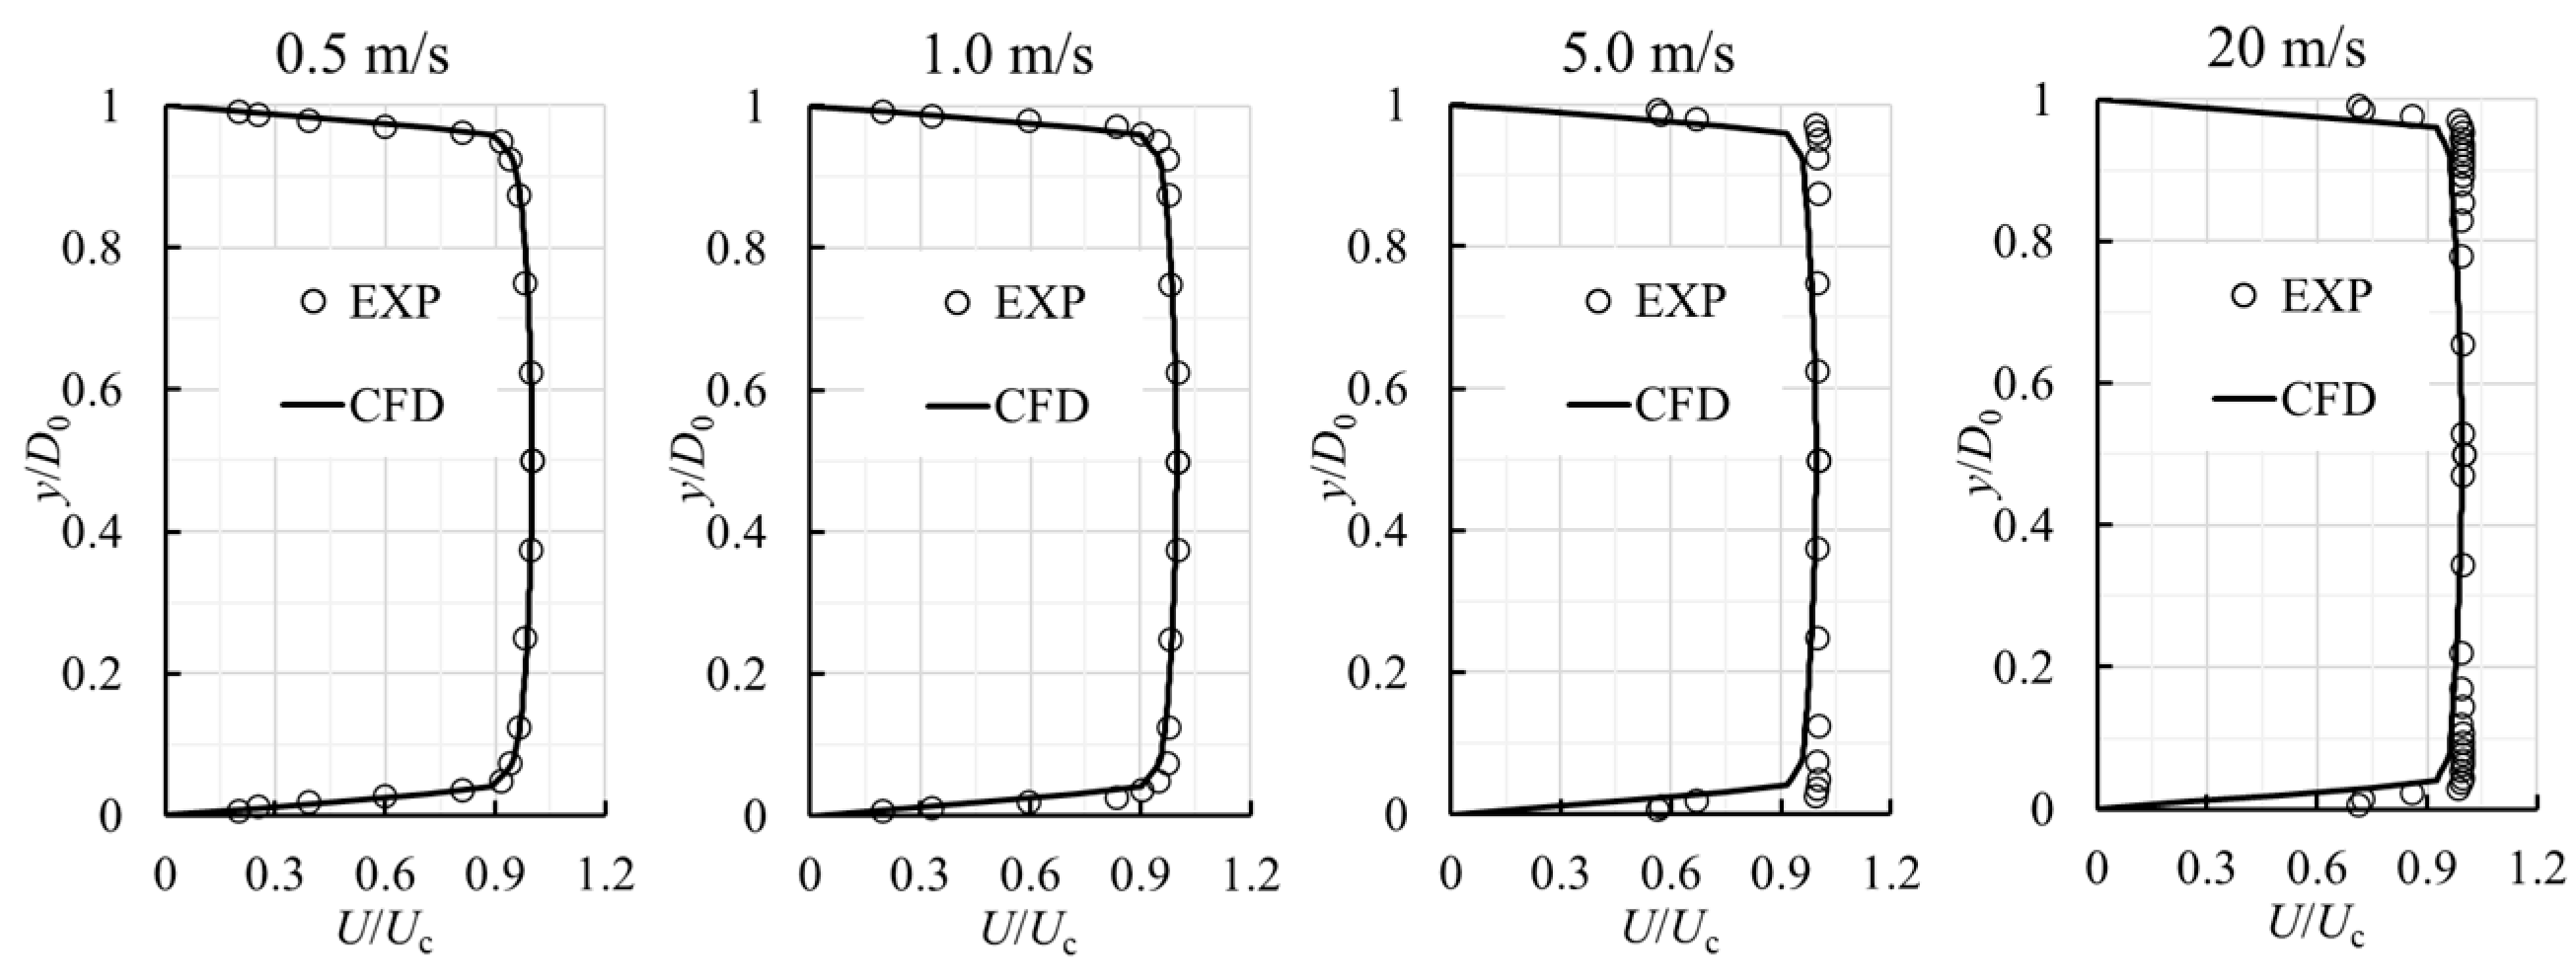
Vertical velocity profiles are given in
Figure 3. To further validate the numerical simulations, the velocity profiles of
x/
D0 = 1 were compared at different streamwise locations. The experimentally measured and numerically simulated velocity profiles showed acceptable agreement in both cases, confirming the correct turbulence model choice for axial and cross-sectional flow characteristics. The agreement of numerical and experimental results is acceptable for using numerical results for analyzing the factors of stable flow distribution along the whole AWT.
3.2. The Convergent Nozzle Influence on the Flow Development
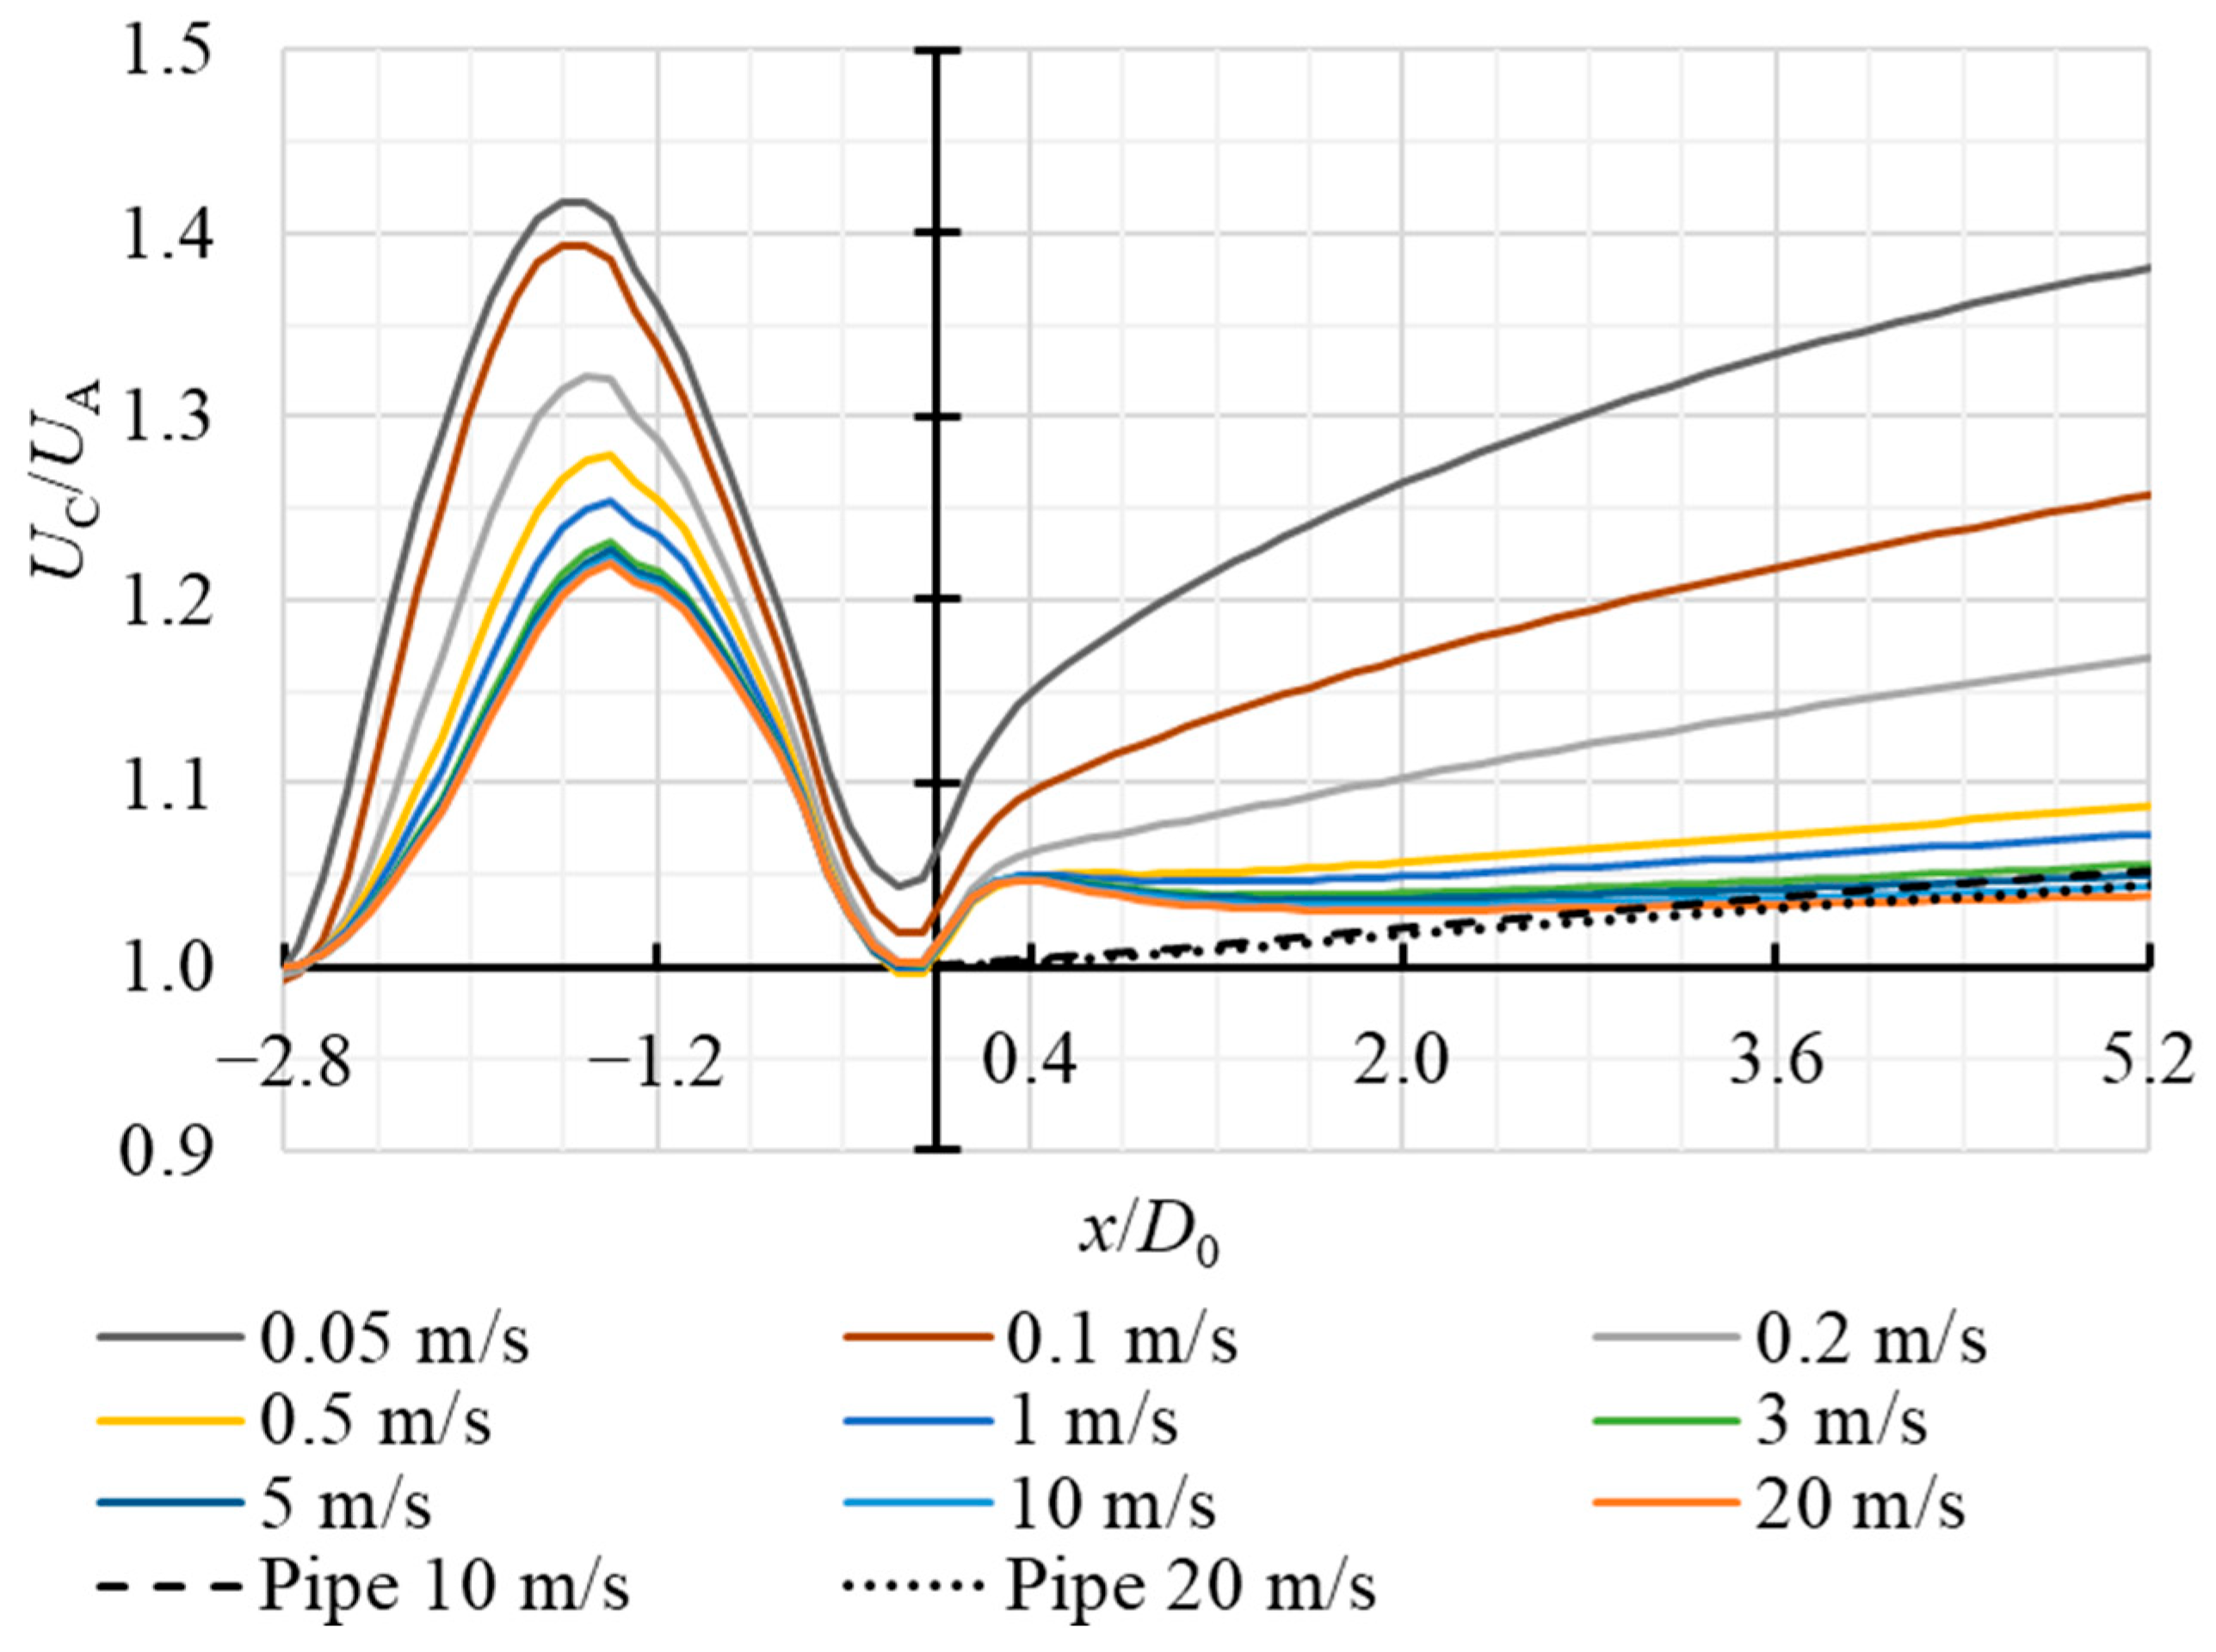
Figure 4 shows the normalized centerline velocity U
C/U
A along the streamwise direction
x/
D0, where U
C is the velocity at the centerline of the AWT and U
A is the mean cross-sectional velocity. The ratio between centerline velocity and mean velocity indicates the flatness of velocity profiles, which is an inherent parameter for the air velocity benchmark facility. The horizontal velocity distribution is given for a range of nominal flow velocities, from 0.05 m/s to 10 m/s, which are measured at
x/
D0 = 3. The velocity values correspond to Re range from 1270 to 255,000, respectively.
All nominal velocity cases show a similar distribution mechanism. The acceleration region is observed within the converging section, where the flow is compressed, and the velocity at the center increases. This velocity peak is observed in the x/D0 range from −1.4 to 1.6, which is caused by the combined effects of geometric contraction and the acceleration caused by the pressure gradient. Afterwards, the velocity rapidly decreases as the flow adjusts to the uniform diameter section of the pipe.
As the nominal velocity increases, the peak in the center velocity becomes less pronounced, and the velocity profiles tend to flatten more quickly. This trend can be explained by turbulence intensification with increasing Re. At lower nominal velocities (e.g., 0.05–0.2 m/s), viscous effects dominate, and the velocity profiles show a more parabolic distribution, which is observed from a less uniform distribution of a center velocity. In contrast, the flow stabilizes faster for higher velocities (5–10 m/s), and the center velocity remains nearly constant after the initial adjustment region of x/D0 = 0.
The relative velocity
UC/
UA plotted against the dimensionless parameter
for different nominal velocities ranging from 1 m/s to 20 m/s are demonstrated in
Figure 5. The parameter
allows for comparing and highlighting the flow development at different velocities. Both cases with a CN and reference data for flow in a pipe at the same nominal velocities are compared.
The results highlight the significant impact of the CN on the flow stabilization process. In all cases, the presence of the nozzle causes a more uniform flow development than the pipe flow without a nozzle. The velocity profiles in the nozzle-assisted flows show lower velocity gradients, but a similar beginning of asymptotic behavior ( wise). The lower velocity gradient indicates a more stable and fully developed longitudinal velocity field over a shorter axial distance. In contrast, the reference pipe flow profiles show larger velocity gradients, particularly at lower . This enhanced stabilization effect is significant in metrology applications involving velocity measurement equipment, where a uniform and predictable flow profile is inherent for accuracy and measurement repeatability. The nozzle effectively preconditions the flow by accelerating and redistributing the velocity field before entering the measurement section, minimizing the influence of upstream disturbances. As shown, across varying inlet velocities, the CN consistently reduces the sensitivity of the flow regardless of Re, resulting in a more reliable and reproducible flow structure.
3.3. Flow Distribution Inside the Test Section
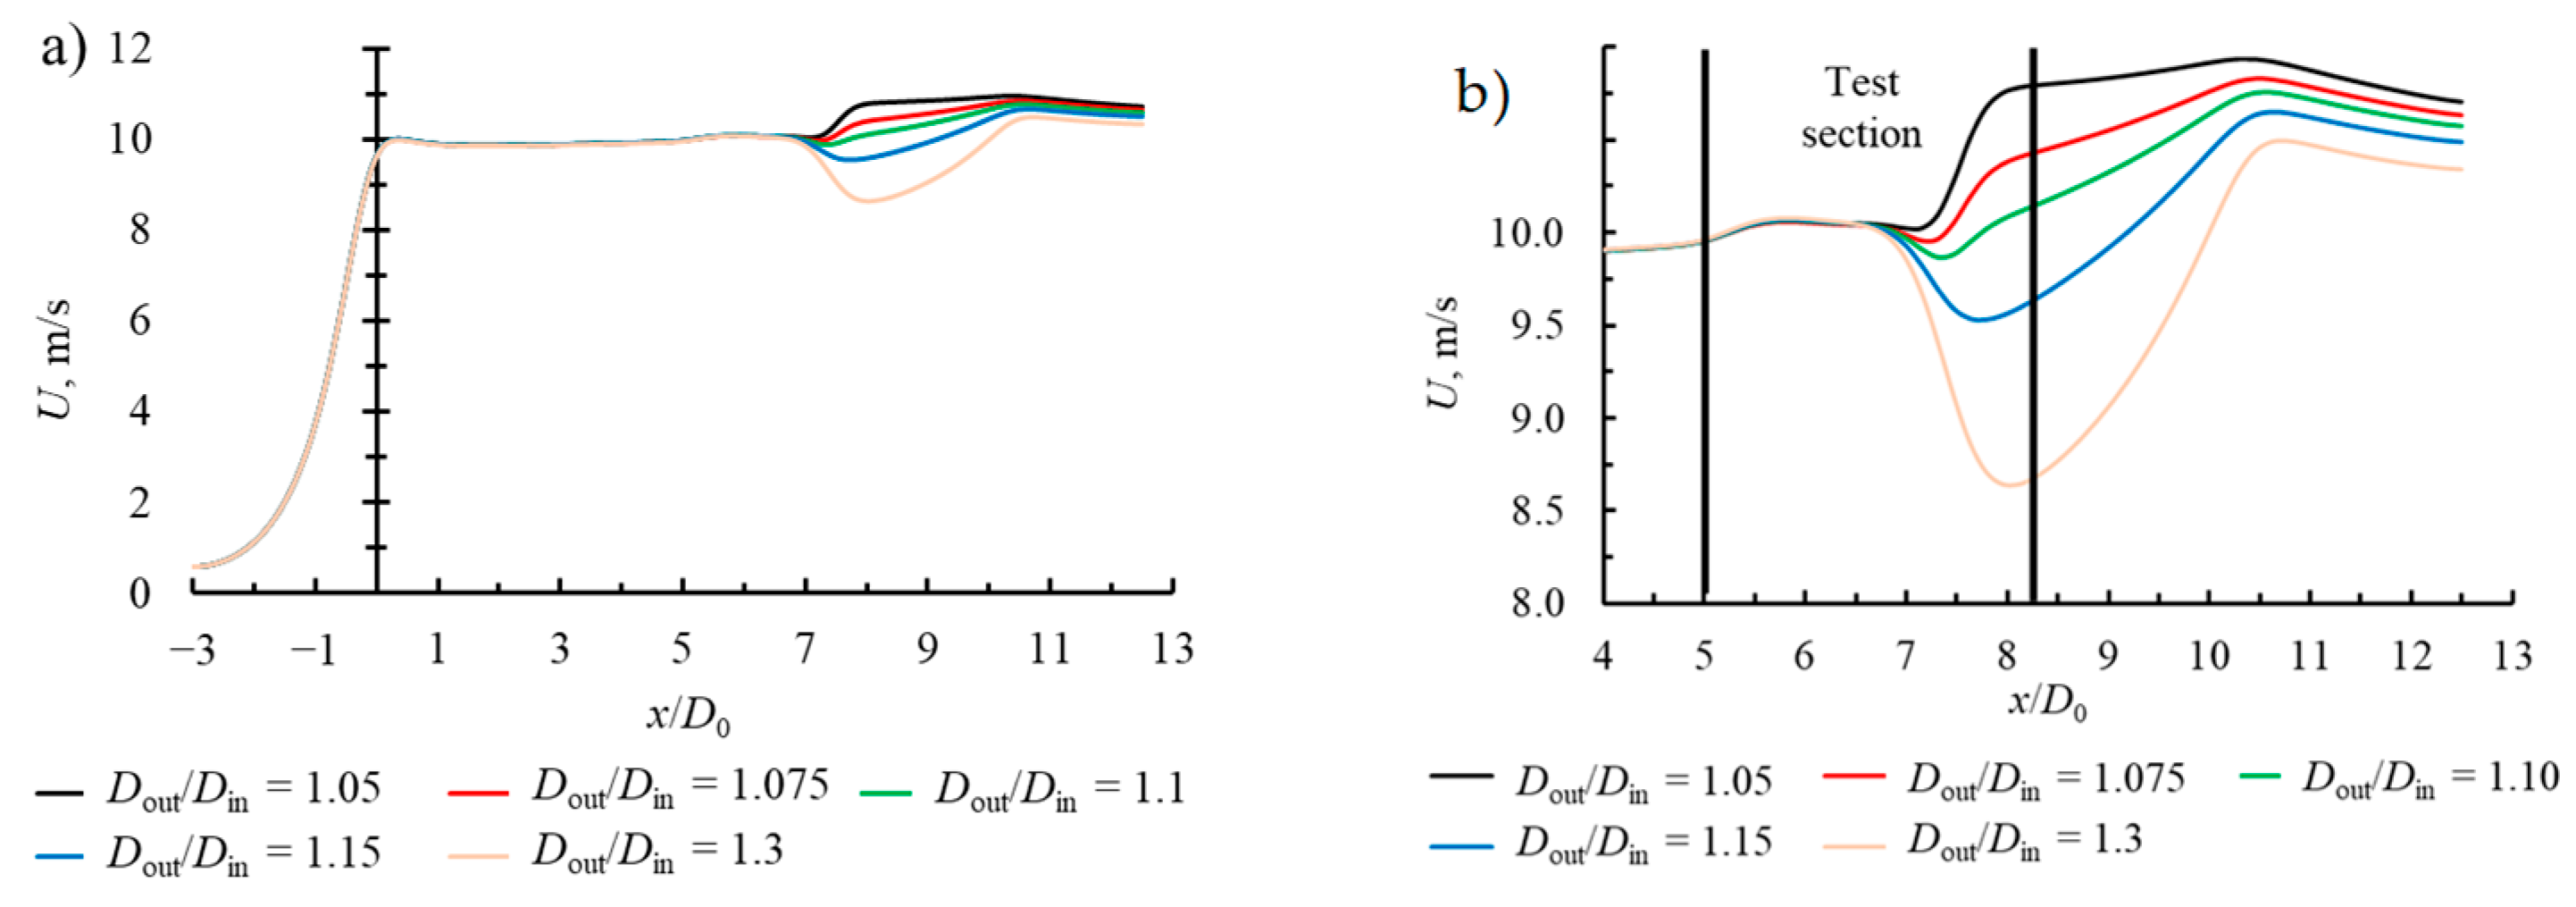
The flow stability along the AWT and the velocity and pressure distribution are presented in
Figure 6 and
Figure 7. The outlet (
Dout) diameter is systematically varied, changing outlet-to-inlet ratio (
Dout/
Din) to study its effect on the axial velocity
U and pressure distribution along the AWT centerline. The velocity distribution shown in
Figure 6 reveals a consistent velocity increase within the nozzle, reaching a near-constant value inside the constant diameter (
D0) pipe section. This is an effect of the CN, which was discussed in the previous section of this work. A characteristic adverse pressure gradient and velocity increase are observed in all cases immediately after flow enters the test section at
x/
D0 = 5, attributed to the abrupt expansion in cross-sectional area at the entrance to the test section. However, significant differences occur upon entering the test section depending on the outlet diameter. The velocity distribution along the centerline in the second half of the test section is governed by the pressure gradient (
Figure 7), which is influenced by changes in cross-sectional area at the outlet of the test section.
The main differences occur at
x/
D0 = 6.5, where either an abrupt increase or decrease in velocity is observed, depending on the flow conditions. The abrupt velocity change is influenced by the pressure distribution and the outlet diameter
Dout. As
Dout increases, the recirculation zone formed at the fore wall becomes smaller in height with a weaker primary vortex. It increases the effective flow cross-section area, leading to a pressure drop and lower maximum velocity. If
Dout is of comparable size with
Din (
Dout/
Din = 1.05–1.1), a stagnation zone with sharp pressure increase is observed on the edge of the fore wall (
Figure 8) indicating local velocity reduction, consequently, it reduces the efficient flow cross-section, leading to an increase in maximum velocity in the centerline (
Figure 9). After the test section, the velocity is inversely proportional to
Dout. It exhibits a high rate of decreases in the case of
Dout/
Din = 1.3 and stabilizes almost instantly after exiting the test section at lower
Dout/
Din.
This analysis is vital since a uniform center velocity distribution is essential for calibrating and testing the velocity meters. Based on these results, the outlet diameter was chosen as Dout = 440 mm, corresponding to Dout/Din = 1.1, as the centerline velocity remains the most uniform along the AWT. These effects collectively explain the observed trend of high centerline velocities at low expansion ratios and highlight the sensitivity of flow dynamics to geometric expansion characteristics. These effects are studied in the following section.
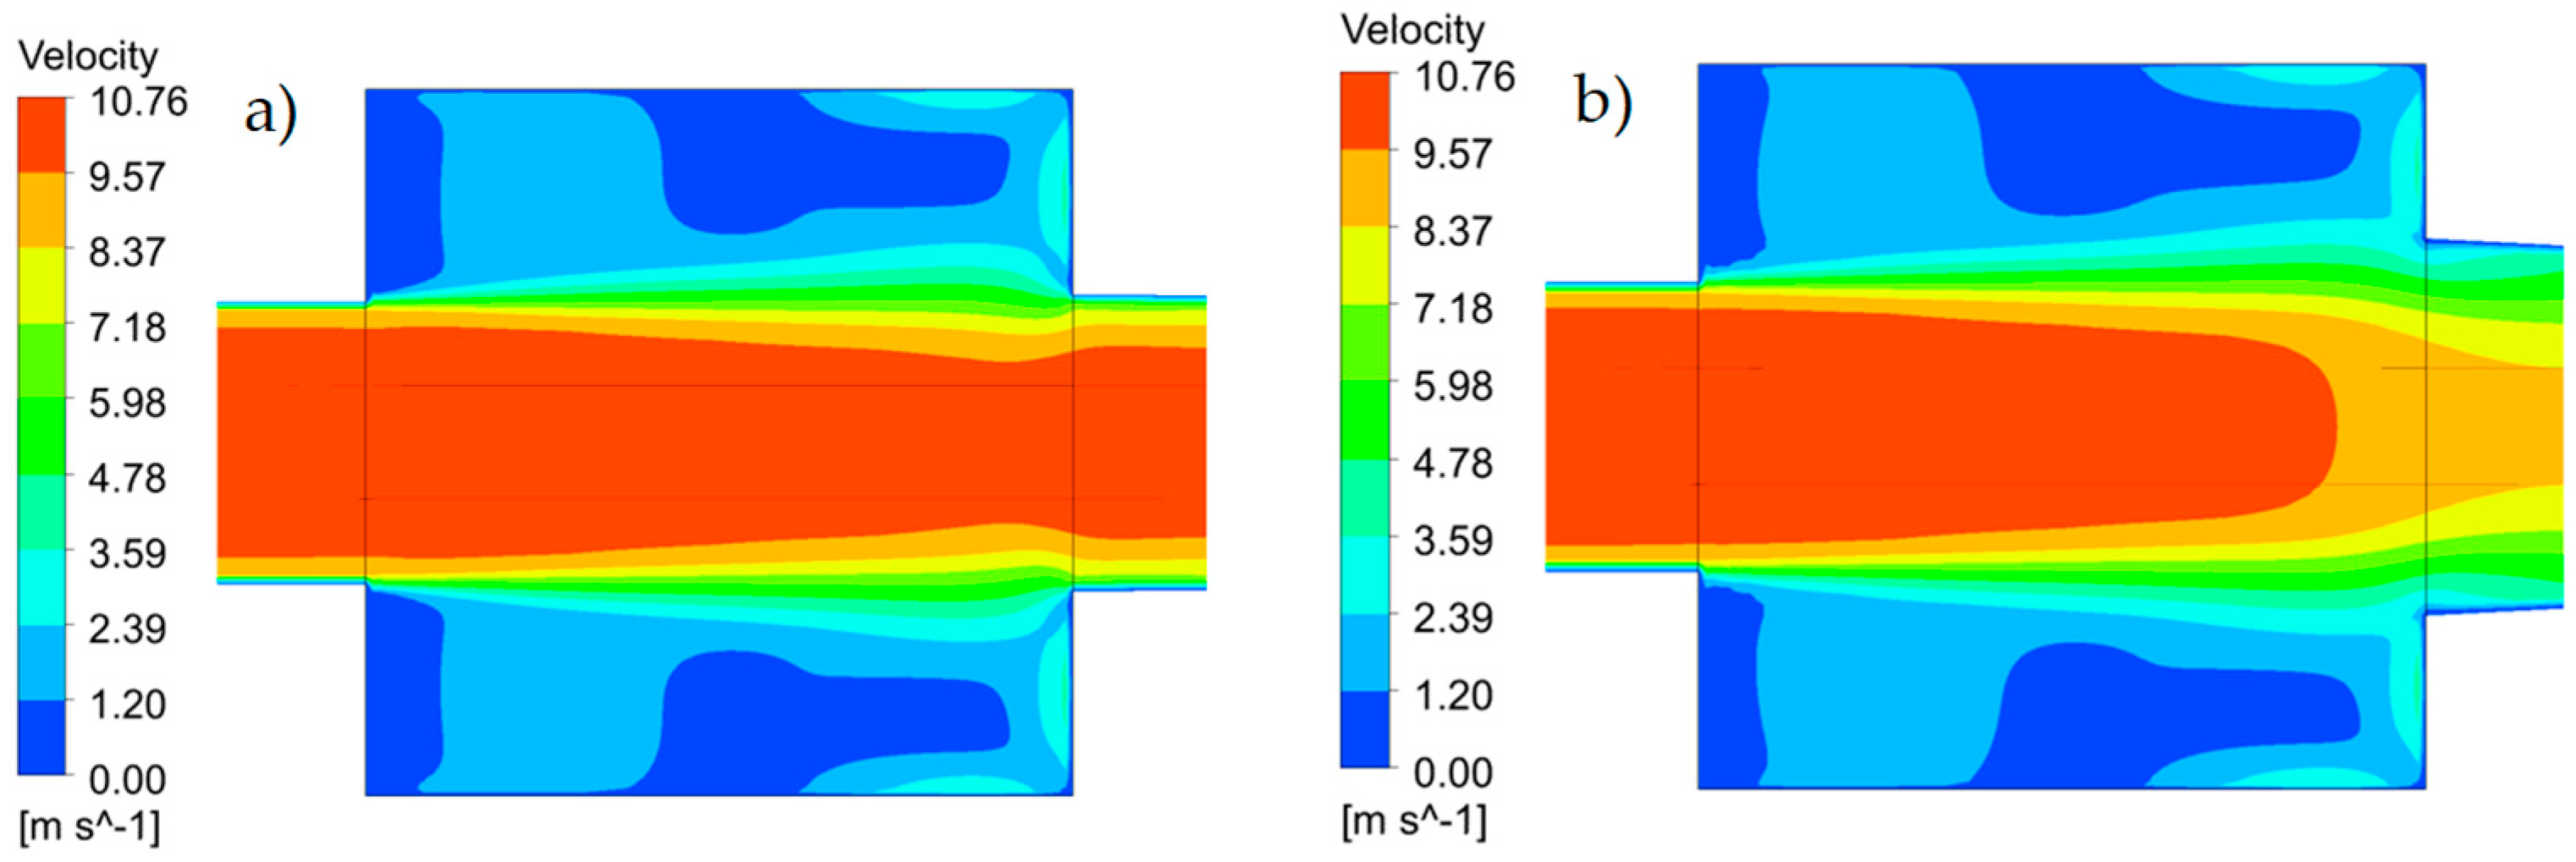
In
Figure 9, the presented velocity contours at two different expansion ratios reveal the flow structure inside the test section and demonstrate the influence of the outlet diameter on the recirculation zones, flow uniformity, and centerline velocity distribution.
In both
Dout/
Din cases, a significant expansion from the inlet to the test section generates a strong adverse pressure gradient downstream of the contraction. It leads to the formation of recirculation zones at the bottom and upper walls of the test section. The streamlines near the walls show reversed flow patterns, indicating the flow separation. These recirculation zones constrain the expansion of the velocity core, resulting in a relatively constant velocity in the initial part of the test section (
Figure 6).
As the flow progresses downstream, x/D0 ≈ 6.5—the pressure and velocity fields begin to diverge depending on the outlet geometry. In the case of x/D0 = 1.3, the expanded outlet increases the effective cross-sectional area, reducing the strength of the recirculation zone but also inducing a strong adverse pressure gradient. This results in a noticeable drop in centerline velocity and inefficient pressure recovery. In contrast, for x/D0 = 1.05, the smaller outlet area leads to a stagnation region at the outlet corner, creating a local pressure rise and funneling effect that accelerates the core flow and maintains higher centerline velocities.
These differences in outlet geometry give rise to distinct pressure loss characteristics. A larger expansion ratio increases turbulence and energy dissipation due to extended recirculation, resulting in higher pressure losses. On the other hand, the smallest expansion ratio preserves dynamic pressure but produces steep velocity gradients, which may introduce measurement uncertainties. The intermediate configuration (x/D0 = 1.1) offers a favorable balance, maintaining flow uniformity and minimizing pressure losses—making it particularly suitable for sensor calibration and flow characterization tasks. These findings align with the anticipated behavior of confined turbulent flows in AWT, underscoring the critical role of geometric parameters in optimizing flow stability for wind tunnel design. The presented results focus on the characterization of flow stability within the test section of the wind tunnel, including a detailed analysis of inlet and outlet flow parameters. These findings provide insight into the development and maintenance of stable flow conditions, which are critical for ensuring measurement accuracy and repeatability in aerodynamic testing. Furthermore, the results have broader applicability beyond the current setup, as they can be extrapolated to other wind tunnel designs and experimental configurations where flow uniformity and stability are essential. This includes applications in environmental wind engineering, aerodynamic calibration, and experimental fluid dynamics, where consistent flow conditions are necessary for reliable performance assessments and data interpretation.

