1. Introduction
With the rapid development of industries such as 5G and the industrial Internet, the electronic component industry, as their fundamental backbone, is experiencing significant opportunities, and intelligent manufacturing has become the core direction of growth [
1]. As key functional devices, pressure-sensitive electronic components require an encapsulation process that is critical to product reliability. However, this process still relies heavily on manual operations, which suffer from low production efficiency and harsh working conditions (e.g., high temperature and toxic environments), severely constraining industrial development [
2]. Deploying industrial robots to replace manual labor and optimizing their layout to enhance overall performance is therefore a key solution [
3,
4].
Robot layout optimization is essentially a complex multi-objective optimization problem. To address such problems, researchers have developed a variety of multi-objective evolutionary algorithms [
5,
6,
7,
8]. Early classical algorithms, such as NSGA-II [
9] and SPEA2 [
10], achieved great success in solving bi-objective or tri-objective problems through fast non-dominated sorting and elitist selection strategies. To handle higher-dimensional objective spaces, NSGA-III [
11] introduced a reference-point-based selection mechanism. Meanwhile, decomposition-based MOEA/D [
12] and swarm-intelligence-based MOPSO [
13] have each demonstrated unique advantages. In recent years, hybrid genetic algorithms have emerged as an important trend for further improving the solution performance of complex problems. In particular, for engineering optimization problems with intricate constraints, hybrid algorithms dedicated to optimal control—such as the Hybrid Evolutionary Algorithm [
14]—have been shown to achieve higher efficiency and stability. For example, Akopov et al. [
15] successfully applied a multi-agent hybrid clustering-assisted genetic algorithm to large-scale reconfigurable network optimization, demonstrating the strong potential of hybrid algorithms in tackling high-dimensional, highly constrained real-world problems.
Meanwhile, robotic layout optimization has advanced across various domains, demonstrating wide applicability. For example, Xidias et al. [
16] proposed the SERobWaS warehouse system, which integrates task scheduling and path and motion planning and uses a genetic algorithm to efficiently manage mobile robot fleets. Similarly, Sánchez-Sosa and Chavero-Navarrete [
17] applied a genetic algorithm to optimize the two-dimensional layout of a screw-fastening cell, effectively reducing workspace area, workstation interference, and robot transfer time.
Through the above review of algorithmic approaches and studies on robotic workcell layout optimization, it is clear that robotic layout optimization is essentially a complex multi-objective optimization problem [
18,
19,
20,
21]. However, existing research still shows obvious limitations when addressing layout problems in specific industrial scenarios. Most prior studies focus on macro-level layouts or on optimizing travel distance/time and have not fully addressed complex situations involving unique multi-layer height differences and spatial path planning. Therefore, the layout optimization of the robotic encapsulation production line studied in this paper exhibits unique complexity and can be regarded as a complex multi-objective optimization problem that integrates the characteristics of optimal control and multi-layer path planning. Its mathematical essence is reflected in the following aspects: typical optimal-control criteria, minimizing total operation time (minimum-time problem) and total motion energy consumption (minimum-energy problem); the pose of the robot base, which serves as a system-level boundary condition and directly affects the overall dynamic performance of the robot’s task trajectories; high complexity, including the robot’s own dynamic limitations (joint limits, torque bounds) [
22] as well as multilayer routing challenges caused by “multi-level height” operations, where the robot must efficiently access multiple work points at different spatial heights [
23] while satisfying strict collision-avoidance and process-pose requirements [
24,
25]. Thus, the problem can be abstracted as finding the optimal robot base pose under strong geometric and dynamic constraints to minimize the time and energy required to complete a specified multi-layer routing task [
26,
27].
After comprehensive consideration, this study adopts the classical NSGA-II algorithm as the core solver to construct a dual-objective optimization model that combines optimal-control characteristics with multi-layer path planning.
Breaking through the limitations of previous work, the proposed improved NSGA-II framework rigorously incorporates robot dynamics constraints as well as strong geometric constraints arising from multi-layer operations, including reachability, precise process-pose requirements, and strict collision avoidance.
This systematic integration of complex engineering constraints ensures the feasibility of the optimized solution in real industrial environments.
Using the WL11 production line of Company X as a practical case study, the proposed method is validated for both effectiveness and engineering applicability, providing a replicable and generalizable solution for robotic layout optimization in similar multi-layer, height-difference scenarios.
2. Research on Layout Optimization of Robot Encapsulation Production Line Based on NSGA-II Algorithm
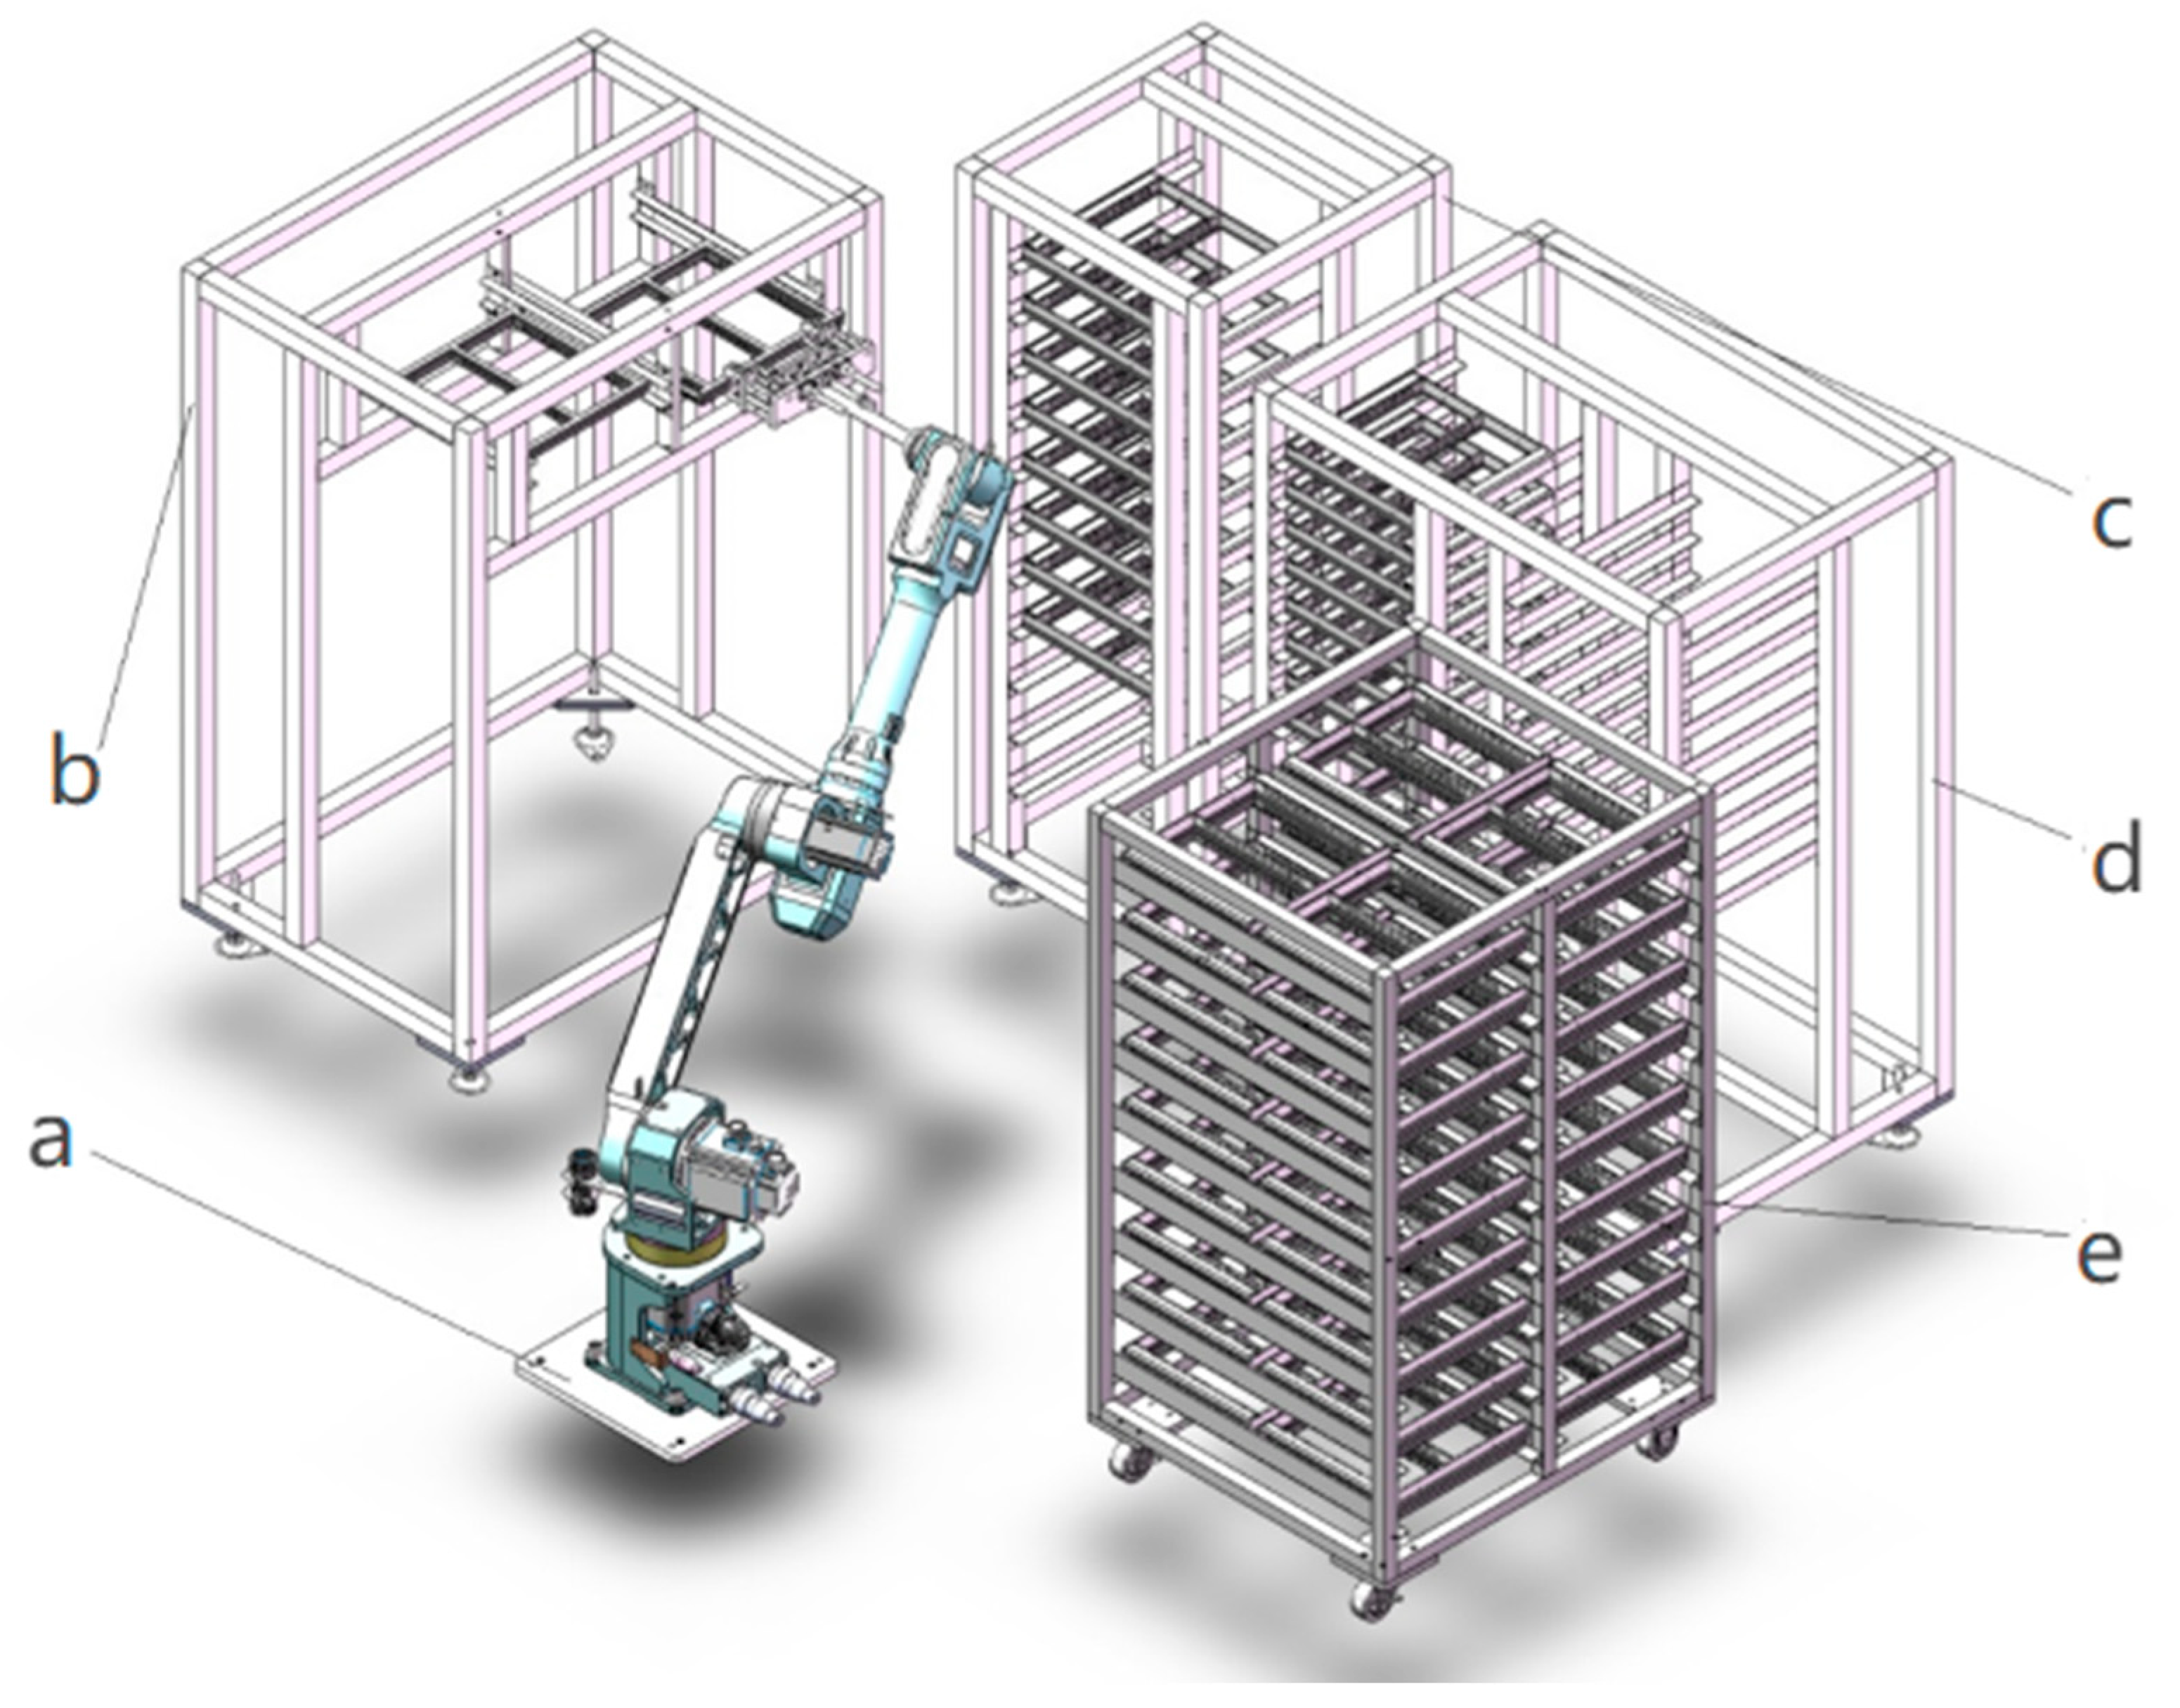
The encapsulation production line for pressure-sensitive electronic components mainly consists of an input/output material stand, a preheating oven, an encapsulation machine, a leveling oven, and an encapsulation robot. With the robot as the center, all processing equipment is arranged in sequence.
Figure 1 shows the overall layout of the pressure-sensitive electronic component encapsulation production line based on industrial robots.
The structure of the robot encapsulation production line layout optimization algorithm based on the NSGA-II algorithm is shown in
Figure 2. The algorithm mainly includes modules such as parameter input, model establishment, constraint conditions, NSGA-II algorithm, and comprehensive evaluation [
28,
29].
2.1. Input Module
2.1.1. Robot
It is necessary to input the kinematic parameters of the SMLR6Z1420/E robot, such as D-H parameters, mechanical limit ranges and maximum speeds of each joint, as well as dynamic parameters like the inertia matrix of each robot link and link mass [
30]. Since dynamic parameters cannot be obtained directly, a robot model is built in Solidworks with corresponding materials set, and the mass analysis function is used to obtain the corresponding dynamic parameters of the components [
31]. Thus, the dynamic parameters of each joint of the SMLR6Z1420/E robot are shown in
Table 1.
2.1.2. Task Trajectory
It is necessary to input the poses of the working points in the trajectory within the absolute coordinate system of the production line into the system according to the selected task trajectory. Since the objective function for the robot’s operation time is established based on the angle variation in the first three joints of the robot, according to the inverse kinematics of the robot, the system only needs the position vector of the end pose of the robot. The coordinates of the working points in the task trajectory of the packaging production line are shown in
Table 2.
2.1.3. Peripheral Equipment
Information on the position and appearance of each piece of equipment in the packaging production line is extracted according to the method for establishing a simplified model of peripheral equipment, as shown in
Table 3.
2.2. Modeling of SMLR6Z1420/E Robot
First, the robot’s link coordinate system is established. The key to establishing the robot’s link coordinate system lies in the selection of the coordinate system origin and the z-axis and x-axis. Simplified diagrams are drawn of each joint of the robot and plot the central axis of each joint. Then, a D-H parameter model of the robot is established through the robot’s link coordinate system, and a workspace model of the robot is built using the Monte Carlo method to facilitate effective spatial planning.
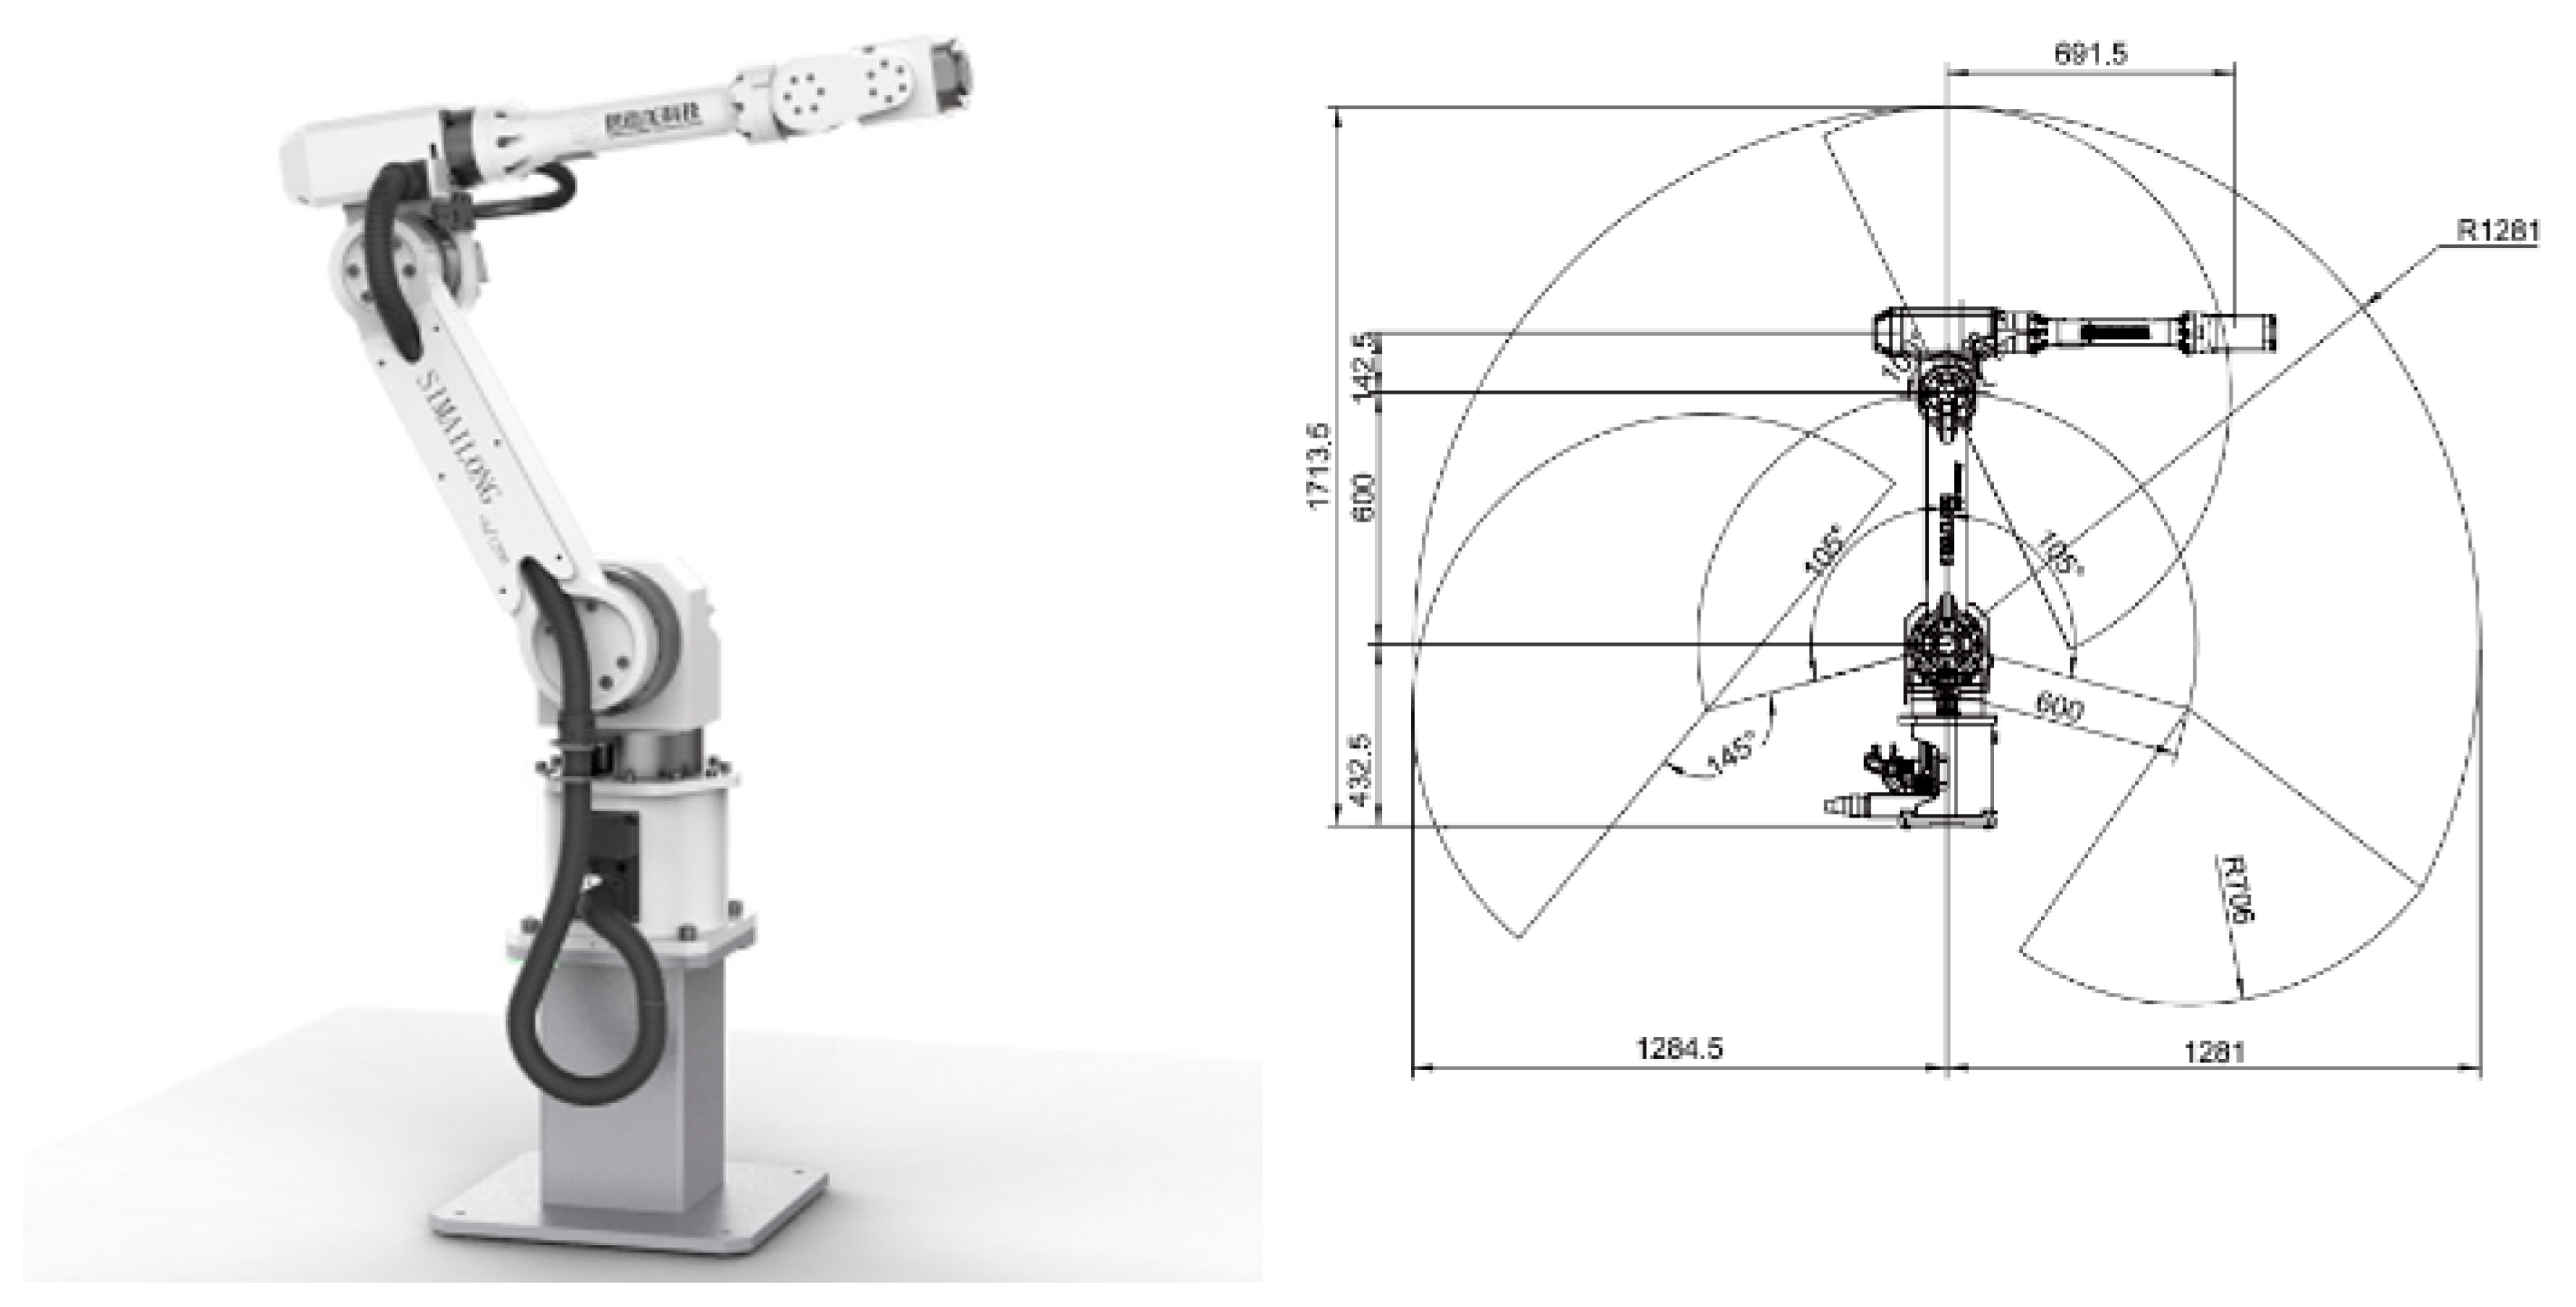
Next, kinematic and dynamic analyses are performed on the SMLR6Z1420/E robot. Its detailed structure and range of motion are shown in
Figure 3.The inverse kinematic solution of the robot is obtained using the pose separation method, and the dynamic equation of the robot is derived by the Lagrange method [
32], providing theoretical support for the establishment of the layout optimization objective function.
Finally, to simplify the model and improve computational efficiency, a geometric shape envelope method is adopted to establish a simplified model of the peripheral equipment. The detailed derivation is as follows:
Step 1: Establishment of the Lagrangian function for the robot system
The Lagrangian is a scalar function defined as the difference between the system’s total kinetic energy and total potential energy:
where
K denotes the total kinetic energy of the robot system and
U denotes the total potential energy.
Taking partial derivatives of the Lagrangian according to the Euler–Lagrange formulation yields the dynamic equation of the robot:
where τ represents the vector of driving torques.
Step 2: Mathematical formulation of the kinetic energy
When analyzing the kinetic energy of an individual link, it is customary to decompose it into translational and rotational components about the link’s center of mass.
The translational kinetic energy arises from the linear motion of the link centroid in space, whereas the rotational kinetic energy originates from the link’s rotation about its centroid.
The kinetic energy of link
can be expressed as
where the first term corresponds to translational kinetic energy and the second term to rotational kinetic energy;
is the mass of link
;
is the inertia tensor of link
expressed in the link coordinate frame; and
and
are the linear and angular velocities of the link centroid, respectively.
The Jacobian matrix
maps joint velocities to the linear and angular velocities of the robot end-effector (or link centroids) in task space, and can be written in expanded form as
The total kinetic energy of the robot system is the sum of the kinetic energies of all links. Substituting the above expression gives
In the equation,
denotes the inertia matrix of link
i expressed in the base coordinate frame, expanded as
.
D represents the inertia matrix of the robot; that is,
Step 3: Mathematical formulation of the potential energy
The robot is a rigid-body system, and the potential energy of each link is generated by gravity.
The gravitational potential energy of link
i is
where
is the gravity vector and
is the position vector of the centroid of link
i.
The total potential energy of the robot is the sum of the potential energies of all links:
Substituting the expressions for
K and
U into the Lagrangian and applying the Euler–Lagrange equation yields the full dynamic equation of the robot:
where
q,
and
denote the joint angles, joint angular velocities, and joint angular accelerations, respectively;
is the velocity-coupling (Coriolis/centrifugal) matrix; and
is the gravity vector.
2.3. Layout Constraints
In the process of layout adjustment for production equipment and robots in the pressure-sensitive electronic component packaging production line, it is necessary to comply with certain specific constraint conditions to ensure the rationality of solving the layout optimization problem.
2.3.1. Reachability Constraint
By establishing a robotic workspace model, it must be ensured that all work points on production equipment fall within the robot’s operational range during production line layout adjustments.
2.3.2. Interference Constraint
This includes two aspects: firstly, the robot base must not interfere with peripheral production equipment; secondly, when the robot end-effector enters the production equipment to retrieve component trays, it must avoid collisions with the equipment during operation [
33,
34].
2.3.3. Relative Pose Constraint
This refers to a restrictive relationship between the relative position and orientation of robots and production equipment. According to process requirements, the robot’s position and orientation relative to specific equipment must be confined within a defined range and cannot be arbitrarily placed.
2.4. Research on the NSGA-II Algorithm
To achieve multi-objective optimization of the layout of the pressure-sensitive electronic component encapsulation production line, this study adopts the NSGA-II algorithm as the solution framework and introduces systematic improvements in chromosome encoding, constraint handling, fitness evaluation, and genetic operators to address the specific characteristics of the robot layout problem [
35].
The optimization problem aims to determine the pose of the robot base in a pressure-sensitive electronic component encapsulation line, where peripheral equipment is fixed and the robot base is movable.
A bi-objective layout optimization model is formulated to minimize:
where
: robot operation time (s),
: motion energy consumption (J).
2.4.1. Chromosome Encoding and Decoding Strategy
A chromosome directly encodes the robot base pose (x,y,θ) on a two-dimensional plane using real-number coding. This encoding method is intuitive and easily corresponds to the physical spatial coordinates. The decoding process maps the chromosome to the specific installation position and orientation of the robot base. Therefore, the robot base pose is encoded using a real-coding scheme, where each chromosome represents a complete layout scheme and consists of three decision variables:
where x and y denote the planar coordinates of the robot base in the absolute coordinate system (unit: mm), with their ranges determined by the physical boundaries of the production line layout space, and θ represents the rotation angle of the base around the Z-axis (unit: rad). The decoding process is thus the mapping of the chromosome to the physical layout.
2.4.2. Constraint Handling Strategy
Constraints are critical to ensuring the practical feasibility of the optimization solutions. This study employs the Constraint Dominance Principle (CDP) to handle the complex layout constraints. The optimization problem must satisfy three categories of constraints:
Kinematic constraints: Each joint angle
and angular velocity
must remain within mechanical limits (see
Table 2 and
Table 3);
Dynamic constraints: Each joint torque must be less than the maximum allowable torque ;
Layout constraints: These include reachability, collision avoidance, and process posture requirements.
To evaluate constraint violations, a Constraint Violation Degree (CVD) is defined as
where
≤ 0 represents the i-th inequality constraint.
The CDP is applied as follows:
If two solutions are feasible, non-dominated sorting based on objective function values is used;
A feasible solution always dominates an infeasible one;
If both are infeasible, the solution with the smaller CVD is preferred.
This mechanism effectively guides the search toward the feasible domain and ensures engineering feasibility of the solutions.
2.4.3. Fitness Function Evaluation
The fitness evaluation of each chromosome (i.e., each layout scheme) is the most computationally intensive component of the algorithm.
The evaluation procedure consists of the following steps:
Motion planning: Based on the given layout, compute the robot motion paths for all task trajectories (see
Table 2).
Operation time calculation: For each trajectory segment, compute the execution time from the joint angle changes and maximum joint velocities, taking the longest joint time as the segment duration. The total operation time is
where
is the joint displacement of joint
in segment
,
is the maximum joint velocity, and
= 0.8 is a velocity scaling factor to ensure safe operation.
The total operation time is
Energy consumption calculation: Based on the robot dynamic model (Lagrangian formulation) and joint friction torque model [
36], compute joint torques
and integrate to obtain the total energy consumption:
Constraint checking: Verify that the layout satisfies all constraints and compute the corresponding CVD value.
Fitness assignment: The final fitness value is defined as the combination of the bi-objective vector and a penalty term:
where
=
is the penalty coefficient.
2.4.4. Genetic Operators
To enhance the search performance of the algorithm for the layout optimization problem, the following genetic operators are designed:
Selection operator: Binary tournament selection, using Pareto rank and crowding distance to select superior individuals.
Crossover operator: Simulated Binary Crossover (SBX), with offspring generated as
where
is a random factor following a specified probability distribution.
where
∼U(0,1)
and
are the upper and lower bounds of the variable, and
= 20 is the mutation distribution index.
3. Experiments and Analysis
3.1. Algorithm Convergence Analysis
Figure 4 illustrates the convergence process of the NSGA-II algorithm during a representative run, where the horizontal axis denotes the number of generations and the vertical axis represents the composite objective function value (weighted sum with weights
and
).
To provide a clearer depiction of the convergence characteristics,
Figure 5 presents the evolution of the Pareto front with increasing generations.
As shown in
Figure 4, the algorithm begins to converge after approximately 50 generations and reaches a stable state after about 120 generations.
Figure 5 reveals that the Pareto front gradually shifts toward the lower-left region, indicating that the proposed optimization model—which simultaneously considers operation time and energy consumption—and the tailored algorithmic framework are effective.
The algorithm is capable of simultaneously optimizing the two competing objectives and reliably searching for a diverse set of non-dominated solutions.
3.2. Comparative Study of Algorithm Performance
To verify the effectiveness of the NSGA-II algorithm in solving the proposed problem, comparative experiments were conducted against two other classical multi-objective optimization algorithms—NSGA-III (designed for high-dimensional objective spaces) and MOPSO (multi-objective particle swarm optimization).
All algorithms were executed with the same population size (N = 100), maximum number of generations (G = 200), computational platform, and number of fitness function evaluations.
The hypervolume (HV) indicator was used to comprehensively evaluate the convergence and diversity of the Pareto fronts obtained by each algorithm, where a larger HV value indicates better overall solution quality.
Table 4 summarizes the average hypervolume (HV), spacing (SP), generational distance (GD), and average runtime across 10 independent runs.
Analysis of
Table 4 reveals the following insights:
NSGA-II achieved the highest average HV value, demonstrating that for the robot layout problem considered in this study—where operation time and motion energy consumption are the optimization objectives—the NSGA-II framework delivers the best overall solution quality in terms of both convergence and diversity;
MOPSO, while exhibiting the shortest runtime, yielded the lowest HV value and the largest standard deviation. This indicates that although MOPSO searches quickly, it is prone to local optima and shows reduced stability when handling the complex industrial constraints of the proposed model;
NSGA-III performed slightly worse than NSGA-II and required longer computation time. This indirectly reflects the bi-objective nature of the present problem: the mechanism of NSGA-III, designed for high-dimensional objective spaces, offers no advantage and instead increases computational overhead. This further confirms that NSGA-II is the more appropriate choice for this application.
Figure 6 provides a visual comparison of the Pareto fronts obtained by the three algorithms, showing that the solution set produced by NSGA-II outperforms the others in both distribution range and uniformity.
Therefore, for the specific scenario of a pressure-sensitive electronic component encapsulation production line, the NSGA-II–based optimization framework demonstrates superior performance, achieving an effective balance between solution quality and computational efficiency.
3.3. Robustness and Performance Evaluation
To evaluate the robustness of the optimization results, statistical analyses were performed on the outcomes of multiple independent runs.
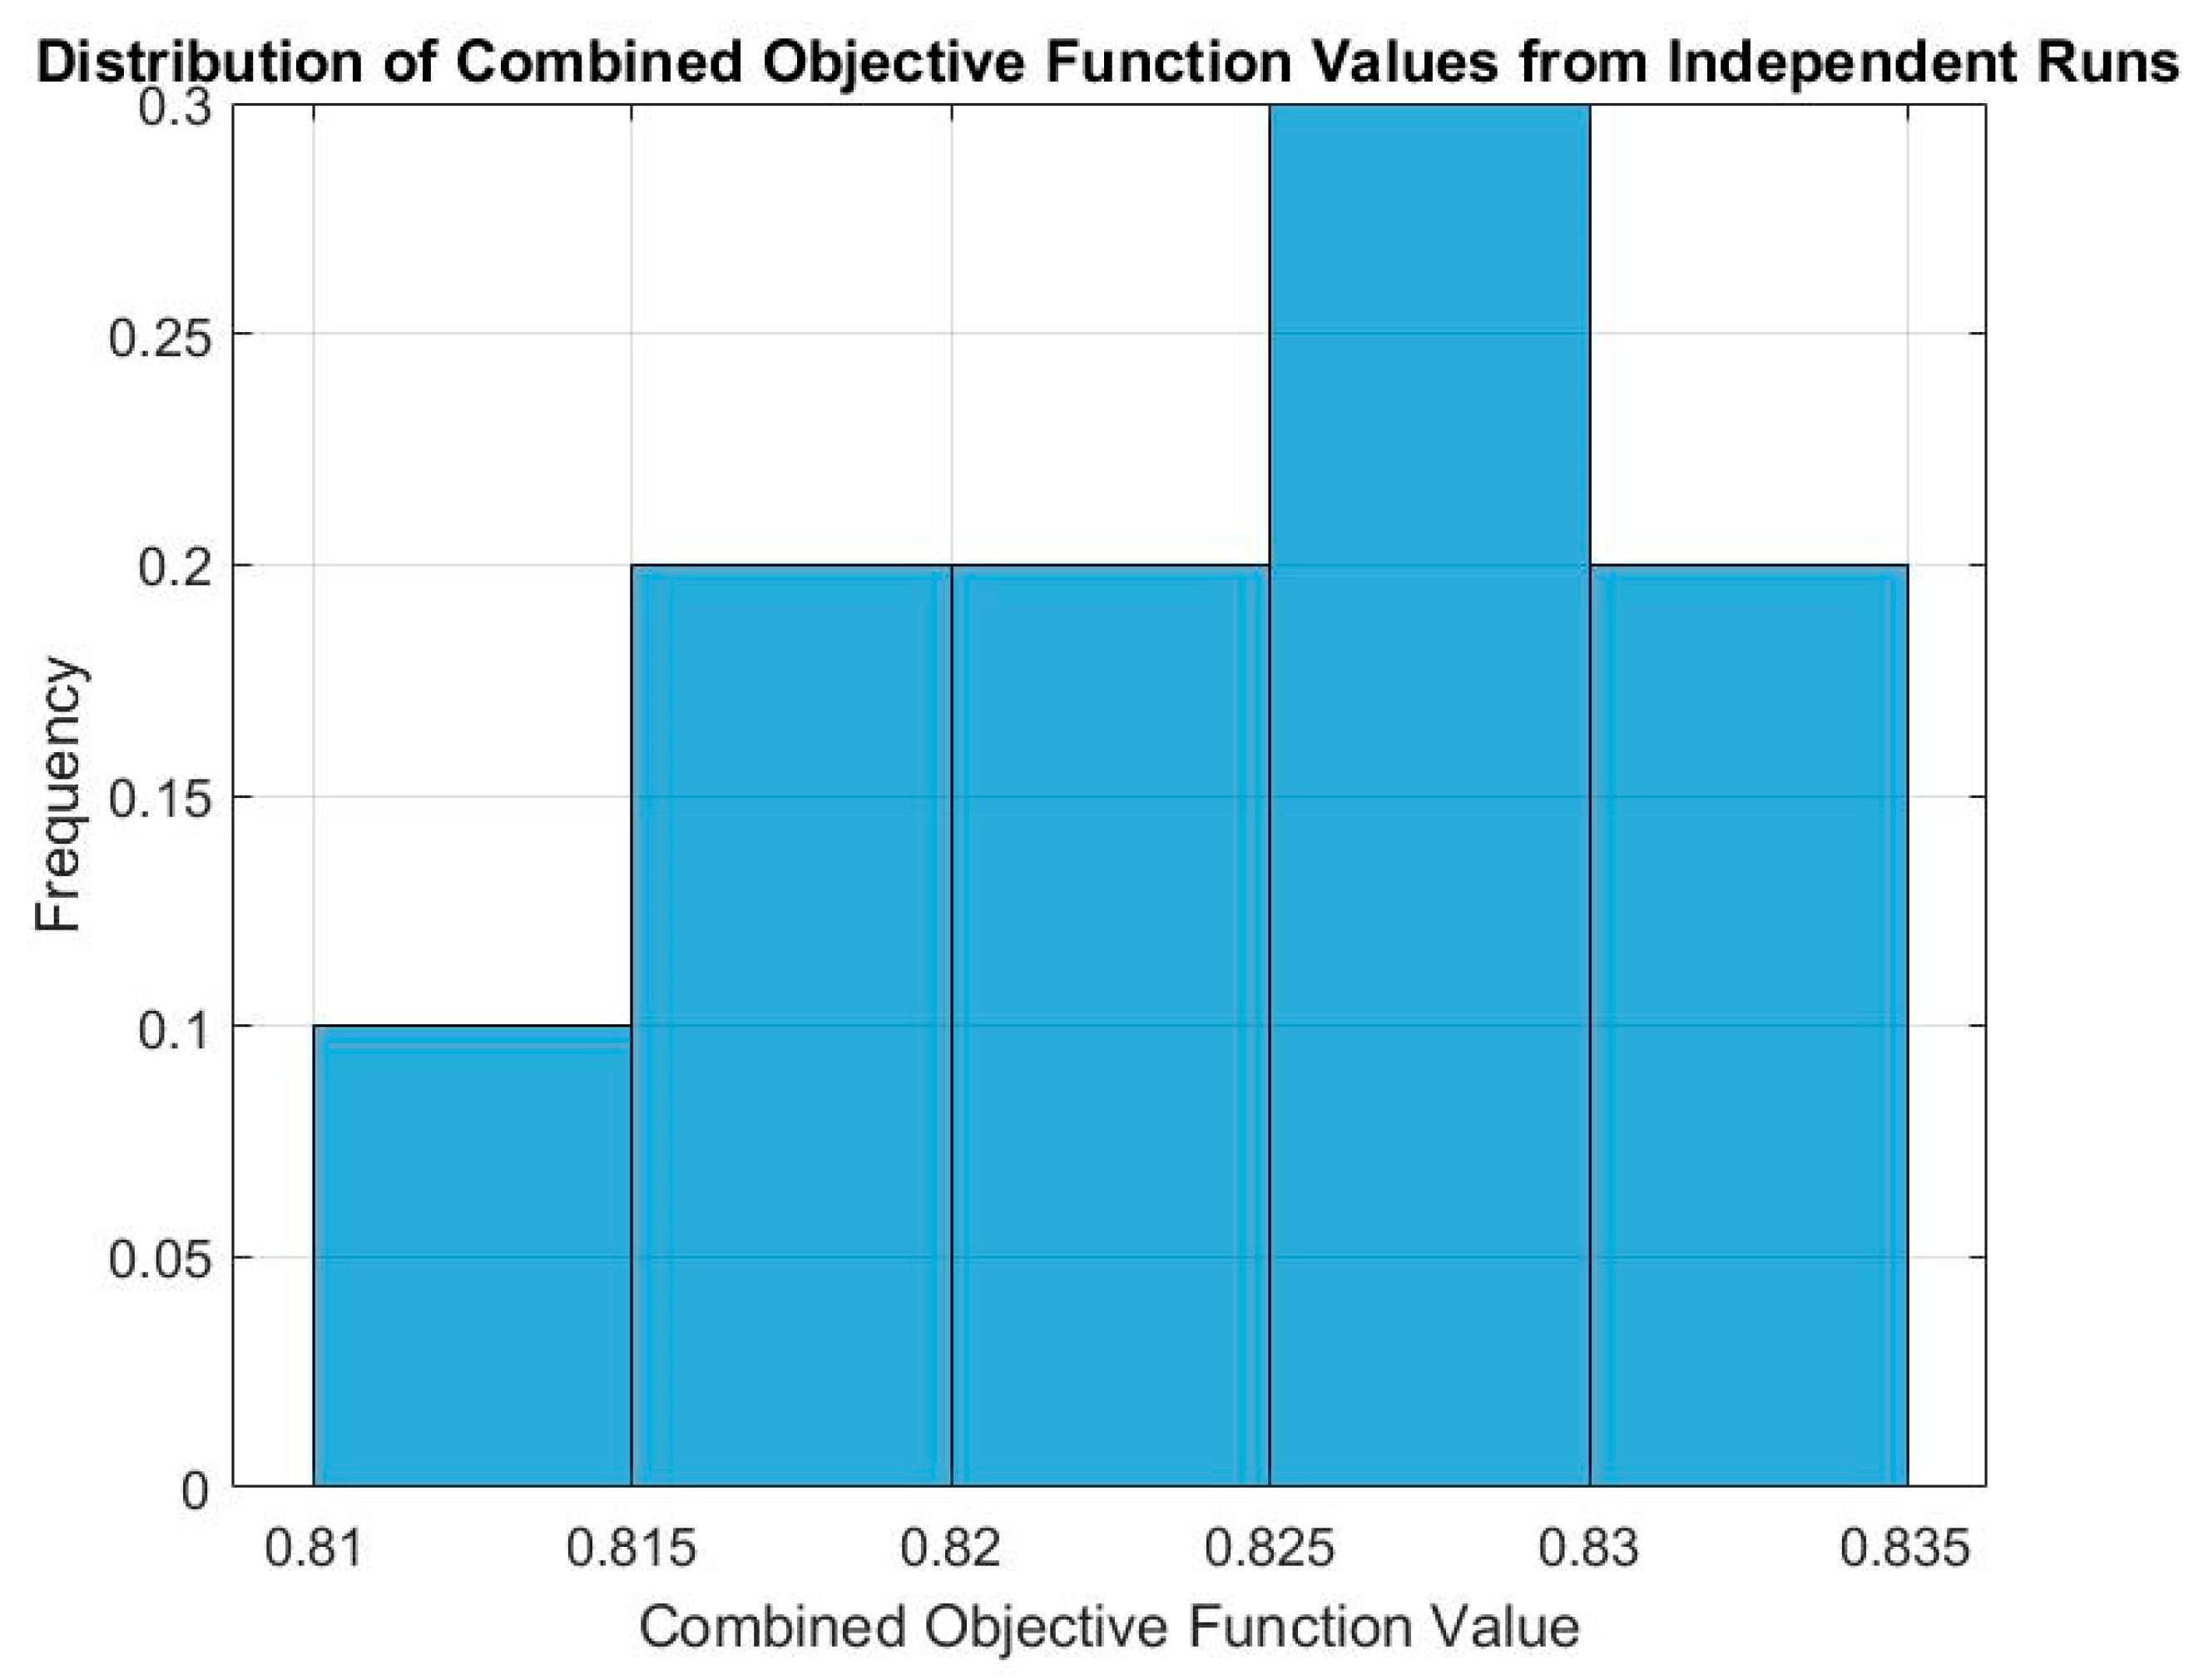
Figure 7 illustrates the distribution of the best composite objective values obtained in each run, while
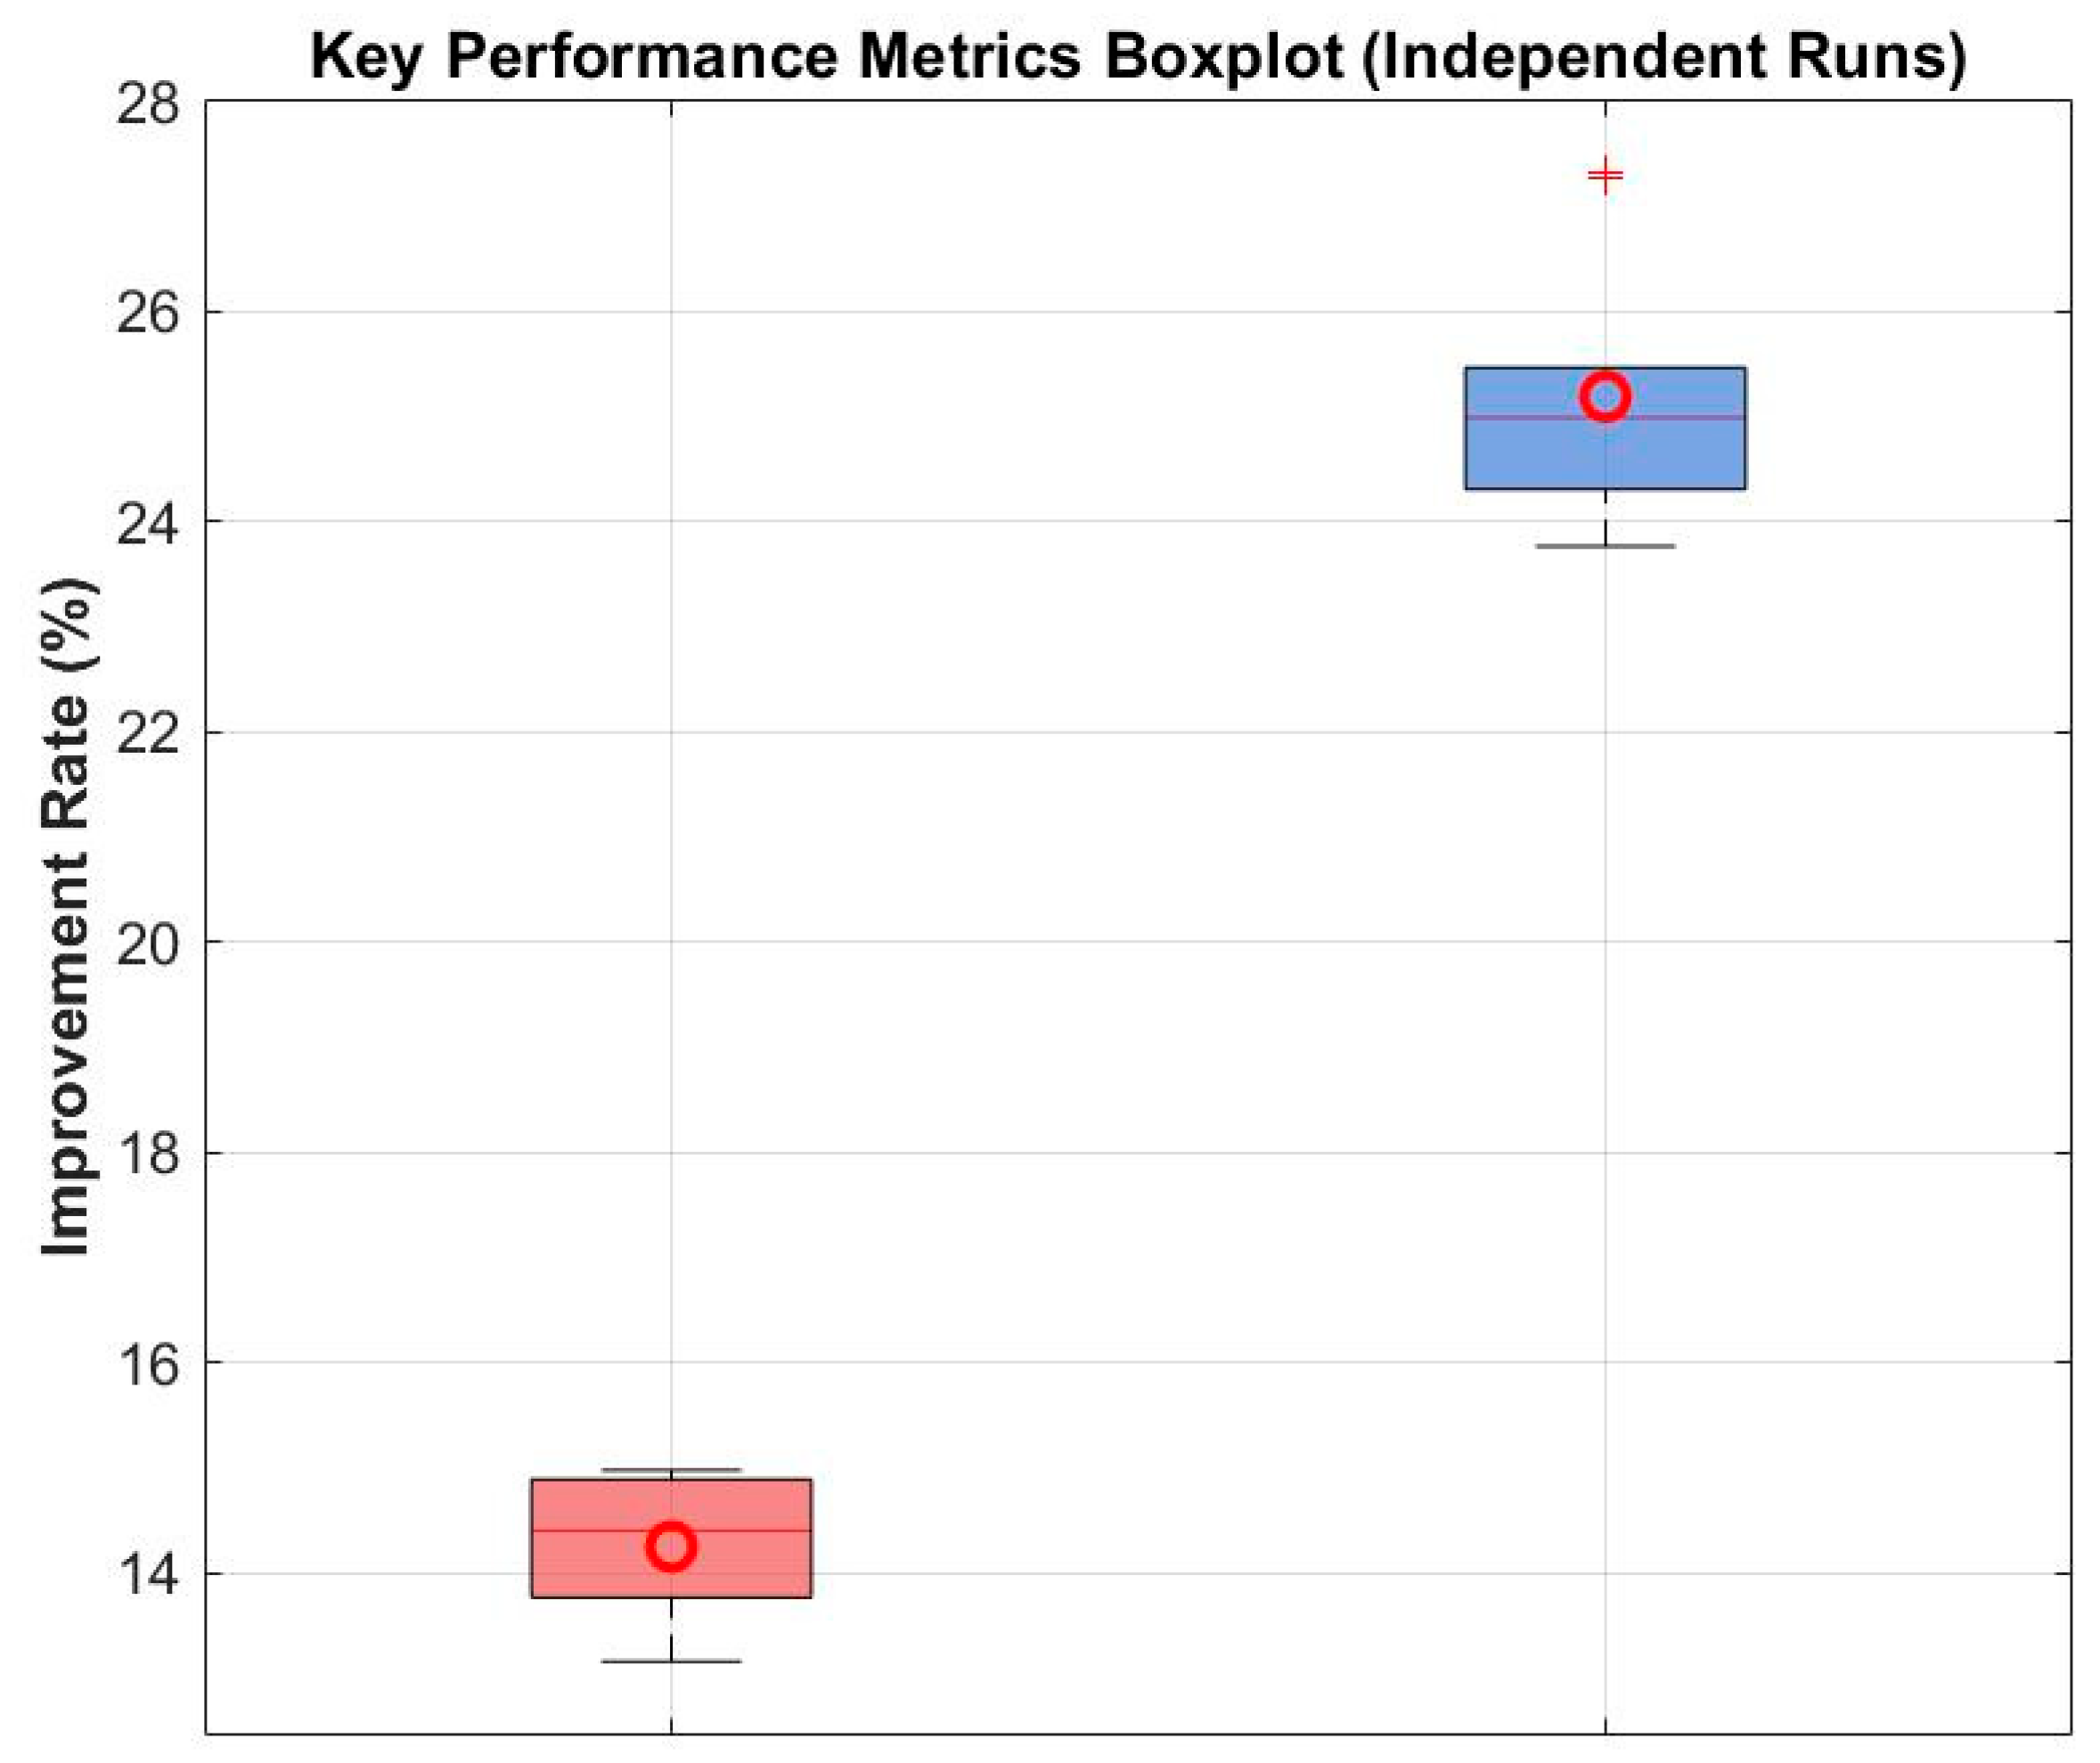
Figure 8 presents boxplots of the key performance metrics.
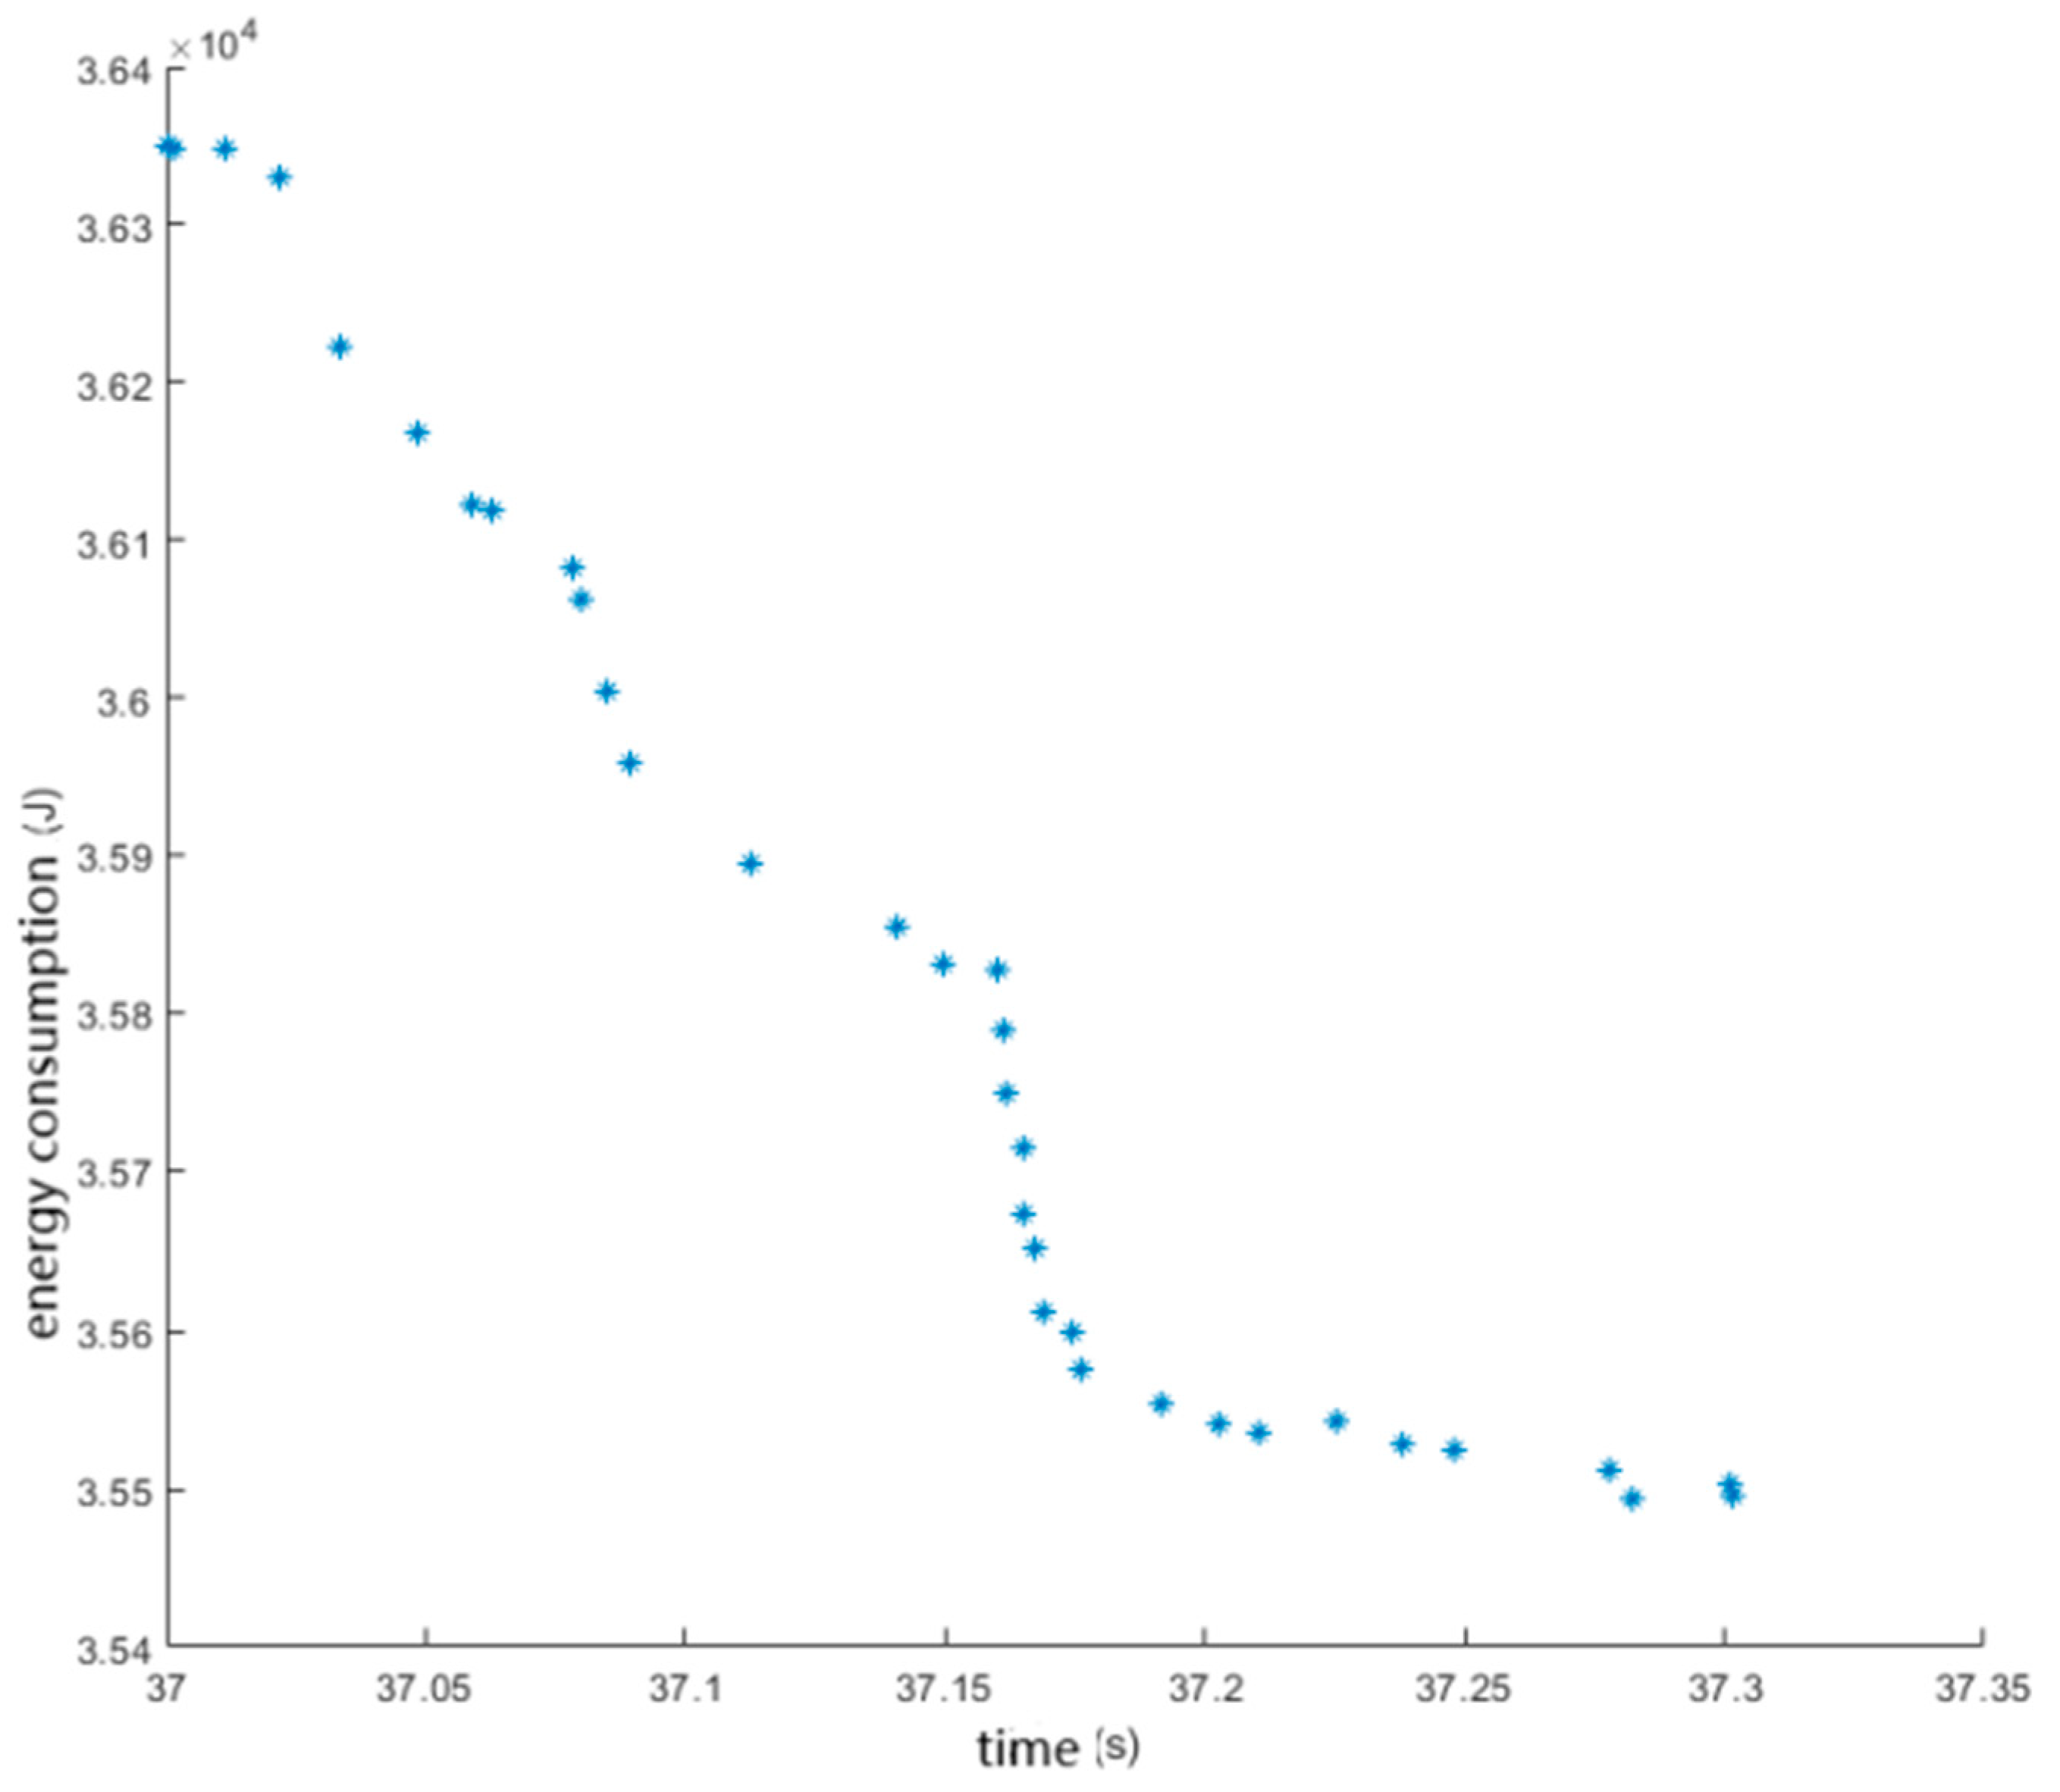
The statistical results show that the mean improvement in operation time was 14.2% ± 0.8%, and the mean improvement in motion energy consumption was 25.1% ± 1.2%.
Table 5 presents the performance comparison data between the optimized scheme and the initial scheme.
These significant and consistent improvements not only validate the effectiveness of the proposed optimization algorithm but, more importantly, demonstrate the necessity and great potential of incorporating motion energy consumption as an optimization objective in layout decision-making.
The boxplots reveal a concentrated data distribution with few outliers, further confirming the reliability of the optimization method proposed in this study.
3.4. Analysis of the Optimal Layout Solution
For the algorithmic design of the robotic encapsulation production line layout optimization problem, the basic parameters of the algorithm were set as follows: the population size N, maximum number of generations G, crossover probability P, and mutation probability Q. The algorithm was then executed to obtain the Pareto-optimal solutions for the layout optimization, as shown in
Figure 9.
In the Pareto-optimal solution set shown in
Figure 9, multiple solutions exist.
Points closer to the upper-left corner represent layout schemes with shorter robot operation time, whereas points closer to the lower-right corner correspond to schemes with lower motion energy consumption.
These solutions are non-dominated and therefore have no inherent superiority over one another; however, in practice, only a single layout scheme must ultimately be selected.
To determine the most suitable installation pose of the robot base, the two objective functions—operation time and motion energy consumption—are combined into a single composite evaluation function by means of a weighted sum, thereby transforming the multi-objective problem into a single-objective optimization.
The composite objective function is defined as:
where
and
are the normalized weights of the two objective functions, and
and
denote the operation time and motion energy consumption objectives, respectively.
To evaluate the robustness of the optimization results, the NSGA-II algorithm was executed multiple times independently.
In all runs, the solutions consistently converged to Pareto fronts of similar shape and distribution, demonstrating the stability of the algorithm.
Since the enterprise currently prioritizes production efficiency, the weight assigned to operation time was set slightly higher than that of motion energy consumption, with weights denoted as and .
Using the solution set from a representative run, the composite objective function F was minimized to obtain the final decision.
The corresponding objective function values are (operation time) and (motion energy consumption), and the resulting optimal robot base pose in the absolute coordinate system is denoted as (1454.65 mm, −156.33 mm, 86°).
Under this layout, the robot’s workspace fully covers all task points while maintaining a safe distance from the surrounding equipment.
As shown in
Figure 10, the optimal layout places the robot near the center of the equipment cluster, allowing it to complete all loading and unloading tasks with relatively short travel paths.
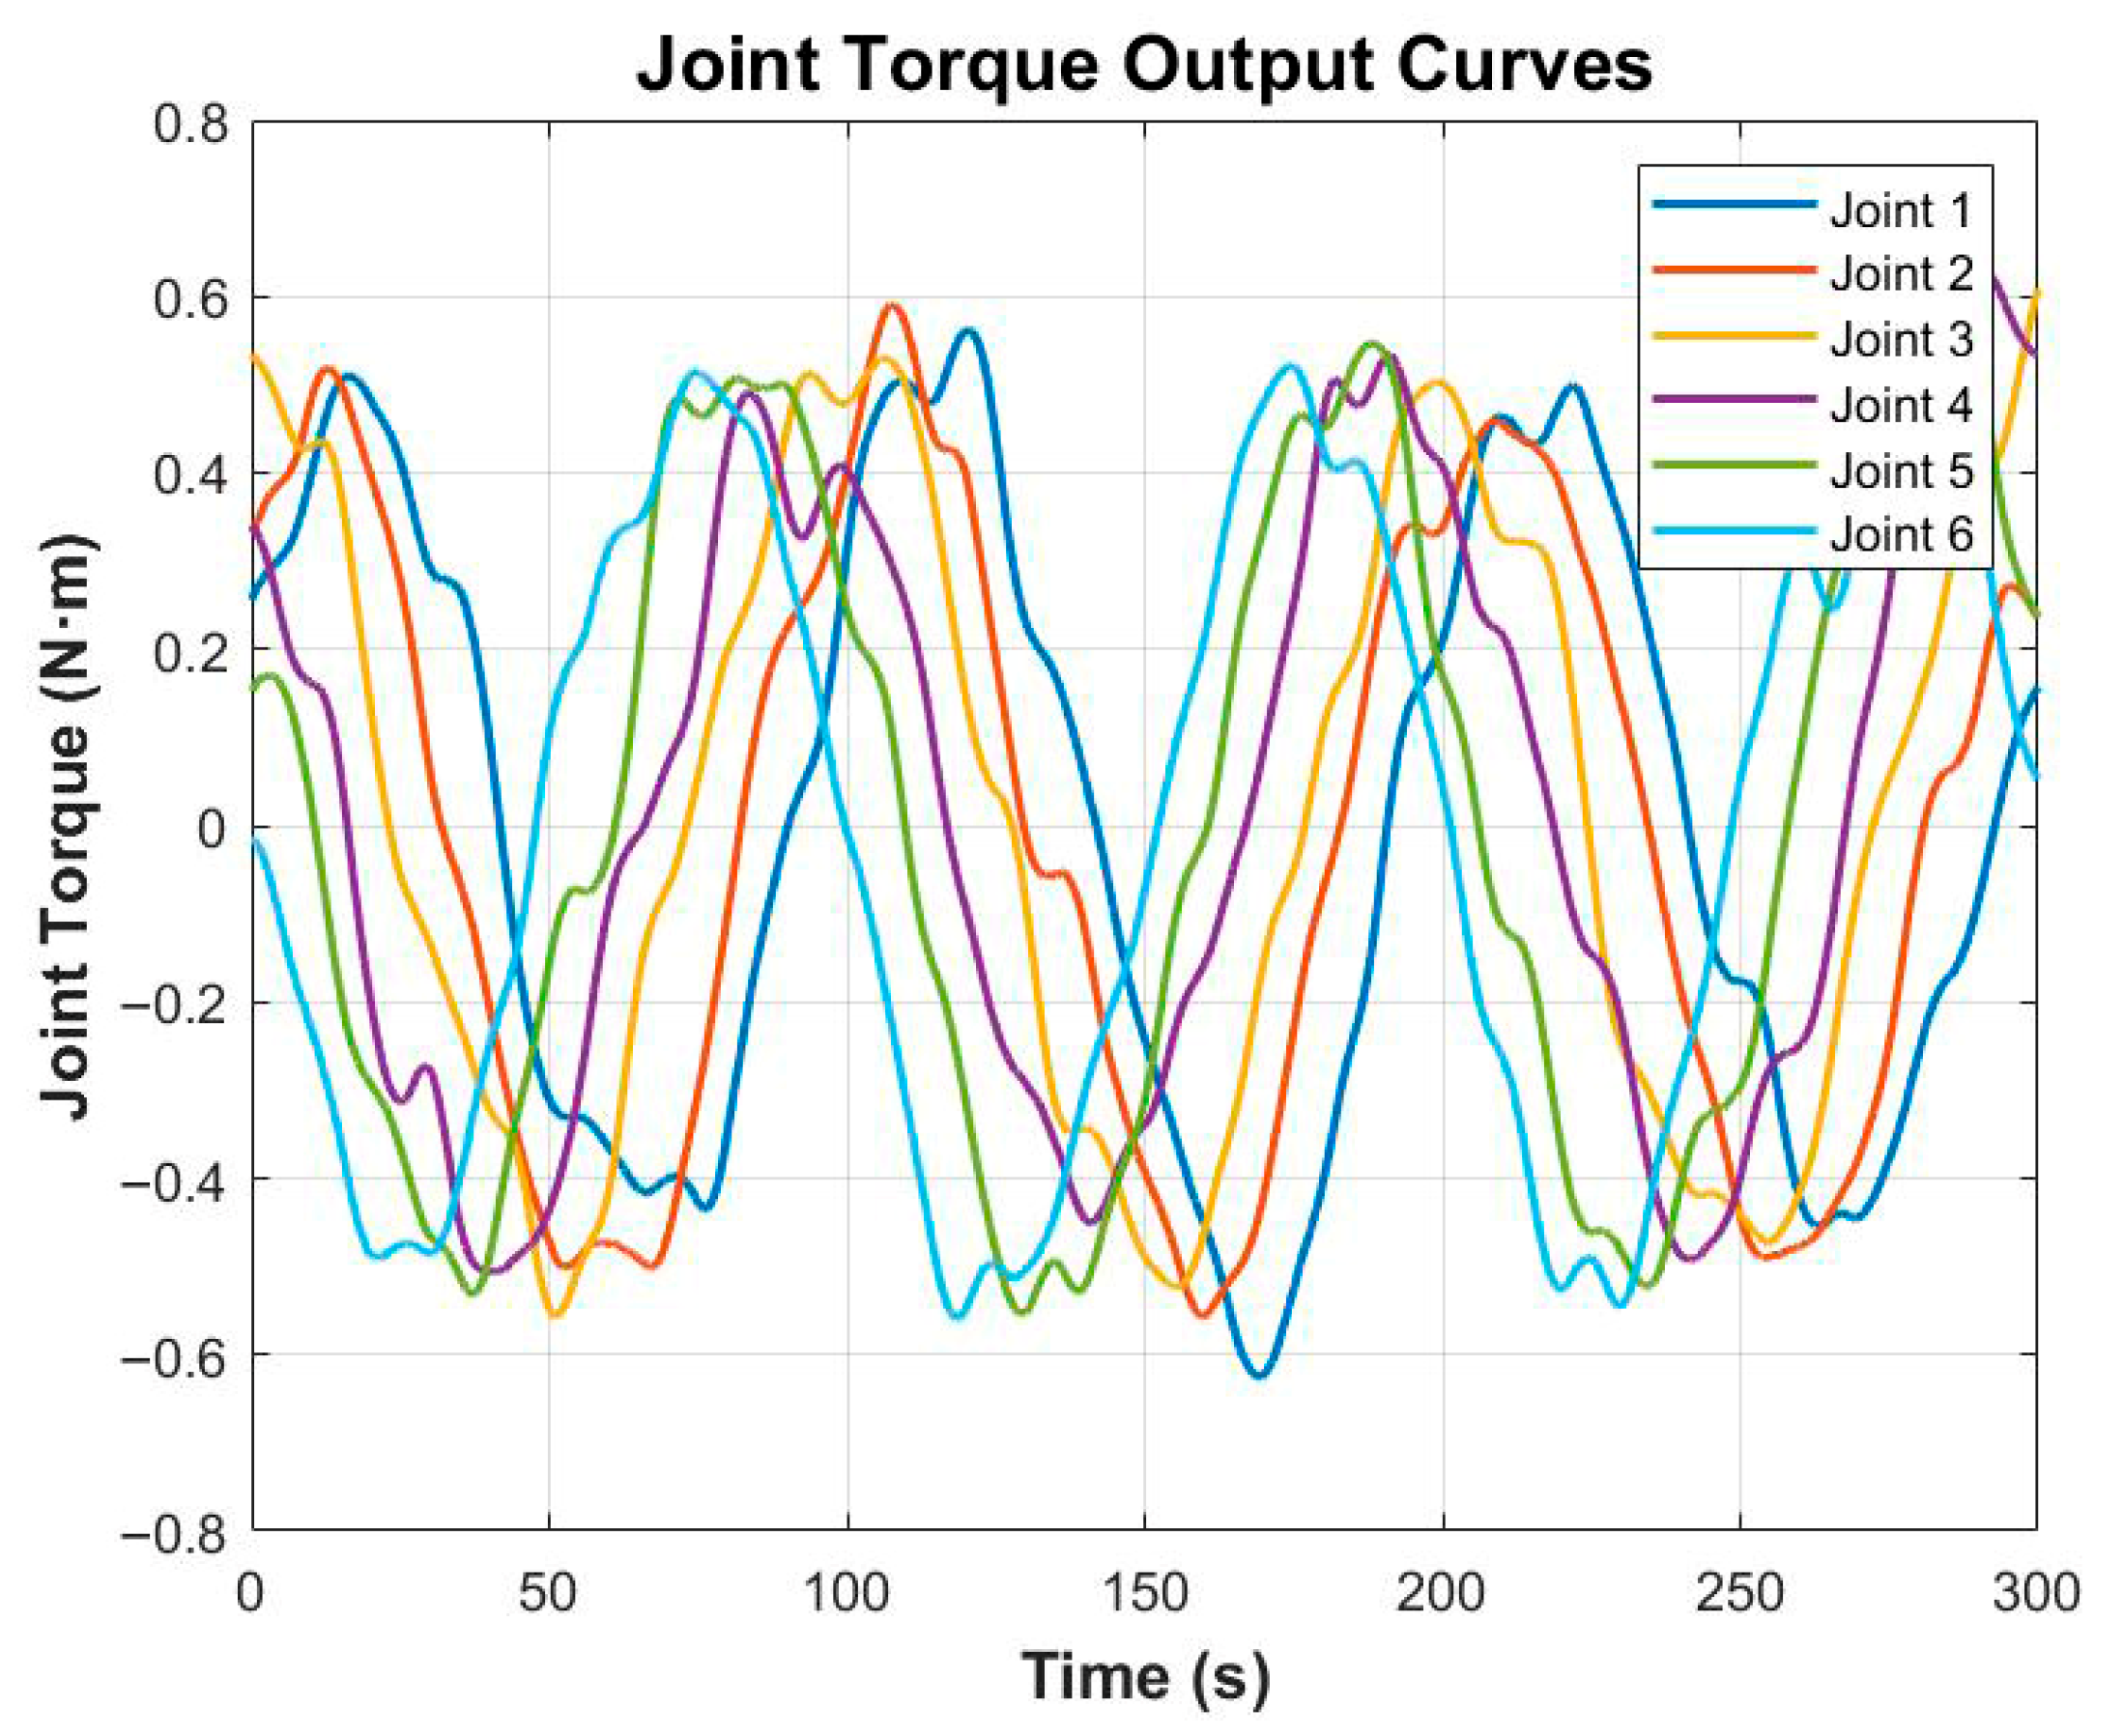
Figure 11 illustrates that the joint torque outputs remain within allowable limits and exhibit smooth variations without abrupt fluctuations, which is beneficial for reducing both energy consumption and mechanical wear.
3.5. Experimental Validation of the Optimized Layout
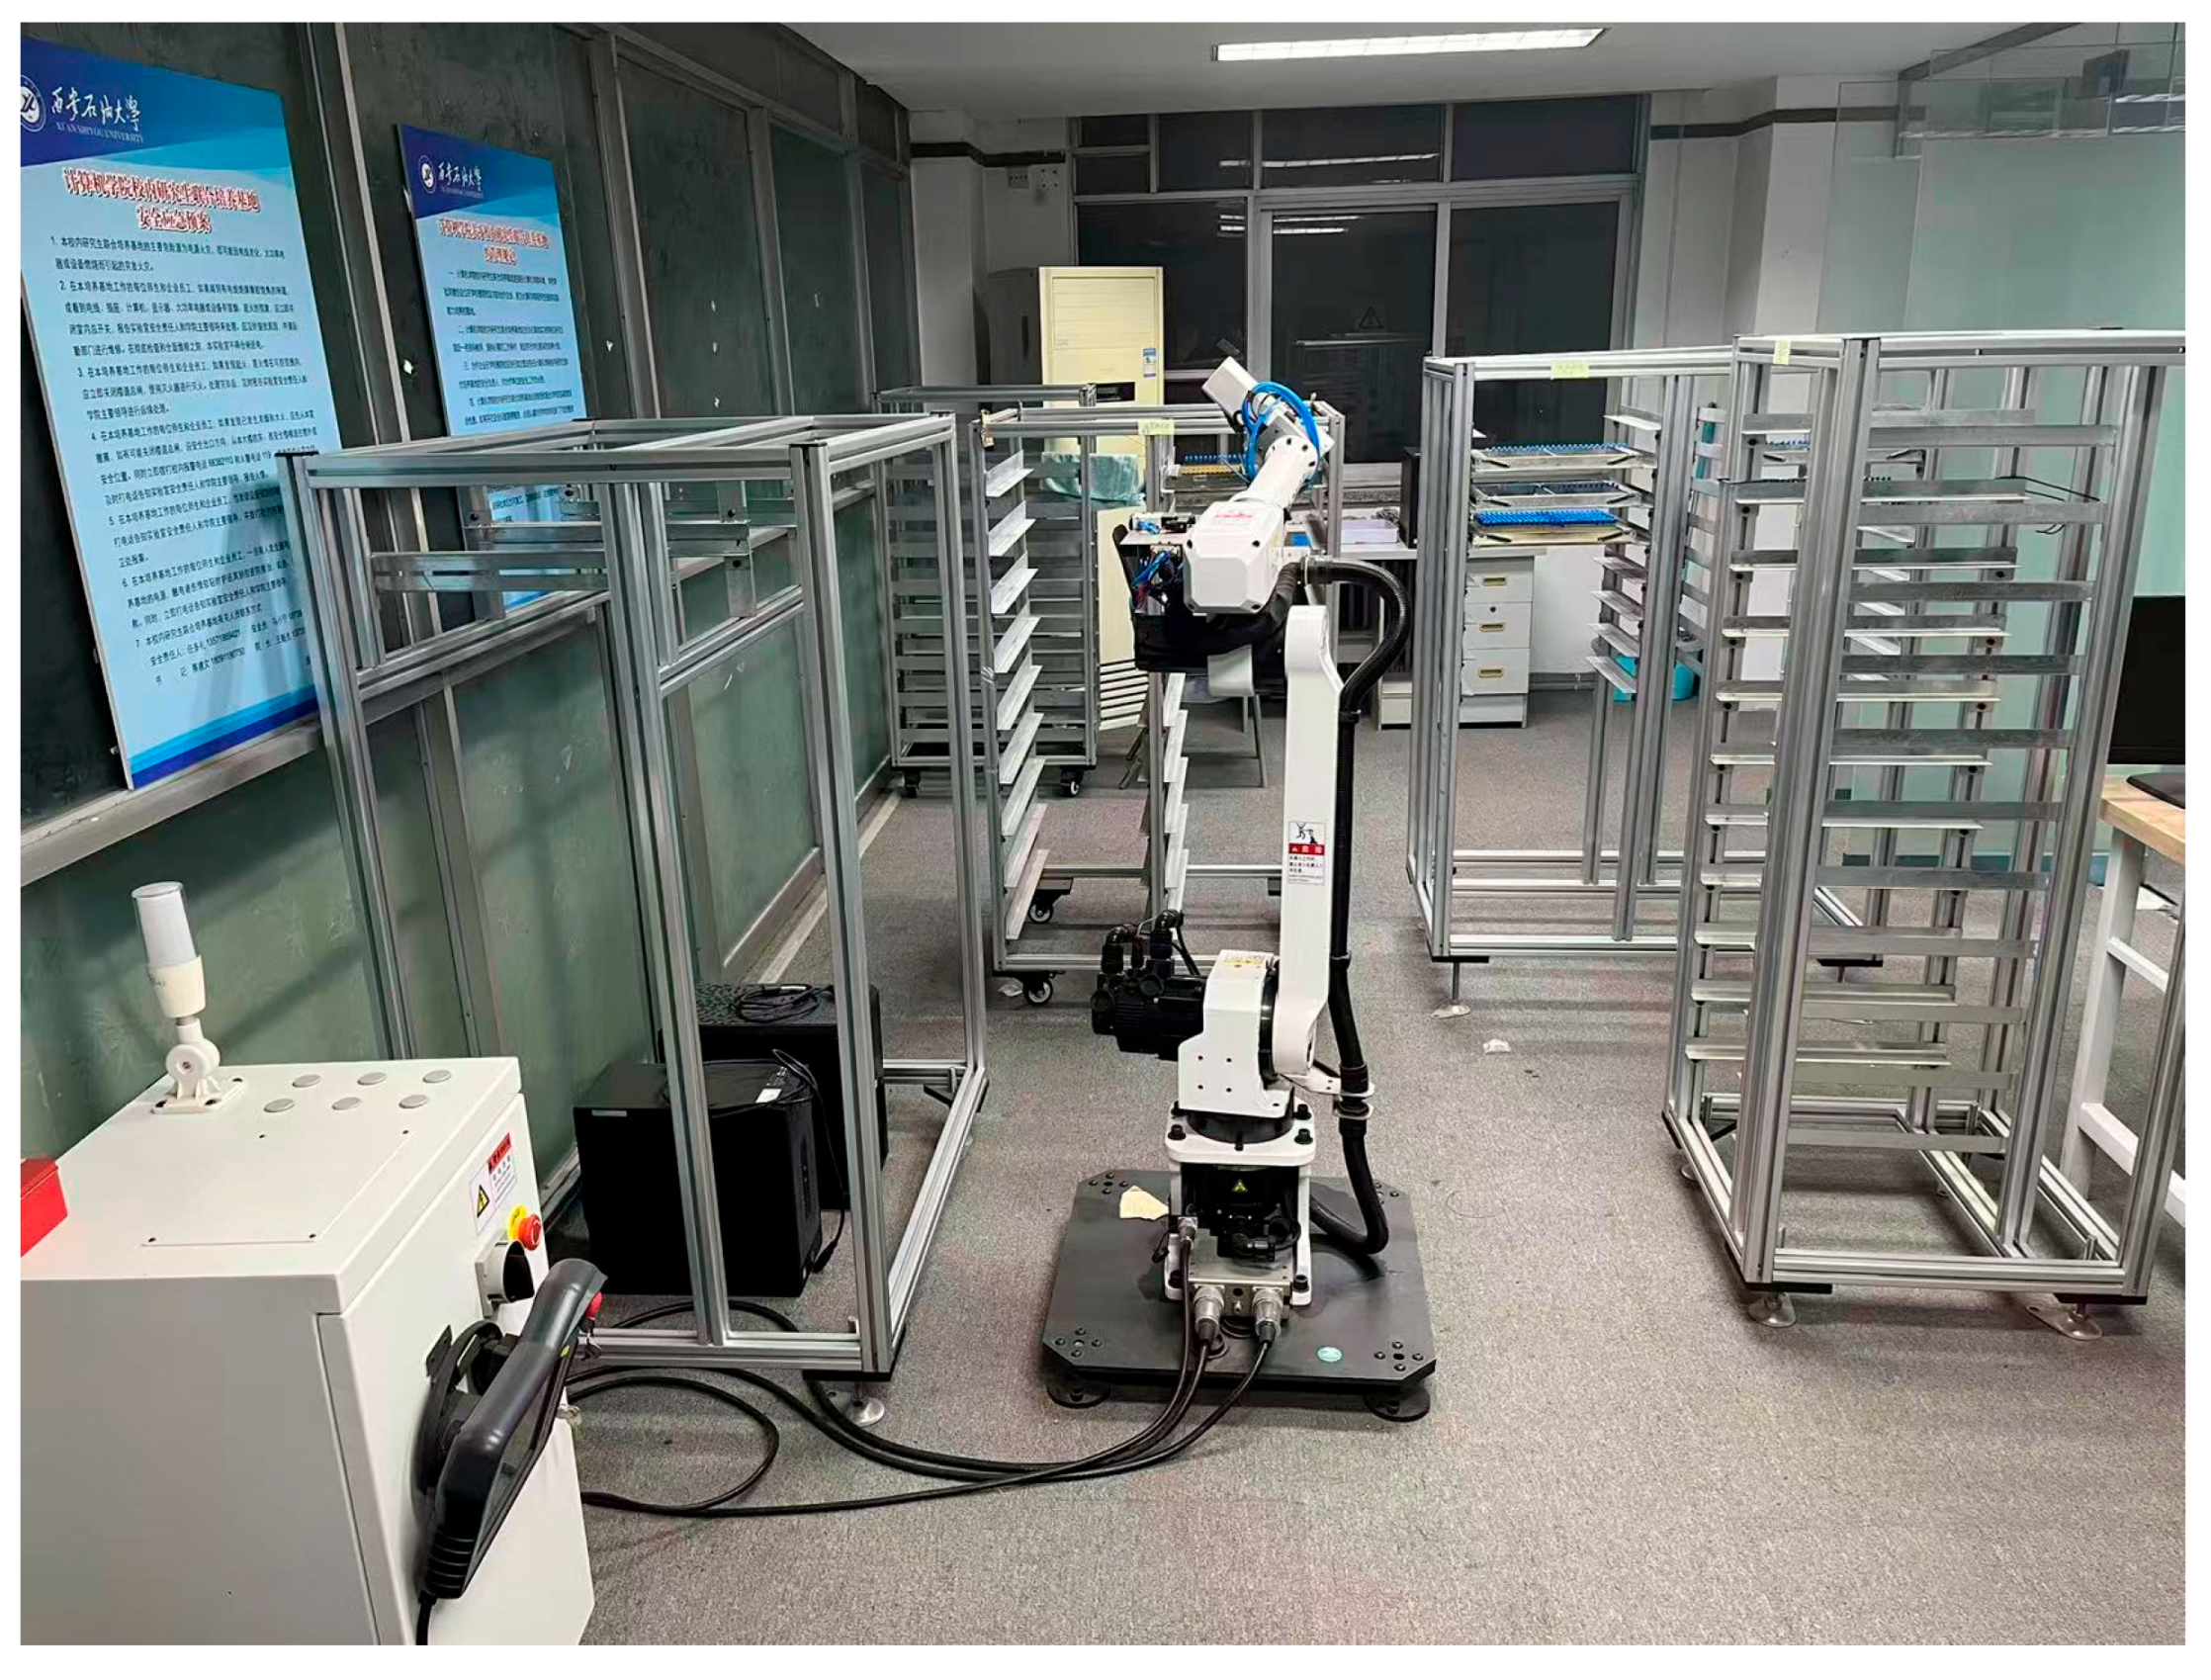
To further validate the engineering feasibility and practical effectiveness of the proposed layout optimization framework, an experimental platform was constructed based on the SMLR6Z1420/E industrial robot (
Figure 12).
The platform replicates the key equipment of the WL11 encapsulation production line, including the encapsulation machine, leveling oven, preheating oven, and input/output racks, while allowing flexible positioning of the robot base.
A custom-designed end effector was developed to handle the multi-layer encapsulation tasks, with pneumatic grippers and protective insulation to cope with the high-temperature environment.
Following the optimized layout configuration obtained from the NSGA-II algorithm, the robot base was physically installed at the computed pose (x,y,θ).
The robot executed the same loading/unloading tasks used in the simulation.
Operation time was measured using the internal controller logs, and energy consumption was recorded through the robot controller’s current sensors integrated with the dynamic model.
Each experiment was repeated ten times to evaluate robustness.
The experimental results confirmed that the optimized layout reduced operation time by 13.9% ± 1.1% and motion energy consumption by 24.8% ± 1.5% compared to the initial layout, closely matching the simulated improvements of 14.81% and 25.63%.
Paired-sample t-tests indicated that these improvements were highly significant (p < 0.001), and the effect sizes (Cohen’s d > 1.8) demonstrated substantial practical impact.
The experimental results not only validate the accuracy of the proposed optimization model and algorithm but also demonstrate its applicability to real production environments.
Minor deviations between simulation and experiment (within 1%) are attributed to unmodeled friction, thermal effects, and sensor noise, which will be further investigated in future work.
4. Discussion
Although the proposed layout optimization framework in this study was validated using a single electronic component packaging production line as a case, its core methodology possesses much broader applicability.
This approach is designed to address a class of industrial layout problems characterized by fixed peripheral equipment, mobile robot bases, and multi-layer spatial paths.
The proposed optimization model is deliberately decoupled from any specific production line. Its inputs consist of a set of generally parameterizable elements:
Task trajectory: Defined by a series of work-point coordinates in three-dimensional space, which can be easily adapted to different point layouts and height levels;
Equipment model: Represented by simplified geometric envelopes (e.g., cuboids or cylinders), with positions and dimensions provided as parameter inputs;
Robot model: Described using standard D-H parameters and dynamic parameters, ensuring applicability to both homogeneous and heterogeneous robotic platforms.
This parameterized design enables the method to be flexibly applied to various industrial scenarios with similar problem characteristics, rather than being limited to the WL11 production line.
The generality of the method lies in its parameterized problem modeling and systematic handling of complex constraints. As long as the target scenario conforms to the above core features, it can be rapidly adapted by updating input parameters without altering the core architecture of the optimization algorithm.
5. Conclusions
This study addresses the layout optimization problem of a pressure-sensitive electronic component encapsulation production line by focusing on the automation and intelligent upgrading of Company X’s WL11 production line.
Through the introduction of industrial robots to replace manual loading/unloading operations and the retrofitting of existing equipment, a fully automated production system was established.
Considering the practical constraints of fixed peripheral equipment and movable robots, the production line layout was optimized with robot operation time and motion energy consumption as dual objectives. To model the optimization problem, a robot operation time model was formulated based on the maximum runtime of the first three joints, while a motion energy consumption model was constructed by integrating the robot dynamics and frictional energy models. The NSGA-II algorithm was selected as the optimization framework after comparative analysis with other multi-objective algorithms (NSGA-III, MOPSO). The proposed NSGA-II–based framework incorporated real-coded chromosome encoding, constraint-handling mechanisms, and multi-objective fitness evaluation, ensuring both engineering feasibility and computational efficiency.
Experimental results demonstrated that the optimal layout scheme achieved a 14.81% reduction in operation time and a 25.63% reduction in motion energy consumption compared with the initial configuration.
Moreover, the algorithm consistently converged to stable Pareto fronts across independent runs, confirming the robustness and reliability of the proposed optimization strategy.
This work provides a generalizable methodology for production line layout optimization in industrial scenarios characterized by multi-layer workspace constraints and complex dynamic limitations, offering valuable insights for the intelligent transformation of the electronic components industry.
