Abstract
The aim of this study is to investigate the impact of machining parameters on the deflection of a cutting tool (i.e., end mill) in the milling of a surface with a curvilinear profile. Test samples were made of aluminium alloy EN AW-7075 T651. Experiments were conducted using the Gocator 2530 laser line profile sensor for real-time measurement of dynamic tool displacement with an inspection speed up to 10 kHz at resolution ranging from 0.028 to 0.054 mm. Response surface methodology was used. Five main technological factors were analysed: cutting speed, feed per tooth (cutting parameters), amplitude, term (curvilinear profile parameters), and the number of flutes (end mill parameter). Obtained data were filtered and visualised as 3D plots. The results showed that cutting speed and amplitude had the greatest impact on tool deflection, while feed per tooth also played a significant role in process stability. In particular, the use of tools with a higher number of flutes led to a considerable reduction in tool deflection, confirming their positive effect on the stability of the machining process. These findings may serve as a basis for the optimisation of machining parameters by taking into account the dynamic deformation of cutting tools.
1. Introduction
Milling is one of the most popular machining methods, valued for its ability to precisely shape even the most complex details. This process is widely used in various industries—from automotive and aerospace to the production of injection moulds and medical devices [1,2]. Its versatility allows for the production of both large structural elements and precision micro components [3]. Combined with CNC technology, milling enables mass production with high repeatability and quality [4,5,6]. That is why, it is an indispensable element of modern manufacturing processes.
Milling is the most widely used machining method for manufacturing thin-walled parts [7]. Thin-walled structures are typically produced by subtractive machining processes in which up to 95% of the initial material volume is removed, leading to a significant decrease in structural mass while maintaining the desired geometry and functionality of manufactured parts [8,9]. However, given their low structural rigidity, these parts are prone to deformation during the milling process, which can greatly reduce the accuracy of the final product [10,11].
Milling process is characterized by cyclic contact between the tool blade and the material, as well as variable cross-section of the cutting layer. A significant challenge arises when the milling process is conducted with the use of end mills, because the cutting forces acting on the tool can cause it to deflect or deviate from its nominal axis, directly affecting the accuracy of the component [12]. In practice, this implies the risk of dimensional inaccuracies or surface irregularities [13]. Therefore, it is crucial to properly select the machining parameters and tool design to suit the material type and product requirements. Bolar et al. [14] studied thin-wall milling and optimized the process parameters to minimize wall deflection caused by tool bending. Sivaprakash et al. [15] used 3D finite element simulations to analyze deformation and force distribution during milling of AISI 1045 steel.
Both experimental studies have been conducted and prediction models have been developed relating to the problem of curved surface machining. Li et al. [16] found that the quality of the machined surface depended on the length of an interpolation line segment. Sharp corners were formed at the intersection of straight sections, leading to increased stress concentration. To investigate the relationship between surface quality and interpolation line length in surface machining, they prepared a mathematical model of the surface topography in 3-axis ball-end milling of curved surfaces, based on acceleration and deceleration control. They found that when the length of the interpolation lines and the radius of curvature were constant, the stress concentration factor would decrease with increasing the central angle. When the radius of curvature and the central angle were maintained constant, the stress concentration factor increased with increasing the interpolation line length. A study [17] modelled process geometry (including feed direction, equivalent feed per tooth, and cutter entry/exit angle) in curved surface machining. The entire milling process was discretized into a series of small, straight surface milling cuts at feed per tooth intervals along the tool path, for which mathematical models of the process geometry were developed. Based on the conducted tests, it was found that the simulated cutting forces were consistent with the measurements in both magnitude and shape, with a difference of less than 12%, which confirmed the validity of the proposed mathematical models for calculating process geometry in curved surface machining. A study by Desai et al. [18] focused on modelling the process geometry in machining curved surfaces, specifically considering the effect of cutter runout. A mathematical model was introduced to calculate key process geometry parameters such as cutter–workpiece engagement and instantaneous uncut chip thickness, while accounting for cutter runout. Unlike simpler models, this approach incorporated the interaction between the current cutting tooth trajectory and those of previous teeth, resulting in a more accurate and realistic representation. Simulation results highlighted the importance of considering these trajectory interactions for precise prediction of machining parameters. The results clearly demonstrated that accurately determining process geometry under these conditions required a structured and comprehensive modelling approach, as proposed by the work.
Luo et al. [19] based their research on real-time deflection monitoring in the milling of a thin-walled element using thin-film PVDF (polyvinylidene fluoride) sensors with a cantilevered beam. The sensor was attached to the non-machined surface of the workpiece to copy the deflection excited by the dynamic cutting force. The correlation between input deflection and output voltage in the monitoring system was established through calibration testing. An analysis of the measured workpiece deflection indicated significant vibration as the cutting tool engaged in the material, and continuous vibration during machining was effectively captured by tracking workpiece deflection. Upon tool exit, the workpiece initially underwent forced vibration, followed by free vibration that gradually diminished until it was fully damped. The machining tests validated the effectiveness of the deflection monitoring approach, demonstrating the viability of using PVDF sensors for real-time vibration assessment in thin-walled component machining. Ma et al. [20] also applied a sensor module integrating a thin-film PVDF piezoelectric strain sensor with an in situ data logging system, which was developed to monitor feed and transverse forces in peripheral end milling. Mounted on the tool shank, the module captured dynamic tool strains and recorded data locally. Its close proximity to the signal source ensured minimal distortion and high signal fidelity. Using the Euler–Bernoulli beam theory and piezoelectric constitutive equations, they found that the measured signals were correlated to cutting forces. Experimental results showed high agreement with the measurements from a platform-type piezoelectric dynamometer. Huo et al. [21] analysed tool deflection in micro-milling and its influence on cutting forces and surface formation. A mathematical model was employed to calculate the distribution of cutting forces on the tool, incorporating the effects of tool elasticity and runout to determine the resulting deflection. Enhanced models for cutting force prediction and sidewall surface generation were developed, explicitly accounting for tool deflection. Experimental validation through micro-end-milling tests demonstrated a strong correlation between the simulated results and the experimental data, confirming the accuracy of the proposed models. Dépincé and Hascoet [22] based their research on prediction accounting for surface errors using a contact point method, considering tool deflection caused by the cutting force. To enable fast yet accurate surface evaluation, a cantilever beam model with an equivalent tool diameter was employed in their study. The milled surface geometry was determined using a contact point approach, showing its reliable performance for both constant and variable radial depths of cut. The accurate estimation of the surface profile allowed for offline prediction of the final machined geometry. Rao et al. [23] analysed the compensation of surface errors caused by tool deflection due to cutting forces in the peripheral milling of complex shapes with continuously varying curvature. Their work proposed a CNC-based tool path compensation strategy tailored for curved geometries, utilizing a mechanistic model for cutting force prediction and a cantilever beam model to estimate tool deflection. Experimental results across various geometries confirmed that the proposed approach significantly enhanced dimensional accuracy in the milling of curved surfaces.
Given that milling is characterized by intermittent tool operation and variable cross-section of the cut layer, the use of end mills poses a significant problem related to the deflection (from the nominal axis) of the tool due to the impact of the cutting force generated during machining [24]. Denkena et al. [25] introduced a sensory spindle slide system for real-time tool deflection control during high-speed milling. Lyu et al. [26] modelled 3D surface topographies in slot milling by incorporating time-dependent tool deflection into their simulation framework. Safari and Razfar [27] combined milling simulation with a genetic algorithm to predict cutting forces and minimize tool deflection.
Despite extensive research on tool deflection and machining dynamics, there remains a clear gap in experimental studies that simultaneously consider both technological parameters and tool path geometry in the milling of curvilinear surfaces. Most existing works have concentrated either on modelling cutting forces or on analysing process parameters in isolation, while the combined effect of surface profile geometry (amplitude and term) and tool characteristics (number of flutes) on tool deflection has not been comprehensively investigated. The research motivation is to experimentally evaluate these interactions under controlled conditions. The results of this study are expected to provide practical guidelines for minimizing tool deflection and improving dimensional accuracy in precision milling of curvilinear surfaces.
The objective of this study is to investigate end mill deflection in the milling of a curvilinear profile surface. Specifically, a relationship between tool deflection δ [mm] and time t [s] is examined, as well as its maximum value is determined for the following variable parameters: cutting speed vc [m/min], feed per tooth fz [mm/tooth], term T [mm], amplitude A [mm], and the number of tool blades (z = 2 and z = 3).
2. Materials and Methods
Experiments were performed to measure real-time tool deflection with the use of a high-resolution laser sensor. In addition, test samples of specified curvilinear geometry were designed, which made it possible to determine the effect of tool path geometry on obtained results.
Experiments were conducted on the samples made of aluminium alloy EN AW-7075 T651, a grade which is widely used in the aerospace industry and the design of structures requiring high strength-to-weight ratio. This material has very good machinability, high mechanical strength and moderate fatigue corrosion resistance. The chemical composition of this alloy is listed in Table 1.

Table 1.
Chemical composition of aluminium alloy EN AW-7075 T651 (wt%) (own elaboration, based on [28]).
For purposes of the experiments, a set of test samples was prepared. The exemplary geometry of these samples is shown in Figure 1. The choice of such geometry resulted from its practical application, e.g., as turbine blades. Figure 1a shows a 3D model of a curvilinear profile sample after milling, while Figure 1b shows a dimensioned drawing of a curvilinear part for T = 30 mm and A = 3 mm.
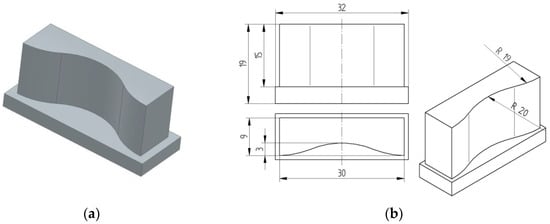
Figure 1.
Exemplary geometric model of a sample: (a) 3D model of a sample after milling, (b) technical drawing showing the dimensions of a curved geometry sample: T = 30 mm, A = 3 mm.
Test samples were fabricated for different amplitude/term combinations. Five different amplitudes were tested: A = 1, 2, 3, 4, and 5 mm, and five different variants of the term: T = 20, 25, 30, 35, and 40 mm. As a result, a total of 25 unique geometric configurations were obtained reflecting different combinations of tool path parameters (e.g., A = 3 mm and T = 30 mm). These parameters made it possible to make a systematic assessment of the impact of variable curvilinear profile surface on the dynamic characteristic of the milling process, that is—tool deflection. The tested variants made it possible to reproduce actual machining conditions for a curvilinear surface as well as to determine the impact of sudden changes in a milling path direction on the generated cutting forces and resulting tool deflection.
Machining tests were conducted on a vertical machining centre, CNC Avia VMC 800 HS, which is dedicated to 3-axis precision machining. The machine has a high rigidity of the kinematic system, which allows for tool deflection measurements with minimum system errors resulting from the machine design. Basic parameters of this machining centre are:
- work tool surface: 1000 × 540 mm,
- displacement in the axes X/Y/Z: 800/540/620 mm,
- maximum spindle rotation: 24,000 rev/min,
- maximum feed rate: 40 m/min.
The milling process was conducted using two SECO cutting tools (Figure 2) designed for ISO N materials, including aluminium alloys. Specifically, the following end mills were employed:
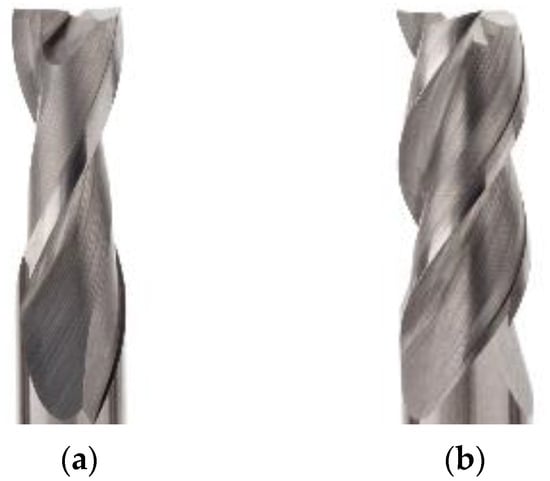
Figure 2.
End mills used in the study: (a) 2-flute JS412120D2SZ2.0, (b) 3-flute JS413120D2SZ3.0.
They were selected to investigate the impact of the number of flutes on the process dynamics and tool defection in the milling of curvilinear surfaces. These tools have optimized geometry to be suitable for high-performance machining of lightweight alloys and their coated blades ensure increased wear resistance and improved chip removal. Table 2 presents technical parameters of cutting tools.

Table 2.
Technical parameters of cutting tools.
The experiments were conducted under dry and down milling conditions, including constant and variable technological parameters of finishing operation. Prior to the actual milling process, test samples were rough milled in order to achieve the preliminary profile of the desired curvilinear surface. The milling process diagram is presented in Figure 3.
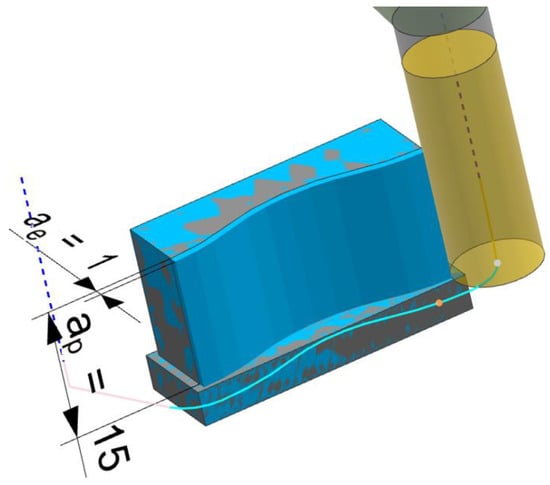
Figure 3.
Milling process diagram.
The following parameters were maintained constant during finishing:
- the axial depth of cut: ap = 15 mm,
- the radial depth of cut: ae = 1 mm.
The following variables were investigated in terms of their impact on tool deflection:
- cutting speed vc: five values were tested ranging 300–900 m/min, changed every 150 m/min (i.e., vc = 300, 450, 600, 750, 900 m/min),
- feed per tooth fz: five values were tested ranging 0.025–0.125 mm/tooth, changed every 0.025 mm/tooth (i.e., fz = 0.025; 0.050; 0.075; 0.100; 0.125 mm/tooth).
In addition to the variable parameters of machining, two cutting tools with different numbers of flutes (2 and 3 flutes) and variable tool path geometry (amplitude and term) were used in the experiments, which made it possible to assess the impact of the tested combinations of technological parameters and tool trajectories on tool deflection in milling.
Tool deflection was measured with a laser linear profile sensor, Gocator 2530A-2-B-01-S, from LMI Technologies (Burnaby, Canada), operated with a network controller, Gocator Master 810. The Gocator 2530 profiler (Figure 4) allows for measurements with inspection speeds up to 10 kHz at resolution ranging 0.028–0.054 mm.
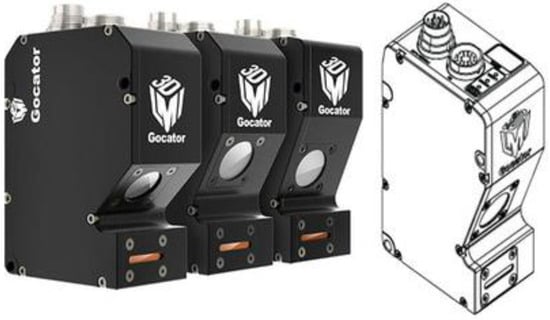
Figure 4.
Laser line profile sensor Gocator 2530A-2-B-01-S used for measuring real-time tool deflection.
Figure 5 shows schematically the phenomenon of tool deflection in milling. Figure 5a shows a real situation when the cutting tool is impacted by the cutting force causing its deflection from the nominal axis. This type of deformation causes the tool trajectory to be deflected from the planned path, which may result in dimensional errors and reduced surface quality. Figure 5b shows the shape of a workpiece after milling with tool deflection. One can see a difference between the nominal and the actual profile of the surface, which is due to the tool deflection during milling.
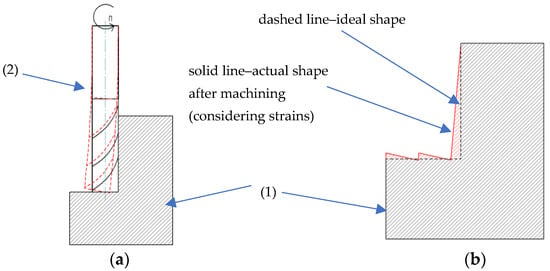
Figure 5.
Effect of tool deflection in milling: (a) machining conducted with an end mill and its tool deflection from the nominal axis, (b) workpiece shape after machining (1—workpiece, 2—end mill).
Obtained data were used to design 3D plots illustrating interactions between the machining parameters, the number of flutes, and the tool deflection. An analysis of these relationships provided a basis for the assessment of the effect of technological parameters and machining path geometry on the dynamics of the machining process. The experimental results also served as a starting point for further optimisation of the milling strategy in terms of minimizing tool deflection and improving dimensional accuracy of machined surfaces. For the purpose of creating 3D plots and performing a statistical analysis, the experiments were conducted in compliance with the design of experiments (DoE) approach. To that end, we used the specialist software package Design-Expert® (23.1.8) allowing experiment design and analysis by advanced statistical modelling tools. Relationships between the input data and the output tool deflection were described by response surface methodology (RSM), which helps describe nonlinear relationships between parameters of the process and its results. This approach allows not only for data interpolation but also for setting the directions of technological parameters optimization. The experiments were conducted in compliance with the central composite design (CCD), which made it possible to assess both linear and quadratic effects together with interactions between the input variables. The experimental design covered all tested range variants of cutting speed, feed per tooth, term, amplitude, and the number of flutes.
3. Results
The study investigated the impact of parameters such as cutting speed, feed per tooth, and the number of flutes on the maximum tool deflection. Recorded signals made it possible to identify characteristic deflection areas and to assess the variations in deflection for different configurations of machining parameters. The characteristics of tool deflection were found to correspond to the periodic change in the workpiece profile described by the parameters: term and amplitude.
Below is given an example of signal analysis. Figure 6 shows an example of tool deflection δ [mm] as a function of t [s], measured in the milling process for a sample with a curvilinear geometry described by:
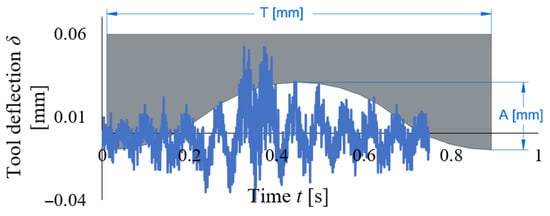
Figure 6.
Tool deflection δ [mm] versus time t [s] for a curved path of machining.
- amplitude A = 3 mm,
- term T = 30 mm.
The milling process was conducted with the following:
- cutting speed vc = 600 m/min,
- feed per tooth fz = 0.075 mm/tooth,
- number of flutes z = 2.
Tool deflection was measured toward the Y-axis of the machine. The signals clearly show areas reflecting subsequent stages of the machining process, where the deflection values significantly increase at the relative extreme of the curvilinear profile
A key parameter of the analysis was the maximum tool deflection as a difference between the greatest and the smallest measured tool deflection in a given trial (1):
δmax = δmax_measurement − δmin_measurement
Based on the plot (Figure 6), the following conclusions can be drawn:
- deflection occurs in cycles, which suggests the occurrence of repeated maximum deflection values in specified time intervals consistent with the term T,
- the presence of these clearly local maximum deflection values may indicate temporary increases in the cutting force,
- deflection measurements did not consider the impact of the tool’s axial run-out, which may affect the interpretation of results,
- the tool deflection exhibits repeatability in specified time intervals, which may result from regular variations in the cutting force when the tool passes through the workpiece,
- the observed peaks may results from temporary variations in the cutting forces caused by, e.g., variable chip thickness, workpiece material inhomogeneity, free vibrations of the machine tool system,
- the results can help optimize the cutting parameters in order to minimize tool deformation and improve process stability.
In effect, this parameter makes it possible to clearly assess the extent of tool deflection in the machining process. Obtained signal waveforms were preliminarily filtered in order to eliminate random noise and single brief peaks which could considerably distort the actual tool deflection value and thus lead to erroneous conclusions. To eliminate outliers, a filter was applied that removed 0.5% of the maximum signal values (the 99.5th percentile).
Filtered data are shown as 3D plots illustrating the effect of the tested variables on the tool deflection δ. The plots are shown in Figure 7, Figure 8, Figure 9, Figure 10, Figure 11, Figure 12 and Figure 13. For comparison purposes, the plots show the tool deflection results for two variants of tool geometry:
- a tool with two flutes (z = 2),
- a tool with three flutes (z = 3).
This comparison made it possible to determine the impact of the number of flutes on the stability of the machining process and the range of generated dynamic deformation. It must be stressed that the comparison was made for the intermediate values of the tested machining parameters, which means that the combinations including the extreme values (minimum and maximum) of cutting speed and feed per tooth were omitted in the analysis. This was done to prevent boundary effects and to ensure the comparison’s reliability.
The experimental results, in accordance with research plan, are presented in Table A1.
3.1. Effect of Cutting Speed and Feed per Tooth on Tool Deflection
Figure 7 shows the effect of the cutting speed vc and the feed per tooth fz on the tool deflection δ. The results were obtained for the constant intermediate amplitude A = 3 mm and the term T = 30 mm, in compliance with the experiment design.
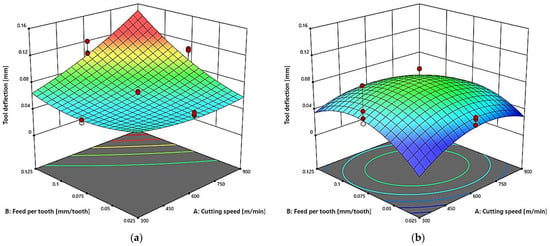
Figure 7.
Cutting speed (vc) and feed per tooth (fz) versus the tool deflection δ in a milling process conducted with A = 3 m and term T = 30 mm, for: (a) two-flute end mill (z = 2), (b) three-flute end mill (z = 3).
For the two-flute end mill (Figure 7a), one can observe a clear increase in the tool deflection with increasing the cutting speed and feed per tooth. The highest deflection values exceeding δ = 0.12 mm were obtained at the maximum values of the tested technological parameters. The minimum deflections occurred at low cutting speeds and feeds, with their values never dropping below 0.04 mm over the entire tested range. For the three-flute end mill (Figure 7b), the deflection values are significantly lower compared to those obtained for the two-flute tool. The deflection mainly increases with the cutting speed, while the impact of the feed per tooth on the deflection value is minimal for this configuration. The maximum deflection value did not exceed δ = 0.09 mm, which indicates higher stability of the milling process conducted with the three-flute tool. The higher number of flutes has a positive effect on reducing tool deflection during machining. The three-flute end mill ensures more stable cutting conditions, especially at higher cutting speeds. The cutting speed vc is the dominant factor affecting deflection, while the impact of the feed per tooth fz is more pronounced for the two-flute tool.
3.2. Effect of Cutting Speed and Amplitude on Tool Deflection
An analysis of the data in Figure 8 reveals that the cutting speed vc and the curvature amplitude A affect the tool deflection δ. The analysis was performed by maintaining the other parameters constant, i.e., the feed per tooth fz = 0.075 mm/tooth and the term T = 30 mm.
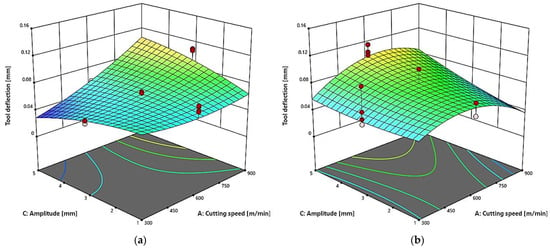
Figure 8.
Cutting speed (vc) amplitude (A) versus the tool deflection δ in a milling process conducted with fz = 0.075 mm/tooth and T = 30 mm, for: (a) two-flute end mill (z = 2), (b) three-flute end mill (z = 3).
For the two-flute end mill (Figure 8a), the tool deflection clearly increases with increasing the cutting speed and amplitude. The maximum deflection of approximately 0.12 mm was obtained at the highest tested amplitude A = 5 mm and the highest cutting speed vc = 900 m/min. In contrast, the minimum deflection value of below 0.04 mm was obtained at the lowest amplitude A = 1 mm and the cutting speed vc = 300 m/min. For the three-flute end mill (Figure 8b), the obtained deflection values are noticeably lower over the entire tested range when compared to those for the two-flute tool. The main trend indicates that the tool deflection increases with the cutting speed vc, while the effect of the amplitude A is less pronounced and does not cause such rapid changes in deflection values. The maximum deflection of the three-flute tool also occurs at high amplitudes and high cutting speeds, but these deflection values are lower than those observed for the two-flute tool, which confirms a more stable operation of the tool with a larger number of flutes.
3.3. Effect of Cutting Speed and Term on Tool Deflection
Response surface plots shown in Figure 9 were used to determine the effect of the variable cutting speed vc and curvature term T on the tool deflection δ in milling.
The results are shown for a milling process conducted with the constant amplitude A = 3 mm and the constant feed per tooth fz = 0.075 mm/tooth. For the two-flute end mill (Figure 9a), an increase in the cutting speed causes a gradual increase in the tool deflection, which is particularly visible at higher term values. The use of a lower term results in reduced deflection of the tool, with the lowest deflection observed at the lowest term and the lowest cutting speed. The highest deflection occurs when the maximum cutting speed and the maximum term are applied at the same time. For the three-flute tool (Figure 9b) a similar trend can be observed, however the deflection values are lower over the entire tested range. The cutting speed has the main impact on tool deflection, while the impact of the variable term is less pronounced. The use of a higher term augments the impact of cutting speed increase on tool deflection, nevertheless this impact is smaller than that observed for the tool with two flutes.
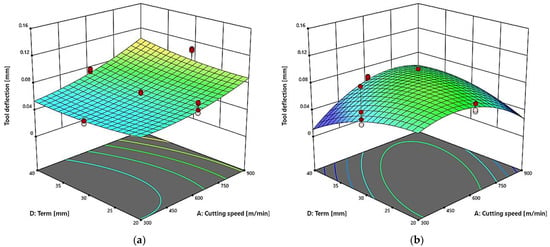
Figure 9.
Effect of cutting speed (vc) and curvature term (T) on the tool deflection δ in a milling process conducted with fz = 0.075 mm/tooth, and A = 30 mm, for: (a) two-flute end mill (z = 2), (b) three-flute end mill (z = 3).
3.4. Effect of Feed per Tooth and Profile Amplitude on Tool
3D plots in Figure 10 illustrate the impact of the variable feed per tooth fz and the variable amplitude A on the tool deflection δ during machining. The results are shown for a milling process conducted with the constant cutting speed vc = 600 m/min and the constant curvature term T = 30 mm.
For the two-flute end mill (Figure 10a) the highest tool deflection was observed when the feed per tooth and amplitude values were increased simultaneously. The lowest deflection was observed for the minimum values of both, which indicates that the milling process is more stable under limited dynamic load. The impact of amplitude is particularly important due to the fact that an increase in amplitude led to a considerable increase in deflection, this impact increasing with feed. For the three-flute end mill (Figure 10b) the deflection values are clearly lower over the entire tested range of parameters than those observed for the two-flute tool. Increased feed and amplitude have a smaller impact on tool deflection than was the case with the two-flute tool. One can only observe a slight increase in tool deflection at high amplitude values, particularly with higher feeds. The results confirm that the use of a higher number of flutes reduces the impact of the dynamic variables on the stability of the milling process, which helps minimize tool deflection.
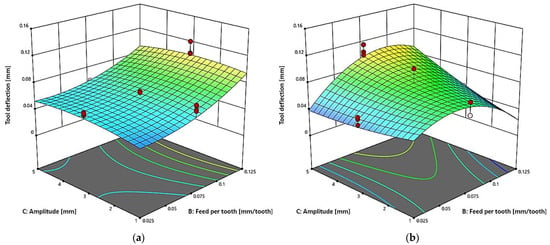
Figure 10.
Effect of feed per tooth (fz) and curvature amplitude (A) on tool deflection δ in a milling process conducted with vc = 600 m/min and T = 30 mm, for: (a) two-flute end mill (z = 2), (b) three-flute end mill (z = 3).
3.5. Effect of Feed per Tooth and Term on Tool Deflection
Figure 11 shows the effect of the feed per tooth fz and the curvature term T on the tool deflection δ during machining. The results are shown for a milling process conducted with the constant cutting speed vc = 600 m/min and the constant amplitude A = 3 mm.
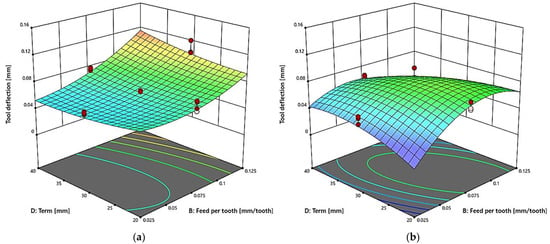
Figure 11.
Effect of feed per tooth (fz) and term (T) on tool deflection δ in a milling process conducted with vc = 600 m/min and A = 3 mm, for: (a) two-flute end mill (z = 2), (b) three-flute end mill (z = 3).
For the two-flute end mill (Figure 11a), the tool deflection clearly tends to increase with increasing feed per tooth and term. The highest deflection values oscillating about 0.12 mm were obtained for the combinations of maximum feeds and terms. This is due to increasing dynamic loads on the tool-workpiece system. The lowest deflection of 0.04 mm was obtained at low values of both analysed parameters, which confirms that the milling process is more stable under such conditions. For the three-flute end mill (Figure 11b), the impact of parameter variations is noticeably smaller, and the deflection values over the tested range remain lower than for the two-flute tool. The use of higher feed per tooth and term also results in higher tool deflection, albeit these changes are smaller. The plot characteristics confirm the greater stability of the machining process conducted with the three-flute tool.
3.6. Effect of Amplitude and Term on Tool Deflection
Figure 12 shows relationships between the tool deflection δ as a function of the curvature amplitude A and the curvature term T for the fixed cutting speed vc = 600 m/min and feed per tooth fz = 0.075 mm/tooth. For the two-flute end mill (Figure 12a), one can observe a clear tendency for the deflection to increase as the amplitude and term are increased.
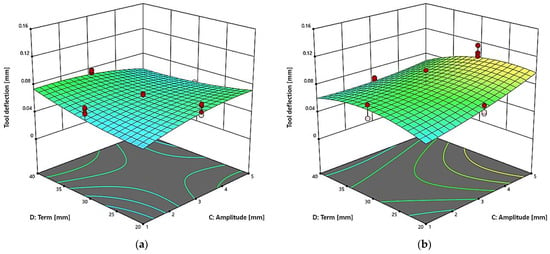
Figure 12.
Effect of amplitude (A) and term (T) on tool deflection δ in a machining process conducted with vc = 600 m/min and fz = 0.075 mm/tooth, for: (a) two-flute end mill (z = 2), (b) three-flute end mill (z = 3).
The highest deflection values were obtained for the combinations with the maximum values of the tested parameters. This may indicate an increase in the dynamic tool deflection when the tool path geometry is significantly changed. The smallest deflection values were observed for a low amplitude of A = 1 mm and a short term of T = 20 mm, which confirms the beneficial effect of these parameters on the stability of the machining process. For the three-flute end mill (Figure 12b) the tool deflection values are considerably lower over the entire tested range. This confirms the more favourable machining conditions and greater rigidity of the three-flute tool. The use of higher amplitude and term also results in higher deflection, but these values remain noticeably lower than those obtained for the two-flute end mill. Such distribution of the results indicates lower dynamic loads and more stable conditions in the machining process conducted with the three-flute end mill, which may result in better surface quality of the workpiece and reduced tool wear.
Table 3 lists the results of statistical analysis (ANOVA) for tool deflection. The ANOVA results confirm the significant impact of the selected machining parameters and interactions between them on tool deflection in milling.

Table 3.
Statistical analysis (ANOVA) results of tool deflection.
The most significant main factors with the greatest impact on the deflection value are the cutting speed (A), feed per tooth (B), and curvature amplitude (C), for which the value of p < 0.0001, which clearly indicates their statistical significance. The number of flutes (E) also proved to be a significant factor (p = 0.0230), although its impact was slightly smaller. The results of the analysis showed the significance of a series of interactions between the parameters under study. A particularly strong effect was observed for the interactions AE, BE, CE, ABE, and BDE, which indicates a high sensitivity of the measurement system to the number of flutes in combination with other machining parameters. The value p < 0.0001 for these interactions confirms their significant impact on the deflection of the tool. In turn, the interactions such as AB, AD, CD, and DE also reached a level of significance, albeit with less impact. The analysis also showed a significant impact of quadratic effects, especially A2 and B2, which confirms the nonlinear nature of changes in tool deflection in relation to these parameters. It is worth stressing the high value of the F-statistic for the main model (F = 17.93), which confirms the good quality of the model’s fit to the experimental data and allows it to be considered statistically significant (p < 0.0001). At the same time, the Lack of Fit test also proved to be significant (p < 0.0001), which may suggest the need for further analysis of the nonlinear relationships or for the consideration of additional factors affecting the process. The statistical analysis results clearly confirm the significant impact of cutting speed, feed per tooth, amplitude, and the number of flutes on tool deflection. Furthermore, the demonstrated presence of significant interactions between the parameters indicates their interdependence and the complexity of phenomena occurring during machining. These results are consistent with the observations obtained from the analysis of the 3D plots, which also indicated a strong influence of the number of flutes and the complex interactions between the machining conditions on the stability of the milling process. Table 4 shows regression equations for tool deflection amplitude.

Table 4.
Regression equations for tool deflection amplitude.
Figure 13 shows the main effects plots for the tested number of flutes. The first plot (Figure 13a) shows a very slight effect of changing the number of flutes from two to three on the tool deflection value. The average deflection value remains almost unchanged, suggesting that under the given cutting conditions, the number of flutes does not play a significant role in tool deflection.
The deflection values for both variants are practically the same, and the differences are within the acceptable margin of error. In the second plot (Figure 13b), the impact of the number of flutes on tool deflection becomes more visible. An increase in the number of flutes from 2 to 3 causes a slight increase in the deflection value. When milling is conducted with the intermediate values of the tested parameters, the number of flutes begins to affect the dynamics of the milling process. The increase in the deflection value with increasing the number of flutes can result from more complex interactions of the cutting force, particularly at higher dynamic loads. In the final plot (Figure 13c) one can observe an opposite relationship, i.e., as the number of flutes is increased, the tool deflection is reduced. At the maximum values of the tested parameters, the use of the three-flute end mill causes the tool deflection to decrease. This may results from a more uniform distribution of the cutting forces due to the use of more flutes, which, consequently, reduces the deflection value. The observed differences between the plots confirm the strong impact of machining conditions on the significance of the number of flutes in tool deflection control. With moderate parameters, the number of flutes plays no significant role. At higher parameters, however, the number of flutes becomes more significant depending on a given configuration of parameters—in one case, it increases tool deflection, but in another case, it reduces it. It can also be seen that the scatter of results was greater when using the three-flute tool. This indicates greater changes in the dynamics of the cutting process. However, most results were concentrated at similar deflection value. This proves that the phenomena occurring during machining processes are very complex and that the interactions between process parameters must be taken into account for process optimization.
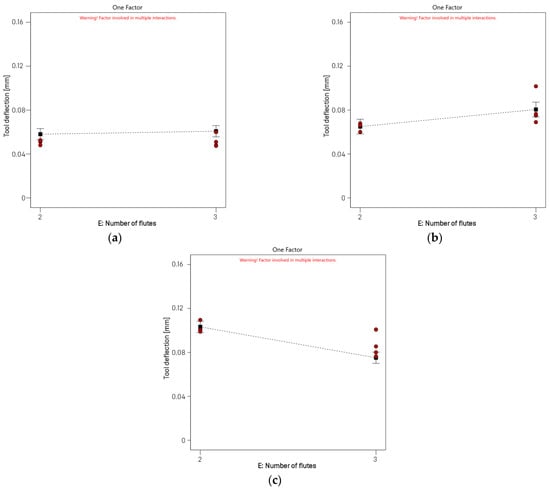
Figure 13.
Main effects plots showing the impact of the number of flutes: (a) vc = 450 m/min, fz = 0.05 mm/tooth, A = 2 mm, T = 25 mm; (b) vc = 600 m/min, fz = 0.075 mm/tooth, A = 3 mm, T = 30 mm; (c) vc = 750 m/min, fz = 0.1 mm/tooth, A = 4 mm, T = 35 mm.
4. Discussion
The results clearly demonstrate that tool deflection in curvilinear surface milling significantly depend on both technological parameters (e.g., cutting speed and feed per tooth) and tool features (number of flutes). The results agree with the findings of previous studies [1,2,3], which showed that the cutting force and dynamic phenomena had a significant impact on the dimensional accuracy and process stability in the milling of parts with complex geometries.
Specifically, the cutting speed (vc) was identified as the main factor affecting tool deflection, which agrees with the findings of previous studies [4,5]. An increase in the cutting speed leads to higher dynamic loads, which results in greater tool deformation, particularly in the case of less rigid end mills. In a similar fashion, the feed per tooth (fz) has a strong impact on the deflection of the two-flute end mill, whereas this impact is clearly smaller on the tool with three flutes, which proves that the tool with a greater number of flutes is more resistant to dynamic load.
A novel contribution of this study is that it takes into account the impact of tool path geometry—i.e., the amplitude (A) and term (T) of a surface profile—on tool deflection. Previous studies have rarely considered this aspect, focusing mainly on the impact of machining parameters. The results have demonstrated that an increase in amplitude causes a significant increase in tool deflection, particularly when combined with increased feed. The impact of the term T is moderate, although it increases when high values of other parameters are used. This behaviour pattern confirms the hypothesis saying that sudden changes in tool path direction lead to increased dynamic loads.
An analysis of interactions between the technological and geometric parameters (e.g., AE, BE, CE, ABE, BDE) has revealed the presence of strong nonlinear interdependent relationships between the variables. These complex interdependencies have been confirmed by the results of both response surface analysis and ANOVA statistical analysis. It should be highlighted that previous studies seldom considered the aspects of tool path geometry and the number of flutes at the same time, an undertaking which is a significant contribution of this work.
The nonlinear interactions observed between machining parameters can be interpreted through the principles of classical cutting mechanics. The end mill can be approximated as a cantilever beam subjected to distributed cutting forces, where deflection depends on both tool rigidity and dynamic loading [25]. Cutting speed (vc) directly influences the dynamic cutting force amplitude, while feed per tooth (fz) determines the instantaneous uncut chip thickness, which in turn modifies the distribution of cutting forces [9]. An increase in profile amplitude (A) amplifies chip thickness variation due to the changing tool engagement angle, thereby intensifying the cyclic bending load on the tool [1]. The combination of these effects explains why nonlinear interactions such as AE (cutting speed × number of flutes) or BE (feed × number of flutes) were statistically significant in the ANOVA. These observations are consistent with established cutting force models and predictive approaches for tool deflection in milling [27].
From a practical point of view, the results demonstrate that the optimization of a milling process for a curvilinear surface must take into account both standard parameters (vc, fz) and tool path geometry. It has been shown that tools with three flutes ensured higher stability of the machining process under dynamic conditions, which is of crucial importance in high precision applications or at high cutting speeds.
Future directions of research in this area include:
- extending the scope of analyses to include 5-axis machining and 3D trajectories,
- considering the effects of overhang length and tool holder rigidity,
- developing methods for compensating tool deflection in real time,
- the use of artificial intelligence methods (i.e., neural networks and machine learning) to optimize tool path in terms of minimized deflection (it is an interesting research area).
Summing up, this study has provided in-depth insight into the effects of machining parameters and tool path geometry on tool deflection, and the proposed approach to modelling this problem can serve as an auxiliary tool for optimizing milling processes for parts with complex shapes.
5. Conclusions
The results of the experiments, deflection signals, ANOVA, and response surface models (RSMs) led to the following conclusions:
- Tool deflection in curvilinear surface milling is cyclic, which results from periodic variations in tool path profile (parameter T). The signal characteristics clearly show the presence of local maximum deflections occurring at regular time intervals.
- The maximum tool deflection (δmax) increases primarily with the cutting speed (vc) and the amplitude (A). These two factors have the greatest impact on the dynamic deflection range of the tool.
- Feed per tooth (fz) has a significant effect on tool deflection, particularly with respect to the two-flute end mill. For a tool with three flutes, this impact is weaker, which indicates higher dynamic rigidity and stability of the machining process conducted using tools with a greater number of flutes.
- The number of flutes (z) plays an important role in the behaviour pattern of deflection:
- the use of a three-flute tool results in lower deflection and high stability of the milling process,
- the effect of a greater number of flutes depended on the configuration of parameters– in some cases, the greater number of flutes reduced tool deflection, but in other cases, this caused a slight increase in deflection.
- 5.
- The obtained tool deflection signals indicate the presence of local peaks that can result from:
- temporary increases in the cutting force,
- variable chip thickness and material inhomogeneity,
- free vibrations of the machine tool system and micro vibrations of the tool.
- 6.
- The high signal oscillation frequency may indicate the presence of micro vibrations that negatively affect surface quality and tool wear.
- 7.
- Tool deflection measurements were made in the Y-axis direction. The deflection increases visible in the signal characteristics correlate with the position of the tool in the workpiece, an important observation which can be used when designing adaptive methods of deflection compensation.
- 8.
- The effect of axial run-out was not considered in the measurements, a fact which must be taken into consideration when interpreting the results. Since axial run-out may affect temporary tool deflection, it is worth investigating its compensation in future studies.
- 9.
- The use of design of experiment methods (DoE) and response surface methodology (RSM) made it possible to create reliable regression models and identify linear effects affecting the interactions between parameters.
- 10.
- The results provide a basis for the optimization of milling strategies for curvilinear surfaces by offering guidance on the selection of conditions that minimize tool deflection and increase process stability.
Author Contributions
Conceptualization, M.L., M.Z.-M., P.P. and J.J.; methodology, M.L., M.Z.-M., P.P., J.K., K.A. and J.L.; software, M.L., M.Z.-M. and P.P.; validation, M.L., M.Z.-M., P.P., K.B.-U., J.J., J.K., K.A. and J.L.; formal analysis, M.L., M.Z.-M., K.B.-U. and J.K.; investigation, M.L., M.Z.-M., P.P., J.K. and J.L.; resources, M.L., M.Z.-M., P.P., J.K. and J.L.; data curation, M.L., M.Z.-M., P.P., J.K. and J.L.; writing—original draft preparation, M.L., M.Z.-M., K.B.-U., J.K. and K.A.; writing—review and editing, M.Z.-M., P.P., J.J. and W.H.; visualization, M.L., M.Z.-M. and P.P.; supervision, M.Z.-M., J.J. and W.H.; project administration, M.Z.-M. and W.H.; funding acquisition, M.Z.-M. and W.H. All authors have read and agreed to the published version of the manuscript.
Funding
Research work co-financed from the state budget under the programme of the Minister of Science and Higher Education Republic of Poland called ‘Polish Metrology II’, project number PM-II/SP/0040/2024/2, amount of funding: 968,000.00 PLN, total value of the project: 968,000.00 PLN. Project title: “Multisensory system for measuring thermos-mechanical interactions with comprehensive condition analysis”.
Institutional Review Board Statement
Not applicable.
Informed Consent Statement
Not applicable.
Data Availability Statement
The original contributions presented in this study are included in the article. Further inquiries can be directed to the corresponding author.
Conflicts of Interest
The authors declare no conflicts of interest.
Appendix A

Table A1.
Experimental results (in accordance with the research plan).
Table A1.
Experimental results (in accordance with the research plan).
| Std | Run | Cutting Speed [m/min] | Feed Per Tooth [mm/tooth] | Amplitude [mm] | Term [mm] | Number of Flutes [-] | Tool Deflection [mm] |
|---|---|---|---|---|---|---|---|
| 70 | 1 | 900 | 0.075 | 3 | 30 | 2 | 0.1091 |
| 106 | 2 | 750 | 0.05 | 2 | 25 | 3 | 0.0644 |
| 126 | 3 | 450 | 0.1 | 4 | 25 | 3 | 0.0906 |
| 42 | 4 | 450 | 0.1 | 2 | 35 | 2 | 0.069 |
| 157 | 5 | 450 | 0.1 | 4 | 35 | 3 | 0.0525 |
| 98 | 6 | 600 | 0.075 | 3 | 30 | 2 | 0.0679 |
| 155 | 7 | 750 | 0.05 | 4 | 35 | 3 | 0.0853 |
| 138 | 8 | 750 | 0.05 | 2 | 35 | 3 | 0.0717 |
| 30 | 9 | 750 | 0.1 | 4 | 25 | 2 | 0.1099 |
| 29 | 10 | 750 | 0.1 | 4 | 25 | 2 | 0.1061 |
| 33 | 11 | 450 | 0.05 | 2 | 35 | 2 | 0.052 |
| 88 | 12 | 600 | 0.075 | 5 | 30 | 2 | 0.0568 |
| 110 | 13 | 450 | 0.1 | 2 | 25 | 3 | 0.0724 |
| 27 | 14 | 450 | 0.1 | 4 | 25 | 2 | 0.054 |
| 181 | 15 | 600 | 0.075 | 1 | 30 | 3 | 0.0791 |
| 178 | 16 | 600 | 0.125 | 3 | 30 | 3 | 0.0435 |
| 74 | 17 | 600 | 0.025 | 3 | 30 | 2 | 0.06 |
| 174 | 18 | 600 | 0.025 | 3 | 30 | 3 | 0.0545 |
| 128 | 19 | 450 | 0.1 | 4 | 25 | 3 | 0.0837 |
| 102 | 20 | 450 | 0.05 | 2 | 25 | 3 | 0.0474 |
| 125 | 21 | 450 | 0.1 | 4 | 25 | 3 | 0.0912 |
| 61 | 22 | 750 | 0.1 | 4 | 35 | 2 | 0.1005 |
| 147 | 23 | 750 | 0.1 | 2 | 35 | 3 | 0.0528 |
| 50 | 24 | 450 | 0.05 | 4 | 35 | 2 | 0.0503 |
| 184 | 25 | 600 | 0.075 | 1 | 30 | 3 | 0.0788 |
| 122 | 26 | 750 | 0.05 | 4 | 25 | 3 | 0.063 |
| 123 | 27 | 750 | 0.05 | 4 | 25 | 3 | 0.0645 |
| 196 | 28 | 600 | 0.075 | 3 | 40 | 3 | 0.066 |
| 163 | 29 | 750 | 0.1 | 4 | 35 | 3 | 0.1008 |
| 56 | 30 | 750 | 0.05 | 4 | 35 | 2 | 0.0647 |
| 95 | 31 | 600 | 0.075 | 3 | 40 | 2 | 0.078 |
| 18 | 32 | 450 | 0.05 | 4 | 25 | 2 | 0.0645 |
| 58 | 33 | 450 | 0.1 | 4 | 35 | 2 | 0.06 |
| 26 | 34 | 450 | 0.1 | 4 | 25 | 2 | 0.0615 |
| 96 | 35 | 600 | 0.075 | 3 | 40 | 2 | 0.0773 |
| 156 | 36 | 750 | 0.05 | 4 | 35 | 3 | 0.0585 |
| 45 | 37 | 750 | 0.1 | 2 | 35 | 2 | 0.0889 |
| 39 | 38 | 750 | 0.05 | 2 | 35 | 2 | 0.0533 |
| 120 | 39 | 450 | 0.05 | 4 | 25 | 3 | 0.0525 |
| 171 | 40 | 900 | 0.075 | 3 | 30 | 3 | 0.052 |
| 141 | 41 | 450 | 0.1 | 2 | 35 | 3 | 0.048 |
| 66 | 42 | 300 | 0.075 | 3 | 30 | 2 | 0.054 |
| 40 | 43 | 750 | 0.05 | 2 | 35 | 2 | 0.054 |
| 65 | 44 | 300 | 0.075 | 3 | 30 | 2 | 0.0525 |
| 80 | 45 | 600 | 0.125 | 3 | 30 | 2 | 0.1206 |
| 170 | 46 | 900 | 0.075 | 3 | 30 | 3 | 0.0337 |
| 3 | 47 | 450 | 0.05 | 2 | 25 | 2 | 0.048 |
| 154 | 48 | 750 | 0.05 | 4 | 35 | 3 | 0.063 |
| 21 | 49 | 750 | 0.05 | 4 | 25 | 2 | 0.0608 |
| 192 | 50 | 600 | 0.075 | 3 | 20 | 3 | 0.069 |
| 38 | 51 | 750 | 0.05 | 2 | 35 | 2 | 0.0525 |
| 168 | 52 | 300 | 0.075 | 3 | 30 | 3 | 0.066 |
| 162 | 53 | 750 | 0.1 | 4 | 35 | 3 | 0.0855 |
| 161 | 54 | 750 | 0.1 | 4 | 35 | 3 | 0.0801 |
| 177 | 55 | 600 | 0.125 | 3 | 30 | 3 | 0.0465 |
| 137 | 56 | 750 | 0.05 | 2 | 35 | 3 | 0.0767 |
| 117 | 57 | 450 | 0.05 | 4 | 25 | 3 | 0.0535 |
| 59 | 58 | 450 | 0.1 | 4 | 35 | 2 | 0.0615 |
| 132 | 59 | 750 | 0.1 | 4 | 25 | 3 | 0.0915 |
| 109 | 60 | 450 | 0.1 | 2 | 25 | 3 | 0.0765 |
| 63 | 61 | 750 | 0.1 | 4 | 35 | 2 | 0.1005 |
| 107 | 62 | 750 | 0.05 | 2 | 25 | 3 | 0.063 |
| 75 | 63 | 600 | 0.025 | 3 | 30 | 2 | 0.0615 |
| 140 | 64 | 750 | 0.05 | 2 | 35 | 3 | 0.0705 |
| 16 | 65 | 750 | 0.1 | 2 | 25 | 2 | 0.069 |
| 71 | 66 | 900 | 0.075 | 3 | 30 | 2 | 0.1088 |
| 5 | 67 | 750 | 0.05 | 2 | 25 | 2 | 0.0552 |
| 142 | 68 | 450 | 0.1 | 2 | 35 | 3 | 0.052 |
| 35 | 69 | 450 | 0.05 | 2 | 35 | 2 | 0.054 |
| 7 | 70 | 750 | 0.05 | 2 | 25 | 2 | 0.0525 |
| 34 | 71 | 450 | 0.05 | 2 | 35 | 2 | 0.0495 |
| 131 | 72 | 750 | 0.1 | 4 | 25 | 3 | 0.0825 |
| 185 | 73 | 600 | 0.075 | 5 | 30 | 3 | 0.1041 |
| 152 | 74 | 450 | 0.05 | 4 | 35 | 3 | 0.057 |
| 115 | 75 | 750 | 0.1 | 2 | 25 | 3 | 0.0503 |
| 183 | 76 | 600 | 0.075 | 1 | 30 | 3 | 0.06 |
| 104 | 77 | 450 | 0.05 | 2 | 25 | 3 | 0.051 |
| 100 | 78 | 600 | 0.075 | 3 | 30 | 2 | 0.06 |
| 153 | 79 | 750 | 0.05 | 4 | 35 | 3 | 0.0627 |
| 182 | 80 | 600 | 0.075 | 1 | 30 | 3 | 0.06 |
| 121 | 81 | 750 | 0.05 | 4 | 25 | 3 | 0.0632 |
| 199 | 82 | 600 | 0.075 | 3 | 30 | 3 | 0.1017 |
| 133 | 83 | 450 | 0.05 | 2 | 35 | 3 | 0.048 |
| 179 | 84 | 600 | 0.125 | 3 | 30 | 3 | 0.0465 |
| 41 | 85 | 450 | 0.1 | 2 | 35 | 2 | 0.0735 |
| 114 | 86 | 750 | 0.1 | 2 | 25 | 3 | 0.0514 |
| 23 | 87 | 750 | 0.05 | 4 | 25 | 2 | 0.069 |
| 22 | 88 | 750 | 0.05 | 4 | 25 | 2 | 0.0615 |
| 94 | 89 | 600 | 0.075 | 3 | 40 | 2 | 0.0765 |
| 134 | 90 | 450 | 0.05 | 2 | 35 | 3 | 0.048 |
| 180 | 91 | 600 | 0.125 | 3 | 30 | 3 | 0.0509 |
| 145 | 92 | 750 | 0.1 | 2 | 35 | 3 | 0.0555 |
| 172 | 93 | 900 | 0.075 | 3 | 30 | 3 | 0.0441 |
| 24 | 94 | 750 | 0.05 | 4 | 25 | 2 | 0.074 |
| 186 | 95 | 600 | 0.075 | 5 | 30 | 3 | 0.0879 |
| 46 | 96 | 750 | 0.1 | 2 | 35 | 2 | 0.102 |
| 187 | 97 | 600 | 0.075 | 5 | 30 | 3 | 0.099 |
| 64 | 98 | 750 | 0.1 | 4 | 35 | 2 | 0.099 |
| 6 | 99 | 750 | 0.05 | 2 | 25 | 2 | 0.0507 |
| 17 | 100 | 450 | 0.05 | 4 | 25 | 2 | 0.051 |
| 72 | 101 | 900 | 0.075 | 3 | 30 | 2 | 0.1065 |
| 112 | 102 | 450 | 0.1 | 2 | 25 | 3 | 0.072 |
| 25 | 103 | 450 | 0.1 | 4 | 25 | 2 | 0.063 |
| 150 | 104 | 450 | 0.05 | 4 | 35 | 3 | 0.0495 |
| 166 | 105 | 300 | 0.075 | 3 | 30 | 3 | 0.0555 |
| 101 | 106 | 450 | 0.05 | 2 | 25 | 3 | 0.0478 |
| 76 | 107 | 600 | 0.025 | 3 | 30 | 2 | 0.063 |
| 73 | 108 | 600 | 0.025 | 3 | 30 | 2 | 0.0645 |
| 68 | 109 | 300 | 0.075 | 3 | 30 | 2 | 0.0495 |
| 175 | 110 | 600 | 0.025 | 3 | 30 | 3 | 0.046 |
| 164 | 111 | 750 | 0.1 | 4 | 35 | 3 | 0.0764 |
| 51 | 112 | 450 | 0.05 | 4 | 35 | 2 | 0.0525 |
| 85 | 113 | 600 | 0.075 | 5 | 30 | 2 | 0.0546 |
| 188 | 114 | 600 | 0.075 | 5 | 30 | 3 | 0.1155 |
| 77 | 115 | 600 | 0.125 | 3 | 30 | 2 | 0.1024 |
| 57 | 116 | 450 | 0.1 | 4 | 35 | 2 | 0.054 |
| 32 | 117 | 750 | 0.1 | 4 | 25 | 2 | 0.1028 |
| 37 | 118 | 750 | 0.05 | 2 | 35 | 2 | 0.054 |
| 14 | 119 | 750 | 0.1 | 2 | 25 | 2 | 0.063 |
| 97 | 120 | 600 | 0.075 | 3 | 30 | 2 | 0.066 |
| 176 | 121 | 600 | 0.025 | 3 | 30 | 3 | 0.0575 |
| 116 | 122 | 750 | 0.1 | 2 | 25 | 3 | 0.0551 |
| 28 | 123 | 450 | 0.1 | 4 | 25 | 2 | 0.0555 |
| 62 | 124 | 750 | 0.1 | 4 | 35 | 2 | 0.1095 |
| 200 | 125 | 600 | 0.075 | 3 | 30 | 3 | 0.0765 |
| 148 | 126 | 750 | 0.1 | 2 | 35 | 3 | 0.063 |
| 111 | 127 | 450 | 0.1 | 2 | 25 | 3 | 0.0765 |
| 19 | 128 | 450 | 0.05 | 4 | 25 | 2 | 0.0555 |
| 36 | 129 | 450 | 0.05 | 2 | 35 | 2 | 0.0514 |
| 12 | 130 | 450 | 0.1 | 2 | 25 | 2 | 0.0766 |
| 124 | 131 | 750 | 0.05 | 4 | 25 | 3 | 0.066 |
| 60 | 132 | 450 | 0.1 | 4 | 35 | 2 | 0.0615 |
| 48 | 133 | 750 | 0.1 | 2 | 35 | 2 | 0.0945 |
| 136 | 134 | 450 | 0.05 | 2 | 35 | 3 | 0.0501 |
| 49 | 135 | 450 | 0.05 | 4 | 35 | 2 | 0.0525 |
| 9 | 136 | 450 | 0.1 | 2 | 25 | 2 | 0.066 |
| 86 | 137 | 600 | 0.075 | 5 | 30 | 2 | 0.0555 |
| 79 | 138 | 600 | 0.125 | 3 | 30 | 2 | 0.087 |
| 81 | 139 | 600 | 0.075 | 1 | 30 | 2 | 0.0735 |
| 13 | 140 | 750 | 0.1 | 2 | 25 | 2 | 0.0735 |
| 2 | 141 | 450 | 0.05 | 2 | 25 | 2 | 0.0525 |
| 108 | 142 | 750 | 0.05 | 2 | 25 | 3 | 0.0555 |
| 173 | 143 | 600 | 0.025 | 3 | 30 | 3 | 0.046 |
| 149 | 144 | 450 | 0.05 | 4 | 35 | 3 | 0.052 |
| 159 | 145 | 450 | 0.1 | 4 | 35 | 3 | 0.0489 |
| 105 | 146 | 750 | 0.05 | 2 | 25 | 3 | 0.054 |
| 191 | 147 | 600 | 0.075 | 3 | 20 | 3 | 0.0666 |
| 146 | 148 | 750 | 0.1 | 2 | 35 | 3 | 0.051 |
| 1 | 149 | 450 | 0.05 | 2 | 25 | 2 | 0.051 |
| 78 | 150 | 600 | 0.125 | 3 | 30 | 2 | 0.1016 |
| 91 | 151 | 600 | 0.075 | 3 | 20 | 2 | 0.078 |
| 89 | 152 | 600 | 0.075 | 3 | 20 | 2 | 0.069 |
| 193 | 153 | 600 | 0.075 | 3 | 40 | 3 | 0.0615 |
| 69 | 154 | 900 | 0.075 | 3 | 30 | 2 | 0.0866 |
| 20 | 155 | 450 | 0.05 | 4 | 25 | 2 | 0.057 |
| 87 | 156 | 600 | 0.075 | 5 | 30 | 2 | 0.0593 |
| 82 | 157 | 600 | 0.075 | 1 | 30 | 2 | 0.075 |
| 103 | 158 | 450 | 0.05 | 2 | 25 | 3 | 0.06 |
| 92 | 159 | 600 | 0.075 | 3 | 20 | 2 | 0.0799 |
| 83 | 160 | 600 | 0.075 | 1 | 30 | 2 | 0.0679 |
| 43 | 161 | 450 | 0.1 | 2 | 35 | 2 | 0.0723 |
| 167 | 162 | 300 | 0.075 | 3 | 30 | 3 | 0.102 |
| 44 | 163 | 450 | 0.1 | 2 | 35 | 2 | 0.0705 |
| 90 | 164 | 600 | 0.075 | 3 | 20 | 2 | 0.0645 |
| 127 | 165 | 450 | 0.1 | 4 | 25 | 3 | 0.0922 |
| 151 | 166 | 450 | 0.05 | 4 | 35 | 3 | 0.0491 |
| 53 | 167 | 750 | 0.05 | 4 | 35 | 2 | 0.0585 |
| 31 | 168 | 750 | 0.1 | 4 | 25 | 2 | 0.0919 |
| 194 | 169 | 600 | 0.075 | 3 | 40 | 3 | 0.063 |
| 47 | 170 | 750 | 0.1 | 2 | 35 | 2 | 0.0984 |
| 198 | 171 | 600 | 0.075 | 3 | 30 | 3 | 0.069 |
| 139 | 172 | 750 | 0.05 | 2 | 35 | 3 | 0.075 |
| 118 | 173 | 450 | 0.05 | 4 | 25 | 3 | 0.052 |
| 15 | 174 | 750 | 0.1 | 2 | 25 | 2 | 0.0735 |
| 165 | 175 | 300 | 0.075 | 3 | 30 | 3 | 0.048 |
| 113 | 176 | 750 | 0.1 | 2 | 25 | 3 | 0.0435 |
| 8 | 177 | 750 | 0.05 | 2 | 25 | 2 | 0.048 |
| 119 | 178 | 450 | 0.05 | 4 | 25 | 3 | 0.0536 |
| 67 | 179 | 300 | 0.075 | 3 | 30 | 2 | 0.0534 |
| 144 | 180 | 450 | 0.1 | 2 | 35 | 3 | 0.0505 |
| 160 | 181 | 450 | 0.1 | 4 | 35 | 3 | 0.051 |
| 189 | 182 | 600 | 0.075 | 3 | 20 | 3 | 0.0783 |
| 55 | 183 | 750 | 0.05 | 4 | 35 | 2 | 0.06 |
| 129 | 184 | 750 | 0.1 | 4 | 25 | 3 | 0.0895 |
| 195 | 185 | 600 | 0.075 | 3 | 40 | 3 | 0.0603 |
| 190 | 186 | 600 | 0.075 | 3 | 20 | 3 | 0.0777 |
| 11 | 187 | 450 | 0.1 | 2 | 25 | 2 | 0.0705 |
| 99 | 188 | 600 | 0.075 | 3 | 30 | 2 | 0.066 |
| 93 | 189 | 600 | 0.075 | 3 | 40 | 2 | 0.0735 |
| 4 | 190 | 450 | 0.05 | 2 | 25 | 2 | 0.0525 |
| 158 | 191 | 450 | 0.1 | 4 | 35 | 3 | 0.0437 |
| 169 | 192 | 900 | 0.075 | 3 | 30 | 3 | 0.043 |
| 84 | 193 | 600 | 0.075 | 1 | 30 | 2 | 0.066 |
| 130 | 194 | 750 | 0.1 | 4 | 25 | 3 | 0.0942 |
| 52 | 195 | 450 | 0.05 | 4 | 35 | 2 | 0.0525 |
| 135 | 196 | 450 | 0.05 | 2 | 35 | 3 | 0.053 |
| 54 | 197 | 750 | 0.05 | 4 | 35 | 2 | 0.057 |
| 197 | 198 | 600 | 0.075 | 3 | 30 | 3 | 0.075 |
| 143 | 199 | 450 | 0.1 | 2 | 35 | 3 | 0.0415 |
| 10 | 200 | 450 | 0.1 | 2 | 25 | 2 | 0.0654 |
References
- Thakur, A.; Singh, R.; Singh, S.; Bansal, A. 3D Modeling and Experimental Investigation for Tool Deflection during End Milling. Mater. Proc. 2021, 62, 776–785. [Google Scholar] [CrossRef]
- Jemielniak, K. Review of New Developments in Machining of Aerospace Materials. J. Mach. Eng. 2021, 21, 22–55. [Google Scholar] [CrossRef]
- Bodziak, S.; De Souza, A.F.; Rodrigues, A.R.; Diniz, A.E.; Coelho, R.T. Surface Integrity of Moulds for Microcomponents Manufactured by Micromilling and Electro-Discharge Machining. J. Braz. Soc. Mech. Sci. Eng. 2013, 36, 623–635. [Google Scholar] [CrossRef]
- Kawasaki, K.; Shinma, K. Accuracy Measurement and Evaluation of Straight Bevel Gear Manufactured by End Mill Using CNC Milling Machine. J. Mech. Des. 2009, 131, 011001. [Google Scholar] [CrossRef]
- Zou, L.; Li, S.; Wang, Y. Study on the Correlation between Workpiece Surface Quality and Milling Force of N6 Nickel. J. Phys. Conf. Ser. 2025, 3019, 012045. [Google Scholar] [CrossRef]
- Deepanraj, B.; Senthilkumar, N.; Hariharan, G.; Tamizharasan, T.; Bezabih, T.T. Numerical Modeling, Simulation, and Analysis of the End-Milling Process. Adv. Mater. Sci. Eng. 2022, 1, 5692298. [Google Scholar] [CrossRef]
- Ge, G.; Xiao, Y.; Feng, X.; Du, Z. An Efficient Prediction Method for the Dynamic Deformation of Thin-Walled Parts in Flank Milling. Comput.-Aided Des. 2022, 152, 103401. [Google Scholar] [CrossRef]
- Sridhar, G.; Babu, P.R. Understanding the Challenges in Machining Thin Walled Thin Floored Avionics Components. Int. J. Appl. Sci. Eng. Res. 2013, 2, 79–92. [Google Scholar] [CrossRef]
- Moges, T.M.; Desai, K.A.; Rao, P.V.M. Modeling of Cutting Force, Tool Deflection, and Surface Error in Micro-Milling Operation. Int. J. Adv. Manuf. Technol. 2018, 98, 2865–2881. [Google Scholar] [CrossRef]
- Fang, Z.; Qian, S.; Wang, C.; Wu, J.; Shen, B. Milling Deformation Prediction for Thin-Walled Components Based on Fusion Model. Int. J. Adv. Manuf. Technol. 2024, 135, 3437–3449. [Google Scholar] [CrossRef]
- Agarwal, A.; Desai, K.A. Effect of Component Configuration on Geometric Tolerances during End Milling of Thin-Walled Parts. Int. J. Adv. Manuf. Technol. 2022, 118, 3617–3630. [Google Scholar] [CrossRef]
- Wang, J.; Ibaraki, S.; Matsubara, A. A Cutting Sequence Optimization Algorithm to Reduce the Workpiece Deformation in Thin-Wall Machining. Precis. Eng. 2017, 50, 506–514. [Google Scholar] [CrossRef]
- Joshi, S.N.; Bolar, G. Influence of End Mill Geometry on Milling Force and Surface Integrity While Machining Low Rigidity Parts. J. Inst. Eng. India Ser. C 2021, 102, 1503–1511. [Google Scholar] [CrossRef]
- Bolar, G.; Joshi, S.N. Experimental Investigation and Optimization of Wall Deflection and Material Removal Rate in Milling Thin-Wall Parts. Manuf. Rev. 2021, 8, 17. [Google Scholar] [CrossRef]
- Sivaprakash, R.; Sugumar, P.; Balamurugan, M.; Michael Thomas Rex, F. Three-Dimensional Finite Element Analysis of the End-Milling Process in Machining AISI 1045 Steel. Eng. Proc. 2025, 93, 18. [Google Scholar] [CrossRef]
- Li, H.; Zhang, P.; Su, G.; Du, J.; Xu, C. On the Milling Strategy in Machining Curved Surfaces Based on Minimum Stress Concentration by a 3-Axis Machining Center. Int. J. Adv. Manuf. Technol. 2022, 120, 6475–6488. [Google Scholar] [CrossRef]
- Wei, Z.-C.; Wang, M.-J.; Ma, R.-G.; Wang, L. Modeling of Process Geometry in Peripheral Milling of Curved Surfaces. J. Mater. Process. Technol. 2010, 210, 799–806. [Google Scholar] [CrossRef]
- Desai, K.A.; Agarwal, P.K.; Rao, P.V.M. Process Geometry Modeling with Cutter Runout for Milling of Curved Surfaces. Int. J. Mach. Tools Manuf. 2009, 49, 1015–1028. [Google Scholar] [CrossRef]
- Luo, M.; Liu, D.; Luo, H. Real-Time Deflection Monitoring for Milling of a Thin-Walled Workpiece by Using PVDF Thin-Film Sensors with a Cantilevered Beam as a Case Study. Sensors 2016, 16, 1470. [Google Scholar] [CrossRef]
- Ma, L.; Melkote, S.N.; Morehouse, J.B.; Castle, J.B.; Fonda, J.W.; Johnson, M.A. Thin-Film PVDF Sensor-Based Monitoring of Cutting Forces in Peripheral End Milling. J. Dyn. Syst. Meas. Control 2012, 134, 051014. [Google Scholar] [CrossRef]
- Huo, D.; Chen, W.; Teng, X.; Lin, C.; Yang, K. Modeling the Influence of Tool Deflection on Cutting Force and Surface Generation in Micro-Milling. Micromachines 2017, 8, 188. [Google Scholar] [CrossRef]
- Dépincé, P.; Hascoët, J.-Y. Active Integration of Tool Deflection Effects in End Milling. Part 1. Prediction of Milled Surfaces. Int. J. Mach. Tools Manuf. 2006, 46, 937–944. [Google Scholar] [CrossRef]
- Rao, V.S.; Rao, P.V.M. Tool Deflection Compensation in Peripheral Milling of Curved Geometries. Int. J. Mach. Tools Manuf. 2006, 46, 2036–2043. [Google Scholar] [CrossRef]
- Czechowski, K.; Wrońska, I.; Toboła, D. Wybrane zagadnienia dotyczące narzędzi stosowanych do frezowania walco-wo-czołowego—Cz. II. Stal Met. Nowe Technol. 2018, 9–10, 16–23. [Google Scholar]
- Denkena, B.; Dahlmann, D.; Boujnah, H. Tool Deflection Control by a Sensory Spindle Slide for Milling Machine Tools. Procedia CIRP 2017, 62, 329–334. [Google Scholar] [CrossRef]
- Lyu, W.; Liu, Z.; Wang, B.; Cai, Y.; Liang, X.; Li, L. Modeling and Simulation of 3D Topographies of Slot Milled Surfaces In-corporating Time-Dependent Tool Deflection. J. Manuf. Process. 2025, 149, 241–257. [Google Scholar] [CrossRef]
- Saffar, R.J.; Razfar, M.R. Simulation of End Milling Operation for Predicting Cutting Forces to Minimize Tool Deflection by Genetic Algorithm. Mach. Sci. Technol. 2010, 14, 81–101. [Google Scholar] [CrossRef]
- EN 573-3:2019; Aluminium and Aluminium Alloys—Chemical Composition and Form of Wrought Products—Part 3: Chemical Composition and Form of Products. CEN: Brussels, Belgium, 2019.
Disclaimer/Publisher’s Note: The statements, opinions and data contained in all publications are solely those of the individual author(s) and contributor(s) and not of MDPI and/or the editor(s). MDPI and/or the editor(s) disclaim responsibility for any injury to people or property resulting from any ideas, methods, instructions or products referred to in the content. |
© 2025 by the authors. Licensee MDPI, Basel, Switzerland. This article is an open access article distributed under the terms and conditions of the Creative Commons Attribution (CC BY) license (https://creativecommons.org/licenses/by/4.0/).