Article

Pipeline External Defect Detection Based on Magnetically Focused Eddy Current Testing System

School of Information Science and Engineering, Northeastern University, Shenyang 110819, China
*
Author to whom correspondence should be addressed.
These authors contributed equally to this work.
Appl. Sci. 2025, 15(20), 11012; https://doi.org/10.3390/app152011012
Submission received: 8 July 2025 / Revised: 1 October 2025 / Accepted: 6 October 2025 / Published: 14 October 2025
(This article belongs to the Section Applied Physics General)

Abstract

Eddy current internal inspection technology has been extensively studied and applied in industrial environments such as oil and gas pipelines. Typically, the penetration depth of eddy current testing in ferromagnetic pipes is reduced compared to non-ferromagnetic materials due to their high magnetic permeability. Given the presence of noise interference in eddy current testing systems, enhancing the signal quality of receiver coils constitutes a critical research focus. This paper proposes and validates through simulations a non-contact magnetically focused eddy current testing (MFECT) system for pipeline internal inspection. The system effectively enhances the signal-to-noise ratio of the receiver coils, mitigates the skin effect, and increases the penetration depth. Comparative analyses of penetration depth with and without magnetic focusing were conducted. Furthermore, the optimal operating frequency of the excitation signal was determined through simulation studies. Finally, the feasibility of the proposed method was verified through experiments.

1. Introduction

Metal pipelines are widely used to transport oil and gas due to their safety, efficiency and low pollution. Since the pipeline operates in dark, humid, and high-pressure environments, it is critical to verify the safety of the pipeline in service [1,2,3]. Nondestructive testing (NDT) methods are crucial for ensuring pipeline safety and reliability while preserving structural integrity. Key techniques include magnetic flux leakage (MFL), eddy current testing (ECT), electromagnetic acoustic transducer (EMAT), and transient test-based techniques (TTBTs). While MFL is commonly applied for pipeline detection, it faces limitations due to material dependencies and magnetic saturation. Conversely, EMAT, despite being a suitable emerging technology, faces challenges related to its high power consumption and system complexity [4,5,6]. TTBTs employ low-frequency pressure waves, as opposed to high-frequency acoustic waves, specializing in the diagnosis of macro-scale anomalies in pipeline systems [7,8]. Compared to the aforementioned method, eddy current testing (ECT) offers superior performance in detecting the condition of conductive industrial products, owing to its cost-effectiveness, high efficiency, and minimal environmental constraints in industrial settings [9].
Current research on ECT techniques focuses on the development of excitation methods and on improving the accuracy of the detection signal and the reliability of the inspection system [10,11]. By the eddy current model analysis, ECT can be utilized to measure the conductivity, permeability and thickness of the materials or the width, depth and orientation of the defects. And more research has been carried out to enhance the data quality and reliability of eddy current testing, such as data processing methods and electromagnetic shielding technology, for coping with a variety of samples.
While conventional ECT employs sinusoidal excitation signals and achieves reliable performance in identifying integrity issues, pulsed excitation has been introduced to obtain more comprehensive defect information. In contrast to sinusoidal wave excitation, pulsed eddy current testing (PECT) utilizes a square pulse as the excitation signal [12,13]. This signal contains multiple frequency components via Fourier decomposition [14], enabling the receiver coil to acquire detection information across discrete frequencies. The higher-frequency components of the signal concentrate near the material surface at early times [15], whereas the lower-frequency signals, due to their superior penetration capability in conductive and ferromagnetic materials, can gather information from deeper regions [16,17].
However, ECT is also limited by the skin effect, which can decreased the penetration of the induced current. Based on the skin effect equation, the penetration is inversely proportional to the frequency, permeability and conductivity of the specimen. To overcome the drawback caused by the skin effect, low-frequency excitation in ECT has been considered as an effective method for detecting high permeability materials [18]. Through this characteristic, low-frequency ECT is widely used in ferromagnetic material defect detection. With LFECT, it is possible to detect both the internal side and the opposite side defect of the specimen [19]. And the lower frequency employed in the excitation signal can cover the specimen thickness entirely. Remote-field eddy current testing (RFECT) technology uses electromagnetic fields that penetrate the pipe wall for inspection [20,21]. This gives it a significant advantage in detecting uniform thinning defects across the pipeline. Then, the technology is not sensitive to cracks or localized pitting corrosion.
In the ECT technique, many researchers have investigated ways to improve the intensity of the receiving signal. One conventional method is to use a U-type component. According to the electromagnetic phenomena, the principle of this method is to conduct flux through and increase the flux density. However, the U-type component method is not suitable for complex conditions such as moving detection. Another method to increase magnetic flux is magnetic flux focusing (MFF), which can be used to improve the flux density around the receiver coils so that the amplitude of the receiving signal is improved. In [22], a magnetic focusing sensor is employed to detect ferromagnetic materials using a multi-layer magnetic shielding structure [23]. MFF can also be carried out using several excitation coils which are placed in geometric symmetry. MFF is used to guide the magnetic flux so as to increase the axis magnetic flux density while decreasing the radial magnetic flux density. Thus, flux density can be superimposed in some fields by symmetrical excitation signals.
Considering the aforementioned issues, this paper proposes a magnetically focused eddy current testing (MFECT) system. The MFECT system comprises one receiving coil and three excitation coils. Among these, two excitation coils function as magnetic focusing coils, positioned within the pipeline in a geometrically symmetric configuration. Their axes are coplanar at the same height and parallel to the pipe wall. A third excitation coil is positioned adjacent to the pipe wall, with the receiving coil situated below it to collect detection signals. To validate the feasibility of the proposed system, a finite element model was established. The optimal excitation frequency was determined based on sensitivity analyses to different defect types. Furthermore, verification was conducted on the influence of magnetic focusing versus non-focusing conditions on signal penetration depth. The results indicate that compared to non-focused conditions, the proposed MFECT system mitigates the skin effect, enabling effective detection of defects with depths exceeding 1mm on the external wall of the pipe. Additionally, models were established to analyze defects of varying depths and widths, and the quantitative relationship between defect parameters and received signals was investigated. The results indicate that the received signals exhibit higher sensitivity to defect depth than to defect width.
This paper is organized as follows: In Section 2, the theoretical analysis is described, and a steel pipe is employed as a specimen. In Section 3, the finite element model of MFF in the proposed ECT is provided. In Section 4, the simulation results are shown and discussed, and the conclusions are provided in Section 5.

2. Theoretical Analysis

Eddy current testing technology is based on the law of electromagnetic induction, and defect information is collected by measuring the nearby magnetic field properties. A sinusoidal signal can be applied to both excitation coils as the excitation signal. The model is presented in Figure 1 to illustrate the MFECT probe configuration.
The proposed MFECT model is composed of three excitation coils, one receiver coil, and the tested pipe. The excitation coil axes are parallel to the pipe wall and coplanar at identical height. And a coil is positioned near the pipe’s inner wall, functioning as the receiver coil. To analyze the change in the spatial magnetic field of the testing system, Maxwell’s equation can be used:
× H = J + D t × E = B t
where E, B, and H are the electric field, magnetic induction intensity, and magnetic field intensity, respectively. ρ and σ are the volume electric charge density and conductivity of the tested sample, respectively. The induced eddy current can be expressed by the following formula:
2 A + ( j ω μ r μ 0 σ ω 2 σ μ r μ 0 ) A = μ J
where A is the magnetic vector potential ( B = × A ) and the divergence is zero. Considering that the frequency of eddy current testing is low and there is no conductive medium in air, the second term in Equation (2) can be ignored. Thus, Equation (2) can be arranged as an equation in a cylindrical coordinate system.
1 r r ( r A r ) A r 2 + A z 2 = μ J
In Equation (3), r and z are radial and axial positions in the cylindrical coordinate system; the magnetic vector potential is represented as A = A r + A ϕ + A z . In order to simplify the problem, the magnetic vector potential is regarded as a function of r and z. Because the selected sample is the inner wall of the pipe, the magnetic vector potential is considered to be a function of both r and z.
In this model, the magnetic field is generated by three excitation coils. When the symmetrical coil excites a magnetic field in the pipeline, the magnetic field is enhanced in the radial direction and canceled in the circumferential direction. Based on Faraday’s law of electromagnetic induction, once a defect is inside the pipeline wall, the magnetic field distribution will change. The permeability of pipelines is much larger than that of the contents, which results in the receiving coil voltage changing.
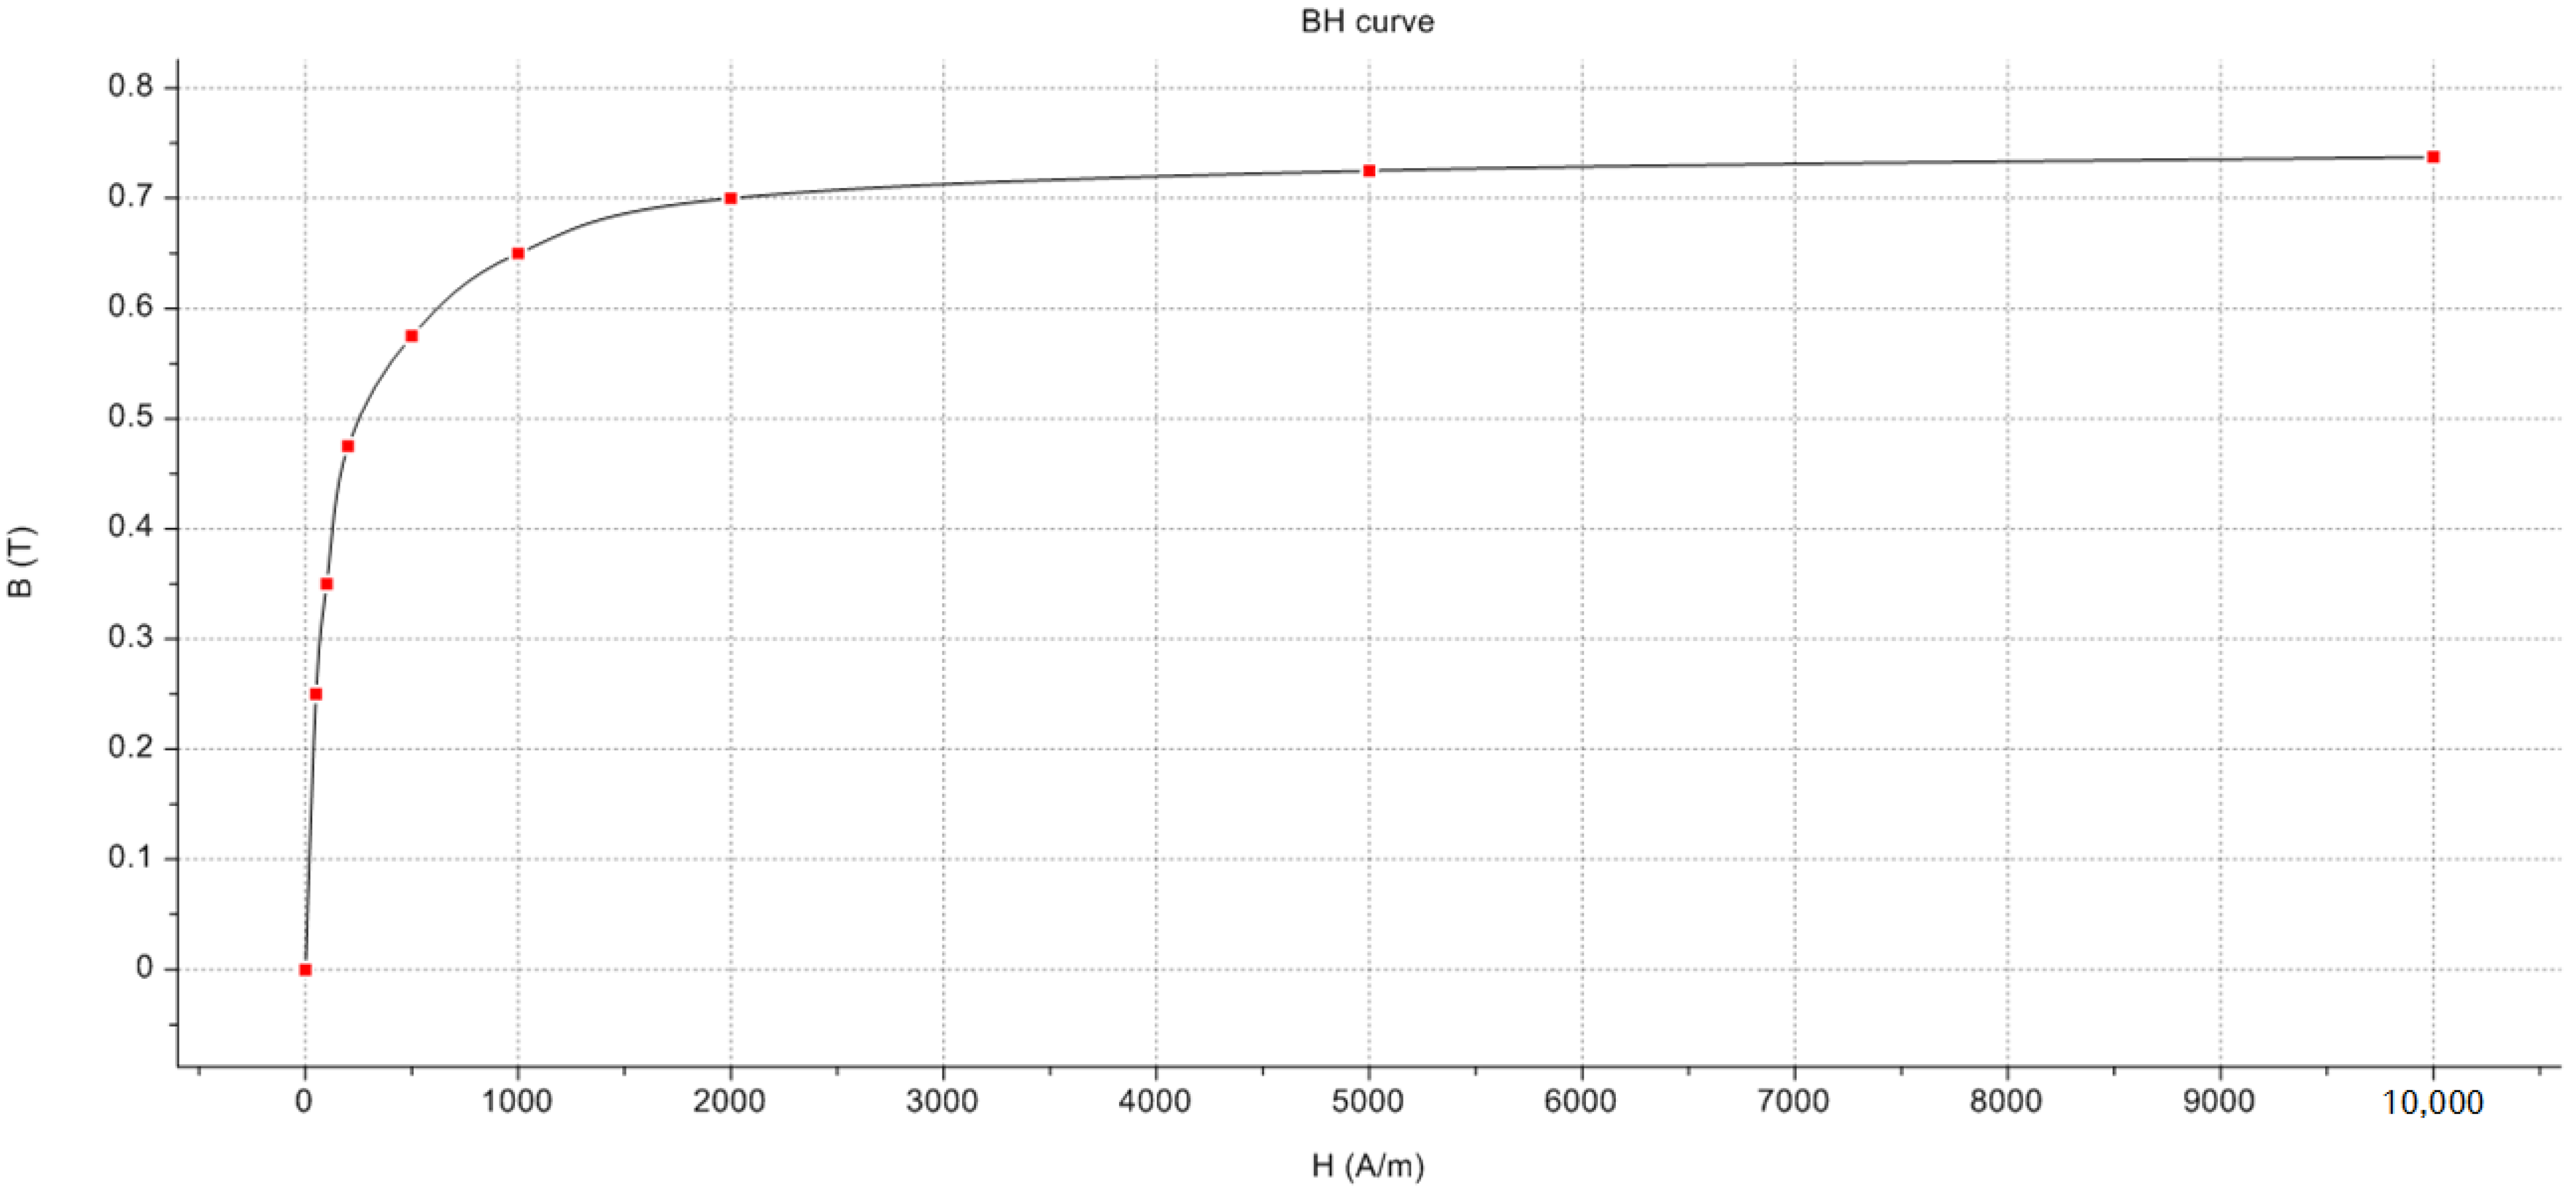
Since the tested specimen is a ferromagnetic material, according to the skin effect formula, the penetration depth is related to the excitation signal frequency, magnetic permeability, and electrical conductivity of the object under test. The material of the pipeline being tested is X-45 steel, and its B-H effective curve is shown in Figure 2.

3. Simulation Model

3.1. Finite Element Model

The configuration of the proposed ECT system, shown in Figure 1, is a spatially symmetrical structure. Considering that the magnetic field distribution excited by the proposed excitation coil is highly symmetrical on the cross-section of the pipeline, in order to reduce the complexity of the model and not influence the accuracy of the results, an appropriate two-dimensional finite element model has been set up. And the model was analyzed using the AC/DC module of COMSOL 6.0 Multi-physics. The parameters of the coils and pipeline are shown in Table 1.
The materials of the coils and pipeline are copper and iron, respectively. Relevant parameter settings are shown in Table 2. The solution region outside the pipeline wall is an infinite element domain.
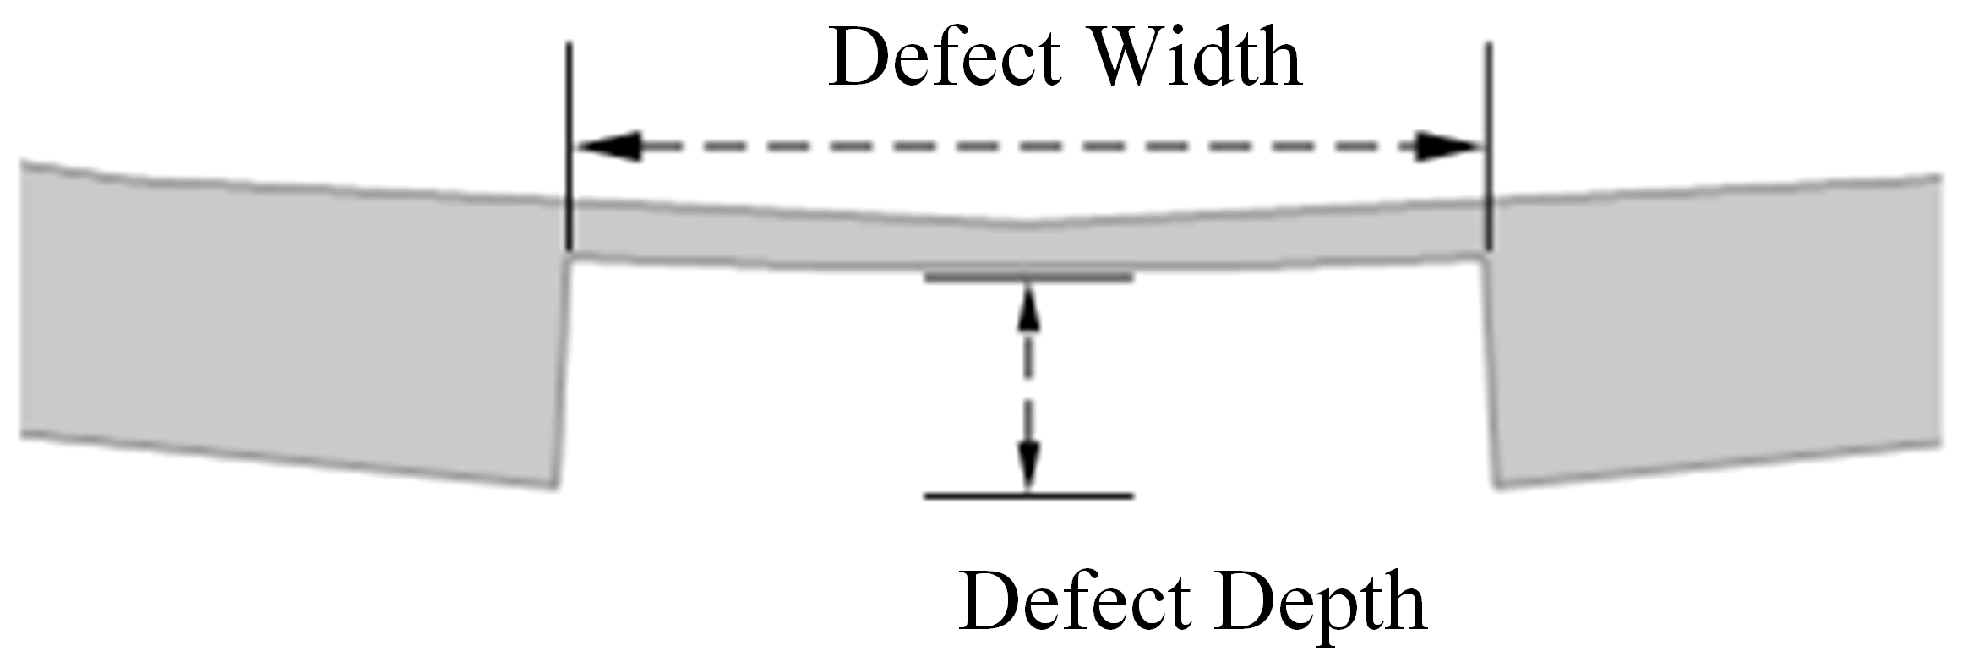
The cross-sectional view of the proposed MFECT system is shown in Figure 3, comprising three excitation coils, one receiver coil, and the tested pipe sample. The receiver coil is positioned centrally beneath the excitation coils in close proximity to the pipe’s inner wall to capture axial (y-direction) signals. Considering the utilization and deployment of focusing coils in practical applications, the coils used for magnetic focusing are placed on both sides of the excitation coil with a 60-degree angle, and their radial extension lines intersect at the center of the pipeline. As shown in Figure 4, considering spatial symmetry, the depth and width of defects are significant research parameters.
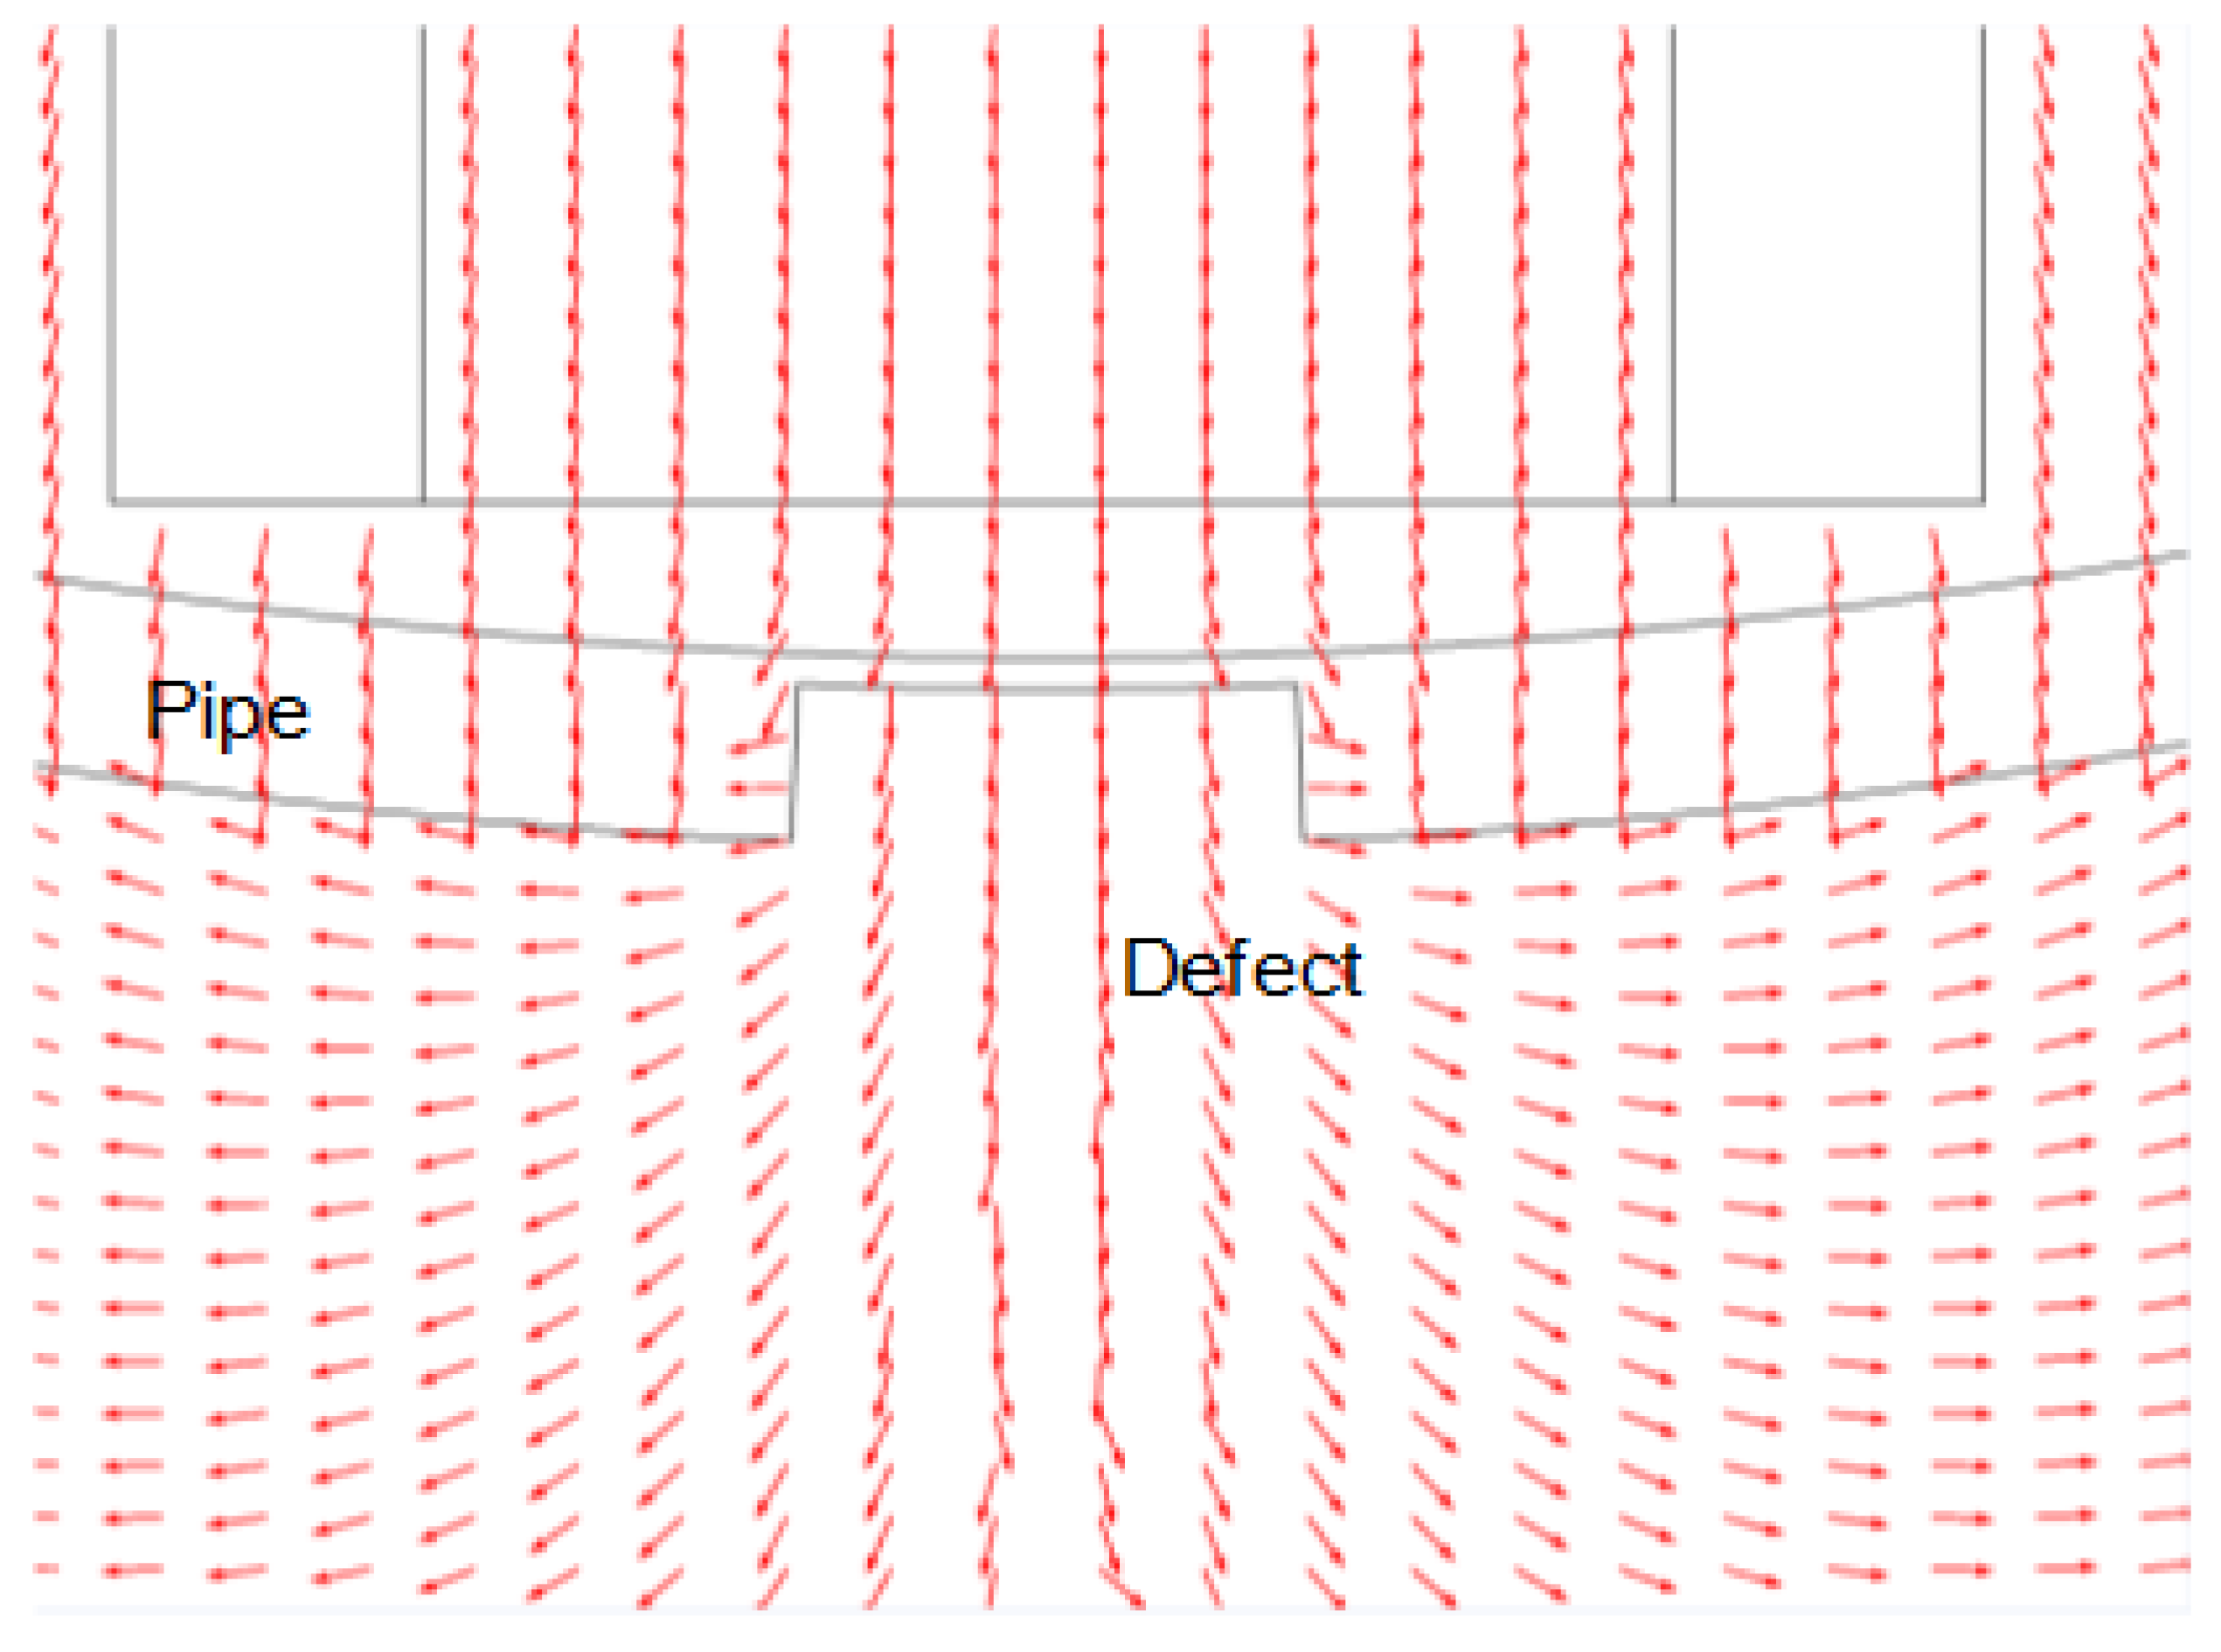
In Figure 3, the input signals of excitation coil I and coil II have the same phase, while excitation coil III is 180 degrees behind in phase. Due to the fact that the tested sample is made of ferromagnetic material, the energy of the magnetic field passing through the pipe wall is the first consideration. According to the simulation results, the corresponding power distribution can be obtained, as shown in Figure 5.

3.2. Optimal Frequency

Considering the variation in magnetic permeability of the test specimen and the differing sensitivity of defect information to excitation signal at different frequencies, the optimal inspection frequency needs to be determined. The simulation excitation is discussed in this subsection. The eddy current skin depth is related to the conductivity, permeability, and frequency, and the skin depth formula is as follows:
δ = 2 ω σ μ
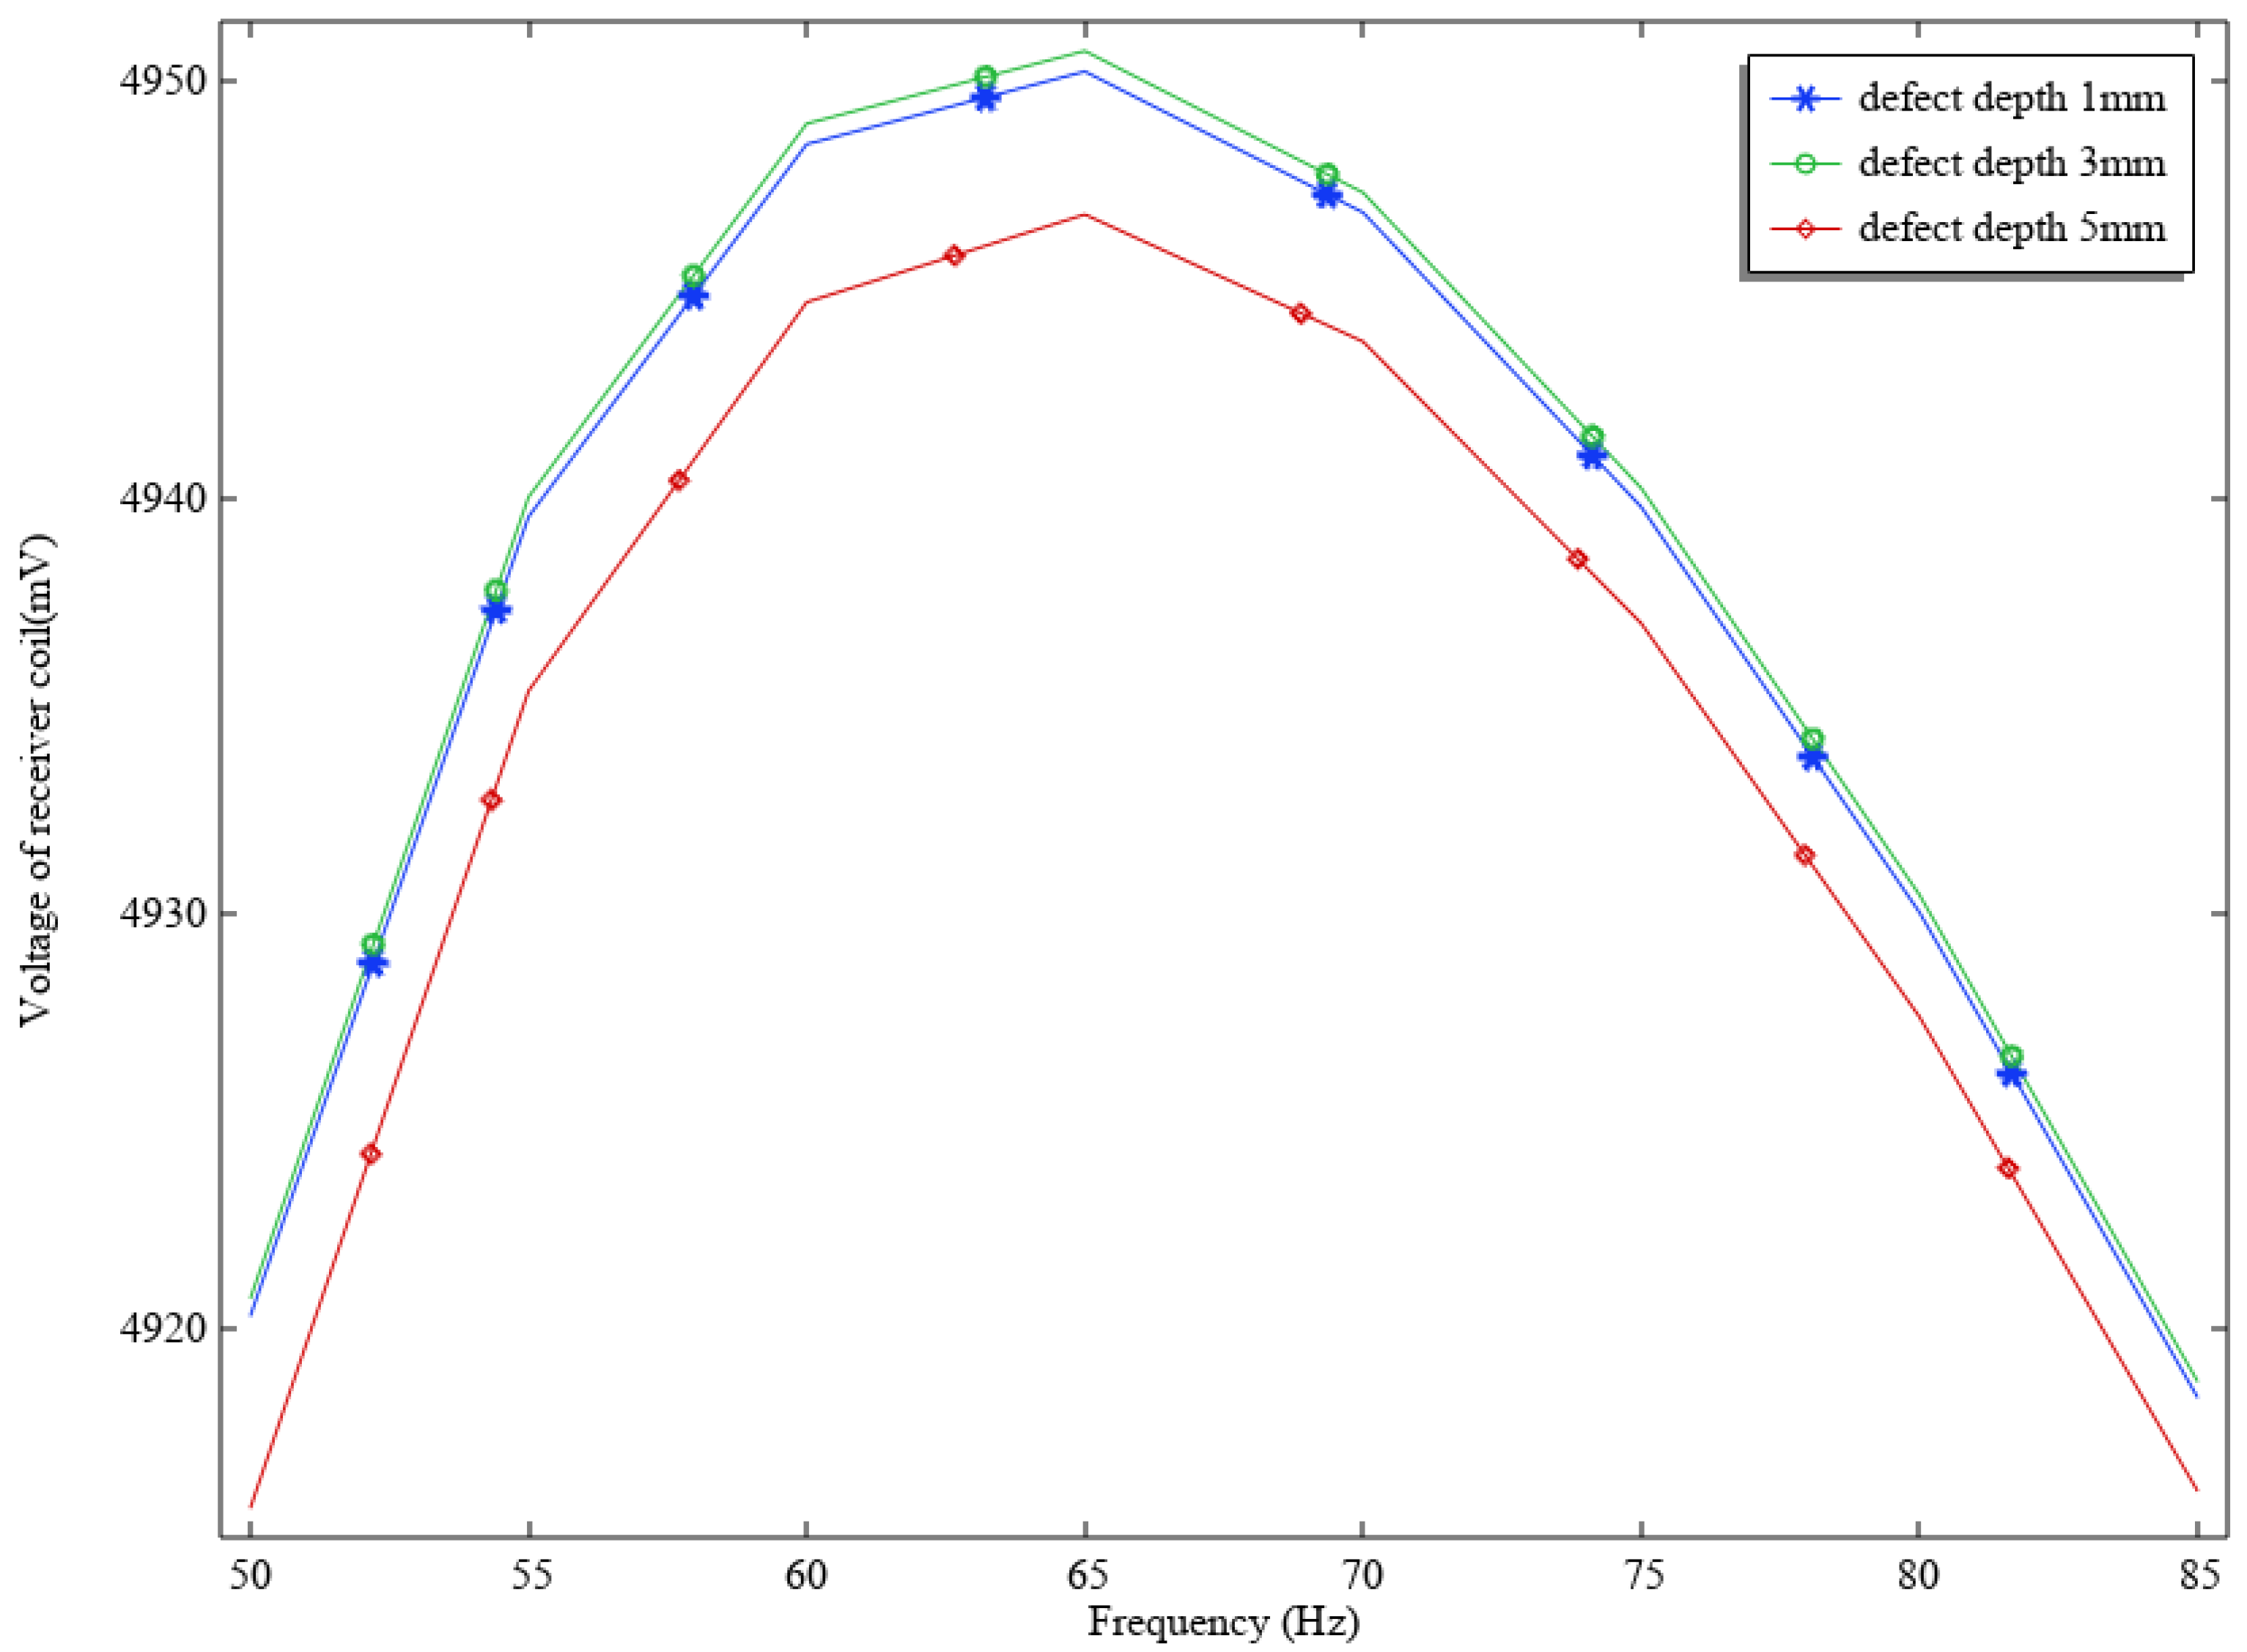
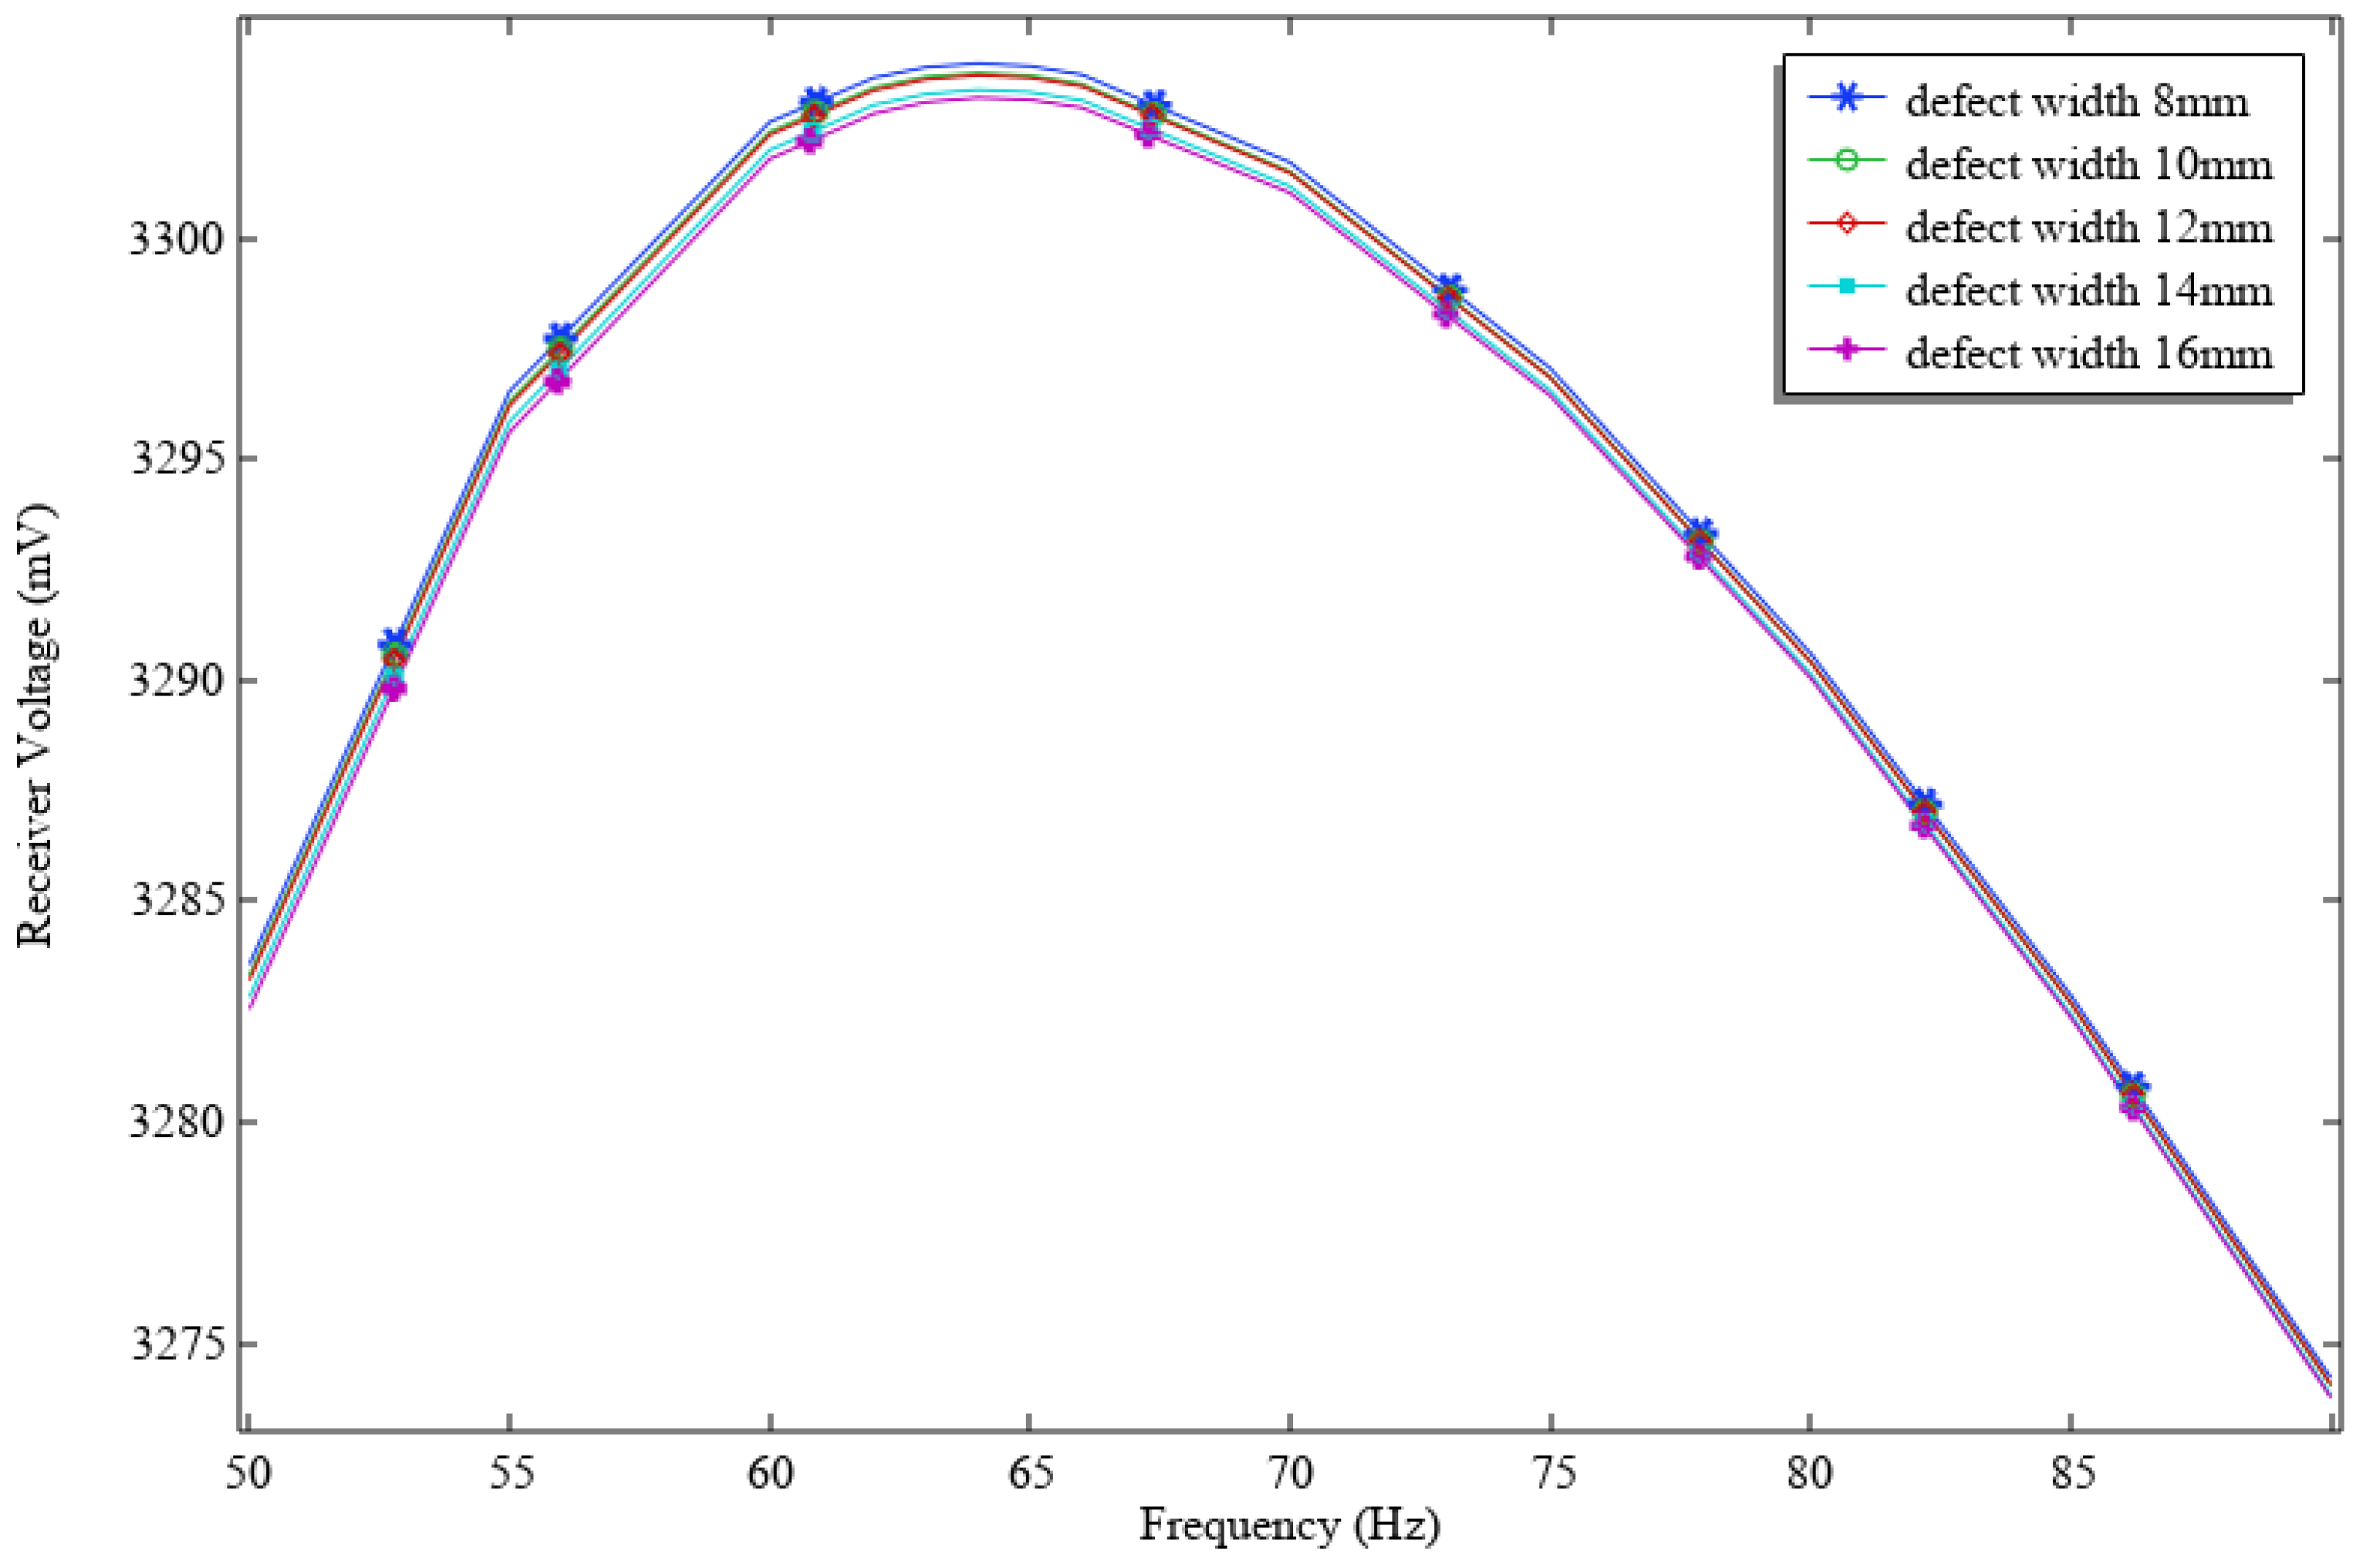
In Equation (4), when the specimen material is determined, the skin depth depends solely on the frequency of the alternating magnetic field. The trend diagram showing the relationship between frequency and receiving coil voltage is presented in Figure 6. The horizontal axis represents the frequency of the sinusoidal excitation signal, and the vertical axis represents the voltage of the receiving coil. It can be seen from the curve that the relationship between the voltage and frequency of the receiving coil is nonlinear. The voltage of the receiver coil increases with the increase in frequency, and decreases when the frequency reaches a certain value. In addition, the received voltage and defect width are shown in Figure 7. It can be observed that the trend of receiver coil voltage is consistent with the change in defect depth, but the amplitude is smaller than the previous received voltage. Through simulation analysis, it can be found that the difference in voltage variation when the defect width changes is less than 1 mV. According to the synthetical analysis, the excitation signal frequency is selected as 65 Hz. When the pipeline has defects, the voltage of the receiving coil at different frequencies has the same trend as that without defects. This will be verified in the next section.

4. Results and Discussion

4.1. Defect Signal Analysis

In order to evaluate and prove the feasibility of the proposed detection system, different sizes of defects are simulated and verified. The different widths and depths of defects are verified by simulation, since the simulation model is built on the two-dimensional plane and the defects are symmetrical. A diagram of defects is shown in Figure 4. The range of defect depths is from 0 to 5 mm with steps of 1 mm on a pipe thickness of 6 mm. The relationship of magnetic flux density extracted in the X-axis direction and defect depth is shown in Figure 8, with different color curves representing different defect depths. The data path on the X-axis is defined the range from −20 to 20 mm. The center of defects is defined as 0 mm in the X-axis direction. The relationship between position on the X-axis and magnetic flux density shows a linear trend. It can be observed that the peak value of the curve is affected by the depth of the defect, and the amplitude increases with depth. However, the magnetic flux density at the center of the defect remains unchanged.
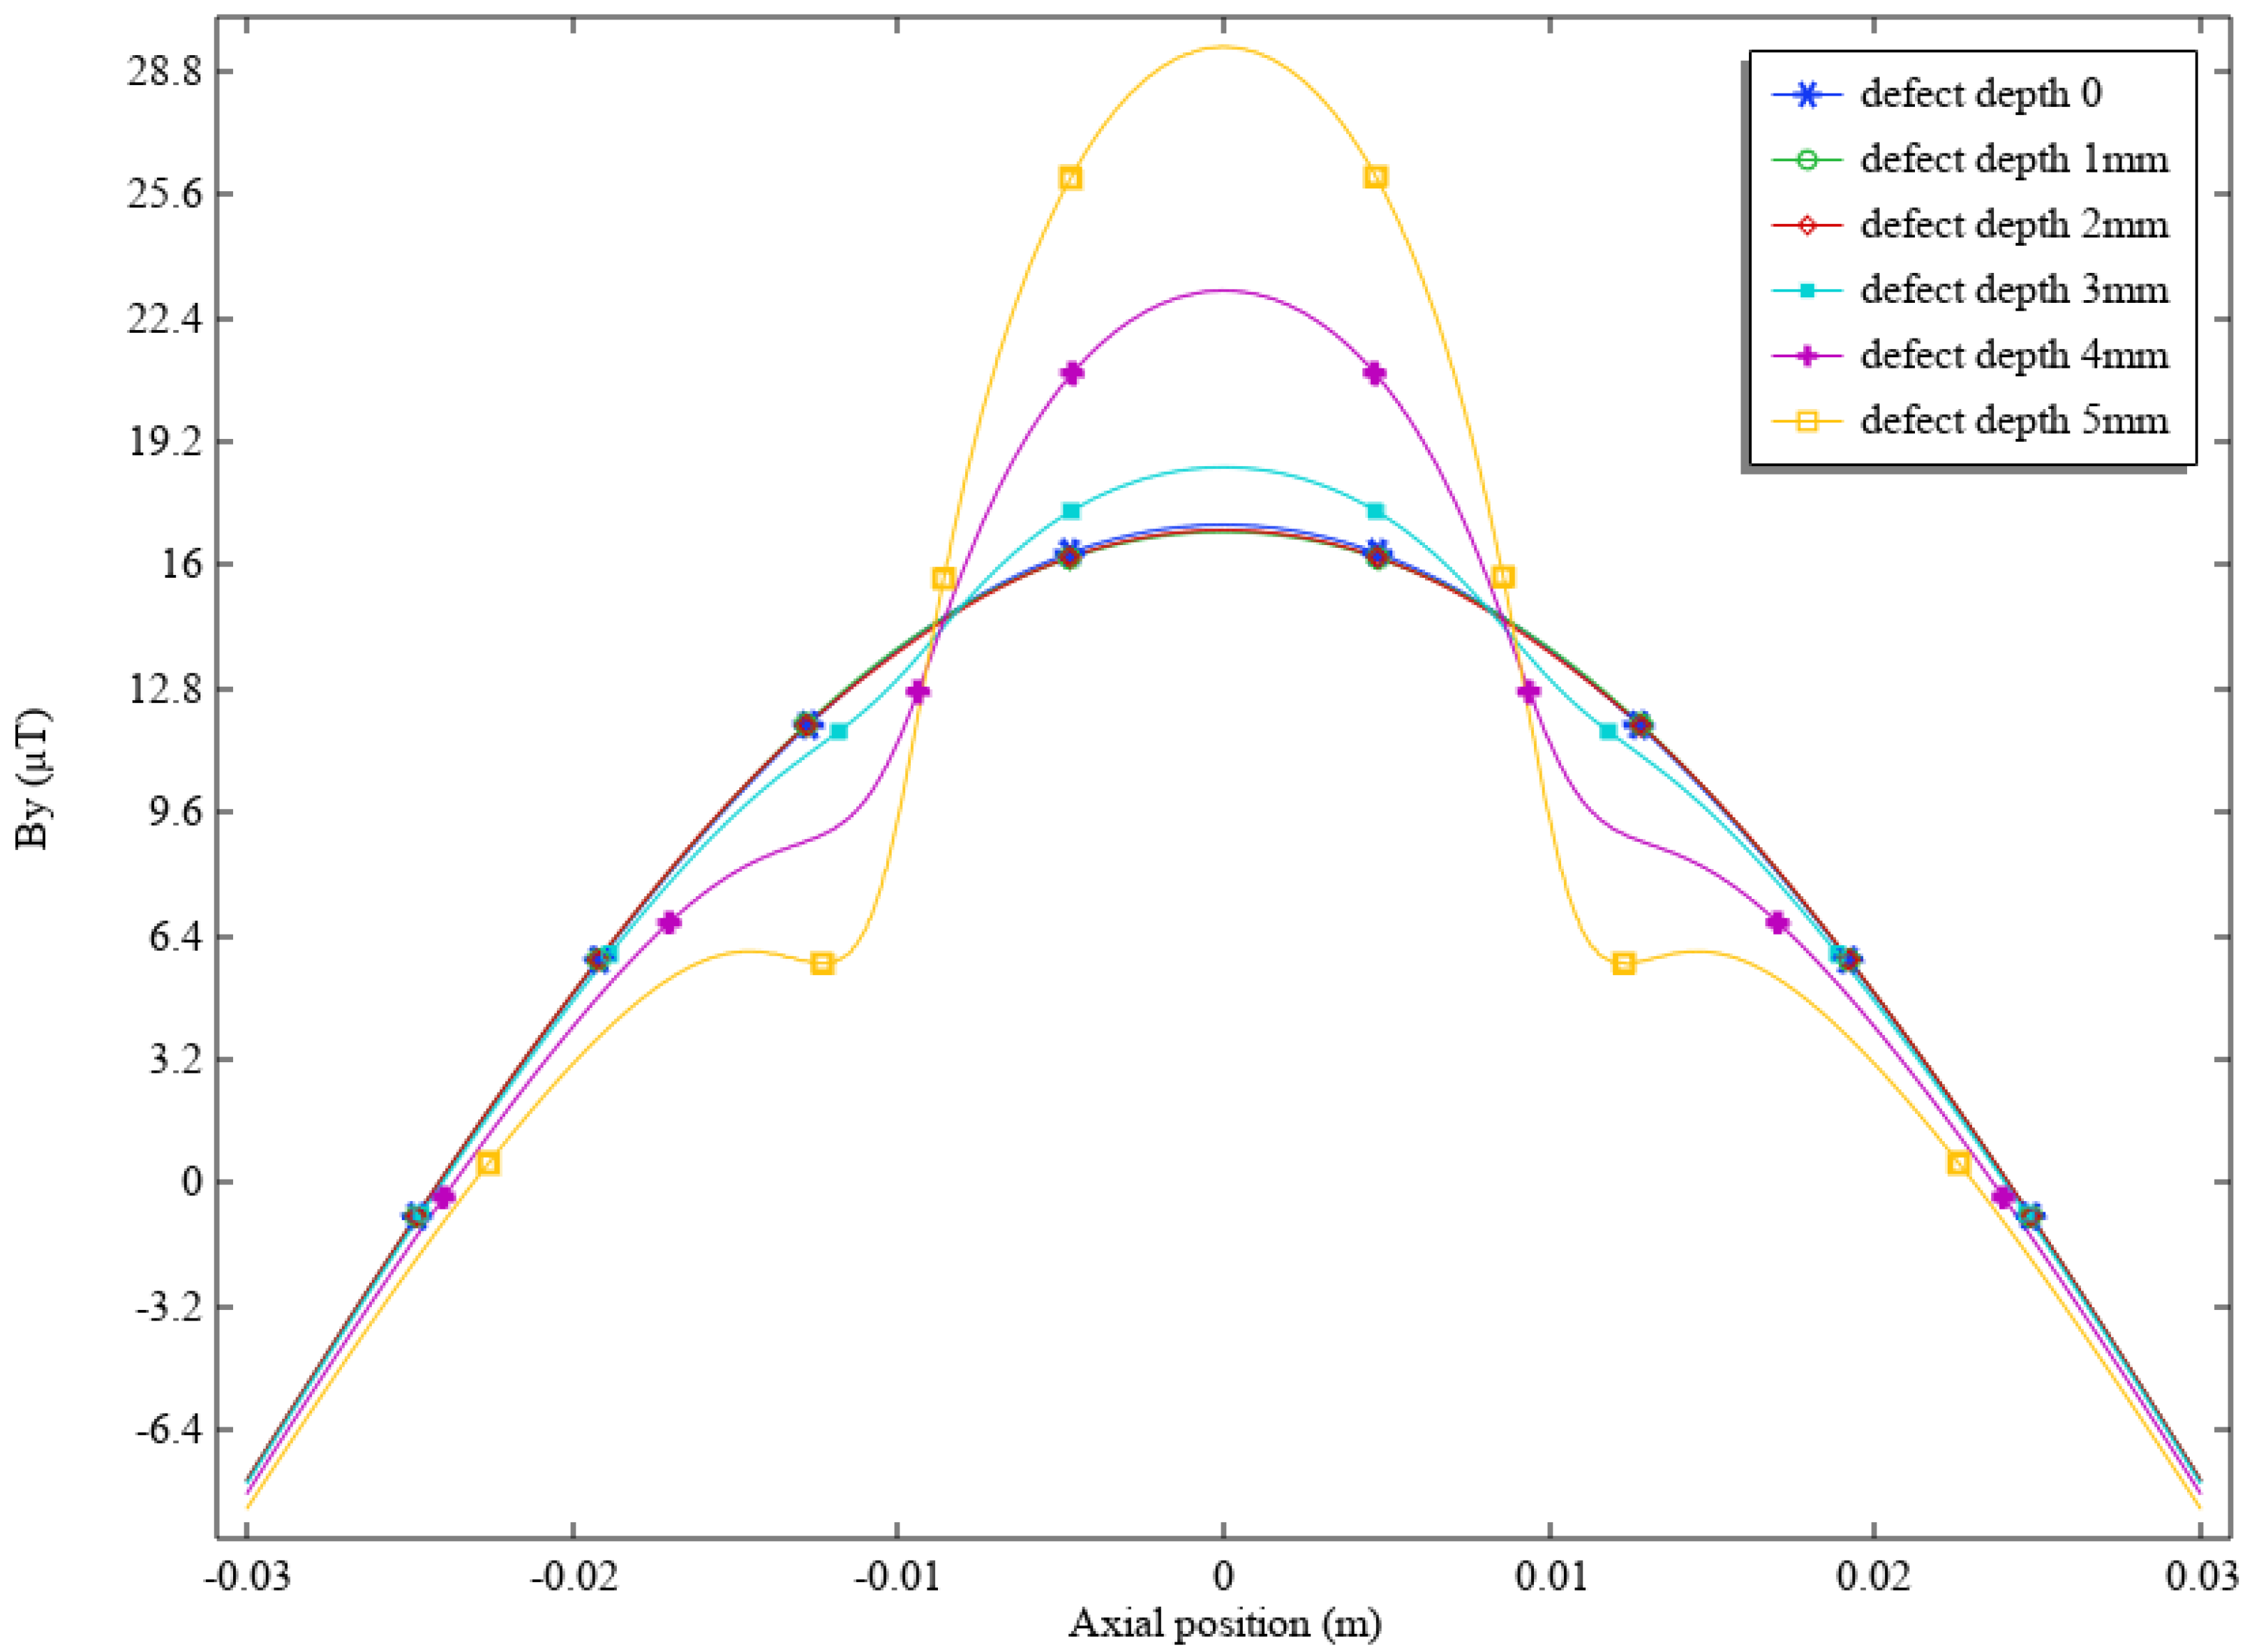
Figure 9 shows the radial values of magnetic flux density extracted at different positions. It can be observed that the peak values of the curves appear at the center of defects and are influenced by the depth of defects. As the depth of defects on the backside of the pipe increases, the magnetic flux density also rises. This occurs because the reduction in pipe wall thickness leads to an increase in external magnetic flux. As the defect exceeds 50 % of the pipe wall thickness, the magnetic flux density increases significantly. Therefore, the influence of defect depth variation on radial magnetic flux density is greater than that on circumferential magnetic flux density.
The relationship between magnetic density on the radial and circumferential directions at different defect widths is shown in Figure 10 and Figure 11. The defect width has been set from 8 mm to 16 mm with a step of 2 mm. In Figure 11, it can be observed that the relationship between the distribution of radial magnetic flux density and axial position is highest at the center of the defect and decreases on both sides. Due to the small difference in peak axial magnetic flux density between different defect widths, it can be seen from a comparison with Figure 9 that the radial magnetic flux signal is more sensitive to defect depth. Figure 10 shows the distribution of magnetic flux density in the circumferential direction at different defect widths. It can be observed that the magnetic flux signal has an overall linear relationship with the circumferential position. When near the defect, the variation trend of magnetic flux density slows down. Regarding the curve of magnetic flux density and circumferential position, the distance between the starting and ending points of the minimum gradient is the defect width.
In order to better analyze the variation in receiving coil voltage under different defects, the transient values of receiving coil voltage were collected. The voltage amplitude of the excitation coil is 10 V with 65 Hz frequency. With the increase in defect depth, the amplitude variation trend of the receiving coil is consistent with the previous analysis. All receiver coil signals maintain the same voltage phase, even for different defect depths. However, there is phase lag between them and the signals without defects. According to Faraday’s law of electromagnetic induction, the receiver coil voltage is
V = j   f   r   A ( r , z )
The existence of defects is equivalent to reducing the mutual inductance between coil and pipeline, so there will be phase difference.

4.2. Comparison with Non-MF ECT

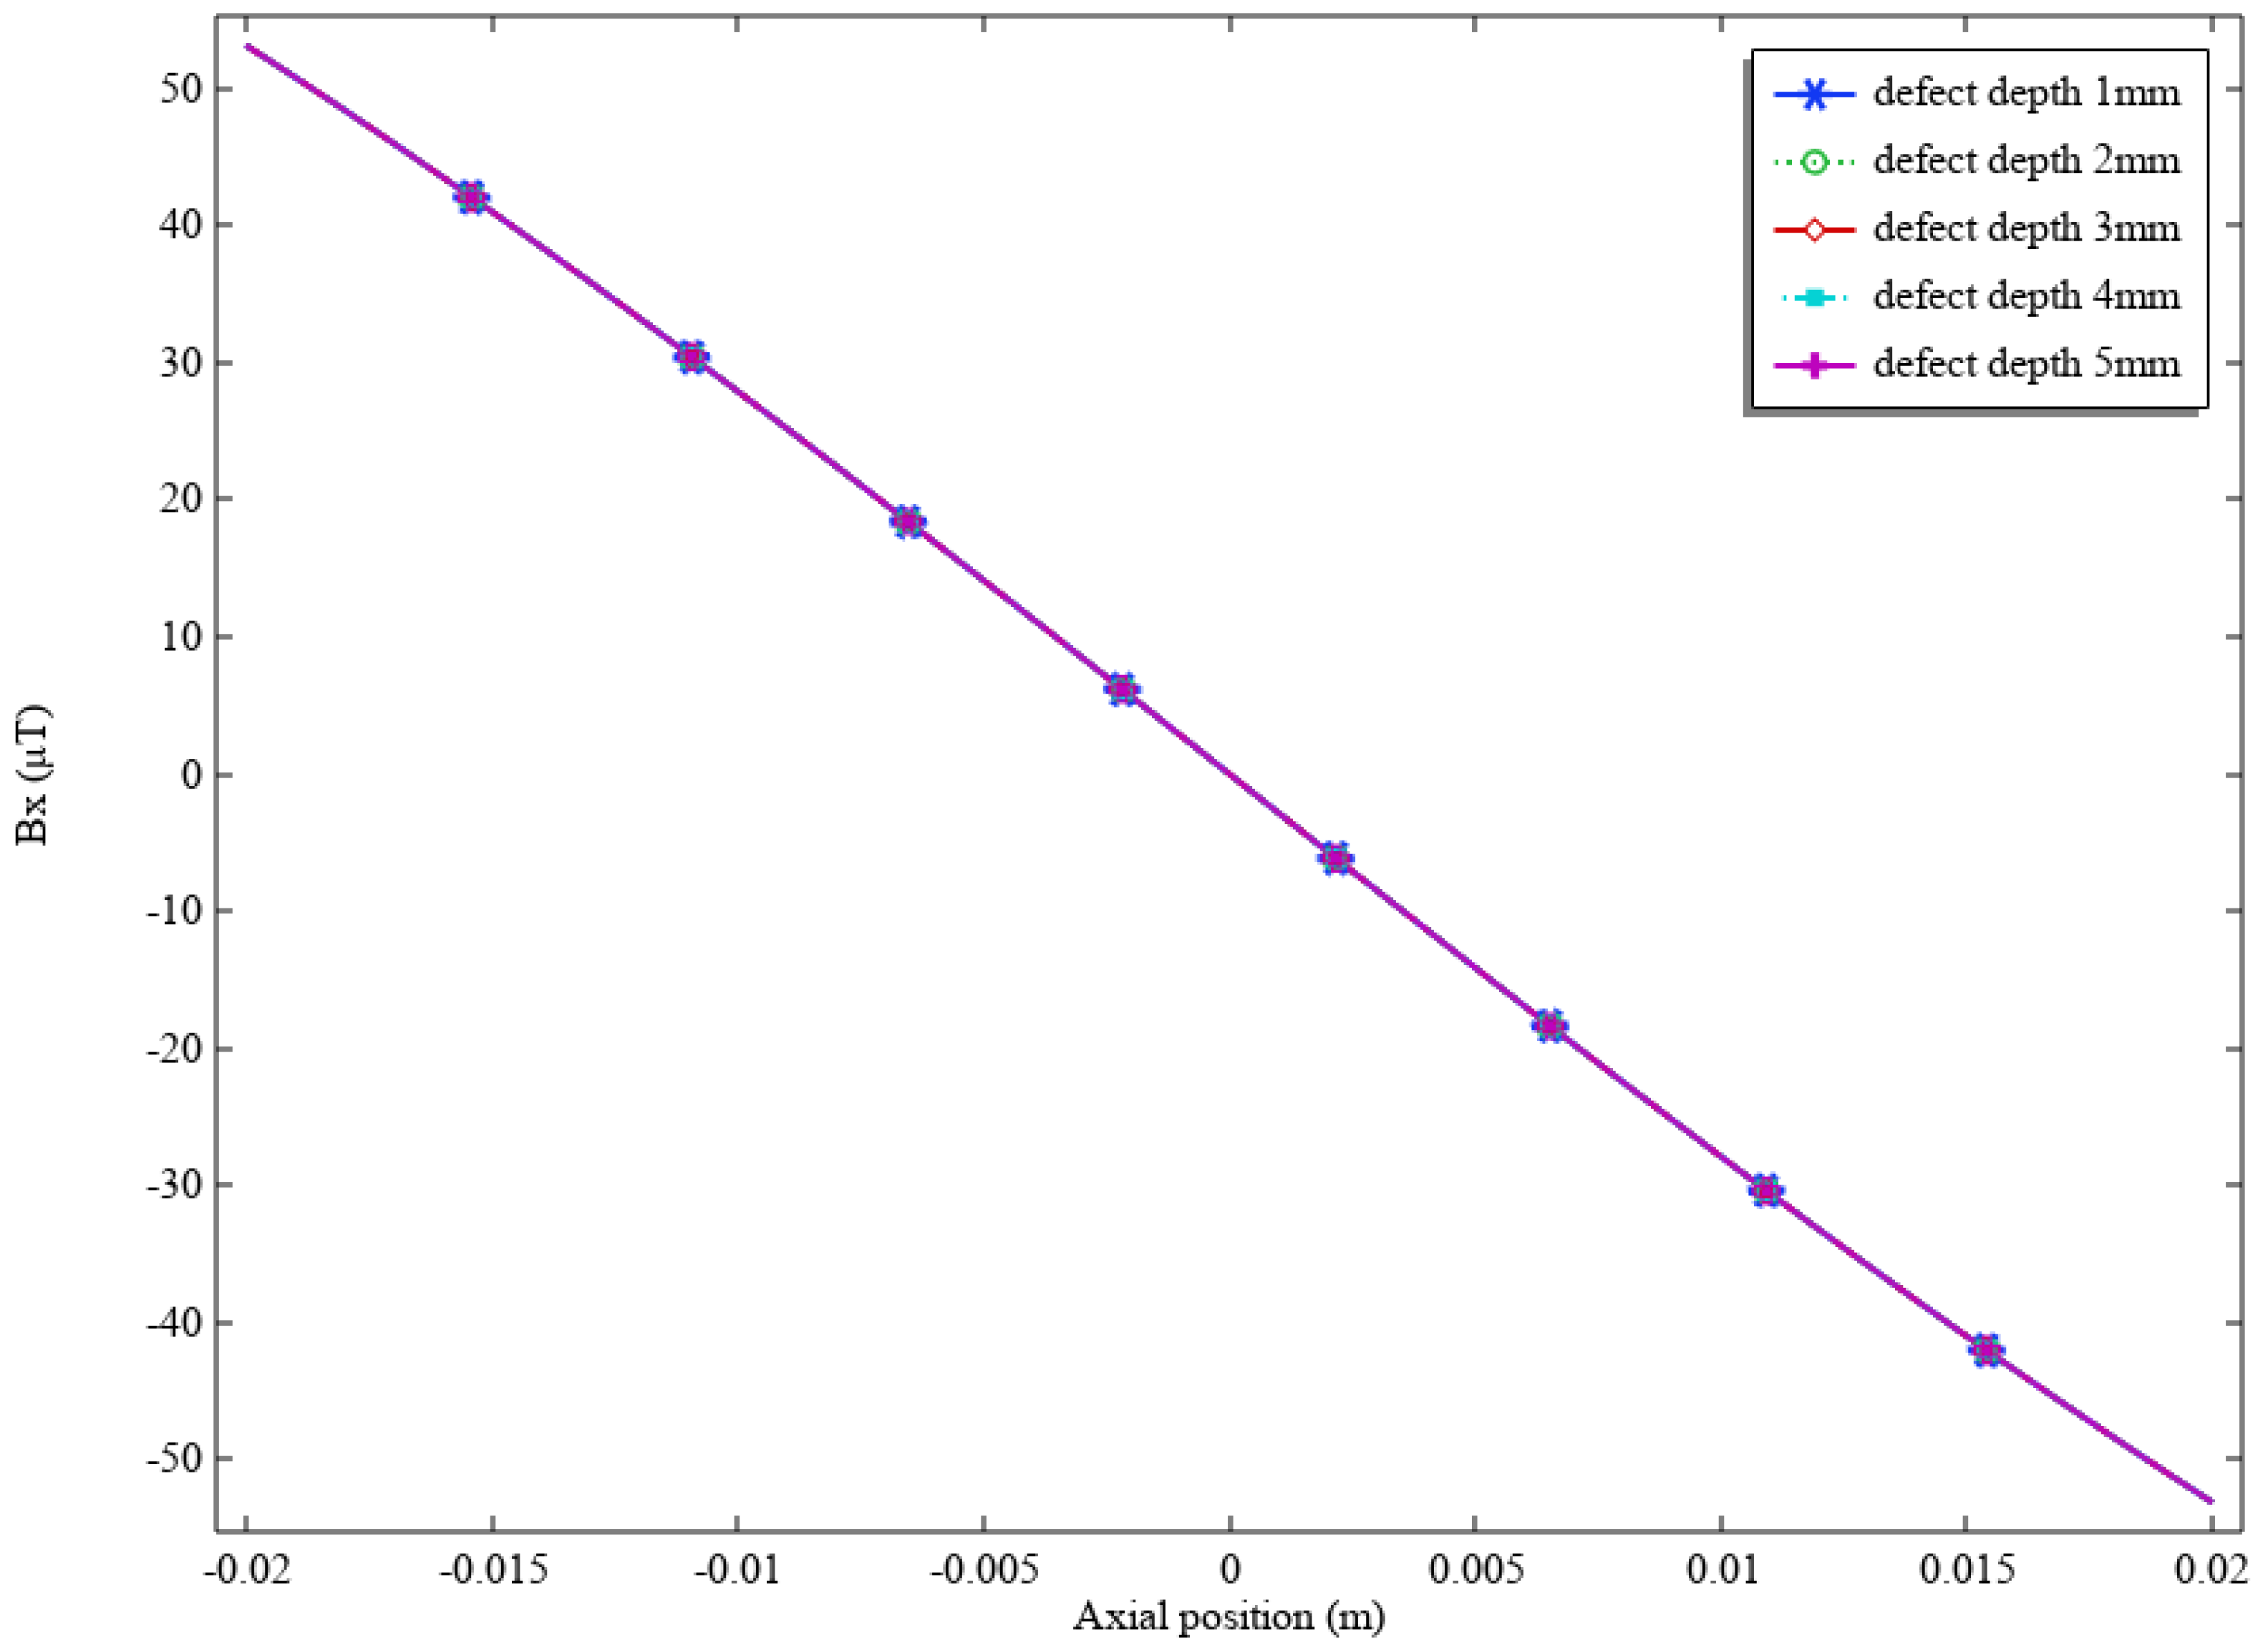
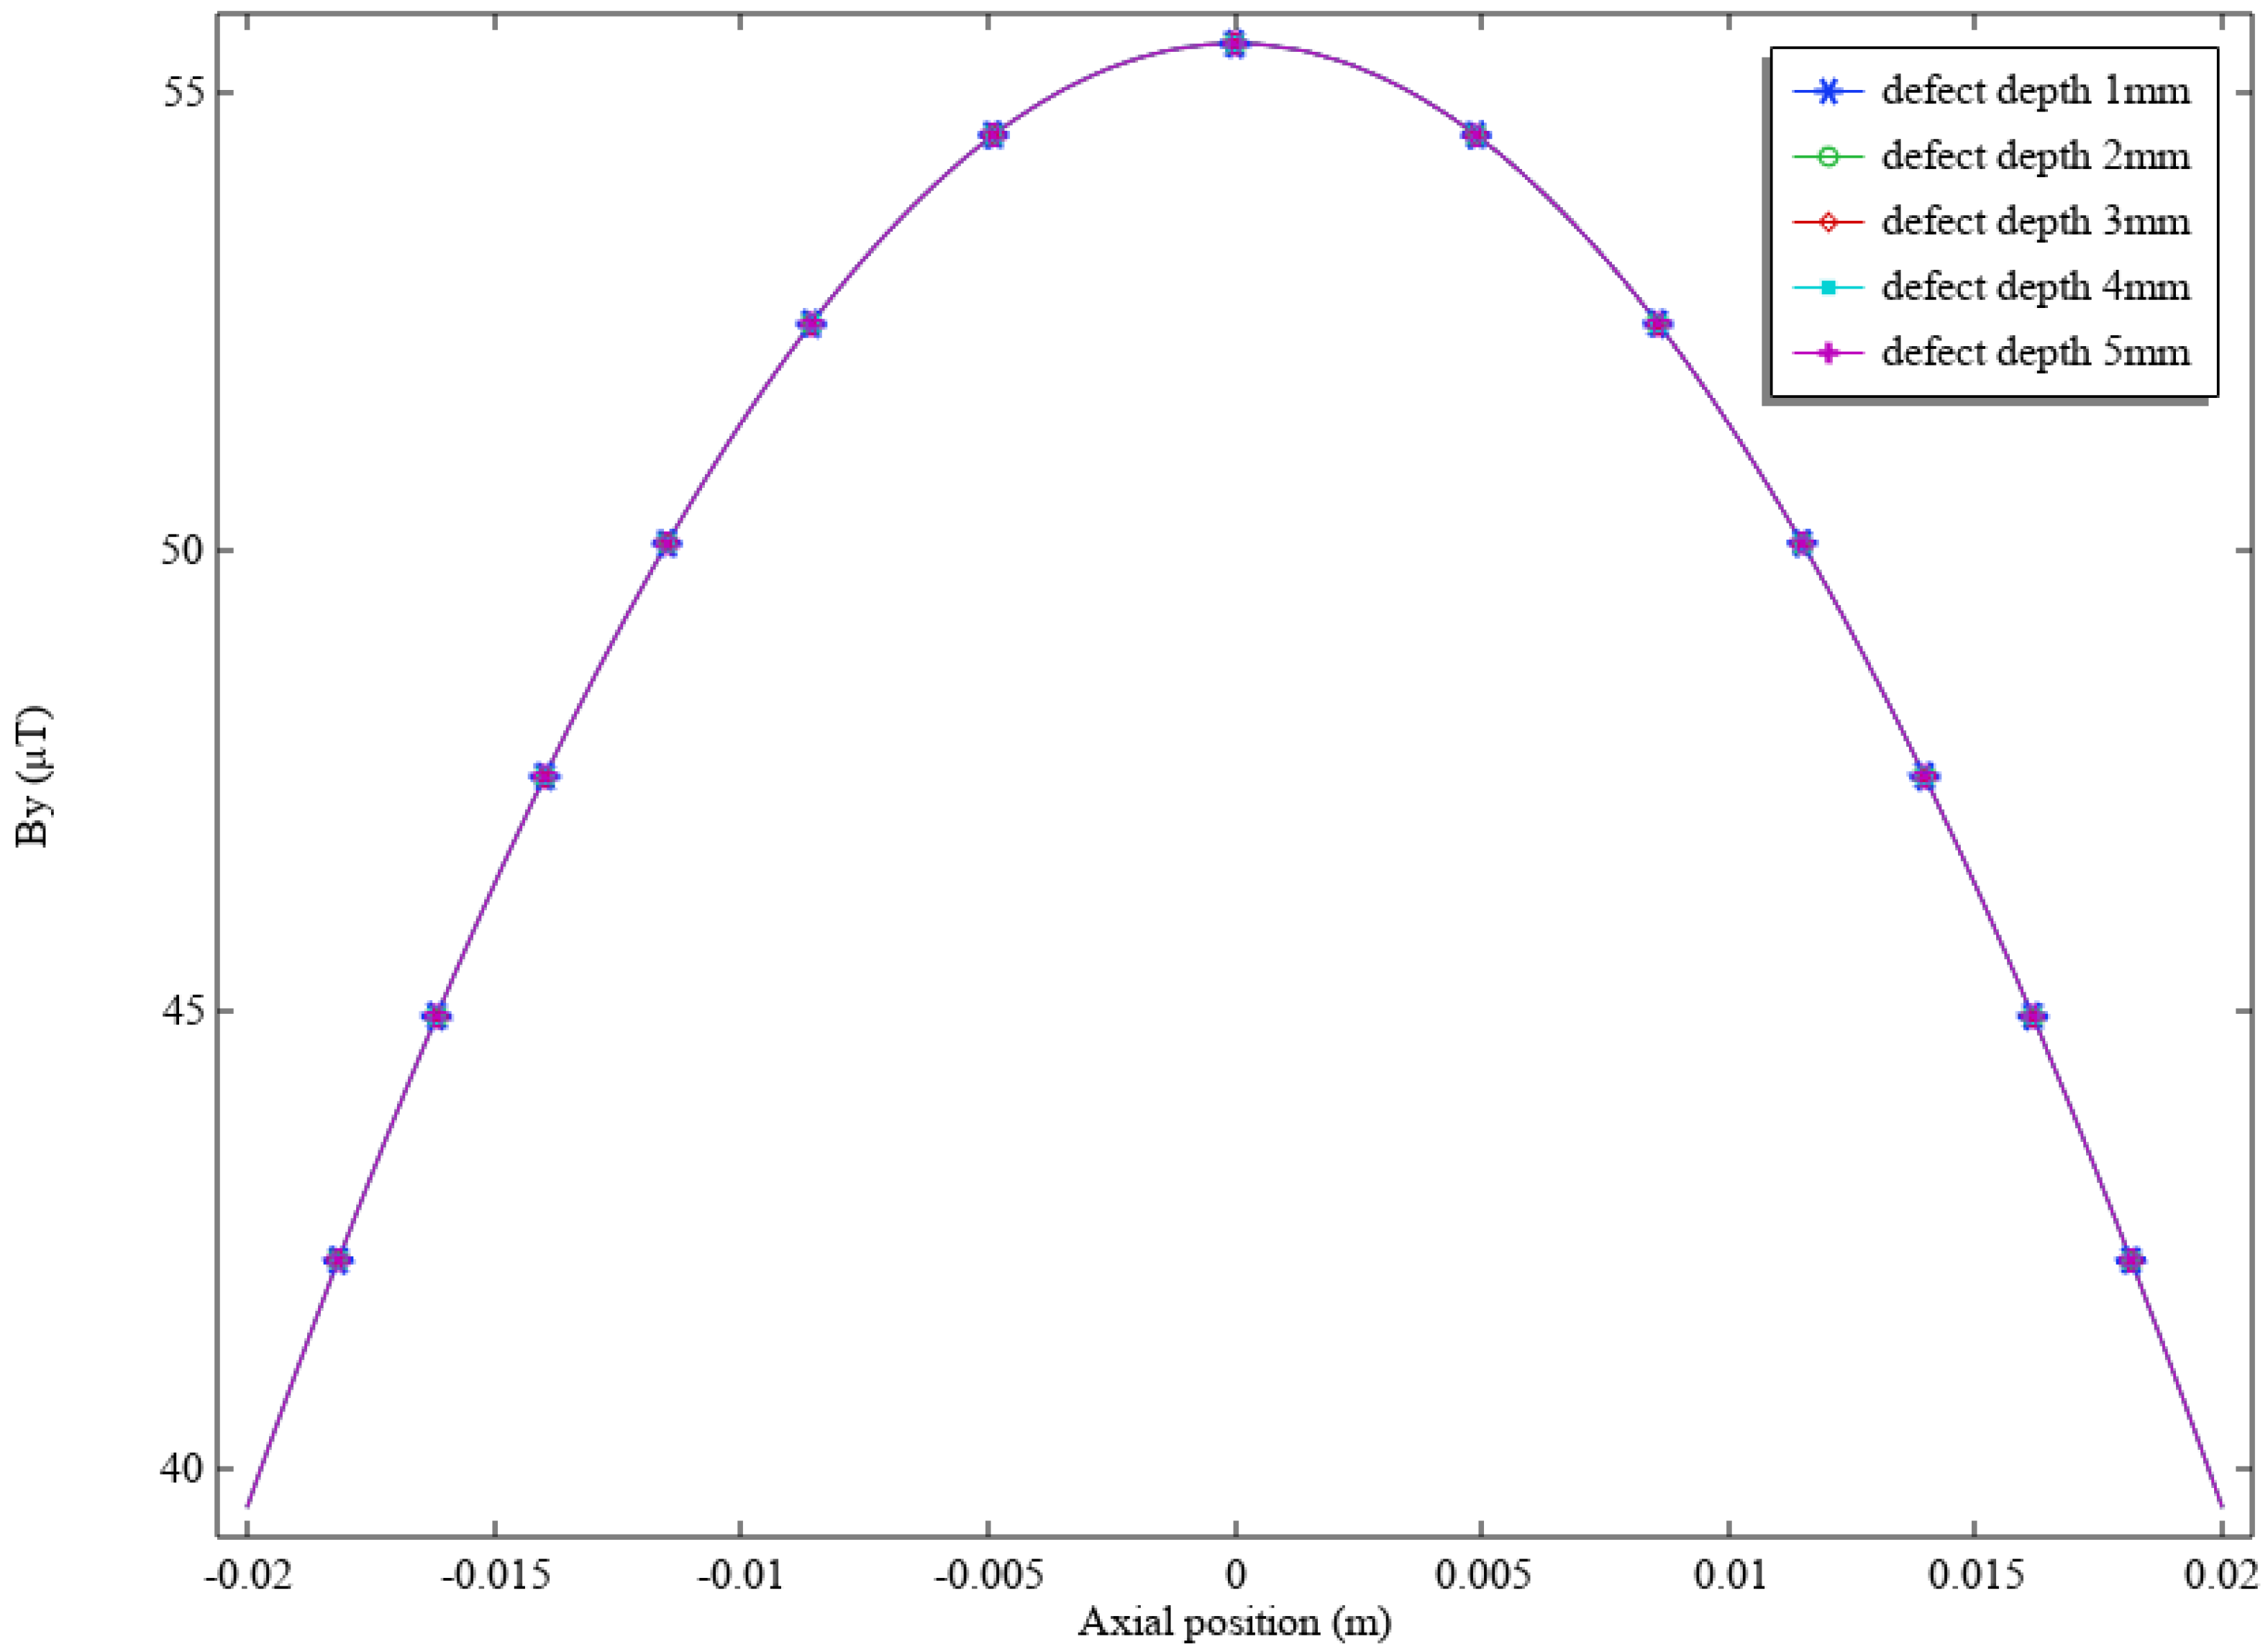
To verify the reliability of the designed inspection system, the detection results were compared with those obtained without magnetic focusing. The magnetic focusing coils on both sides are removed, and the number of excitation coils is reduced to one. Simultaneously, the height and number of turns of the excitation coil are tripled compared to the original coil to ensure identical excitation power without change in lift-out distance. Figure 12 and Figure 13 represent the magnetic flux distribution in the axial and circumferential directions when there is no magnetic focusing excitation coil, respectively. The defect signals of different depths and widths overlap significantly. Without magnetic focusing, the permeability of the pipeline remains unchanged, and according to Equation (4), the penetration depth is less than that of the MFCET system. The defect information on the back of the pipeline has not been collected and cannot be detected.

5. Experiment

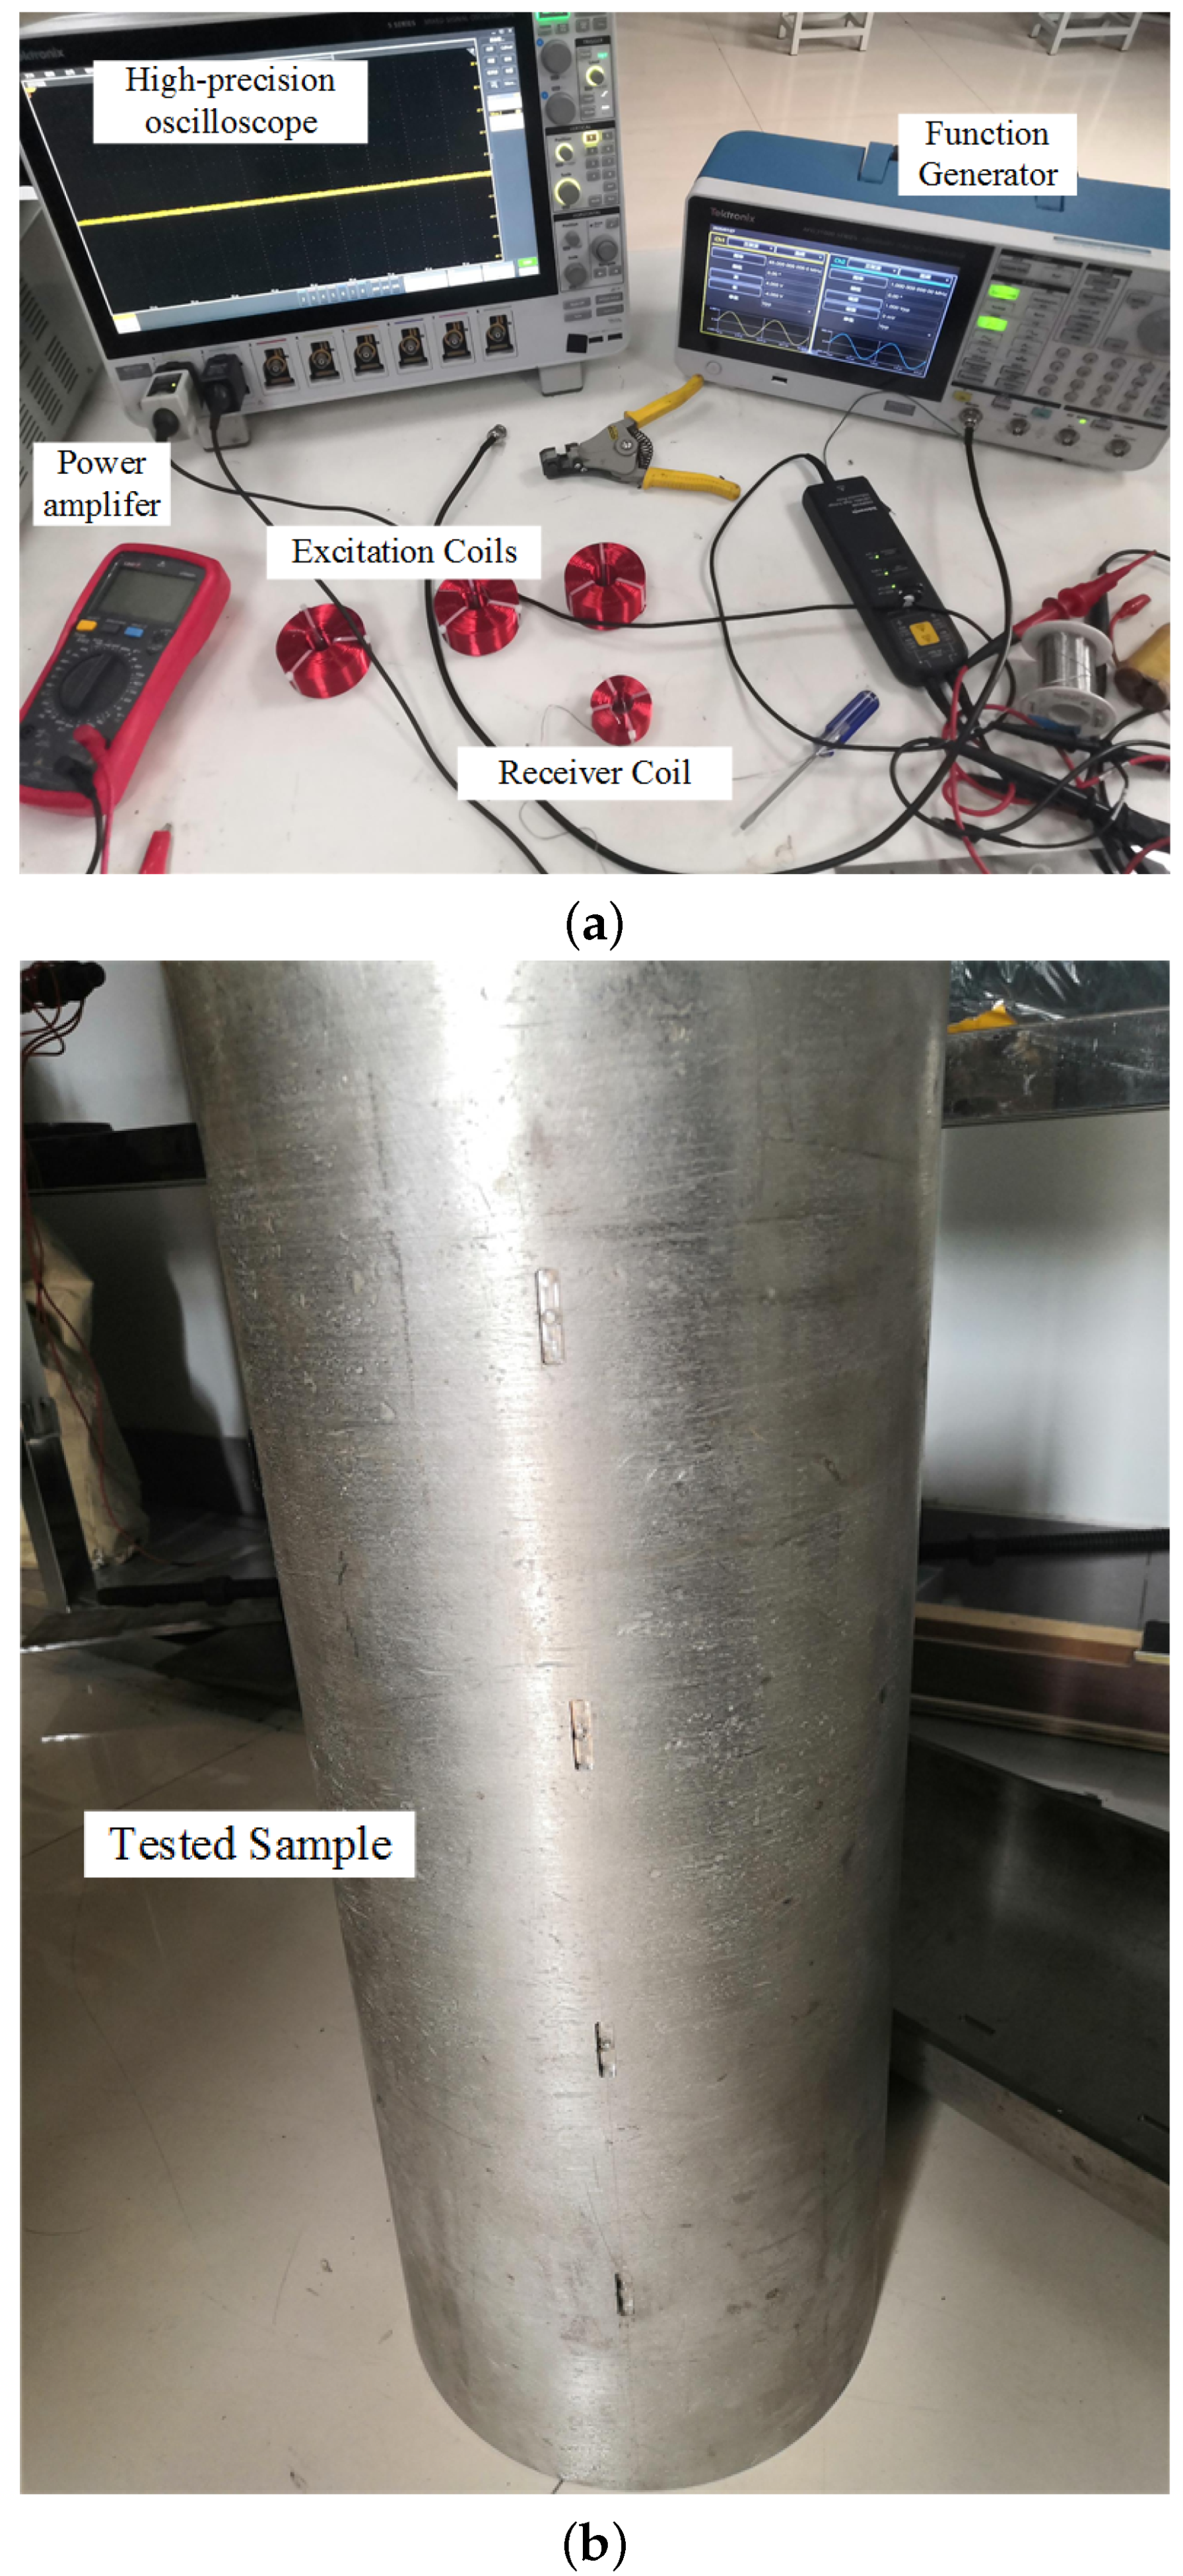
The MFECT experimental system, shown in Figure 14, includes a function generator, a power amplifier, excitation coils, a receiving coil, a high-precision oscilloscope, and the tested pipeline.
In this experiment, the function generator (Tektronix Corporation AFG31000 (Beaverton, OR, USA)) was used as the excitation signal generator, which generates a sine signal with an amplitude of 1 V. The excitation frequency has been optimized in the previous section, with 65 Hz selected as the excitation frequency. The voltage signal is amplified by a power amplifier (Aigtek Corporation ATA-3080 (Xi’an, China)) and then connected to the excitation coil of the eddy current detection system for excitation current loading. The induction signal of the detection coil is filtered and adjusted by a multifunctional filter (NF Corporation 3611 (Yokohama, Japan)), and then obtained by a high-precision oscilloscope (Tektronix Corporation MSO508).
The tested piece is a Q235 carbon steel straight pipe with a wall thickness of 6 mm, as shown in Figure 14b. A defect is machined on the outer wall of the pipe, with a rectangular shape. The length and width of the machined defect are the same, but the depth is different. The experimental parameters are listed in Table 3. Due to processing errors, the actual size of the processing defect is 2 mm in length, 15.1 mm in width, and 1–5 mm in depth with a step of 1 mm. The excitation coil is made of enameled wire with a diameter of 1 mm and a coil turn count of 400. The receiving coil is made of enameled wire with a diameter of 0.5 mm and has 700 turns.
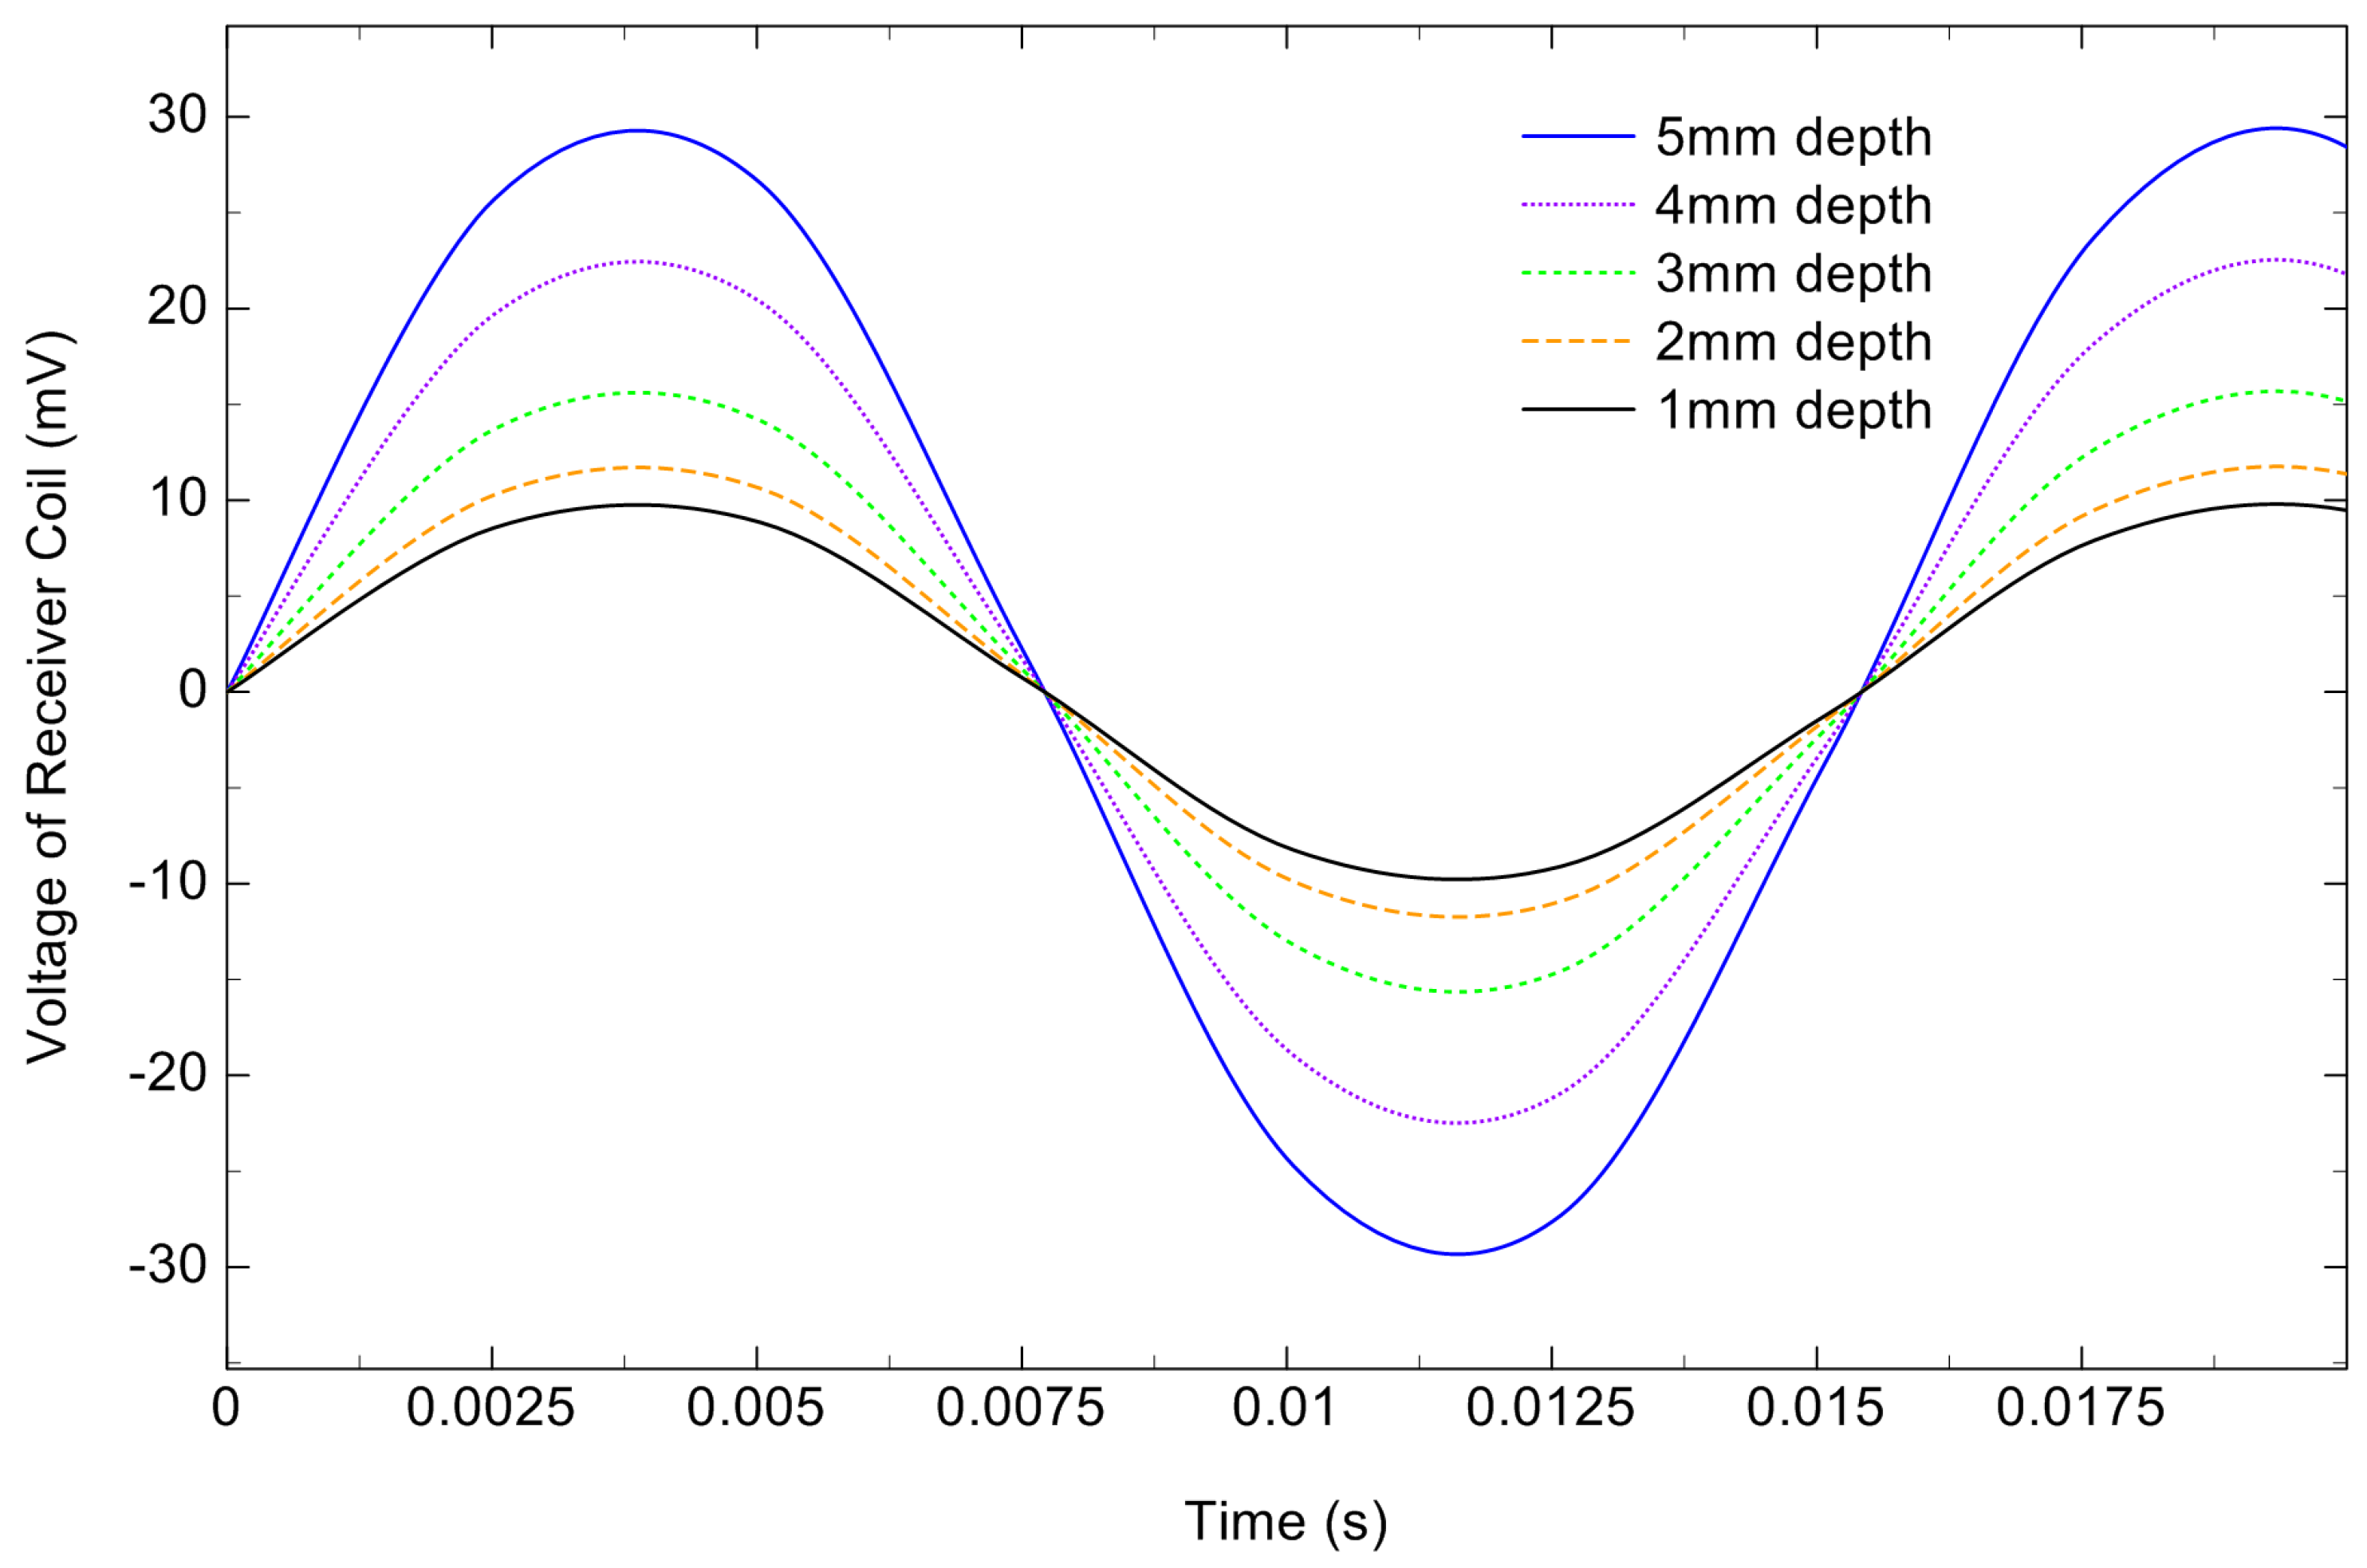
The MFECT system was used to detect defects outside the pipeline, and the results of the experiment are shown in Figure 15. In Figure 15, the maximum of signals increases as the defect depth increases. This is because the reluctance of defects is much larger than that of the tested sample. Consequently, the leakage magnetic field intensifies with the reduction in the remaining wall thickness, resulting in a higher voltage in the receiving coil. This behavior aligns with the pattern conventionally observed in simulation analyses. The experiment results indicate that the MFECT technique is capable of detecting defects on the backside of the pipe.

6. Conclusions

This paper presents an in-pipe mobile magnetically focused eddy current testing system designed to detect backside defects in pipeline. The proposed detection system incorporates one receiver coil and three excitation coils, with two of the excitation coils dedicated to achieving magnetic flux focusing. To validate the feasibility of the proposed system, theoretical analysis was conducted and a finite element simulation model was established. First, the excitation signal frequency was selected and optimized at 65 Hz. Subsequently, the correlation between the received signal and defect depth/width were examined, confirming that defects exceeding 50% of the pipe wall thickness can be reliably detected. Comparative analysis with conventional non-focused eddy current methods demonstrated that the designed system significantly enhances the detectability of pipeline backside defects. The feasibility of the proposed method was verified through experiments.

Author Contributions

Methodology, Z.G. and H.Z.; Writing—original draft, Z.G. All authors have read and agreed to the published version of the manuscript.

Funding

This research received no external funding.

Data Availability Statement

The data presented in this study are available in the article.

Conflicts of Interest

The authors declare no conflicts of interest.

References

  1. Vanaei, H.; Eslami, A.; Egbewande, A. A review on pipeline corrosion, in-line inspection (ILI), and corrosion growth rate models. Int. J. Press. Vessels Pip. 2017, 149, 43–54. [Google Scholar] [CrossRef]
  2. Machado, M.A. Eddy currents probe design for NDT applications: A review. Sensors 2024, 24, 5819. [Google Scholar] [CrossRef]
  3. Ma, B.; Shuai, J.; Liu, D.; Xu, K. Assessment on failure pressure of high strength pipeline with corrosion defects. Eng. Fail. Anal. 2013, 32, 209–219. [Google Scholar] [CrossRef]
  4. Clough, M.; Fleming, M.; Dixon, S.M. Circumferential guided wave EMAT system for pipeline screening using shear horizontal ultrasound. NDT E Int. 2017, 86, 20–27. [Google Scholar] [CrossRef]
  5. Rossteutscher, I.; Blaschke, O.; Dötzer, F.; Uphues, T.; Drese, K.S. Improved EMAT sensor design for enhanced ultrasonic signal detection in steel wire ropes. Sensors 2024, 24, 7114. [Google Scholar] [CrossRef]
  6. He, Y.; Chen, S.; Zhou, D.; Huang, S.; Wang, P. Shared Excitation Based Nonlinear Ultrasound and Vibrothermography Testing for CFRP Barely Visible Impact Damage Inspection. IEEE Trans. Ind. Inform. 2018, 14, 5575–5584. [Google Scholar] [CrossRef]
  7. Meniconi, S.; Brunone, B.; Tirello, L.; Rubin, A.; Cifrodelli, M.; Capponi, C. Transient tests for checking the Trieste subsea pipeline: Toward field tests. J. Mar. Sci. Eng. 2024, 12, 374. [Google Scholar] [CrossRef]
  8. Meniconi, S.; Brunone, B.; Tirello, L.; Rubin, A.; Cifrodelli, M.; Capponi, C. Transient tests for checking the Trieste subsea pipeline: Diving into fault detection. J. Mar. Sci. Eng. 2024, 12, 391. [Google Scholar] [CrossRef]
  9. AbdAlla, A.N.; Faraj, M.A.; Samsuri, F.; Rifai, D.; Ali, K.; Al-Douri, Y. Challenges in improving the performance of eddy current testing: Review. Meas. Control 2019, 52, 46–64. [Google Scholar] [CrossRef]
  10. Dann, M.R.; Huyse, L. The effect of inspection sizing uncertainty on the maximum corrosion growth in pipelines. Struct. Saf. 2018, 70, 71–81. [Google Scholar] [CrossRef]
  11. Yan, C.; Bao, J.; Zheng, X. Conductivity Measurement for Non-Magnetic Materials Using Eddy Current Method with a Novel Simplified Model. Sensors 2025, 25, 3900. [Google Scholar] [CrossRef] [PubMed]
  12. Zhang, K.; He, Y.; Dong, Z. Pulsed Eddy Current Nondestructive Testing for Defect Evaluation and Imaging of Automotive Lightweight Alloy Materials. J. Sens. 2018, 2018, 1–11. [Google Scholar] [CrossRef]
  13. Ge, J.; Xu, F.; Yusa, N. Experimental investigation of low-frequency and pulsed eddy current testing in thickness measurement. Nondestruct. Test. Eval. 2024, in press. [Google Scholar] [CrossRef]
  14. Mihalache, O.; Yamaguchi, T.; Shirahama, T.; Ueda, M. Window multi-frequency ECT for multi-coils in a RFEC system for FBR SG tubes. Int. J. Appl. Electromagn. Mech. 2019, 59, 1161–1168. [Google Scholar] [CrossRef]
  15. Zou, X.; She, S.; Zheng, X.; Yu, K.; Shen, J.; Peyton, A.; Yin, W. Simultaneous Estimation of Conductivity and Radial Eccentricity of Metallic Cylinders Using Eddy Current Testing. IEEE Trans. Instrum. Meas. 2025, 74, 6011110. [Google Scholar] [CrossRef]
  16. Chen, W.; Wu, D.; Wang, X.; Wang, T. A self-frequency-conversion eddy current testing method. Measurement 2022, 195, 111129. [Google Scholar] [CrossRef]
  17. Shao, W.; Wu, X.; Lu, R.; Chen, J.; Ma, Y. A multi-frequency balanced electromagnetic field measurement for arbitrary angles of pipeline cracks with high sensitivity. Insight-Non Test. Cond. Monit. 2024, 66, 361–367. [Google Scholar] [CrossRef]
  18. Thirunavukkarasu, S.; Rao, B.; Jayakumar, T.; Raj, B. Techniques for processing remote field eddy current signals from bend regions of steam generator tubes of prototype fast breeder reactor. Ann. Nucl. Energy 2011, 38, 817–824. [Google Scholar] [CrossRef]
  19. Xu, Z.; Fan, S.; Song, T. Parameter identification of pulsed eddy current testing equivalent circuit model and its application to defect evaluation. Meas. Control 2021, 54, 1113–1121. [Google Scholar] [CrossRef]
  20. Komatsubara, K.; Gao, Y.; Gotoh, Y.; Guan, W.; Muramatsu, K. Frequency characteristics analysis of remote field eddy current testing on ferromagnetic pipes. IEEE Trans. Magn. 2023, 59, 6200605. [Google Scholar] [CrossRef]
  21. Mohammed, F.T.; Saffiudeen, M.F.; Syed, A.; Alamri, Y.A. Failure Analysis of Heat Exchanger Using Remote Field Eddy Current Testing (RFET). J. Fail. Anal. Prev. 2025, 25, 996–1002. [Google Scholar] [CrossRef]
  22. Mokros, S.G.; Underhill, P.R.; Morelli, J.E.; Krause, T.W. Pulsed Eddy Current Inspection of Wall Loss in Steam Generator Trefoil Broach Supports. IEEE Sens. J. 2017, 17, 444–449. [Google Scholar] [CrossRef]
  23. Mirzaei, M.; Ripka, P.; Chirtsov, A.; Grim, V. Eddy current speed sensor with magnetic shielding. J. Magn. Magn. Mater. 2020, 502, 166568. [Google Scholar] [CrossRef]
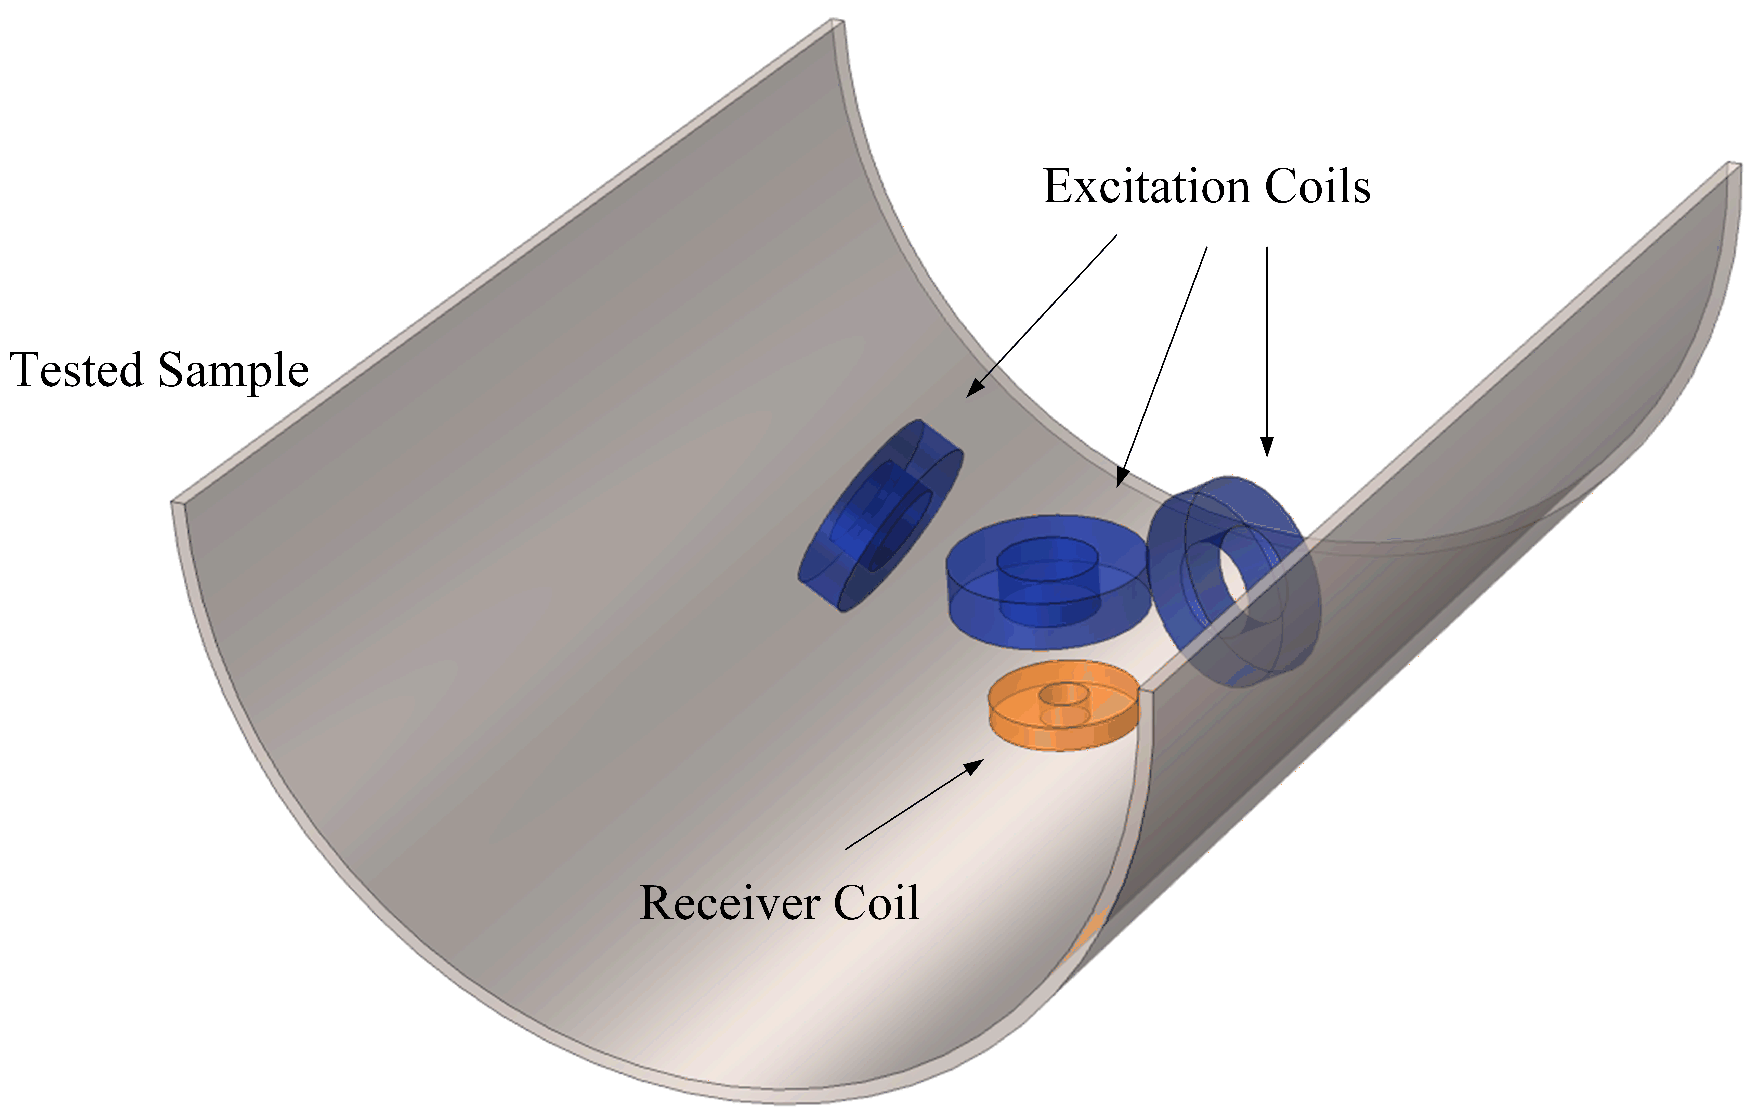
Figure 1. Structure of magnetically focused eddy current testing.
Applsci 15 11012 g001
Figure 2. The BH curve of the steel pipe.
Applsci 15 11012 g002
Figure 3. Arrangement of an MFECT system in pipe (Unit: mm).
Applsci 15 11012 g003
Figure 4. Schematic diagram of defect.
Applsci 15 11012 g004
Figure 5. Poynting vector distribution on detection cross-section.
Applsci 15 11012 g005
Figure 6. The voltage of the receiver coil with different defect depth under different frequencies.
Applsci 15 11012 g006
Figure 7. The voltage of the receiver coil with different defect width under different frequencies.
Applsci 15 11012 g007
Figure 8. The circumferential axis flux density with different positions under different defect depths.
Applsci 15 11012 g008
Figure 9. The radial axis flux density with different positions under different defect depths.
Applsci 15 11012 g009
Figure 10. The circumferential axis magnetic flux with different defect widths.
Applsci 15 11012 g010
Figure 11. The radial axis magnetic flux with different defect widths.
Applsci 15 11012 g011
Figure 12. Distribution of magnetic flux on circumferential axis under different defect depths without magnetic focusing coil.
Applsci 15 11012 g012
Figure 13. Distribution of magnetic flux on radial axis under different defect depths without magnetic focusing coil.
Applsci 15 11012 g013
Figure 14. Schematic of the experimental testing system. (a) FMECT system. (b) Tested sample.
Applsci 15 11012 g014
Figure 15. The voltage received by the receiving coil at different defect depths at an excitation frequency of 65 Hz.
Applsci 15 11012 g015
Table 1. Parameter of coils and sample.
Excitation CoilsReceiver CoilPipeline
Thickness (mm)20106
Inner radius (mm)1010200
Outer radius (mm)4030206
Lift-off (mm)105/
Turns (N)400200/
Table 2. Material properties.
Excitation CoilsReceiver CoilPipeline
Materialcoppercopperiron
Conductivity (S/m) 5.8 × 10 7 5.8 × 10 7 1.12 × 10 7
Relative permeability11BH curve
Table 3. Experimental parameters.
ItemParameter
Excitation CoilInner diameter10 mm
Outer diameter40 mm
Height20 mm
Turns400
Receiver CoilInner diameter10 mm
Outer diameter30 mm
Height10 mm
Turns700
Disclaimer/Publisher’s Note: The statements, opinions and data contained in all publications are solely those of the individual author(s) and contributor(s) and not of MDPI and/or the editor(s). MDPI and/or the editor(s) disclaim responsibility for any injury to people or property resulting from any ideas, methods, instructions or products referred to in the content.