1. Introduction
The longitudinal displacement profile (LDP) reflects how the radial displacement of the surrounding rock at a tunnel excavation boundary evolves with distance from the tunnel face. It is an important component of convergence confinement analysis and is used to determine support timing in the support design for rock mass surrounding tunnels, mining shafts, and even roadways [
1,
2,
3]. The displacement of tunnel-surrounding rock is affected by geological and engineering conditions, particularly rock mass properties, engineering structures and parameters, excavation methods, and other associated geomechanical conditions [
4,
5,
6,
7]. Accordingly, the method for constructing LDP curves must be specifically adapted to account for these geological and engineering conditions. Neglecting this requirement may lead to unsuitable support designs, resulting in the failure of supporting structures or even instability of the tunnel-surrounding rock. Furthermore, such scenarios directly threaten the safety of construction personnel and equipment and adversely impact the economic efficiency of construction enterprises. Consequently, developing LDP construction methods tailored to distinct engineering conditions represents both a safety imperative and an economic necessity for modern tunneling operations.
LDP curve construction methods are categorized into theoretical analytical methods, numerical simulation methods, and field monitoring methods. Compared to the latter two methods, the theoretical analytical method is simpler to carry out, less time-consuming, and lower in cost. It is also essential for designing the support structure for tunnel-surrounding rock, particularly for preliminary support. After many years of development, various theoretical analytical methods for constructing tunnel LDP curves under different geological and engineering conditions have been proposed and developed through on-site monitoring and numerical simulation analysis.
Panet [
8] used the linear elastic model to simulate tunnel excavation and fitted simulation data on the evolution of radial displacement of surrounding rock at the tunnel excavation boundary as a function of distance from the tunnel face. A method of LDP construction for a tunnel was obtained:
where
ur and
umax are the radial displacement and the maximum radial displacement of the surrounding rock at the tunnel excavation boundary, respectively;
x is the distance from the tunnel face; and
R0 is the tunnel excavation radius. These parameters have the same physical meaning throughout this paper.
Chen et al. [
9] proposed the following method for constructing tunnel LDPs by fitting on-site monitoring data:
Unle and Gercek [
10] observed that the radial displacement of surrounding rock at the tunnel excavation boundary in front and behind the tunnel face does not vary as a single continuous function with distance from the tunnel face. Therefore, they adopted the linear elastic model and proposed a segmented LDP construction method considering the influence of Poisson’s ratio through numerical simulation:
For
X* ≥ 0,
where
X* =
x/
R0. A positive
x value refers to the excavated tunnel section, while the contrary refers to the unexcavated tunnel section.
u0 represents the radial displacement of the surrounding rock of the tunnel excavation boundary at the tunnel face location.
Aa,
Ab,
Ba, and
Bb are Poisson’s ratio functions, expressed as follows:
Vlachopoulos and Diederichs [
11] posited that the radius of the plastic zone has a significant impact on the tunnel’s LDP. They used the elastic–perfectly plastic model, through numerical simulation and obtained LDP expressions considering the influence of the plastic zone:
For
X* ≥ 0,
where
u* =
u0/
umax,
R* =
Rp/
R0, and
Rp is the radius of the plastic zone.
Alejano et al. [
12] proposed a method for calculating the radius of the plastic zone of the surrounding rock of a tunnel excavated in elastic-strain softening rock mass through numerical calculations, which is combined with the LDP construction method proposed by Vlachopoulos et al. [
11] to form an LDP construction method for a tunnel excavated in elastic-strain softening rock mass. However, this method is still essentially an LDP construction method established using the elastic–perfectly plastic model; an LDP construction method for tunnel-surrounding rock using an elastic-strain softening model remains to be developed.
Zhong et al. [
13] conducted numerical simulations on tunnel excavation in Xigeda stratum with varying water contents using the Mohr–Coulomb yield criterion and the elastic–perfectly plastic model. In addition, they obtained data on the evolution of radial displacement of the surrounding rock at a tunnel excavation boundary as a function of distance from the tunnel face. Based on this, they proposed the following fitting expressions for constructing LDP curves for tunnels in the water-bearing Xigeda stratum:
For
x < 0,
where
ω is the water content in %, and
p1~
p7 are coefficients of the above fitting equations, which have different values in the intervals
x ≥ 0 and
x < 0.
In the development of tunnel LDP construction methods based on numerical simulations, the elastic model and the elastic–perfectly plastic model have often been used, including for the purpose of extending a tunnel LDP construction method established using the elastic–perfectly plastic model to the case of elastic-strain softening rock mass. However, an LDP construction method using the elastic–brittle–plastic model has not yet been proposed for hard–brittle tunnel-surrounding rock. This study uses the numerical simulation method and the elastic–brittle–plastic model to obtain and analyze data on the evolution of radial displacement of the surrounding rock at the tunnel excavation boundary as a function of distance from the tunnel face. A method is accordingly established for constructing the LDPs of tunnels excavated in elastic–brittle–plastic rock mass, which provides an option for the convergence–confinement analysis of tunnels, mine shafts, or roadways.
2. Numerical Model and Parameters of Tunnels
Using the elastic–brittle–plastic constitutive model, numerical simulations are employed to obtain data on the evolution of radial displacement of the surrounding rock at the tunnel excavation boundary as a function of distance from the tunnel face under varying conditions. These data are then used to fit and establish a functional relationship between the radial displacement of surrounding rock and the distance from the tunnel face—thereby developing an LDP curve construction method suitable for tunnels with elastic–brittle–plastic surrounding rock.
Although only rock masses with a Geological Strength Index (GSI) > 75 (excluding purely elastic cases) exhibit elastic–brittle–plastic mechanical responses in practical engineering [
14], it is feasible to assign GSI values within the range of [0, 100] to a numerical model of rock mass when developing an LDP curve construction method for tunnels excavated in elastic–brittle–plastic rock masses. After all, when adopting the elastic–brittle–plastic constitutive model, the quantitative relationship established using the GSI ∈ [0, 100] (i.e., the LDP curve construction method) must inherently apply to GSI ∈ [75, 100].
Given the lack of tunnel engineering cases meeting the research requirements, this study was based on a quasi-circular granite tunnel in northwest China with a burial depth of 630 m and an average excavation radius of 3.75 m. The parameters of this baseline model were adjusted to yield diverse parameter combinations fulfilling the research needs. Simultaneously, to ensure that the developed LDP curve construction method is applicable to different tunnel projects with varying surrounding rock conditions (GSI > 75), key parameters in the numerical tunnel model were rendered dimensionless.
The FLAC3D three-dimensional finite difference program [
15] and Phase2 two-dimensional finite element program [
16] are widely used for simulating tunnel excavation. Validated by Vlachopoulos and Diederichs [
11], the FLAC3D 3D simulation tests for the evolution of radial displacement of the surrounding rock at tunnel excavation boundary as a function of the distance from the tunnel face show close alignment with simulation results obtained using Phase2’s built-in 2D simulation method for 3D axisymmetric tunnel problems [
17]. Furthermore, Phase2 offers simpler modeling and shorter computation time on the same computational platform. Therefore, the Phase2 program is chosen to simulate tunnel excavation in this study.
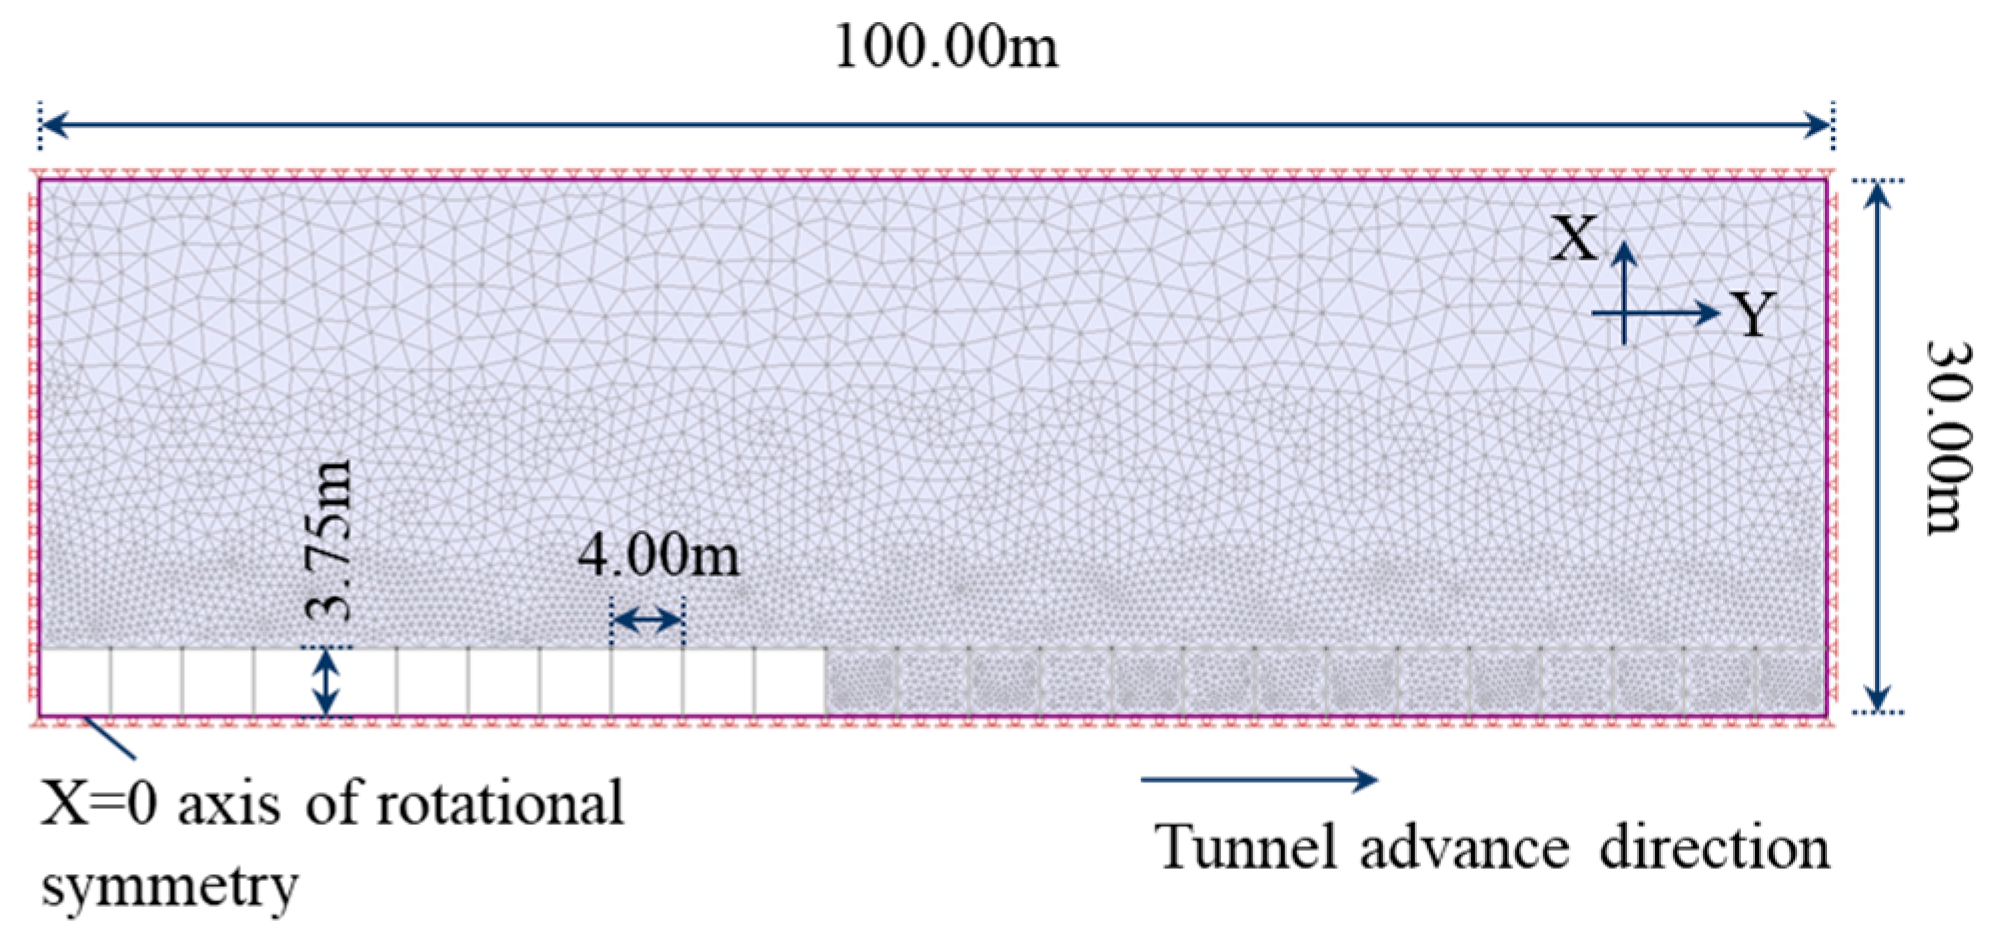
Based on the above granite tunnel project with a burial depth of 630 m, combined with the Phase2 simulation method for three-dimensional axisymmetric problems [
17], a circular tunnel axisymmetric model is constructed, as shown in
Figure 1. The model is symmetric around the
X = 0 axis, with a length of 100.00 m and a width of 30.00 m. The model is excavated from left to right, with an excavation radius of 3.75 m and a cycle advance of 4.00 m; the upper and right boundaries of the model limit displacement in both X and Y directions, while the lower and left boundaries limit the Y and X displacements, respectively. The in situ stress in the model is hydrostatic pressure, and the magnitude is the self-weight of the tunnel-covering rock, with an average bulk density of 0.027 KN/m
3.
As shown in
Figure 1, the tunnel model adopts a triangular mesh with 11,570 elements. According to elastoplastic mechanics theory, regions beyond 3–5 times the excavation radius from the center of the circular opening are in the non-excavation-disturbed zone [
18]. Consequently, the mesh was refined within a range of about five times the tunnel radius from its center. Subsequent refinement to approximately 1.5 times and 2 times the original number of mesh elements resulted in variations in radial displacement at the tunnel excavation boundary, which remained within 3% of the initial values, thereby validating the rationality of the non-uniform mesh design.
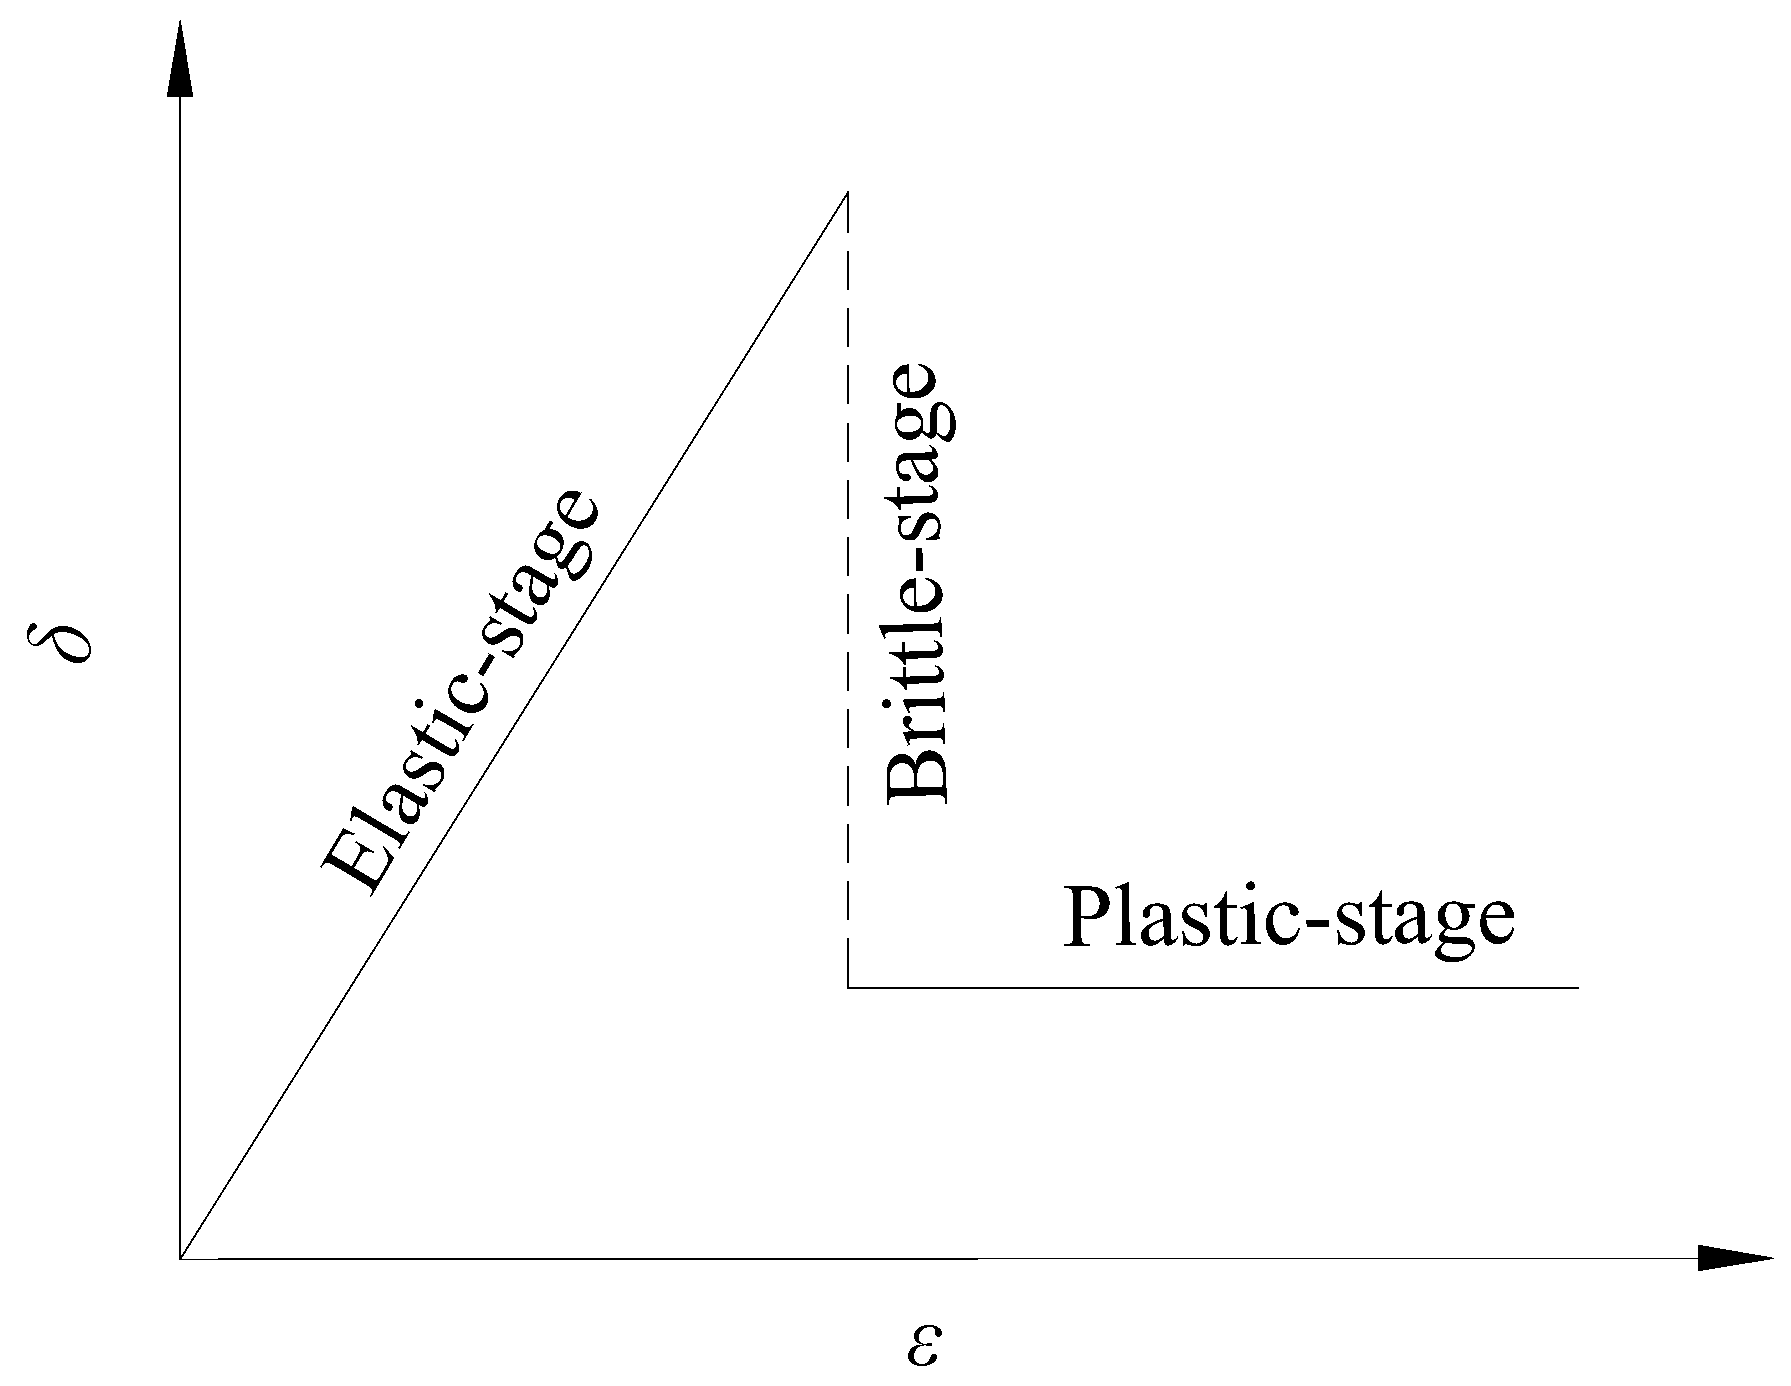
The numerical model of the tunnel is based on the elastic–brittle–plastic constitutive model, as illustrated in
Figure 2. During the elastic stage, the model parameters represent the peak physical–mechanical properties of the rock mass, determined by the intact rock properties and peak GSI values (GSI
p). Upon entering the plastic stage, the model parameters correspond to residual physical–mechanical properties of the rock mass, derived from the intact rock properties and residual GSI values (GSI
r).
Based on the physical–mechanical properties of intact granite at a depth of 630 m, namely, the T0 parameter group in
Table 1, where
σci is the uniaxial compressive strength of intact rock,
Ei is the elastic modulus of intact rock,
μ is the Poisson’s ratio of intact rock,
σ0 is the in situ stress,
UCSRM is the global strength of the rock mass [
19], and the other parameters have the same physical meanings as described above. Referring to Vlachopoulos and Diederichs’s method for defining numerical model parameters [
11], GSI
p or
σci is adjusted under a constant
σ0, and
σ0 is adjusted under a constant GSI
p and
σci, resulting in numerical model parameters of tunnel-surrounding rock with a certain ratio of
σ0 to
UCSRM, as shown in
Table 1 and
Table 2, respectively. GSI
r is calculated using the empirical calculation method proposed by Alejano et al. [
12], as shown in Equation (11).
For the Phase2 numerical model of the tunnel adopting the generalized Hoek–Brown yield criterion, the input parameters include
σci, the peak and residual value of the elastic modulus of rock mass
E, the Poisson’s ratio of the rock mass
v, and the peak and residual values of Hoek–Brown constants (
mb,
s, and
a) calculated using GSI
p and GSI
r, respectively. The method for calculating the physical–mechanical parameters of rock mass proposed by Hoek et al. [
19] was used to determine the above tunnel model input parameters. The calculated results are summarized in
Table 3.
3. LDP for Elastic–Brittle–Plastic Tunnel-Surrounding Rock
Phase2 numerical simulations were conducted on tunnel models with parameters assigned from different parameter groups in
Table 3; the key deformation and failure parameters of tunnel-surrounding rock were obtained as presented in
Table 4.
u0 represents the radial displacement of the surrounding rock of the tunnel excavation boundary at the tunnel face location,
umax represents the maximum radial displacement of surrounding rock at the tunnel excavation boundary,
Rp represents the radius of the plastic zone, and
R0 represents the excavation radius of the tunnel.
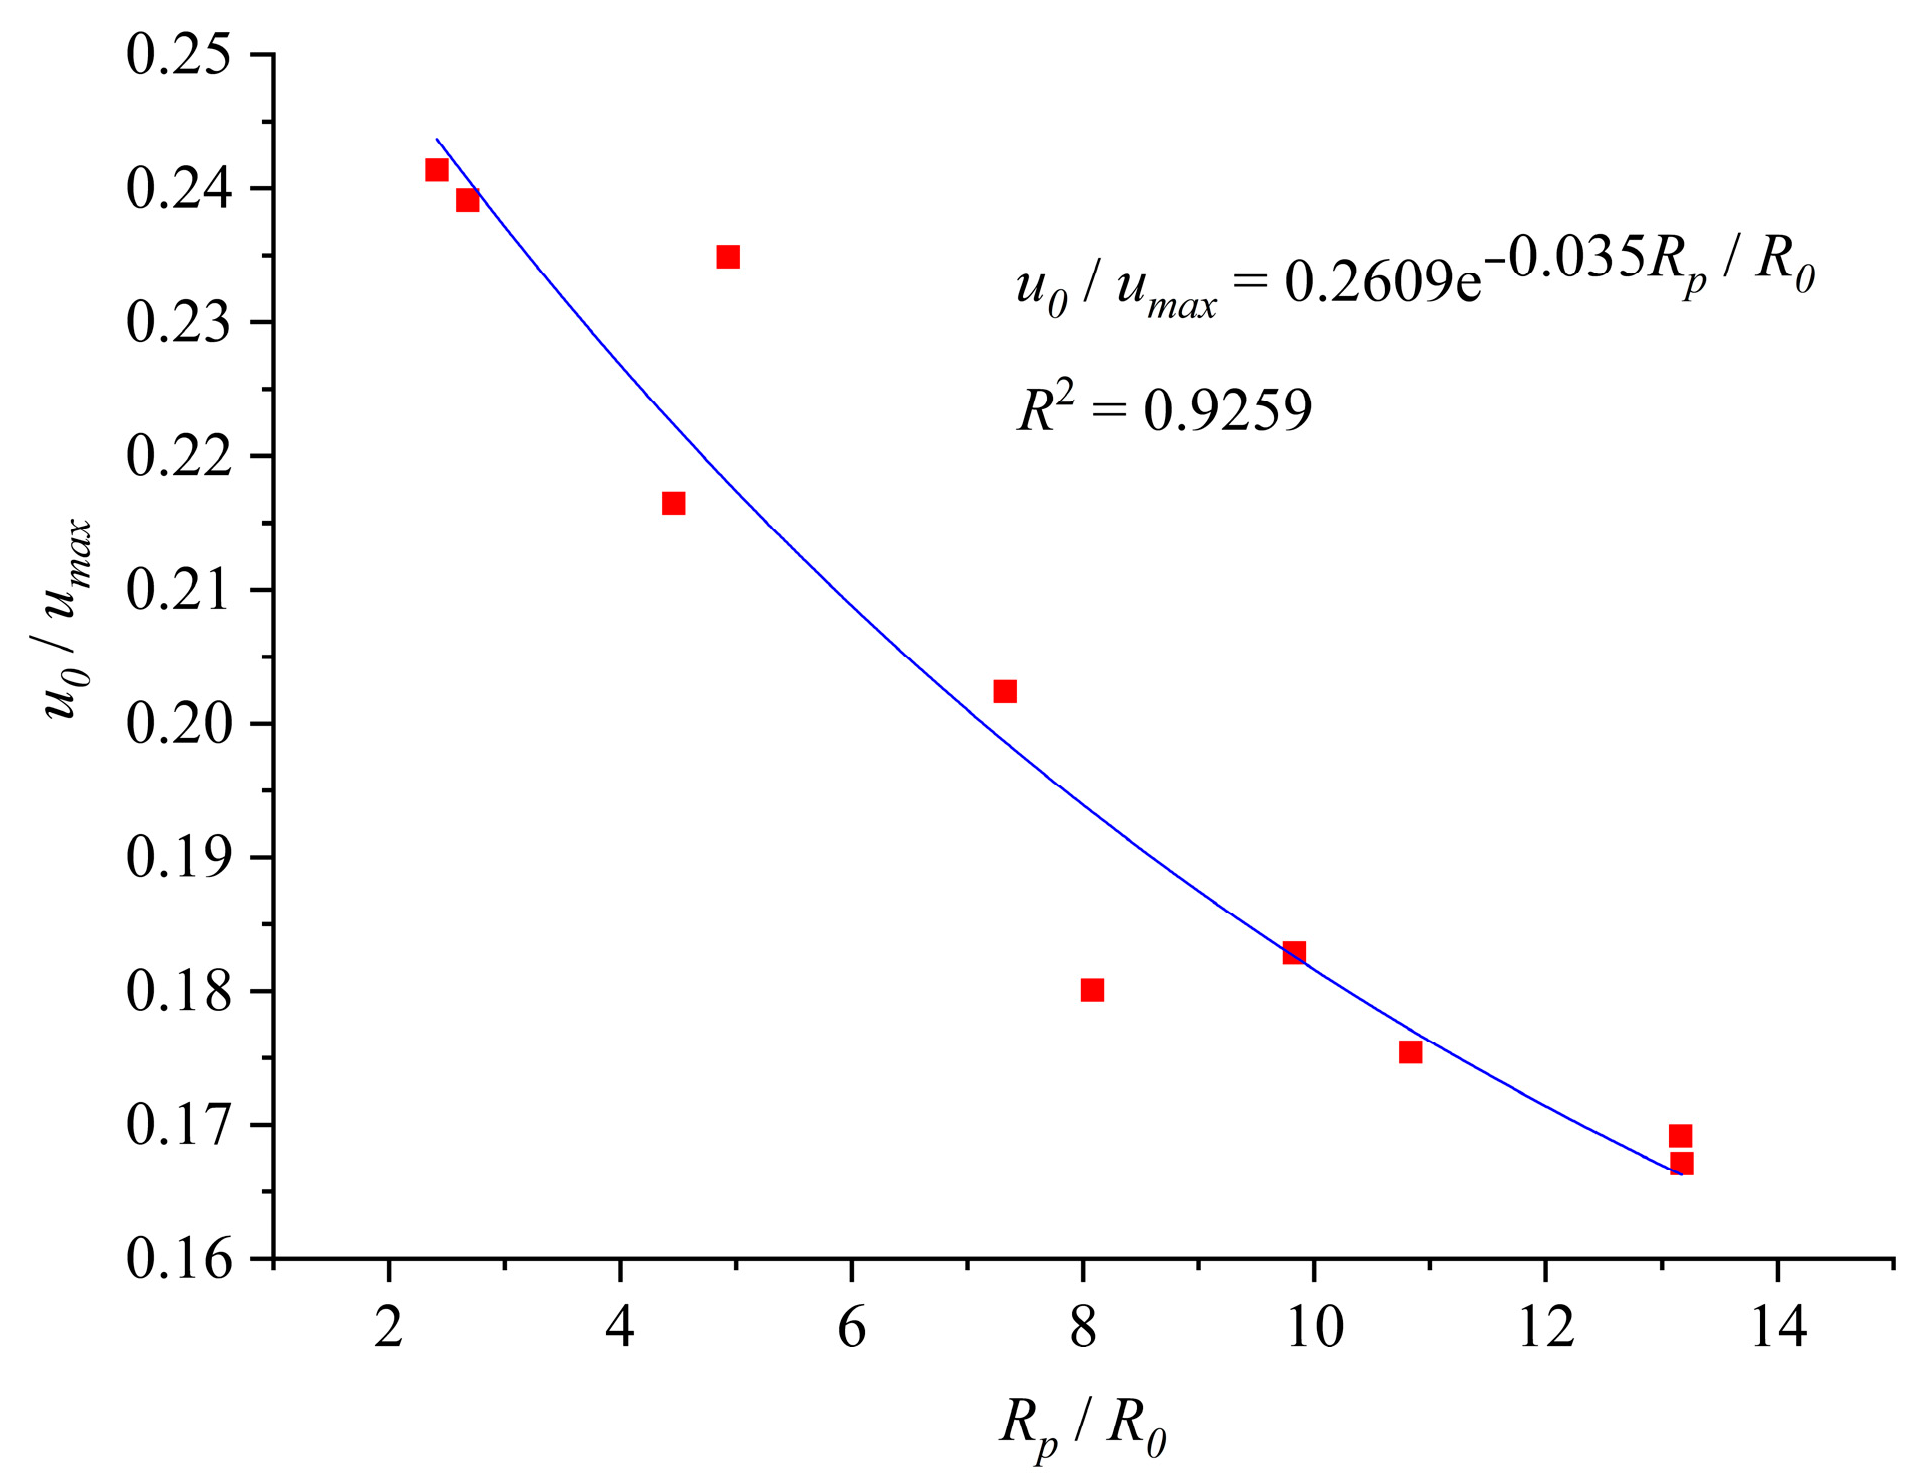
Analyzing the simulated data in
Table 4, the quantitative relationship between the dimensionless radial displacement
u0/
umax and the dimensionless plastic zone radius
Rp/
R0 at the tunnel face location is obtained using the different parameter groups in
Table 3, as shown in
Figure 3 and Equation (10):
where
R2 is the correlation coefficient with a range of [0, 1]. The larger the correlation coefficient, the better the correlation between the fitted curve and the data points.
R2 = 0.9259 shows a strong correlation, which means that the quantitative relationship in Equation (12) is reliable.
According to
Table 4 and Equation (12), the quantitative relationship between the radial displacement of the surrounding rock at the tunnel excavation boundary in elastic–brittle–plastic rock mass and the distance from the tunnel face is constructed as follows:
where
=
Rp/
R0 and
X* =
X/
R0. A positive
X or
X* represents the excavated tunnel section, while the contrary represents the unexcavated tunnel section. By employing the different rock mass parameter groups listed in
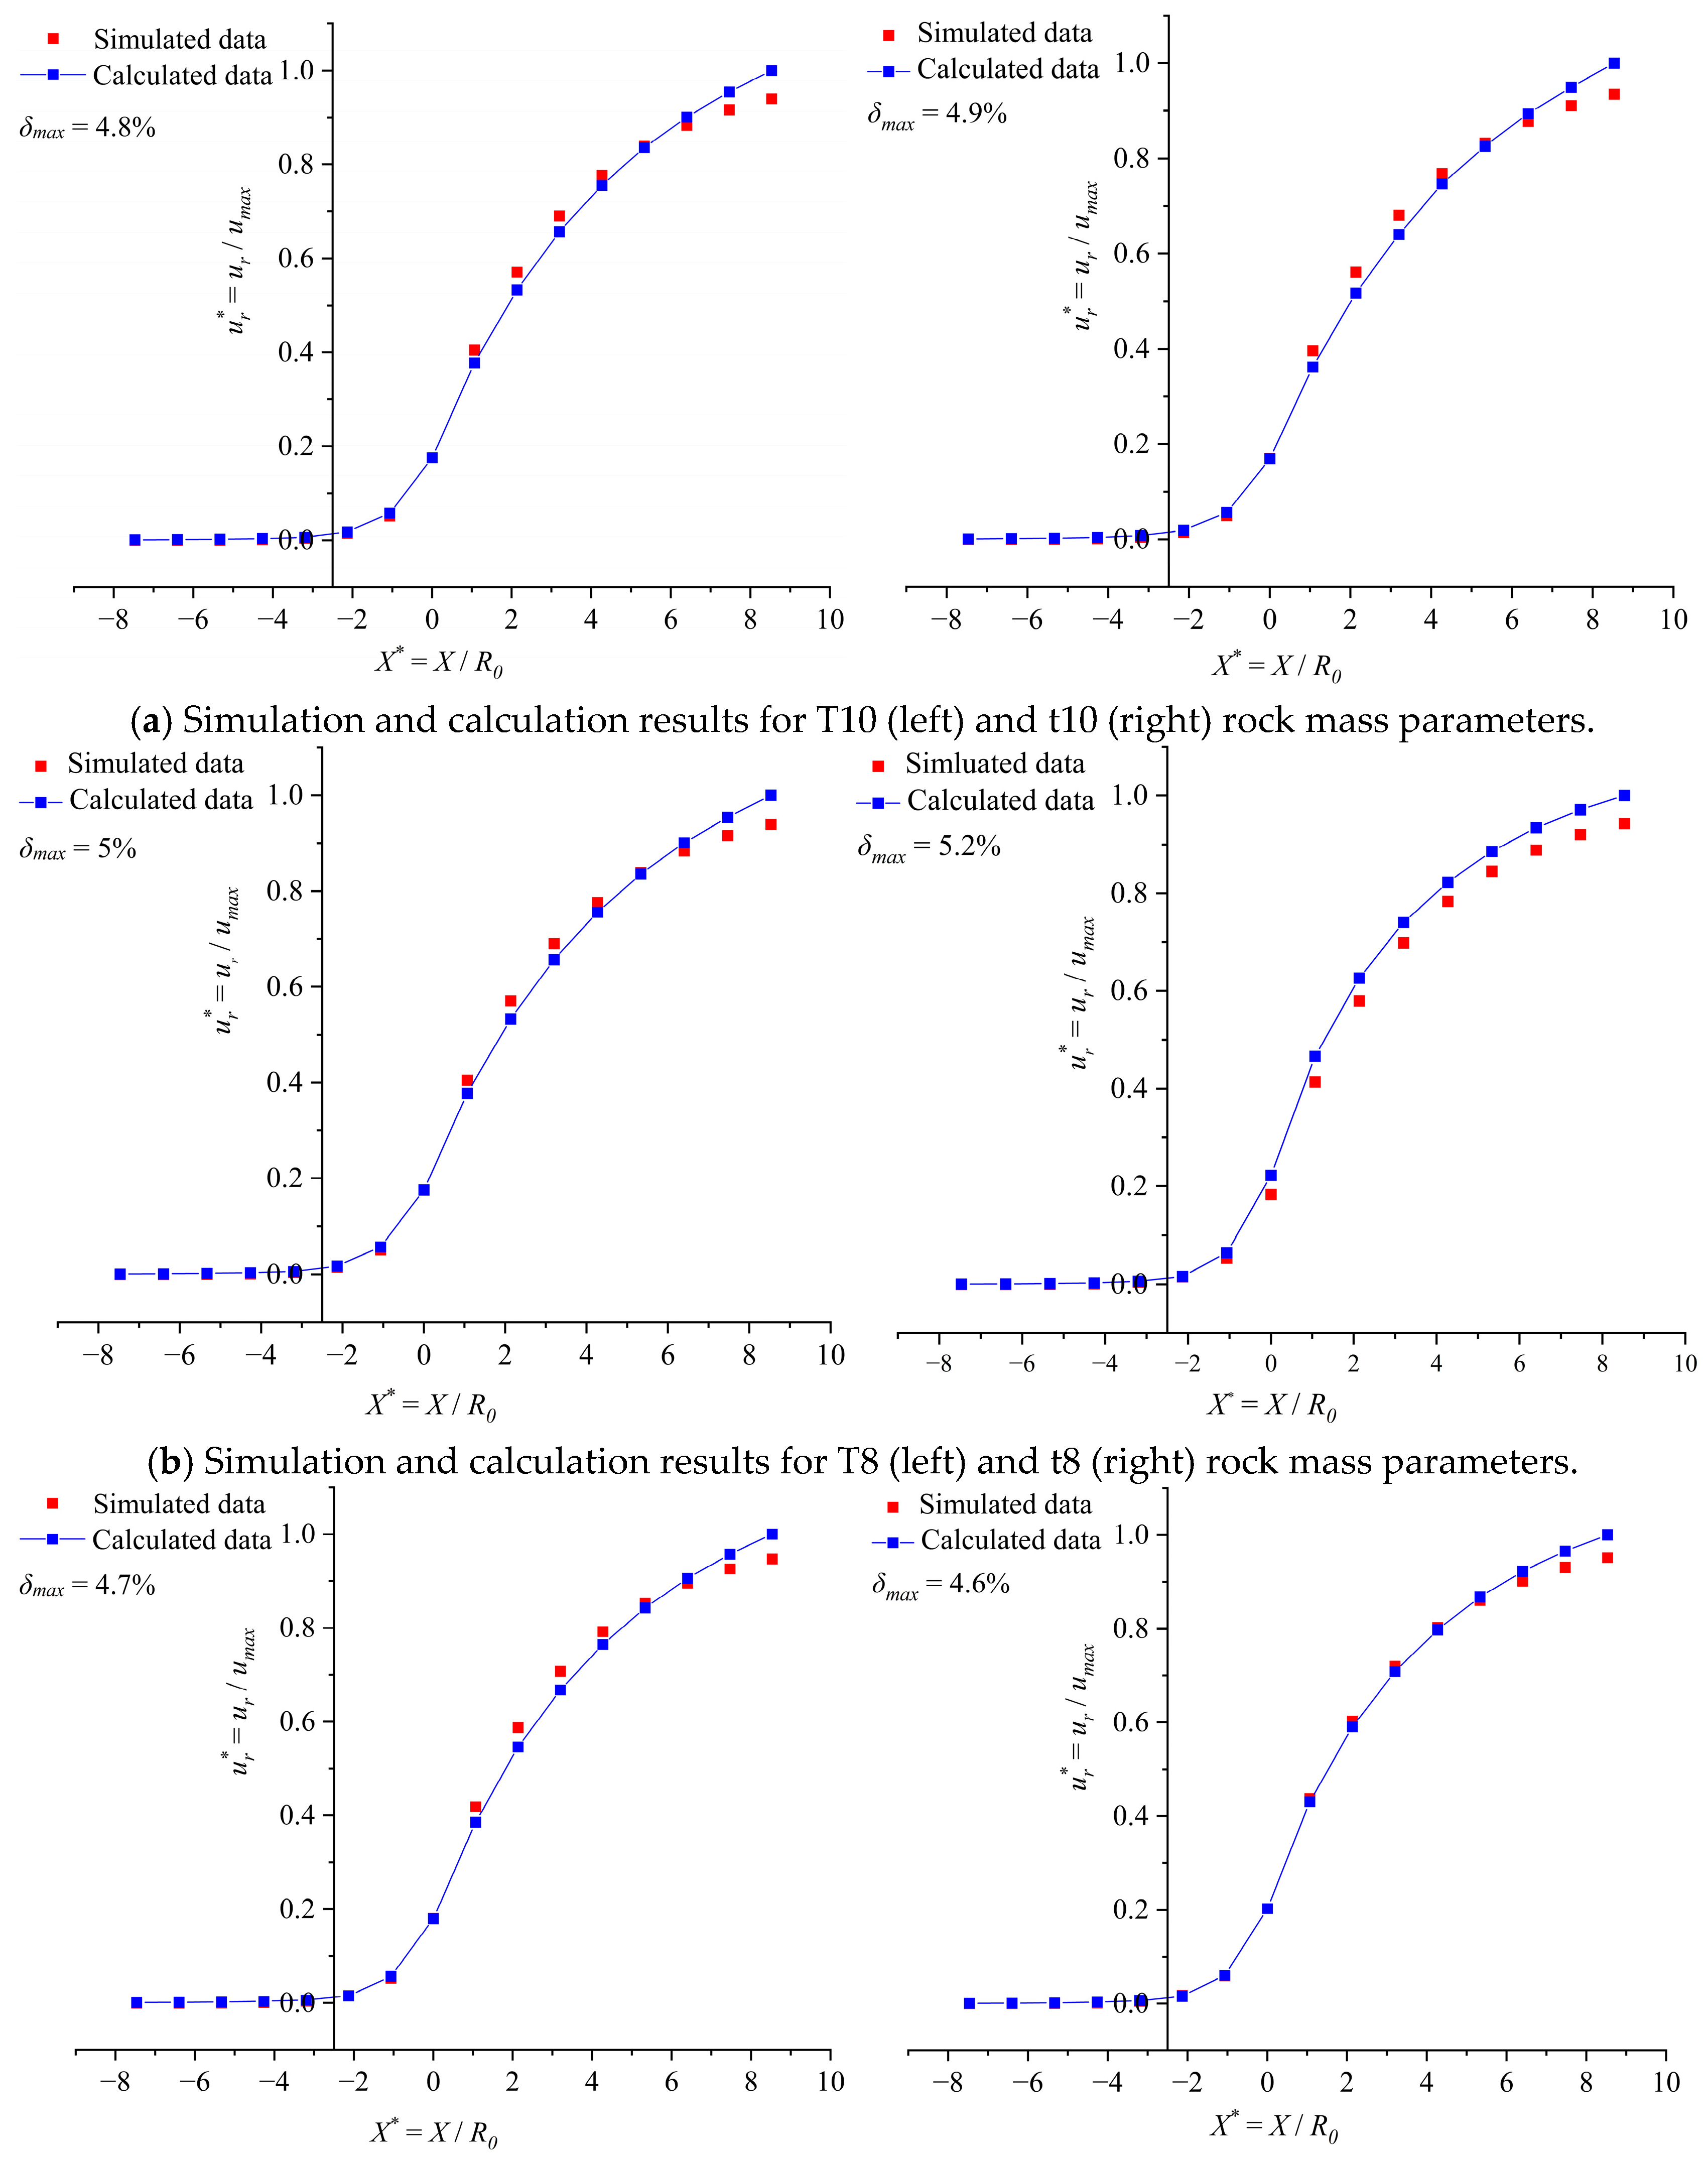
Table 3 to simulate tunnel excavation, tunnel LDPs were constructed through numerical simulation data and calculations using Equations (12)–(14), as shown in
Figure 4.
Figure 4 shows high consistency between the LDPs of the tunnel-surrounding rock assigned different parameter groups and constructed using the two methods, which preliminarily verifies the accuracy of the proposed analytical expressions for constructing the LDP of the elastic–brittle–plastic tunnel-surrounding rock.
Meanwhile, for a tunnel model with a specific parameter group from
Table 3, the simulated and calculated radial displacement data of the surrounding rock at the tunnel excavation boundary can be obtained at the same distance from the tunnel face. The relative error
δ between the two displacement values can be calculated using Equation (15), where
u1 and
u2 represent the simulated and calculated radial displacement values, respectively. Using this method, multiple relative errors of radial displacement
δ at different distances from the tunnel face can be derived for a tunnel model based on specific parameters. The maximum value of relative error
δmax among these
δ values can serve as an indicator of the consistency between the two curves for the tunnel model based on specific parameters. As shown in
Figure 4, the
δmax values calculated for all parameter groups in
Table 3 remain below 5.2%, demonstrating excellent agreement between the LDPs generated via the two methods for each parameter group. This further quantitatively validates the accuracy of the analytical expressions for LDPs obtained by fitting the simulated data in this study.
4. Engineering Verification and Application
The proposed LDP construction method for elastic–brittle–plastic tunnel-surrounding rock was validated by monitoring the radial displacement of the surrounding rock during tunneling in the Jinping Underground No. 4 experimental tunnel in China, conducted by Feng et al. [
20]. Based on Feng et al.’s research [
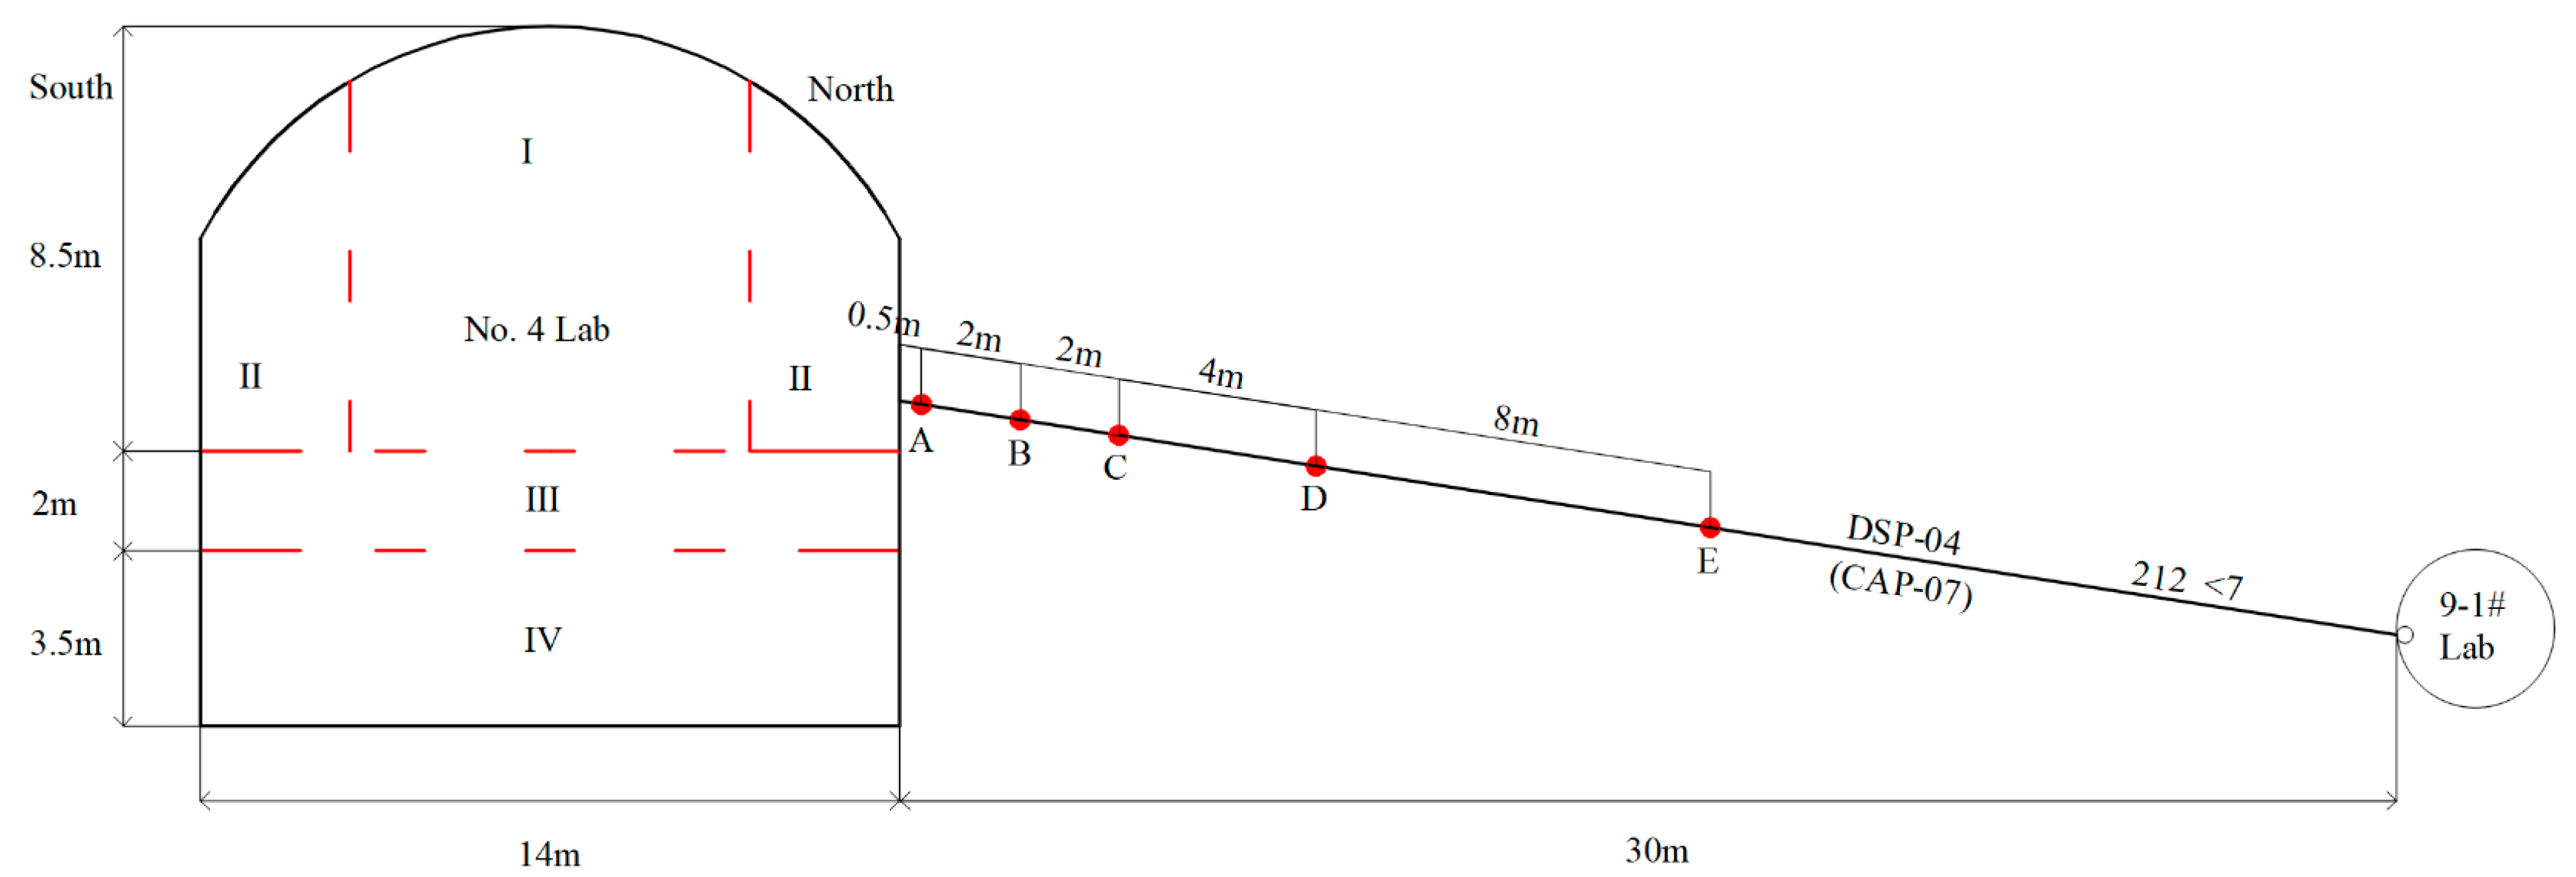
20], the excavation sequence and sensor layout of the No. 4 experimental tunnel are shown in
Figure 5. The No. 4 experimental tunnel is excavated in layers in the order of I, II, III, and IV. The measurement point positions of the multi-point displacement meter are indicated by A, B, C, D, and E in
Figure 5. Due to the long distance between the upper-layer (I, II) and lower-layer (III, IV) faces of the No. 4 experimental tunnel, as well as the relatively small displacement of the surrounding rock induced by the excavation of part I of the experimental tunnel (1–2 mm) compared to the excavation of part II of experimental tunnel (50–60 mm), the process of excavating the upper-layer experimental tunnel can be regarded as an independent full-section tunnel excavation process. Thus, validating the LDP construction method proposed in this study based on its monitoring results is reasonable.
According to Feng et al. [
20], the depth of the No. 4 experimental tunnel is about 2400 m, and the average value of in situ stress in the axial, horizontal, and vertical directions of the experimental tunnel is about 50 MPa. The rock mass where the No. 4 experimental tunnel is located is composed of marble, with a uniaxial compressive strength of 120 MPa, an elastic modulus of 35 GPa, and a Poisson’s ratio of 0.25. The GSI
p is 80 and the calculated GSI
r is 41. The following calculation adopts the generalized Hoek–Brown yield criterion, and Hoek et al.’s method for calculating rock mass parameters [
19] was used to calculate the strength and deformation parameters of the surrounding rock of the No. 4 experimental tunnel. The calculated results are listed in
Table 5.
Using the algorithm method proposed by Zhao et al. [
3]—which employs an elastic–brittle–plastic constitutive model and the generalized Hoek–Brown yield criterion for determining the maximum radial displacement
umax and plastic zone radius
R0 of circular tunnel-surrounding rock—the calculations were performed using the rock mass parameters in
Table 5 and in situ stress values from the No. 4 experimental tunnel as input parameters. The
Rp of the No. 4 experimental tunnel with an equivalent excavation radius
R0 of 11.25 m is calculated to be 7.85 m, and
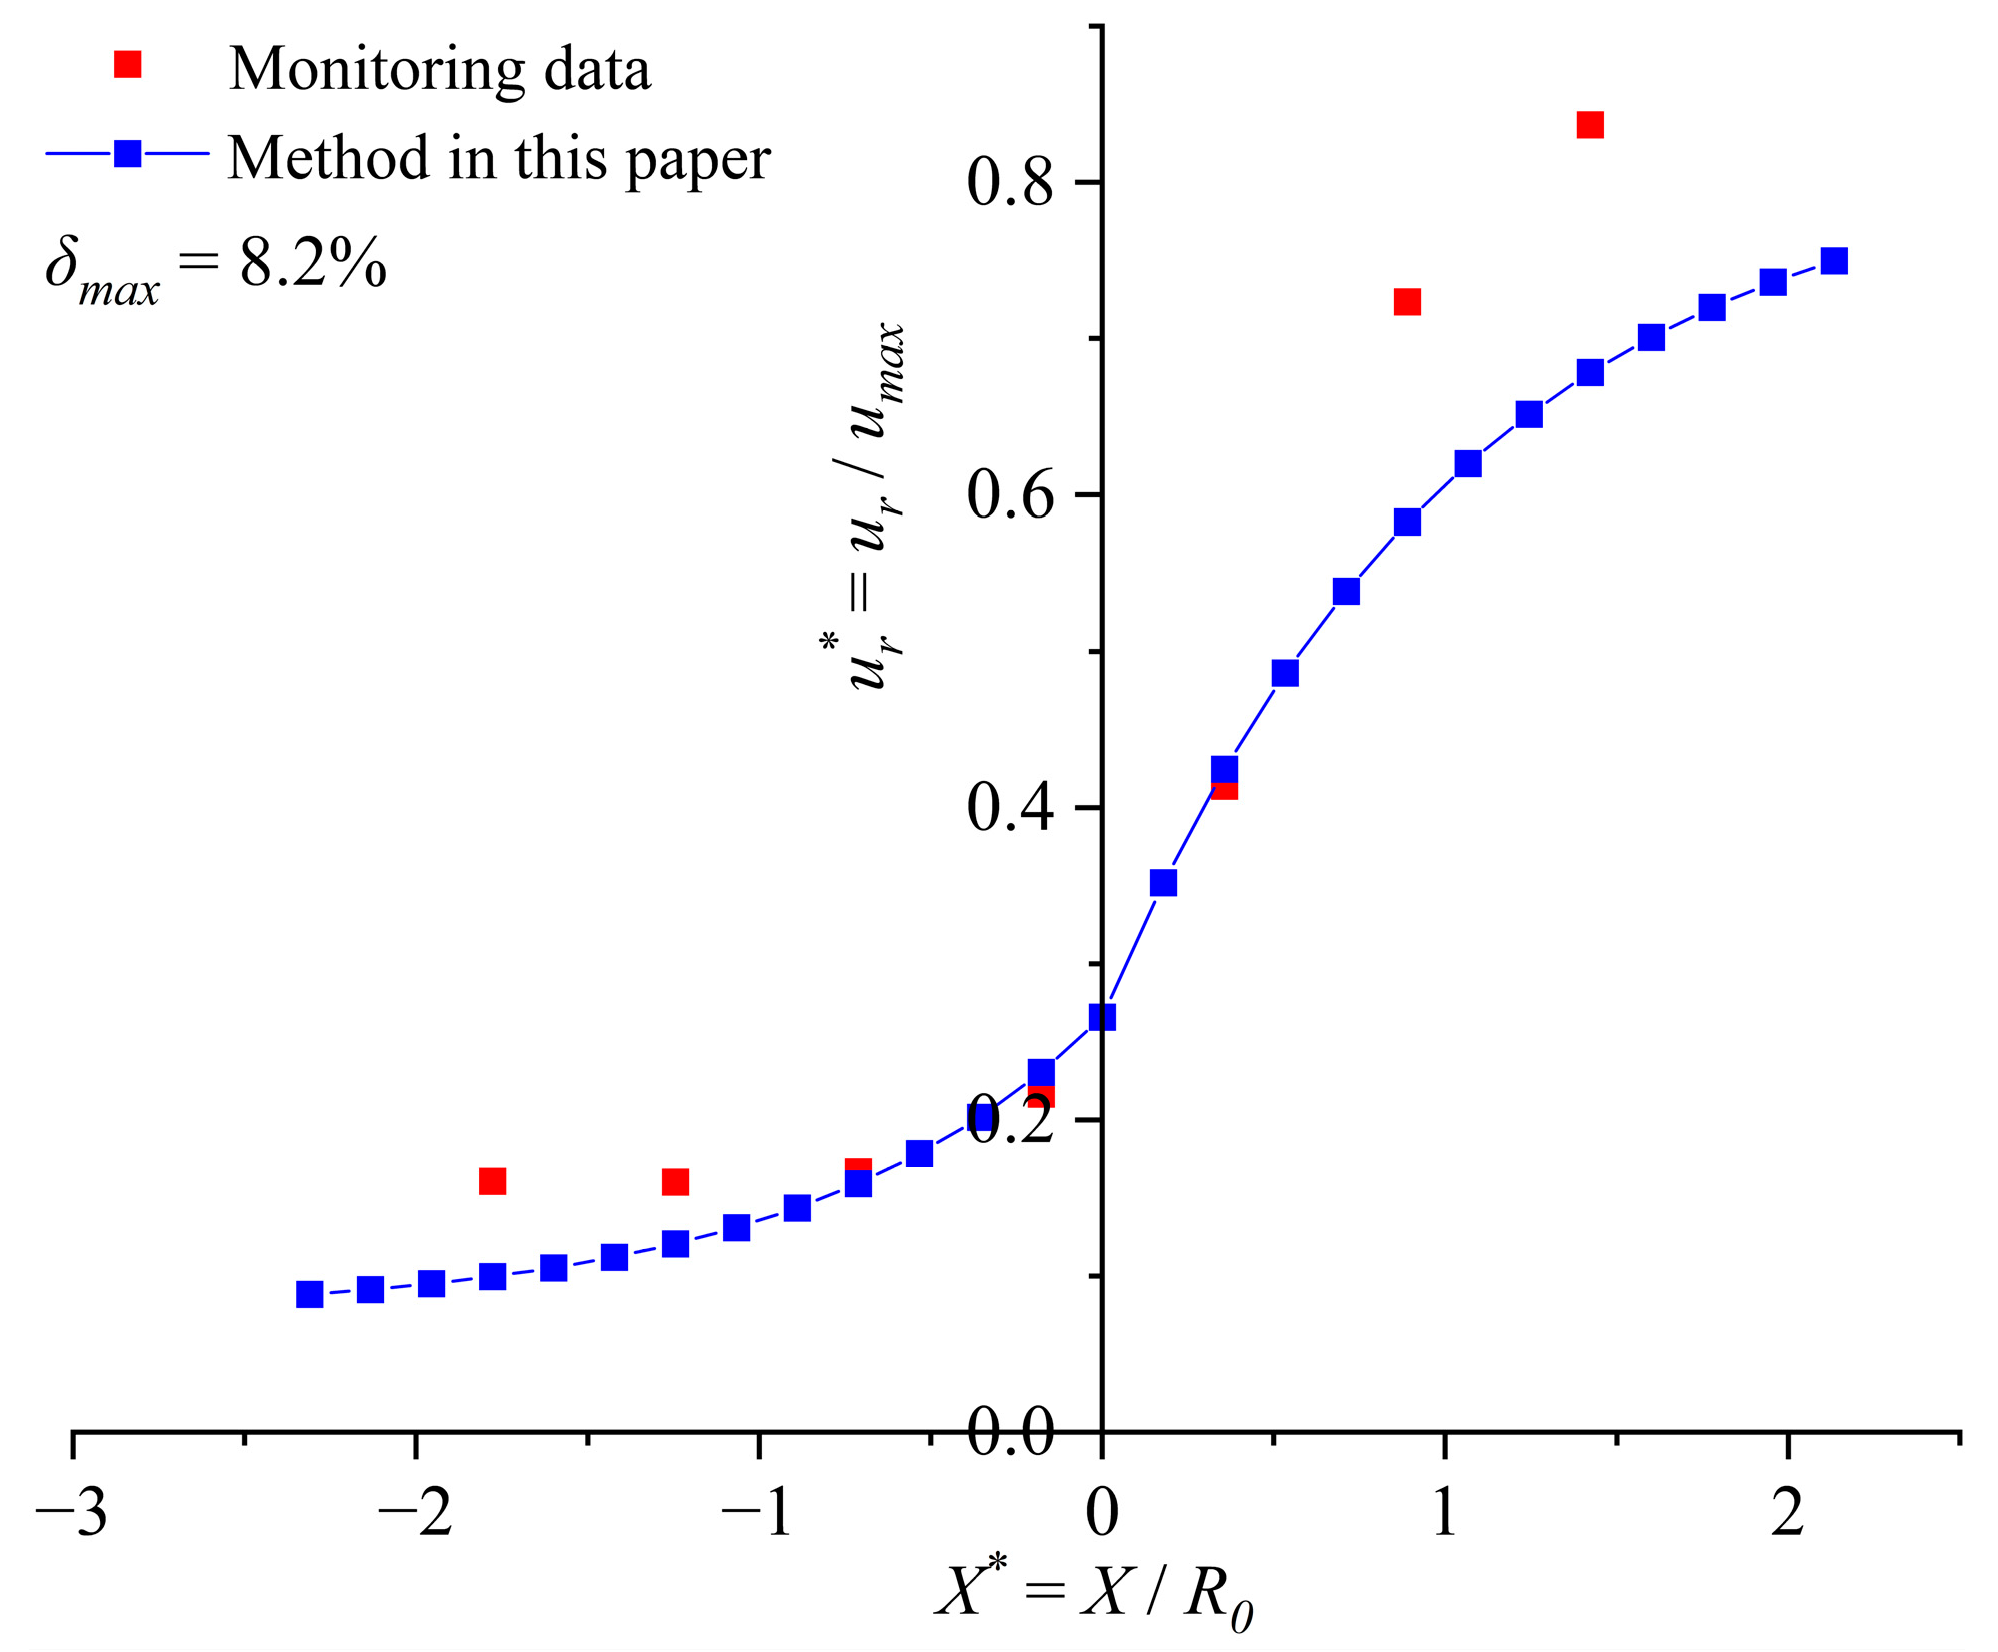
umax is 0.054 m. Based on this, the LDP construction method proposed in this paper is used to construct the LDP of the No. 4 experimental tunnel, and the results are compared with the displacement monitoring data of the No. 4 experimental tunnel, as shown in
Figure 6.
Figure 6 shows that the LDP of the No. 4 experimental tunnel generated using the LDP construction method proposed in this paper is generally consistent with the monitoring results of the tunnel, and the maximum relative error
δmax of radial displacement of the surrounding rock at the tunnel excavation boundary, calculated using Equation (15), is 8.2% at different distances from the tunnel face between the two curves. This result verifies the applicability and reliability of the LDP construction method for the convergence–confinement analysis of the elastic–brittle–plastic tunnel-surrounding rock.
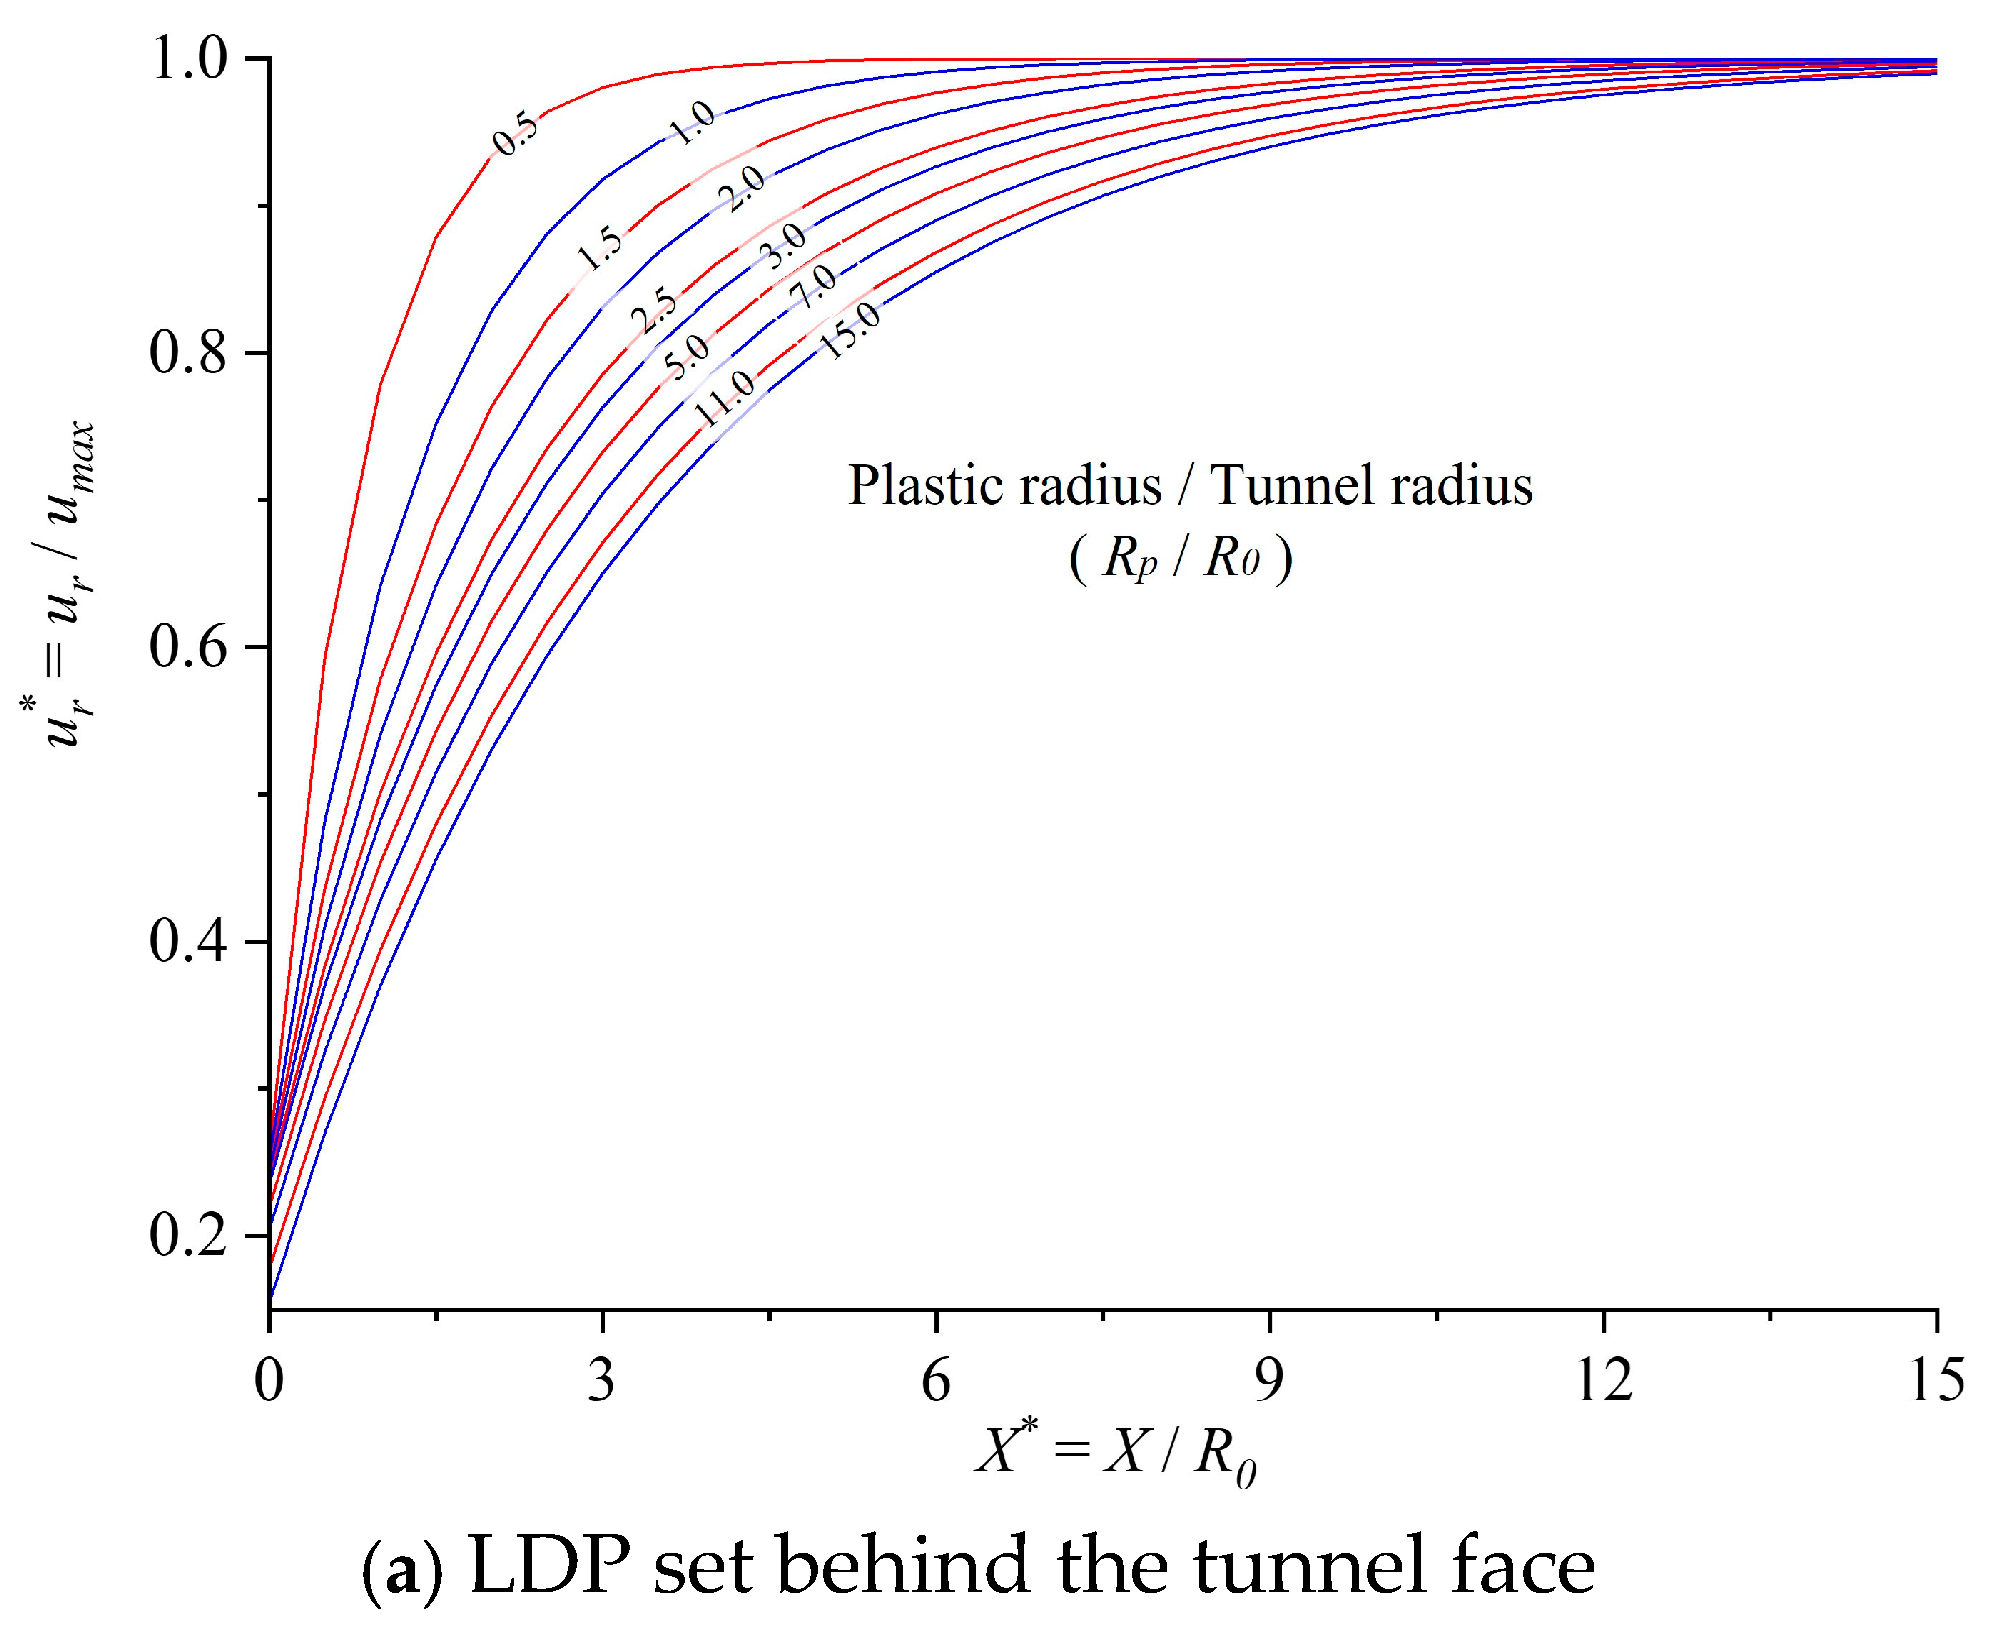
In addition, for ease of application, the LDP construction method proposed in this paper was used to generate LDPs with different dimensionless plastic zone radii (
Rp/
R0), as shown in
Figure 7. By analyzing the interaction between the ground reaction curve (GRC) of tunnel-surrounding rock and the support characteristic curve (SCC) of the corresponding support system, the convergence displacement of tunnel-surrounding rock allowed by a safe and economical support system is obtained. Accordingly, combined with the dimensionless plastic zone radius of tunnel-surrounding rock (
Rp/
R0),
Figure 7 can be used to determine the distance between the tunnel support structure and the tunnel face (support timing).
5. Discussion
Hoek and Brown [
14] pointed out that, in the stability analysis of engineering rock masses, the elastic–perfectly plastic model, elastic-strain softening model, and elastic–brittle–plastic model should be used when GSI < 25, 25 < GSI < 75, and GSI > 75, respectively. In the development of a convergence–confinement theory, there are already methods for constructing the GRC of tunnel-surrounding rock using the elastic–perfectly plastic model, the elastic-strain softening model, and the elastic–brittle–plastic model [
21,
22,
23]. LDP construction methods for elastic–perfectly plastic and elastic-strain softening tunnel-surrounding rock have also been proposed and developed [
11,
12]. When applying the GRC construction method using the elastic–brittle–plastic model to construct the GRC for tunnel-surrounding rock with GSI > 75, it is recommended to use the method proposed in this paper to construct the LDP. This method can supplement the development of convergence–confinement theory.
In establishing the proposed LDP construction method for elastic–brittle–plastic tunnel-surrounding rock, empirical calculation methods for GSI residual values were adopted and circular tunnels and hydrostatic pressure were assumed, which reduces the method’s accuracy and reliability. Therefore, the tunnel support scheme obtained from the convergence–confinement analysis of tunnels using the method proposed in this paper should be regarded as preliminary. In addition, in its implementation, this support plan still needs to be adjusted and verified through on-site observation and monitoring.
6. Conclusions
This research used numerical simulation methods to study the tunnel LDP construction method for convergence confinement analysis. The conclusions obtained are as follows:
(1) An LDP construction method for circular or near-circular tunnels was proposed and fitted using simulated data of tunnel numerical models based on the elastic–brittle–plastic constitutive model. This method is mainly suitable for constructing the LDP of the elastic–brittle–plastic tunnel-surrounding rock with GSI > 75.
(2) The numerical simulation data on the radial displacement of the surrounding rock at tunnel excavation boundaries are highly consistent with data calculated from its fitted expressions for different tunnel models. The maximum relative error between simulated and calculated displacement values at tunnel boundaries is merely 5% for different tunnel models, validating the accuracy of the analytical expression for the LDP curve proposed in this study.
(3) Monitoring data on the radial displacement of the surrounding rock (GSI = 80, with elastic–brittle–plastic mechanical response characteristics) at the excavation boundary in the No. 4 experimental tunnel are highly consistent with data calculated using the proposed analytical expressions for constructing the LDP curve in this paper. The maximum relative error between the measured and calculated radial displacement values is merely 7% for different tunnel models, further validating the applicability and reliability of the proposed LDP curve construction method for elastic–brittle–plastic tunnel-surrounding rock.
(4) Using the LDP construction method proposed in this paper, an LDP graph for elastic–brittle–plastic tunnel-surrounding rock (GSI > 75) is established. With the dimensionless plastic zone radius of the tunnel, the distance between the location of the specified radial displacement of the tunnel excavation boundary and the tunnel face can be obtained, making this a convenient and fast approach for determining the support timing of the support structure of tunnel-surrounding rock.
