Article

Study on the Evolution Patterns of Cavitation Clouds in Friction-Shear Cavitating Water Jets

1
School of Mechanical Engineering, Heilongjiang University of Science and Technology, Harbin 150022, China
2
School of Safety Engineering, Heilongjiang University of Science and Technology, Harbin 150022, China
*
Author to whom correspondence should be addressed.
Appl. Sci. 2025, 15(20), 10992; https://doi.org/10.3390/app152010992 (registering DOI)
Submission received: 9 September 2025 / Revised: 5 October 2025 / Accepted: 10 October 2025 / Published: 13 October 2025
(This article belongs to the Topic Fluid Mechanics, 2nd Edition)

Abstract

Current cavitating water jet technology for mineral liberation predominantly relies on the micro-jet impact generated by bubble collapse. Consequently, conventional nozzle designs often overlook the shear effects on mineral particles within the internal flow path. Moreover, the cavitation cloud evolution mechanisms in nozzles operating on this innovative principle remain insufficiently explored. This study systematically evaluates the cavitation performance of an innovatively designed cavitating jet nozzle with friction-shear effects (CJN-FSE), whose optimized internal structure enhances the interlayer shear and stripping effects crucial for the liberation of layered minerals. Utilizing high-speed imaging, we visualized submerged friction-shear cavitating water jets and systematically investigated the dynamic evolution patterns of cavitation clouds under jet pressures ranging from 15 to 35 MPa. The results demonstrate that the nozzle achieves effective cavitation, with jet pressure exerting a significant influence on the morphology and evolution of the cavitation clouds. As the jet pressure increased from 15 to 35 MPa, the cloud length, width, and average shedding distance increased by 37.05%, 45.79%, and 211.25%, respectively. The mean box-counting dimension of the cloud contour rose from 1.029 to 1.074, while the shedding frequency decreased from 1360 to 640 Hz. Within the 15–25 MPa range, the clouds showed periodic evolution, with each cycle comprising four stages: inception, development, shedding, and collapse. At 30 MPa, mutual interference between adjacent clouds emerged, leading to unsteady shedding behavior. This study thereby reveals the influence of jet pressure on the dynamic evolution patterns and unsteady shedding mechanisms of the clouds. It provides a theoretical and experimental basis for subsequent research into the nozzle’s application in liberating layered minerals and proposes a new design paradigm for cavitation nozzles tailored to the mechanical properties of specific minerals.

1. Introduction

Cavitation is a phase-change phenomenon induced by local pressure variations within a liquid [1,2,3]. The immense energy released instantaneously during bubble collapse represents its most valuable engineering characteristic [4,5]. This is because the asymmetric collapse of bubbles near a solid boundary generates high-speed micro-jets directed toward the wall, thereby imparting significant mechanical effects on the material surface [5,6,7]. Consequently, cavitation technology has found substantial application in fields that leverage this intense mechanical action, including efficient cleaning, surface derusting, material comminution, and material surface strengthening [8,9,10,11,12].
As a significant engineering implementation of the cavitation effect, cavitating jet technology actively induces bubble generation through specially designed nozzle structures and harnesses the intense impact effects resulting from bubble collapse to enhance the jet’s performance [13]. As research on cavitating water jet technology deepens, its potential for mineral comminution and liberation has come into sharper focus. Guo et al. [14] conducted multiple comminution experiments on mica using abrasive cavitating jets and discovered that the cavitation effect significantly improves energy utilization efficiency. Dvorsky et al. [15] performed theoretical and experimental studies on the pure vapor cavitation mechanism in a novel water jet mill (WJM), finding that cavitation collapse induced by extreme velocity gradients can efficiently break down micron-sized silicon particles to the nanoscale. Sen et al. [16] conducted grinding tests on magnetite using a customized water jet experimental device equipped with a cavitation chamber, confirming that the growth and collapse of cavitation bubbles effectively promote particle refinement, representing a key mechanism for enhancing comminution efficiency. Galecki et al. [17] performed batch closed-circuit comminution tests on mono-sized coal samples using a self-designed cavitation chamber, observing that cavitation aids particle breakage, with backpressure-free conditions favoring refinement and the presence of backpressure broadening the product size distribution. Furthermore, Galecki et al. [18] investigated the effects of feed size and operating pressure on particle comminution efficiency, finding that coarser bituminous coal is more easily comminuted, and increasing pressure not only yields finer products but also alters particle morphology from flaky to blocky. These studies collectively corroborate the effectiveness of the cavitation effect in mineral comminution, revealing the promoting role of the energy instantaneously released during bubble collapse in particle liberation. However, this body of research primarily focuses on utilizing the impact energy for overall particle fragmentation and generally overlooks the shear effects exerted by the nozzle structure on mineral particles during liberation. Particularly for layered-structure minerals, efficient liberation relies not only on impact damage from bubble collapse but more critically on the directional application of shear force along weak interlayer interfaces to achieve efficient delamination [19]. Most current nozzle designs overlook this crucial mechanism. Therefore, it is essential to systematically optimize cavitation nozzle structures to synergistically excite both the necessary shear force and the cavitation effect. This optimization should be tailored to the mechanical properties and liberation behavior of layered minerals. Such an approach is of significant importance for enhancing the applicability and engineering maturity of cavitating jet technology in mineral processing.
The cavitating jet nozzle serves as the core component for applying cavitating jets to mineral comminution. Its structural parameters significantly influence the cavitation intensity of the jet and the stability of cavitation cloud development [20,21,22], thereby determining the ultimate liberation and comminution efficiency for minerals. Consequently, optimizing the nozzle structure for specific application scenarios is a critical pathway to enhancing technical efficacy. In recent years, scholars have conducted extensive research on the relationship between nozzle structure and cavitation performance using advanced numerical and experimental methods. Hutli et al. [23] combined high-speed imaging with copper specimen erosion tests and found that the nozzle geometric structure has the most significant influence on jet performance. Liu et al. [24] compared the cavitation effects of cylindrical, organ-pipe, and converging-diverging nozzles, indicating that cylindrical nozzles generate the most cavitation clouds, whereas the contraction truncation angles in converging-diverging nozzles inhibit the full development of cavitation clouds. Kamisaka et al. [25] proposed, through aluminum specimen erosion tests, that cavitation cloud lifetime is a key parameter affecting erosion intensity and found that nozzles with orifices near the throat exit and medium-length guide tubes exhibit optimal erosion performance. Cai et al. [26] demonstrated through erosion tests on aluminum specimens and sandstone that nozzles with a whistle-shaped outlet and a shorter throat can generate cavitation clouds with larger volume, lower shedding frequency, longer effective range, and stronger erosion capability. Prasetya et al. [27] employed X-ray phase-contrast imaging to reveal that proportional scaling of the nozzle size affects the diameter of the initial cavitation bubbles within the nozzle, with the bubble size showing a positive correlation with the nozzle dimensions. Wang et al. [28] found that organ pipe nozzles with a diffuser section at the outlet can enhance shear vortex intensity, thereby improving cavitation effects. Guo et al. [29] designed a dual-nozzle co-flow cavitating jet and confirmed its favorable cavitation performance, capable of forming cavitation clouds with distinct periodic variation patterns. Ullas et al. [30] compared Venturi tubes with different throat lengths using multi-modal measurement techniques and found that throat length significantly influences the cavitation shedding mechanism and collapse intensity. Yang et al. [31] conducted high-speed imaging tests on nozzles with divergence angles of 40°, 80°, and 120°, finding that the nozzle with an 80° divergence angle produced cavitation clouds with superior performance in both concentration and distribution range. Vidvans et al. [32] compared the performance of organ pipe nozzles (with Strouhal numbers of 0.14, 0.28, and 0.42) and long straight-hole nozzles in co-flow cavitating jet peening, indicating that the organ-pipe nozzle with St = 0.28 achieved the optimal cavitation intensity and peening efficacy. While these studies have laid a crucial foundation for understanding cavitation mechanisms and nozzle optimization, it is important to note that the majority focus on traditional applications such as material erosion and surface cleaning. The predominant design objectives are to enhance impact strength, increase erosion area, or intensify local damage—effects that primarily leverage the shock waves and micro-jets from bubble collapse. In contrast, research on cavitation nozzles specifically designed for the liberation of layered minerals remains scarce. Given that the efficient liberation of such minerals relies more heavily on shear-induced delamination at bedding interfaces than on impact fragmentation alone, there is an urgent need to develop specialized nozzle structures capable of synergistically inducing cavitation effects and enhancing shear actions, tailored to the mechanics of interlayer delamination.
In summary, despite the significant potential of cavitating jet technology in mineral processing and the considerable progress made in understanding nozzle structures and cavitation performance, research on nozzles specifically for liberating layered minerals remains in its infancy. Existing designs predominantly focus on enhancing the impact effect from bubble collapse and have paid insufficient attention to the shear effects experienced by mineral particles within the nozzle. To address this gap, the cavitation performance of a novel cavitating jet nozzle with friction-shear effects (CJN-FSE) is investigated. The CJN-FSE features a specially designed internal flow path to intensify the shear-induced liberation of mineral particles. Using high-speed imaging, we systematically examined the dynamic evolution patterns of cavitation clouds generated by the nozzle under jet pressures ranging from 15 to 35 MPa. The observed characteristics were compared with those of traditional nozzles reported in the literature to identify common cavitation behaviors. This work elucidates the influence of jet pressure on the cavitation dynamics of the CJN-FSE, providing a theoretical and experimental basis for its application in liberating layered minerals and proposing a new design strategy for the efficient liberation of such minerals.

2. Materials and Methods

2.1. Cavitating Jet Nozzle with Friction-Shear Effects

The disintegration process of layered mineral particles under cavitating jet action involves complex multi-physics dynamics. The primary mechanisms include interlayer delamination induced by pressure release; micro-jet impact from cavitation bubble collapse; water-wedge effects (i.e., the wedging action resulting from fluid penetration into the interlayer cracks or fissures of layered minerals) at solid–liquid interfaces; and the combined action of friction-shear coupling effects among mineral particles and between particles and nozzle walls [19]. This study focuses on a friction-shear cavitating water jet, which is a submerged jet generated by an independently designed CJN-FSE. This nozzle is specifically engineered to leverage these multiple physical mechanisms for mineral liberation. Its core innovation lies in the active intensification of friction-shear coupling effects, which synergistically enhances interlayer delamination and cavitation-induced damage. The structure of the CJN-FSE, shown in Figure 1, incorporates the following key functional features:
(1)
Fluid acceleration and kinetic energy impartment. According to the continuity equation for incompressible flow:
Q = A i v i = A o v o
where Q is the volumetric flow rate, Ai is the inlet cross-sectional area of the converging section, Ao is the outlet cross-sectional area of the converging section, vi is the average flow velocity at the inlet, and vo is the average flow velocity at the outlet. The first nozzle stage, featuring a converging section, induces a significant reduction in the flow path cross-sectional area along the flow direction (Ao < Ai). According to Equation (1), this results in the outlet average velocity vo significantly exceeding the inlet velocity vi under a constant flow rate Q, thereby conferring high initial kinetic energy to the fluid.
(2)
Intensification of shear stress within the fluid, enhancing friction-shear coupling effects. Stages 2 to 4 each incorporate flat frictional sections within their internal flow paths. For a Newtonian fluid (assuming no-slip boundary conditions), the shear stress τ within the fluid satisfies Equation [33]:
τ = μ γ
where μ is the dynamic viscosity of the fluid and γ represents the velocity gradient. The confined channel height (700–600 μm) in these flat frictional sections induces a significant velocity gradient, yielding high shear stress. This intensified shear stress constitutes the core driving force of the friction-shear coupling effects. Consequently, as layered mineral particles traverse these regions, they undergo intense friction and shear, promoting effective interlayer delamination.
(3)
Active induction of cavitation. Stage 4 incorporates a diffuser section. The geometric expansion of this diffuser is designed to generate a substantial pressure drop in the flow field, creating the low-pressure conditions required for cavitation inception. The propensity for cavitation is characterized by the cavitation number, σ [34,35,36]:
σ = p 2 p v p 1 p 2 p 2 p 1
where p1 is the jet pressure (at the nozzle inlet), p2 is the ambient pressure (the static water pressure inside the cavitation tank at the nozzle outlet), and pv is the saturated vapor pressure of water at room temperature. Cavitation occurs when σ falls below a critical value σc. The diffuser section is designed to reduce the ambient pressure p2. This decrease in p2 lowers the cavitation number σ, thereby inducing cavitation. Studies indicate [31,37] that optimal cavitation effects are achieved with divergence angles within 40–60°. The divergence angle θ of conventional nozzles is defined by:
tan θ 2 = r o r i L k
where ro is the equivalent outlet radius, ri is the equivalent inlet radius, and Lk is the diffuser length. Based on Equation (4), the equivalent divergence angles for the present nozzle were calculated to be 60° in the height direction and 47.27° in the width direction, both of which fall within the recommended effective range.
Unlike traditional cavitating jets, which rely primarily on shear layers between the jet and the surrounding fluid, the core characteristic of the friction-shear cavitating water jet lies in its internal flow path structure. This structure is designed to actively enhance solid–liquid friction, thereby inducing intense shear stress within the fluid. This “friction-shear” coupling effect acts directly on mineral particles, providing the necessary mechanical force for interlayer delamination. Thus, the term “friction-shear” denotes an active design mechanism where solid–liquid friction is harnessed to intensify shear forces, with the ultimate goal of enhancing mineral liberation efficiency.

2.2. Test System and Experimental Setup

The cavitating jet visualization test system, as schematically and physically depicted in Figure 2, consisted of a water reservoir, a high-pressure pump, a control console, the CJN-FSE, a high-speed camera system, a light source with a diffuser panel, a computer, and a cavitation tank. The system was driven by a CHC16/50 S-L triplex plunger pump (UDOR S.p.A., Rubiera, Italy), with a rated pressure of 50 MPa and a maximum flow rate of 16 L/min. The high-speed imaging was captured by a Y4-S1 camera (Integrated Design Tools, Pasadena Inc., Pasadena, CA, USA), which was equipped with an AF Nikkor 50 mm f/1.8D fixed-focal-length lens (Nikon Corporation, Tokyo, Japan); this camera system offers a maximum sampling frequency of 130,000 fps and a maximum image resolution of 1024 × 1024 pixels. A 300 W LED white surface light source with a color temperature of 6500 K, combined with a diffuser panel, served as the illumination system to ensure a uniform light field in the imaging area. An overflow port was installed on the wall of the cavitation tank to maintain a constant liquid level during experiments, thereby ensuring a stable confining pressure at the nozzle outlet. All high-pressure experimental procedures strictly adhered to safety protocols. The rated working pressure of all pressure-bearing components, including the high-pressure pump, pipelines, and the nozzle, significantly exceeded the maximum experimental value of 35 MPa. Furthermore, the system was outfitted with safety valves and other overpressure protection devices to guarantee a safe and controllable experimental process.

2.3. Test Procedure

The experimental procedure comprised the following steps. First, the cavitation tank was filled until water overflowed, maintaining a dynamic equilibrium at the liquid surface to ensure a stable confining pressure environment. The assembly comprising the high-pressure hose, nozzle holder, and nozzle was then rigidly mounted using adjustable brackets, ensuring the nozzle axis was vertically aligned and the submerged depth at the outlet was 500 mm. The high-speed camera was positioned 130 cm from the nozzle, orientated to center the nozzle exit within the field of view while capturing the full evolution of the cavitation clouds. Spatial calibration was performed using a standard scale ruler, after which all component positions were secured.
The high-speed camera was configured with the following parameters: a sampling frequency of 5000 fps, an exposure time of 198 μs, an aperture of f/4, and a capture resolution of 800 × 600 pixels. This frame rate was selected because preliminary observations indicated a maximum cavitation cloud shedding frequency below 2000 Hz, thereby satisfying the Nyquist sampling criterion. The exposure time balanced sufficient light intake and image clarity, while the resolution adequately met the requirements for both spatial calibration accuracy and resolving key cavitation cloud features at the specified high frame rate. Under this configuration, the depth of field was estimated to exceed 10 cm, amply covering the primary region of cavitation cloud evolution. Furthermore, as the imaging field was located in the central area of the lens and geometric distortion at an f/4 aperture was negligible, lens distortion was not considered a significant factor.
A step-loading protocol was employed during testing. The jet pressure was increased at a rate of 0.5 MPa/s until reaching the target pressures of 15, 20, 25, 30, and 35 MPa. At each target pressure, data acquisition commenced only after the system had maintained stable operation for 30 s. For every jet pressure condition, the high-speed camera recorded the dynamic cavitation cloud behavior over a duration of 0.2 s (equivalent to 1000 frames), which was sufficient to capture numerous complete evolution cycles for robust statistical analysis.
To verify the reliability of the experimental results, three independent replicate tests were conducted for each operating condition. For each replicate, the system was completely restarted and the full procedure was followed to mitigate potential influences from prior initial conditions. A comparison of the average cavitation cloud length, width, and shedding frequency from the three replicates revealed that all relative deviations were within 10%, confirming the good reliability and repeatability of the data.
Finally, key flow parameters were calculated based on the experimental settings. The volumetric flow rate Q was determined for each jet pressure pj. Subsequently, the Reynolds number Re and the cavitation number σ, the latter based on the nozzle outlet pressure, were derived. The corresponding values for all test conditions are summarized in Table 1.
Spatial calibration was performed using a standard scale ruler with 1 mm graduations. The ruler was carefully positioned within the plane of the jet centerline and adjusted to be parallel to the camera’s imaging sensor to minimize parallax error, ensuring coverage of the entire cavitation cloud evolution region. A 16.0 cm segment on the ruler was selected as a reference length. Using Image Pro Plus 6.0 software, the pixel width corresponding to this physical length was measured repeatedly across multiple images, yielding an average value of 400 pixels. The spatial conversion coefficient, η, was then determined as follows [38]:
η = d o d i
where do is the actual physical dimension, and di represents the corresponding number of pixels in the image. Substituting the values into Equation (5) gives η = 0.400 mm/pixel, meaning each pixel represents a physical area of 0.400 mm × 0.400 mm.
Given the high-speed camera sensor pixel size of 13.68 μm, the optical magnification factor was calculated to be approximately 0.0342. An uncertainty analysis was conducted for the spatial measurements. The primary sources of uncertainty were identified as the residual parallelism deviation between the scale ruler and the imaging plane, and the pixel edge interpretation error during image analysis. The combined standard uncertainty from these sources was estimated to be ±1.0 pixel. Contributions from optical distortion in the central field of view and the manufacturing tolerance of the scale ruler were deemed negligible. Consequently, the absolute standard uncertainty for spatial measurements is ±0.40 mm. This uncertainty is substantially smaller than the characteristic changes in cavitation cloud dimensions observed across the tested pressure range, which confirms that the measurement error does not compromise the reliability of the main findings.

3. Results

3.1. Image Processing Methods and Procedure

To accurately analyze the dynamic evolution of the cavitation clouds, a systematic image processing workflow was implemented. The key steps involved were grayscale conversion, time-averaged analysis, contour extraction, and the Frame Difference Method (FDM). The specific procedures for these key techniques are detailed below.
Cavitation clouds are opaque and reflective [39], yielding high-contrast optical signatures in high-speed imaging. Taking advantage of this, the clouds were captured using side-lighting illumination, appearing as high-intensity white regions in the raw images. To analyze their dynamics accurately, grayscale image processing was applied. This conversion transforms original three-channel RGB images into single-channel grayscale images, which removes chromatic interference and enhances the contrast between the cavitation clouds and the background, thereby improving identification accuracy. The conversion was performed using the standard weighted average formula:
I gray = 0.299 R + 0.587 G + 0.114 B
where R, G, B are the pixel values of the red, green, and blue channels, respectively, and Igray is the converted grayscale value, ranging from 0 to 255.
Time-averaged analysis was employed to extract the steady-state features and characterize the time-averaged morphology of the cavitation clouds by performing statistical averaging over the image sequence in the temporal dimension [31]. It is mathematically defined as
I mean = 1 N t = 1 N I t
where Imean is the time-averaged grayscale matrix, It denotes the grayscale matrix at frame t, and N represents the number of images within the computational time domain. (N = 1000, corresponding to 0.2 s). This technique effectively suppresses interference from transient fluctuations, thereby revealing the underlying time-averaged cloud structure.
To enable comparative analysis across images, the time-averaged grayscale images were normalized to the [0, 1] interval using the following transformation [31]:
I norm = I t min I mean max I mean min I mean
where Inorm is the normalized time-averaged grayscale matrix. For subsequent contour map generation, pixels with normalized intensities in the range [0, 0.1] were clamped to a value of 0.1. This threshold was applied because this low-intensity range predominantly corresponds to background optical noise (e.g., from water and sensor dark current) rather than the cavitation cloud signal. Suppressing this noise facilitates a clearer visualization of the cavitation cloud morphology.
Extracting the binary contour of the cavitation clouds from the grayscale images was a prerequisite for the fractal dimension calculation. This was achieved via image binarization using a fixed global threshold method in MATLAB R2023b:
B W x , y = 1 0 if   I mean x , y T otherwise
where Imean(x,y) is the value in the time-averaged grayscale matrix at row x, column y; T is the binarization threshold, manually selected between 0.2 and 0.3 to ensure consistent contour extraction across all pressure conditions. The Canny edge detection algorithm was then applied to the binary images to obtain a single-pixel-width contour curve. Finally, all contour images were rescaled to a standard size of 1024 × 1024 pixels to maintain dimensional consistency for subsequent analysis.
The FDM was used to analyze cloud dynamics. It operates by computing the grayscale difference between consecutive frames, producing a difference matrix:
D t = I t I t 1
where Dt is the grayscale difference matrix, and It−1 represents the grayscale matrix at frame t − 1. In the resulting matrix, positive and negative values correspond to pixels that have brightened or darkened, respectively, between frames. This directly captures the dynamic evolution processes of the cavitation clouds [39].

3.2. Dynamic Behavior of Cavitation Clouds Under Constant Jet Pressure

Figure 3 illustrates the dynamic evolution of cavitation clouds within a 3 ms timeframe at 20 MPa jet pressure. The image sequence was acquired at equal time intervals (0.2 ms), with the abscissa and ordinate representing temporal and spatial dimensions, respectively. Analysis of grayscale characteristics in sequential images enables clearer identification of morphological evolution patterns at millisecond timescales. As illustrated in Figure 3, under a jet pressure of 20 MPa, cavitation clouds near the nozzle exit exhibit distinct periodic dynamic evolution. A complete cycle comprises four phases: inception, development, shedding, and collapse. Time-resolved imaging shows that at 0.2 ms, Cavitation Cloud A has nucleated within the wake region of preceding clouds. At 0.4 ms, the preceding cloud sheds from Cloud A, which then enters the development phase (0.4–1.4 ms). During this phase, the length and width of Cloud A increase progressively by 255.56% and 59.52%, respectively. During 1.4–1.6 ms, cavitation cloud A sheds from cloud B and subsequently enters the collapse phase (1.6–2.6 ms), exhibiting two characteristic evolutionary behaviors: significant decay in axial velocity at the cloud tail and rapid attenuation in density/length of the cavitation cloud. Complete collapse occurs at 2.8 ms. Temporal analysis further indicates that subsequent clouds B, C, and D nucleate at 1.0, 1.8, and 2.6 ms, respectively, each following the same evolutionary phases as Cloud A.
This periodic evolution is fundamentally driven by the cyclic generation, development, and shedding of vortices in the shear layer. Upon exiting the nozzle, the high-speed water jet establishes a strong velocity gradient against the surrounding stagnant water, triggering shear layer instabilities that lead to the formation of discrete vortex structures. The pressure at the core of these vortices drops, as described by Bernoulli’s principle. When the core pressure falls below the local saturated vapor pressure, cavitation occurs, giving rise to the visible cavitation clouds. Once the vortices reach a critical scale, they shed, and the attached cavitation clouds consequently enter the shedding and collapse stages, thereby initiating a new cycle of vortex generation. The diffuser section of the nozzle effectively intensifies this vortex generation process, resulting in the production of a stable, periodic sequence of cavitation clouds. This observed iterative periodicity, demonstrating clear temporal self-similarity across the inception, development, shedding, and collapse phases at 20 MPa, validates the intrinsic stability of the cavitating jet pulsations generated by the CJN-FSE. These characteristics are consistent with the periodic cavitation cloud evolution documented for other nozzle types [2,34,36,40,41,42,43], collectively confirming that the CJN-FSE produces stable and effective cavitation.

3.3. Characteristics of Cavitation Clouds Under Varying Jet Pressures

3.3.1. Morphological Features of Cavitation Clouds

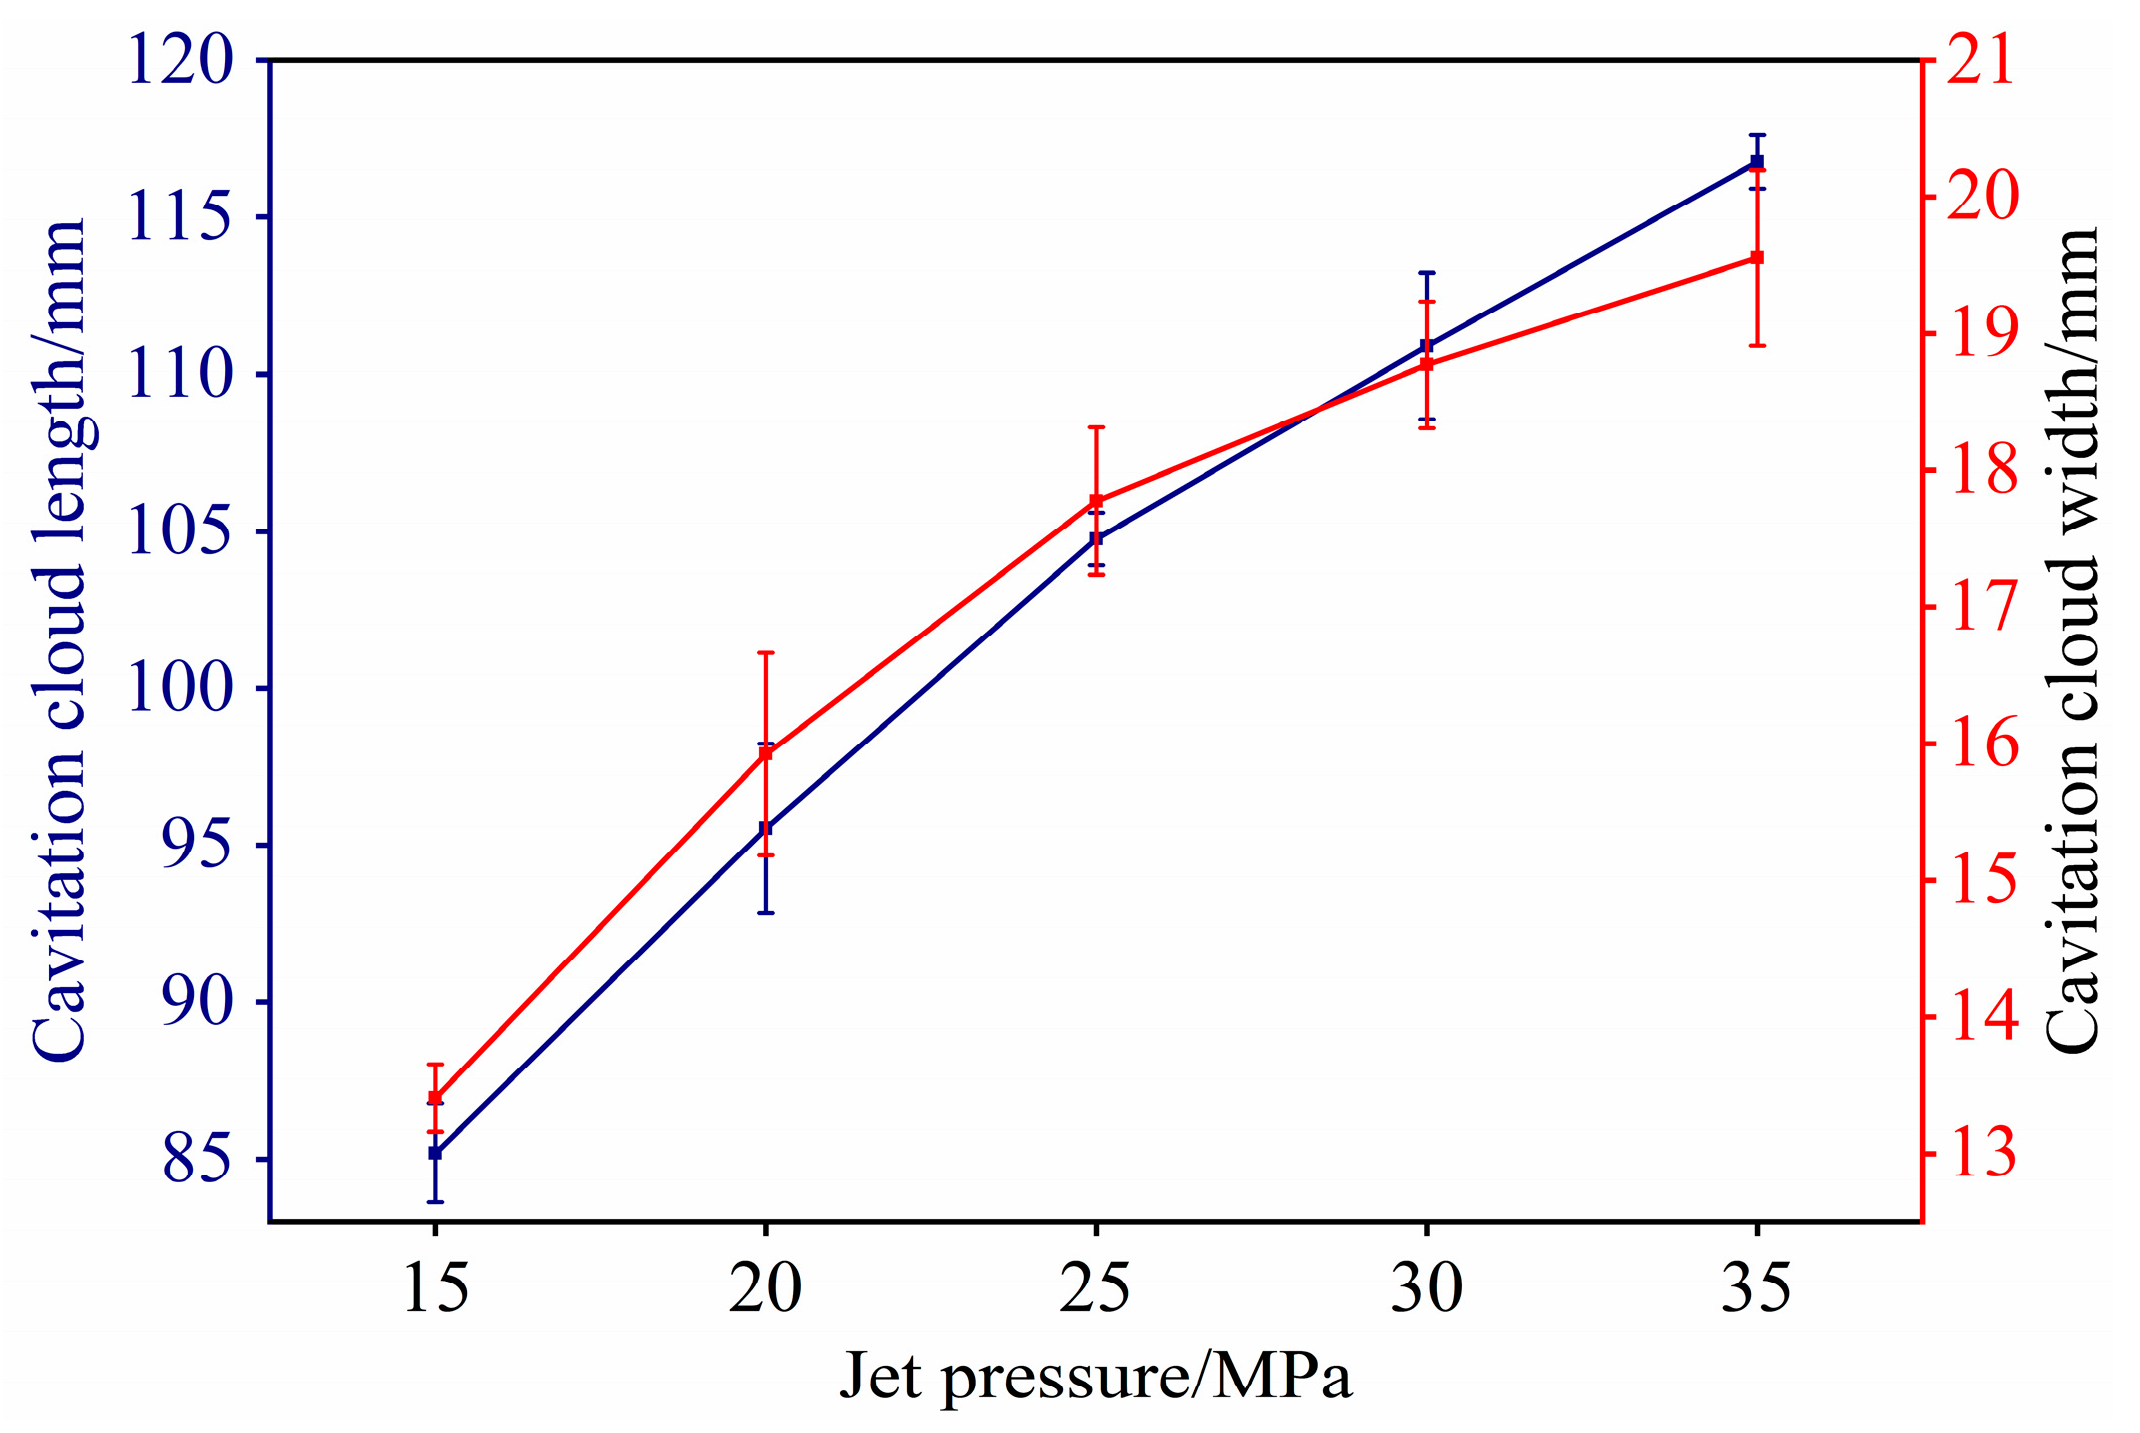
This method decouples interference from periodic cloud evolution and plunger pump pressure fluctuations, enabling accurate reconstruction of time-averaged morphological features. This paper performs temporal averaging on cavitation cloud images under varying jet pressures. The temporally averaged grayscale images of cavitation clouds over 0.2 s durations at 15–35 MPa jet pressures are illustrated in Figure 4. In Figure 4b, the exclusion of pixels with grayscale values in the range of 0 to 0.1 (normalized to 0 to 1 scale) eliminates interference from low-intensity regions on cavitation cloud morphology in contour maps. Statistical analysis of cloud dimensions using Image Pro Plus 6.0 software revealed a 45.79% increase in width and a 37.05% increase in length as jet pressure increased from 15 to 35 MPa. The variation curves of cavitation cloud length and width versus jet pressure are shown in Figure 5. It can be seen from Figure 5 that both the length and width of the cavitation cloud increase with increasing jet pressure, but the rate of increase diminishes as the jet pressure rises.
The fractal dimension serves as an effective metric for quantifying the complexity and irregularity of geometric shapes, finding extensive application across engineering disciplines [44]. For contour curves, it provides a quantitative measure of morphological complexity. Among various computational methods, the box-counting dimension is particularly prevalent for analyzing complex curves, owing to its conceptual and computational simplicity and straightforward implementation. Moreover, the cavitation cloud contour exhibits self-similarity, a characteristic for which the box-counting dimension is well-suited. The method is also computationally efficient and consistent, making it ideal for processing the large volumes of binary image data generated from transient contours under different pressures, thereby facilitating robust statistical comparison. For these reasons, the box-counting dimension was selected in this study to characterize the contour complexity of the cavitation clouds. The box-counting dimension DF of a cavitation cloud contour curve F is defined as follows [45,46]:
D F = lim r 0 log ( N r ) log r
where r denotes the side length of the square boxes (grid cells) used to cover the plane containing curve F, and Nr represents the minimum number of boxes required to completely cover curve F.
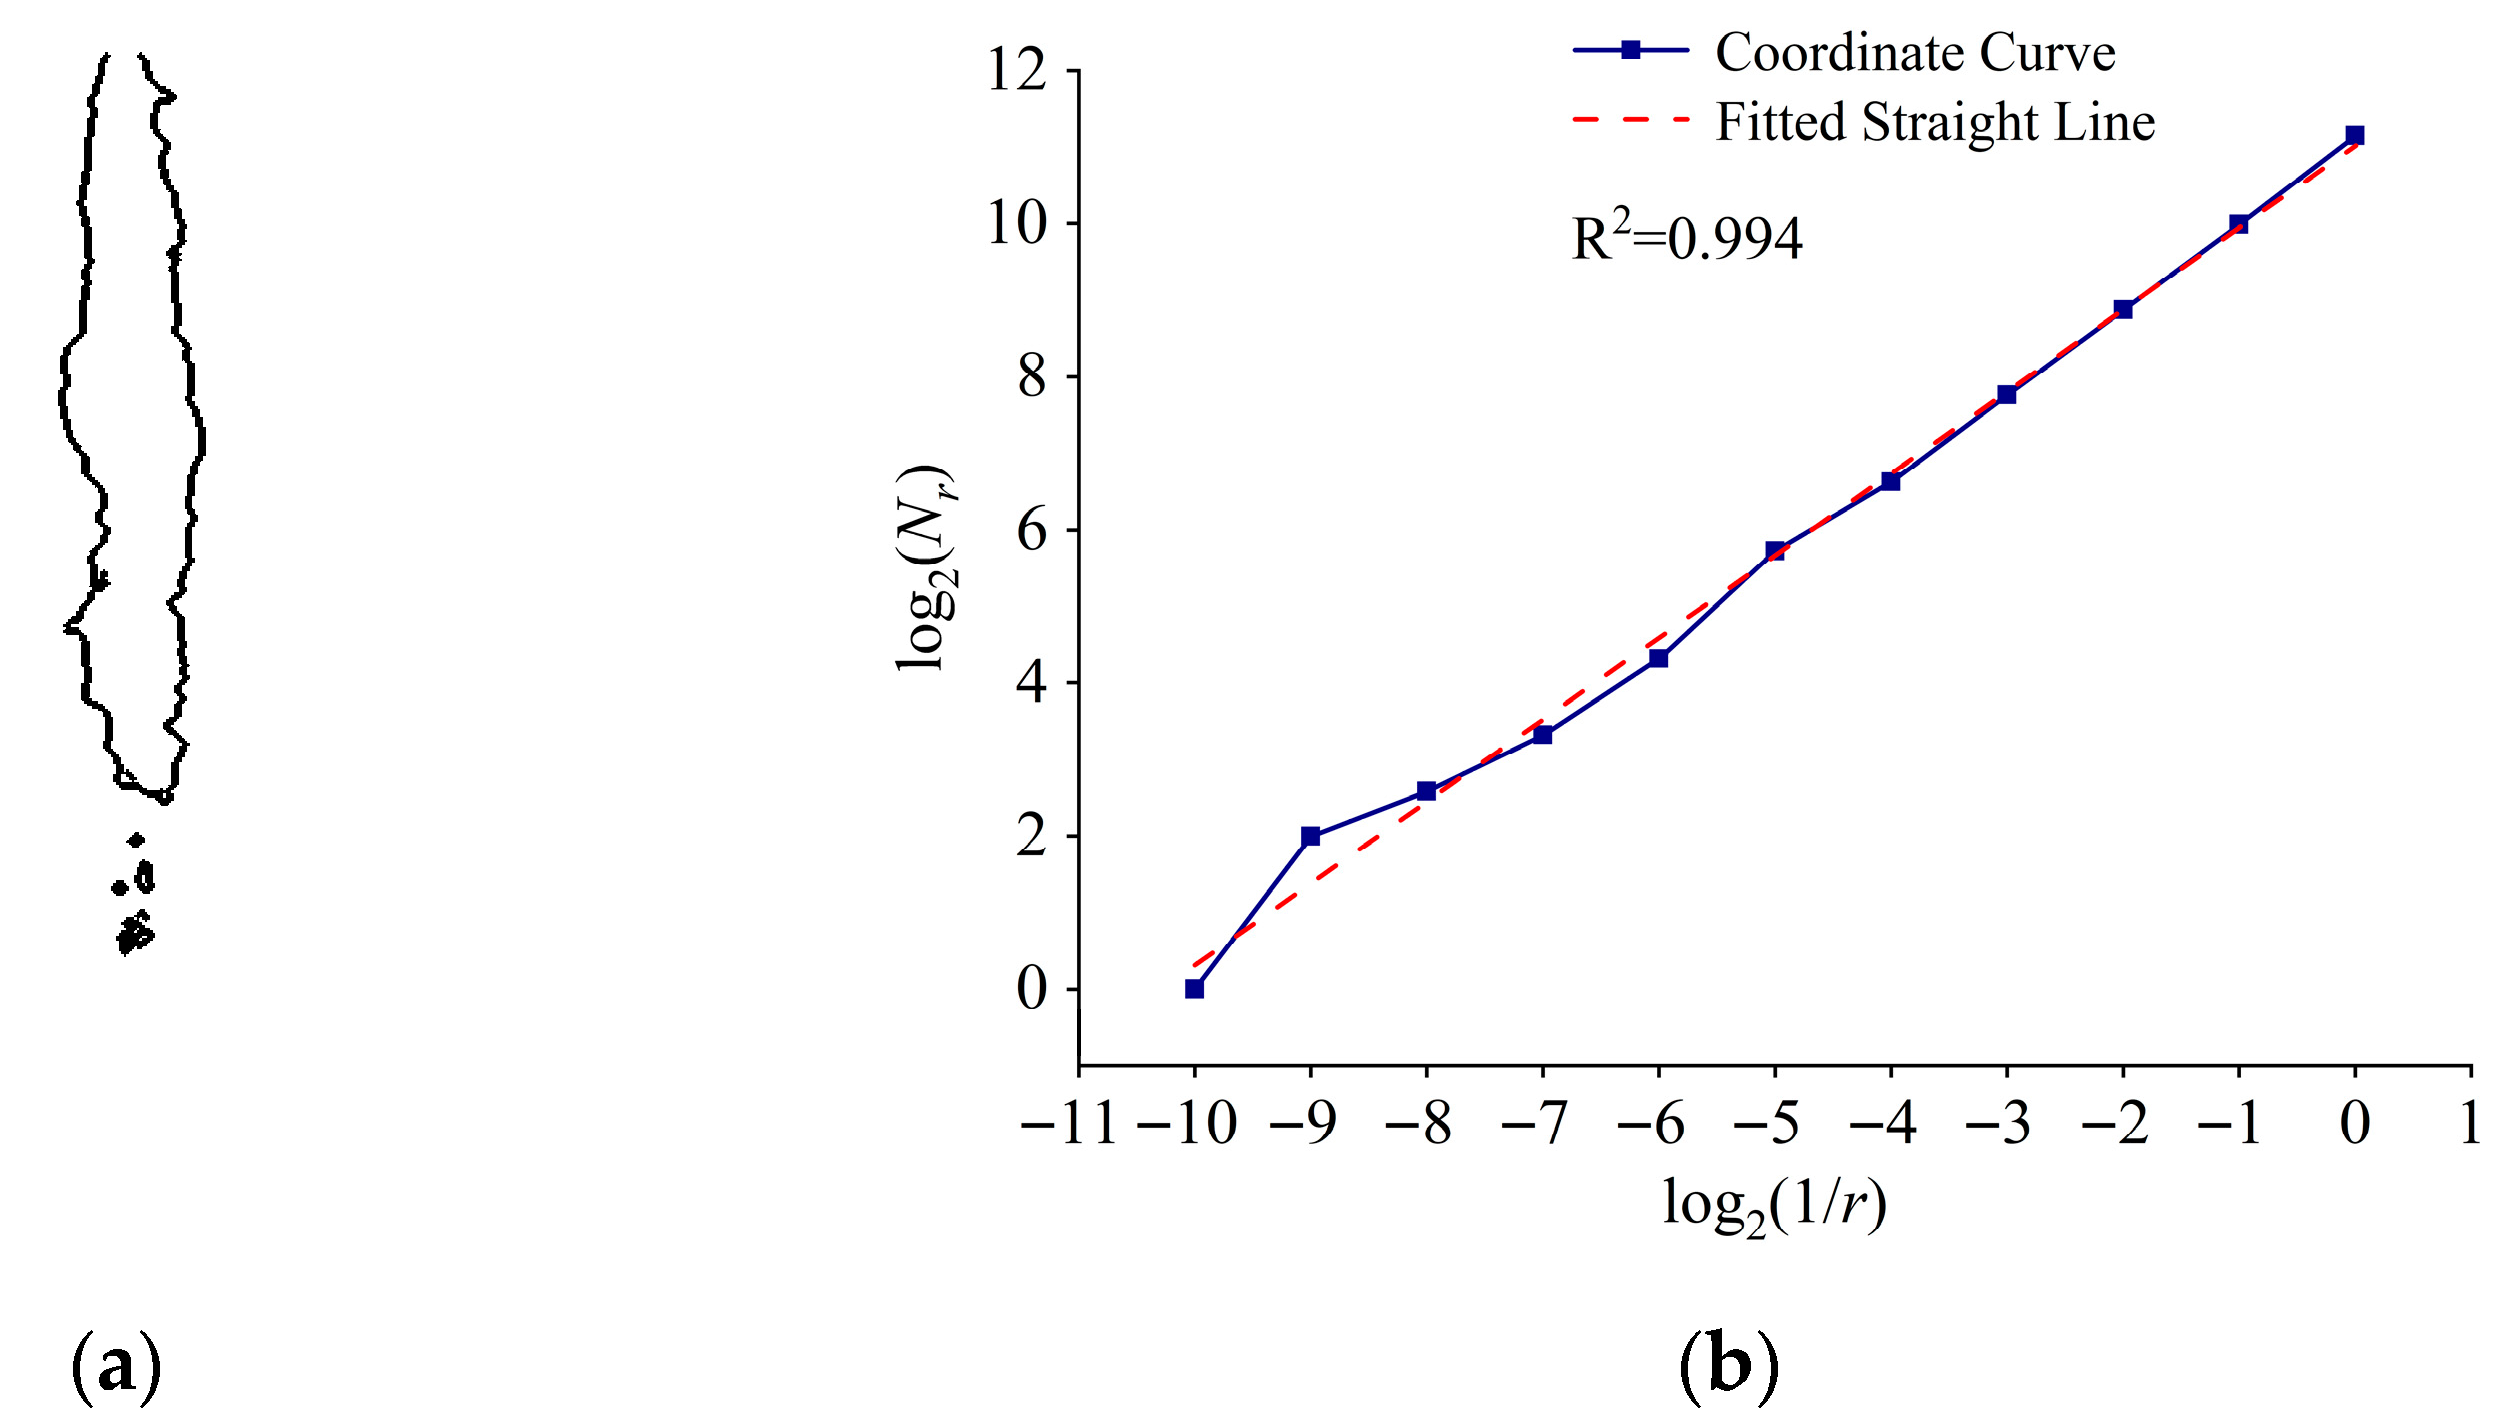
The box-counting dimension was computed using a geometric sequence of box sizes, with side lengths doubling from 20 = 1 pixel to 210 = 1024 pixels, resulting in 11 distinct scales. A linear regression was then performed on the data plotted in a double logarithmic coordinate system, where log2(1/r) and log2(Nr) represented the abscissa and ordinate, respectively. The slope of the resulting best-fit line provides the estimate for the box-counting dimension, DF. Figure 6 presents a representative cavitation cloud contour at 35 MPa and its corresponding double logarithmic plot. As shown in Figure 6b, the strong linear correlation observed in the plot indicates scale invariance of the contour across the analyzed range of scales, thereby confirming its fractal nature and validating the application of the box-counting method in this study.
However, cavitation clouds exhibit highly dynamic evolution, and their instantaneous morphology, influenced by flow field disturbances, possesses significant randomness. Consequently, the box-counting dimension of the cavitation cloud contour curve at a single moment cannot comprehensively and stably characterize the overall complexity of the cavitation cloud under a specific jet pressure. To overcome the limitations of single-phase analysis and enable effective comparison of cavitation cloud contour complexity under different jet pressures, this study calculates the box-counting dimension for the contour curves of all cavitation clouds captured within the 0.2 s sampling period under the same jet pressure. The arithmetic mean of these values is then used as the characteristic parameter representing the contour complexity of the cavitation cloud under that operating condition. This method effectively suppresses transient random fluctuations through statistical averaging in the time domain, making the calculation results more reflective of the inherent complexity of the cavitation cloud structure. It thereby provides a stable and statistically significant quantitative metric for comparisons under different jet conditions.
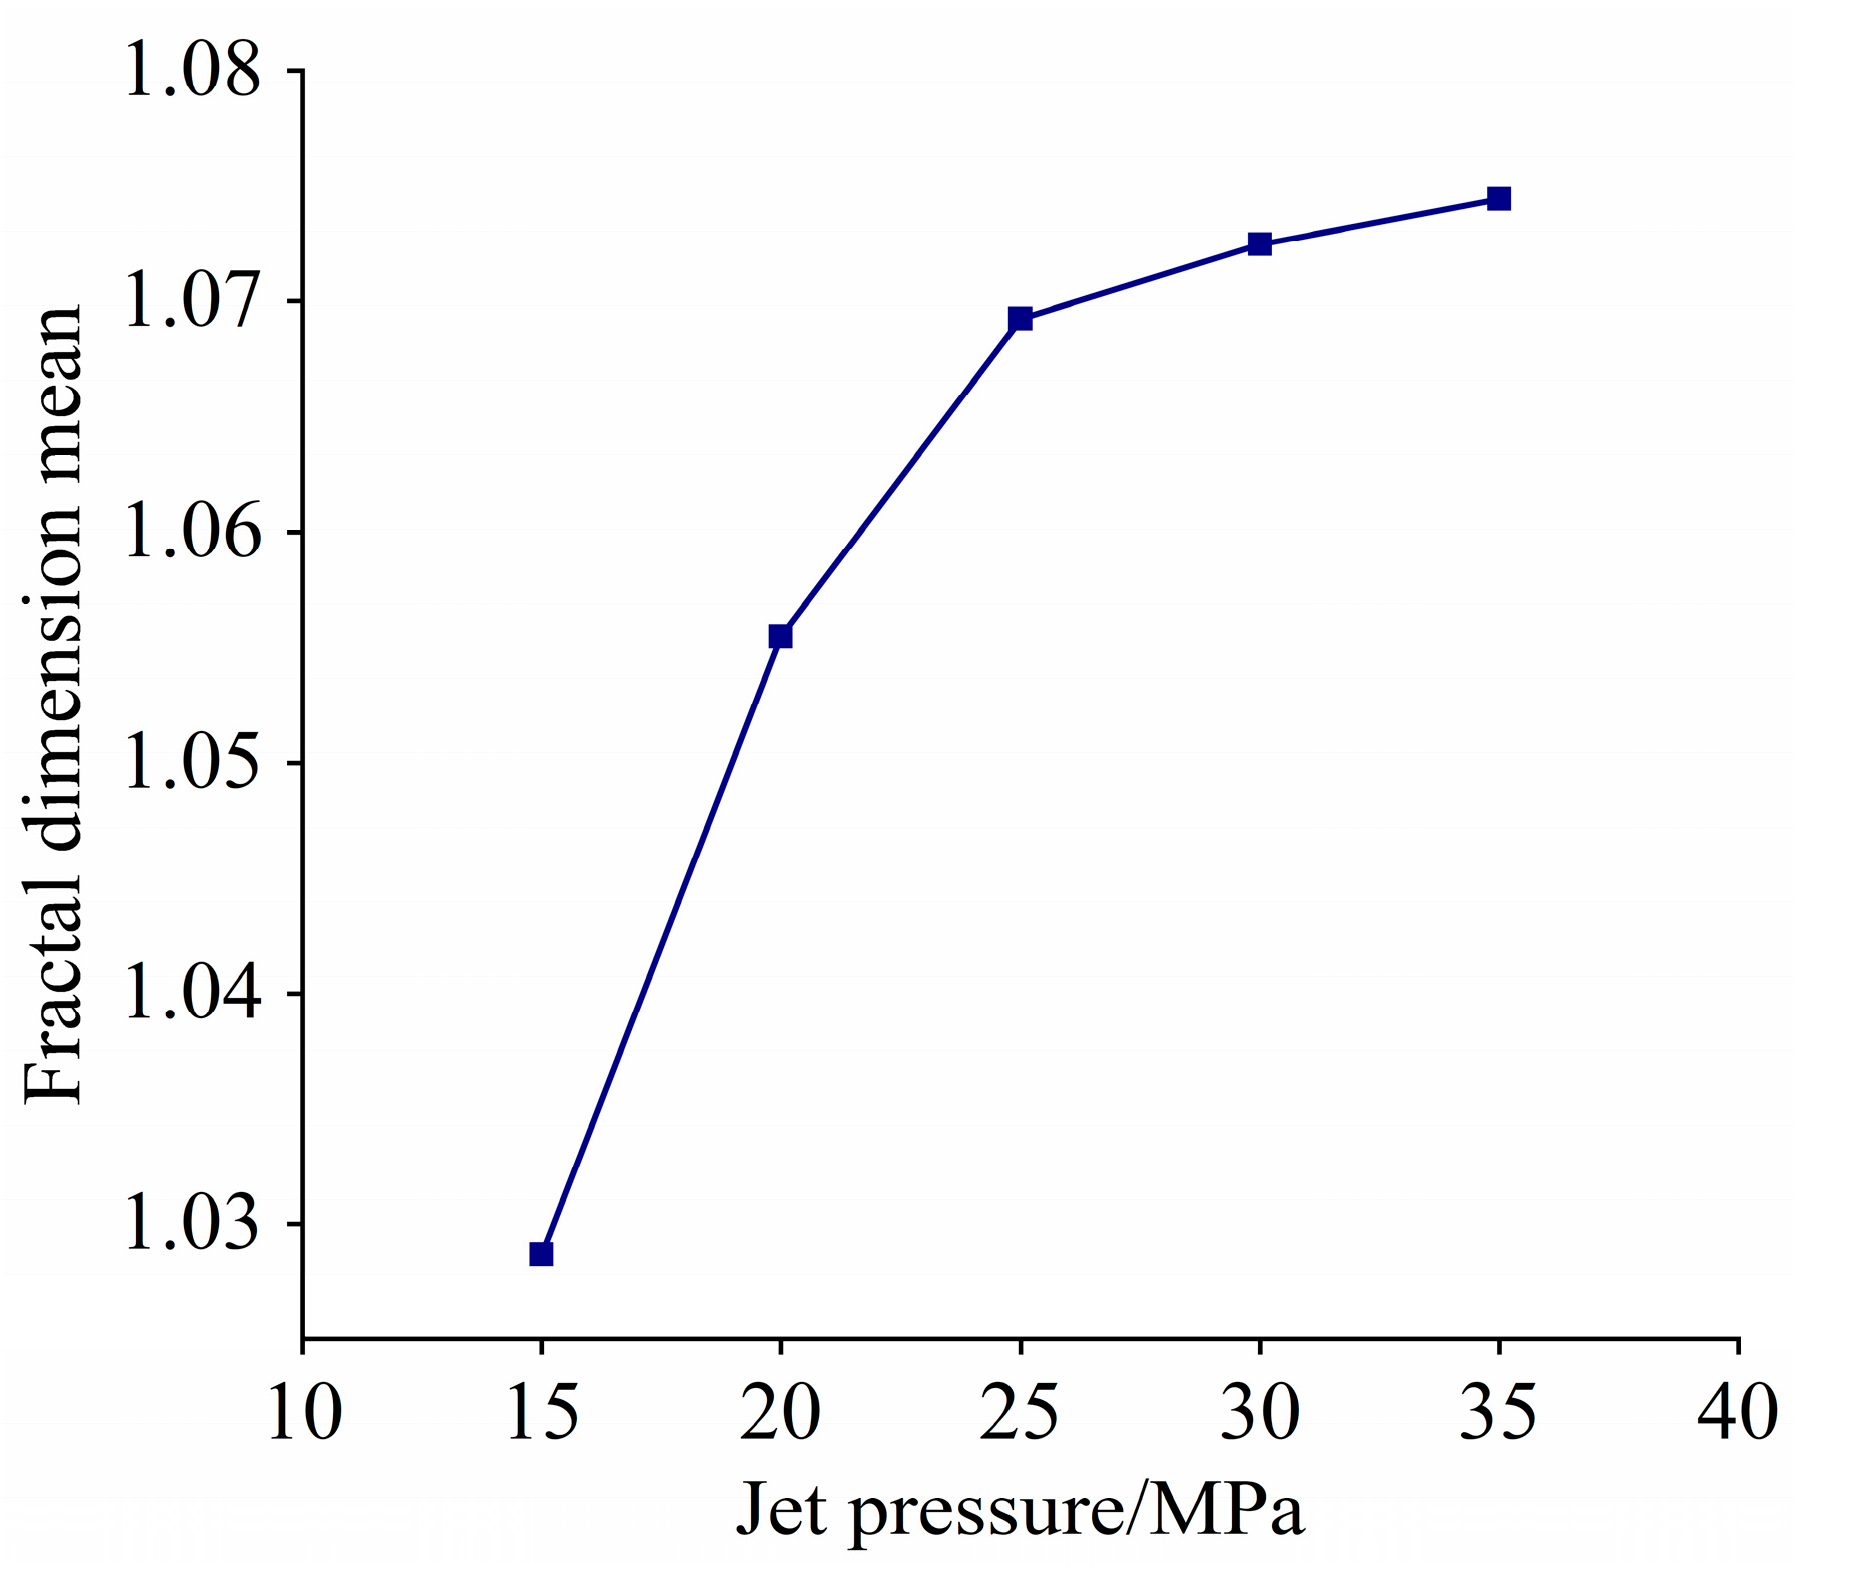
Applying this method, the mean box-counting dimension of the cavitation cloud contour was calculated across the jet pressure range of 15–35 MPa. Figure 7 plots this mean value against jet pressure, with the corresponding statistical data provided in Table 2. It is noteworthy that the calculated fractal dimensions exhibited a relatively large standard deviation, originating from the inherently transient and turbulent nature of the cavitation clouds, which causes significant random fluctuations in their instantaneous morphology. Nevertheless, the mean value derived from a statistical sample of 1000 frames robustly represents the time-averaged contour complexity. As illustrated in Figure 7, the mean box-counting dimension demonstrates a clear monotonic increase from 1.029 to 1.074 as the jet pressure rises from 15 MPa to 35 MPa. This upward trend signifies a transition in the cloud’s morphology: from a relatively smooth and simple contour at lower pressures to an increasingly fragmented and intricate one at higher pressures. The proliferation of small-scale structures and the growing irregularity of the boundary directly contribute to this increase in morphological complexity.
From a fluid mechanics standpoint, an increase in jet pressure intensifies the shear interaction at the jet boundary, enhancing flow instability and vortex generation, which in turn leads to a more complex cavitation cloud morphology and a correspondingly higher box-counting dimension of the cloud contour. Simultaneously, the elevated pressure promotes the activation and growth of cavitation nuclei, contributing to the observed increases in cloud length and width. These observations collectively demonstrate that the nozzle design, particularly the diffuser section, effectively creates low-pressure zones and enhances shear layer development, thereby confirming its efficacy in cavitation generation. The strengthening of cavitation effects with rising jet pressure is expected to enhance the comminution efficiency for mineral particles. However, a diminishing trend in the growth rates of cloud dimensions and contour complexity is observed as pressure exceeds a certain level. This signifies that the enhancement of cavitation by jet pressure is subject to the law of diminishing marginal returns; specifically, the incremental gain in cavitation intensity per unit pressure increase becomes smaller at higher operating pressures. Therefore, optimizing the jet pressure for mineral disintegration applications necessitates a trade-off between achieving high comminution efficiency and managing energy consumption. Employing excessively high jet pressures is not only energy-intensive but also provides progressively smaller improvements in disintegration performance.

3.3.2. Dynamic Evolution of Cavitation Clouds Under Varying Jet Pressures

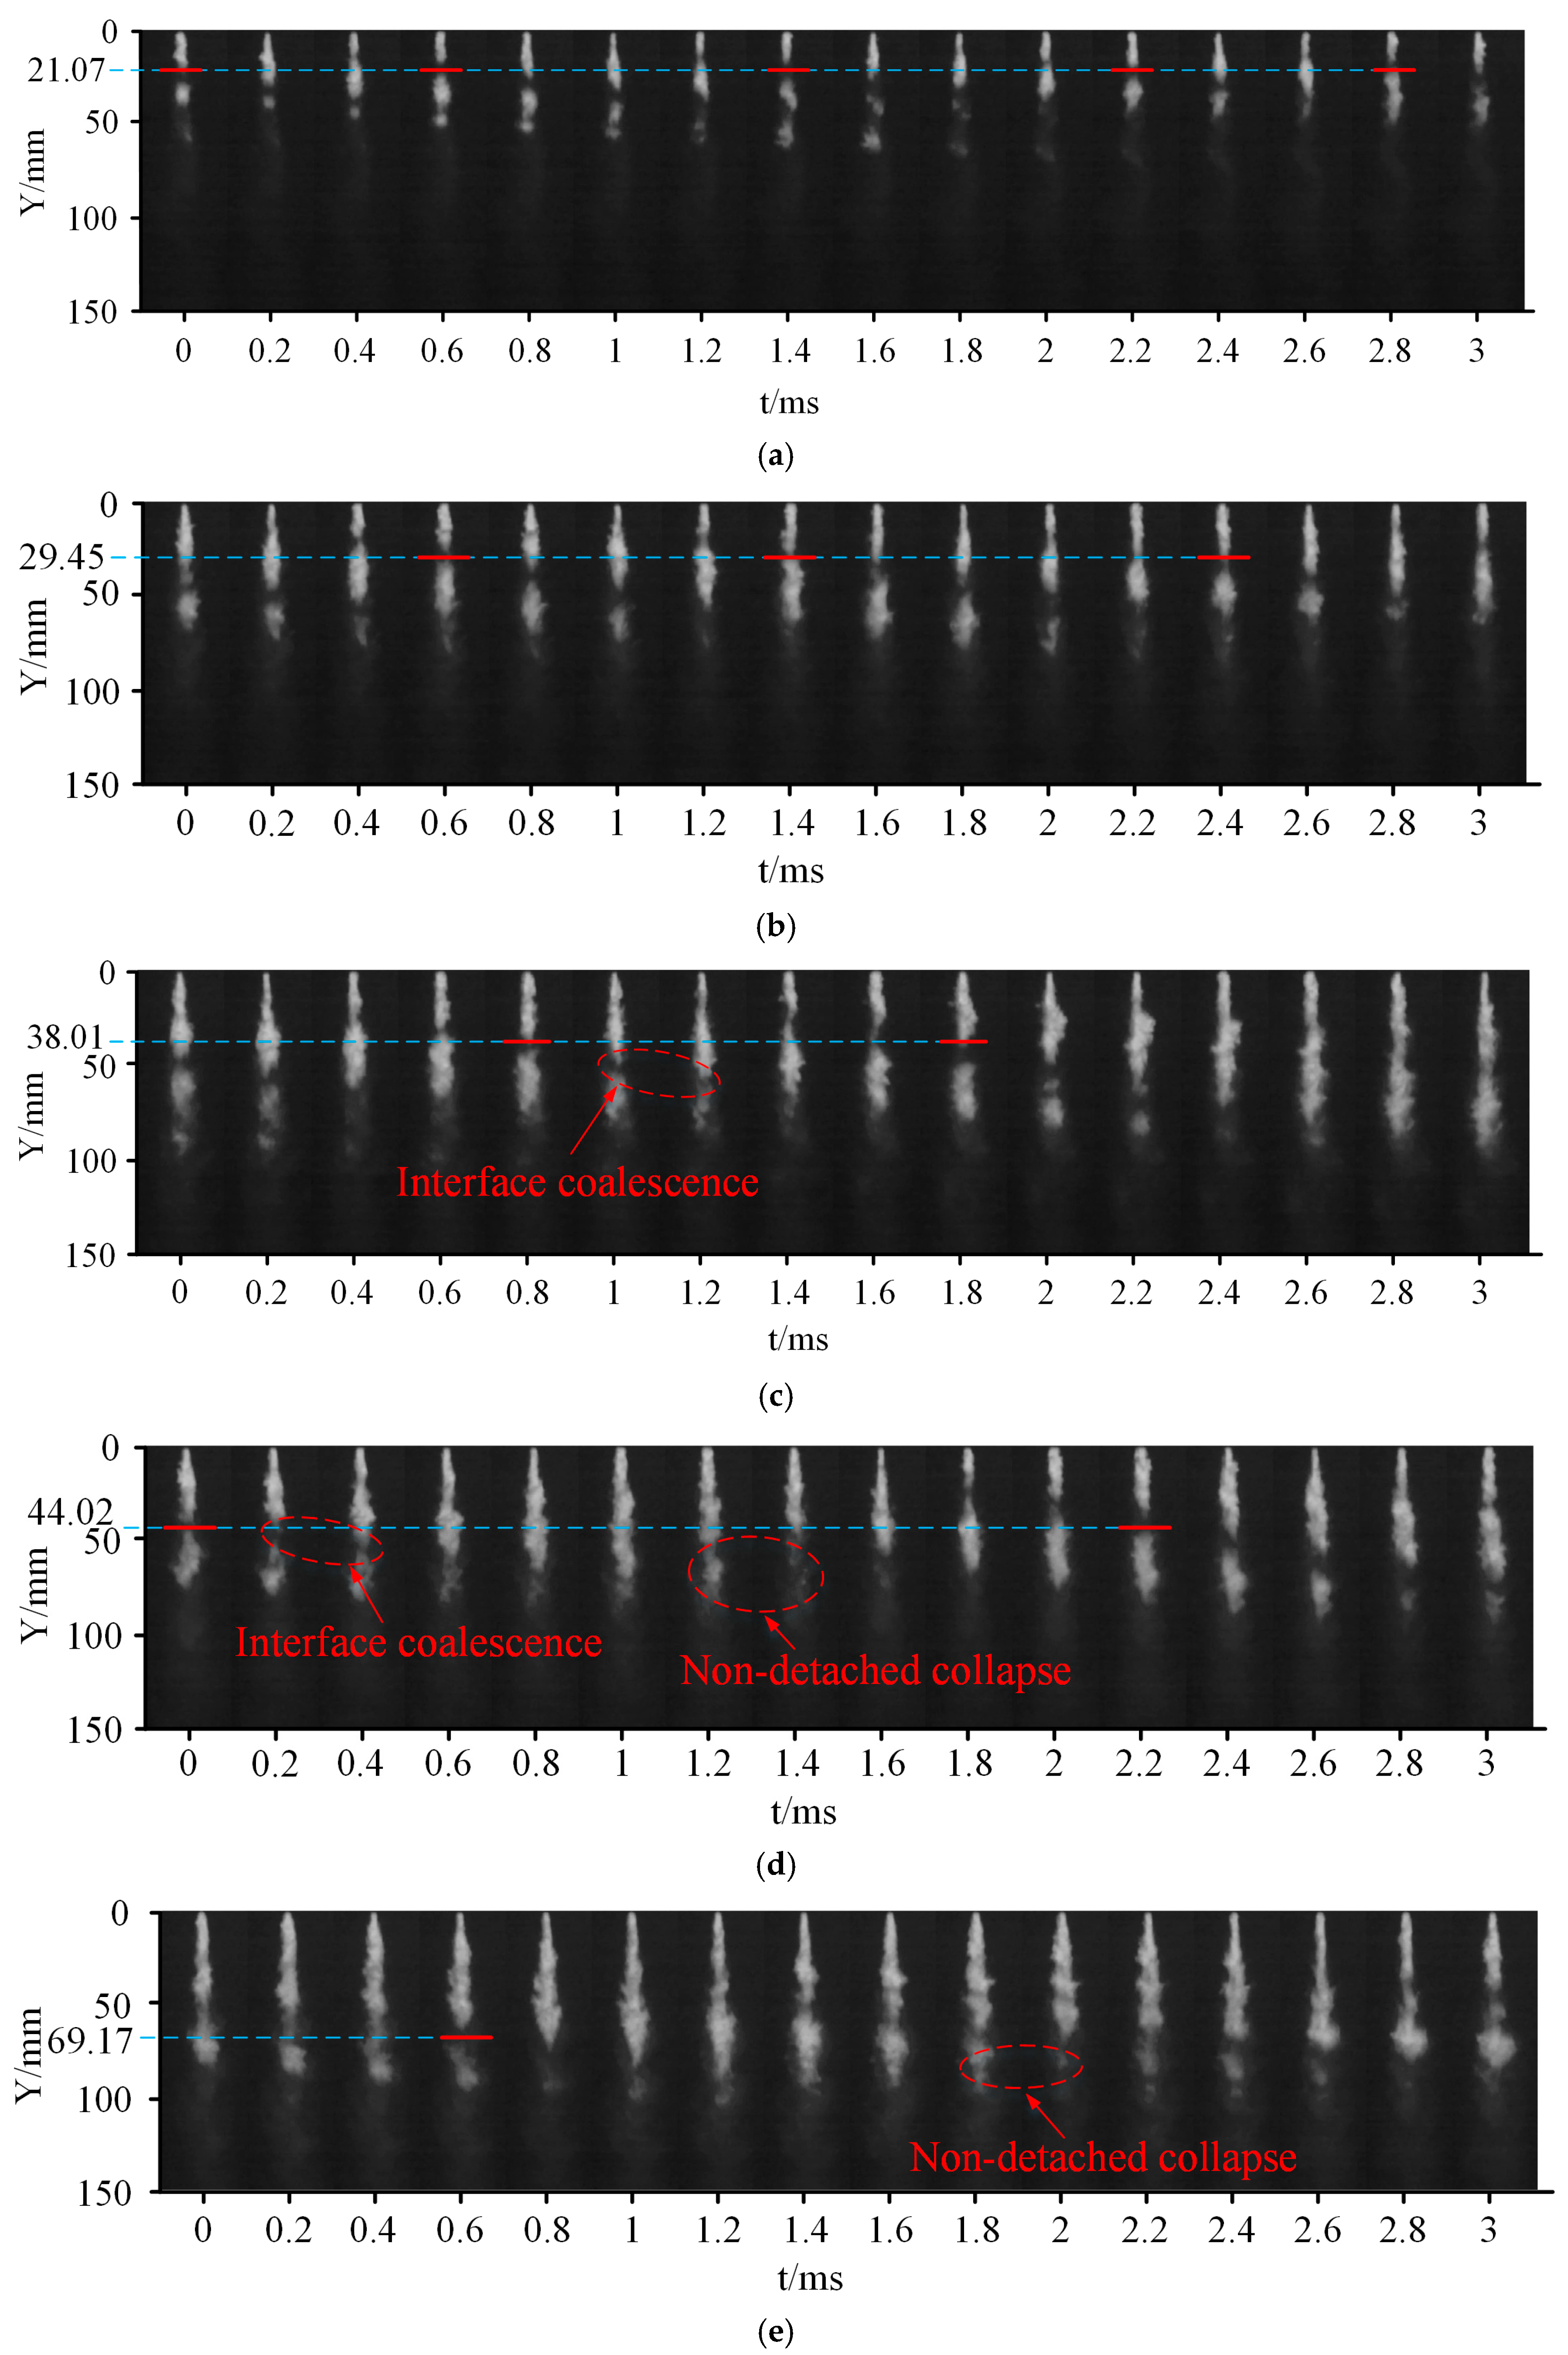
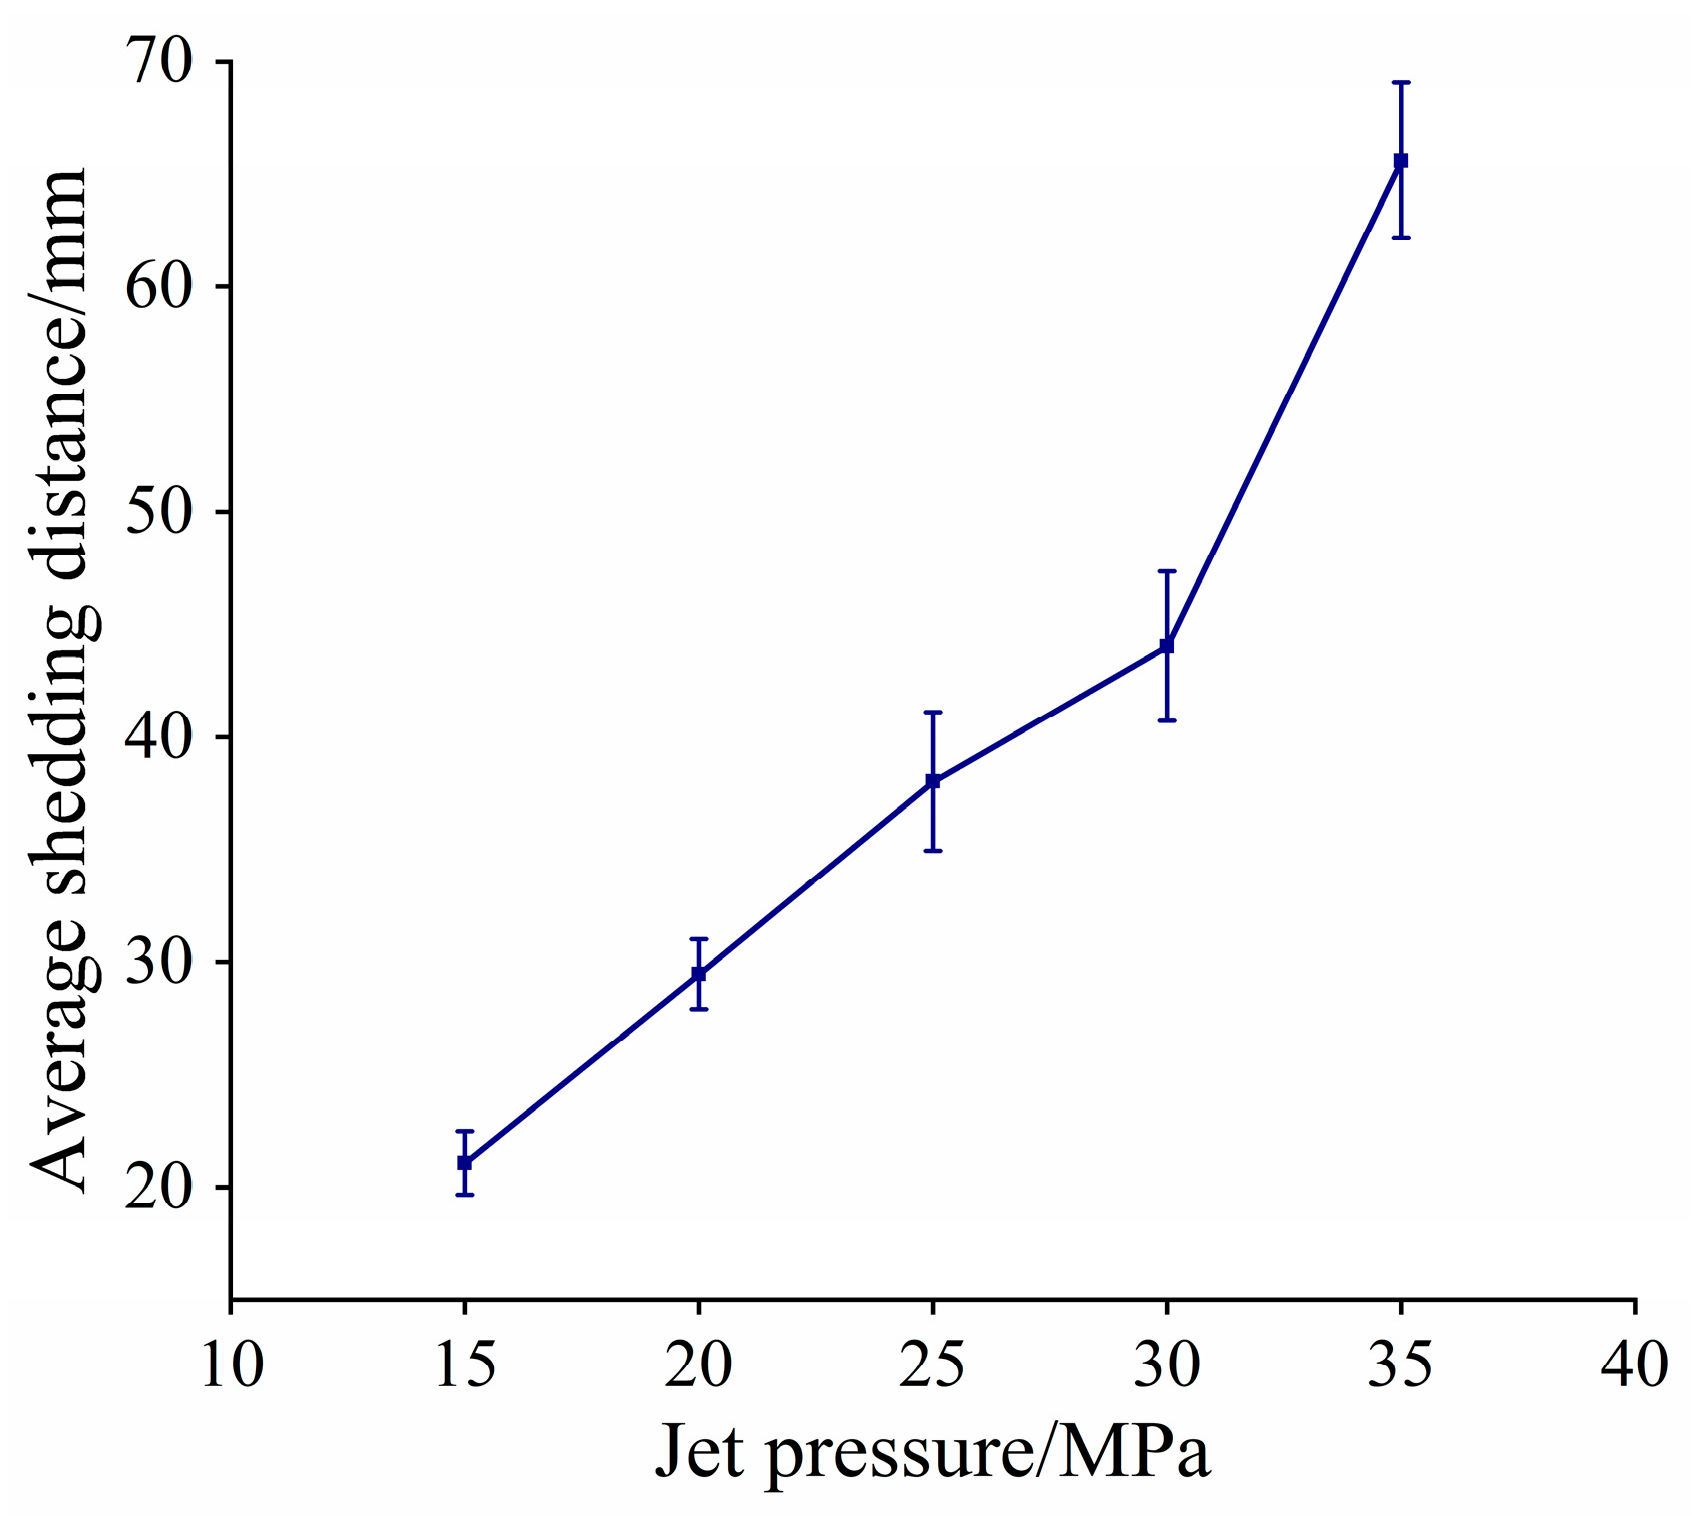
Figure 8 presents grayscale images of cavitation clouds over a 3 ms period at jet pressures of 15–35 MPa. The blue dashed line marks the shedding characteristic plane. The vertical distance between the shedding plane and the nozzle exit defines the average shedding distance. Statistical measurements show a 211.25% increase in average shedding distance as jet pressure rises from 15 to 35 MPa. Figure 9 plots this distance versus jet pressure, revealing a nonlinear growth trend. Notably, at 35 MPa, the average shedding distance increases markedly compared to lower-pressure conditions.
As shown in Figure 8, at 15 MPa, the nozzle produces periodic cavitation clouds, though of limited axial extent. Increasing the jet pressure to 20 MPa elevates the nozzle outlet flow rate and velocity, which intensifies shear-induced vortex generation. This process yields larger and more energetic vortex structures, establishing a more extensive low-pressure region that, in turn, exacerbates cavitation, promotes volumetric expansion, and leads to a substantial elongation of the clouds. Under this condition, the four characteristic stages of a full cycle—inception, development, shedding, and collapse—are distinctly visible. At 25 MPa, the jet maintains a similar periodic evolution but with heightened cavitation intensity near the nozzle exit. Concurrently, the shedding plane moves downstream, the clouds attain larger dimensions prior to shedding, and the overall jet length is extended. A critical transition occurs beyond 25 MPa, where a combination of reduced cloud tail velocity and increased pre-shedding size triggers interfacial fusion between a shedding cloud and its successor, as evidenced in Figure 8c (1–1.2 ms) and Figure 8d (0.2–0.4 ms). This coalescence becomes more pronounced at higher pressures. At 30 MPa, the temporal overlap between clouds intensifies; the preceding cloud has not fully collapsed or shed before the subsequent cloud rapidly generates and develops, resulting in significant spatial overlap and mutual interference. This interaction disrupts the inherent periodicity of the vortex-shedding process, preventing a fraction of the clouds from completing a full shedding-collapse cycle and thus triggering a transition from steady to unsteady shedding behavior. The non-shedding clouds subsequently undergo a gradual collapse, as seen in Figure 8d (1.2–1.4 ms) and Figure 8e (1.8–2 ms). At 35 MPa, this unsteady shedding is markedly pronounced, which considerably increases the average shedding distance.
Comparative studies indicate that the observed cloud merging between shedding and adjacent cavitation clouds in this work also occurs in clouds generated by other nozzles. For instance, Zhu et al. [35] documented the merging of shed clouds with primary clouds, noting that increased jet pressure promotes coalescence, consistent with our findings. Furthermore, observations by Cui et al. [40] on cylindrical cavitating nozzles at 20 MPa revealed cloud merging within 0.6 to 0.7 ms. Similarly, observations by Hutli et al. [47] on conical diffuser cavitation nozzles at 26.7 MPa jet pressure revealed interface fusion between adjacent cavitation clouds within the 0.276 to 0.354 ms timeframe.
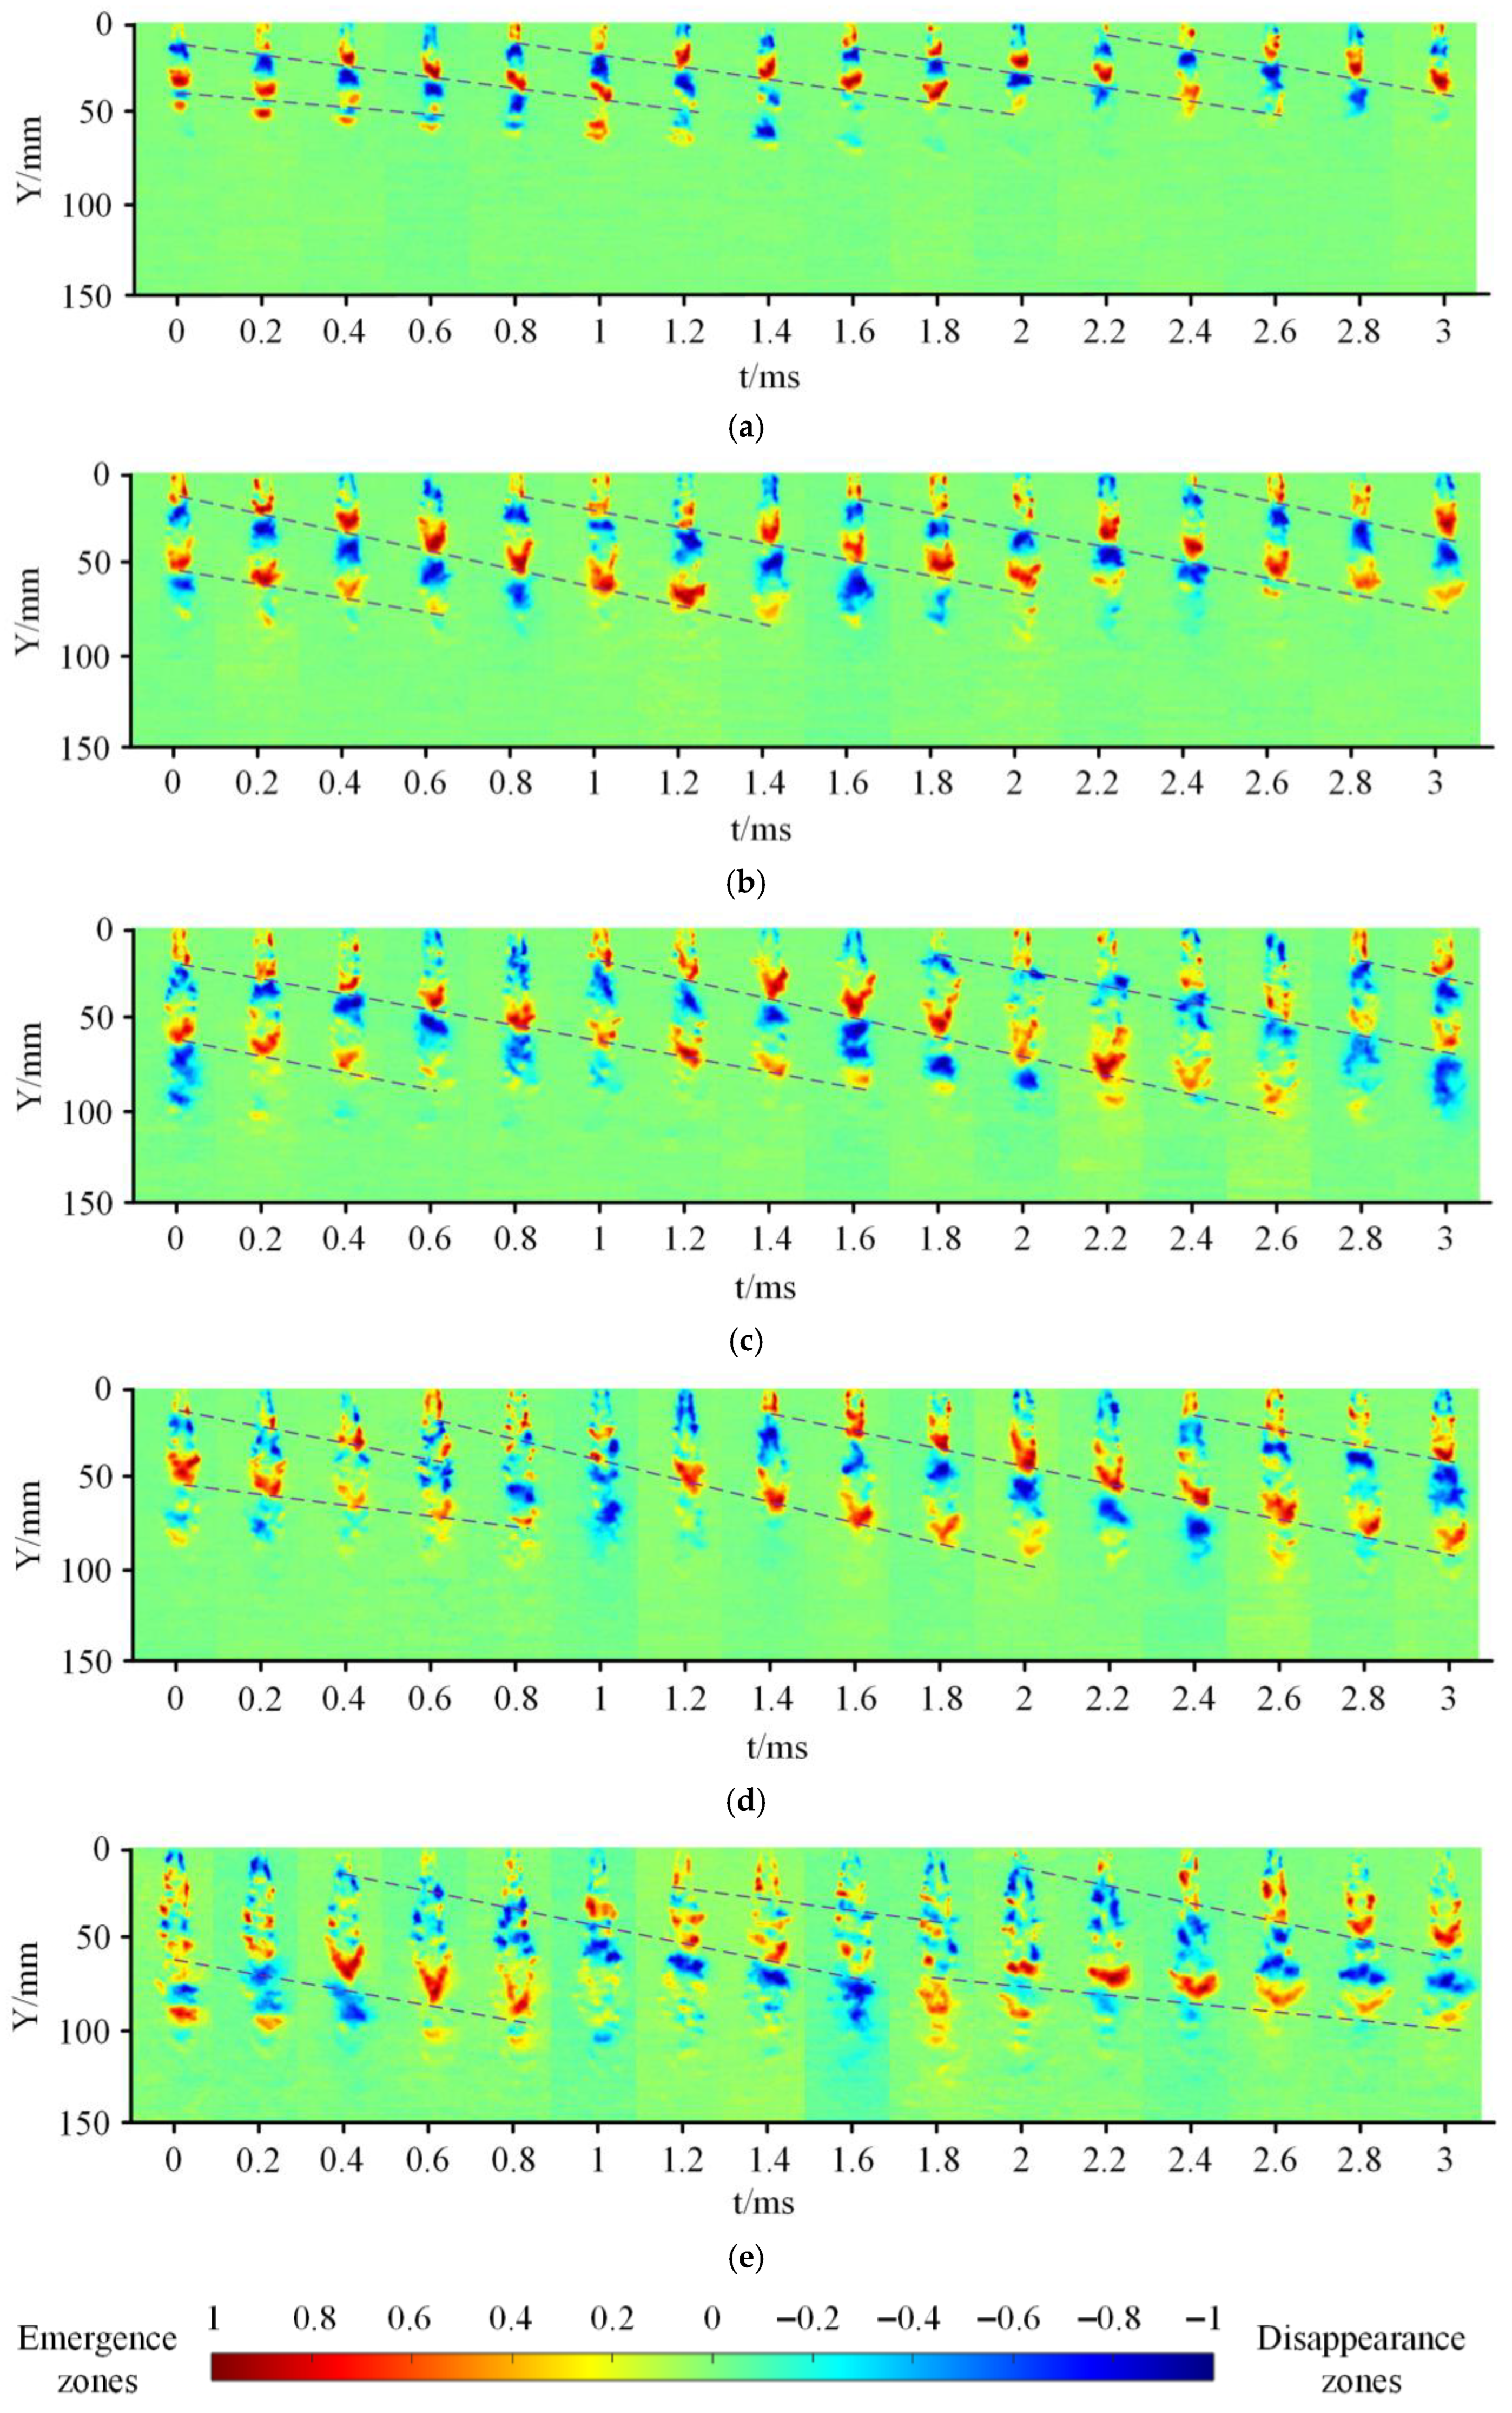
At jet pressures ≥ 30 MPa, cavitation clouds exhibit unsteady shedding behavior. To clearly distinguish clouds across cycles and analyze their dynamics at elevated pressures, we applied the FDM to process grayscale image sequences. The FDM detects motion regions by comparing pixel-wise variations between consecutive frames [31,48].
Figure 10 presents the FDM maps of the cavitation clouds under the five jet pressures, where adjacent dashed lines demarcate identical evolution cycles. Based on the principles of FDM, the translational motion of a cloud along the jet axis induces concurrent positive and negative grayscale fluctuations in the image sequence. Therefore, the FDM maps capture a superposition of the genuine cavitation processes (bubble development and collapse) and the apparent motion due to cloud displacement.
To distinguish true collapse from pure translation, an area-based quantitative criterion was established. During pure translational motion without significant phase change, the area of the grayscale disappearance zone and the emergence zone should be approximately equal. Conversely, a collapse event, characterized by a net reduction in cloud volume, manifests as a grayscale disappearance zone that is significantly larger than the emergence zone. The specific criterion was defined as follows: a cloud was classified as undergoing pure translation if the ratio of the disappearance zone area to the emergence zone area fell within 0.8–1.2. A ratio exceeding 1.5 for several consecutive frames was identified as a collapse event. These threshold values were determined through statistical analysis of multiple characteristic evolution sequences and were found to effectively discriminate between the two physical processes.
Figure 10 reveals that cavitating jets under all five pressures exhibit similar periodic evolution within individual cycles. As jet pressure increases, the FDM maps display intensified hollowing effects at their central regions, indicating heightened cloud density that persistently occupies the jet core. Consequently, grayscale fluctuations from cloud inception and migration concentrate along jet peripheries. When jet pressure is below 30 MPa, mutual interference between cavitation clouds is relatively small, resulting in distinct periodic characteristics in the developmental changes of cavitation clouds across cycles. When jet pressure reaches 30 MPa, interference between cavitation clouds occurs within the 0.4–1 ms timeframe. At 35 MPa jet pressure, this mutual interference becomes significantly more pronounced, leading to significant interference with cavitation cloud collapse during the 1.2 to 1.8 ms interval.
The core design objective of the CJN-FSE is to intensify friction-shear coupling effects on mineral particles through internal flow paths while synergistically inducing cavitation to enhance disintegration efficiency. The observed dynamic characteristics of cavitation clouds—particularly their periodicity, stability, and spatiotemporal collapse distribution—are critical for achieving this synergy. At 15–25 MPa, cavitation clouds exhibit clear, stable periodic shedding. This periodicity implies a predictable spatiotemporal distribution of bubble collapses. Combined with the nozzle’s internally designed high-shear zones and stable periodic micro-jet impacts from cavitation collapse, this theoretically enables uniform and efficient interlayer delamination of layered mineral particles.
However, when jet pressure exceeds 30 MPa, the observed unsteady shedding causes disordered collapse processes with highly uneven spatiotemporal distribution. This heterogeneity results in spatiotemporally uncontrollable cavitation energy acting on mineral particles: some are subjected to excessive or unpredictable impacts, while others reside in energy-deficient regions. Consequently, disintegration efficiency fluctuates, and product size distribution broadens with reduced uniformity. Thus, despite higher pressures generating denser clouds, the uncontrollable collapse distribution due to non-steadiness may compromise overall disintegration efficacy and product quality stability.

3.3.3. Shedding Frequency of Cavitation Clouds Under Varying Jet Pressures

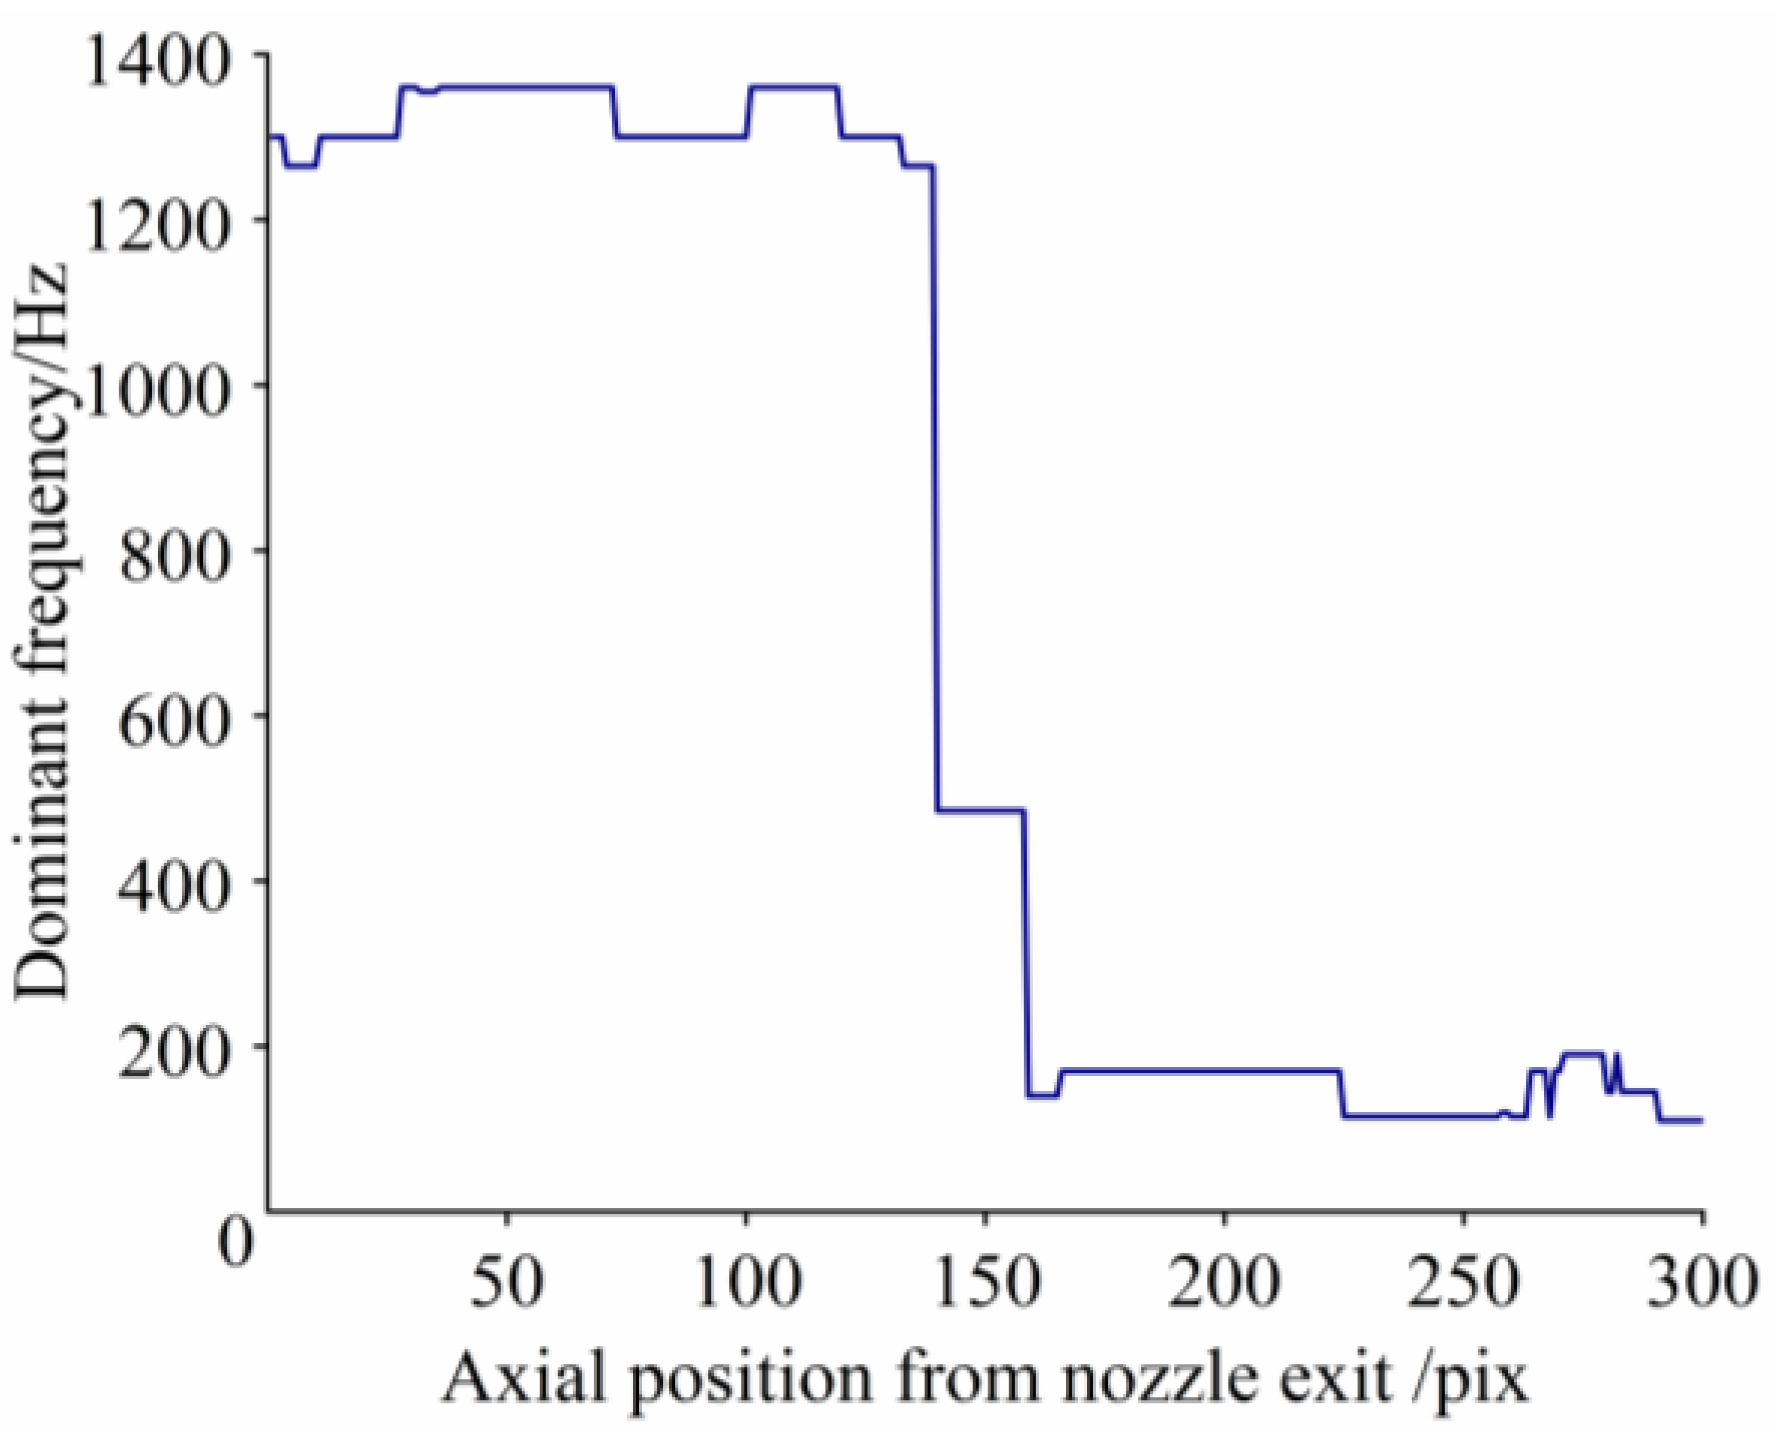
Grayscale frequency analysis extracts the dominant frequency of grayscale variations at specific locations within cavitation cloud images over time, reflecting the primary oscillation frequency in target regions. Studies confirm that the dominant grayscale frequency along the cavitating jet axis serves as a reliable proxy for cloud shedding frequency [36,49,50]. Frequency-domain analysis was performed on the grayscale values at different axial positions along the cavitating jet centerline over a 0.2 s duration under various jet pressures using MATLAB. The dominant frequencies of these grayscale values at 15 MPa are presented in Figure 11.
As shown in Figure 11, the dominant frequencies of the grayscale values along the jet centerline exhibit significant variations across different axial positions. Analysis in conjunction with Figure 8a reveals that within the interval of 0–35 pixels (0–14.0 mm), the cavitation cloud is in the development stage and the dominant frequency of the jet centerline grayscale value fluctuates between 1265 and 1360 Hz; within 36–72 pixels (14.4–28.8 mm), the cavitation cloud begins shedding and the dominant frequency of the jet centerline grayscale value remains constant at 1360 Hz; within 73–139 pixels (29.2–55.6 mm), the cavitation cloud collapses and the dominant frequency of the jet centerline grayscale value fluctuates between 1265 and 1360 Hz; within 140–158 pixels (56 to 63.2 mm), the bubble clouds that have not completely collapsed continue to collapse within this interval, resulting in a rapid attenuation of the dominant frequency of the jet centerline grayscale value to 485 Hz; within 159–300 pixels (63.6–120 mm), only a very small number of residual cavitation bubbles exist, with no significant grayscale changes observable in the images, and the dominant frequency of the jet centerline grayscale value fluctuates between 110 and 170 Hz.
The axial distribution of the dominant frequency is a direct manifestation of the distinct hydrodynamic regimes characterizing each stage of cavitation cloud evolution. Within the development, shedding, and initial collapse regions (0–139 pixels), the flow is governed by coherent, periodically shedding vortex structures, which generate a stable and dominant high-frequency signature. The minor fluctuations observed within this high-frequency band are attributed to background flow field turbulence and the inherent stochasticity of the cloud edge collapse process. Beyond approximately 140 pixels, in the final collapse region, the coherent cloud structure disintegrates into a dispersed cluster of small bubbles undergoing random collapse. In this regime, the grayscale variations lose their periodic character, transitioning to a low-frequency, broadband signal indicative of stochastic processes. This fundamental change in the governing physics—from organized, large-scale vortex shedding to disordered, fine-scale bubble collapse—is responsible for the observed sharp attenuation of the dominant frequency. Thus, the frequency distribution serves as a clear spectral signature of the cavitation cloud’s transition from an ordered, periodic state to a fully disordered, random one.
As illustrated in Figure 8a, under a jet pressure of 15 MPa, the average shedding time of the cavitation cloud within 3 ms is 0.75 ms, corresponding to a shedding frequency of approximately 1333 Hz, and the average shedding distance is approximately 21.07 mm, which corresponds to the 53 pixels position in the cavitation cloud images. Analysis in conjunction with Figure 11 reveals that this average shedding distance falls within the dominant frequency stable region of 14.4–28.8 mm, where the shedding frequency is 1360 Hz; the discrepancy relative to the estimated shedding frequency is a mere 2.0%. This demonstrates that the dominant frequency of the jet centerline grayscale value within the stable region encompassing the average shedding distance can accurately reflect the shedding behavior of the cavitation cloud at 15 MPa jet pressure. Therefore, the shedding frequency of the cavitation clouds can be estimated by calculating the dominant frequency of the jet centerline grayscale value within the stable region corresponding to its average shedding distance. This aligns with the conclusion drawn by Peng et al. [50,51] that variations in the grayscale value at a specific point within a defined interval can reflect the shedding frequency of cavitation clouds.
For each jet pressure, the pixel location corresponding to the average cloud shedding distance was identified on the jet centerline. A Fast Fourier Transform (FFT) was then applied to the grayscale value time series at these locations to extract the dominant frequency components. The FFT was configured with the following parameters: a sampling frequency Fs of 5000 Hz, N = 1000 sampling points, and a rectangular window of the same length, yielding a frequency resolution of 5 Hz. To enhance the clarity of the primary peak, spectral components below a 50 Hz cutoff were excluded to mitigate low-frequency interference. The noise level was estimated through residual analysis by comparing the original signal with a single-frequency cosine model constructed using the identified dominant frequency and amplitude. The statistical uncertainty of the identified dominant frequency was quantified using the Cramér-Rao lower bound theory to compute the 95% confidence interval. This comprehensive spectral processing methodology robustly determines the cavitation cloud shedding frequency and its associated uncertainty. The cavitation cloud shedding frequencies and their 95% confidence intervals under different jet pressures, calculated using MATLAB, are summarized in Table 3. The corresponding grayscale frequency-domain diagrams are shown in Figure 12.
As observed in Figure 12, the dominant frequency of the grayscale at the shedding location decreases with increasing jet pressure, indicating that the shedding frequency of the cavitation cloud diminishes as jet pressure rises; this finding is consistent with the conclusions obtained by Dong et al. [39] and Hutli et al. [47]. When the jet pressure reaches 30 MPa, mutual interference among cavitation clouds occurs, causing a small number of clouds to exhibit non-shedding behavior, resulting in a decrease of the cavitation cloud shedding frequency to 1165 Hz; when the jet pressure reaches 35 MPa, the mutual interference intensifies and the non-shedding phenomenon becomes significantly more pronounced, leading to a substantial decrease in cavitation clouds shedding frequency to 640 Hz.
The amplitude in the frequency spectra of Figure 12 represents the power of the grayscale fluctuation signal at each frequency. As the pressure increases from 15 to 20 MPa, a marked increase in amplitude is observed across the spectrum, particularly at the dominant shedding frequency. This signifies a greater contrast in the cavitation cloud images and more intense grayscale oscillations per shedding cycle, aligning with the visual observations of larger and denser clouds. At 25 MPa, a distinct shift occurs: the amplitude at the dominant frequency diminishes sharply, while the background noise level rises and secondary spectral peaks proliferate. This evolution indicates a breakdown in the coherence of the shedding process, where the previously stable periodic signal becomes contaminated by a broad spectrum of disturbances. This spectral broadening is a direct consequence of the physical interactions between clouds, such as interfacial fusion and the onset of non-shedding collapse, which disrupt the organized vortex shedding. By 35 MPa, the spectrum transitions from a discrete, tonal character to a continuous, broadband one, manifesting the complete disintegration of periodic shedding into fully developed unsteady and chaotic behavior. Collectively, these spectral transformations provide conclusive frequency-domain evidence that corroborates the time-domain observation of a transition from stable periodicity to destabilization and disorder with increasing jet pressure.
In summary, the CJN-FSE generates significant cavitation effects across the jet pressure range of 15–35 MPa, and its cavitation performance gradually strengthens with increasing jet pressure. However, when the jet pressure reaches 30 MPa, mutual interference occurs between adjacent cavitation clouds. This interference disrupts the periodicity of cloud shedding, leading to disorder in their collapse timing and manifesting as unsteady shedding characteristics. At a jet pressure of 35 MPa, this unsteady phenomenon becomes more pronounced, causing the shedding frequency of the cavitation clouds to rapidly decrease to 640 Hz. Based on the analysis of cavitation cloud dynamics, an operational pressure ≤ 30 MPa is recommended for the CJN-FSE in mineral liberation processes. This upper limit is critical for maintaining stable and controllable cavitation, which is a prerequisite for efficient and predictable particle disintegration.

4. Discussion

Conventional nozzle designs for mineral liberation via cavitating water jets largely overlook the critical role of shear effects on particles within the nozzle. To address this limitation and evaluate the performance of a nozzle engineered specifically to enhance such effects, this study investigated the dynamic evolution of cavitation clouds generated by the submerged CJN-FSE using high-speed imaging. The results demonstrate that the internal flow path of the CJN-FSE successfully generates stable cavitating jets. A key finding, however, is that jet pressures exceeding 30 MPa induce significant interference between successive cavitation clouds, leading to unsteady shedding behavior. This instability becomes particularly severe at 35 MPa, where intensified inter-cloud interaction markedly suppresses the collapse process and precipitates a sharp decline in shedding frequency from 1165 Hz to 640 Hz. Due to the detrimental impact of such unsteady shedding on the uniformity and efficiency of mineral liberation, it is recommended that the operational pressure of this nozzle be maintained at or below 30 MPa in practice.
The design philosophy of the CJN-FSE is fundamentally distinct from that of nozzles optimized for erosion enhancement [23,24,25,26,27,28,29,30,31,32]. Its primary objective is to achieve a synergistic intensification of both ‘cavitation impact’ and ‘friction-shear’ mechanisms, tailored to the specific mechanical demands of liberating layered minerals. The observed stable, periodic shedding at low-to-medium pressures (15–25 MPa) is consistent with the behavior of other nozzle types [2,34,36,40,41,42,43], as the underlying vortex-shedding physics in the shear layer is a universal phenomenon. This study confirms that the multi-stage internal flow path of the CJN-FSE is fully capable of sustaining this stable periodic cavitation. More importantly, it validates a novel design paradigm: the active control of shear stress via flow path geometry to promote mineral liberation. This represents a significant departure from and a valuable extension to conventional cavitation nozzle design theory.
The CJN-FSE is designed to intensify friction-shear coupling effects on mineral particles via its internal flow path while concurrently inducing cavitation, creating a synergistic action aimed at enhancing liberation efficiency. The dynamic characteristics of the cavitation clouds—specifically their periodicity, stability, and spatiotemporal collapse distribution—are paramount to realizing this synergy. Within the 15–25 MPa range, the clear and stable periodic shedding ensures a predictable spatiotemporal distribution of bubble collapses. This predictable cavitation energy delivery, when combined with the high-shear zones engineered within the nozzle, enables a combined mechanism of stable micro-jet impact and directed shear force. This multi-mechanistic action is anticipated to facilitate uniform and efficient interlayer delamination of layered mineral particles.
However, when the jet pressure exceeds 30 MPa, the observed transition to unsteady shedding results in a disordered collapse process with a highly heterogeneous spatiotemporal distribution. This spatial and temporal unpredictability of collapse events renders the cavitation energy delivered to the mineral particles uncontrollable. Consequently, some particles are likely subjected to excessive or erratic impacts, while others in energy-deficient regions receive insufficient treatment. This inconsistency in energy delivery likely results in fluctuating liberation efficiency and a broader, less uniform product size distribution. Thus, despite the generation of denser cavitation clouds at elevated pressures, the compromised controllability of the collapse process is counterproductive, potentially undermining both the overall liberation efficacy and the final product quality uniformity.
In summary, while increasing jet pressure enhances cavitation intensity and could theoretically improve liberation efficiency, its practical application for mineral processing requires a more nuanced consideration. Two critical factors emerge from this study: first, the intensification of cavitation with pressure is subject to diminishing returns; second, and more importantly, pressures exceeding 30 MPa introduce significant flow unsteadiness. This unsteadiness manifests as spatiotemporally unpredictable cloud shedding and collapse, which degrades the controllability and effectiveness of the energy transfer to mineral particles, thereby jeopardizing liberation uniformity, process efficiency, and product quality stability. Consequently, for practical engineering implementation, the marginal gains in cavitation intensity at high pressures must be carefully weighed against the substantial risks to process stability and product consistency.
This study has primarily elucidated the macroscopic influence of jet pressure on cavitation cloud dynamics through multi-faceted qualitative observation and quantitative analysis based on high-speed imaging and image processing. Nevertheless, certain limitations remain. First, the study lacks quantitative measurements of the internal cloud structure, local pressure/velocity fields, and inlet pressure fluctuations. Second, it does not establish a direct quantitative correlation between cavitation characteristics and the liberation efficiency of layered minerals. These limitations also define clear directions for future research. Subsequent work will focus on the following aspects: (1) integrating high-precision sensors and Particle Image Velocimetry (PIV) to quantitatively analyze parameters such as flow rate and velocity at the nozzle outlet; (2) measuring pressure fluctuation curves at the nozzle inlet under different jet pressures over a 30-s duration to quantify pressure variations and their spectral characteristics; (3) performing comparative cavitation erosion tests with conventional nozzles of similar characteristic parameters to evaluate the performance enhancement attributable to the multi-stage internal flow path; and (4) conducting liberation experiments on model layered minerals (e.g., mica, graphite) to construct a quantitative model linking operational parameters, cavitation metrics, and liberation effectiveness. This integrated pathway is essential for transitioning this technology from a promising proof-of-concept toward a practical engineering application.

5. Conclusions

This study employed high-speed imaging technology to conduct cavitation visualization experiments on a friction-shear cavitating water jet. By utilizing methods such as grayscale image analysis, time-averaged processing, fractal dimension calculation, FDM, and cavitation cloud shedding frequency measurement to analyze the cavitation clouds under different jet pressures, the following conclusions can be drawn:
(1)
For a novel nozzle with a multi-stage flow path structure (converging section, flat frictional section, diffuser section), a friction-shear cavitating water jet intended for layered mineral liberation and characterized by a “friction-shear” coupling effect was proposed.
(2)
The regulatory effect of jet pressure on the cavitation cloud evolution behavior of the CJN-FSE was investigated. Within the 15–25 MPa range, the cavitation clouds exhibit stable periodic evolution (inception, development, shedding, collapse). When the pressure exceeds 30 MPa, excessive flow field kinetic energy leads to mutual interference between clouds, resulting in a transition to an unsteady shedding mode. The geometric dimensions (length, width) and morphological complexity (box-counting dimension) of the cavitation clouds increase monotonically with pressure, while the shedding frequency decreases.
(3)
Based on the clear correlation between cavitation stability and jet pressure, we recommend maintaining the operational pressure at or below 30 MPa for mineral liberation applications. This pressure threshold is identified as the upper limit for preserving stable and controllable cavitation, which is a critical prerequisite for achieving uniform and efficient liberation performance. This finding provides a crucial operational guideline for the future application of the CJN-FSE.
In conclusion, this work elucidates the cavitation characteristics of the CJN-FSE and proposes a novel design philosophy for cavitation nozzles: a function-integrated approach that tailors the nozzle’s function to the specific mechanical demands of the target application. Future research will prioritize two critical avenues: the quantitative characterization of the internal shear flow field and the establishment of a direct correlation between quantified cavitation metrics and mineral liberation efficiency. These investigations are essential to build a robust foundation for the eventual engineering deployment and adoption of this technology.

Author Contributions

Conceptualization, X.D.; methodology, X.D. and Y.J.; software, Y.J.; validation, X.D. and Y.J.; formal analysis, Y.J.; investigation, X.D., Y.J., and C.G.; resources, X.D. and L.C.; data curation, Y.J.; writing—original draft preparation, Y.J. and C.G.; writing—review and editing, X.D.; visualization, Y.J.; supervision, X.D. and L.C.; project administration, X.D.; funding acquisition, X.D. All authors have read and agreed to the published version of the manuscript.

Funding

This research was supported by the National Natural Science Foundation of China (Grant No. 52075151).

Institutional Review Board Statement

Not applicable.

Informed Consent Statement

Not applicable.

Data Availability Statement

The data presented in this study are available on request from the corresponding author. As the data in this paper belongs to the National Natural Science Foundation of China, it involves related privacy and is not owned by individuals.

Conflicts of Interest

The authors declares that there are no conflicts of interest.

References

  1. Hutli, E.; Nedeljkovic, M.; Bonyár, A. Dynamic behaviour of cavitation clouds: Visualization and statistical analysis. J. Braz. Soc. Mech. Sci. Eng. 2019, 41, 281. [Google Scholar] [CrossRef]
  2. Soyama, H. Cavitating Jet: A Review. Appl. Sci. 2020, 10, 7280. [Google Scholar] [CrossRef]
  3. Yang, Y.F.; Wang, G.W.; Shi, W.D.; Li, W.; Ji, L.L.; Wang, H.L. Turbulence Characteristics in the Mixing Layer of a Submerged Cavitating Jet at High Reynolds Numbers. Sustainability 2022, 14, 11963. [Google Scholar] [CrossRef]
  4. Han, L.; Zhang, M.D.; Huang, G.H.; Huang, B. Energy transformation mechanism of a gas bubble collapse in the free-field. Chin. J. Theor. Appl. Mech. 2021, 53, 1288–1301. [Google Scholar] [CrossRef]
  5. Schenke, S.; van Terwisga, T.J.C. An energy conservative method to predict the erosive aggressiveness of collapsing cavitating structures and cavitating flows from numerical simulations. Int. J. Multiph. Flow 2019, 111, 200–218. [Google Scholar] [CrossRef]
  6. Peng, C.; Tian, S.C.; Li, G.S. Joint experiments of cavitation jet: High-speed visualization and erosion test. Ocean Eng. 2018, 149, 1–13. [Google Scholar] [CrossRef]
  7. Li, X.F.; Duan, Y.X.; Zhang, Y.N.; Tang, N.N. Retardant Effects of Collapsing Dynamics of a Laser-Induced Cavitation Bubble Near a Solid Wall. Symmetry 2019, 11, 1051. [Google Scholar] [CrossRef]
  8. Bukharin, N.; El Hassan, M.; Omelyanyuk, M.; Nobes, D. Applications of cavitating jets to radioactive scale cleaning in pipes. Energy Rep. 2020, 6, 1237–1243. [Google Scholar] [CrossRef]
  9. Gu, J.Y.; Luo, C.H.; Lu, Z.B.; Ma, P.C.; Xu, X.C.; Ren, X.D. Bubble dynamic evolution, material strengthening and chemical effect induced by laser cavitation peening. Ultrason. Sonochem. 2021, 72, 105441. [Google Scholar] [CrossRef]
  10. Soyama, H. Cavitation Peening: A Review. Metals 2020, 10, 270. [Google Scholar] [CrossRef]
  11. Soyama, H. Comparison between the improvements made to the fatigue strength of stainless steel by cavitation peening, water jet peening, shot peening and laser peening. J. Mater. Process. Tech. 2019, 269, 65–78. [Google Scholar] [CrossRef]
  12. El Hassan, M.; Bukharin, N.; Al-Kouz, W.; Zhang, J.W.; Li, W.F. A Review on the Erosion Mechanism in Cavitating Jets and Their Industrial Applications. Appl. Sci. 2021, 11, 3166. [Google Scholar] [CrossRef]
  13. Li, G.S.; Shen, Z.H. Theory and Application of Self-Resonating Cavitating Water Jet, 1st ed.; China University of Petroleum Press: Dongying, China, 2008; p. 4. ISBN 978-7-5636-2146-0. [Google Scholar]
  14. Guo, C.W.; Dong, L. Energy Consumption in Comminution of Mica with Cavitation Abrasive Water Jet. J. Chin. Univ. Min. Technol. 2007, 17, 251–254. [Google Scholar] [CrossRef]
  15. Dvorsky, R.; Lunacek, J.; Sliva, A. Dynamics analysis of cavitation disintegration of microparticles during nanopowder preparation in a new Water Jet Mill (WJM) device. Adv. Powder Technol. 2011, 22, 639–643. [Google Scholar] [CrossRef]
  16. Sen, S. Grinding of magnetite using a waterjet driven cavitation cell. Powder Technol. 2016, 297, 34–43. [Google Scholar] [CrossRef]
  17. Galecki, G.; Akar, G.; Sen, S.; Li, Y. Advanced studies on coal injection into a cavitation cell for the purpose of comminution. Arch. Min. Sci. 2012, 57, 769–778. [Google Scholar] [CrossRef]
  18. Galecki, G.; Sen, S.; Akar, G.; Li, Y. Parametric evaluation of coal comminution by waterjets. Int. J. Coal Prep. Util. 2013, 33, 36–46. [Google Scholar] [CrossRef]
  19. Dong, X.; Jiang, Y.; Guo, C.H. Mechanical mechanism of shear cavitating water jet dissociation of flake graphite. In Proceedings of the 2024 7th International Conference on Mechanical, Electrical and Material Application, Changsha, China, 23–25 February 2024. [Google Scholar]
  20. Soyama, H. Enhancing the aggressive intensity of a cavitating jet by means of the nozzle outlet geometry. J. Fluids Eng. 2011, 133, 101301. [Google Scholar] [CrossRef]
  21. Dong, W.Q.; Yao, L.G.; Luo, W.L. Numerical Simulation of Flow Field of Submerged Angular Cavitation Nozzle. Appl. Sci. 2023, 13, 613. [Google Scholar] [CrossRef]
  22. Huang, S.W.; Huang, J.P.; He, K. Research on erosion effect of various submerged cavitating jet nozzles and design of self-rotating cleaning device. Appl. Sci. 2024, 14, 1433. [Google Scholar] [CrossRef]
  23. Hutli, E.; Nedeljkovic, M.S.; Czifrus, S. Study and Analysis of the Cavitating and Non-Cavitating Jets Part Two Parameters Controlling the Jet Action and a New Formula for Cavitation Number Calculation. Therm. Sci. 2020, 24, 407–419. [Google Scholar] [CrossRef]
  24. Liu, H.S.; Xu, Y.; Wang, Z.C.; Zhang, J.L.; Wang, J.X. Experimental and numerical simulations to examine the mechanism of nozzle geometry affecting cavitation water jets. Geoenergy Sci. Eng. 2024, 233, 212511. [Google Scholar] [CrossRef]
  25. Kamisaka, H.; Soyama, H. Enhancing the Aggressive Intensity of a Cavitating Jet by Introducing Water Flow Holes and a Long Guide Pipe. J. Fluids Eng. 2021, 143, 031201. [Google Scholar] [CrossRef]
  26. Cai, T.F.; Chamorro, L.P.; Ma, F.; Han, J. Impact of nozzle lip on the cavitation cloud characteristics of self-excited cavitating waterjets. Ocean Eng. 2023, 285, 115329. [Google Scholar] [CrossRef]
  27. Prasetya, R.; Sou, A.; Moon, S.; Pratama, R.H.; Wada, Y.; Yokohata, H. X-ray Phase Contrast Imaging of Cavitation and Discharged Liquid Jet in Nozzles with Various Sizes. At. Sprays 2019, 29, 59–78. [Google Scholar] [CrossRef]
  28. Wang, G.W.; Yang, Y.F.; Wang, C.; Shi, W.D.; Li, W.; Pan, B. Effect of Nozzle Outlet Shape on Cavitation Behavior of Submerged High-Pressure Jet. Machines 2022, 10, 4. [Google Scholar] [CrossRef]
  29. Guo, C.H.; Dong, X.; Song, H.R.; Jiang, Y. Features of Structure and Flow Field in Homemade Co-Current Cavitation Water Jet Nozzle. Materials 2025, 18, 146. [Google Scholar] [CrossRef] [PubMed]
  30. Ullas, P.K.; Chatterjee, D.; Vengadesan, S. Experimental study on the effect of throat length in the dynamics of internal unsteady cavitating flow. Phys. Fluids 2023, 35, 023332. [Google Scholar] [CrossRef]
  31. Yang, Y.F.; Li, W.; Shi, W.D.; Zhou, L.; Zhang, W.Q. Experimental Study on the Unsteady Characteristics and the Impact Performance of a High-Pressure Submerged Cavitation Jet. Shock Vib. 2020, 2020, 1701843. [Google Scholar] [CrossRef]
  32. Vidvans, A.N.; Melkote, S.N.; Sanders, D.G. Enhancing Cavitation Intensity in Co-Flow Water Cavitation Peening with Organ Pipe Nozzles. J. Manuf. Sci. Eng. ASME 2021, 143, 071010. [Google Scholar] [CrossRef]
  33. Yin, S.H.; Hao, S.; Zhang, H.S.; Hu, S.; Cao, D.Y. The calculation medel of conveying resistance of waste rock-unclassified pastes slurry mixed with water-reducing agent. J. Harbin Eng. Univ. 2022, 43, 212–220. [Google Scholar] [CrossRef]
  34. Xu, Y.; Liu, H.S.; Wang, Z.C.; Zhang, J.L.; Wang, J.X. Analysis of the Effects of Nozzle Geometry on the Cavitation Water Jet Flow Field Using Orthogonal Decomposition. Iran. J. Sci. Technol. Trans. Mech. Eng. 2024, 48, 119–132. [Google Scholar] [CrossRef]
  35. Zhu, R.Y.; Zhu, H.T.; Zhang, X.H.; Pan, S.Z.; Zhang, C.; Xie, B. Experimental study on the unsteady behavior and frequency characteristics of high-speed submerged cavitating water jets. Phys. Fluids 2024, 36, 103336. [Google Scholar] [CrossRef]
  36. Nishimura, S.; Takakuwa, O.; Soyama, H. Similarity Law on Shedding Frequency of Cavitation Cloud Induced by a Cavitating Jet. J. Fluid Sci. Technol. 2012, 7, 405–420. [Google Scholar] [CrossRef]
  37. Yang, Y.F.; Li, W.; Shi, W.D.; Zhang, W.Q.; El-Emam, M.A. Numerical Investigation of a High-Pressure Submerged Jet Using a Cavitation Model Considering Effects of Shear Stress. Processes 2019, 7, 541. [Google Scholar] [CrossRef]
  38. Lu, Y.P.; Wang, J.; Yu, H.L. 3D image processing and analyzing system for industrial computed tomography. Chin. J. Sci. Instrum. 2009, 30, 444–448. [Google Scholar] [CrossRef]
  39. Dong, J.M.; Li, S.; Meng, R.X.; Zhong, X.; Pan, X.X. Research on Cavitation Characteristics of Two-Throat Nozzle Submerged Jet. Appl. Sci. 2022, 12, 536. [Google Scholar] [CrossRef]
  40. Cui, Y.Y.; Zhao, M.J.; Ding, Q.M.; Cheng, B. Study on Dynamic Evolution and Erosion Characteristics of Cavitation Clouds in Submerged Cavitating Water Jets. J. Mar. Sci. Eng. 2024, 12, 641. [Google Scholar] [CrossRef]
  41. Peng, G.Y.; Wakui, A.; Oguma, Y.; Shimizu, S.; Ji, H. Periodic Behavior of Cavitation Cloud Shedding in Submerged Water Jets Issuing from a Sheathed Pipe Nozzle. J. Flow Control Meas. Vis. 2018, 6, 15–26. [Google Scholar] [CrossRef]
  42. Hutli, E.; Nedeljkovic, M.S.; Radovic, N.A.; Bonyár, A. The relation between the high speed submerged cavitating jet behaviour and the cavitation erosion process. Int. J. Multiph. Flow 2016, 83, 27–38. [Google Scholar] [CrossRef]
  43. Zhu, R.Y.; Zhang, X.H.; Zhu, H.T.; Zhang, C.; Pan, S.Z. On unsteady cavitation flow of a high-speed submerged water jet based on data-driven modal decomposition. Ocean Eng. 2024, 295, 116916. [Google Scholar] [CrossRef]
  44. Datseris, G.; Kottlarz, I.; Braun, A.P.; Parlitz, U. Estimating fractal dimensions: A comparative review and open source implementations. Chaos Interdiscip. J. Nonlinear Sci. 2023, 33, 102101. [Google Scholar] [CrossRef] [PubMed]
  45. Sajid, M.; Husain, A.; Reddy, J.; Alresheedi, M.T.; Al Yahya, S.A.; Al-Rajy, A. Box dimension of the border of Kingdom of Saudi Arabia. Heliyon 2023, 9, e14846. [Google Scholar] [CrossRef] [PubMed]
  46. Patiño-Ortiz, M.; Patiño-Ortiz, J.; Martínez-Cruz, M.; Esquivel-Patiño, F.; Balankin, A.S. Morphological Features of Mathematical and Real-World Fractals: A Survey. Fractal Fract. 2024, 8, 440. [Google Scholar] [CrossRef]
  47. Hutli, E.A.F.; Nedeljkovic, M.S. Frequency in Shedding/Discharging Cavitation Clouds Determined by Visualization of a Submerged Cavitating Jet. J. Fluids Eng. 2008, 130, 021304. [Google Scholar] [CrossRef]
  48. Li, F.Z.; Tan, Z.R.; Chen, L.Y.; Li, R.T.; Xu, Z.Y.; Wang, Y. Study on Dynamic Evolution of Cavitation Clouds and Optimization of Standoff Distance in Water Cavitation Peening. J. Mech. Eng. 2019, 55, 120–126. [Google Scholar] [CrossRef]
  49. Wright, M.M.; Epps, B.; Dropkin, A.; Truscott, T.T. Cavitation of a submerged jet. Exp. Fluids 2013, 54, 1541. [Google Scholar] [CrossRef]
  50. Peng, C.; Tian, S.C.; Li, G.S. Determination of the shedding frequency of cavitation cloud in a submerged cavitation jet based on high-speed photography images. J. Hydrodyn. 2021, 33, 127–139. [Google Scholar] [CrossRef]
  51. Peng, C.; Li, G.S.; Tian, S.C. Dynamics of cavitation cloud in submerged cavitation water jet. Pet. Sci. Bull. 2017, 2, 228–239. [Google Scholar] [CrossRef]
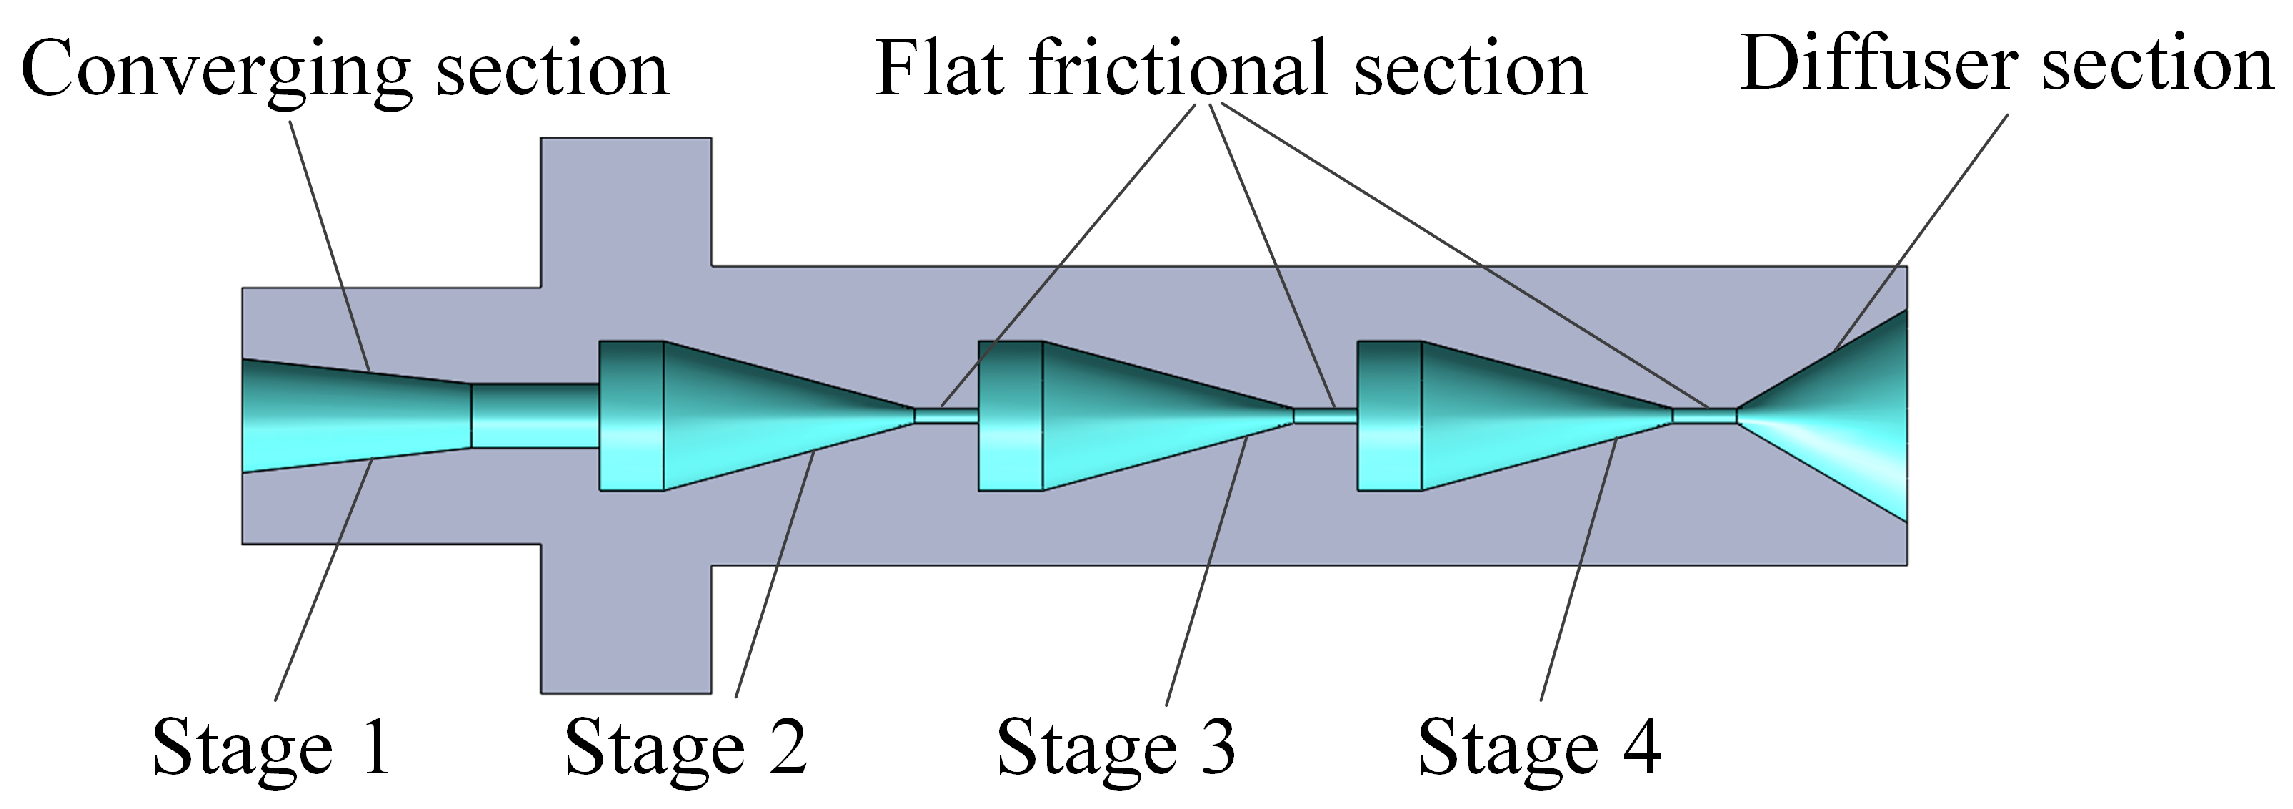
Figure 1. Internal channel geometry of the series-connected cavitating jet nozzle with friction-shear effects (CJN-FSE).
Applsci 15 10992 g001
Figure 2. Cavitating jet visualization test system: (a) Schematic diagram of the visualization system; (b) Physical prototype of the visualization system.
Applsci 15 10992 g002
Figure 3. Time-resolved evolution of the cavitating jet at 20 MPa jet pressure. The labeled A, B, C, and D in the figure are all newly generated cavitation clouds.
Applsci 15 10992 g003
Figure 4. Cavitation clouds under varying jet pressures: (a) Time-averaged grayscale images; (b) Contour maps of time-averaged grayscale.
Applsci 15 10992 g004
Figure 5. Variation curves of cavitation cloud dimensions versus jet pressure. Data points represent the mean values from three independent repeated tests (n = 3), and error bars indicate the standard deviation (SD).
Applsci 15 10992 g005
Figure 6. Contour curve of the cavitation cloud and its double logarithmic plot for box-counting dimension calculation at 35 MPa jet pressure: (a) Contour curve of the cavitation cloud, (b) Double logarithmic plot for box-counting dimension.
Applsci 15 10992 g006
Figure 7. Variation curve of the mean box-counting dimension of the cavitation cloud contour versus jet pressure.
Applsci 15 10992 g007
Figure 8. Grayscale images of cavitation clouds under varying jet pressures: (a) 15 MPa; (b) 20 MPa; (c) 25 MPa; (d) 30 MPa; (e) 35 MPa. The red line segments designate the shedding positions of the cavitation clouds, while the blue dashed line represents the characteristic plane of cavitation cloud shedding.
Applsci 15 10992 g008
Figure 9. Variation curve of average shedding distance versus jet pressure. Data points represent the mean values from three independent repeated tests (n = 3), and error bars indicate the standard deviation (SD).
Applsci 15 10992 g009
Figure 10. FDM maps of cavitation clouds under varying jet pressures: (a) 15 MPa; (b) 20 MPa; (c) 25 MPa; (d) 30 MPa; (e) 35 MPa.
Applsci 15 10992 g010
Figure 11. Dominant grayscale frequency along the jet centerline at 15 MPa jet pressure.
Applsci 15 10992 g011
Figure 12. Grayscale frequency-domain diagrams at the shedding location of the jet centerline: (a) 15 MPa; (b) 20 MPa; (c) 25 MPa; (d) 30 MPa; (e) 35 MPa; (f) Variation of cavitation cloud shedding frequency with jet pressure.
Applsci 15 10992 g012
Table 1. Operation parameters under different jet pressures.
pj (MPa)Q (L/s)Reσ
150.1581.860 × 1050.333 × 10−3
200.1822.143 × 1050.250 × 10−3
250.2042.402 × 1050.200 × 10−3
300.2232.626 × 1050.167 × 10−3
350.2412.838 × 1050.143 × 10−3
Table 2. Statistical values of the box-counting dimension for the cavitation cloud contour under different jet pressures.
pj (MPa)DFmeanSDR2meann
151.02870.02430.99541000
201.05550.02580.99751000
251.06920.02020.99831000
301.07250.02080.99801000
351.07440.01960.99671000
Table 3. Cavitation cloud shedding frequencies and 95% confidence intervals under different jet pressures.
pj (MPa)Dominant Frequency (Hz)95% Confidence Interval (Hz)
1513601359.02–1360.98
2013001299.02–1300.98
2512851283.88–1286.12
3011651163.68–1166.32
35640638.92–641.08
Disclaimer/Publisher’s Note: The statements, opinions and data contained in all publications are solely those of the individual author(s) and contributor(s) and not of MDPI and/or the editor(s). MDPI and/or the editor(s) disclaim responsibility for any injury to people or property resulting from any ideas, methods, instructions or products referred to in the content.