Article

Decision-Making for Product Form Image Based on ET-EEG Technology

1
College of Mechatronic Engineering, North Minzu University, Yinchuan 750021, China
2
School of Architecture and Art Design, Lanzhou University of Technology, Lanzhou 730050, China
3
School of Mechanical and Electrical Engineering, Lanzhou University of Technology, Lanzhou 730050, China
*
Authors to whom correspondence should be addressed.
Appl. Sci. 2025, 15(20), 10979; https://doi.org/10.3390/app152010979
Submission received: 30 August 2025 / Revised: 3 October 2025 / Accepted: 7 October 2025 / Published: 13 October 2025

Abstract

The use of neurophysiological data to acquire product image avoids the inherent subjectivity in the empirical design process. In this paper, we use eye tracking–electroencephalography (ET-EEG) to study mapping among user behaviour, eye movements, EEG features and image decisions in the process of product form cognition. First, we designed an ET-EEG experiment using hair dryer stimuli, with morphology rated on a Likert scale. Then, ET-EEG data were categorized according to image category: “unambiguous (matching)”, “unambiguous (mismatching)”, “ambiguous (positive)”, or “ambiguous (negative)”. Finally, the behavioural data, eye movement indicators, and event-related potentials (ERPs) were analysed to parse the cognitive features. The behavioural, ET and ERP data were highly consistent, and their values increased as the cognition resources devoted to decision-making increased. ET-EEG physiological data thus objectively and effectively reflected users’ image cognition of products, providing theoretical support for design research on the origin of cognition.

1. Introduction

Kansei engineering involves the mapping of human perceptions of objects [1], constructed by feedback regarding thoughts and emotions related to the product [2]. Visual aspects of products (e.g, colour, morphology and other visual elements) are first processed in perceptual regions of the brain during image acquisition, which is followed by image cognition and image evaluation of the product. The user’s Kansei values serve as key data that determine subsequent design work [3]. To improve design accuracy, it is necessary to ensure the validity and accuracy of product image evaluation data as much as possible in the image acquisition stage. Currently, user image studies mainly utilize the explicit measurement method (EMM) and implicit measurement method (IMM) to obtain product image values [4]. The former consists of subjective psychometric methods used to obtain the user’s image cognition of the product [5], while the latter obtains image values indirectly through objective physiological data such as electroencephalography (EEG) signals [6], eye movements [7], and blood oxygen content [8].
Psychometric methods mainly involve situational interviews [9], questionnaires [10], and semantic differences used to obtain user image evaluations of products through their subjective and controllable conscious behaviours [11], such as language, actions, and facial expressions. For example, Zhang et al. [12] applied the expert interview method and KJ method to obtain a representative product and adjectives related to Audi A4L car headlights in a multicriteria decision-making study of product form. Cheng et al. [13] used the semantic difference method to obtain a representative product and adjectives related to electric vehicles. Zeng et al. [14] used a subjective evaluation method to obtain a representative product and adjectives related to vases. However, experts are not the end users; therefore, their evaluation of the product cannot accurately reflect the real needs of users. Additionally, explicit behaviours observed after subjective processing are easily influenced by factors such as life experience and educational background, resulting in the inability to represent users’ potential assessments and affecting the accuracy of subjective psychometric results truly and accurately.
In recent years, research on the use of physiological features for design decision-making has been fruitful. Physiological data reflect users’ unconscious and involuntary behaviours [15], and researchers can assess product image acquisition by measuring and analysing subjects’ physiological data [16].
Of external information available to people, 80% is visual input [17]; visual stimuli undergo substantial processing in the brain. Therefore, eye tracking data are an effective reflection of user cognition. Ho et al. [18] assessed the emotional valence of products according to changes in pupil diameter, with positive and neutral product images evoking greater pupil dilation than negative product images. Li et al. [19] applied a psychological perspective, collecting data on four eye movement indicators, including the latency and duration of the first fixation, total fixation count, and average pupil diameter; these indicators were weighted with the comprehensive weighting method to obtain user evaluations. Qu et al. [20] found that subjects had an increased number of fixations, longer fixation durations and larger pupil diameters for pleasant and neutral products than for unpleasant products. Compared to men, women had larger pupil diameters when viewing pleasant and neutral products and smaller pupil diameters when viewing unpleasant product images. Wang et al. [21] eye tracking was used to collect eye movement data from designers reading task-related text and sketching; designer experience was directly proportional to the number, characteristics, and durations of regressions (looking backwards in the text) as well as the quality of the sketch and inversely proportional to the working time and evaluation accuracy.
EEG reflects the neural activity of the cerebral cortex, and its high temporal resolution has ensured its widespread use in the field of cognitive science. Zhou et al. [22] proposed an emotion analysis model based on long short-term memory (LSTM) and EEG and applied it to parametric design. Marina et al. [23] to evaluate user food preference, a product perception method based on EEG was proposed in the transmodal taste–vision task. Zhang et al. [24] objectively evaluated the appearance design of two charging piles from the user’s point of view using EEG with the help of multiple fractal detrended fluctuation analysis (MF-DFA) method. Yang et al. [25] behavioural and EEG data were used to examine the influence of product appearance features and familiarity on product recognition. Product colour features with low and high familiarity, shape features with low familiarity and material features with high familiarity improved product recognition.
There are drawbacks to using ET or EEG techniques individually to study a user’s underlying cognitive behavior. Although the eye movement index can speculate the cognitive process of users to a certain extent, there is still a certain degree of ambiguity that cannot truly reflect the cognitive processing of users. Although EEG technology can be a good solution to this problem, it is rarely so applied. Since ET and EEG data are individually unable to detect abnormalities, a combination of the two (ET-EEG data) can be used to explore the implicit processing of Kansei cognition [26]. For example, Zhu et al. [27] proposed a product evaluation method based on the fusion of ET and EEG to reduce the subjectivity of product evaluation and improve the reliability of product evaluation using a spatiotemporal neural network and fuzzy system. Wang et al. [28] design decisions were predicted by studying the relationships of design decisions with subject eye movement and EEG data. The results showed that the integration of eye movement and EEG data better fit the expert decision results. Guo et al. [29] the visual aesthetics of the table lamp were quantified by combining EEG and ET data. Yang et al. [30] analysis of the product form design elements and users’ Kansei cognition led to the proposal of a product Kansei image prediction model based on EEG and ET physiological indices.
Based on these findings, the combined application of eye tracking and EEG provides an effective paradigm for objectively capturing users’ perceptual imagery of products through multimodal data fusion, significantly reducing subjective and empirical biases in design evaluation [31]. These studies robustly confirm the predictive validity of ET-EEG physiological features for outcome variables such as design decision prediction, aesthetic quantification, and image modeling. However, current research focus remains predominantly on correlating physiological signals with design outcomes, while systematic empirical investigation into the underlying cognitive mechanisms of Kansei imagery formation remains scarce. In this paper, we used the ET-EEG technique to investigate the relationships among subject behaviours, eye movement features, EEG features and product image decisions when viewing product images. The aims were as follows: to explore user behaviour, visual processing and processing rules during image decision-making; to provide scientific support for developing products that meet user image needs; and to obtain evaluations of product images through objective physiological data.
The outline of this study is as follows:
(1)
Four conditions were generated for product image decision-making: unambiguous stimuli (a matching/mismatching for the Kansei adjective) [32] and ambiguous stimuli (associated with the positive/negative word in an adjective pair) [33]. The stimuli were classified by a subjective evaluation method.
(2)
The ET-EEG technique was used to collect behavioural, eye movement, and ERP data in the four conditions and to quantify the relationships among behavioural data, eye movement data, ERP data and image cognition.
(3)
The processing rules of user behaviour, visual perception and cognition during image decision-making were discussed in detail.

2. Product Image Evaluation Experiment

The hairdryer was selected as the research vehicle in this experiment based on the following considerations. First, as a small household appliance frequently used in daily life, participants possess high familiarity with hairdryers, which facilitates rapid and accurate form evaluations during the experiment. Second, hairdryers exhibit distinct form features and high recognizability, and their design language can convey clear form imagery, thereby supporting effective collection of imagery perceptual data. Furthermore, hairdryer casings are typically made of a single material, which minimizes interference from material factors in morphological imagery judgments. Additionally, their functional structure is relatively simple, helping to avoid complications in imagery perception caused by functional complexity. Finally, as a representative small household appliance, hairdryers share many common characteristics with products in this category, enhancing the representativeness and generalizability of the study’s findings.
In this study, a hair dryer was used as the stimulus to construct the image space according to the Kansei evaluation of the product. Based on the behavioural data, eye movement data and EEG data of the subjects in the ET-EEG experiment, the decision-making behaviour of subjects in the image matching process was analysed. The relationships of objective data (such as decision latency, fixation count, pupil diameter, and P300 and N400 amplitudes) with product image decisions were studied under different conditions.

2.1. Construction of Kansei Image Space

Product imagery is the user’s direct association of product features, is a reproduction of the user’s cognitive experience, the product form imagery originates from the human cognition of the product form. Different form of hair dryers brings different emotional experiences to users, we collect adjectives describing the form imagery of hair dryers through multiple channels such as the Internet, advertisements, magazines, etc., to build a vocabulary database of the form imagery of the products, and then statistically screen out the representative image words after user evaluation and scoring.
We searched for adjectives to describe hair dryers and obtained 68 adjectives. To reduce the spatial dimension of the imagery and screen out the imagery words that are not related to the description of the hairdryer’s form, two doctors in industrial design and four masters in product design were invited to screen the 68 adjectives twice; First, adjectives unrelated to form description (e.g., those describing brand, material, or function) were removed, followed by the elimination of semantically redundant or ambiguous adjectives; 20 adjectives with strong correlations to the shape of a hair dryer were obtained. The similarity of these 20 adjectives was investigated with a 5-point Likert scale. Twenty similarity questionnaires were collected, and SPSS19 was used for K-means clustering. Avoiding the extremes of a single group or an excessive number of groups, the classification achieved better results with 4–8 categories of adjectives. The number of categories was set at 4 because high dimensionality of adjectives would lead to overly complex subsequent physiological experiments [34]. Four representative terms were obtained using this K-means clustering as follows: “cute”, “fashionable”, “comfortable”, and “simple”. The antonym pairs of the representative words (“dull–cute”, “traditional–fashionable”, “stiff–comfortable”, and “complicated–simple”) were used as the target word pairs in the image space. The clustering results are shown in Table 1.

2.2. Experimental Stimulus Collection and Image Semantic Evaluation

From the internet, e-commerce platforms and other locations, 198 pictures of hair dryers were obtained. In the initial screening process, which involved the removal of similar shapes of hair dryers and blurred images, 100 stimuli were obtained. To ensure the accuracy of the experiment and remove the influence of irrelevant factors, the logo was removed from all stimuli, images were converted to greyscale, and the size, background and resolution of all stimuli were standardized. Two individuals with industrial design doctorates and three individuals with a Master of Arts were invited to screen the stimuli again, and 50 representative stimuli were identified based on form similarity, as shown in Figure 1. An image survey using a 5-level Likert scale (−2, −1, 0, 1, and 2) to evaluate each hair dryer stimulus was distributed online. A total of 40 subjects participated in the survey, all of whom were graduate students in product design. The survey data provided the image evaluation value for each hair dryer stimulus (see Table 2).

2.3. Experimental Design

In this experiment, “dull–cute”, “traditional–fashionable”, “stiff–comfortable”, and “complicated–simple” were used as the four dimensions of the product image space, and subjects evaluated each image of a hair dryer. The match between the stimulus and the given adjective was used to divide stimuli into four conditions: unambiguous images (matching or mismatching with the adjective) and ambiguous images (aligning with the positive or negative words in an adjective pair). By analysing the behavioural data, eye movement data and EEG data of subjects in different conditions, we explored the behavioural, perceptual and cognitive processing patterns of users during decision-making processes.

2.3.1. Experimental Materials

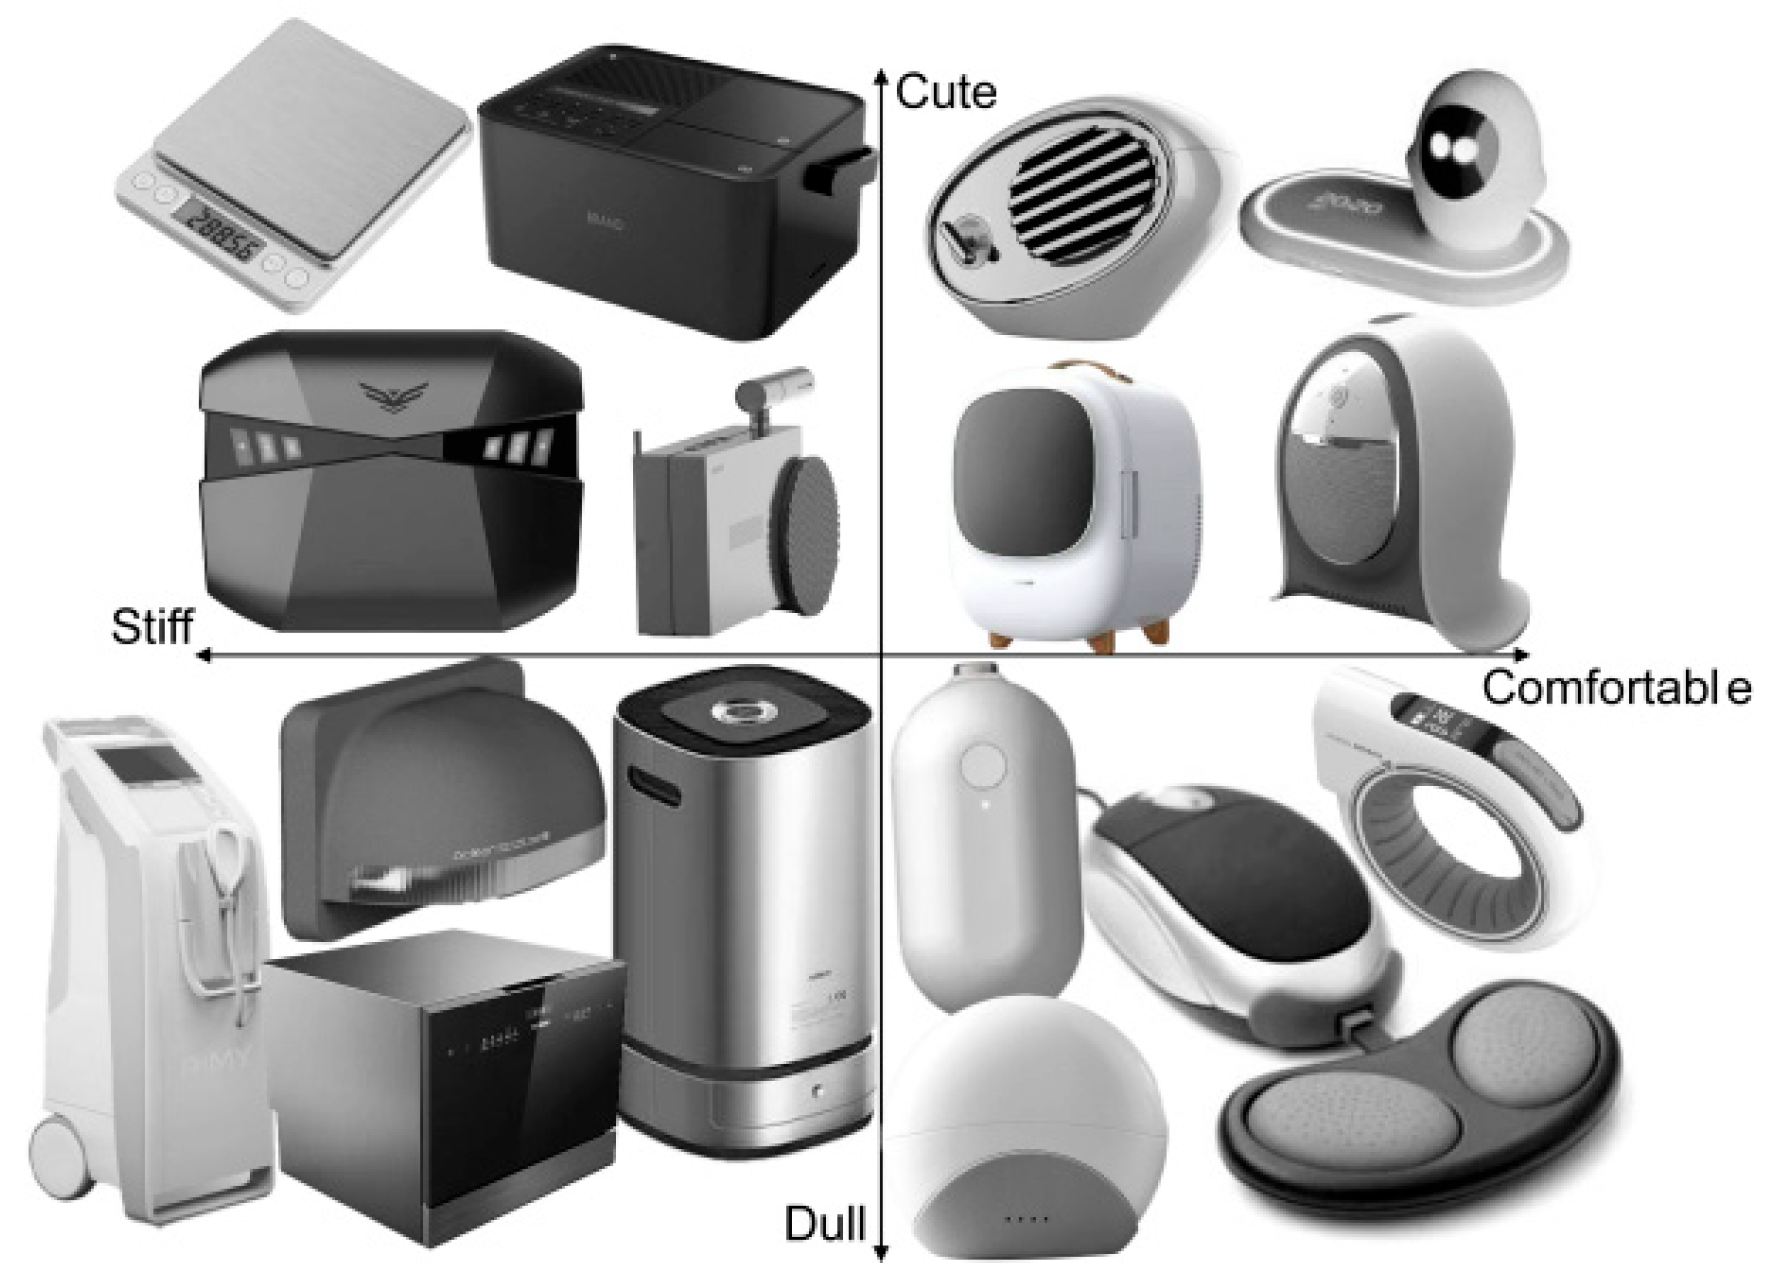
In the ET-EEG experiment, each pair of adjectives was matched to 15 hair dryer stimuli. For example, in the “dull–cute” dimension, based on the Kansei image evaluation of the 50 hairdryer stimuli in Table 2, five stimuli each representing extreme dullness, neutral, and extreme cuteness values were selected. The experiments were conducted using a “priming stimulus” and “target stimulus” paradigm [35]. Four pairs of adjectives were used as the priming stimuli, and a hair dryer stimulus was used as the target stimuli. To reduce individual subjective differences and increase experimental accuracy, product image boards [36] were designed to guide subjects. A representative image board is shown in Figure 2.

2.3.2. Experimental Subjects

A total of 30 design graduate students and 2 design undergraduates were recruited to participate in this experiment. There were equal numbers of males and females; subjects were 19–28 years old, and all were right-handed. All subjects were in good health, had no history of mental or neurological disorders and were able to clearly see the experimental stimuli presented on a screen. The experimental procedure was explained to subjects before the experiment, and all subjects signed an informed consent form before participating.

2.3.3. Experimental Equipment

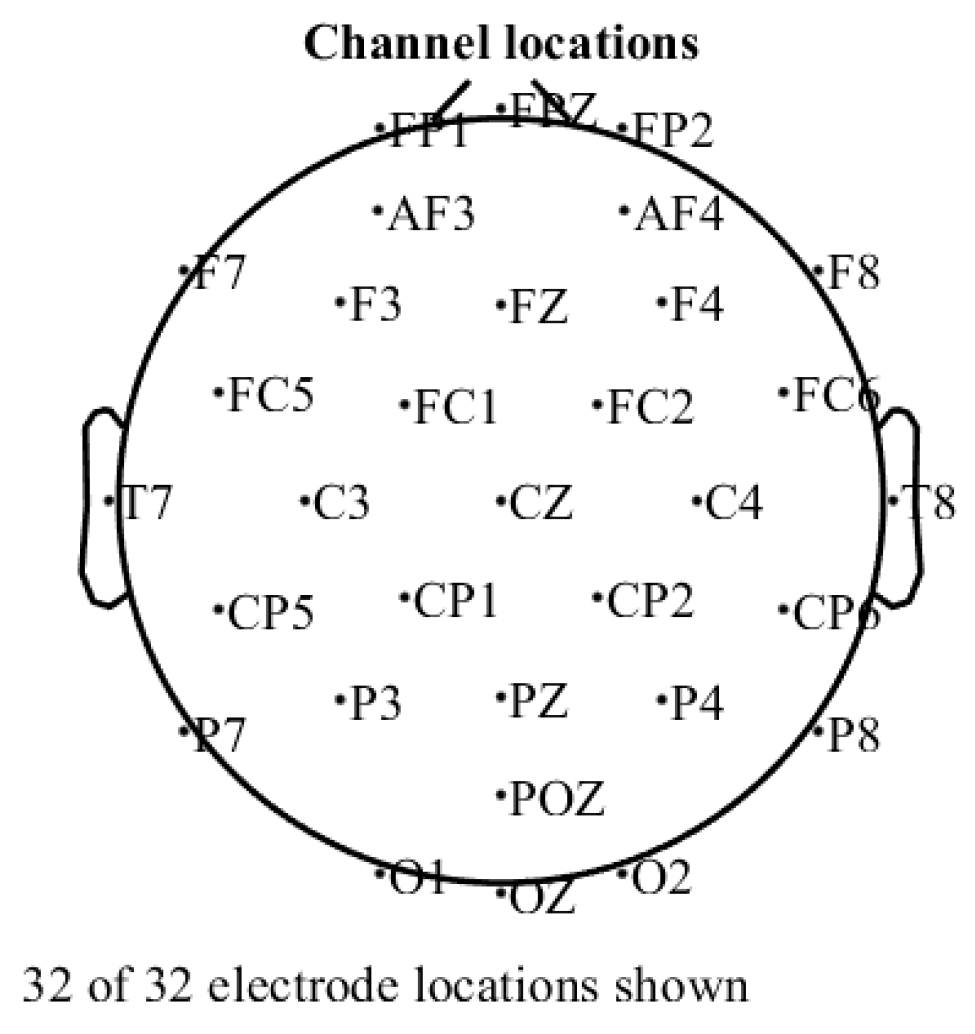
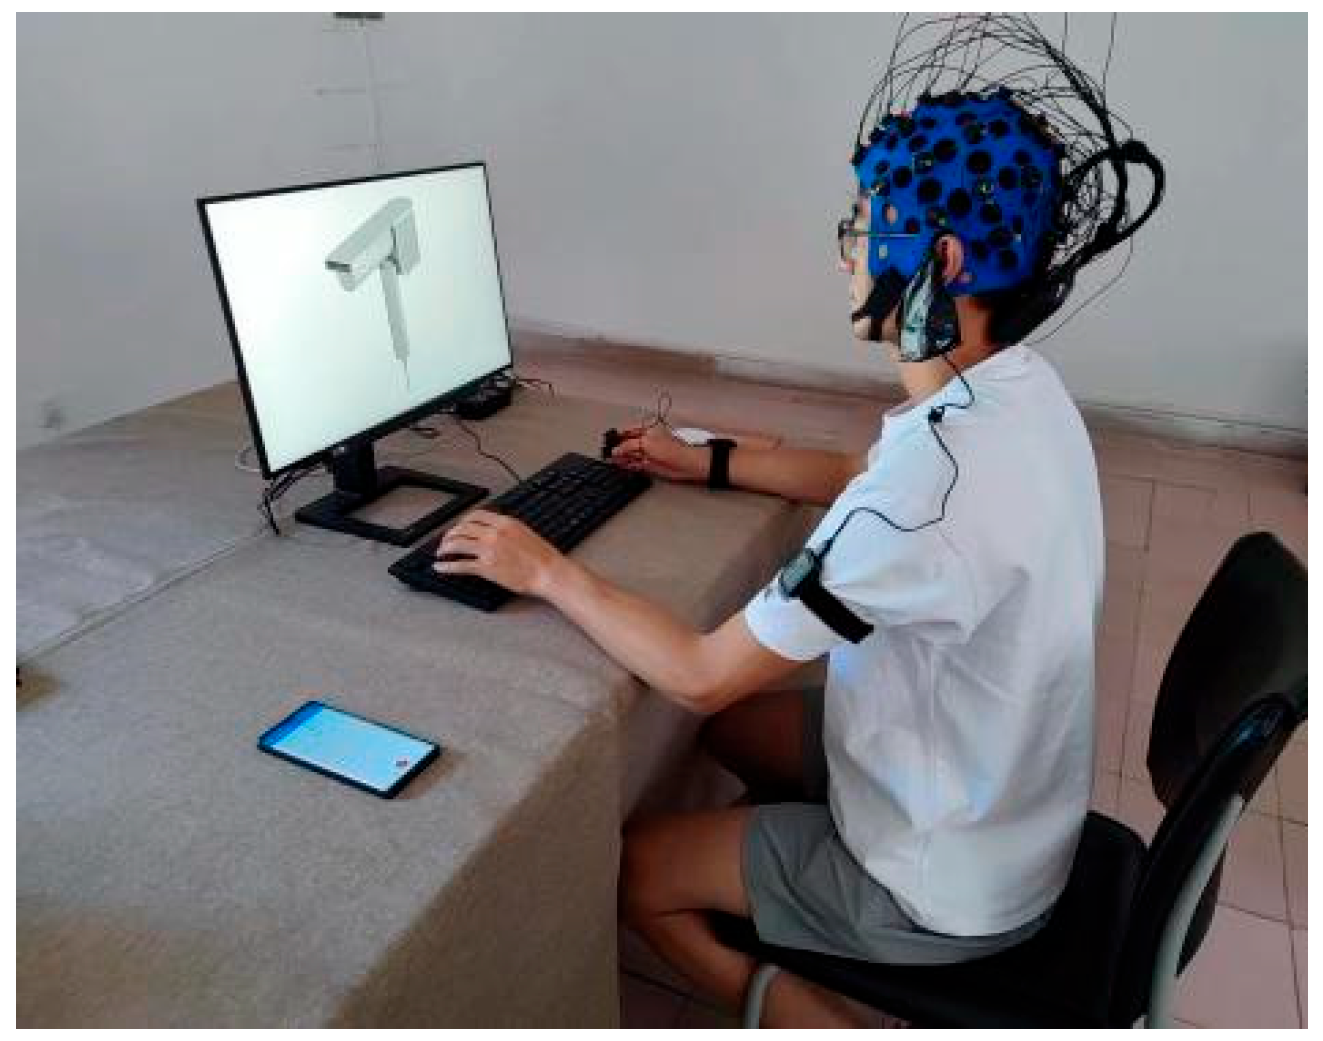
The experiment utilized the ErgoLAB V3.0 human-machine environment test platform (developed by the Kingfar technology company, Beijing, China), and the Tobii (Stockholm, Sweeden) Pro Fusion 250 Hz eye-tracking device. EEG data were collected by a 32-channel BitBrain (Zaragoza, Spain) semi-dry EEG system, with a highest sampling rate of 1000 Hz per lead, and electrodes were arranged according to the international 10–20 system. The electrode arrangement is shown in Figure 3. A CPU (E5-2678V3) with a graphics card (RTX3090 24G) was used to collect and process the data. Stimuli were presented on a PHL242E2F (1920 × 1080) display. The eye tracker was mounted on the lower edge of the monitor frame, with subjects’ eyes positioned at an average distance of 70 cm from the device. The experiment was conducted in a quiet laboratory featuring soft lighting, comfortable temperature, and no noise interference. The experimental scenario is shown in Figure 4.

2.3.4. Experimental Process

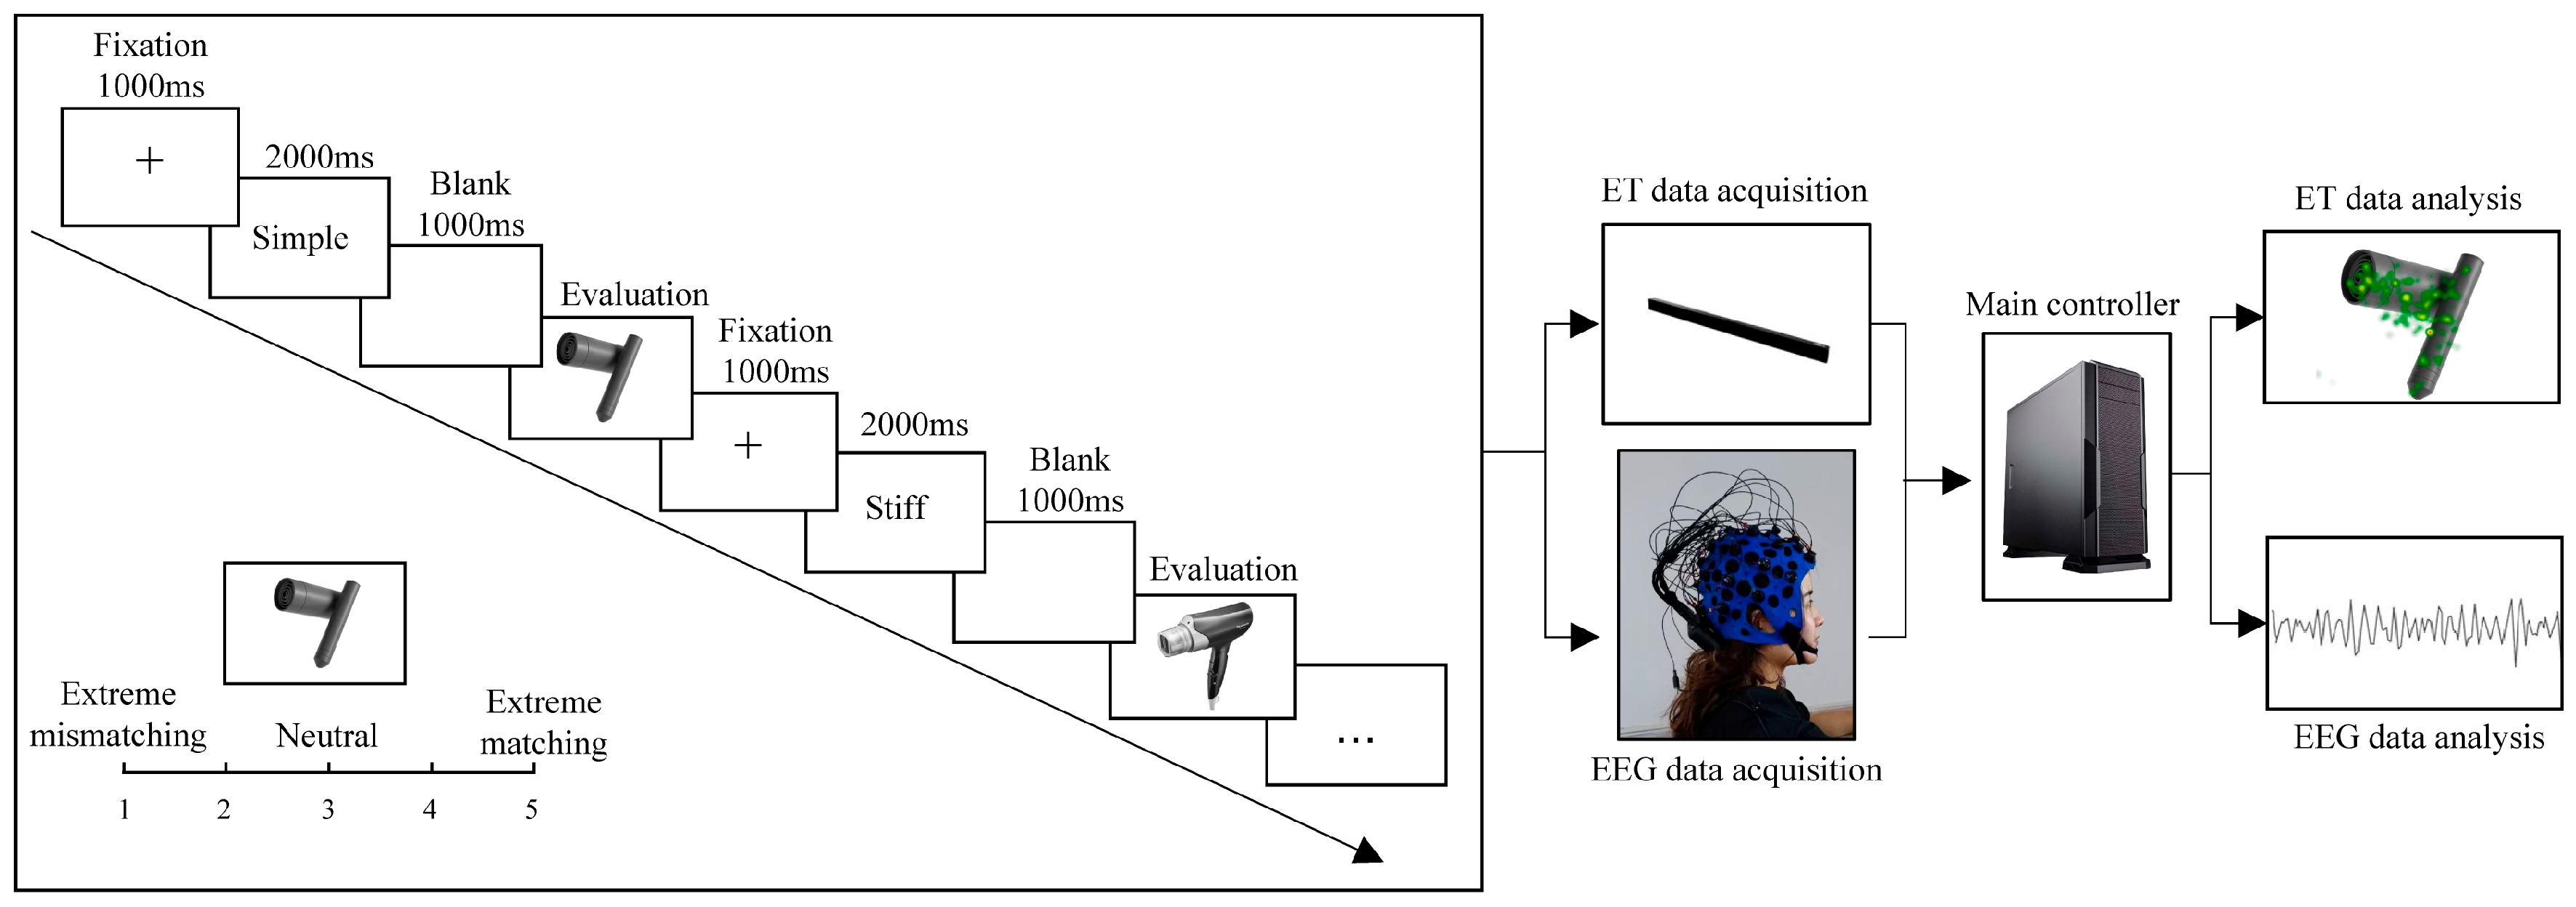
Prior to the experiment, subjects donned EEG caps, and the eye-tracking equipment was calibrated. If the experiment is interrupted, recalibration is required. To minimize experimental errors caused by subject movement, subjects should minimize body movement during the experiment. To reduce experimental error due to individual subjective perceptions of the adjectives, subjects viewed the image boards before the experiment. Before the pre-experiment, the subjects were instructed to sit and meditate with their eyes closed for 5 min. After this meditation, the screen introduced the experiment, including the experimental paradigm and precautions. Subjects started the experiment after fully understanding the experimental content. In the pre-experiment, subjects were familiarized with the experimental process to ensure the smooth operation of the formal experiment. The formal experimental procedure was the same as the pre-experiment. The specific procedure was as follows: first, a fixation cross was presented in the centre of the screen for 1000 milliseconds. Subsequently, priming adjectives were presented for 2000 milliseconds. Finally, the target stimulus was presented (Randomly presented). The time elapsed between presentation and input of the subject decision was defined as the decision latency. Subjects indicated their image judgment as follows: 1, extreme mismatching; 2, mismatching; 3, neutral; 4, matching; and 5, extreme matching. Subjects pressed the corresponding number on the keyboard. After their decision was entered, the next trial began. Each stimulus in the experiment was assessed once for each of the adjective pairs for a total of 5 × 3 × 2 × 4 = 120 trials. To ensure the accuracy of the experiment and prevent errors caused by subject fatigue, a 3-min break was provided after 60 trials were performed. The entire experiment lasted 23 min. The experimental procedure is shown in Figure 5.

3. Statistical Analysis

3.1. Behavioural Analysis

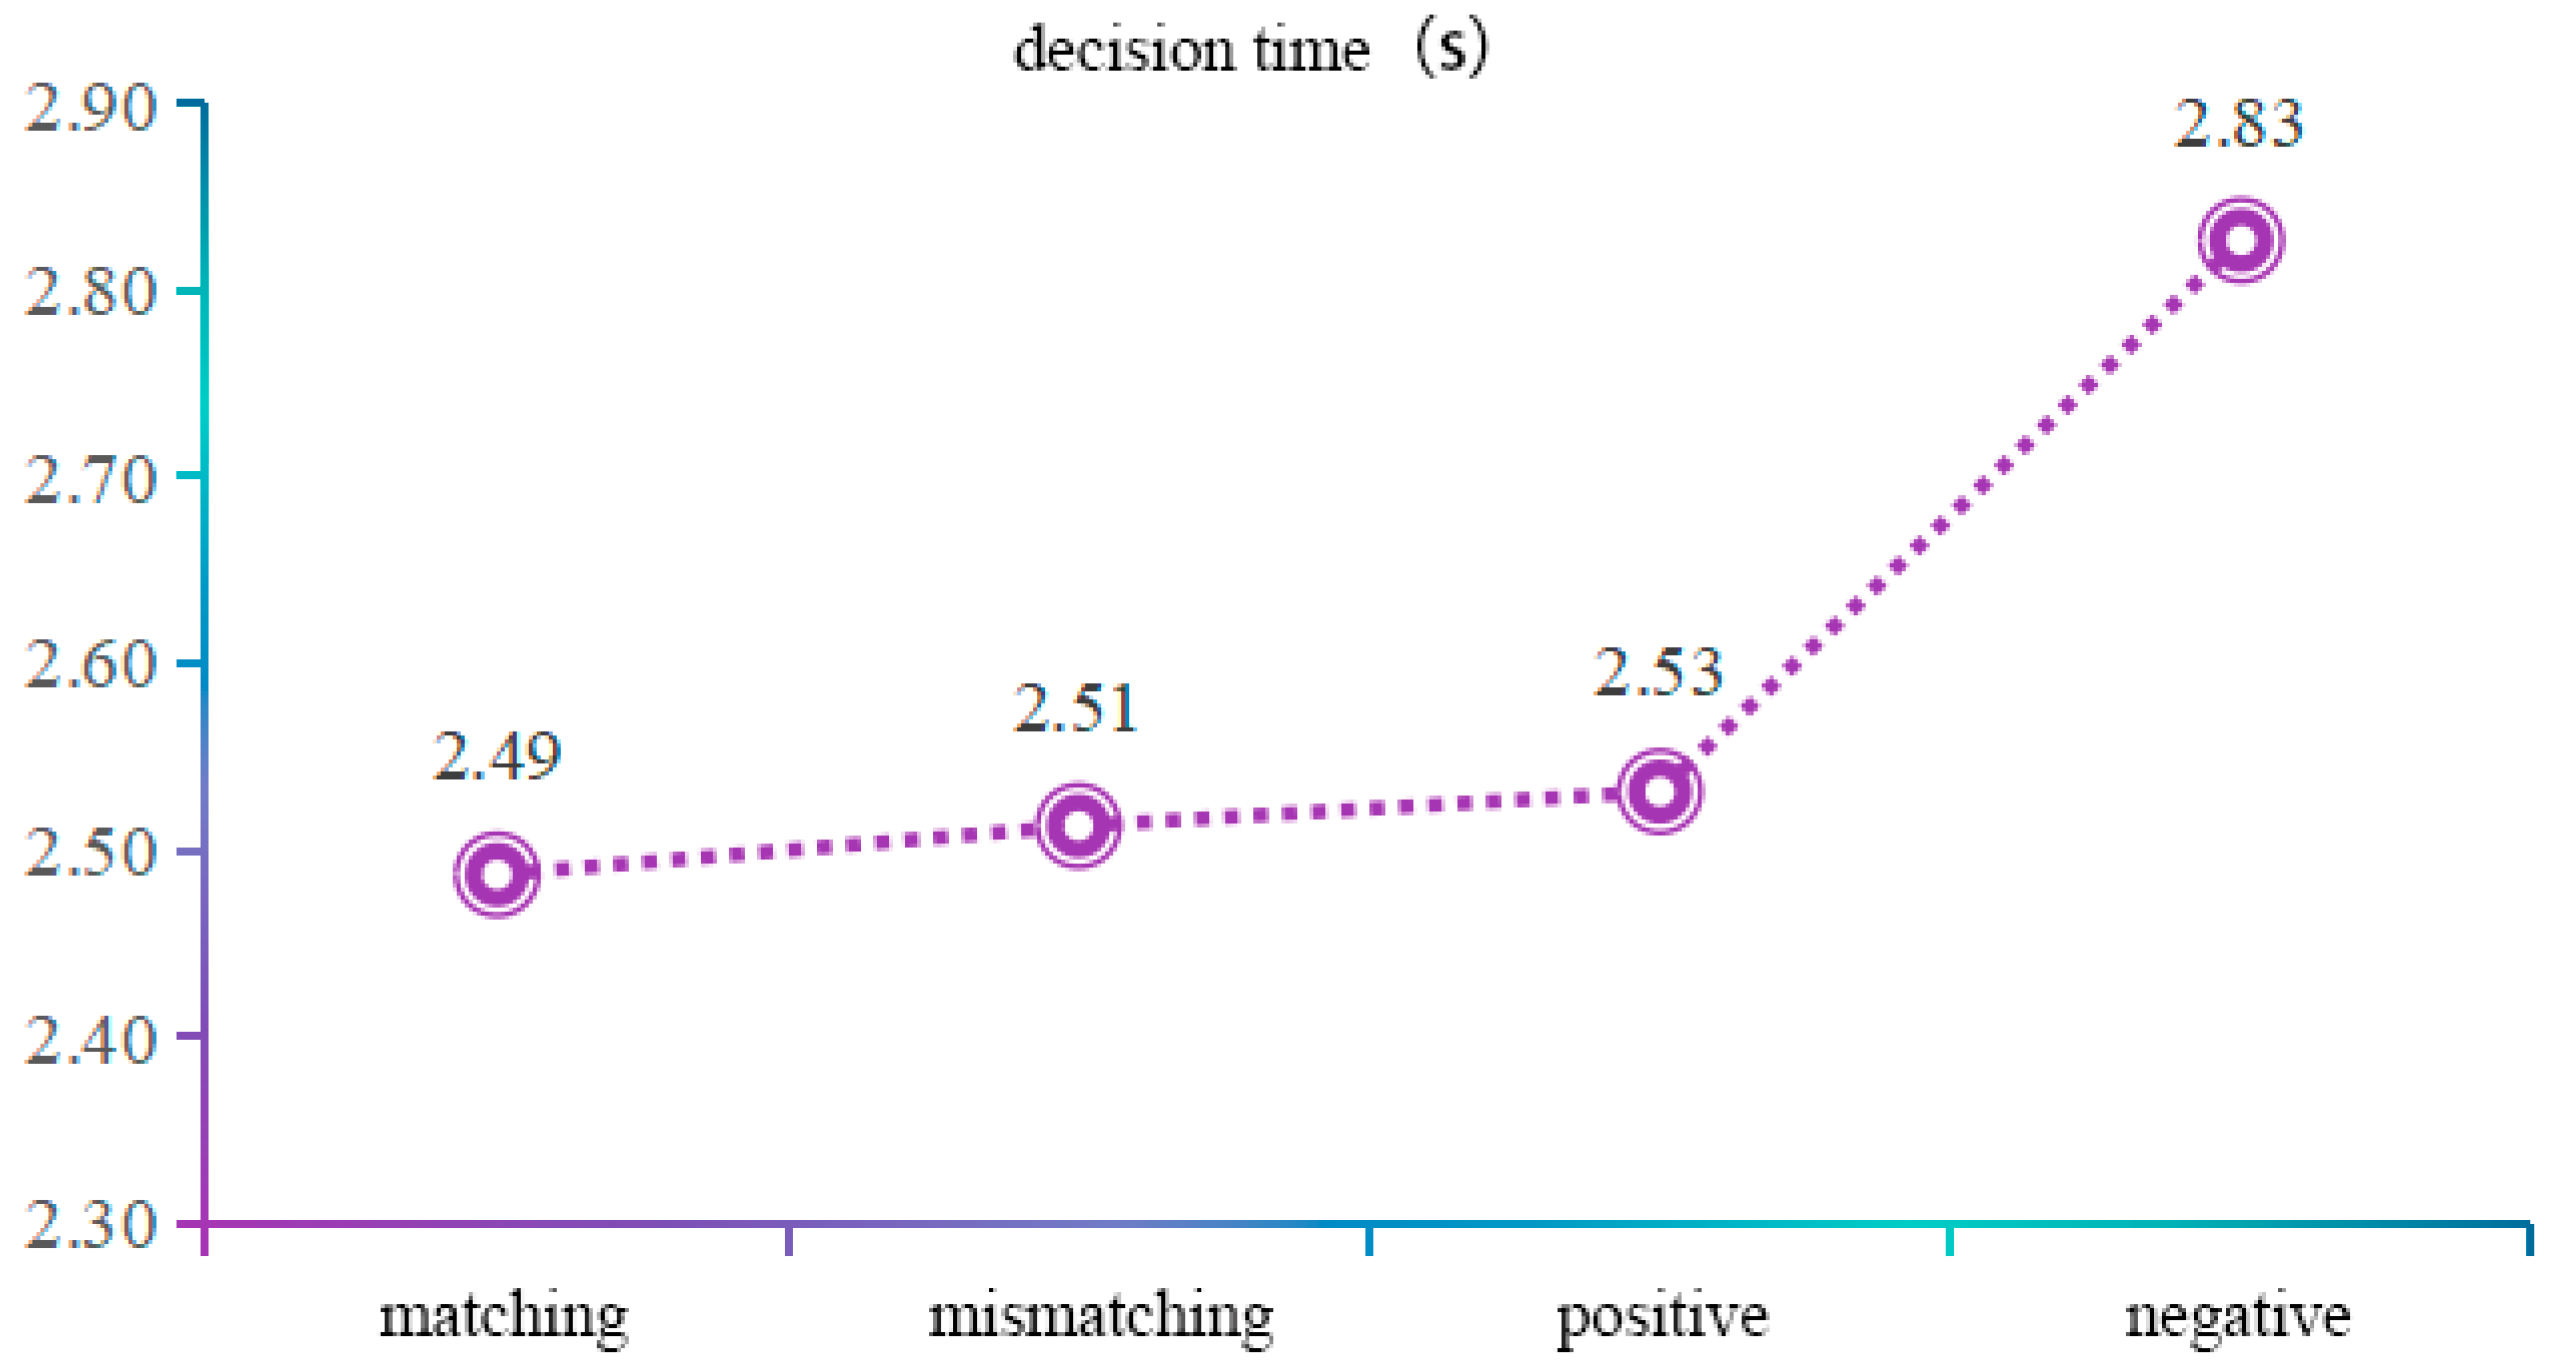
In the experiment, ErgoLAB will record the time required for subjects to make decisions. The decision latency indicated the time between the appearance of the target stimulus and the keyboard response of subjects regarding their decision. It represents the time required for cognitive processing of the subject’s form imagery. One-way ANOVA was conducted on decision latency according to product image evaluation. Decision latency was significantly correlated with product image evaluation F(34, 83) = 1.725, p = 0.023 < 0.05. The decision latency was longer when the stimulus was unambiguous than when the stimulus was ambiguous. Additionally, unambiguous stimuli had longer decision latency when the stimulus was a mismatching compared to when the stimulus was a match. Ambiguous stimuli had a shorter decision latency for positive adjectives than negative adjectives, as shown in Figure 6.

3.2. Eye Movement Feature Extraction

ET technology records eye movements during cognitive processing and thus reflects the subject’s cognitive process. In this paper, a Tobii Pro Fusion 250 Hz eye tracker was used to collect eye movement indexes of subjects during the cognitive decision-making process of product imagery as an index of subjects’ emotional experience induced by product imagery decision-making behaviors. In this study, the ErgoLAB human-machine environment synchronization test cloud platform was used to extract 14 eye movement features. To reduce the effect of gross errors on the experimental data, the Pauta criterion (1) and the discriminant (2) were used to exclude gross errors for all eye movement data [37] as follows:
σ = i = 1 n ( Z ( k ) Z ¯ ) n 1
R n ( k ) = Z ( k ) Z ^
where n is the number of observations, Z ¯ is the arithmetic mean of the observations, σ is the standard deviation of the given parameter, Rn is the residual, and Z ^ is the estimated value of the observations.
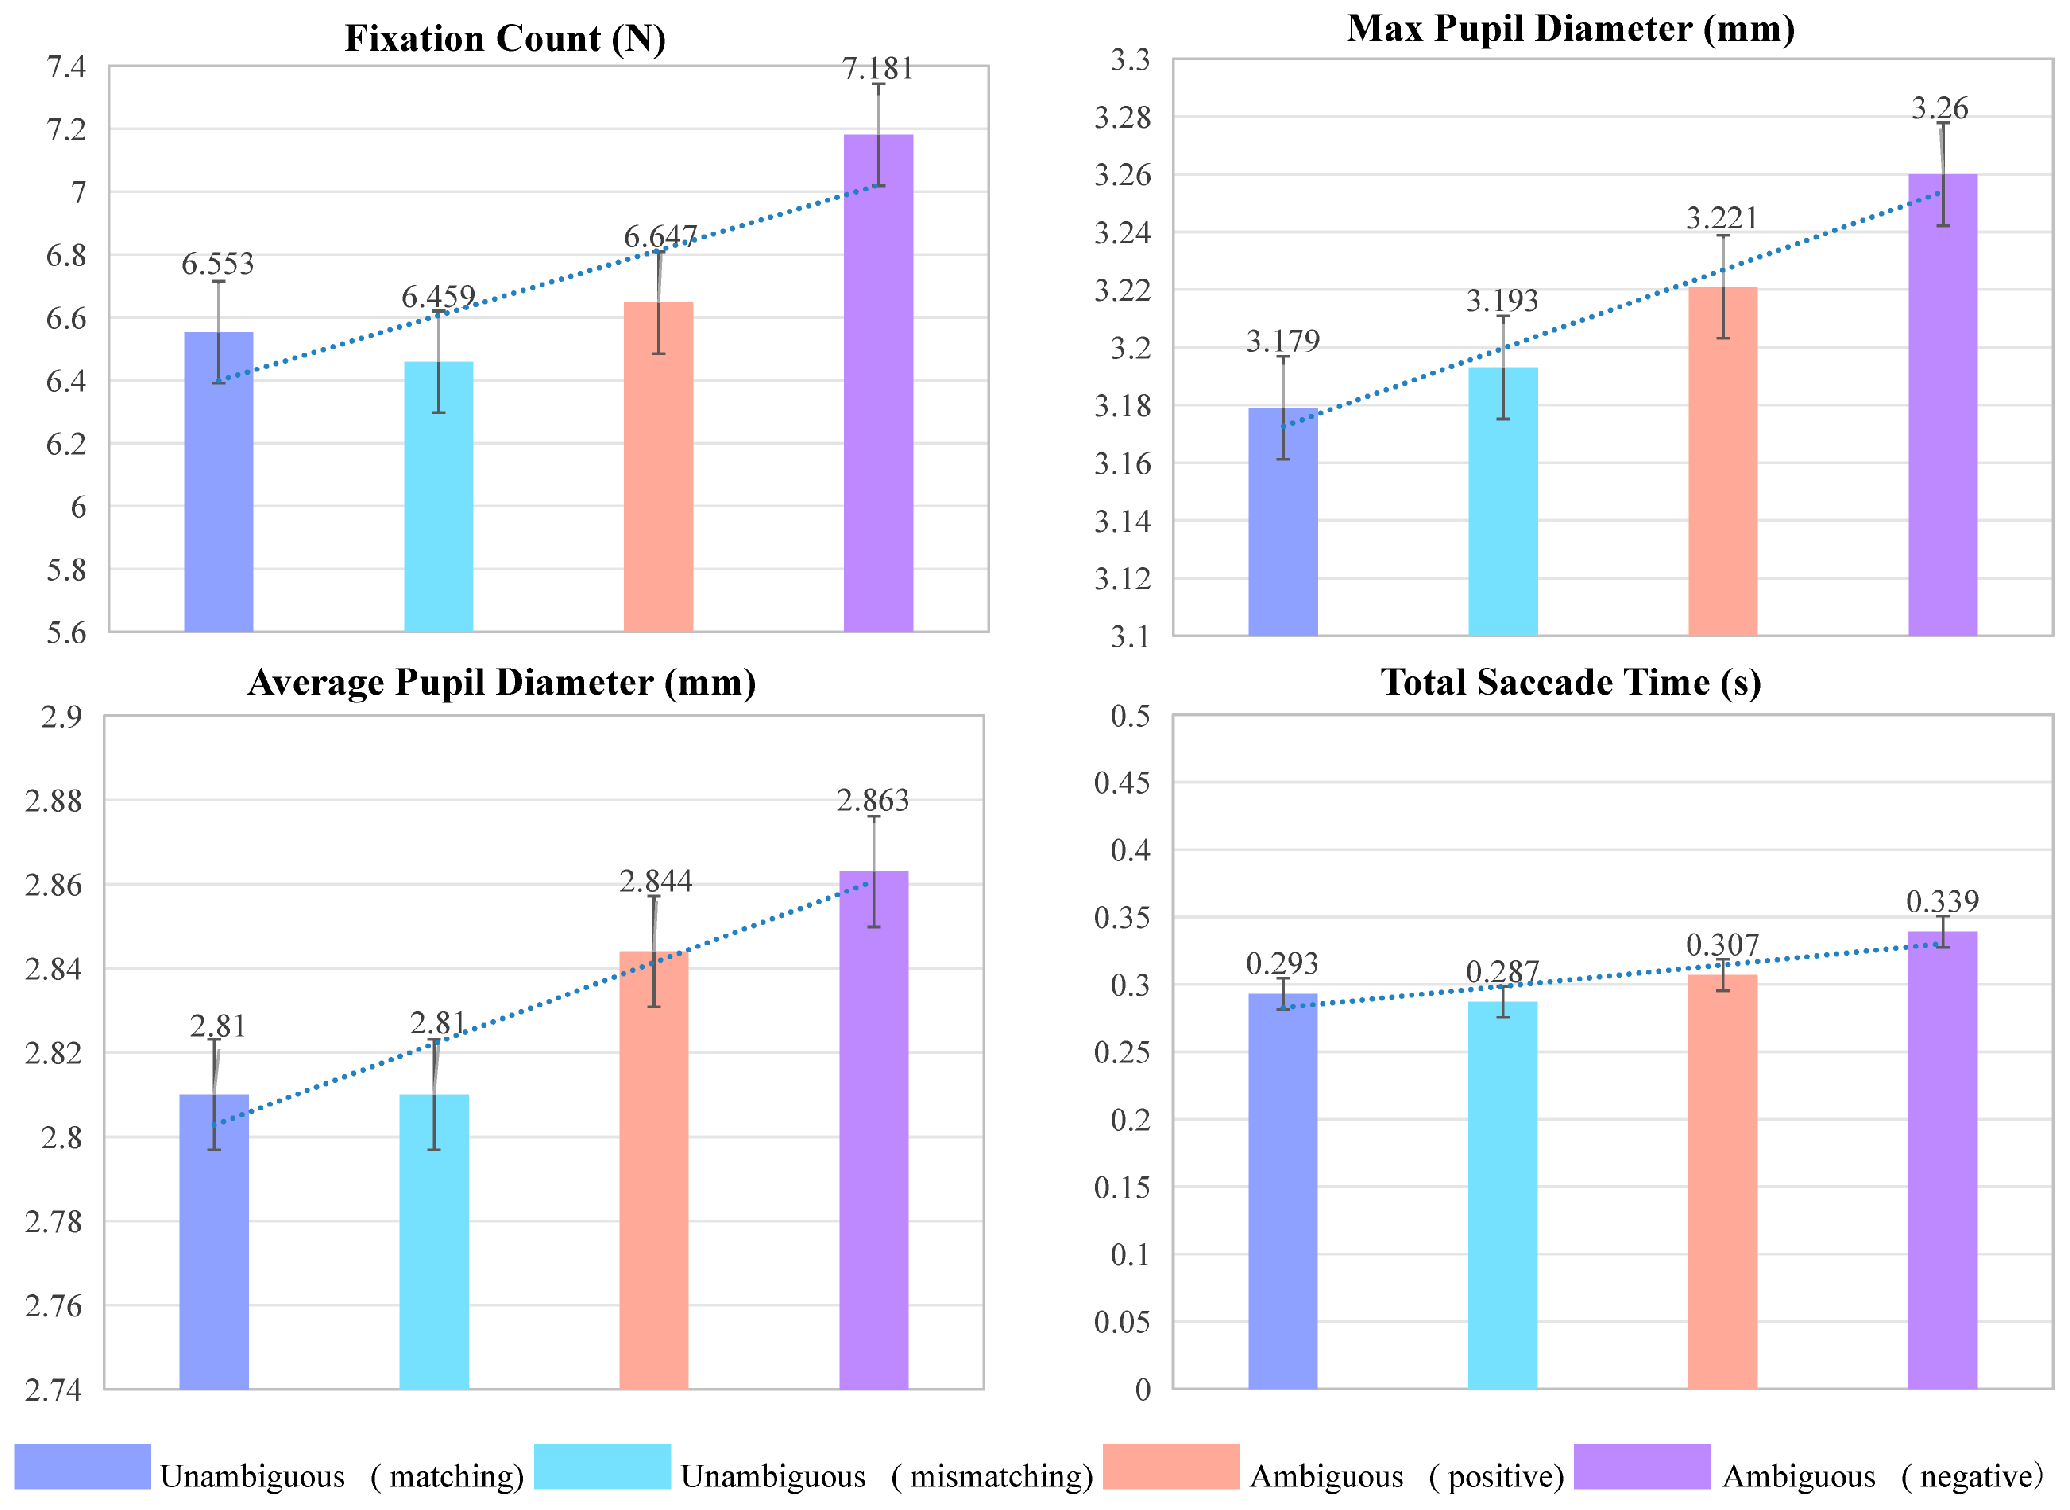
To better reflect user cognition, the eye movement indexes most closely related to product image evaluation were determined. One-way ANOVAs were conducted on the eye movement data according to product image evaluations. Four eye movement indexes (average pupil diameter, maximum pupil diameter, fixation count, and total saccade time) were associated with product image evaluation during the decision latency, as shown in Table 3. There was edge correlation between total saccade time and product image evaluation, p = 0.056. Average pupil diameter, maximum pupil diameter and fixation count were all significantly correlated with product image ratings and thus significantly influenced by affective changes in the subjects.
The eye movement index values in the different conditions are shown in Figure 7. Statistical analysis showed that the values of eye movement indexes were greater when the stimulus was ambiguous than when the stimulus was unambiguous. When the stimulus was ambiguous, associations with the positive adjective led to a lower eye movement index value than associations with the negative adjective. When the stimulus was unambiguous, the fixation count and total saccade time of matching stimuli were greater than those of mismatching stimuli. Although there was no significant difference in average pupil diameter between the matching and mismatching stimuli, the maximum pupil diameter value was greater for the mismatching stimuli.

3.3. EEG Data Extraction

3.3.1. EEG Data Acquisition and Preprocessing

EEG can record scalp potential changes at higher frequencies, thus investigating the features of scalp potentials in different cognitive matching states. EEG data can respond to real-time changes in the EEG signals of a subject after receiving a stimulus, thus characterizing cognitive processing in brain regions. In this paper, BitBrain semi-dry electrode EEG system was used to collect EEG data, and EEGLAB (MATLAB-Based EEG Data Processing Toolbox) was used to pre-process the EEG data. While EEG data were collected from 32 subjects, equipment failure led to lack of acquisition of data from sub001 and sub002. Therefore, EEG data from 30 subjects were preprocessed. The main steps were as follows: selection of the EEG channel, loading of channel locations, application of a bandpass filter, switching of reference electrodes, performance of principal component analysis, removal of artefacts, data segmentation, and baseline correction. The average reference electrode was used in this study, and a bandpass filter of 0.1–30 Hz was applied to remove the influence of main power. Employing ICA to remove artifacts such as eye movements, heartbeat, and eye drift. The time window analysed lasted from 200 ms before target stimulus presentation (defined as 0 ms) to 1000 ms after the appearance of the target stimulus. Thus, 1200 ms of EEG data was subjected to time frequency analysis. Baseline correction involved the selection of data during the period [−200 ms, 0 ms]. The preprocessed EEG data of all subjects were overlaid to obtain the overlay data of individual trials for ERP analysis.

3.3.2. EEG Feature Analysis

Previous studies have found that the P1, N1 and P2 components reflect early cognitive processing and that the N2, P300 and N400 reflect later processing related to judgements and cognitive evaluations of events; therefore, the latter components were selected and analysed in this study to determine product image cognition.
  • N2 component analysis
The N2 component, a negative peak that occurs between 200 ms and 300 ms, under different conditions was analysed by repeated-measures ANOVAs. There was a significant main effect of condition on N2 amplitude [F = 4.356, p = 0.006 < 0.01]; thus, the N2 amplitude was significantly influenced by condition and can be used as an indicator to explore the relationships between EEG responses and product image decisions. Pairwise comparisons of different conditions showed significant differences in N2 amplitude between unambiguous (matching) and ambiguous (positive) stimuli (p = 0<0.05), between unambiguous (matching) and ambiguous (negative) stimuli (p = 0<0.01), and between unambiguous (mismatching) and ambiguous (positive) stimuli (p = 0.01 < 0.05). There was also a significant difference in N2 amplitude between unambiguous (mismatching) stimuli and ambiguous (negative) stimuli (p = 0.013 < 0.05). The difference in N2 amplitude between unambiguous (matching) and unambiguous (mismatching) stimuli (p = 0.912 > 0.05) was not statistically significant. The difference in N2 amplitude between ambiguous (positive) and ambiguous (negative) stimuli (p = 0.071 > 0.05) was not statistically significant.
  • P300 component analysis
Repeated-measures ANOVAs were performed for the P300 component, a positive peaks between 300 ms and 400 ms, according to condition. There was a significant main effect of condition on P300 amplitude [F = 11.393, p = 0 < 0.01]. Therefore, the P300 component can be used as a reference for studying the relationships between EEG data and product image decisions. Pairwise comparisons of conditions revealed that the mean P300 amplitude was significantly different between unambiguous (matching) and ambiguous (positive) stimuli (p = 0 < 0.01), between unambiguous (matching) and ambiguous (negative) stimuli (p = 0.005 < 0.01), and between unambiguous (mismatching) and ambiguous (positive) stimuli (p = 0.001 < 0.01). The mean P300 amplitude did not statistically significantly differ between matching and mismatching conditions for unambiguous stimuli (p = 0.32 > 0.05). When the stimuli were ambiguous, the mean P300 amplitude did not statistically significantly differ between positive and negative stimuli (p = 0.916 > 0.05). The mean P300 amplitude did not statistically significantly differ between unambiguous (mismatching) and ambiguous (negative) stimuli (p = 0.062 > 0.05).
  • N400 component analysis
Repeated-measures ANOVAs were performed for the N400 component, a positive peak between 400 ms and 500 ms, according to condition. There was a significant main effect of condition on N400 amplitude [F = 11.393, p = 0<0.01], indicating that the N400 component can be used as a reference indicator for exploring judgements in each condition. The mean N400 amplitude was significantly different between ambiguous (positive) and unambiguous (matching) stimuli (p = 0<0.01), between ambiguous (positive) and unambiguous (mismatching) stimuli (p = 0<0.01), between ambiguous (negative) and unambiguous (matching) stimuli (p = 0.007 < 0.01), between ambiguous (negative) and unambiguous (mismatching) stimuli (p = 0.018 < 0.05), and between ambiguous (positive) and ambiguous (negative) stimuli (p = 0.019 < 0.05). However, for unambiguous stimuli, there was no statistically significant difference in N400 amplitude between matching and mismatching stimuli (p = 0.734 > 0.05).
To further explore differences in ERPs induced by different conditions, electrodes strongly correlated with the product image were screened by one-way ANOVA, as shown in Table 4. In the table, odd numbers indicate left electrodes, and even numbers indicate right electrodes. The analysis examined ERP amplitudes for unambiguous (matching/mismatching) and ambiguous (positive/negative) stimuli. The ERP waveforms under the two conditions are shown in Figure 8 and Figure 9.
The N2 amplitude in the frontal lobe was significantly correlated with that at the F3 [F(2, 177) = 3.931, p = 0.022 < 0.05], FC5 [F(2, 177) = 3.587, p = 0.031 < 0.05], and FC1 electrodes [F(2, 177) = 6.058, p = 0.003 < 0.01]. For unambiguous stimuli, the N2 amplitude in the matching condition was significantly greater than that in the mismatching condition. For ambiguous stimuli, the N2 amplitude was larger for positive stimuli than for negative stimuli. The P300 amplitude was significantly correlated among electrodes CP5 [F(2, 177) = 8.401, p = 0<0.01], parietal P7 [F(2, 177) = 3.317, p = 0.04 < 0.05] and POZ [F(2, 177) = 3.094, p = 0.049 < 0.05] in the central region. For unambiguous stimuli, the P300 amplitude induced by mismatching was larger than that induced by matching. For ambiguous stimuli, the P300 amplitude induced by positive words was larger than that induced by negative words. The N400 amplitudes in the frontal FP2 [F(2, 177) = 3.481, p = 0.034 < 0.05], AF4 [F(2, 177) = 4.406, p = 0.014 < 0.05], F7 [F(2, 177) = 3.845, p = 0.024 > 0.05], FC1 [F(2, 177) = 4.287, p = 0.016 < 0.05], FC2 [F(2, 177) = 5.587, p = 0.005 < 0.01], central C4 [F(2, 177) = 4.088, p = 0.019 < 0.05], CP2 [F(2, 177) = 5.149, p = 0.007 < 0.01], temporal T8 [F(2, 177) = 6.728, p = 0.002 < 0.01], and parietal P4 electrodes [F(2, 177) = 6.42, p = 0.002 < 0.01] were significantly correlated. For unambiguous stimuli, the N400 amplitude of mismatching stimuli was greater than that of matching stimuli; for ambiguous stimuli, positive word matching elicited a greater amplitude than negative word matching.

4. Discussion

4.1. Relationship Between Behavioural Data and Image Evaluation

For unambiguous stimuli, subjects had shorter decision latency, whereas for ambiguous stimuli, the decision latency was longer due to greater cognitive difficulty. Further study of unambiguous stimuli revealed that the decision latency in the matching condition took longer than that in the mismatching condition, a finding supported by Yang et al. [34]. The results suggest that when stimuli match with adjectives, subjects’ decisions consume less memory resources, product information is transmitted more efficiently, and cognitive processing is smoother. The analysis of ambiguous stimuli revealed that the decision latency was longer for the negative words than the positive words in the adjective pair, which indicates that negative words require more cognitive resources during decision-making than positive words, imposing a greater cognitive load and thereby increasing the difficulty of decision-making.

4.2. Relationship Between Physiological Features and Image Evaluation

4.2.1. Relationship Between Eye Movement Indexes and Image Cognition

The differences in the attraction potency and cognitive load of the stimulus form resulted in significant differences in attention allocation. According to previous studies, the fixation count and total saccade time are correlated with subjects’ information search and cognitive processes [38]. The analysis of mean values of the eye movement indexes in the four conditions showed that when subjects made decisions regarding unambiguous stimuli, the fixation count and total saccade time values were smaller, indicating that the unambiguous stimuli were more easily processed by users. For unambiguous stimuli (matching/mismatching), the fixation count and total saccades time were larger, which indicates that matching of adjectives with stimuli induced greater fixation. For ambiguous stimuli (positive/negative), the fixation count and total saccade time values were smaller when the stimulus was associated with positive words. Associations of positive words with the stimulus could attract subject attention and lead to more efficient information search, and it is consistent with the findings of Li et al. [39].
Pupil diameter is related to the cognitive demands of tasks and is one of the important measures of cognitive load; pupil diameter increases with increasing task demand and resource input [40]. Analysis of pupil diameters showed that pupil diameter was larger for ambiguous stimuli than unambiguous stimuli, and this is consistent with the findings of Henderson et al. in emotional imagery and pupil diameter [41]. When stimuli are ambiguous, the subjects need to allocate more attention to searching for relevant information, which hampers information processing and increases cognitive load, leading to increased pupil diameter. When stimuli were unambiguous, there were no significant differences in average pupil diameter between matching and mismatching conditions; however, the maximum pupil diameter in the mismatching condition was significantly larger than that in the matching condition. This suggests cognitive load during decision-making regarding mismatching stimuli. For ambiguous stimuli, stimuli associated with negative words induced a larger pupil diameter. The association of negative words with the stimulus may have consumed more attentional resources and imposed a greater cognitive load, and the study by Buter et al. supports this result [42]. Therefore, in the design process, we should avoid products whose form is inconsistent with the image.

4.2.2. Relationship Between EEG Features and Image Cognition

The N2 reflects an individual’s early processing of stimuli, is related to visual input, reflects the allocation of attentional resources, and increases in amplitude with increasing difficulty of recognition [43]. By comparing the N2 amplitude induced by unambiguous and ambiguous stimuli, we found that the N2 amplitude increased with increasing decision difficulty. The processing of this information mainly occurred in the left frontal area, with obvious differences between the hemispheres. The results showed that the N2 component reflects the recognition of stimulus information. Ambiguous stimuli lack unambiguous image feature information; therefore, decision-making requires a substantial investment of cognitive resources, which leads to a larger N2 amplitude. Additionally, when the stimulus and associated semantics are contradictory, this generates cognitive conflict reflected by a larger N2 amplitude [44]. Although the N2 component did not differ significantly between unambiguous (matching/mismatching) stimuli in this study, ERP waveforms showed that unambiguous (mismatching) stimuli evoked greater N2 amplitudes than unambiguous (matching) stimuli. There was no significant difference in N2 component between ambiguous (positive/negative) stimuli, but ERP waveforms were stronger for ambiguous (positive) stimuli.
The P300 component is related to psychological factors, and its amplitude is proportional to the cognitive load. The more difficult the decision is and the more complex the stimulus is, the greater the P300 amplitude. This ERP is associated with activities such as decision selection, stimulus discrimination, and object classification [45]. The decision-making process is realized by comparing the stimulus with knowledge stored in the brain. The greater the similarity between the stimulus and memory information, the higher the efficiency of processing. Compared with unambiguous stimuli, ambiguous stimuli required greater memory resources for evaluation and induced greater P300 amplitudes. For ambiguous stimuli, although stimuli associated with positive and negative words induced the P300 in this study, there was no significant difference in the P300 amplitudes between the two conditions. However, the positive condition was more strongly related to the P300. Because the brain is more inclined to process positive emotional stimuli during late evaluation, with negative stimuli, positive stimuli can induce a greater P300 component [46].
The N400 component is associated with semantic violations and is mainly observed in the frontal and central regions. Kansei adjectives not related to the stimuli and ambiguous stimuli can elicit a substantial N400 amplitude; both are observed in similar areas. It has been shown that the N400 amplitude is correlated with similarity; lower similarity results in larger N400 amplitudes [47]. Although there was no significant difference between N400 amplitudes evoked by matching and mismatching conditions of unambiguous stimuli in this study, the N400 amplitude was larger for the mismatching condition. Psychological studies have found that negative emotions elicit activity from more neural structures for information processing, occupy more cognitive resources, and increase the difficulty of the task, whereas positive emotions promote cognitive processing [48]. Inconsistent with these findings, in the present study, ambiguous stimuli associated with positive words induced a larger N400 amplitude.

4.3. Comprehensive Analysis

Integrated analysis of behavioral, eye tracking, and EEG data revealed significant differences in the cognitive process of product form imagery cognition based on varying levels of imagery unambiguous. When product form imagery is clearly defined, subjects’ cognitive processing of imagery proceeds more smoothly due to distinct product features, resulting in higher efficiency in information retrieval and matching. This manifests as shorter decision-making times and smaller values for eye-tracking metrics such as fixation counts, total saccade duration, and pupil diameter. When product form imagery is ambiguous, cognitive processing uncertainty increases, requiring greater cognitive resources for analysis and decision-making. This manifests as significant increases in all eye tracking metrics and decision-making time.
The event-related potential (ERP) results were consistent with the aforementioned findings. The N2, P300, and N400 components all exhibited distinct activation patterns under different product form imagery conditions. It is particularly noteworthy that this study observed significantly larger N400 amplitudes when samples were paired with positive words under conditions of low perceptual image clarity. While this phenomenon may appear inconsistent with the widely held view in psychology that “negative emotions mobilize more neural resources” [48], it actually reveals the specificity of cognitive processing under conditions of perceptual ambiguity. We propose that perceptual ambiguity itself creates an uncertain cognitive context, which may lead participants to form a relatively neutral cognitive expectation. In such a context, the presentation of an explicitly positive word may generate significant conflict or violation against this background expectation, thereby increasing semantic integration difficulty and manifesting as enhanced N400 amplitude. Therefore, the observed N400 enhancement likely stems from integration difficulties caused by the cognitive conflict between “unambiguous and ambiguity,” rather than being solely attributable to the emotional valence of the words.
In summary, the behavioral data, eye tracking features, and EEG features demonstrated strong correlation and consistency, collectively indicating that participants’ cognitive load followed an increasing gradient of unambiguous (matching) < unambiguous (mismatching) < ambiguous (negative) < ambiguous (positive). This validates multimodal data fusion as an effective and objective approach for capturing users’ unconscious cognitive preferences regarding product imagery.

5. Conclusions

The present ET-EEG product image cognition experiments were conducted to analyses behavioral, eye movement, and EEG data of users during the Kansei cognition of the shape of hair dryers from the perspective of visual and cognitive processing. Cognitive processing was facilitated, and decision latencies were shorter for unambiguous product images. Unambiguous stimuli that did not match the Kansei adjectives required greater cognitive resources compared to those that matched the Kansei adjectives. Ambiguous stimuli associated with negative words consumed more memory resources and led to longer decision latencies than those associated with positive words. The study showed higher consistency between subject behavioral, eye movement, and ERP data. At the same time, subject decision latency, fixation counts, pupil diameter and other eye movement indicators as well as the amplitude of the N2, P300 and N400 components served as objective data regarding users’ cognitive preferences for product images. These objective data can inform designers regarding the multidimensional evaluation of product images by users. ET-EET technology, as an objective basis for capturing user preferences, can provide new pathways for design decisions.

6. Prospects

This paper analyses the relationship between the four states of users’ product imagery decision-making and behavioral, eye movement, and EEG data. However, according to previous studies, it was found that there are differences in Kansei cognition between males and females, and that there is an obvious gender bias in cognitive preference for products. At the same time, the use of the dominant hand leads to a hemispheric effect in the cognitive processing of the brain, and most of the current products are designed with the right-handed as the target user group, causing some inconvenience to the life of the left-handed group. In the follow-up study, the effects of gender, handedness and sample greyness on users’ imagery cognition can be explored to enrich the quantitative criteria of Kansei cognition.

Author Contributions

Conceptualization, S.Z. and H.S.; methodology, S.L.; software, K.Q.; validation, Q.Z., K.Q. and S.L.; formal analysis, H.S.; investigation, H.S., S.Z. and Q.Z.; resources, S.Z.; data curation, K.Q.; writing—original draft preparation, H.S.; writing—review and editing, Q.Z., S.Z., S.L. and K.Q.; visualization, S.L.; supervision, Q.Z.; project administration, S.Z.; funding acquisition, Q.Z. and H.S. All authors have read and agreed to the published version of the manuscript. S.Z. and Q.Z. contributed equally to the oversight of this work.

Funding

This work was funded by the General Scientific Research Project (Natural Science & Engineering Category) of North Minzu University (2025XYZJD03), the Ningxia Natural Science Foundation Project (Research on the Cognitive Mechanism and Influence Mechanism of Product Form Image Based on Cognitive Neuroaesthetics, 2026A1690).

Institutional Review Board Statement

This study was granted ethical approval by the Ethics Committee of North Minzu University (Ethics of the North Minzu University No. 2023-008) and was conducted in the Industrial Design Science Laboratory, School of Mechanical Engineering, North Minzu University.

Informed Consent Statement

All participants voluntarily participated in this study and gave informed consent before starting the experiment.

Data Availability Statement

The raw data supporting the conclusions of this article are available from the authors without undue reservation.

Acknowledgments

This study was supported by the “Scientific Research Support” project provided by Kingfar International Inc. Thanks for the research technical and related scientific research equipment support of Kingfar project team. The “Scientific Research Support” project agreement stipulates that there is no conflict of interest between the results of the research and Kingfar International Incl. Thanks for all the students who participated in the experiment for their support of this study. This work was supported by the “2025 Humanities and Social Sciences Cultivation Fund Project of Lanzhou University of Technology: Cognitive Load Assessment and Optimization of Digital Twin Interfaces Based on EEG and ET.”

Conflicts of Interest

The authors declare that this research was conducted in the absence of any commercial or financial relationships that could be construed as potential conflicts of interest.

Abbreviations

The following abbreviations are used in this manuscript:
ET-EEGeye tracking–electroencephalography
ERPsevent-related potentials
EMMexplicit measurement method
EEGelectroencephalography
ETeye tracking

Appendix A

Table A1. Product image evaluation scores.
Stimulus NumberDull–CuteTraditional–FashionableStiff–ComfortableComplicated–Simple
1−0.23−0.15−0.10.13
20.150.8−0.050.83
30.33−0.180.680.58
40.50.250.630.53
50.5−0.10.630.8
60.331.28−0.08−0.08
70.030.980.230.65
8−0.2−0.130.180.63
90.231.350.281.15
10−0.480.6−0.4−0.38
110.80.550.950.65
120.480.50.30.4
13−0.20.13−0.20.3
140.80.630.60.4
150.030.230.280.73
160.330.70.41
170.50.630.450.45
180.7310.781.05
19−0.151.05−0.131.28
200.381.15−0.11.08
210.43−0.280.650.6
220.250.80.130.08
230.831.10.750.95
24−0.050.25−0.05−0.43
25−0.130.050.030.05
260.830.150.880.75
27−0.1−0.130.080.25
280.810.551.1
290.030.250.230.78
300.850.60.980.95
31−0.1−0.380.280.43
320.781.10.331.15
330.751.150.751.25
340.50.750.530.38
350.130.630.15−0.38
360.931.10.731.05
37−0.30.08−0.23−0.35
380.280.050.20.6
390.40.10.330.03
400.280.40.150.65
41−0.23−0.45−0.55−0.6
420.13−0.230.330.65
430.950.550.40.6
440.050.40−0.15
450.380.450.280.58
460.280.450.280.55
4700.65−0.080.58
48−0.38−0.530.050.03
490.680.430.20.53
500.750.930.70.85

References

  1. Zhang, B.C.; Guo, W.M.; Wang, Y.Q.; Li, S.; Huang, Y.; Xu, J. Research on passenger visual image for train interior design. J. Mech. Eng. 2016, 52, 199–205. [Google Scholar] [CrossRef]
  2. Luo, S.J.; Pan, Y.H. Review of theory, key technologies and its application of perceptual image in product design. Chin. J. Mech. Eng. 2007, 43, 8–13. [Google Scholar] [CrossRef]
  3. Xie, X.H. Design Method of Interior Color of Subway Vehicle Based on NCS and Perceptual Image. Mech. Des. Res. 2021, 3, 159–164. [Google Scholar] [CrossRef]
  4. Yang, M.Q.; Lin, L.; Milekic, S. Affective Image Classification Based on User Eye Movement and EEG Experience Information. Interact. Comput. 2018, 30, 417–432. [Google Scholar] [CrossRef]
  5. Ding, M.; Li, P.H.; Wang, Y.H.; Zhang, X.X. Product color emotional design method based on CNT-GAT and EGT-GA. Packaging Engineering. Comput. Integr. Manuf. Syst. 2025, 1–29. [Google Scholar] [CrossRef]
  6. Wang, P.S.; Feng, H.B.; Du, X.B.; Nie, R.; Lin, Y.; Ma, C.; Zhang, L. EEG-Based Evaluation of Aesthetic Experience Using BiLSTM Network. Int. J. Hum.–Comput. Interact. 2024, 40, 8166–8179. [Google Scholar] [CrossRef]
  7. Fu, B.L.; Gu, C.R.; Fu, M.; Xia, Y.; Liu, Y. A novel feature fusion network for multimodal emotion recognition from EEG and eye movement signals. Front. Neurosci. 2023, 17, 1234162. [Google Scholar] [CrossRef]
  8. Jin, Z.H.; Xing, Z.M.; Wang, Y.R.; Fang, S.; Gao, X.; Dong, X. Research on Emotion Recognition Method of Cerebral Blood Oxygen Signal Based on CNN-Transformer Network. Sensors 2023, 23, 8643. [Google Scholar] [CrossRef]
  9. Liu, H.W.; Li, C.Y.; Huang, Z.G.; Romanoor, N.H. Research on gap between consumer demand and product design supply of new Chinese-style clothing products. J. Text. Res. 2021, 42, 167–174. [Google Scholar] [CrossRef]
  10. Wang, S.; Liu, Y.L.; Sun, L. An Intelligent Generative Design Method for Product Styling Driven by Visual Perception Data. J. Comput.-Aided Des. Comput. Grap 2025, 1–19. Available online: https://link.cnki.net/urlid/11.2925.tp.20250214.1634.037 (accessed on 8 October 2025).
  11. Yang, D.M.; Zhang, X.T.; Zhang, J.N.; Wang, Z.; Dong, X. Intelligent Design Method of Urban Rail Transit Vehicle Modeling Integrating Regional Culture. Mach. Des. Res. 2025, 41, 21–27+34. [Google Scholar] [CrossRef]
  12. Zhang, S.T.; Su, P.F.; Su, S.F. Fusion of Cognitive Information: Evaluation and Evolution Method of Product Image Form. Comput. Intell. Neurosci. 2021, 2021, 5524093. [Google Scholar] [CrossRef]
  13. Cheng, Y.S.; Xu, X.Q.; Chen, G.Q.; Sun, L.; Wu, J. Image prediction model of electric vehicle based on neural network. Comput. Integr. Manuf. Syst. 2021, 27, 1135–1145. [Google Scholar] [CrossRef]
  14. Zeng, D.; Zhou, Z.; He, M.; Tang, C. Solution to Resolve Cognitive Ambiguity in Interactive Customization of Product Shape. Int. J. Comput. Intell. Syst. 2020, 13, 565–575. [Google Scholar] [CrossRef]
  15. Borgianni, Y.; Maccioni, L. Review of the use of neurophysiological and biometric measures in experimental design research. Artif. Intell. Eng. Design. Anal. Manuf. 2020, 34, 248–285. [Google Scholar] [CrossRef]
  16. Ding, Y.; Cao, Y.; Qu, Q.; Duffy, V.G. An exploratory study using electroencephalography (EEG) to measure the smartphone user experience in the short term. Int. J. Hum.–Comput. Interact. 2020, 36, 1008–1021. [Google Scholar] [CrossRef]
  17. Luo, Y.L.; Luo, Y.J. Research status of brain mechanism of visual motion perception. Adv. Psychol. Sci. 2003, 11, 132–135. [Google Scholar]
  18. Ho, C.H.; Lu, Y.N. Can pupil size be measured to assess design products? Int. J. Ind. Ergon. 2014, 44, 436–441. [Google Scholar] [CrossRef]
  19. Li, Z.; Gou, B.C.; Chu, J.J.; Yang, Y. Way of getting user requirements based on eye tracking technology. Comput. Eng. Appl. 2015, 51, 233–237. [Google Scholar]
  20. Qu, Q.X.; Guo, F. Can eye movements be effectively measured to assess product design?: Gender differences should be considered. Int. J. Ind. Ergon. 2019, 72, 281–289. [Google Scholar] [CrossRef]
  21. Wang, X.T.; Deng, W.D. Cognitive Differences of Product Image Sketches Based on Sketch Eye Tracking. J. Comput.-Aided Des. Comput. Graph. 2019, 31, 287–294. [Google Scholar] [CrossRef]
  22. Zhou, M.N.; Lin, Z.; Pan, M.J.; Chen, X. An emotion recognition model based on long short-term memory networks and EEG signals and its application in parametric design. J. Mech. Med. Biol. 2023, 23, 2340096. [Google Scholar] [CrossRef]
  23. Marina, D.; Sofya, K. EEG correlates of perceived food product similarity in a cross-modal taste-visual task. Food Qual. Prefer. 2020, 85, 103980. [Google Scholar] [CrossRef]
  24. Zhang, Y.S.; Kang, Y.Y.; Guo, X.; Li, P.; He, H. The effect analysis of shape design of different charging piles based on Human physiological characteristics using the MF-DFA. Sci. Rep. 2024, 14, 1–12. [Google Scholar] [CrossRef] [PubMed]
  25. Yang, C.; Zeng, J.; Chen, C.; Wang, Q. Investigation on Effect of Appearance Characteristics on Product Identity Based on EEG. J. Tongji Univ. (Nat. Sci.) 2020, 48, 1385–1394. [Google Scholar]
  26. Lopez-Gil, J.M.; Virgili-Goma, J.; Gil, R.; Guilera, T.; Batalla, I.; Soler-González, J.; García, R. Method for improving EEG based emotion recognition by combining it with synchronized biometric and eye tracking technologies in a non-invasive and low cost way. Front. Comput. Neurosci 2016, 10, 119. [Google Scholar] [CrossRef]
  27. Zhu, S.Y.; Qi, J.; Hu, J.; Hao, S. A new approach for product evaluation based on integration of EEG and eye-tracking. Adv. Eng. Inform. 2022, 52, 101601. [Google Scholar] [CrossRef]
  28. Wang, Y.W.; Yu, S.H.; Ma, N.; Wang, J.; Hu, Z.; Liu, Z.; He, J. Prediction of product design decision Making: An investigation of eye movements and EEG features. Adv. Eng. Inform. 2020, 45, 101095. [Google Scholar] [CrossRef]
  29. Guo, F.; Li, M.M.; Hu, M.C.; Li, F.; Lin, B. Distinguishing and quantifying the visual aesthetics of a product: An integrated approach of eye-tracking and EEG. Int. J. Ind. Ergon. 2019, 71, 47–56. [Google Scholar] [CrossRef]
  30. Yang, M.Q.; Lin, L.; Chen, Z.; Wu, L.; Guo, Z. Research on the construction method of kansei image prediction model based on cognition of EEG and ET. Int. J. Interact. Des. Manuf. 2020, 2, 565–585. [Google Scholar] [CrossRef]
  31. Chen, Y.; Lin, L.; Chen, Z.A. Research on Product Preference Image Measurement Based on the Visual Neurocognitive Mechanism. Adv. Intell. Syst. Comput. 2020, 1006, 873–882. [Google Scholar] [CrossRef]
  32. Feng, J.; Xu, J.; Li, Y.; Wu, X.C. The Effect of Congenital Blindness on Color Cognition: An ERP Study. Stud. Psychol. Behav. 2022, 20, 289–296. [Google Scholar] [CrossRef]
  33. Fan, W.; Ren, M.M.; Zhang, W.J.; Zhong, Y. The impact of feedback on self-deception: Evidence from ERP. Acta Psychol. Sin. 2022, 54, 481–496. [Google Scholar] [CrossRef]
  34. Yang, C.; Chen, C.; Tang, Z.C. Study of Electroencephalography Cognitive Model of Product Image. J. Mech. Eng. 2018, 54, 126–136. [Google Scholar] [CrossRef]
  35. Chen, L.; Shi, X.K.; Li, W.N.; Hu, Y. Influence of cognitive control based on different conflict levels on the expression of gender stereotypes. Acta Psychol. Sin. 2022, 54, 628–645. [Google Scholar] [CrossRef]
  36. Su, J.N.; Liu, Y.L.; Shi, R.; Li, X.; Tang, Z. Product Image Modeling Design Method for Cross-cultural Fusion. Packag. Eng. 2019, 40, 10–15. [Google Scholar] [CrossRef]
  37. Guo, Z.N.; Lin, L.; Yang, M.Q.; Zhang, Y. Product image extraction model construction based on multi-modal implicit measurement of unconsciousness. Comput. Integr. Manuf. Syst. 2022, 28, 1150–1163. [Google Scholar] [CrossRef]
  38. Wu, X.L.; Xue, C.Q.; Gedeon, T.; Hu, H.; Li, J. Visual search on information features on digital task monitoring interface. J. Southeast Univ. (Nat. Sci. Ed.) 2018, 48, 807–814. [Google Scholar] [CrossRef]
  39. Li, M.M.; Guo, F.; Ren, Z.G.; Duffy, V.G. A visual and neural evaluation of the affective impression on humanoid robot appearances in free viewing. Int. J. Ind. Ergon. 2022, 88, 103159. [Google Scholar] [CrossRef]
  40. Gorin, H.; Patel, J.; Qiu, Q.Y.; Merians, A.; Adamovich, S.; Fluet, G. A Review of the Use of Gaze and Pupil Metrics to Assess Mental Workload in Gamified and Simulated Sensorimotor Tasks. Sensors 2024, 24, 1759. [Google Scholar] [CrossRef]
  41. Henderson, R.R.; Bradley, M.M.; Lang, P.J. Emotional imagery and pupil diameter. Psychophysiology 2018, 55, e13050. [Google Scholar] [CrossRef]
  42. Buter, R.; Soberanis-Mukul, R.D.; Shanka, R.; Puentes, P.R.; Ghazi, A.; Wu, J.Y.; Unberath, M. Cognitive effort detection for tele-robotic surgery via personalized pupil response modeling. Int. J. Comput. Assist. Radiol. Surg. 2024, 19, 1113–1120. [Google Scholar] [CrossRef]
  43. Sun, R.; Luo, Y.Y. Research on Consumer Privacy Paradox Behavior from the Perspective of Self-perception Theory: Evidence from ERPs. Nankai Bus. Rev. 2021, 24, 153–162. [Google Scholar] [CrossRef]
  44. Lian, H.P.; Cao, D.; LI, Y.J. Electroencephalogram characteristics under successful cognitive reappraisal in emotion regulation. J. Biomed. Eng. 2020, 37, 579–586. [Google Scholar] [CrossRef]
  45. Li, X.W.; Zhao, X.H.; Huang, L.H.; Rong, J. Influence Mechanism of Bridge Sign Complexity on Cognitive Characteristics of Drivers’ Electroencephalogram. J. Southwest Jiaotong Univ. 2021, 56, 913–920. [Google Scholar] [CrossRef]
  46. Zhan, B.; Du, B.X.; Chen, S.H.; Li, Y.; He, W.; Luo, W. Moral judgment modulates fairness consideration in the early outcome evaluation stage. Chin. Sci. Bull. 2020, 65, 1985–1995. [Google Scholar] [CrossRef]
  47. Chen, M.; Wang, H.Y.; Xue, C.Q.; Shao, J. Match judgments of semantic word-product image based on event-related potential. J. Southeast Univ. (Nat. Sci. Ed.) 2014, 44, 58–62. [Google Scholar] [CrossRef]
  48. Dong, G.H.; Yang, L.Z. An ERP Study on the Process of Conflict Emotion Control. Psychol. Sci. 2008, 31, 1365–1368. [Google Scholar] [CrossRef]
Figure 1. The representative images of hair dryers.
Applsci 15 10979 g001
Figure 2. A representative image board displaying objects characterized along the dimensions of “dull–cute” and “complicated–simple”.
Applsci 15 10979 g002
Figure 3. BitBrain electrode placement map.
Applsci 15 10979 g003
Figure 4. Representative image of the experimental setup.
Applsci 15 10979 g004
Figure 5. Experimental procedures.
Applsci 15 10979 g005
Figure 6. Decision time for different imagery matching scenarios.
Applsci 15 10979 g006
Figure 7. Eye movement index values in the different conditions.
Applsci 15 10979 g007
Figure 8. Comparison of responses to matching and mismatching conditions of unambiguous stimuli via superimposed waveforms (horizontal coordinate: time [ms]; vertical coordinate: voltage [µv]).
Applsci 15 10979 g008
Figure 9. Comparison of responses to ambiguous stimuli associated with positive and negative words via superimposed waveforms (horizontal coordinate: time [ms]; vertical coordinate: voltage [μv]).
Applsci 15 10979 g009
Table 1. Adjective clustering.
ClusterAdjectives
1cuteslickfresh
2fashionabletechnologicalartcoolexquisitestrongtexturedfluent
3comfortablesobereleganttraditionalsecureenvironmentalhandsome
4simpleconvenient
Table 2. Product image evaluation scores. (Complete data is available in Appendix A).
Stimulus NumberDull–CuteTraditional–FashionableStiff–ComfortableComplicated–Simple
1−0.23−0.15−0.10.13
20.150.8−0.050.83
30.33−0.180.680.58
40.50.250.630.53
50.5−0.10.630.8
60.331.28−0.08−0.08
430.950.550.40.6
440.050.40−0.15
450.380.450.280.58
460.280.450.280.55
4700.65−0.080.58
48−0.38−0.530.050.03
490.680.430.20.53
500.750.930.70.85
Table 3. Correlations of eye movement indices with product image evaluations.
Eye Movement IndexFp
Average pupil diameter (mm)2.4490
Maximum pupil diameter (mm)1.8130.015
Total saccade time (s)1.5480.056
Fixation count (N)1.5980.044
Table 4. One-way ANOVA results of product image evaluations and electrode measurements of different ERPs.
ERP ComponentTime Window (ms)ElectrodeFp
N2200–300F33.9310.022
FC53.5870.031
FC16.0580.003
P300300–400CP58.4010
P73.3170.04
POZ3.0940.049
N400400–500FP23.4810.034
AF44.4060.014
F73.8450.024
FC14.2870.016
FC25.5870.005
C44.0880.019
T86.7280.002
CP25.1490.007
P46.420.002
Disclaimer/Publisher’s Note: The statements, opinions and data contained in all publications are solely those of the individual author(s) and contributor(s) and not of MDPI and/or the editor(s). MDPI and/or the editor(s) disclaim responsibility for any injury to people or property resulting from any ideas, methods, instructions or products referred to in the content.