Abstract
As aviation operations extend into complex natural environments, dust particles present significant challenges to flight stability and safety, particularly in dust-prone regions like southern Xinjiang. This study employs high-fidelity computational fluid dynamics (CFD) simulations, combined with the SST turbulence model and the Lagrangian discrete phase model, to analyze the aerodynamic response of the NACA 0012 airfoil at varying wind speeds (5, 15, and 30 m/s) and angles of attack (3°, 8°, and 12°). The results indicate that, at low speeds and moderate to high angles of attack, dust particles reduce lift by over 70%, primarily due to boundary layer instability, weakened suction-side pressure, and premature flow separation. Higher wind speeds slightly delay flow separation, but cannot counteract the disturbances caused by the particles. At higher angles of attack, drag increases by more than 60%, driven by wake expansion, shear dissipation, and delayed pressure recovery. Pitching moment frequently reverses from negative to positive, reflecting a forward shift in the aerodynamic center and a loss of pitching stability. An increase in dust concentration amplifies these effects, leading to earlier moment reversal and more abrupt stall behavior. These findings underscore the urgent need to improve aircraft design, control, and safety strategies for operations in dusty environments.
1. Introduction
In recent years, sand and dust weather has attracted increasing attention for its adverse effects on aerospace operations, given its detrimental impact on aircraft performance, structural integrity, and operational safety. This issue is especially pronounced in arid and semi-arid regions, where frequent sandstorms and dusty weather conditions severely degrade aerodynamic efficiency and compromise engine health. Southern Xinjiang, China, is one such region: its proximity to major desert basins such as the Taklamakan Desert and the Kumtag Desert results in frequent occurrences of dust-laden weather.
Against this backdrop, it becomes essential to investigate how dust influences the aerodynamic behavior of aircraft surfaces. To study the aerodynamic profile of a specific object, it is necessary to define its geometry—using an airfoil or wing cross-section in the case of aircraft [1]. Airfoils have an important role in aerodynamic applications because the performance of a body is influenced by the aerodynamic shape [2]. Traditional aerodynamic analyses typically assume clean airflow, an assumption that does not accurately reflect the real operational conditions encountered in desert or dust-prone regions. Therefore, a more realistic simulation approach is required to quantify and predict aerodynamic losses under dust-laden flow conditions. Computational fluid dynamics (CFD) offers a powerful numerical tool for modeling such complex fluid–particle interactions. With advancements in multiphase flow modeling, it is now possible to capture the effects of particle characteristics—including size, concentration, and velocity—on the aerodynamic forces acting over an airfoil surface.
The optimal characteristics of an aircraft airfoil are achieved by attaining a high lift coefficient and a low drag coefficient. Extensive research has been conducted on this topic, driven largely by the rapid advancements in computational fluid dynamics (CFD) [3].
International researchers have conducted extensive investigations on airfoil aerodynamics under varying flow conditions. Douvi C. Eleni et al. [4] established quantitative criteria for selecting appropriate turbulence models for a NACA 0012 airfoil at high Reynolds numbers and multiple angles of attack, while also proposing a mesh-based transition modeling strategy that provides valuable guidance for turbulence modeling in CFD simulations of airfoils. Iliev et al. [5] performed wind tunnel experiments on the NACA 0015 airfoil to examine its performance across different speeds and angles of attack, identifying an optimal performance at an 8° angle of attack. Rogowski et al. [6] conducted numerical simulations of a NACA 0018 airfoil using different turbulence models and compared the results with experimental data to validate simulation accuracy, determining that the Transition SST turbulence model best matched the experimental results. Umapathi and Soni et al. [7] compared the lift, drag, and pressure coefficients of NACA 2313 and NACA 7322 airfoils at various angles of attack, concluding that the NACA 2313 airfoil exhibited superior aerodynamic performance. Rubel et al. [8] evaluated the aerodynamic performance of the symmetric NACA 0015 and asymmetric NACA 4415 airfoils over an angle of attack range of 0 ≤≤ 18°, assessing flow separation, lift, drag, pressure, and velocity profiles, and found the latter to be aerodynamically superior. Pranto and Inam et al. [2] calculated the aerodynamic characteristics of the NACA 4312 airfoil at a fixed Reynolds number (Re=) for various angles of attack, finding that the lift coefficient began to decrease at 13°, a condition identified as stall. Shabur et al. [9] analyzed the aerodynamic behavior of NACA 0018 and NACA 0012 airfoils at Reynolds numbers of and, revealing that the CL/CD ratio increases with Reynolds number, the optimal angle of attack is 10, and the stall angle is 17°they further concluded that NACA 0018 is better suited for aircraft applications, while NACA 0012 is preferable for wind energy purposes. Fatahian et al. [10] employed multiple models integrating the Lagrangian discrete phase model (DPM) with the Eulerian volume of fluid (VOF) method to investigate aerodynamic performance under dry and heavy rain conditions, demonstrating that water film formation significantly impacts airfoil aerodynamics. Douvi D. C. et al. [11] compared the calculated aerodynamic performance of the S809 airfoil under different angles of attack in a dry and dusty environment at Reynolds numbers of Re = 1 × 10⁶ and Re = 2 × 10⁶ with existing experimental data of the airflow over the S809 airfoil from reliable sources. Their results showed that dust concentration has a significant impact on aerodynamic performance. Ge M. et al. [12] systematically investigated the influence of deep surface defects (pits) and shallow distributed defects on the S809 airfoil. They found that, in defect cases, the maximum lift coefficient was significantly reduced, while the drag coefficient increased sharply. Moreover, under dynamic pitching motion, the hysteresis loops of dynamic lift (and drag) coefficients exhibited an effectively enlarged opening. S. Gupta et al. [13] carried out dynamic stall analysis of the S809 airfoil by combining it with the Leishman–Beddoes dynamic stall model. The predicted lift, drag, and pitching moment coefficients were compared with measured values of the oscillating S809 airfoil at different reduced frequencies, mean angles of attack, and amplitude conditions, showing very good agreement between the model and the experimental data. Douvi E. C. et al. [14] predicted the flow field and aerodynamic characteristics of the NACA 0012 airfoil under simulated heavy rain conditions, and found that rainfall led to a degradation of aerodynamic performance, particularly a decrease in lift and an increase in drag.
Chinese researchers have also contributed significantly to studies on airfoil aerodynamics under complex environmental conditions. Li Runnian et al. [15] employed the Delayed Detached Eddy Simulation (DDES) method based on the Reynolds-averaged Navier–Stokes equations and Large Eddy Simulation (RANS–LES), together with a discrete phase model, to investigate the effects of particles on the flow structures around and the aerodynamic performance of the NREL S809 airfoil. Sun Xinyu et al. [16] used the Reynolds-averaged equations for incompressible flow combined with the k-SST turbulence model to study the aerodynamic characteristics of flexible morphing wings. Their results indicated that the lift coefficient, drag coefficient, and lift-to-drag ratio of a camber-morphing wing differ within an angle of attack range of −10° to 7°. Zhang Ruimin et al. [17] examined the complex physical phenomena occurring on wing surfaces under rainfall conditions, presenting both experimental and numerical simulation results to review domestic and international research progress on the effects of rain on aircraft aerodynamic performance.
Although extensive work has been carried out worldwide on airfoil aerodynamic performance, most studies have been based on idealized or single-flow conditions. In reality, airfoils often operate under complex and variable environmental influences such as rainfall, snow accumulation, and sandstorms—non-ideal conditions that can significantly impact aerodynamic performance. However, systematic investigations into airfoil aerodynamics under such challenging conditions remain limited, particularly with regard to the effects of dust. In light of this, the present study focuses on the typical dust weather conditions in southern Xinjiang, employing a comprehensive CFD-based numerical simulation approach to analyze in depth the impact of dust particles on airfoil aerodynamic performance, thereby providing theoretical support and engineering references for aircraft design and operation in dust-laden environments.
2. Numerical Simulation Method
2.1. Study Area Investigation
To ensure that the numerical simulation results closely reflect real operating conditions, this study takes as an example a model aircraft operated by a commercial aviation group in the southern Xinjiang region. A field investigation was conducted at Shache Yarkant Airport, located at 77°4′31. 087″ E and 38°14′11. 621″ N, as shown in Figure 1. The airport lies within the Tarim Basin, one of China’s largest inland basins, surrounded by expanses of Gobi and desert. Spring (March–May) and autumn (September–November) are peak seasons for dust weather, during which sandstorms can reduce visibility to only a few hundred meters, affecting aircraft takeoff, landing, and ground operations. The duration of dust events ranges from several hours to multiple days, typically fluctuating with wind speed. This airport serves as a representative site for the characteristic dust weather of southern Xinjiang. A vertical sand collector, as shown in Figure 2, was deployed for 32 h in a stationary setup, with sampling heights set at 20 cm, 26 cm, 32 cm, 38 cm, 44 cm, and 50 cm. The collected sand particles were subsequently analyzed using a high-precision electron microscope, as illustrated in Figure 2.

Figure 1.
Geographical Location of Shache Yarkant Airport.
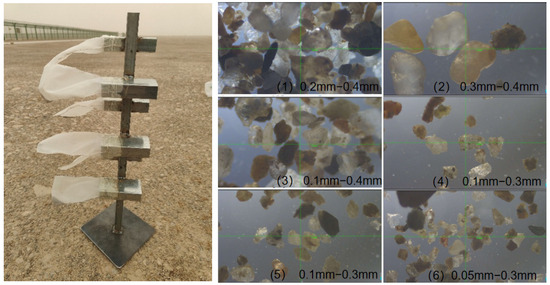
Figure 2.
Vertical sand collector (left) and sample measurements at different heights at Shache Yarkant Airport (right).
After analyzing the sand particle samples, the approximate quantity distribution across different particle diameter ranges was determined, as shown in the Figure 3 below:

Figure 3.
The distribution of sand particle diameters.
Based on the sampling and analysis of representative data, this study employs particles with diameters randomly generated within the range of 50–150 μm, with a higher proportion concentrated around 100 μm.
At the same time, according to the field investigation data from the airport, under normal conditions the local wind speed is approximately 5 m/s, while during sandstorms or strong wind events, it can reach 15 m/s. In past extreme weather conditions, wind speeds have been recorded at 29–32 m/s. Therefore, in this study, representative headwind speeds of 5 m/s, 15 m/s, and 30 m/s were selected as the wind speed conditions for the subsequent numerical simulations.
2.2. Numerical Modeling
2.2.1. Governing Equations for Incompressible Flow
Under subsonic conditions, the flow around an airfoil is generally assumed to be incompressible and steady. The governing equations are derived from the fundamental principles of fluid mechanics, particularly the conservation of mass and momentum.
For incompressible, two-dimensional steady flow, the continuity equation can be expressed as:
where u and v denote the velocity components in the x and y directions, respectively.
For two-dimensional incompressible flow, the Navier–Stokes equations are given by:
where is the fluid density, is the static pressure, and is the dynamic viscosity.
The Navier–Stokes equations governing fluid motion are inherently nonlinear and complex. When dealing with turbulence, their solution becomes even more challenging due to the chaotic and multi-scale nature of turbulent flows. The Reynolds-Averaged Navier–Stokes (RANS) equations represent the time-averaged form of the governing equations for fluid motion:
Here, denotes the density, represents the velocity, and is the dynamic viscosity of the fluid. This formulation accounts for adjustments arising from the mean body force, the isotropic stress caused by the mean pressure gradient, the viscous stress, and the apparent stresses induced by the fluctuating velocity field—commonly referred to as Reynolds stresses. These nonlinear stress terms require additional modeling to close the RANS equations, which has led to the development of a variety of turbulence models [2].
2.2.2. Turbulence Model
In this study, the turbulence model adopted is the Shear Stress Transport (SST) model, which employs the Wilcox formulation [18,19] in the near-wall region and transitions to the model [20] in the far-field region, while accounting for the influence of shear stress on transport [21]. This approach combines the independence of the model with the robustness of the model, offering both accuracy and stability. The transport equations are:
Here, : fluid density; : time; : Cartesian coordinates ( = 1,2,3); : velocity component; : turbulent kinetic energy; : specific dissipation rate; : molecular dynamic viscosity; : turbulent viscosity; : turbulent Prandtl number for the k-equation; : production term of turbulent kinetic energy; : empirical constant (SST model parameter); : empirical constant (SST model parameter); : magnitude of the strain-rate tensor; : empirical constant (SST model parameter); : turbulent Prandtl number for the ω-equation; : blending function; : empirical constant (SST model parameter).
This model is among the most commonly used in computational fluid dynamics (CFD) for predicting the characteristics of turbulent flows. In this study, air is used as the working fluid and is treated as an ideal gas, with its density and dynamic viscosity varying as functions of temperature and pressure. The ideal gas model typically assumes that the behavior of air follows the ideal gas equation:
where is the static pressure, is the density, is the specific gas constant for air, and is the absolute temperature.
Under the ideal gas model, the density of air is approximately and the dynamic viscosity is . According to field survey data, the aircraft’s speed during takeoff roll is between 64 m/s and 68 m/s. Based on the Reynolds number formula:
Here, is the fluid density, is the characteristic velocity of the fluid (for aerodynamic analysis of an aircraft, this is typically the velocity of the object relative to the fluid, i.e., the aircraft’s flight speed), L is the characteristic length, which in this numerical simulation is taken as 1 m, and is the dynamic viscosity of the fluid. Based on these parameters, the Reynolds number is calculated to be approximately , indicating that the flow is turbulent.
2.2.3. Discrete Phase Model
The Discrete Phase Model (DPM) is a numerical approach based on the Euler–Lagrange framework [22,23]. In the DPM, the solid phase is assumed to be dilute, and particle–particle interactions are neglected. The model can account for various fluid forces acting on the particles and allows for two-way coupling calculations. In simulating gas–solid two-phase flows under wind–sand conditions, the particle phase motion equation is given by [24]:
Here, is particle mass, is particle velocity, is acceleration of the particle, is total force exerted by the fluid on the particle, is moment of inertia of the particle, is angular velocity of the particle, is angular acceleration of the particle, and is moment exerted by the fluid on the particle.
Fluent solves the discrete phase trajectories by integrating the differential equations of particle force balance in a Lagrangian coordinate system. In Cartesian coordinates, the equation in the x-direction can be expressed as:
Here, is particle acceleration in the x-direction, is drag force coefficient per unit particle mass, is gravitational acceleration component in the x-direction, is particle density, and is additional external force in the x-direction.
In this equation, represents the drag force per unit mass of the particle, given by:
In this equation, is the velocity of the continuous phase (fluid), is the particle velocity, is the drag coefficient, and is the relative Reynolds number (particle Reynolds number).
3. Grid Verification and Numerical Simulation
3.1. Verification of Grid Independence
Before performing detailed numerical simulations, it is essential to verify whether the mesh resolution is sufficient to ensure the accuracy of the results. To confirm that the computed aerodynamic coefficients are not affected by further mesh refinement, a mesh independence study was conducted.
3.1.1. Grid Settings and Refinement Strategies
A series of structured C-type meshes were generated around the NACA 0012 airfoil, with progressive refinement in regions of high flow gradients. The total number of cells ranged from approximately 28,900 to 42,200, with local clustering near the leading edge, suction surface, and trailing edge to accurately capture boundary layer development and flow separation. To properly resolve near-wall turbulence, the first grid layer height was set to satisfy a dimensionless wall distance of .
Radial grid spacing was controlled such that cell density increased by a factor of 1.15 within a distance of 5% of the chord length from the airfoil surface, ensuring smooth growth of the boundary layer mesh. Around the leading edge region (within 2% chord length), the mesh was refined more aggressively with a growth ratio of 1.08 to resolve sharp pressure gradients. Along the trailing edge wake region, the mesh density was increased by approximately 1.2× per successive layer to capture vortex shedding and wake expansion.
In the far-field region, cell density was gradually reduced with a growth ratio of 1.25 until reaching the outer boundary (15 chord lengths away), ensuring computational efficiency while maintaining solution accuracy in the vicinity of the airfoil. The clustering strategy is illustrated in Figure 4, where fine grids concentrate near the airfoil and gradually transition to coarser cells in the outer field. This refinement strategy provides a balance between accuracy in critical flow regions and overall computational cost, particularly suited for SST turbulence modeling in multiphase CFD simulations.

Figure 4.
Mesh around the NACA 0012 airfoil (left) and detailed view near the airfoil (right).
3.1.2. Grid Independence Result
The simulation was carried out at a Reynolds number of and an angle of attack , conditions under which the mesh resolution in this region is typically highly sensitive. The computed lift coefficient is shown in Figure 5.

Figure 5.
Variation in lift coefficient with mesh size.
As shown in the figure, when the Reynolds number is (as mentioned in 2.2.2 above), variations in the aerodynamic coefficients become negligible once the mesh size exceeds 36,800 cells, indicating that the mesh has converged. Therefore, a mesh with 36,800 cells was selected for all subsequent simulations to balance computational accuracy and efficiency.
3.2. Numerical Modeling
3.2.1. Overview of Simulation Conditions
To investigate the aerodynamic behavior of the wing under dusty and sand-laden climatic conditions, a series of two-dimensional CFD simulations were conducted using the previously validated mesh and turbulence model. The simulated environmental conditions were designed to represent the typical dusty climate of southern Xinjiang, with suspended sand particle diameters set in the range of 50–150 . Based on field data, the simulations examined the influence of three main variables:
- Wind speed: 5 m/s, 15 m/s and 30 m/s.
- Angle of attack: 3°, 8°and 12°.
- Dust concentration: 0.0319 kg/m3, 0.0769 kg/m3, 0.0891 kg/m3.
For each combination of wind speed and angle of attack, simulations were performed under both dust-free and dust-laden conditions to evaluate how airborne sand and dust affect aerodynamic performance indicators (the three different concentrations of sand and dust were all obtained through on-site research at Shache Yarkant Airport), including the lift coefficient (), drag coefficient (), and pitching moment coefficient (). The three aerodynamic performance coefficient equations are:
Here, is fluid density, is Freestream velocity, A is reference area, and c is reference length.
These are key parameters for assessing wing performance. The following section presents a comparative analysis of the aerodynamic coefficients for clean-air and dust-weather conditions across different angles of attack and wind speeds.
3.2.2. Compare the Influences of Wind Speed and Power Angle on Aerodynamic Performance Respectively
Using a dust concentration of 0.0769 kg/m3 as an example, with fixed wind speeds of 5 m/s, 15 m/s, and 30 m/s, the angle of attack was varied. The simulated results for the static pressure distribution of the fluid around the airfoil are Figure 6, Figure 7 and Figure 8 shown below:
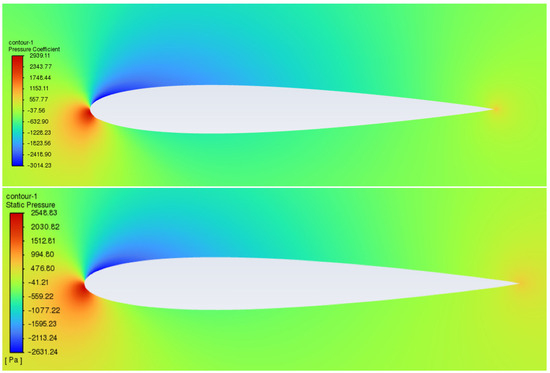
Figure 6.
Comparison of static pressure distribution for dust-free (top) and dust-laden (bottom) conditions at a wind speed of 5 m/s and an angle of attack of 3°.
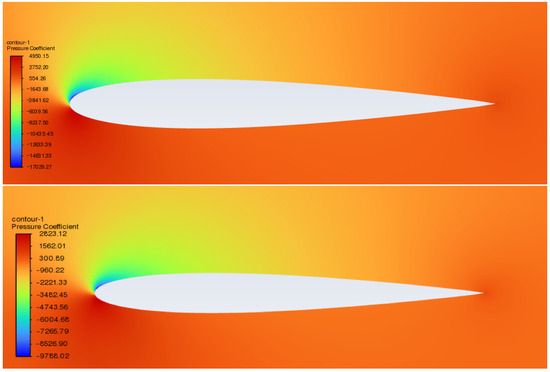
Figure 7.
Comparison of static pressure distribution for dust-free (top) and dust-laden. (bottom) conditions at a wind speed of 5 m/s and an angle of attack of 8°.
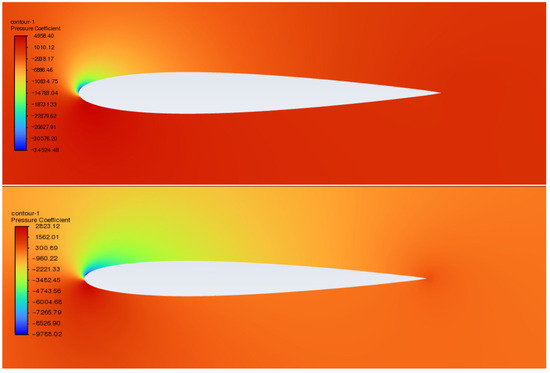
Figure 8.
Comparison of static pressure distribution for dust-free (top) and dust-laden (bottom) conditions at a wind speed of 5 m/s and an angle of attack of 12°.
From the above contour plots, it can be observed that, during the aircraft’s takeoff preparation phase, airborne dust particles lead to a reduction in the surrounding fluid’s static pressure. As the angle of attack increases, the static pressure of the surrounding fluid further increases.
Similarly, numerical simulations were completed for wind speeds of 15 m/s and 30 m/s, and the corresponding data were obtained. These results were then analyzed to assess their impact on aerodynamic performance. The simulation results are as Figure 9, Figure 10 and Figure 11 follows:
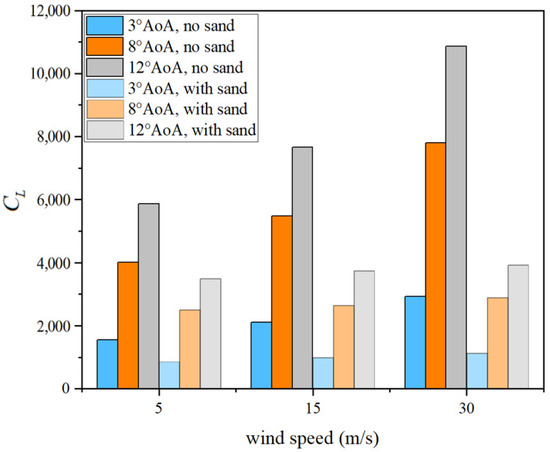
Figure 9.
Bar chart of lift coefficient variation with wind speed.
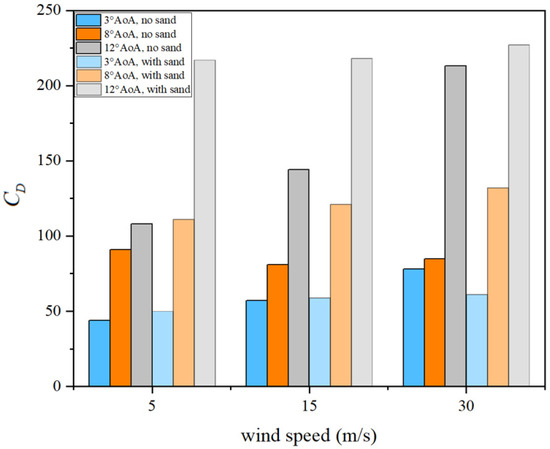
Figure 10.
Bar chart of drag coefficient variation with wind speed.
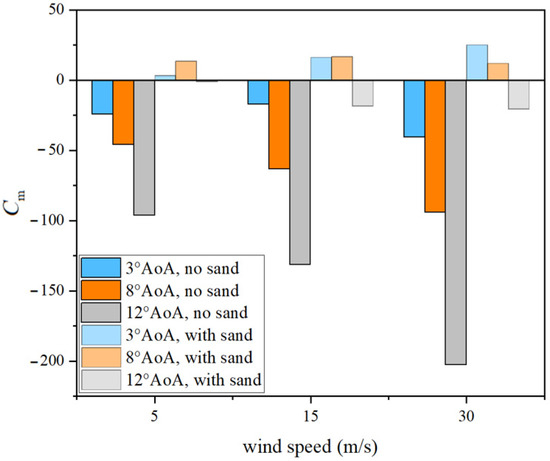
Figure 11.
Variation in pitching moment coefficient with wind speed.
The above data were organized to show the percentage change in aerodynamic coefficients caused by dust under different angles of attack at the same wind speed, as shown in Table 1, Table 2 and Table 3 below:

Table 1.
Percentage change in lift coefficient due to dust.

Table 2.
Percentage change in drag coefficient due to dust.

Table 3.
Percentage change in pitching moment coefficient due to dust.
- Lift coefficient
The results show that dust consistently reduces lift across all wind speeds and angles of attack, following a clear nonlinear degradation trend. At 5 m/s, lift decreases by 37–45%, with the strongest effect at small angles of attack, indicating that, even at low Reynolds numbers, dust particles can destabilize the boundary layer, trigger early separation, weaken suction on the upper surface, and cause substantial lift loss. At 15 m/s, the lift reductions remain large (about 51–53% at all angles). Although higher flow energy slightly delays separation, it cannot counteract dust-induced disturbances, which uniformly suppress lift. At 30 m/s, lift still drops sharply (about 62–64%), showing that even under strong flow attachment, dust intensifies turbulence and weakens the suction-side pressure gradient. The effect is especially severe near stall-critical angles, where lift collapse becomes more abrupt. In summary, dusty conditions impose a persistent and strong suppressive influence on lift, evident even at low angles and increasingly severe at higher angles, as continuous boundary-layer disruption destabilizes the suction peak and undermines the pressure differential that generates lift.
- 2.
- Resistance coefficient
Dust has a pronounced and nonlinear impact on drag, with effects varying by wind speed and angle of attack (AoA) but generally most severe at medium-to-high AoA. At 5 m/s, drag changes non-monotonically: a small increase at 3° (+13.6%) suggests localized stabilization of the boundary layer, but at 8° drag rises sharply (+22.0%) and at 12° it doubles (+100.9%) due to amplified shear-layer and wake disturbances. At 15 m/s, drag increases consistently across all AoA, with small growth at 3° (+3.5%) but substantial rises at 8° (+49.4%) and 12° (+51.4%), reflecting intensified separation and unsteady wake expansion. At 30 m/s, dust reduces drag at 3° (−21.8%), likely from turbulence-enhanced near-wall mixing, but drag again rises sharply at 8° (+55.3%) and remains high at 12° (+6.6%). Overall, dust can slightly reduce drag at low AoA but predominantly causes strong drag growth at medium-to-high AoA, especially near stall, where boundary-layer instability, reduced suction-side pressure recovery, and enhanced wake dissipation dominate. These effects imply that, during climb, maneuvering, or moderate-to-high-speed operations, dust substantially degrades aerodynamic efficiency, increases energy consumption, and imposes higher loads on control systems.
- 3.
- Pitching moment coefficient
Dust exerts a strong destabilizing influence on the pitching moment across all wind speeds, often reversing its sign and threatening flight attitude stability. At 5 m/s, the moment reverses at 3° (−24.4 → +3.1, +112.7%) and 8° (−46 → +13. 6, +129. 6%), while at 12°, it nearly neutralizes (−96.4 → −1.1). At 15 m/s, the reversals are even stronger: at 3° (−17.3 → +16.2, +193.6%) and 8° (−63.2 → +16.7, +126.4%), with major weakening still evident at 12° (−131.4 → −18.5). At 30 m/s, despite higher flow attachment, dust continues to cause large variations: at 3° (−40.5 → +25.0, +161.7%) and 8° (−94.3 → +11.9, +112.6%), with significant reduction at 12° (−202.7 → −20.5, +89.9%). Overall, dust tends to reverse the pitching moment at low and moderate AoA and strongly weaken it at higher AoA, reflecting upper-surface suction loss, boundary-layer disturbance, and forward shift of the aerodynamic center. This disruption undermines pitch stability and poses serious risks during sensitive maneuvers such as turning or pitch adjustments.
Taking a sand–dust concentration of 0.0769 kg/m3 as an example, numerical simulations of the velocity distribution in the flow field around the airfoil were conducted at fixed angles of attack of 3°, 8°, and 12°, while varying the incoming flow velocity. The results are shown as Figure 12, Figure 13 and Figure 14 follows:

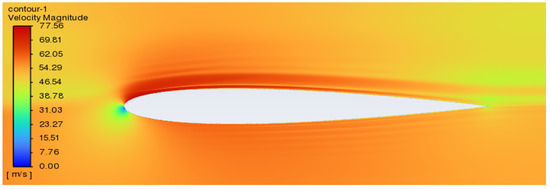
Figure 12.
Comparison of flow velocity without sand–dust (top) and with sand–dust (bottom) at a wind speed of 5 m/s and an angle of attack of 3°.
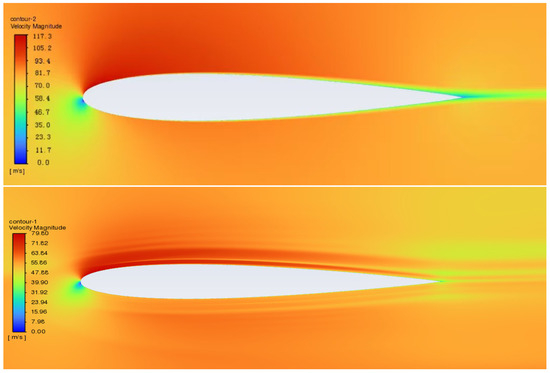
Figure 13.
Comparison of flow velocity without sand–dust (top) and with sand–dust (bottom) at a wind speed of 15 m/s and an angle of attack of 3°.
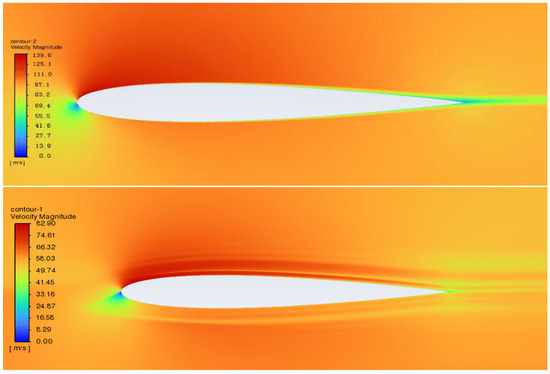
Figure 14.
Comparison of flow velocity without sand–dust (top) and with sand–dust (bottom) at a wind speed of 30 m/s and an angle of attack of 3°.
From the above contour plots, it can be seen that, during the aircraft’s takeoff preparation phase, airborne sand–dust particles cause noticeable changes in the surrounding flow velocity. In clean air, the flow over the suction surface accelerates smoothly, reaching a high velocity near the leading edge, and then gradually recovers toward the trailing edge. However, in a dusty environment, a distinct velocity stratification appears on the upper surface near the leading edge. This stratification indicates the formation of multiple velocity layers, which can be attributed to momentum exchange between the carrier fluid and the suspended dust particles. From a physical standpoint, the introduction of dust, acting as discrete phase particles, alters the boundary-layer dynamics through drag and inertial interactions with the flow. Due to their mass, the particles lag behind the rapidly moving airstream, causing momentum deficit in the near-wall region while the outer boundary layer maintains relatively higher velocity. This effect creates a velocity gradient—or “layering”—within the boundary layer, visible as stratified structures in the velocity contours. Additionally, the presence of particles increases local turbulence intensity and promotes earlier transition or thickening of the boundary layer, further intensifying the stratification effect.
At the same time, the angle of attack is fixed and the wind speed is changed to analyze the influence on aerodynamic performance. The simulation results are as Figure 15, Figure 16 and Figure 17 follows:
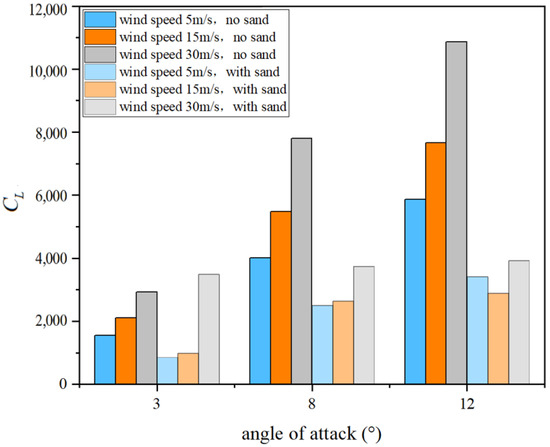
Figure 15.
Variation in lift coefficient with angle of attack.
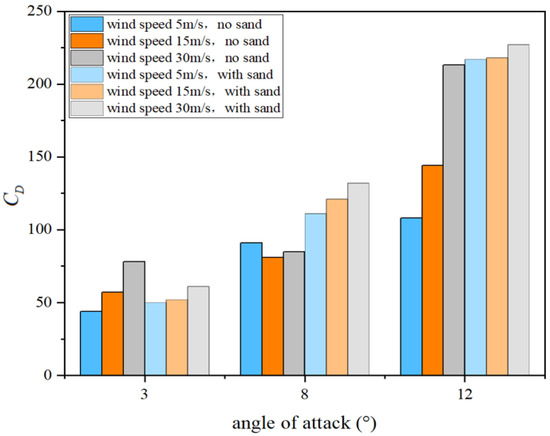
Figure 16.
Variation in drag coefficient with angle of attack.
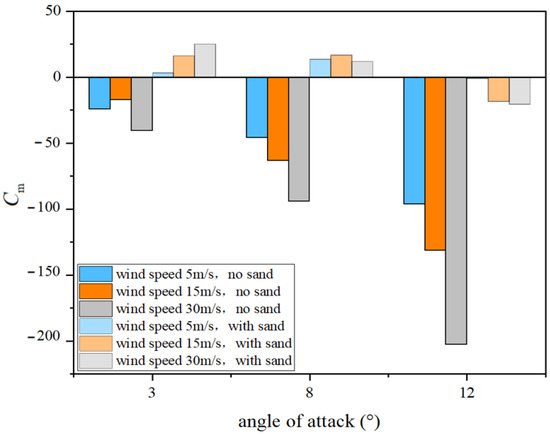
Figure 17.
Variation in pitching moment coefficient with angle of attack.
The percentage data tables under the same power Angle but different wind speeds are the same as those in Table 1, Table 2 and Table 3 above.
- 4.
- Lift coefficient
The results show that sand and dust strongly suppress lift at all wind speeds and angles of attack. At 3° AoA, lift in clean air rises from 1547 at 5 m/s to 2924 at 30 m/s, but in dusty air it only grows from 851 to 1127, about 40% of the clean case. At 8°, clean lift increases from 4015 to 7805, while dusty lift rises only from 2503 to 3744, showing greater suppression as disturbances to the suction peak intensify. Even with higher flow energy, dust-induced boundary layer instability and early separation dominate lift loss. At 12° near stall, the impact becomes most severe: at 30 m/s, lift drops from 10,856 in clean flow to 3919 in dusty conditions, a reduction of 63.9%. These results confirm that dust consistently disrupts suction generation and attachment, with effects magnified at higher angles. Under high dynamic pressure, dust-induced disturbances, suction collapse, and large-scale separation still prevail, producing nonlinear and destructive lift suppression that severely degrades aerodynamic efficiency.
- 5.
- Resistance coefficient
In terms of drag variation, at a fixed angle of attack of 3°, the dusty environment exhibits a certain “drag-reduction” effect. In clean air, drag increases from 44 (at 5 m/s) to 78 (at 30 m/s), whereas under dusty conditions it rises only from 50 to 61, showing a markedly moderated growth. This suggests that at low angles of attack, dust particles may enhance small-scale flow disturbances in a way that suppresses laminar–turbulent transition, temporarily improving boundary layer stability and providing a certain “delayed separation” or “postponed transition” effect. However, when the angle of attack increases to 8°, this trend reverses, and dust causes a significant drag increase: at 5 m/s, drag rises from 91 to 111 (+22.0%) at 15 m/s, from 81 to 121 (+49.4%), and at 30 m/s, from 85 to 132 (+55.3%). This indicates that dust at this stage enhances shear layer growth, wake instability, and flow separation, thereby intensifying pressure drag and induced drag generation. At the high angle of attack of 12°, this drag-increase trend becomes particularly severe, showing a distinct nonlinear character. At 5 m/s and 15 m/s, drag rises from 108 and 144 to 217 and 218, respectively—growth rates exceeding 50%. At 30 m/s, drag still reaches 227, approaching the limit drag level.
These results reveal that, at high angles of attack, dust readily triggers large-scale wake expansion, near-wall separation, and periodic vortex shedding, leading to a combined effect of form drag and turbulent dissipation, and significantly degrading aerodynamic efficiency.
- 6.
- Pitching moment coefficient
Dust has a pronounced influence on pitching moment, often reversing its direction and weakening attitude stability. At a 3° angle of attack, clean airflow produces a consistently negative moment (nose-down trend), but with dust, the values shift to positive (+3.1, +16.2, +25.0), showing complete reversals and increases of over 110–190%. This reflects a dust-induced forward shift of the aerodynamic center, disrupting trim balance and creating a nose-up tendency. At 8°, the destabilization is even stronger: clean moments remain negative (−46 to −94.3), while dusty cases turn entirely positive (+13.6, +16.7, +11.9), again exceeding 110% growth. Notably, even at 30 m/s the nose-up bias persists, demonstrating that pressure distribution shifts dominate over higher flow attachment. This suggests that, during moderate-AoA operation, wings may experience a sustained pitch bias, risking abnormal control responses. At 12° near stall, the moment remains negative but its magnitude drops sharply, with reductions up to 90% (e. g, −202. 7 to −20.5), severely weakening control authority. Overall, dust alters chordwise pressure distribution and vortex structure, driving nonlinear amplification and reversal of pitching moment, posing serious risks to flight stability and trim control.
3.2.3. The Influence of Concentration on Aerodynamic Performance
To further quantify the impact of sand and dust concentration on the aerodynamic performance of an airfoil, this section extends the previous study by introducing comparative simulations under three mass concentrations of airborne particles:
- High concentration: 0.0891 kg/m3;
- Medium concentration: 0.0769 kg/m3;
- Low concentration: 0.0319 kg/m3.
Under these three conditions, the variations in lift coefficient, drag coefficient, and pitching moment coefficient were examined to explore how particle concentration influences boundary-layer behavior, surface pressure distribution, and aerodynamic balance. The simulations were conducted for fixed combinations of angles of attack (3°, 8°, and 12°) and freestream velocities (5 m/s, 15 m/s, and 30 m/s). The results are presented in the following Figure 18, Figure 19 and Figure 20:

Figure 18.
The lift coefficient curves of different dust concentrations.
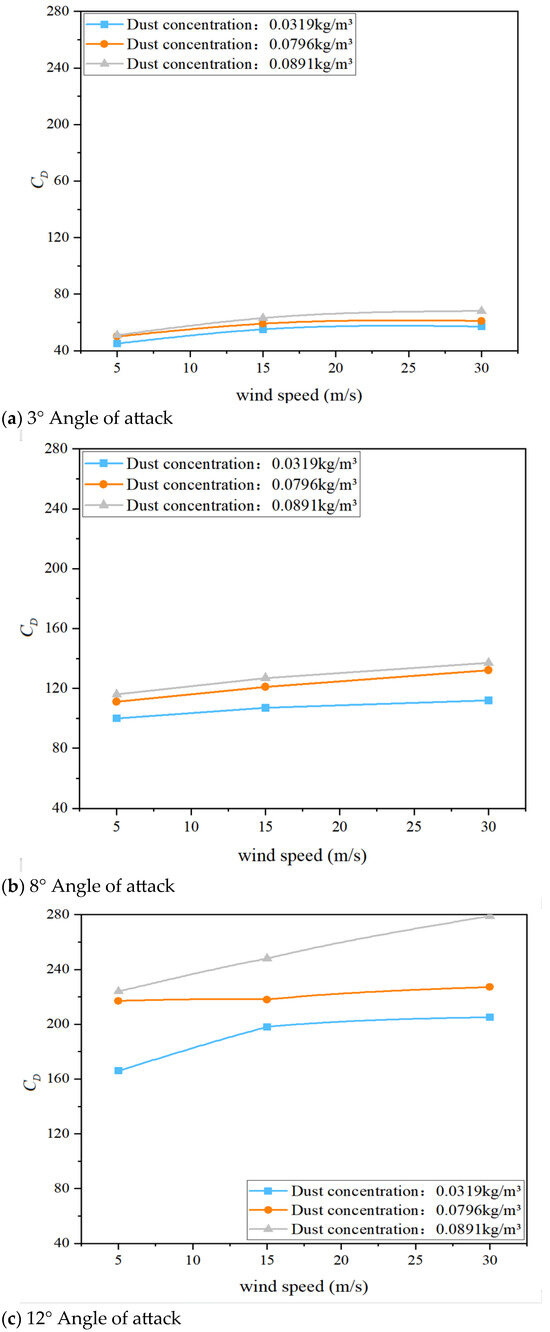
Figure 19.
The resistance coefficient curves of different dust concentrations.
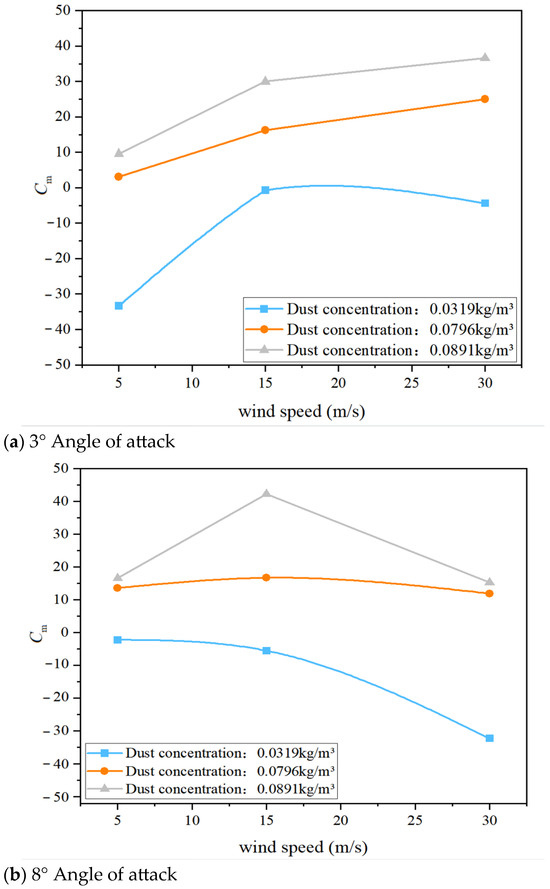

Figure 20.
The resistance coefficient curves of different dust concentrations.
- Lift coefficient
Sand and dust concentration has a pronounced effect on the lift characteristics of the airfoil, with higher concentrations leading to more severe lift reduction. Across all tested wind speeds and angles of attack, lift consistently decreases as particle concentration increases. For example, at an angle of attack of 12° and a wind speed of 30 m/s, the lift drops from 4302 at a concentration of 0.0319 kg/m3 to 3919 at 0.0769 kg/m3, and further down to 3484 at 0.0891 kg/m3, representing a cumulative decrease of nearly 20%. Similar trends are observed under other combinations of angle of attack and wind speed. The monotonic decline in lift with increasing concentration indicates that higher particle loading intensifies momentum exchange within the boundary layer and increases surface roughness, thereby inducing earlier flow separation and substantially weakening suction over the upper surface. This effect is particularly pronounced at high angles of attack, where the boundary layer is inherently more fragile and particle-induced disturbances more readily trigger stall.
From a fluid dynamics perspective, in high-concentration dusty environments, particles interact with the main flow through drag and impact collisions, extracting momentum and causing the boundary layer to thicken while locally reducing the Reynolds number. These changes promote earlier transition to turbulence or even flow separation, thereby significantly suppressing lift generation.
- 2.
- Resistance coefficient
Under varying concentration conditions, drag exhibits a positive correlation with dust concentration—higher concentrations produce greater drag. For example, at an angle of attack of 8° and a wind speed of 30 m/s, drag increases from 112 at a concentration of 0.0319 kg/m3 to 132 at 0.0769 kg/m3, and further to 137 at 0.0891 kg/m3, representing an increase of more than 20%. This trend indicates that increasing dust concentration not only intensifies flow-field disturbances and shear-layer separation, but also introduces additional drag sources through the direct drag effect of the particles themselves, thereby amplifying the overall drag coefficient.
Theoretically, aerodynamic drag consists of form drag and skin-friction drag. Dust particles primarily elevate form drag by disrupting streamline attachment, increasing adverse pressure gradients, and enhancing shear stress. At the same time, particle impacts on the surface introduce micro-scale roughness, causing a slight increase in skin-friction drag. The combined effect of these mechanisms results in a rapid rise in drag with increasing particle concentration.
- 3.
- Pitching moment coefficient
The pitching moment coefficient is highly sensitive to variations in sand and dust concentration, particularly at angles of attack of 3° and 8°. Changes are observed not only in the magnitude of the moment, which increases substantially, but also in its direction, with reversals occurring under certain operating conditions. For example, at a wind speed of 5 m/s and an angle of attack of 8°, the pitching moment shifts from −33. 4 at a concentration of 0.0319 kg/m3 to 13. 6 at 0.0769 kg/m3, and further rises to 42. 4 at 0.0891 kg/m3. This represents not only a multiple-fold increase in magnitude, but also a clear reversal from nose-down to nose-up moment, indicating a forward shift of the aerodynamic center and an enhancement of nose-up pitching tendency.
The underlying mechanism lies in the formation of localized high-disturbance regions near the leading edge and the upper surface of the wing due to dust particles. These disturbances modify the chordwise pressure distribution, shifting the center of pressure forward and consequently changing the overall pitching moment from negative to positive, thereby disrupting aerodynamic trim. As concentration increases, the severity of flow disturbance grows, and the tendency toward a positive pitching moment becomes more pronounced. In high-concentration conditions, such moment reversals may pose serious challenges to aircraft trim and stability, particularly during takeoff and climb phases.
- 4.
- The influence of concentration on aerodynamic behavior
From an aerodynamic physics perspective, increasing sand and dust concentration intensifies fluid–particle interactions, driving the flow field from its original, predictable laminar or attached turbulent state toward an unstable, separation-dominated regime. As particle concentration rises, both inter-particle collision frequency and particle–wall interaction frequency increase significantly, leading to elevated local turbulence intensity, thickened shear layers, and the formation of momentum deficit regions, which in turn reduce the effective lifting surface area.
Furthermore, within the DPM (Discrete Phase Model) framework, greater particle mass enhances inertial effects, compelling the fluid to divert preferentially around these particles. This induces pronounced redistribution effects upstream of the airfoil and along the suction surface. Such “particle–airflow interference” not only disrupts the original pressure gradient distribution but also promotes strong vortex shedding and unstable wake structures in the trailing region, thereby amplifying pitching moment variations and drag penalties.
Overall, the aerodynamic performance differences observed across varying dust concentrations reflect the strong coupling between particulate matter and aircraft aerodynamic behavior in dusty environments. The impact lies not only in quantitative changes to lift and drag but also in the fundamental restructuring of the flow field and the alteration of control characteristics. Therefore, future aircraft design should fully account for the dynamic adaptability to concentration variations and ensure robustness in control strategies under such conditions.
3.2.4. Analysis of Stall Characteristics Under Sand and Dust Conditions
In actual flight, airfoil stall is a critical nonlinear aerodynamic phenomenon that affects both the safety and control stability of an aircraft. In dusty environments, the evolution of the boundary layer and the flow attachment characteristics can be significantly altered, thereby shifting the stall onset point and modifying its characteristics. To investigate the influence of sand and dust on the stall behavior of an airfoil, this study conducted simulations at a concentration of 0.0319 kg/m3, covering an angle-of-attack range from 3° to 22° under three representative freestream velocities (5 m/s, 15 m/s, and 30 m/s). The variations in lift coefficient and drag coefficient under these conditions were obtained, as shown in the Figure 21 below.
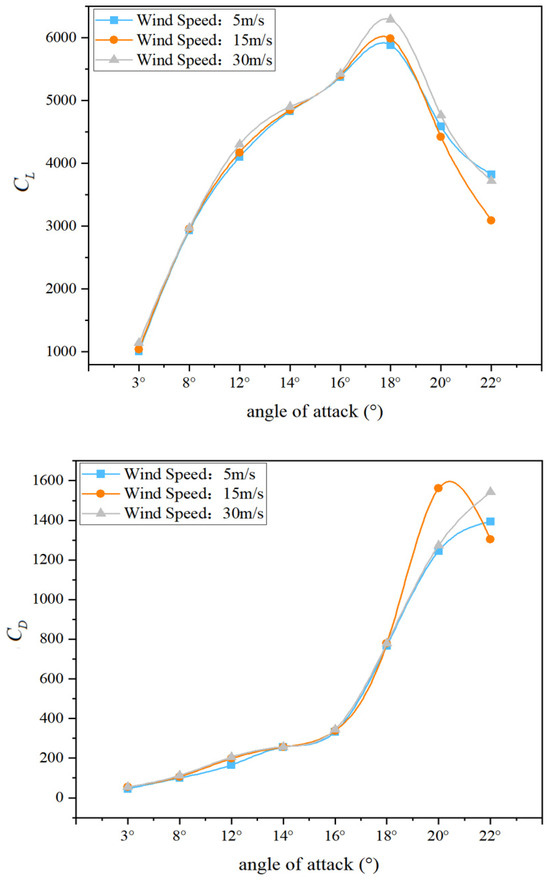
Figure 21.
Variations in lift and drag coefficients with angle of attack.
- Lift force changes and stall point identification
As shown in the figure, as the angle of attack increases from 3°, the lift coefficient of the airfoil rises steadily in the early stage, exhibiting a typical lift growth trend. However, under all wind speed conditions, the lift reaches a plateau at an angle of 16° and shows a clear decline beyond 18°, indicating a rapid expansion of flow separation and the onset of stall.
At a wind speed of 5 m/s, the lift increases from 1007 at 3° to 5884 at 16°, peaks at 5884 at 18°, and then drops sharply to 4586 at 20° and 3625 at 22°, displaying the typical post-stall abrupt drop in lift. Under wind speeds of 15 m/s and 30 m/s, the lift curves follow a similar trend, with the maximum lift occurring at an angle of 18°, followed by a marked reduction. At 15 m/s, the peak lift is 5986 (18°) and falls to 3093 at 22°; at 30 m/s, the peak lift is 6239 (18°) and decreases to 3723 at 22°.
This trend indicates that even at high wind speeds with abundant flow kinetic energy, the presence of sand and dust particles cannot effectively suppress the occurrence of stall; instead, it exacerbates the degree of lift collapse at large angles of attack.
- 2.
- Drag Variation and Stall Indicators
When the angle of attack is below 12°, the increase in drag coefficient remains relatively moderate. However, once the angle reaches 14°, drag growth accelerates sharply, reflecting the expansion of boundary layer separation and the thickening of the shear layer, which induces vortex shedding:
At 5 m/s, drag jumps from 255 at 14° to 766 at 18°, and further to 1394 at 22°. Under wind speeds of 15 m/s and 30 m/s, drag between 16° and 20° exhibits a nonlinear, explosive rise (e.g., at 15 m/s: 333 → 779 → 1561), signaling that non-attached flow dominates the aerodynamic behavior over the airfoil surface.
By examining the lift and drag curves together, it can be determined that, under a sand–dust concentration of 0.0319 kg/m3, the stall angle of the NACA 0012 airfoil is generally within the range of 16–18°. As wind speed increases, the maximum lift rises slightly, but the stall angle range remains largely unchanged. This indicates that, near the stall threshold, the inertia and drag effects of sand–dust particles dominate the local flow-field structure, diminishing the beneficial influence of higher wind speeds in delaying stall onset.
- 3.
- Theoretical analysis and explanation of flow mechanism
The essence of stall is a boundary layer separation phenomenon dominated by an adverse pressure gradient.
At small angles of attack, the airflow can remain smoothly attached to the upper surface of the airfoil, forming a strong suction region and delivering good lift performance. As the angle of attack increases—particularly beyond 14°—the effective incidence of the upper surface becomes steeper, intensifying the adverse pressure gradient. The boundary layer begins to show signs of instability near the leading edge, and by 18°, the boundary layer loses its kinetic energy entirely and undergoes complete separation. At this point, suction collapses and lift drops.
Meanwhile, large zones of low-speed recirculating vortices form, triggering large-scale separated wakes that lengthen the flow path around the airfoil, increase energy losses, and significantly raise drag.
The presence of sand and dust particles further disturbs the development of the boundary layer, triggering earlier transition and separation, thereby causing stall to occur sooner. This manifests as a steeper post-peak lift drop and faster drag growth.
In clean air, the increase in lift with angle of attack is mainly due to the intensified low-pressure region on the upper surface caused by streamlined flow acceleration. In a dusty environment, however, particles disrupt this attachment in two ways: surface impacts and blockage effects break down the smooth adherence of streamlines or increased near-wall turbulence and particle-fluid mixing viscosity make the boundary layer more prone to detachment.
Specifically:
- Localized high turbulence and low-pressure disruption:
At high angles of attack, particles tend to accumulate near the leading edge of the suction surface, inducing high-intensity turbulence and vortex structures that disrupt the stable low-pressure region.
- Particle inertia promoting separation:
Due to their inertia, particles have difficulty following the curved streamlines, creating crossflow or reverse-flow microregions that further displace the main flow and promote boundary layer separation.
- Local Reynolds number reduction:
Momentum exchange between particles and the fluid reduces local velocity, lowering the Reynolds number. This causes the boundary layer to transition to an unstable turbulent state earlier and to separate sooner.
- Aerodynamic center migration and stability risks:
Before and after stall, the center of lift shifts sharply rearward, which may induce structural oscillations and pitch instability.
The stall process in a sand and dust environment is shown in Figure 22, The blue and red lines represent the lift curves in clean air and sand and dust environments respectively. Therefore, compared with ideal clean air, stall in a sand–dust environment is characterized by earlier onset, steeper lift decay, more pronounced drag increase, and irregular migration of the aerodynamic center. This implies that aircraft operating in deserts or regions with high sand–dust concentrations must incorporate non-ideal stall models into their design, and apply flight envelope restrictions and control law optimization based on the coupled relationship among concentration, angle of attack, and wind speed, in order to ensure flight safety and handling stability.

Figure 22.
Schematic diagram of stall process in sand and dust environment.
4. Conclusions
This study focuses on the variation characteristics of airfoil aerodynamic performance under typical sand–dust environmental conditions in southern Xinjiang. Based on computational fluid dynamics (CFD) methods, it systematically investigates the influence mechanisms of sand–dust particles on key aerodynamic parameters such as lift, drag, and pitching moment, and establishes a simulation analysis framework involving multiple wind speeds, angles of attack, and concentrations. Using the NACA 0012 symmetric airfoil and incorporating the particle size range of sand–dust collected from field measurements (50–150 μm), the study examines various combinations of wind speed (5 m/s, 15 m/s, 30 m/s) and angle of attack (3°, 8°, 12°), constructing both sand–dust and dust-free control groups to explore the effects of concentration variation and stall behavior on aerodynamic performance. The main findings are as follows:
- Lift and Drag Performance:
The presence of sand-dust particles significantly reduces lift, with a decrease of up to 80%, especially at low wind speeds and moderate angles of attack. This is due to sand-dust disrupting the boundary layer, weakening the suction surface, and causing early flow separation. Drag experiences a slight reduction at low angles of attack but increases sharply with higher angles of attack, especially due to vortex shedding and wake expansion.
- 2.
- Pitching Moment Reversal:
In sand-dust conditions, the pitching moment coefficient reverses from negative (nose-down) to positive (nose-up), with an increase exceeding +150%. This reversal occurs because sand-dust disturbs the pressure distribution balance, shifting the aerodynamic center forward and disrupting pitch stability, which may affect flight control.
- 3.
- Dust Concentration and Stall Characteristics:
Higher dust concentrations (0.0891 kg/m3) further degrade lift, increase drag, and amplify pitching moment changes. Additionally, sand-dust causes premature stall onset, decreasing the stall angle and making the stall process more severe and uncontrollable, primarily due to intense flow separation and recirculation near the leading edge.
- 4.
- Physical Mechanism Attribution:
Comprehensive flow field analyses indicate that sand–dust affects aerodynamic performance through:
- Disrupting the laminar state of the boundary layer and inducing turbulence development;
- Increasing momentum dissipation in near-wall regions;
- Causing premature collapse of pressure distribution;
- Enhancing unsteady vortex shedding in the wake.
Together, these effects systematically reduce lift, increase drag, and cause unstable shifts in the aerodynamic center.
In summary, this study, through high-fidelity CFD simulations, clearly reveals the triple adverse effects of sand–dust environments on airfoil aerodynamic performance: reduced lift, increased drag, and pitching moment reversal. The findings provide important theoretical and engineering significance for guiding aerodynamic layout optimization, stability control strategy development, and flight performance assessment of aircraft operating in sand-prone regions. The findings of this study can serve as a useful reference for conditions where the particle size distribution and concentration of dust are similar to those observed in southern Xinjiang. Nevertheless, considerable regional variations in dust characteristics remain, highlighting the need for further investigation under diverse environmental conditions.
Author Contributions
M.L.: methodology, software, validation, formal analysis, writing—original draft preparation. A.J.: conceptualization, investigation, supervision, funding acquisition, writing—review and editing. Y.H.: software, formal analysis. H.L.: validation. All authors have read and agreed to the published version of the manuscript.
Funding
The work reported above was supported by the Natural Science Foundation of China (12362033), Research on local sand and dust motion simulation method based on multiphase flow (CIRP202415001X).
Data Availability Statement
The data that support the findings of this study are available from the corresponding author upon reasonable request.
Conflicts of Interest
The authors declare no conflicts of interest.
References
- Pranto, M.R.I.; Inam, M.I. Numerical Analysis of the Aerodynamic Characteristics of NACA4312 Airfoil. J. Eng. Adv. 2020, 1, 29–36. [Google Scholar] [CrossRef]
- Kaya, M.N.; Kok, A.R.; Kurt, H. Comparison of aerodynamic performances of various airfoils from different airfoil families using CFD. Wind Struct. 2021, 32, 239–248. [Google Scholar]
- Kaya, F. Investigation of effects of sand particles on aerodynamic performance of NACA 0012 airfoil. Niğde Ömer Halisdemir Üniversitesi Mühendislik Bilimleri Dergisi 2023, 12, 302–309. [Google Scholar] [CrossRef]
- Eleni, D.C.; Athanasios, T.I.; Dionissios, M.P. Evaluation of the turbulence models for the simulation of the flow over a National Advisory Committee for Aeronautics (NACA) 0012 airfoil. J. Mech. Eng. Res. 2012, 4, 100–111. [Google Scholar] [CrossRef]
- Iliev, V.; Lazarevikj, M.; Aleksoski, V. Numerical and experimental investigation of airfoil performance in a wind tunnel. Am. J. Eng. Res 2020, 9, 119–124. [Google Scholar]
- Rogowski, K.; Królak, G.; Bangga, G. Numerical study on the aerodynamic characteristics of the NACA 0018 airfoil at low Reynolds number for Darrieus wind turbines using the transition SST model. Processes 2021, 9, 477. [Google Scholar] [CrossRef]
- Umapathi, M.; Soni, N. Comparative analysis of airfoil NACA 2313 and NACA 7322 using computational fluid dynamics method. Int. J. Sci. Prog. Res 2015, 12, 193–198. [Google Scholar]
- Rubel, R.I.; Uddin, M.K.; Islam, M.Z.; Rokunuzzaman, M. Comparison of aerodynamics characteristics of NACA 0015 & NACA 4415 aerofoil blade. Int. J. Res. -Granthaalayah 2017, 5, 187–197. [Google Scholar]
- Shabur, A.; Hasan, A.; Ali, M. Comparison of aerodynamic behaviour between NACA 0018 and NACA 0012 airfoils at low Reynolds number through CFD analysis. Adv. Mech. Eng. Technol. 2020, 3, 1–8. [Google Scholar]
- Fatahian, H.; Salarian, H.; Eshagh Nimvari, M.; Khaleghinia, J. Numerical simulation of the effect of rain on aerodynamic performance and aeroacoustic mechanism of an airfoil via a two-phase flow approach. SN Appl. Sci. 2020, 2, 867. [Google Scholar] [CrossRef]
- Douvi, D.C.; Margaris, D.P.; Davaris, A.E. Aerodynamic performance of a NREL S809 airfoil in an air-sand particle two-phase flow. Computation 2017, 5, 13. [Google Scholar] [CrossRef]
- Ge, M.; Zhang, H.; Wu, Y.; Li, Y. Effects of leading edge defects on aerodynamic performance of the S809 airfoil. Energy Convers. Manag. 2019, 195, 466–479. [Google Scholar] [CrossRef]
- Gupta, S.; Leishman, J.G. Dynamic stall modelling of the S809 aerofoil and comparison with experiments. Wind Energy 2006, 9, 521–547. [Google Scholar] [CrossRef]
- Douvi, E.C.; Margaris, D.P. Aerodynamic performance investigation under the influence of heavy rain of a NACA 0012 airfoil for wind turbine applications. Int. Rev. Mech. Eng 2012, 6, 1228–1235. [Google Scholar] [CrossRef]
- Li, R.; Zhao, Z.; Li, D.; Li, Y.; Chen, X.; Yu, J. Effects of Windblown Sand on Flow around Wind Turbine Airfoils and Their Aerodynamic Performance. Trans. Chin. Soc. Agric. Eng. 2018, 34, 205–211. [Google Scholar]
- Sun, X.; Duan, F. Aerodynamic Characteristics Analysis of Flexible Deformable Airfoils. Flight Mech. 2023, 41, 1–9. [Google Scholar] [CrossRef]
- Zhang, R.; Cao, Y. A Review of the Effects of Rain on Aircraft Aerodynamic Performance. J. Aerosp. Power 2010, 25, 2290–2295. [Google Scholar] [CrossRef]
- Launder, B.E. DB Spalding Mathematical Models of Turbulence; Academic Press: London, UK, 1972. [Google Scholar]
- Reynolds, O. IV. On the dynamical theory of incompressible viscous fluids and the determination of the criterion. Philos. Trans. R. Soc. A 1895, 186, 123–164. [Google Scholar]
- Tikhomirov, V.M. Equations of Turbulent Motion in an Incompressible Fluid; Selected Works of AN Kolmogorov; Springer: Dordrecht, The Netherlands, 1991; pp. 328–330. [Google Scholar]
- Menter, F.R. Two-equation eddy-viscosity turbulence models for engineering applications. AIAA J. 1994, 32, 1598–1605. [Google Scholar] [CrossRef]
- Armenio, V.; Fiorotto, V. The importance of the forces acting on particles in turbulent flows. Phys. Fluids 2001, 13, 2437–2440. [Google Scholar] [CrossRef]
- Schiller, V.L. Uber die grundlegenden Berechnungen bei der Schwerkraftaufbereitung. Z. Vereines Dtsch. Ing. 1933, 77, 318–321. [Google Scholar]
- Yu, M. Study on Dynamic Stall Characteristics and Wear of Wind Turbine Airfoils in Wind-Sand Environment. Master’s Thesis, Lanzhou University of Technology, Lanzhou, China, 2022. [Google Scholar] [CrossRef]
Disclaimer/Publisher’s Note: The statements, opinions and data contained in all publications are solely those of the individual author(s) and contributor(s) and not of MDPI and/or the editor(s). MDPI and/or the editor(s) disclaim responsibility for any injury to people or property resulting from any ideas, methods, instructions or products referred to in the content. |
© 2025 by the authors. Licensee MDPI, Basel, Switzerland. This article is an open access article distributed under the terms and conditions of the Creative Commons Attribution (CC BY) license (https://creativecommons.org/licenses/by/4.0/).