Article

Prediction of Favorable Sand Bodies in Fan Delta Deposits of the Second Member in Baikouquan Formation, X Area of Mahu Sag, Junggar Basin

1
Hubei Key Laboratory of Southern Complex Shale Oil and Gas Geology and Development, Yangtze University, Wuhan 430100, China
2
State Key Laboratory of Geological Processes and Mineral Resources, China University of Geosciences, Wuhan 430074, China
3
School of Geosciences, Yangtze University, Wuhan 430100, China
4
Urumqi Branch of Geophysical Research Institute, Bureau of Geophysical Prospecting Inc., China National Petroleum Corporation, Urumqi 830016, China
*
Author to whom correspondence should be addressed.
Appl. Sci. 2025, 15(20), 10908; https://doi.org/10.3390/app152010908
Submission received: 12 September 2025 / Revised: 3 October 2025 / Accepted: 9 October 2025 / Published: 10 October 2025

Abstract

The prediction of thin-bedded, favorable sand bodies within the Triassic Baikouquan Formation fan delta on the western slope of the Mahu Sag is challenging due to their strong spatial heterogeneity. To address this, we propose an integrated workflow that synergizes seismic sedimentology with geologically constrained seismic inversion. This study leverages well logging, core data, and 3D seismic surveys. Initially, seismic attribute analysis and stratal slicing were employed to delineate sedimentary microfacies, revealing that the fan delta front subfacies comprises subaqueous distributary channels, interdistributary bays, and distal bars. Subsequently, the planform distribution of these microfacies served as a critical constraint for the Seismic Waveform Indicative Inversion (SWII), effectively enhancing the resolution for thin sand body identification. The results demonstrate the following: (1). Two NW-SE trending subaqueous distributary channel systems, converging near the BAI65 well, form the primary reservoirs. (2). The SWII, optimized by our workflow, successfully predicts high-quality sand bodies with a cumulative area of 159.2 km2, primarily located in the MAXI1, AIHU10, and AICAN1 well areas, as well as west of the MA18 well. This study highlights the value of integrating sedimentary facies boundaries as a geological constraint in seismic inversion, providing a more reliable method for predicting heterogeneous thin sand bodies and delineating future exploration targets in the Mahu Sag.

1. Introduction

Seismic sedimentology, as defined by Zeng, provides a three-dimensional analysis of subsurface formations by integrating lithofacies, sedimentary origins, spatial distribution of depositional systems, and basin evolution history. This approach synthesizes seismic lithology and seismic geomorphology to reconstruct the geological narrative of target strata [1]. Seismic lithology, a central component, converts three-dimensional seismic data into lithology volumes through a range of petrophysical techniques, including phase conversion, time–frequency analysis, wave impedance inversion, seismic attribute analysis, and amplitude versus offset (AVO) analysis [2]. Seismic geomorphology techniques derive geomorphological insights from 3D seismic data, facilitating in-depth analysis of sedimentary formations, paleo-landforms, and sedimentary environment features [3].
Recent progress in seismic sedimentology has greatly enhanced the analysis of passive continental margins and lacustrine rift basins [4]. In particular, Zeng et al. established a standardized workflow for seismic sedimentology research, specifically tailored to lacustrine rift basins in China, providing a crucial methodological framework for subsequent studies.
The rapid development of seismic sedimentological techniques stems from their capability to predict the distribution of thin sand bodies, even when seismic data possess limited vertical resolution [5]. Furthermore, these methods have successfully revealed the three-dimensional distribution patterns of sedimentary bodies through stratal slicing, providing robust technical support for predicting favorable sand bodies and investigating sedimentary processes [6]. The application of seismic sedimentology [7] principles is particularly relevant to this study, which focuses on.
The Mahu Sag lies along the northwestern edge of the Junggar Basin in northwest China (Figure 1a). The main body of the Triassic Baikouquan Formation in the Mahu Sag is characterized by shallow-water fan delta deposits formed under a gentle slope setting. Three subfacies characterize these deposits: fan-delta plain, fan-delta front, and prodelta. The fan delta plain primarily develops facies such as matrix-supported floating conglomerates, graded bedding conglomerates from scour channels, and alluvial conglomerates, generally exhibiting brown to gray-brown colors. These colors reflect oxidizing to weakly oxidizing depositional conditions. The fan delta front is mainly characterized by facies such as cross-bedded sandy conglomerates, calcareously cemented sandy conglomerates, sand-supported floating conglomerates, horizontal to wavy bedded sandstones, and gray mudstones, which overall appear gray to gray-brown. This coloration indicates a weakly oxidizing to reducing depositional environment. The typical fan delta front interdistributary bay deposits are represented by sandstone facies that range from flat to gently undulating bedding. These are distinguished by gray mudstone and silty mudstone, featuring both horizontal and wavy bedding patterns. The Baikouquan Formation in the Mahu Sag features a fan delta-lacustrine sedimentary system that displays a backward progression, with the Huangyangquan fan delta serving as the main focus of our research area.
The western flank of the Mahu Sag comprises a consolidated, gently dipping zone that forms a stable segment of the lacustrine basin slope, with paleo-gradients not exceeding three degrees [8]. The stratigraphic layers of the Mahu Sag are divided into three separate segments-the Lower Baikouquan, the Middle Karamay, and the Upper Baijiantan formations-all of which were laid down during the Triassic era, as depicted in Figure 1b. The Lower Baikouquan Formation exhibits a stratification of fluvial-lacustrine conglomerates, granular sandstones, and clay-rich rock types [9]. Xian et al. provided a comprehensive documentation of the stratigraphic architecture of the Baikouquan Formation, which is further divided into three members from base to top: T1b1, T1b2, and T1b3 [10].
Previous research mainly characterized sand and gravel body genetic types and controlling factors using only existing well data [11]. Previous work on sand body prediction in the Junggar Basin has led to the development of various techniques, including seismic forward modeling, statistical inversion, attribute optimization, multi-attribute analysis, and prestack elastic impedance inversion, with more emphasis on the improvement of statistical methods and inversion algorithms [12]. Despite the existing body of research, critical gaps remain that hinder the accurate prediction of favorable sand bodies in the Baikouquan Formation: (1). Conventional seismic inversion techniques often lack sufficient geological constraints, leading to significant uncertainties in characterizing the complex, thin-bedded sand bodies within the conglomeratic sequences of the fan delta. The reliance on statistical methods or algorithms without robust facies control has proven inadequate for resolving such heterogeneous reservoirs. (2). Previous studies have not fully leveraged high-precision seismic sedimentology to establish a reliable sedimentary facies model as a lateral constraint for inversion. The lack of a robust geological framework limits the ability to accurately delineate the spatial distribution and connectivity of high-quality sand bodies. To bridge these gaps, this study proposes a novel, integrated workflow that combines seismic sedimentology with geologically constrained Seismic Waveform Indicative Inversion (SWII). Since 2012, drilling results have demonstrated a clear correlation between the thickness and spatial distribution of reservoirs and their hydrocarbon flow capacity-a finding of significant importance, as emphasized in reference [13]. There is now broad consensus among experts that the composition, particularly the physical characteristics, of large-scale fan-delta sandstone reservoirs exerts a substantial influence on the volume and scale of oil and gas accumulations. This insight has been deepened by a thorough investigation of mudstone and rock attributes, as well as the reservoir traits, in the Triassic Baikouquan Formation fan delta located on the western edge of the Mahu Sag [14]. Consequently, there is an urgent need to develop reliable methods for predicting the locations of these high-permeability reservoirs within extensive conglomerate sequences, in order to expand the prospective areas for locating and extracting hydrocarbons in this area.
In the study area, an analysis of hydrocarbon accumulation conditions and favorable facies belts within the Baikouquan Formation has been conducted. It has been determined that the Baikouquan Formation features the development of favorable facies belts at the fan delta front, which are widely distributed and characterized by large-scale control of hydrocarbon accumulation. The Triassic Baikouquan Formation in the Mahu Sag is shallowly buried and develops favorable facies belts at the fan delta front, possessing conditions for large-scale hydrocarbon accumulation, including efficient migration, accumulation, reservoir, and sealing mechanisms. Reference Xian et al. reports on a comprehensive analysis using core samples, mud logging, and well logging data from the Baikouquan Formation in the Mahu Sag, noting that the favorable facies belts at the fan delta front are widely distributed. A geological model has been established depicting large-scale hydrocarbon control by fan delta systems on gentle slope settings within sag lake basins.
This study presents a novel seismic-stratigraphic method for identifying high-quality sandstone reservoirs and characterizing their associated physical properties [15]. This method has proven effective in two major reservoir zones of the T1b2 layer in the Baikouquan Formation. The forecasted placement of these premium reservoirs is crucial for shaping upcoming exploration tactics and enhancing well positioning within the study area.

2. Geological Setting

The western Mahu Sag slope (Figure 1c), located on the Junggar Basin’s northwestern edge, underwent several major tectonic episodes, such as the Hercynian, Indosinian, and Yanshanian orogenies [16]. Within the northwestern Junggar Basin, the Wuxia Fault Zone (Figure 1a) initiated following the Carboniferous Hercynian orogeny, with its subsequent development fundamentally controlled by this compressional stage. Subsequent late orogenic activity led to the formation of foreland basins [17]. During the Permian, the propagation of peripheral thrust belts toward the basin center controlled the development of alluvial fan and fan-delta systems. Driven by the Indosinian orogeny that occurred from the Triassic period to the Early Jurassic, the Triassic witnessed intensified tectonic activity driven by the Indosinian orogeny, manifested by the rapid uplift of the northwestern Hala’alate Mountains and enhanced reverse thrusting along the Wuxia Fault Zone [17]. Tectonic uplift of orogenic belts enhances erosion, thereby supplying adjacent basins with abundant detrital material that fills and controls the sedimentary sequences in foreland or peripheral basins. This uplift resulted in the deposition of thick Triassic successions south of the orogenic belt, while uplifted areas experienced varying degrees of stratigraphic denudation. Cretaceous tectonic activity significantly diminished, resulting in a period of episodic subsidence. During the Cenozoic, renewed episodes of uplift and denudation shaped the present-day stratigraphic configuration [18].
The study area is situated within a third-order structural unit bounded by the Urho Fault Zone and the Fault Terrace Zone on the western slope of the Mahu sag (Figure 1). This structural domain features stable tectonic-sedimentary conditions, a south-dipping monoclinal structure (Figure 1c), and well-preserved stratigraphy. Adjacent to the Mahu hydrocarbon-generating sag, the study area benefits from efficient hydrocarbon migration, resulting in significant accumulations [18,19]. The Triassic succession comprises the Baikouquan, Karamay, and Baijiantan formations in ascending order. This Mesozoic succession unconformably overlies Permian strata (Figure 1). The Baikouquan Formation comprises fan-deltaic conglomerates interbedded with mudstones, sourced from the northwest. It is subdivided into three members: the Lower Member (T1b1), Middle Member (T1b2), and Upper Member (T1b3). Both the overall stratigraphic thickness and sand-body thickness increase eastward, forming a wedge. Concurrently, fan-delta plain, fan delta front, and prodelta deposits are distributed sequentially from west to east [19]. Vertically, from the Lower Member (T1b1) to the Upper Member (T1b3), grain size fines upward, and color transitions from brown to gray-green and gray, reflecting an overall transgressive succession [20].

3. Data and Methods

3.1. Dataset

This study utilized key datasets comprising core samples, wireline logs, and 3D seismic data for the analysis and interpretation. The data was collected specifically for oil and gas prospecting activities around the northeastern portion of the Mahu Depression, which is situated within the Junggar Basin. The Xinjiang Oilfield Company, which is a division of the China National Petroleum Corporation (CNPC), was the provider of this valuable dataset. The 3D seismic data in the study area is 600 km2 (Figure 1), features an effective bandwidth of 10–60 Hz, a vertical sampling interval of 2 ms (two-way time, TWT), and a horizontal bin size of 12.5 m × 12.5 m. Based on a dominant frequency of 40 Hz and an interval velocity of 3676 m/s, the vertical resolution (λ/4) was calculated to be approximately 23 m. The seismic data conforms to the SEG normal polarity standard. Under this convention, an increase in acoustic impedance with depth-corresponding to a positive reflection coefficient is displayed as a positive reflection amplitude, typically represented by red, white, or peak events. Conversely, a decrease in impedance with depth, resulting in a negative reflection coefficient, is displayed as a negative reflection amplitude, conventionally represented by black or trough events. Seismic interpretation and attribute analysis were conducted using the GeoEast software platform on dedicated seismic workstations. Seismic interpretation and attribute analysis were carried out on seismic workstations using the GeoEast 4.0 software (Figure 1). Conventional wireline logs, including gamma ray (GR) and deep resistivity (RT), were used to identify lithofacies, perform stratigraphic correlation, and evaluate reservoir architecture.

3.2. Methodology

Within the three-tiered stratigraphic framework, the Baikouquan Formation was subdivided into three members utilizing an refined logging model and a seismic-to-well tie calibration approach [21]. The attribute extraction tool within the GeoEast software was utilized to generate and analyze stratigraphic sections derived from the 3D seismic amplitude data. Slices were taken every 2 ms, and the single slice that best represented the fan delta morphology was chosen for interpretation [22]. The flat boundary of the sedimentary subfacies within the second interval of the Baikouquan Formation acted as the lateral limit for the low-frequency model (LFM) applied in seismic inversion to forecast high-quality reservoirs.
The workflow included these steps: (1) Identification and interpretation of sedimentary facies using log facies and core data. The boundary of the second interval was delineated using the seismic sedimentological method (stratal slicing) [23]. (2) The planar boundary of the sedimentary facies belt within the second interval was delineated. These boundaries, in conjunction with those of the stratigraphic slices, were employed as lateral and vertical (time/depth) constraints, respectively, for the low-frequency model (LFM) in the seismic inversion process to enhance the accuracy of high-quality reservoir prediction [24]. (3) Relationships between lithology, petrophysical properties, hydrocarbon-bearing properties, and well log impedance within the second interval of the Baikouquan Formation were established to define reservoir discrimination criteria. The primary goal was to identify the spectral interval of seismic impedances indicative of superior reservoirs across varied geological contexts [25]. (4) Using the defined sedimentary facies as the fundamental unit, lateral variations in seismic waveform morphology, reflecting differences in sedimentary microfacies associations, were utilized [26]. Variogram models derived from analogous well logs were applied for stochastic simulation within corresponding waveform classification units. Based on this approach, Seismic Waveform Indicative Inversion was performed. Based on the correlation between wave impedance and physical properties, reservoirs exhibiting porosity greater than 8% and permeability exceeding 1 mD were defined as high-quality [13,14]. This approach successfully delineated the spatial distribution of high-quality sand bodies throughout the study area.

4. Results

4.1. Sedimentary Facies Signatures

The sedimentary setting significantly influences the creation of superior reservoirs. Consequently, delineating sedimentary facies zones is a prerequisite and foundation for predicting the distribution of high-quality reservoir sands, as these zones govern the macro-distribution pattern of regional reservoir sands [27,28].

4.1.1. Petrographic Analysis

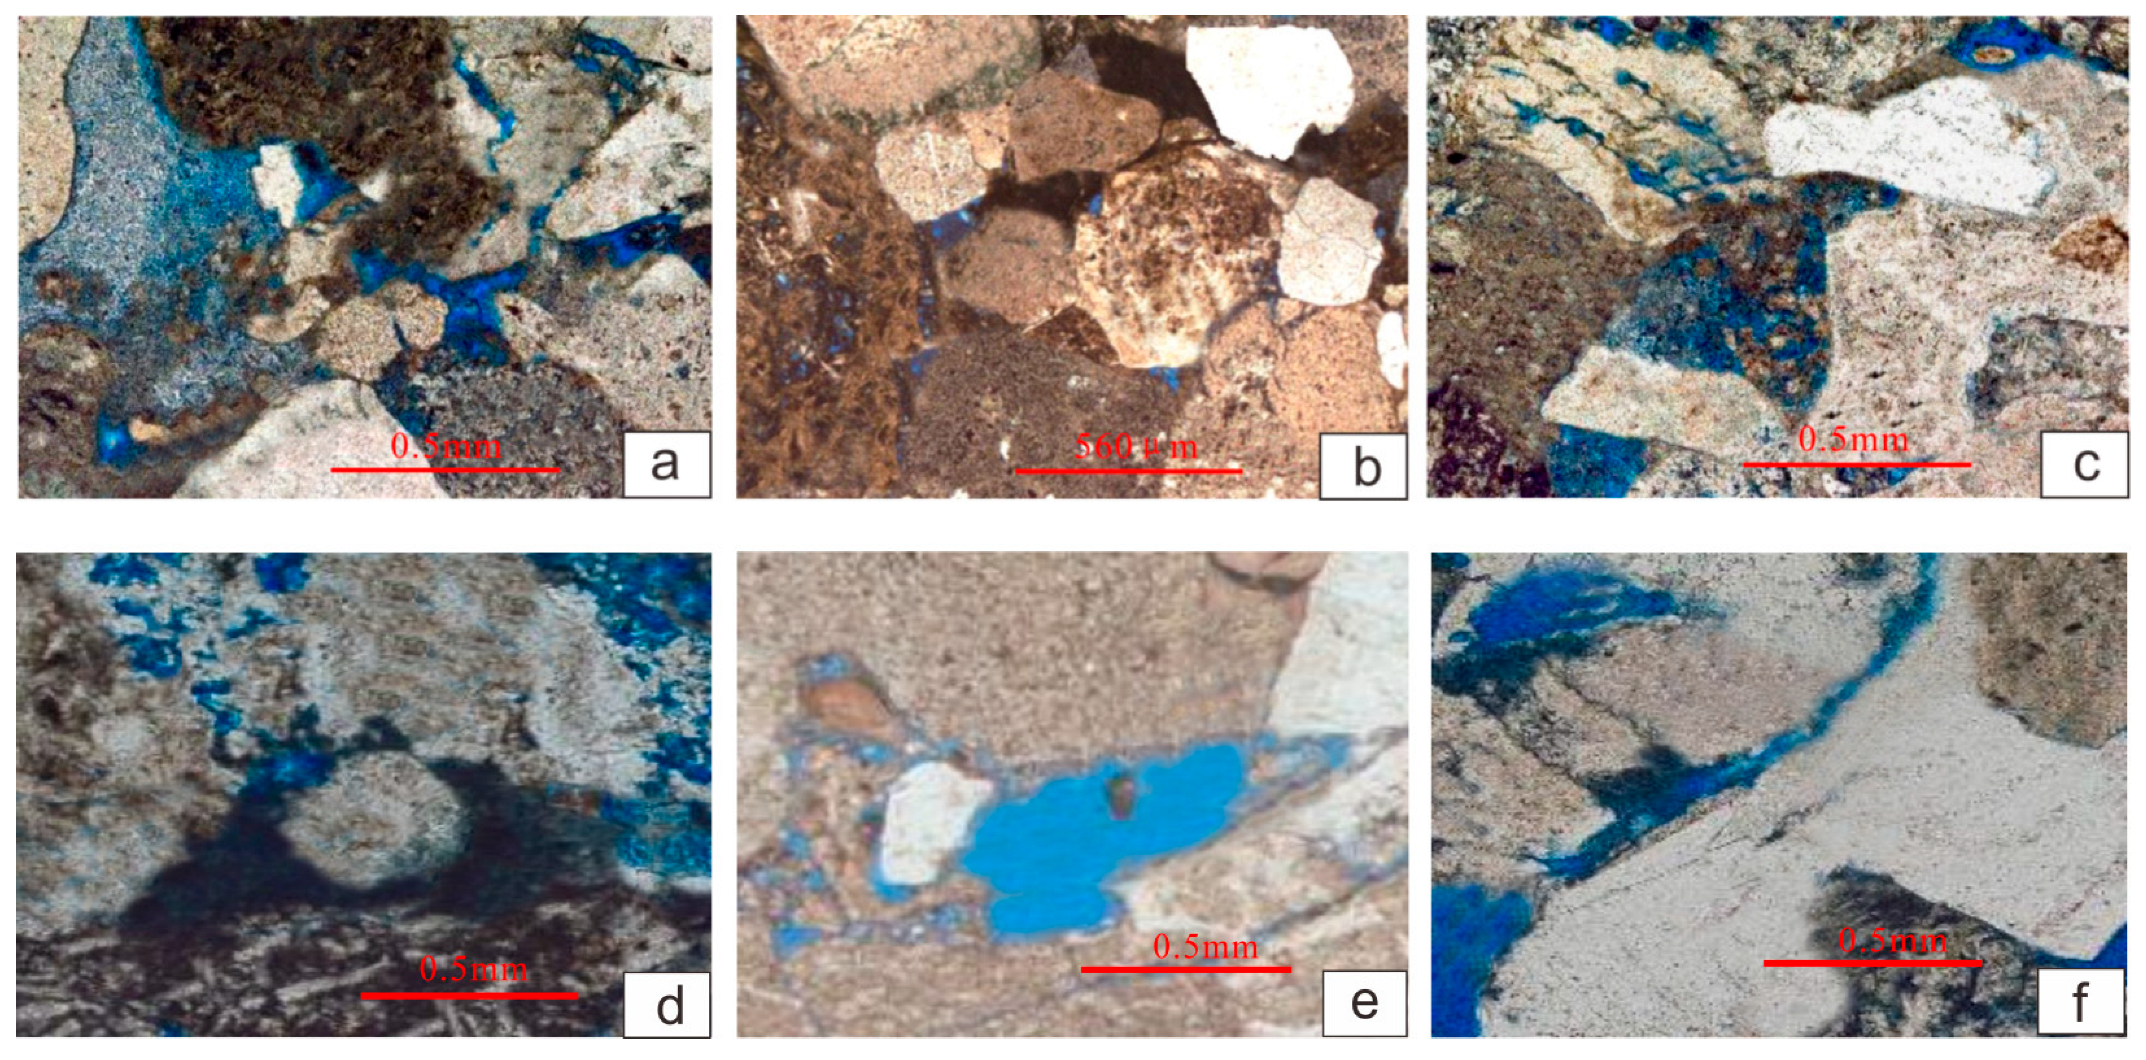
Diagenetic processes significantly modify the primary pore structure of the fan delta conglomerates and sandstones in the Baikouquan Formation. Pore-throat geometry is a key factor affecting reservoir properties. Reservoir pore structure undergoes complex alterations during diagenesis. Analysis of well data (cast thin sections, thin sections) and scanning electron microscopy data indicates that secondary pores dominate within the study area reservoir. The main types include:
This type of secondary pore forms when the intergranular pores of sandstones are partially filled with matrix during burial and diagenesis. Generally, these pores are large in size, evenly distributed, and have good connectivity [29]. The sandstone and conglomerate reservoirs in the study area are primarily characterized by intergranular pores, and exhibit favorable pore-throat characteristics along with relatively high porosity and permeability (Figure 2a,f).
During the diagenetic process, pores formed by the dissolution or metasomatism of clastic particles, cements, and impurities in sandstone and conglomerate are termed dissolution pores [30]. Figure 2b shows that dissolution pores are also present in the second member of the Baikouquan Formation, including intragranular dissolution pores and intergranular dissolution pores. Well Ma 18 exhibits intragranular dissolution pores, where particles are partially dissolved, and the resulting pores connect with pre-existing pores. These dissolution pores account for 20% of the pore space in the second member reservoirs of the Baikouquan Formation and constitute the main storage space for oil and gas [31].
Lithologic fractures are fractures formed under sedimentary processes’ control. In thin sections, these fractures often exhibit a specific orientation and length. With increasing distance, the fractures may terminate or narrow. Fractures can significantly enhance the permeability of sandstone and conglomerate reservoirs, thereby improving overall reservoir quality [32] (Figure 2c–e).

4.1.2. Sedimentary Microfacies Characteristics

The second member of the Baikouquan Formation in the X area of the Mahu sag comprises fan delta front deposits, primarily consisting of microfacies such as subaqueous distributary channels, interdistributary bays, and distal bars.
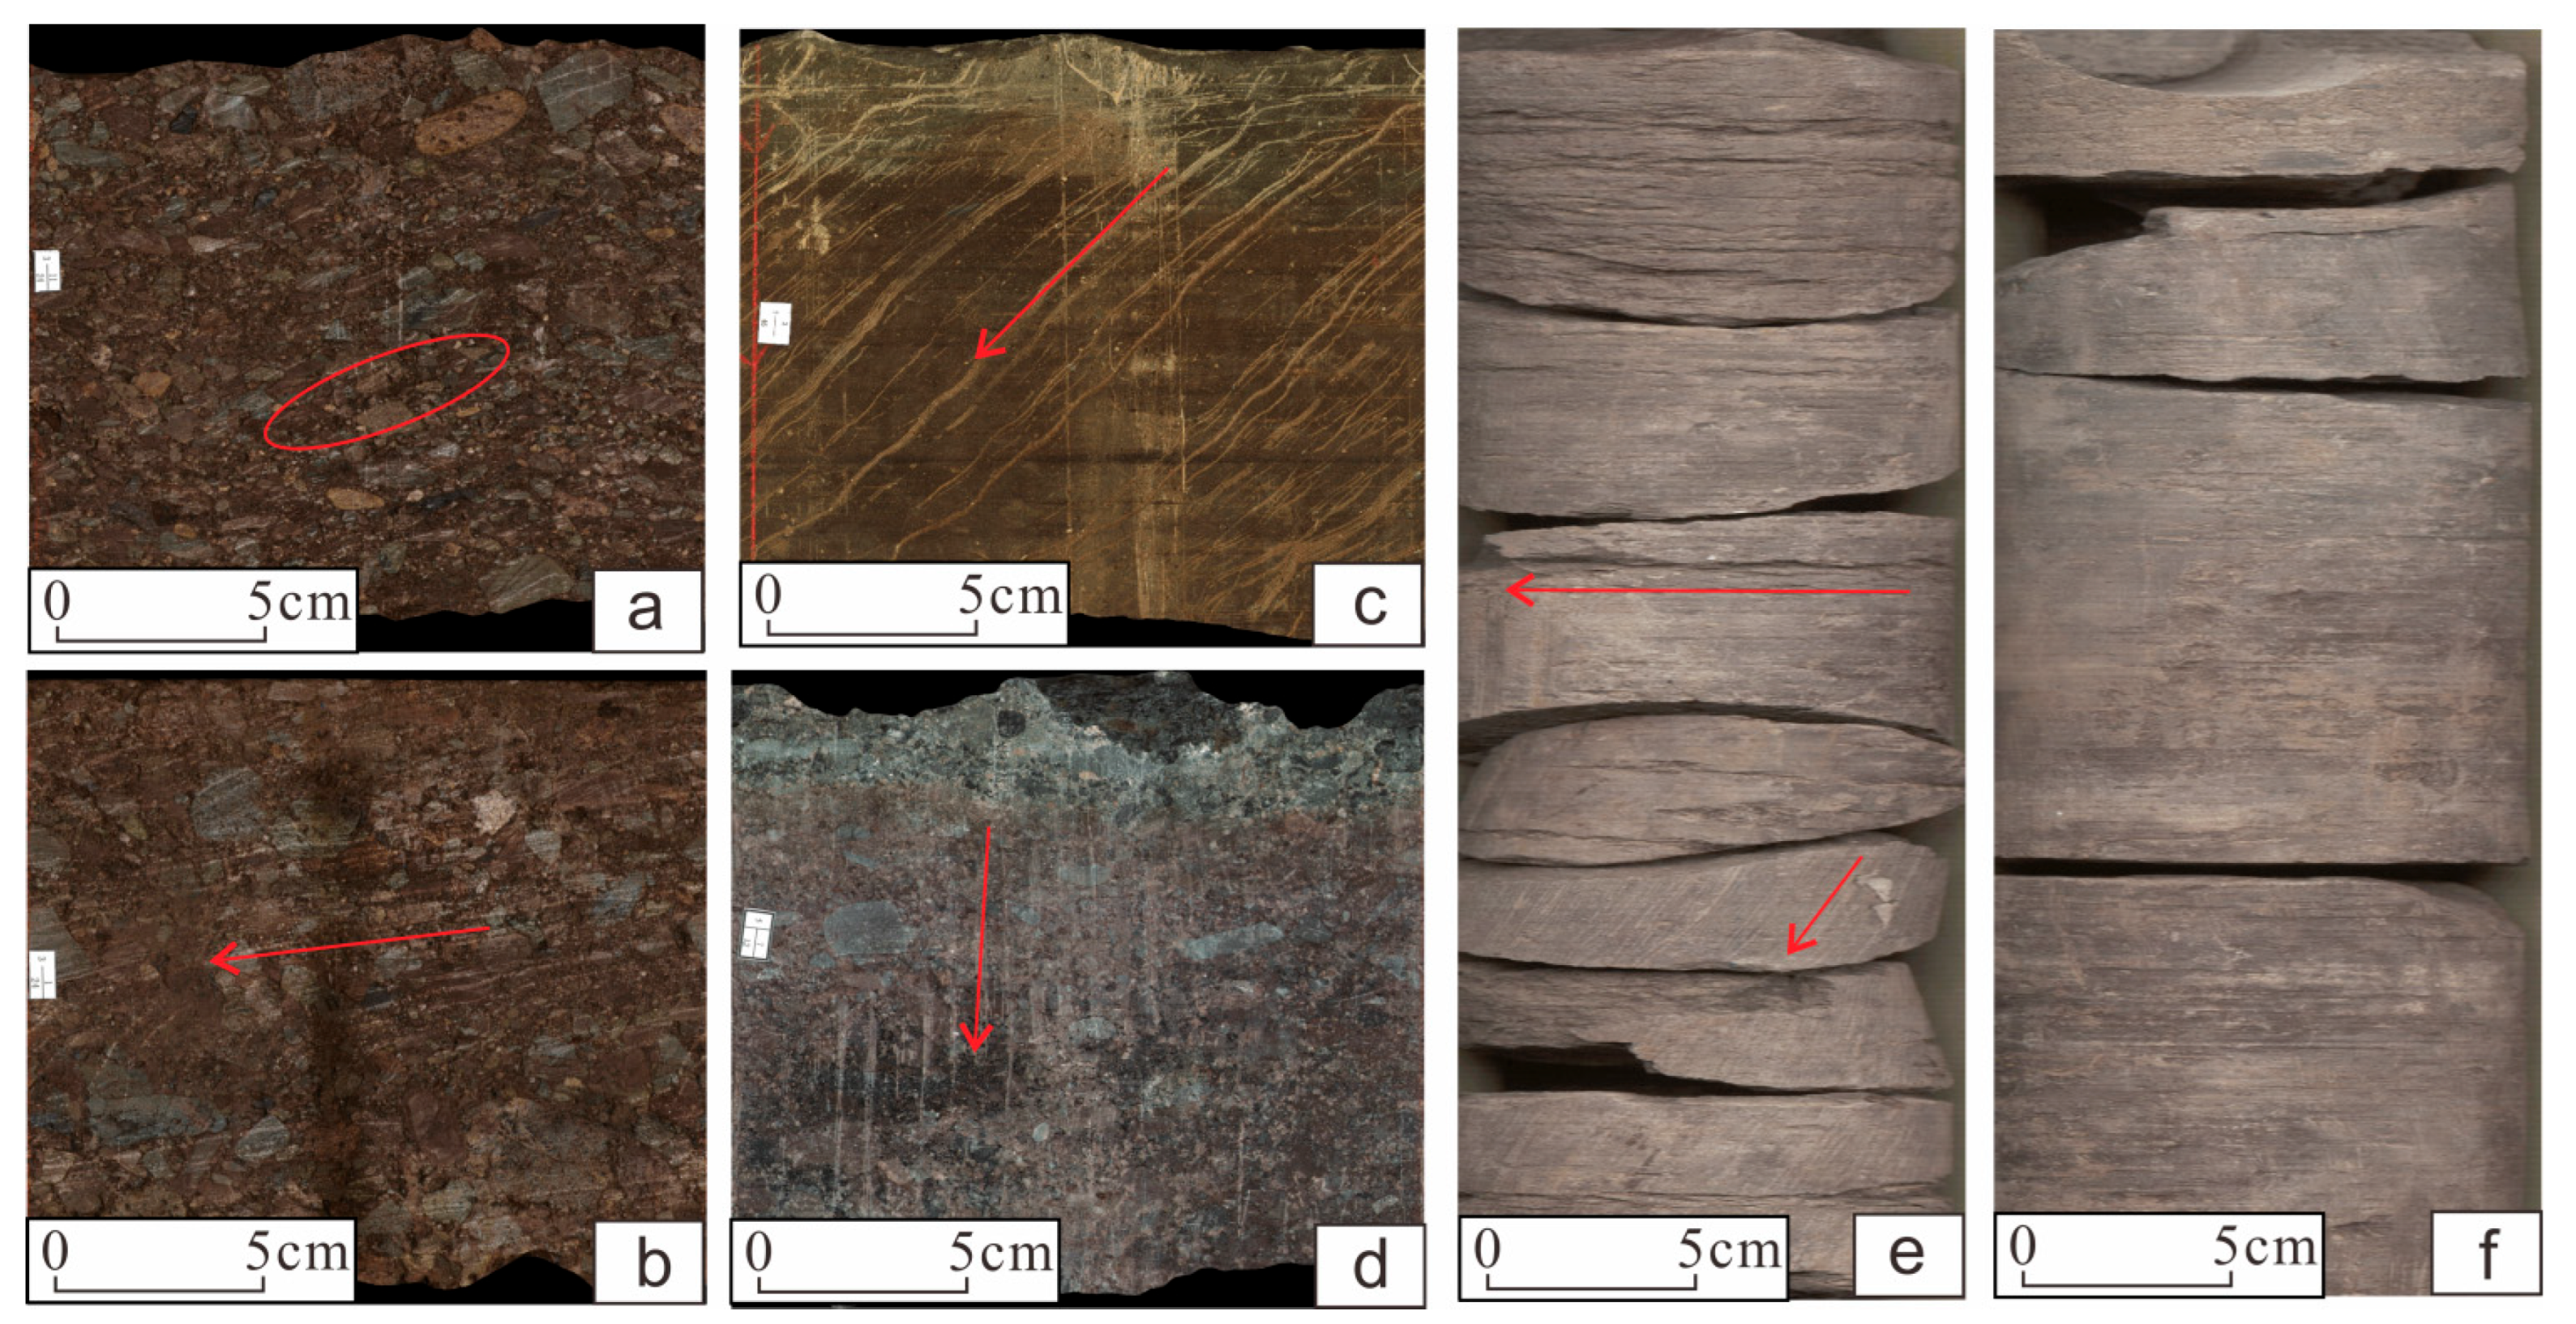
The subaqueous distributary channel in the study area is the subaqueous extension of the delta plain distributary channel that enters the lake. Its lithology is relatively coarse, predominantly light gray or gray-green fine sandstone (Figure 3a), with locally siltstone and very low mud content. The core exhibits distinct sedimentary structures of traction flow origin, such as planar and trough cross-bedding (Figure 3b).
Subaqueous interdistributary bays on the subaqueous fan delta front represent fine-grained deposits formed by overbank sedimentation between subaqueous distributary channels. Due to the flatter terrain and weaker hydrodynamic conditions, these deposits are widely distributed but exhibit smaller thickness. The main lithology of this microfacies is a light gray to grayish-green assemblage of sandstone and mudstone. Horizontal laminations are commonly developed in the cores (Figure 3c,d). Subaqueous interdistributary bay deposits exhibit a characteristic thickness of 4.5 m, constrained by core and log data from Wells AIHU4 and AIHU10.
The distal bar microfacies developed at the end of the subaqueous distributary channel margin at the front of the fan delta. This microfacies is typically parallel to the shoreline. Its lithology consists of sandstone and siltstone, locally interbedded with thin mudstone layers, exhibiting moderate to good sorting and subrounded grains (Figure 3e,f). This microfacies is dominated by horizontally laminated sandstone and siltstone, reflecting the slow settling of fine-grained sediments in a low-energy hydrodynamic environment. It commonly overlies the subaqueous interdistributary bay microfacies.

4.1.3. Logging Facies Characteristics

Logging curves primarily characterize the lithology of sedimentary rocks and their vertical stacking patterns. Based on the analysis of logging data from the study area, the types and characteristics of the logging curves are identified as follows.
(1)
Thick-layer box type
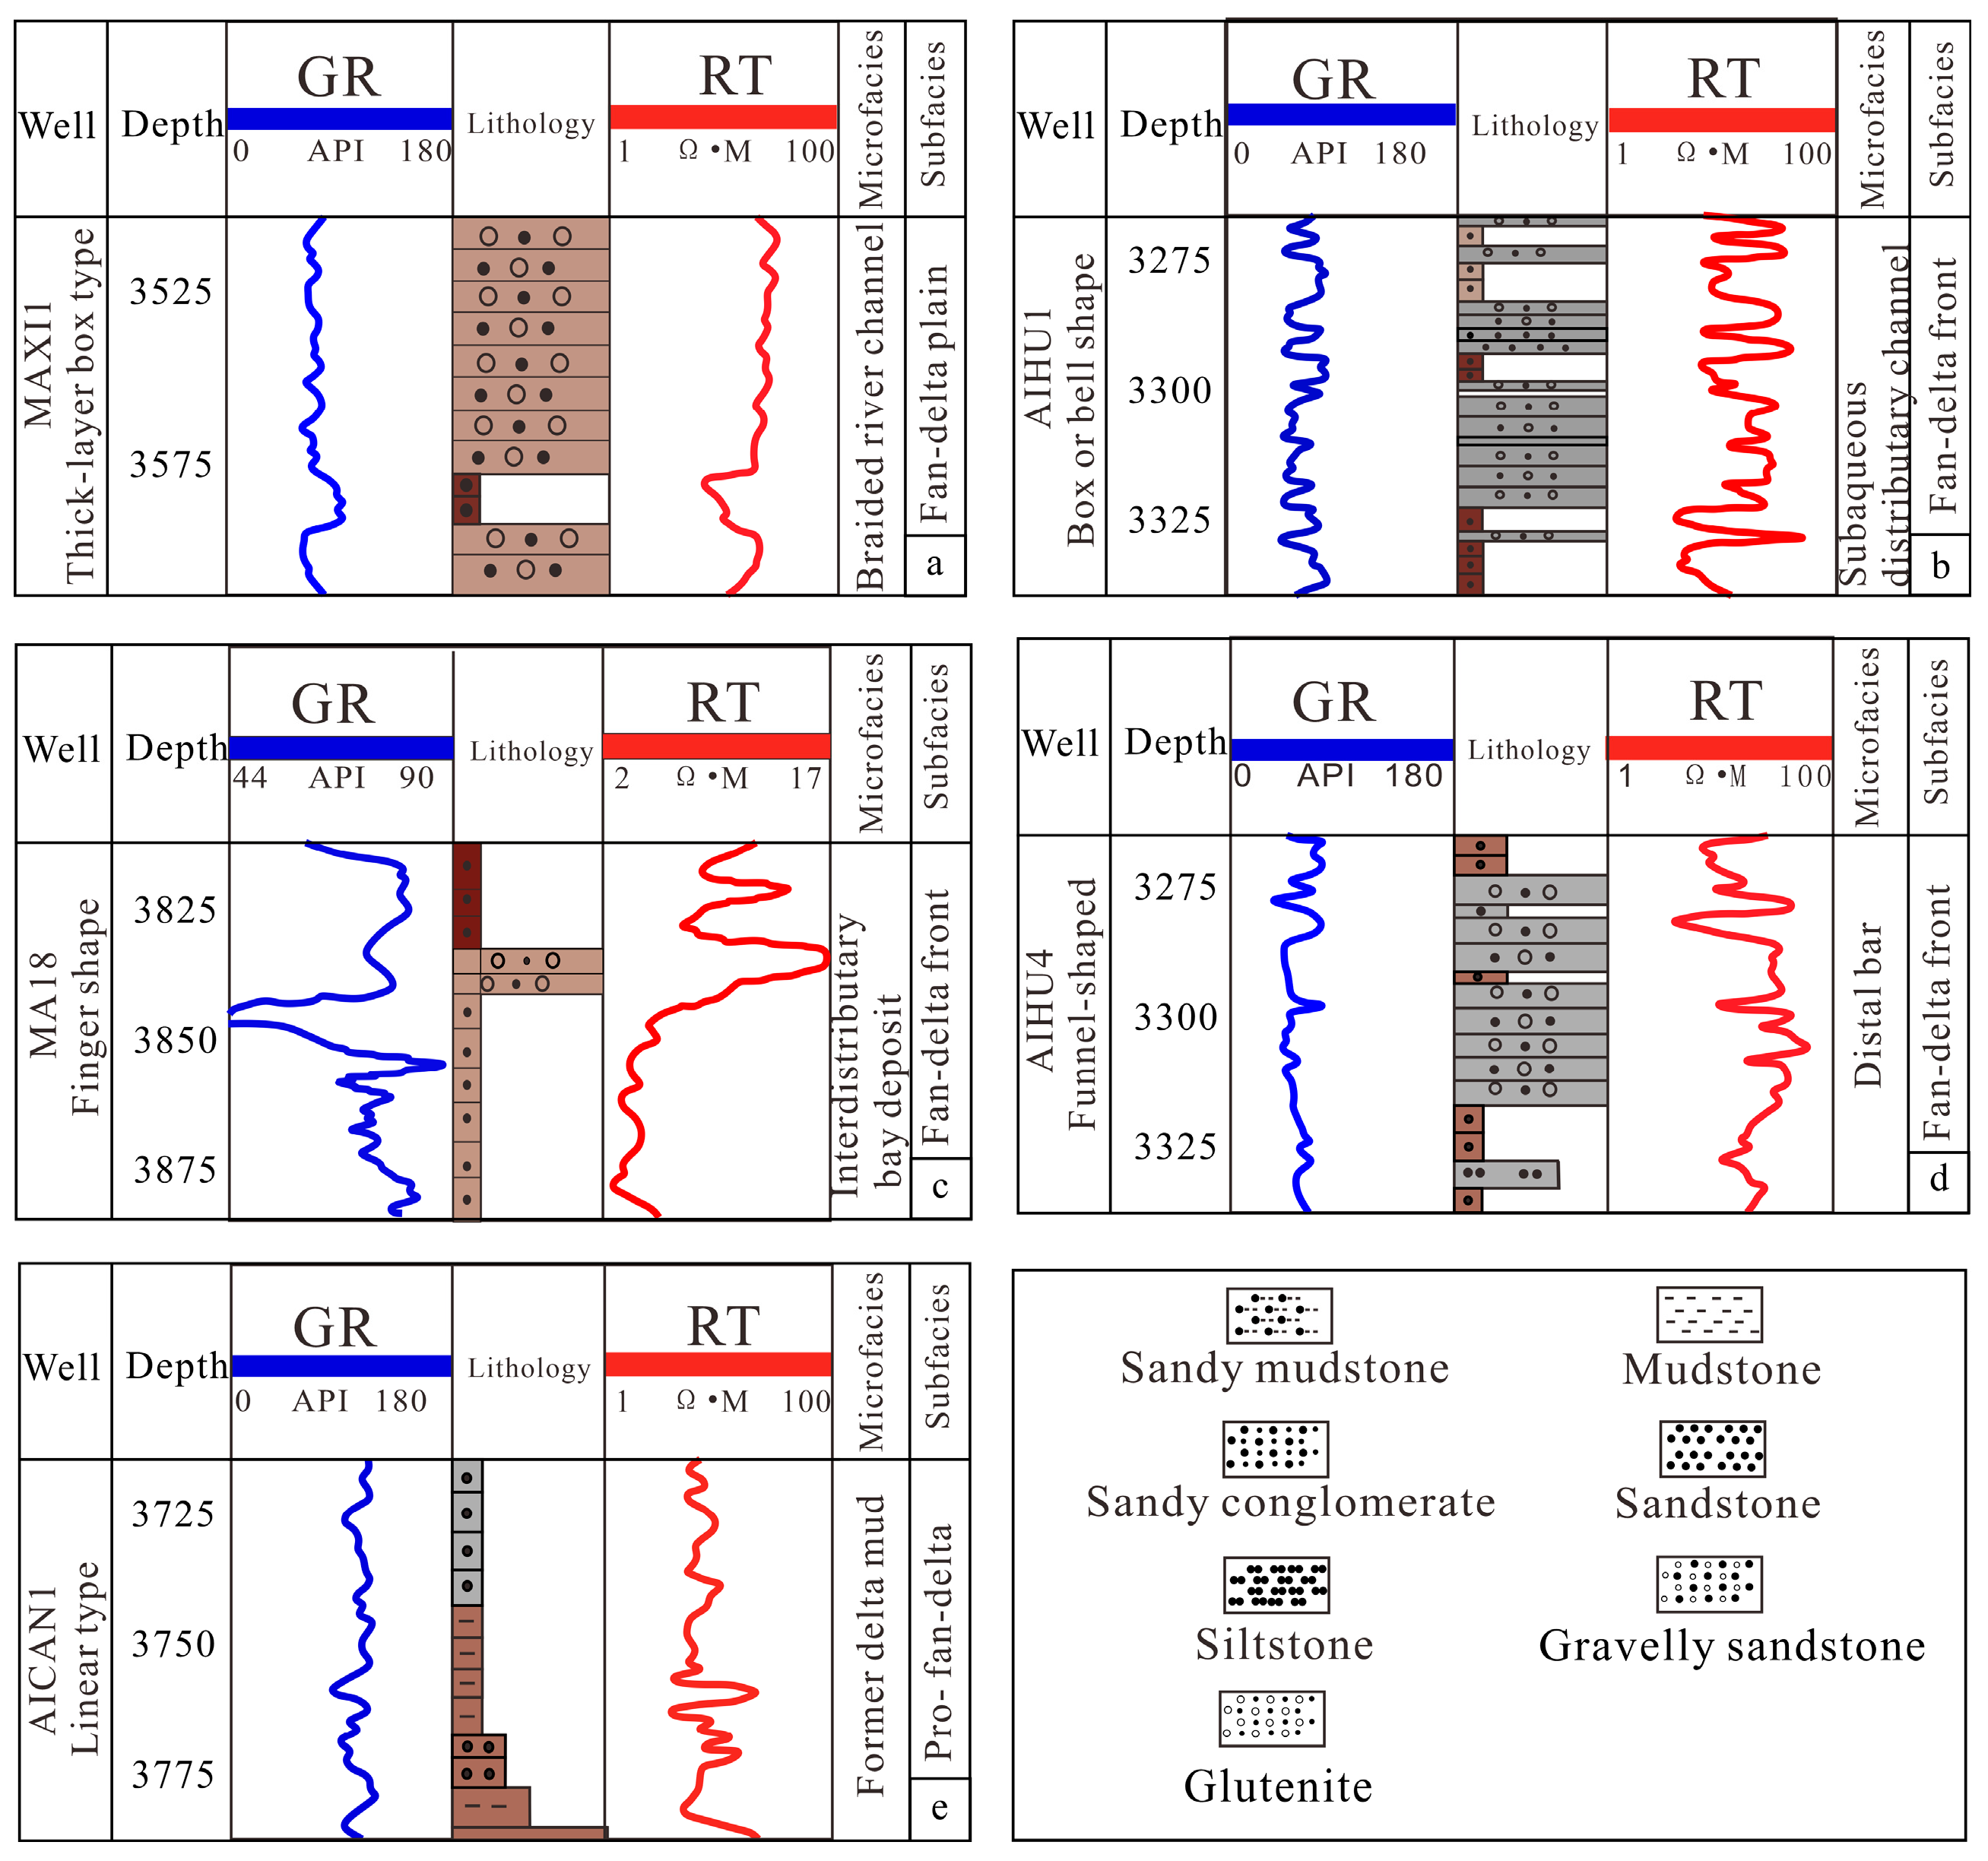
Using Well MAXI1 in area X as an example, the natural gamma-ray logging curve for the T1b2 member of the Baikouquan Formation exhibits a box-shaped morphology between 3525 and 3575 m depth. The high amplitude of this box-shaped curve suggests relatively coarse-grained size and relatively high hydraulic energy in the depositional environment. The curve is overall smooth but characterized by microserrated to serrated motifs, indicating abundant sediment supply (Figure 4a).
(2)
Bell shape
Bell-shaped logging curves are characterized by high amplitude in the middle to lower parts and low amplitude in the upper part, resulting in a morphology that is broad at the base and narrow at the top. Using Well AIHU1 as an example, the natural gamma-ray logging curve of the target interval at a depth range of 3275–3325 m exhibits a bell-shaped morphology. This is manifested by decreasing amplitude upward and a corresponding upward-fining grain size trend. The lithology comprises predominantly medium sandstone, fine sandstone, and siltstone (Figure 4b).
(3)
Finger shape
The natural gamma ray logging curve exhibits a finger pattern, characterized by its top and bottom being close to the mudstone baseline, its middle part exhibiting medium to low amplitude, and its upper and lower parts exhibiting similar values. Using Well MA18 in area X as an example, the GR curve within the 3825–3875 m depth interval of the second member displays this finger-shaped pattern. The associated lithology is predominantly fine-grained sandstone and siltstone, indicating low hydraulic energy, insufficient sediment supply, and unstable hydrodynamic conditions in the depositional environment (Figure 3c).
(4)
Funnel-shape
The natural gamma-ray (GR) logging curve exhibits a funnel-shaped morphology: its top is close to the mudstone baseline, the GR amplitude sharply decreases to medium-low (characteristic of sandier intervals) in the upper part, and then gradually approaches the mudstone baseline again towards the base. Using Well AIHU4 in area X as an example, the GR curve within the depth interval of 3275–3325 m in the second member of the Baikouquan Formation is funnel-shaped. Medium-low GR amplitude indicates finer-grained sediment, and the corresponding lithology is mainly argillaceous siltstone and fine sandstone (Figure 4d).
(5)
Linear type
In gamma-ray log interpretation, a straight-line natural gamma-ray (GR) curve exhibits a featureless morphology. Using Well AICAN1 in area X as an example, the natural gamma-ray (GR) curve is straight-line within the depth interval from 3725 to 3775 m in the second member of the Baikouquan Formation. The low-amplitude natural gamma logging curve and the natural potential logging curve with low negative anomalies generally indicate a higher content of clay in the sediment. The lithology corresponding to the straight logging curve in area X is mainly silty mudstone and mudstone, indicating that the hydrodynamic conditions during the sedimentary period were weak and the supply of material sources was insufficient (Figure 4e).

4.1.4. Seismic Facies Characteristics

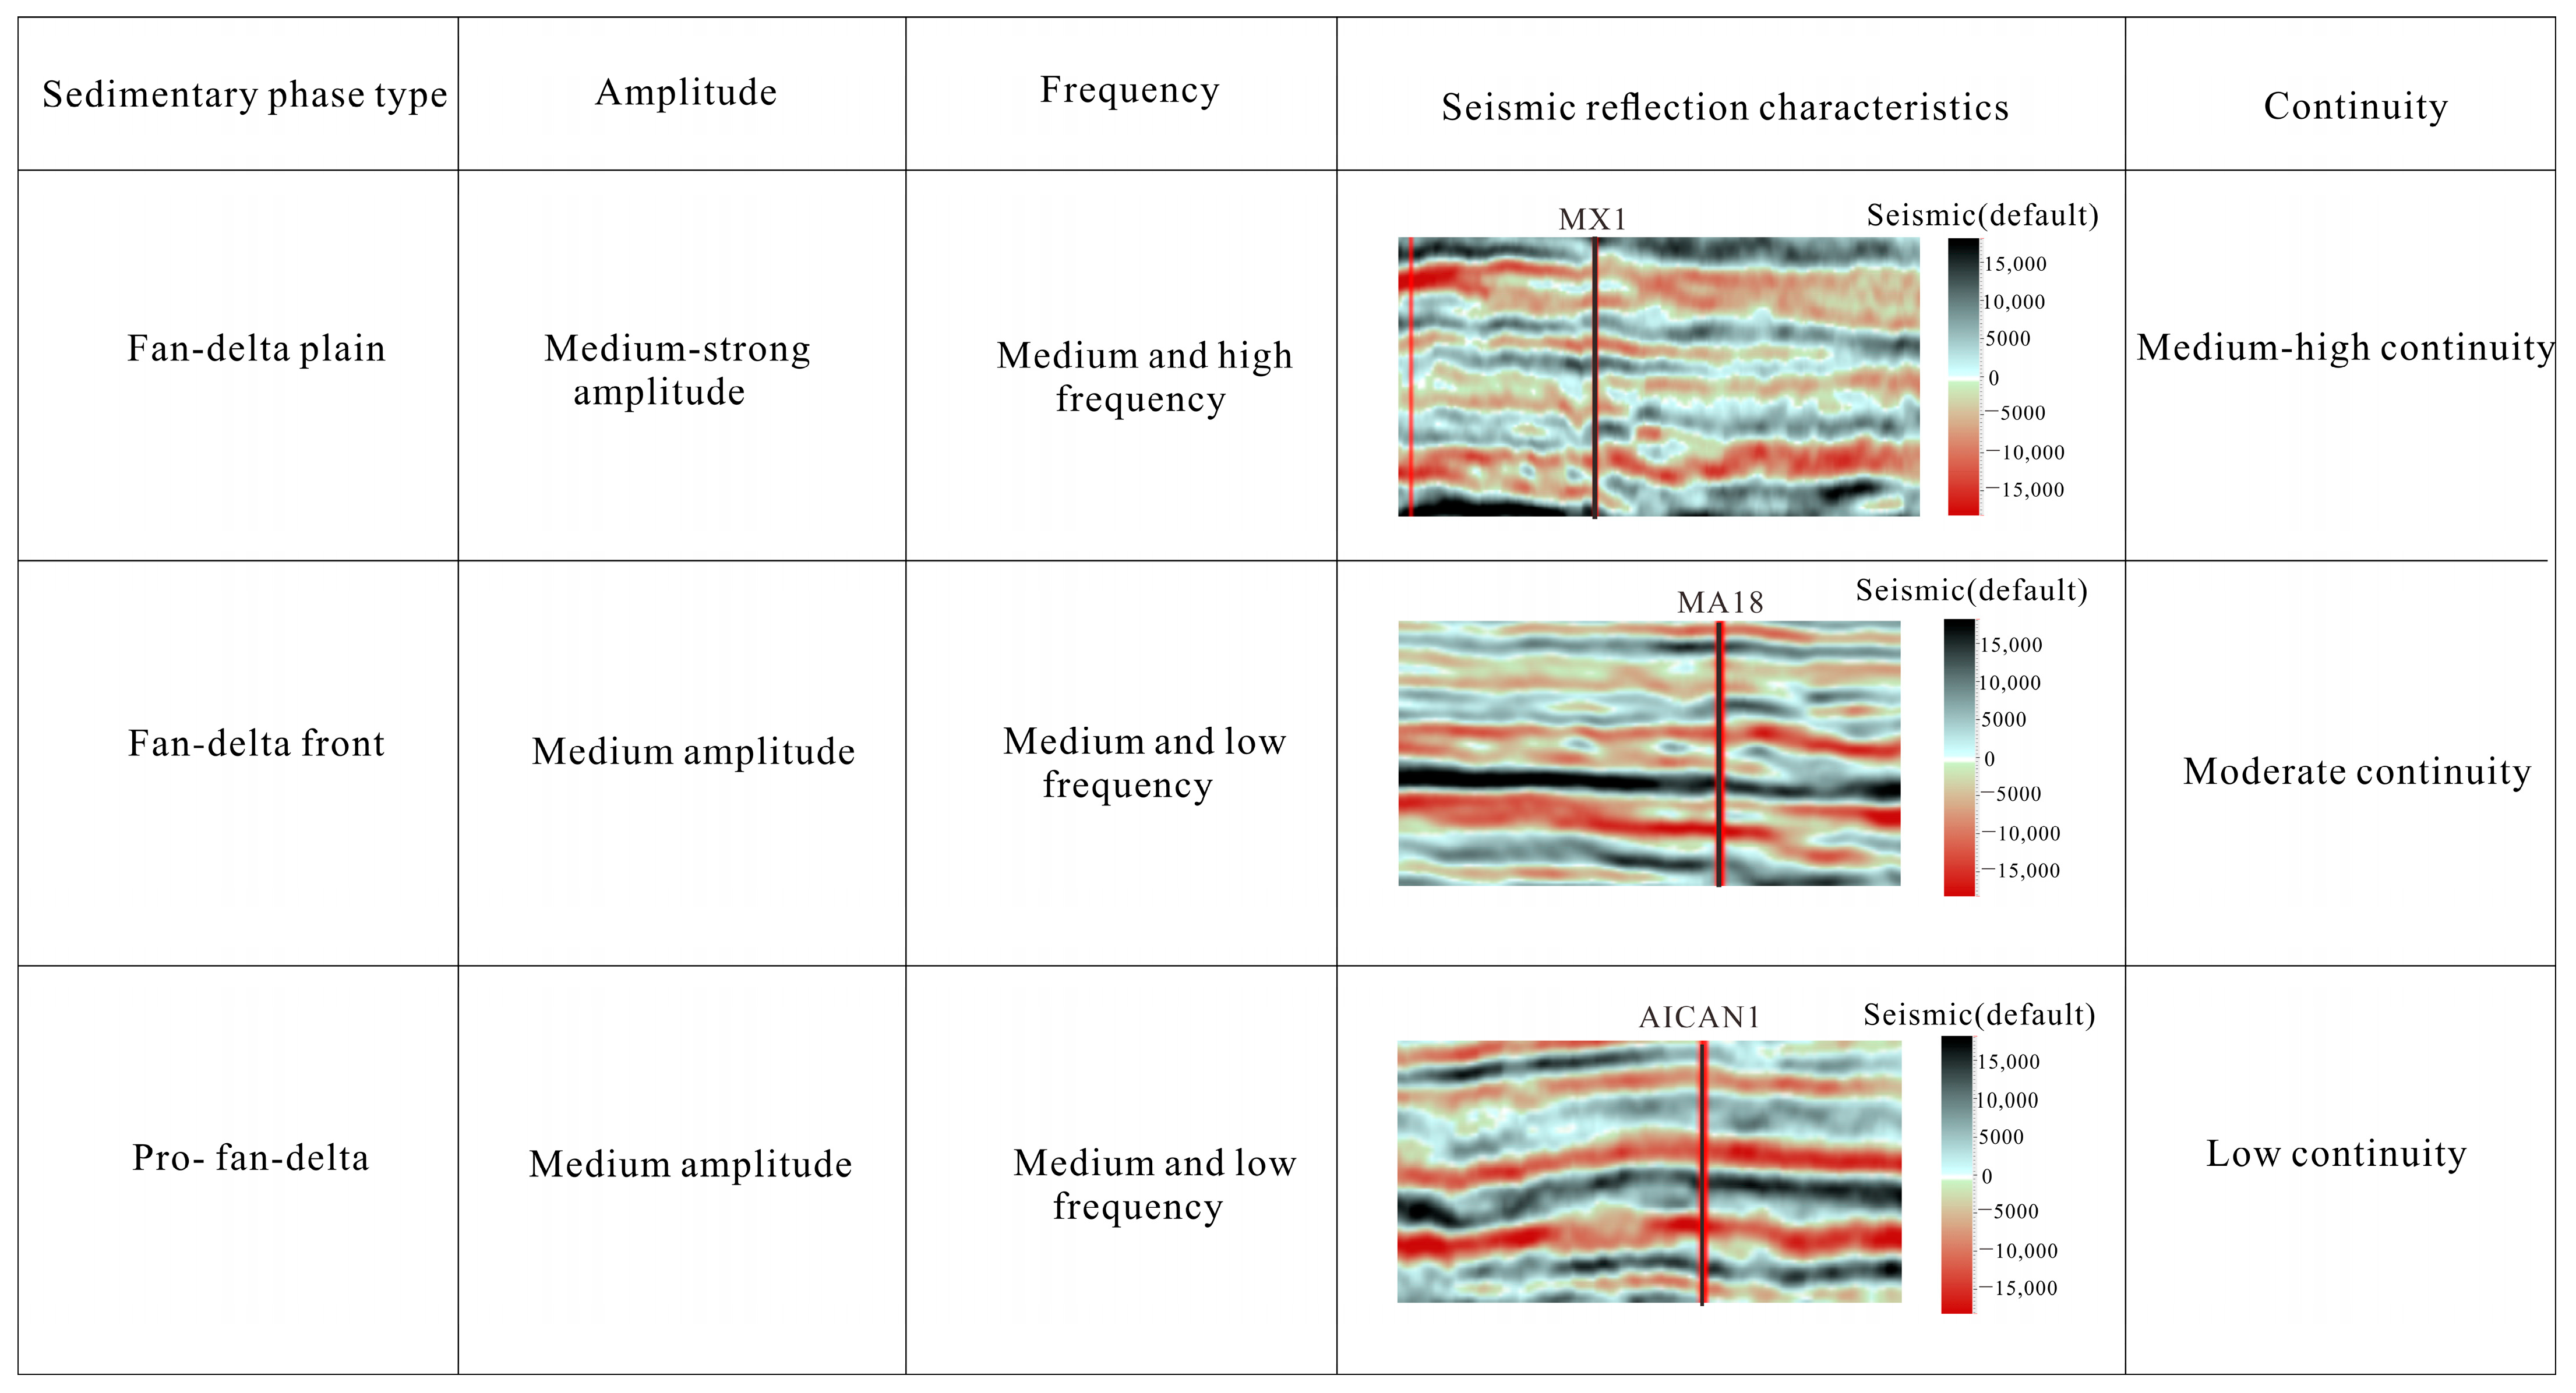
Seismic facies represent the visualization allowing interpretation of geological properties of sedimentary systems in seismic reflection profiles. Figure 5: Seismic calibration reveals the seismic response traits of the fan delta facies within the study region. In the Area X region, the seismic activity of the fan-delta plain’s rock formations-specifically within the T1b2 layer of the Baikouquan Formation-exhibits subtle seismic waves, patchy echoes, and a jumbled arrangement of reflective layers. The fan delta front exhibits extensive, frequent, and uninterrupted reflections. The prodelta facies show moderate amplitude, frequency, and continuity.

4.2. Planar Distribution of Sedimentary Facies

Stratigraphic slicing is a key technique in seismic sedimentology [32]. The seismic amplitude distribution within stratal slices provides critical lithologic and geomorphic information for plan-view sedimentary microfacies analysis. Effective seismic geomorphological imaging requires extracting seismic amplitude data along chronostratigraphically significant surfaces representing isochronous horizons [33]. Seismic attributes are conventionally classified into four categories: time attributes, amplitude attributes, frequency attributes, and absorption attributes. Time attributes characterize the structural framework of subsurface formations, while amplitude attributes are primarily used for lithological discrimination [34]. The lateral variation in these attributes reflects formation thickness and provides reservoir information [35]. Frequency attributes can reflect lithological changes in the strata and, to some extent, can indicate variations in the stability of the depositional environment. The absorption attenuation attribute can reflect the pore and permeability characteristics of the reservoir, as well as its hydrocarbon saturation. Conventional amplitude attributes include approximately 15 types, such as maximum peak amplitude, Root Mean Square (RMS) amplitude, average absolute amplitude, amplitude variance, and sum of absolute amplitudes [36].
The study compared and analyzed a variety of amplitude attributes by calculating the values of different attributes at existing well locations within the work area and correlating them with the sandstone thickness at the same well locations. Conventional amplitude attributes include approximately 15 types, such as maximum peak amplitude, Root Mean Square (RMS) amplitude, average absolute amplitude, amplitude variance, and sum of absolute amplitudes [37]. The study analyzed a variety of amplitude attributes by calculating the values of different attributes at existing well locations within the work area and correlating them with the sandstone thickness at the same well locations. Analysis of the correlation statistics for the 15 amplitude attributes revealed that the Root Mean Square (RMS) amplitude exhibits a strong correlation with sandstone thickness at the well locations. Specifically, the correlation coefficient between RMS amplitude and sandstone thickness is 0.83 (Table 1), indicating that this attribute effectively reflects the lateral variation in sandstone thickness within the study area.
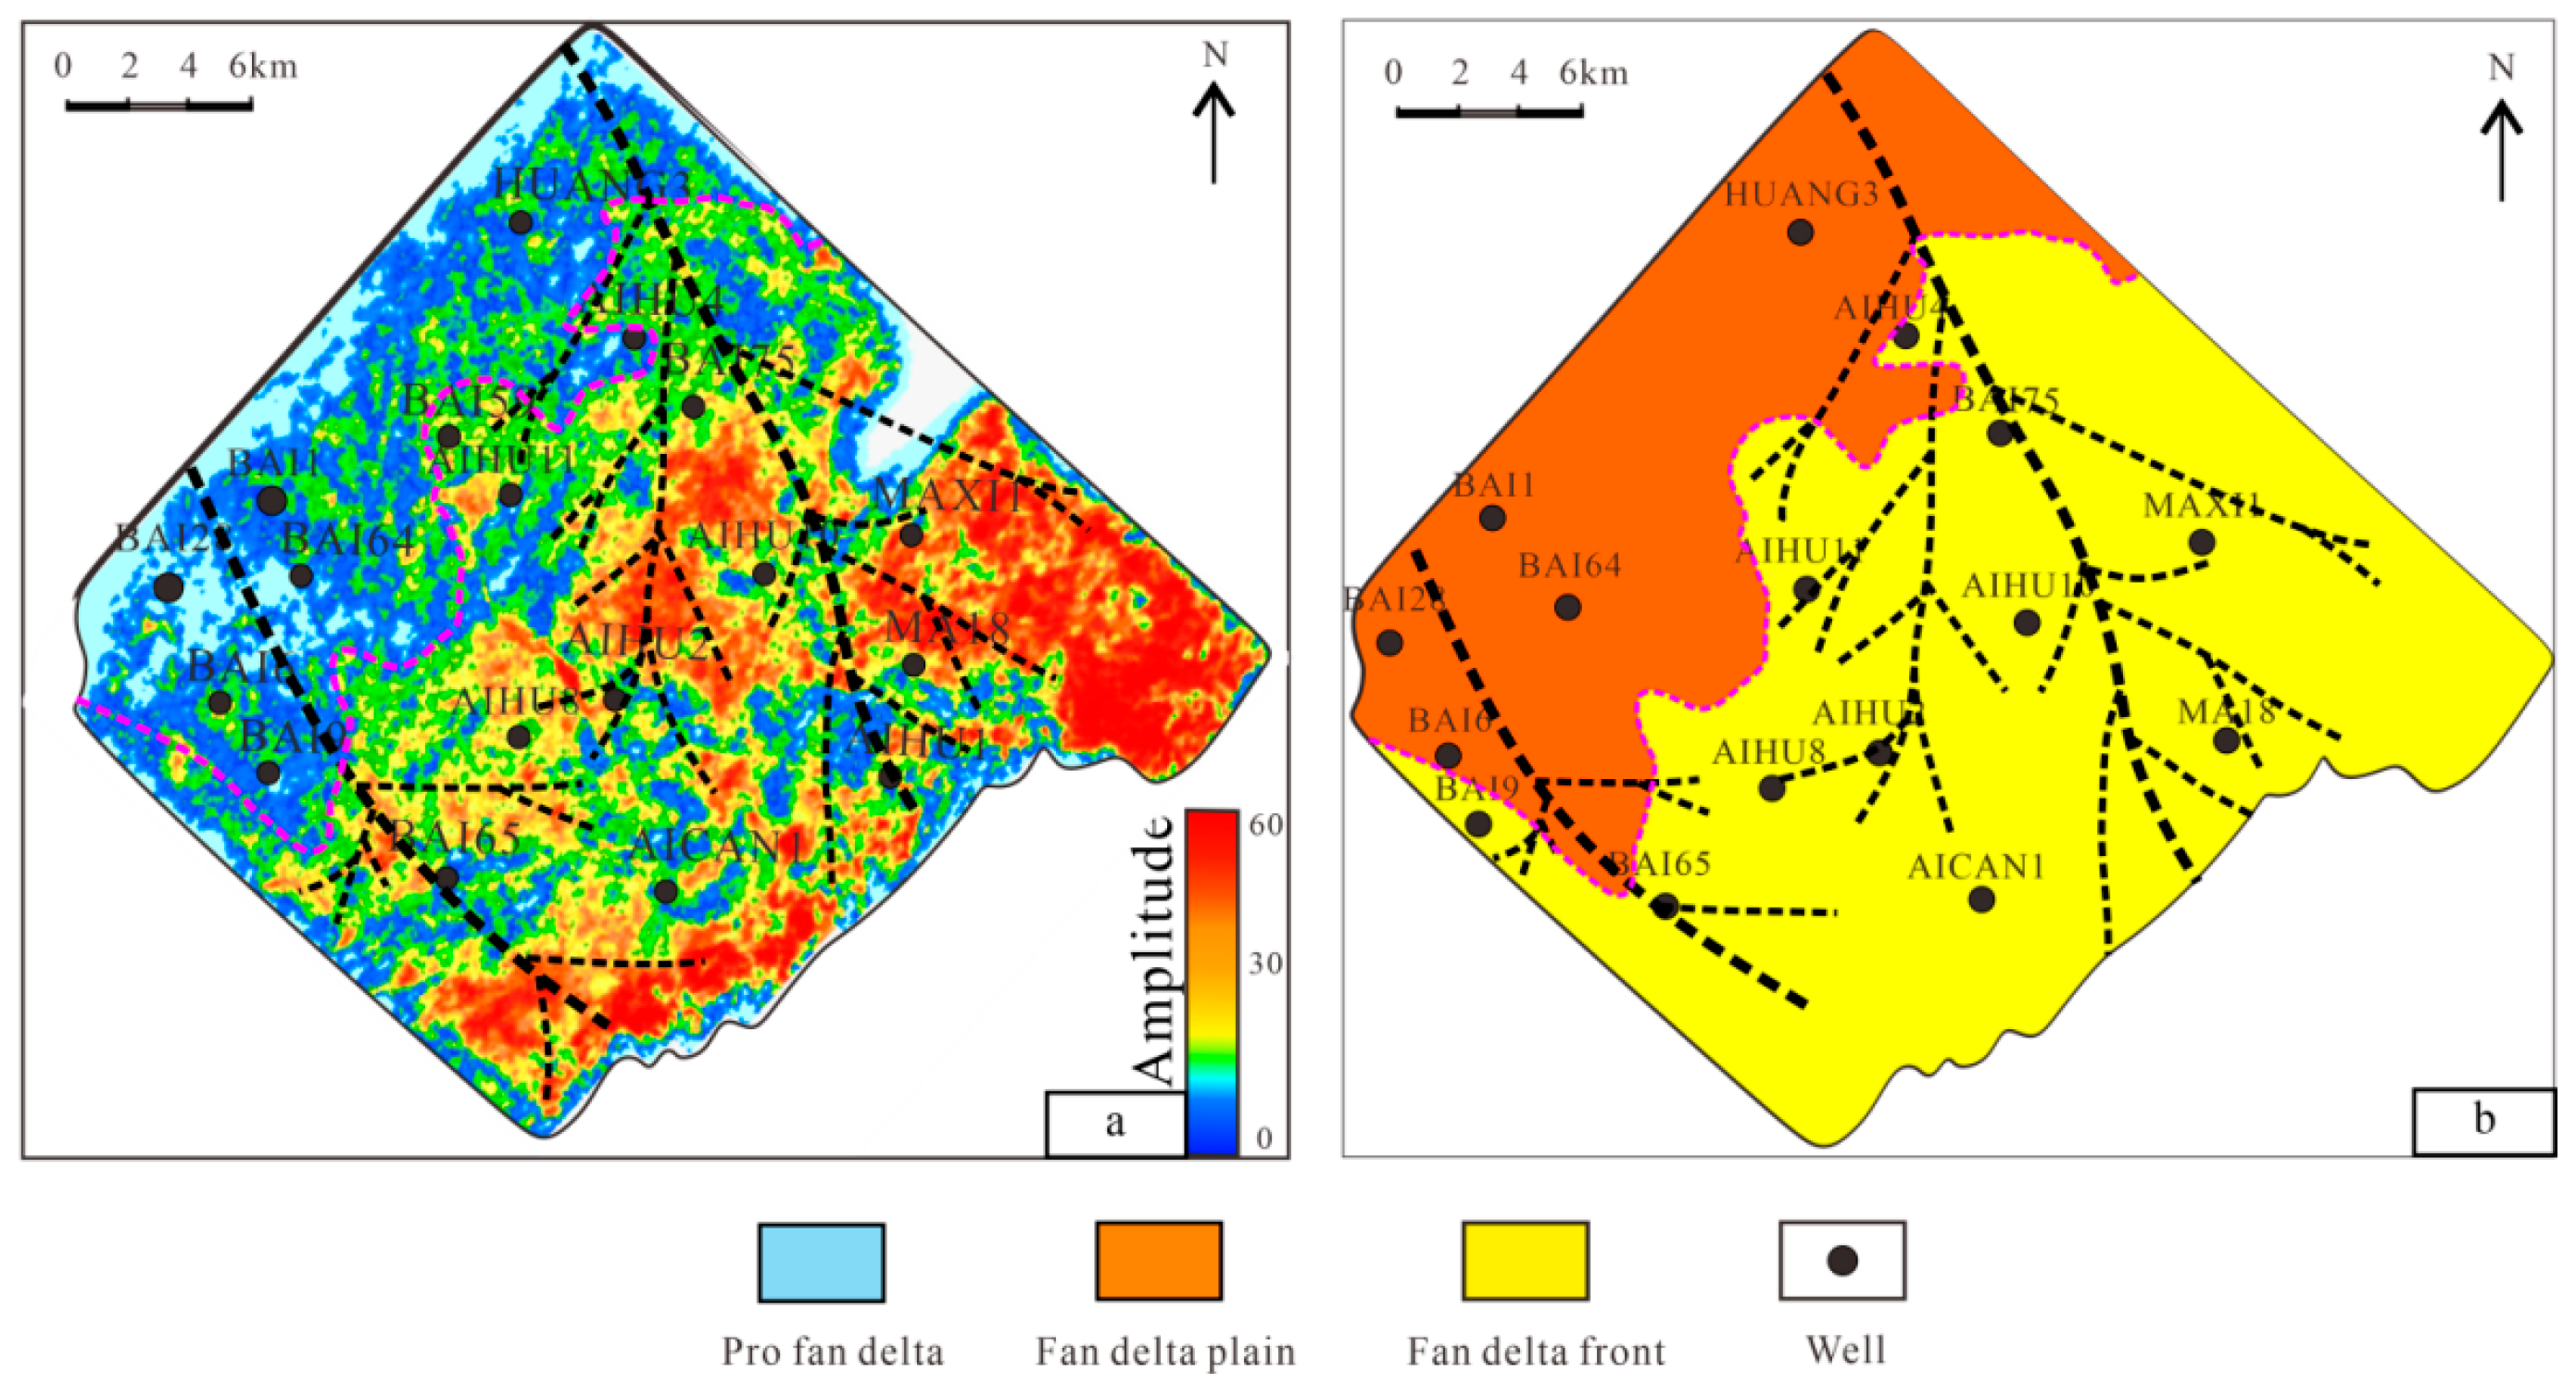
In this study, reference horizons were selected from seismic horizons corresponding to the top and bottom boundaries of stratigraphic sequences. These horizons are phase-stable, laterally continuous, and clearly traceable (Figure 5). Based on detailed seismic interpretation, stratigraphic slices were generated. Combined with analysis of sedimentary facies identification markers from single wells, these slices revealed the distribution characteristics of sedimentary microfacies within the fan delta of the second member. This analysis clarified the reservoir sand body enrichment zones. Therefore, the consistent-phase horizons identified on the second member attribute maps served as boundary conditions for the low-frequency model used in seismic inversion and interpretation. Figure 6a shows the Root Mean Square (RMS) amplitude attribute map for the target horizon. On this map, red and yellow areas represent strong amplitude responses (high RMS values), while blue areas represent weak amplitude responses (low RMS values). Based on seismic-to-well calibration, high RMS values correspond to areas of greater sand thickness (Figure 6a). The RMS amplitude map for the second member generally exhibits good continuity. Additionally, it reveals localized low-value areas and channel sand body distribution patterns, with channel boundaries distinctly delineated. Integrating seismic attribute analysis with well data (including single-well facies, wireline logs, and insights from lateral facies continuity analysis), the sedimentary facies distribution map of the study area was generated using a multi-parameter mapping approach (Figure 6b). Within the study area, two NW-SE-oriented distributary channels converge near the BAI65 well, spanning a width of approximately 20 km. The second member was predominantly supplied by an NW sediment source. The channels trend north–south, with associated sand bodies better developed near the MAXI1, AIHU10, and AICAN1 wells (Figure 6a).
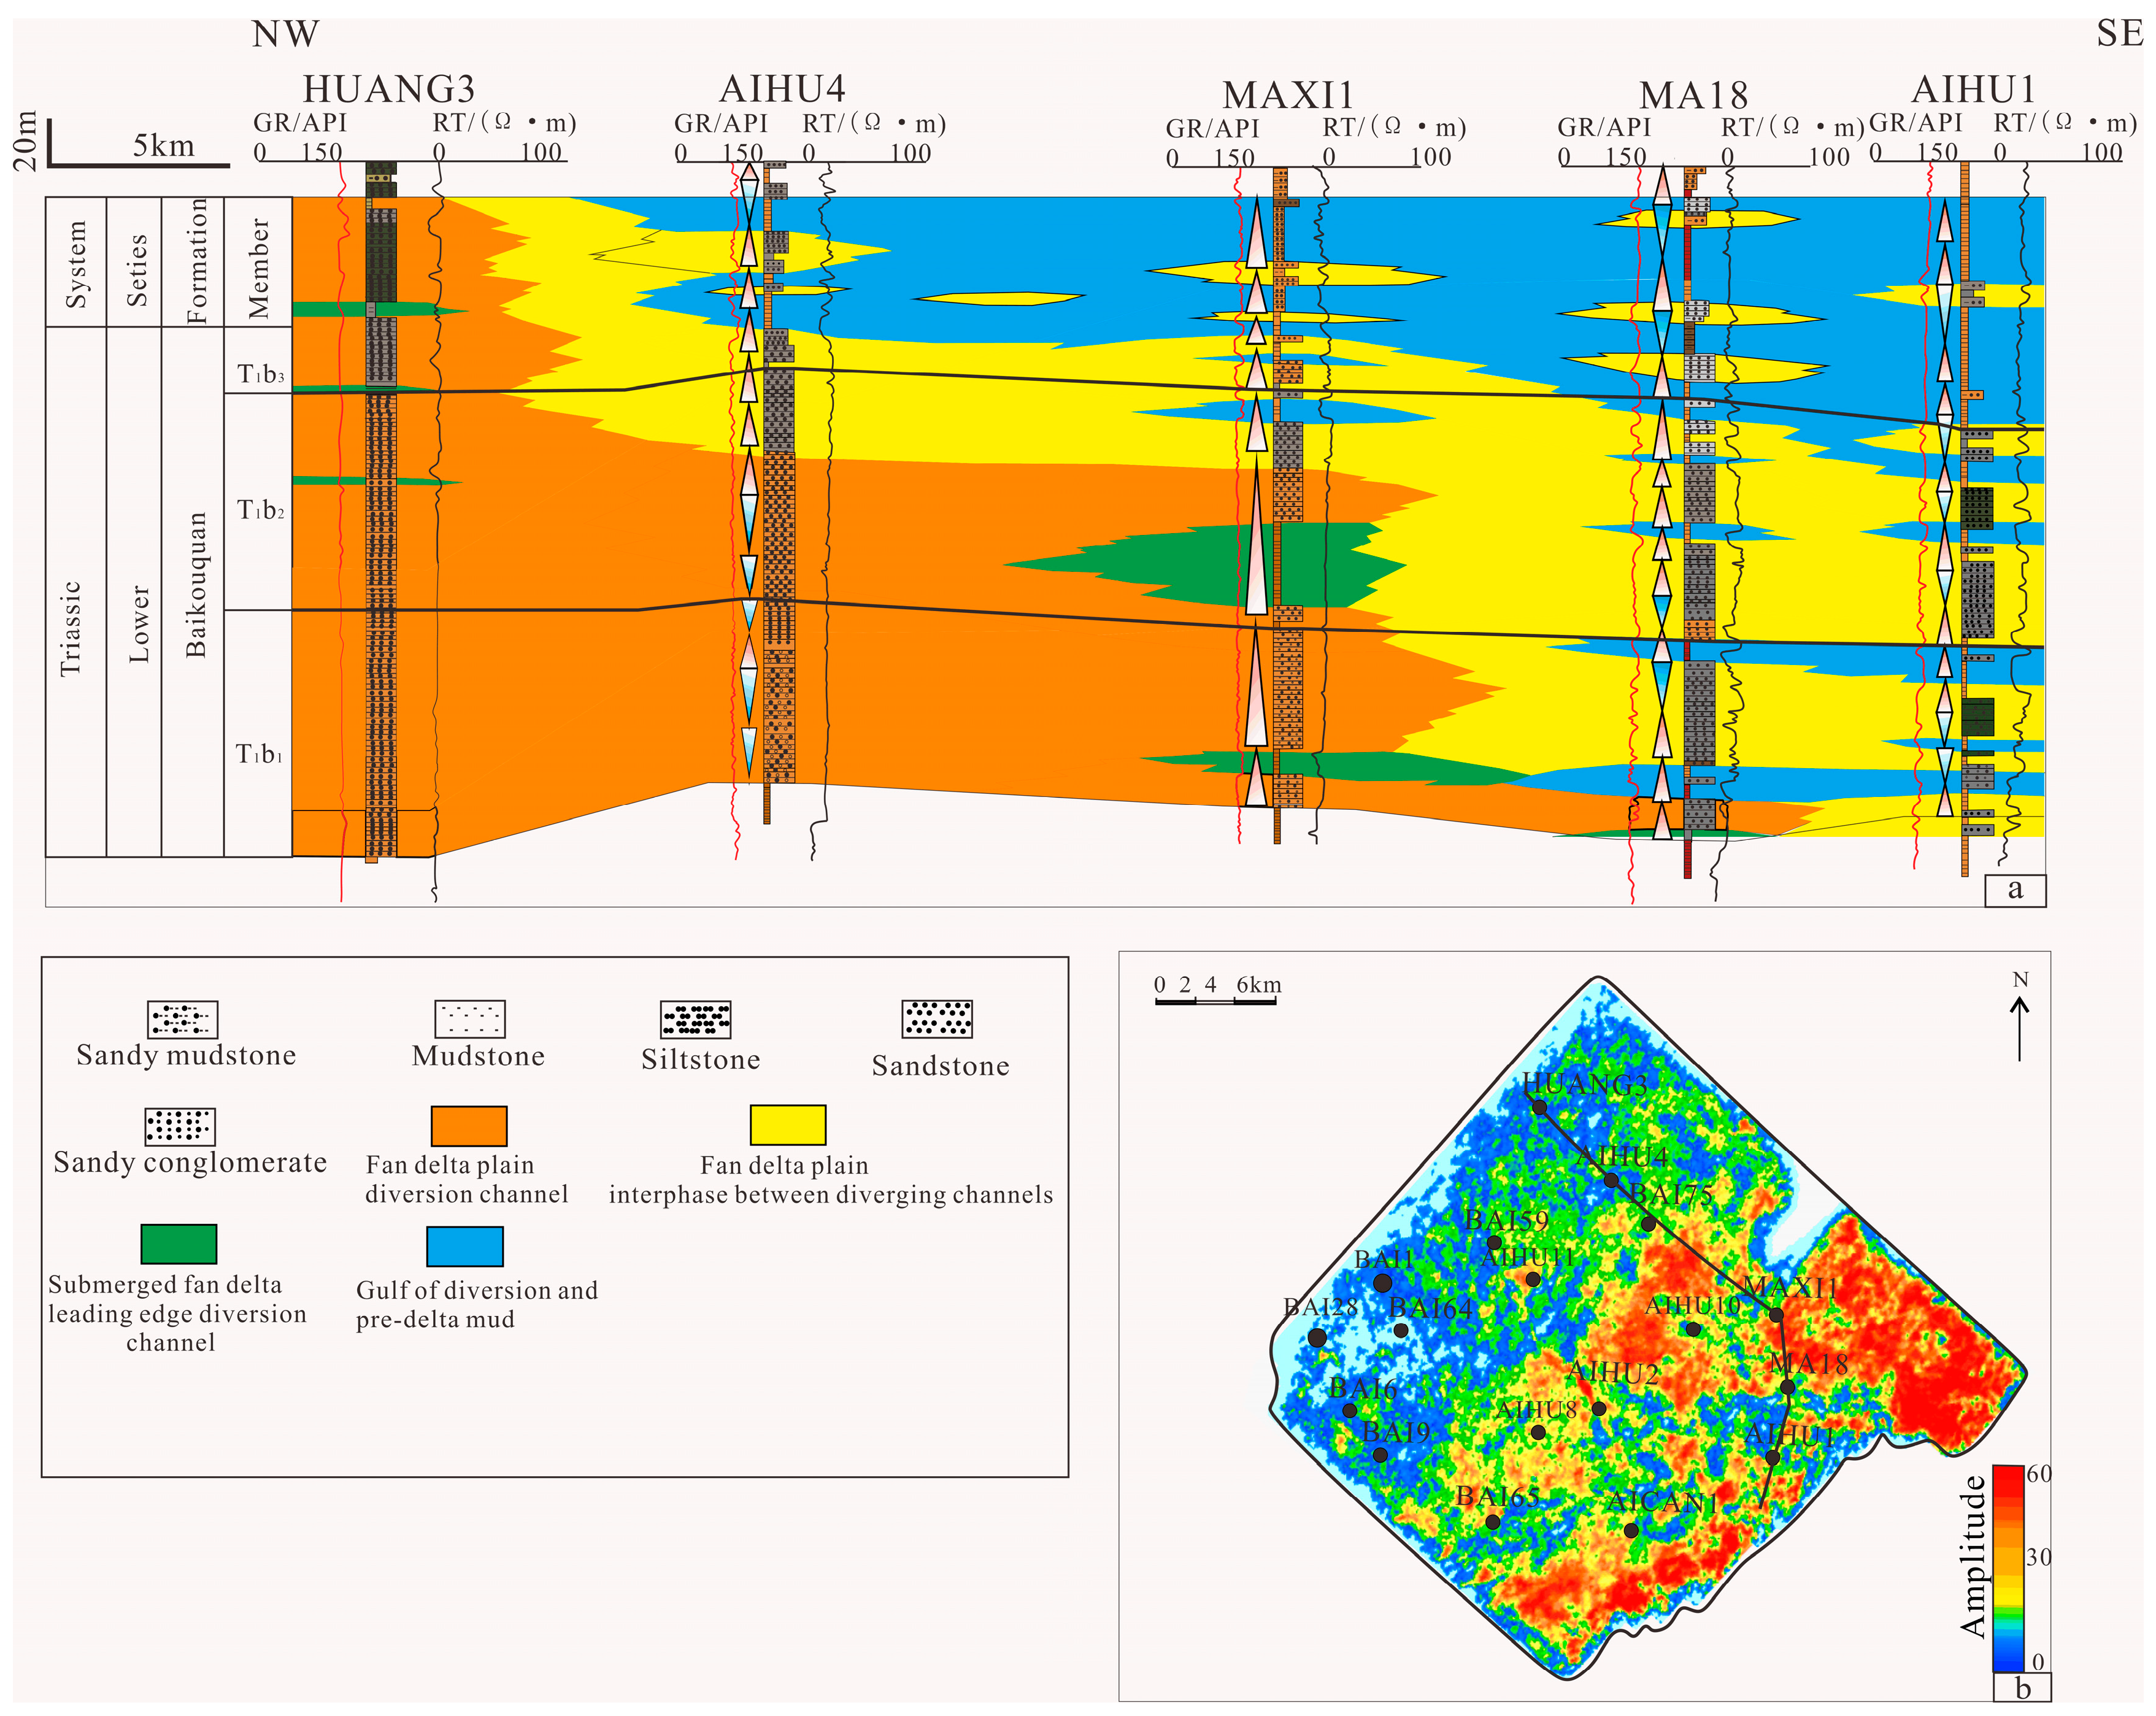
It was concluded from previous research [38] that the sediment source of the study area lies in the northwestern part of the Mahu sag (Figure 1). Well-to-well correlation reveals that the stratigraphy tilts towards the depocenter with minor thickness variations. Furthermore, it shows that a regressive sequence, comprising fan delta plain, fan delta front, and prodelta deposits, has developed from the bottom up. This sequence is characterized by multistage sandy (blue and green) and gravelly bodies (yellow and orange) exhibiting vertical stacking patterns and laterally contiguous distribution (Figure 7).

4.3. Sand Body Prediction

Through the classification, characterization, and spatial distribution analysis of sedimentary microfacies within the fan delta of the second member of the Baikouquan Formation, the depositional system architecture and reservoir heterogeneity can be systematically elucidated [39]. The spatial distribution of sand bodies was constrained for Seismic Waveform Indicative Inversion by utilizing boundaries of subaqueous distributary channels and interdistributary bay facies zones [40]. Combining most of the drilled oil and gas wells in the second member of the Baikouquan Formation, the reservoir development regularity is observed. Seismic inversion and subsequent analysis were applied to the sandy second member of the Baikouquan Formation for forecasting the positioning of prospective sand reservoirs. As the second member of the Baikouquan Formation in Area X of the Mahu sag (Figure 1), it was deposited by multiple provenances, and its sand body stacking patterns are complex. This complexity makes it difficult to distinguish thin sandstone beds from thin-bedded mudstone using conventional sandstone identification methods.
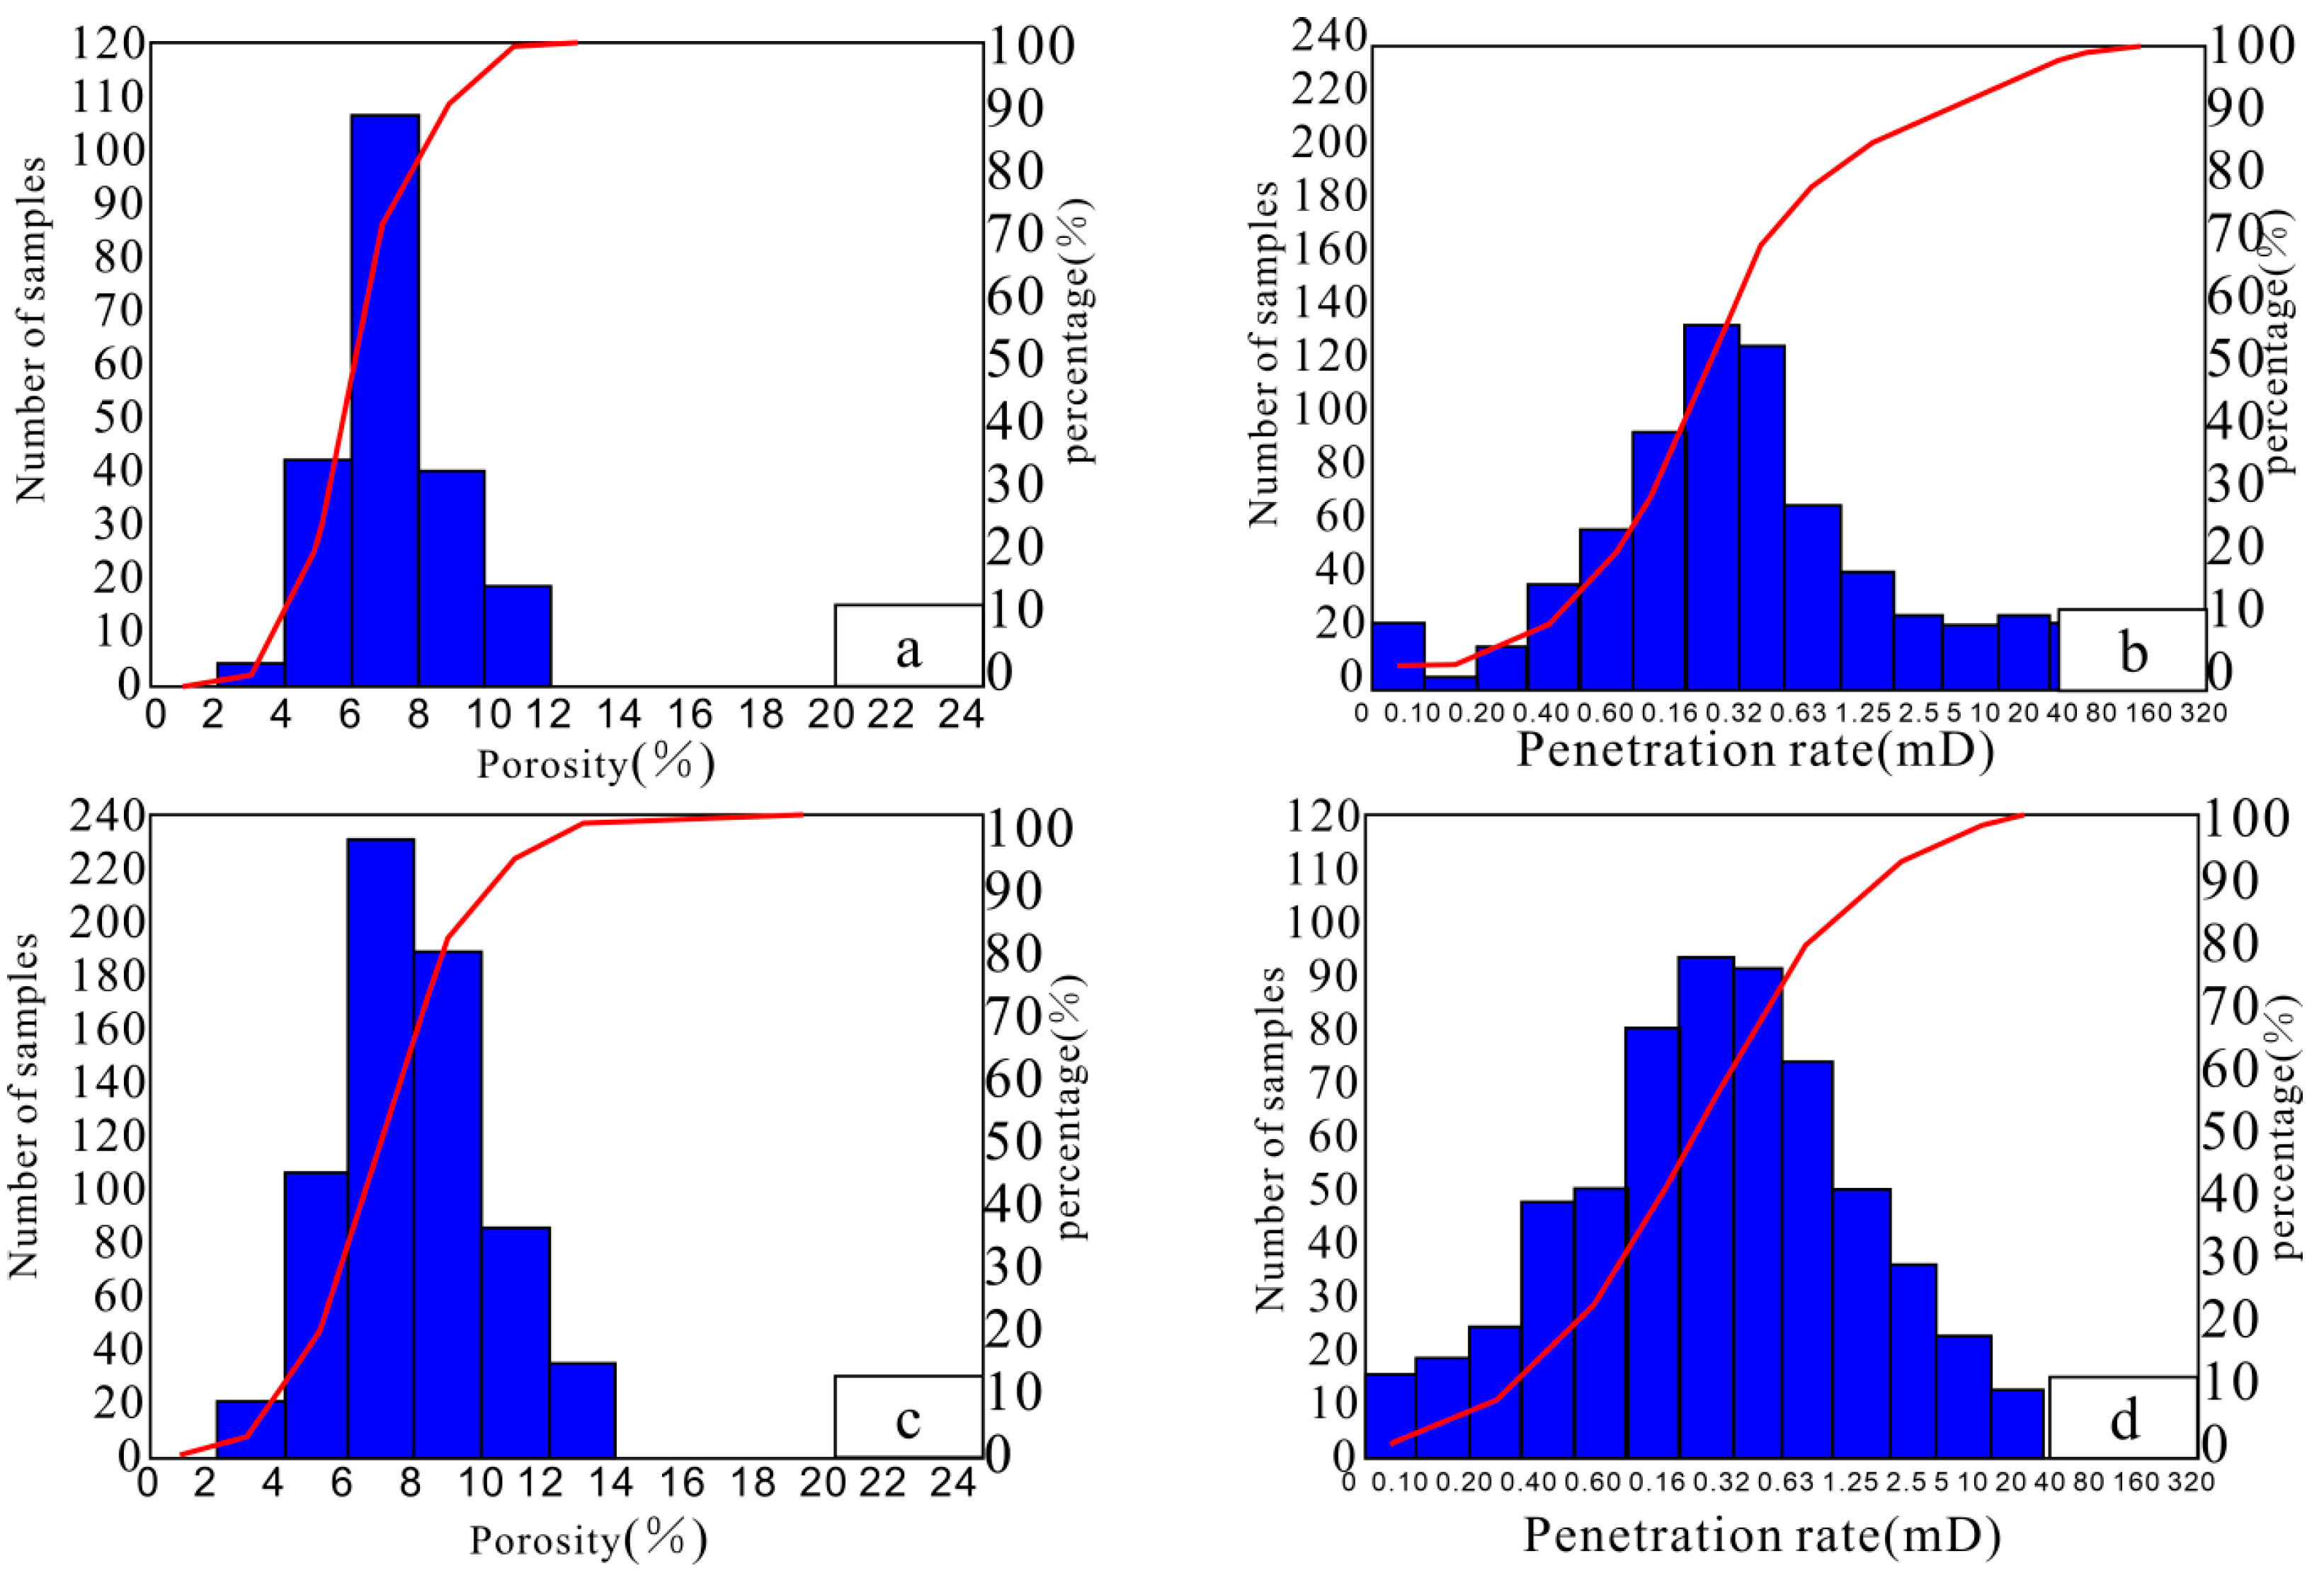
Statistical analysis of the drilled wells indicates that within the fan delta subfacies, porosity ranges from 0.6% to 12.01% and ranges from 0.01 to 337 mD. High-quality sand bodies are not developed in this subfacies (Figure 8a,b). In contrast, the fan delta front subfacies lithology is relatively pure, with minimal matrix content. Porosity ranges from 1.17% to 23% and permeability ranges from 0.01 to 396.28 mD. This subfacies constitutes the primary zone for high-quality sand body development (Figure 8c,d).

4.3.1. Seismic Waveform Indicative Inversion

As the second member of the Baikouquan Formation in Area X of the Mahu sag (Figure 7) was deposited by multiple provenance systems, the resulting sand body stacking patterns are complex. This complexity hinders the distinction between thin sandstone beds and thin-bedded mudstone using conventional methods. To enhance reservoir prediction accuracy, this study employs Seismic Waveform Indicative Inversion. This technique leverages well-log waveform data and seismic data to provide high inter-well prediction capability for sand bodies, overcoming seismic resolution limits by improving resolution and accuracy [41].
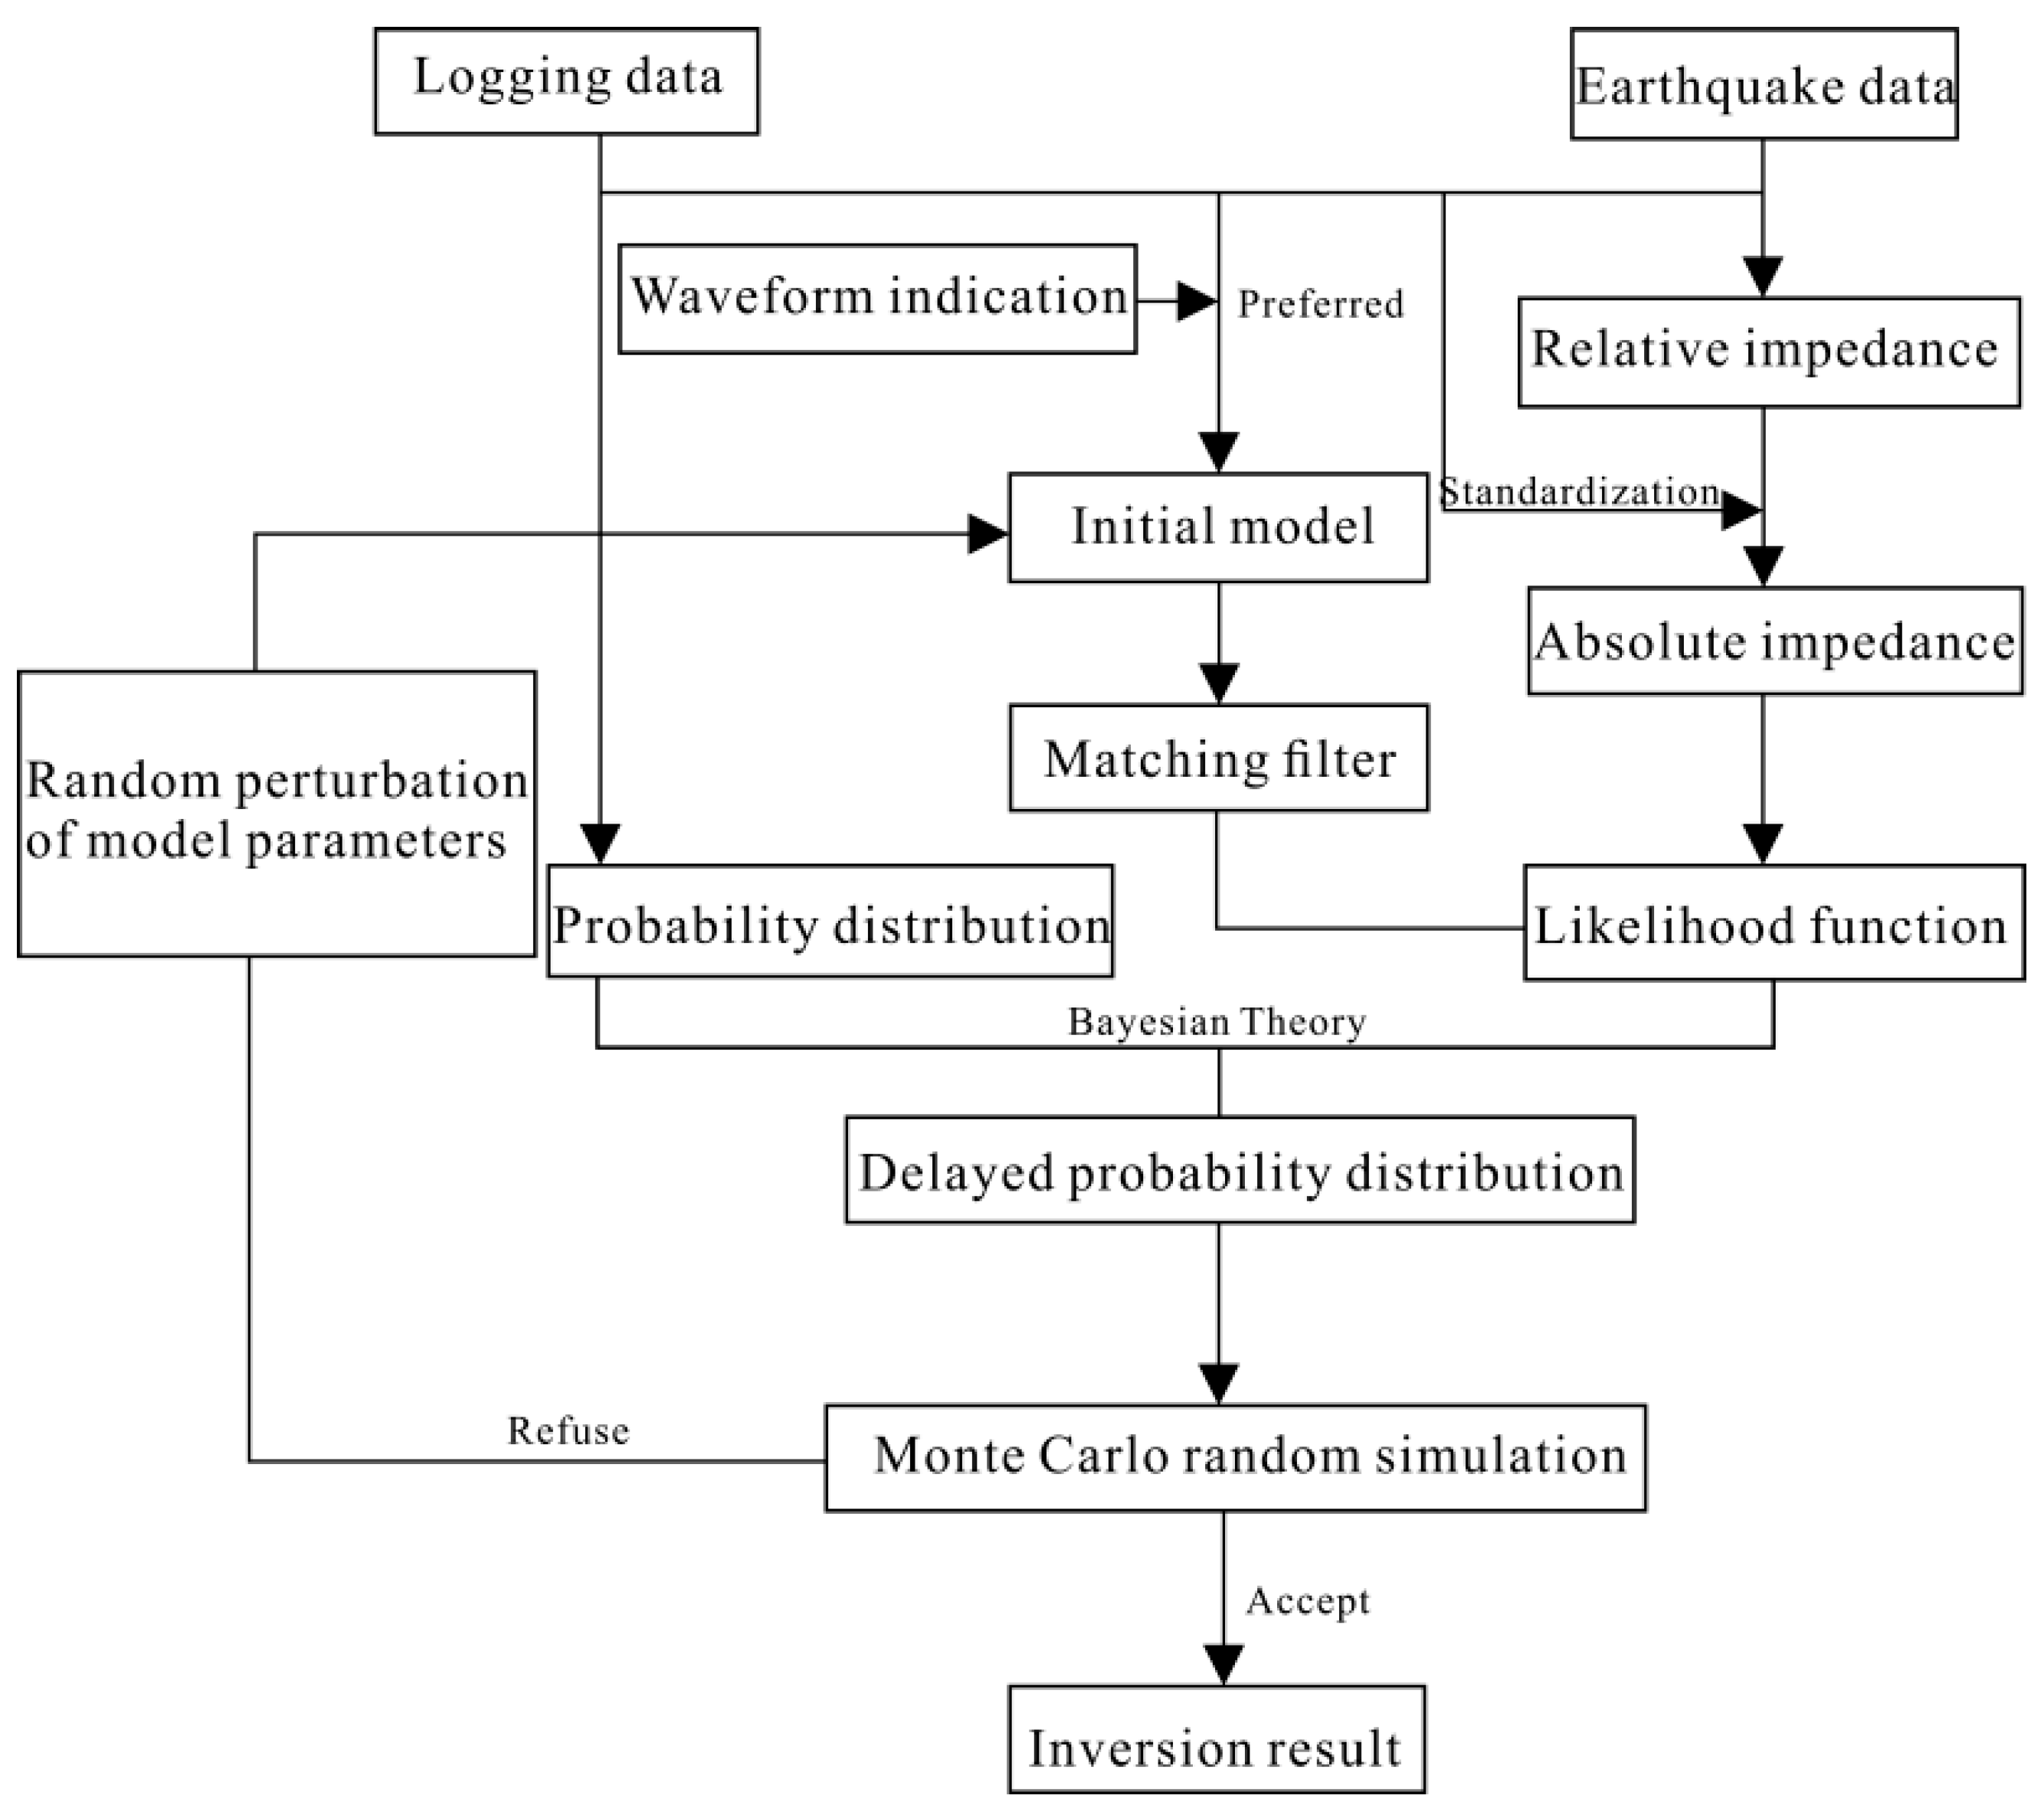
Seismic Waveform Indicative Inversion is performed by establishing the mapping relationship between seismic waveforms and logging curves, distinguishing the corresponding log curve patterns of different seismic traces, selecting the best-matching samples as the initial model, and performing the inversion in the framework of Markov Chain Monte Carlo stochastic simulation to obtain the inversion results [42] (Figure 9). Seismic inversion accurately characterizes subsurface lithology and physical properties, providing critical input for reservoir evaluation [42]. Model-based inversion integrates high-frequency well-log data and low-frequency components to compensate for seismic bandwidth limitations, delivering reliable geological information for prediction. In this study, sandstone reservoir discrimination is achieved by performing inversion guided by the sedimentary microfacies distribution pattern and constrained by the well-log impedance constraints. Sand body thickness is calculated and spatially mapped to present the results of seismic inversion and reservoir prediction.
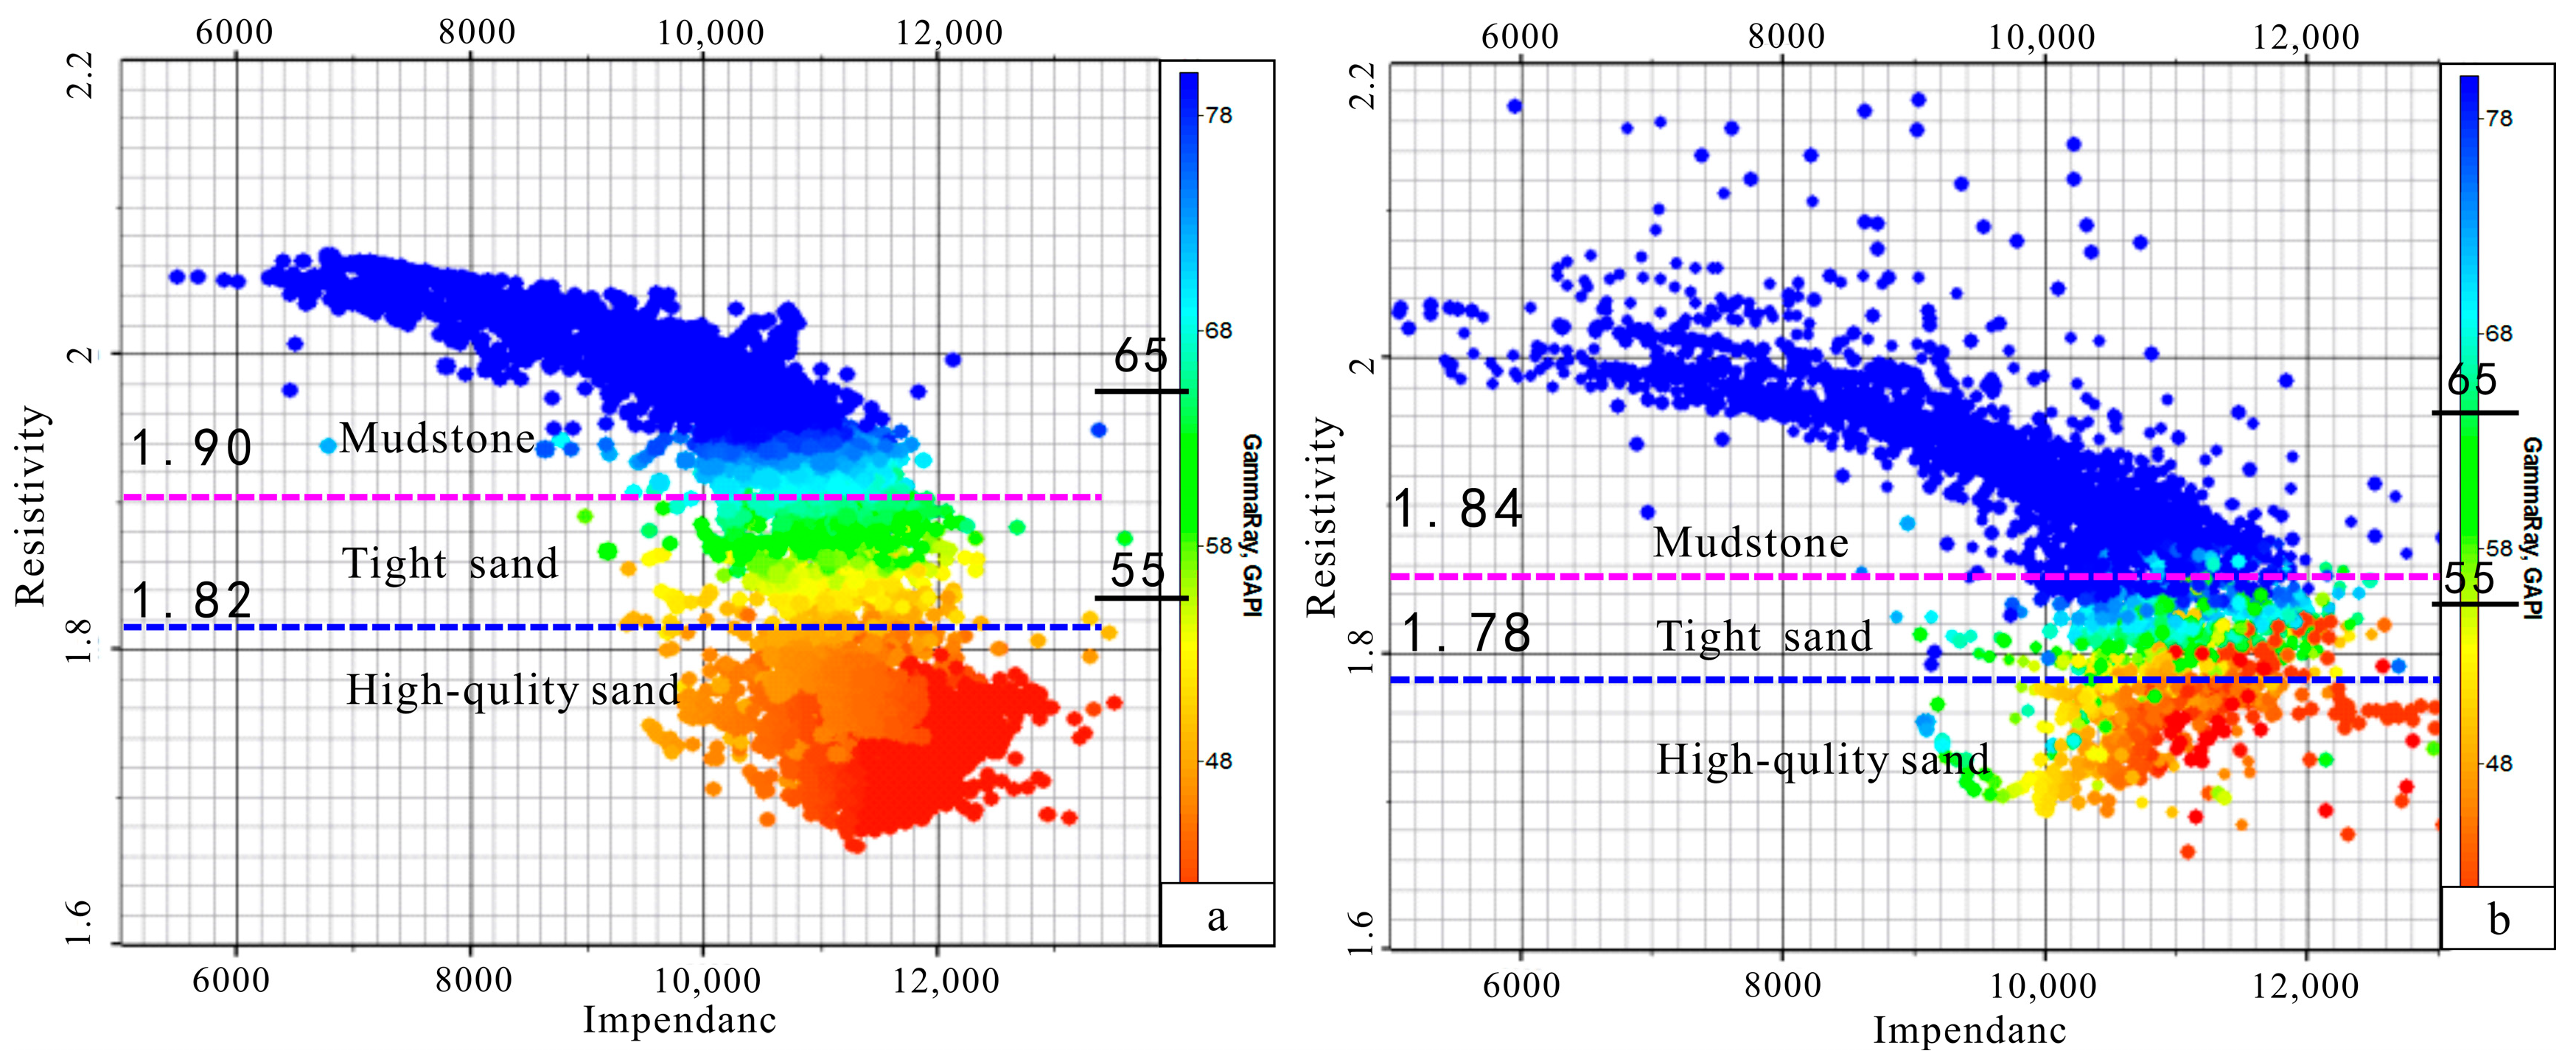
Using drilling and logging data (Figure 4) from the study area, a comprehensive statistical analysis was performed on the acoustic and resistivity properties of sandstones and mudstones in the second member of the Baikouquan Formation. A cross-plot of wave impedance versus resistivity was constructed to distinguish between reservoir and non-reservoir intervals in this member. The resulting figure reveals significant differences in the resistivity–wave impedance relationships between sandstone and mudstone. The intersection diagrams made from Wells AIHU1, MA18, MAXI 1, BAI 75, and AIHU 2 show that the mudstone impedance values range from 6000 to 9500 (m/s)·(g/cm3). The impedance values of sandstone are mostly between 1000 and 12,500 (m/s)·(g/cm3) (Figure 10a). The intersection diagrams made from AIHU4, AIHU5, AIHU6, AIHU8, and AIHU9 well indicate that mudstone impedance ranges from 6000 to 9000 (m/s)·(g/cm3), whereas sandstone impedance is typically between 10,500 and 12,000 (m/s)·(g/cm3) (Figure 10b). In the study area, sand bodies exhibit relatively low resistivity (Resistivity low 1.82 (m/s)·(g/cm3)) while the mudstone shows high resistivity (Resistivity high 1.90 (m/s)·(g/cm3)). These variations reflect lithological differences and can be effectively used to discriminate reservoir-quality sandstone from non-reservoir mudstone layers. Therefore, based on the existing geological understanding, by taking the wave impedance value or resistivity value of each well as the constraint condition and through lateral inversion, the purpose of distinguishing effective sandstone reservoirs can be better achieved.
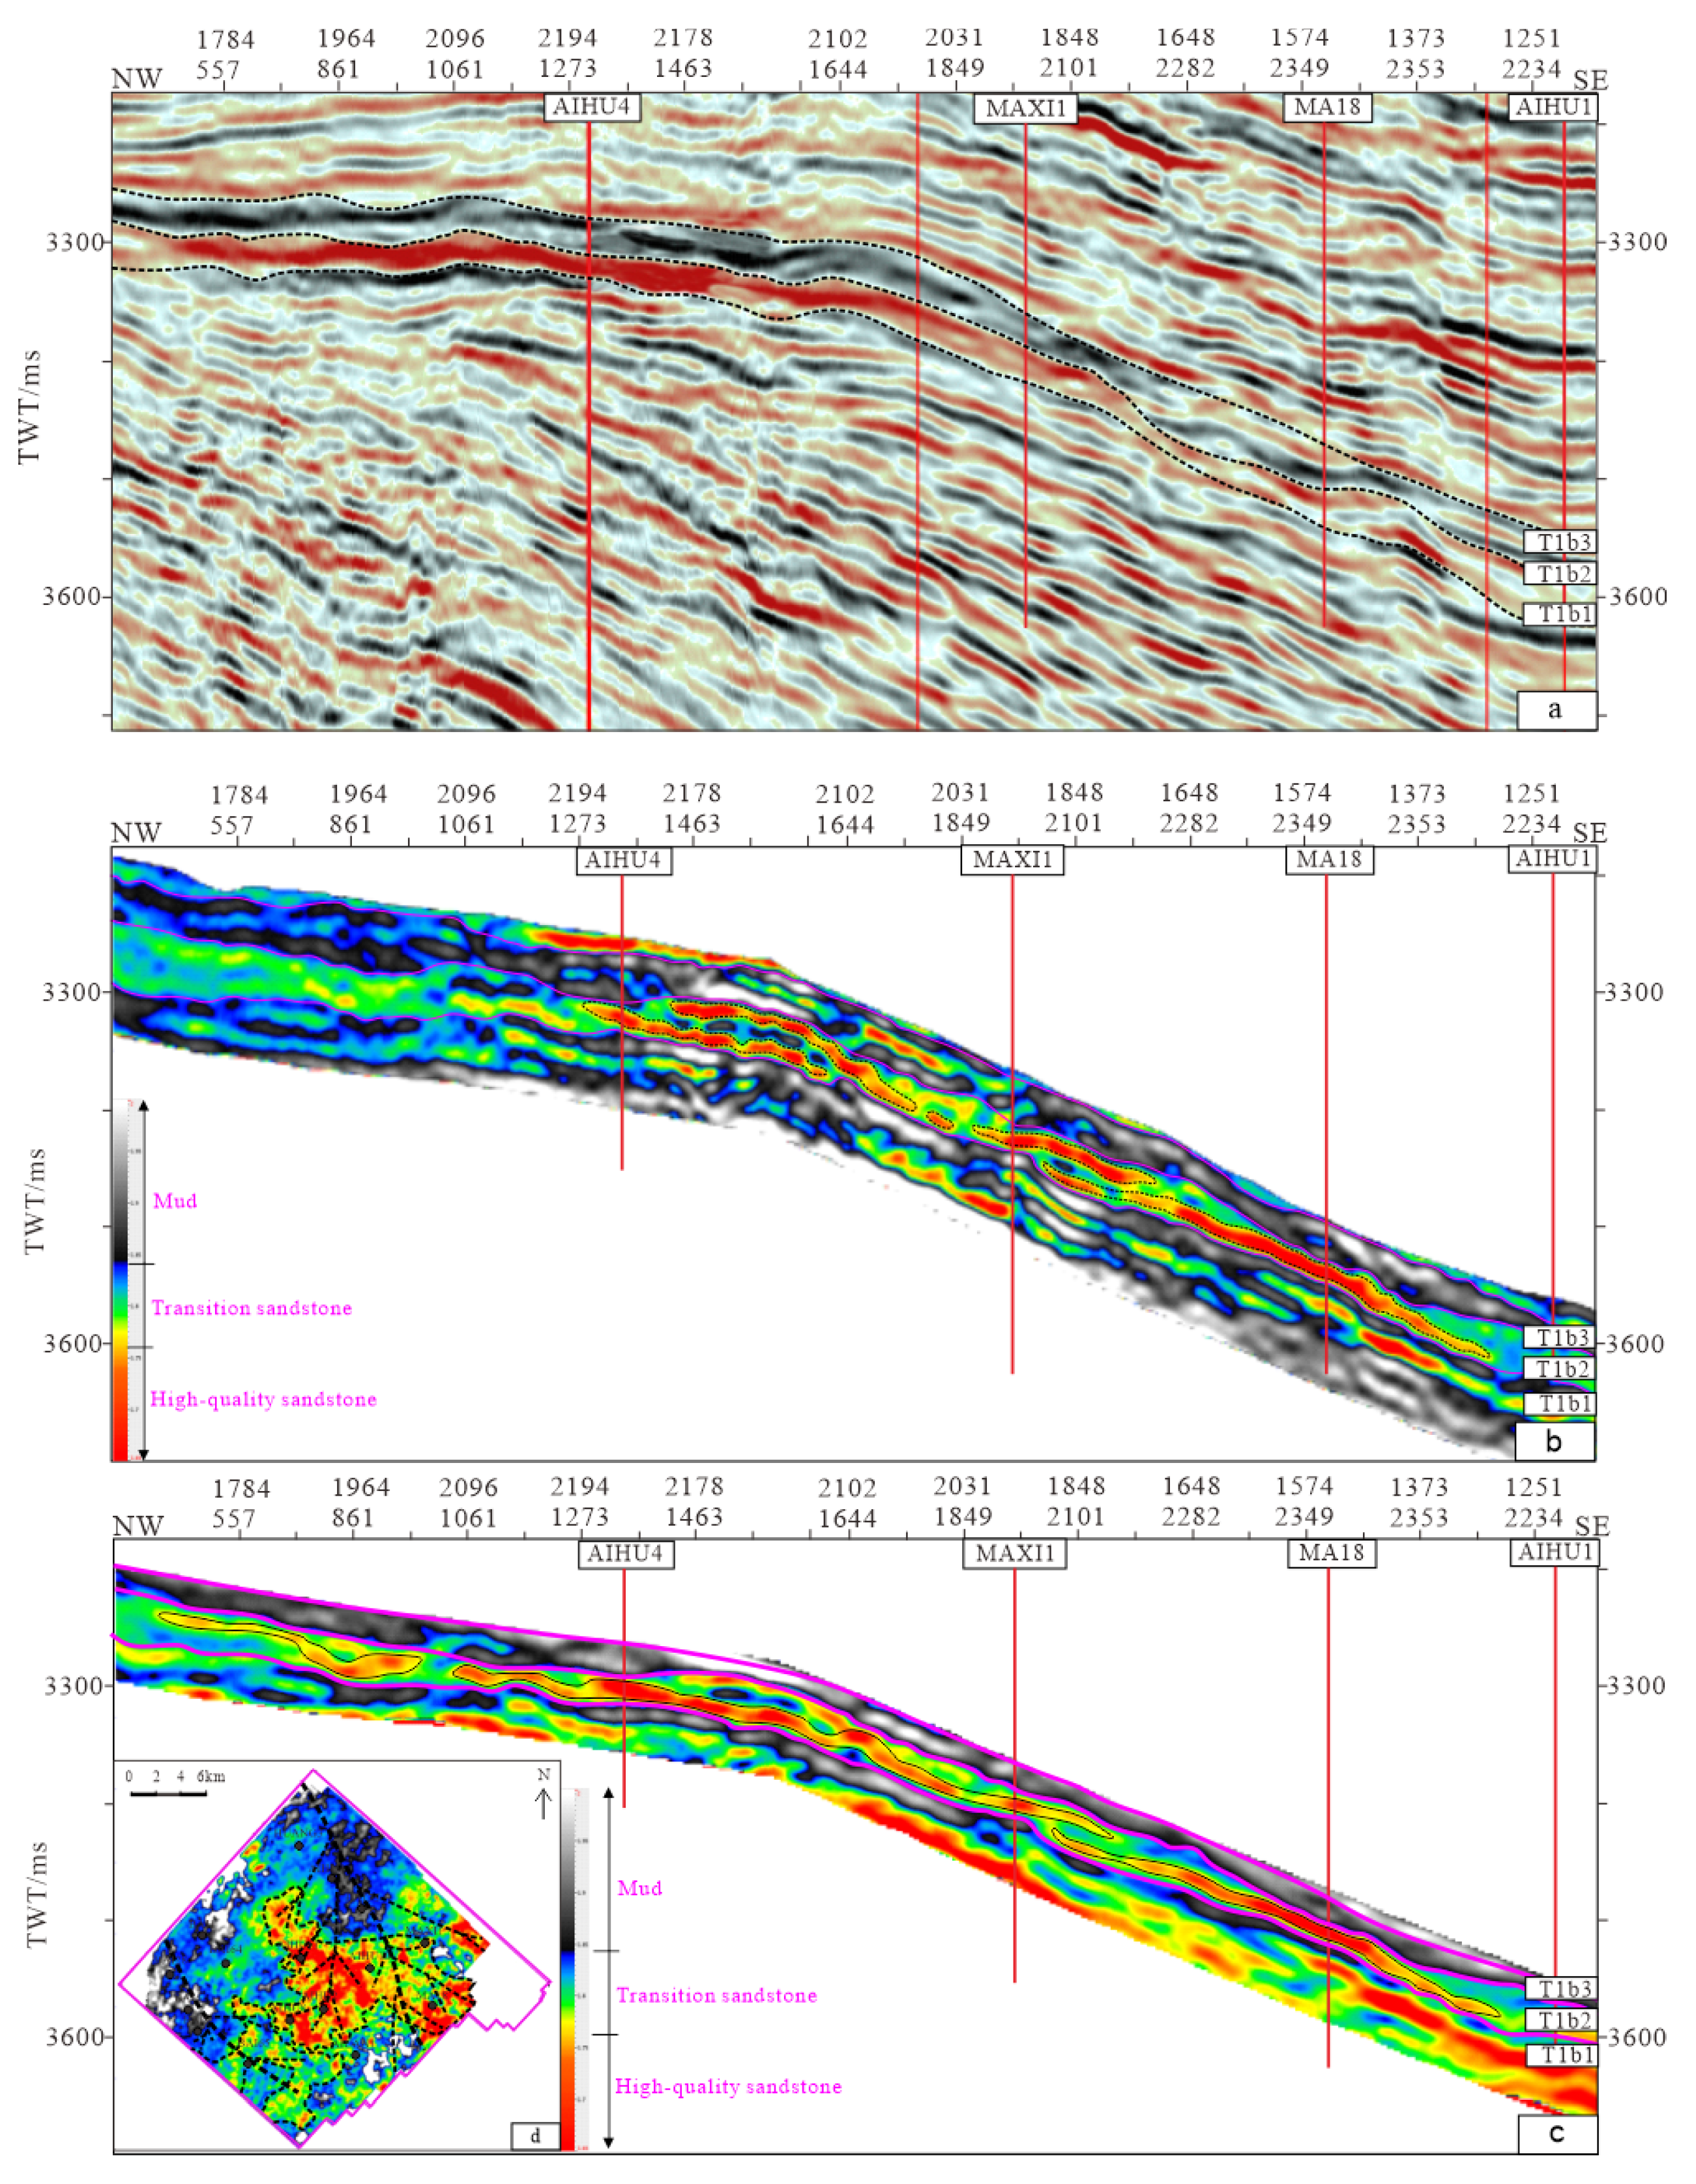
The Waveform Indicative Inversion results demonstrate that the red-yellow color corresponds to low gamma-ray values, typically interpreted as sandstone lithofacies, while the green-blue spectrum indicates high GR values, generally associated with mudstone lithofacies. Figure 11 compares the conventional inversion profile with the Waveform Indicative Inversion profile. The conventional inversion profile from the second member of the Baikouquan Formation indicates a mudstone-dominated interval near Well AIHU1. There is a high-quality reservoir between Wells MA18 and MAXI1 (Figure 11b). By further narrowing down the wave impedance values, the Waveform Indicative Inversion profile successfully differentiated between sandstone and mudstone. This revealed the presence of high-quality reservoirs in Well AIHU4 and its surrounding area, the upper section of Well MAXI1, and regions close to Well MA18. (Figure 11c).
Waveform Indicative Inversion identifies the extent of high-quality reservoir variation between wells. The results show that the reservoir sand body gradually thins from northwest to southeast, with a thickness ranging from 6 to 10 m. The vertical overlap rate between sand bodies of the two channel stages is approximately 20%. The primary zone of the high-quality reservoir lies east of Well AIHU4. Despite the eastward thinning of the sand body, this zone remains a high-quality reservoir. Interbedded mudstone forms an effective reservoir-caprock assemblage. Results indicate well-developed sand bodies within distributary channels of the Second Member, Baikouquan Formation. In the eastern proven area, high-quality reservoir sands are interconnected, forming a hydrocarbon-bearing zone throughout the region.
Table 2 compares target-layer sand body thicknesses from selected wells, demonstrating close agreement between inversion results and drilling data. For the key target interval in the study area, frequency-division impedance inversion was performed using Seismic Waveform Indication Simulation, and the sand body thickness predicted by this inversion along the seismically interpreted stratigraphy was extracted. Predicted thicknesses show minor deviations (<5%) from drilling data, attributed to seismic resolution limits and lateral heterogeneity of sand bodies.

4.3.2. Sand Ratio Forecast

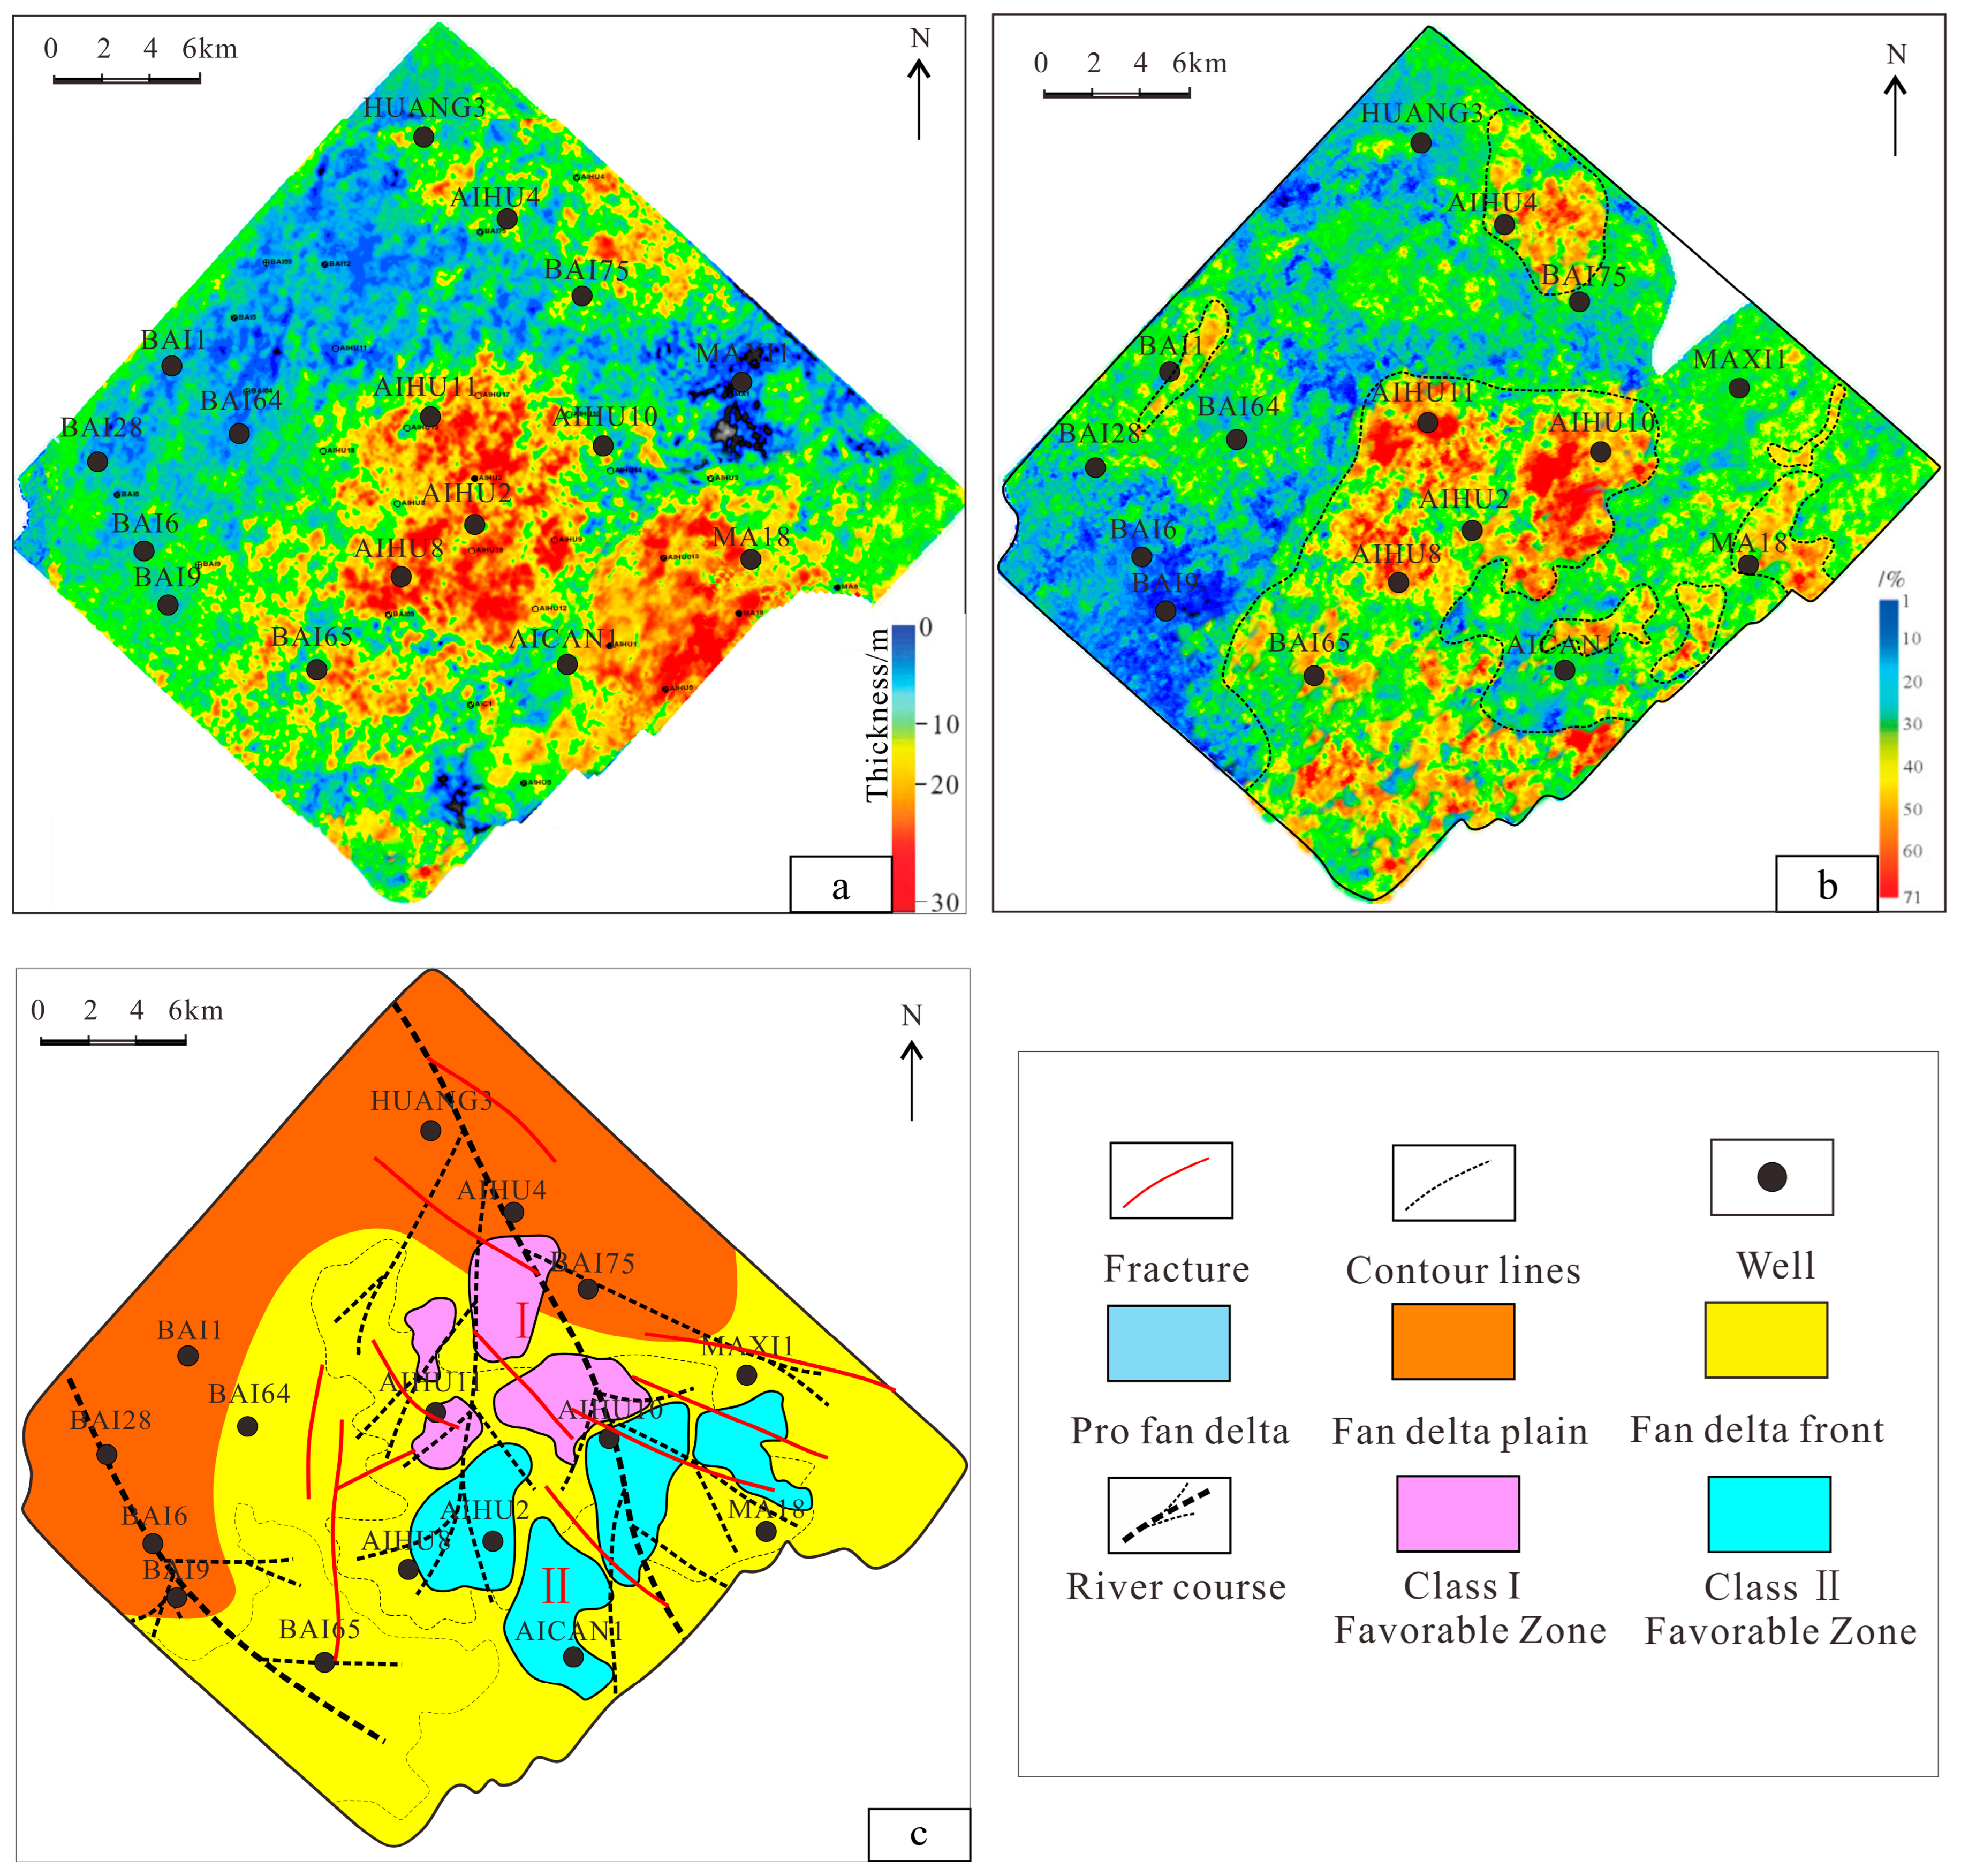
Argillaceous content inversion using well-log measurements derived the areal sandstone distribution. This was calibrated with well data (drilling, logs, core descriptions), generating a predicted sand-to-argillaceous ratio for the target interval (Figure 12a). The analysis indicates high sand-to-mud ratios, predominantly exceeding 0.5, in the second member of the Baikouquan Formation. According to the integrated analysis of well log facies, logging data, and RMS amplitude maps, areas with sand-to-mud ratios >0.5 correspond to the main river channel; those with ratios between 0.3 and 0.5 represent the channel margins; and areas with ratios <0.3 are interpreted as overbank deposits.

4.3.3. Favorable Sand Body Prediction

Based on seismic inversion results, RMS amplitude attributes were used to identify sand-prone zones. These were further refined by integrating sand-to-mud ratios and sand thickness distribution maps to predict the distribution of favorable sand bodies in the study area (Figure 12b). Studies on the Mahu sag have shown that the effective thickness of the sand body in the favorable subphase area at the front edge of the fan delta is often greater than 40 m, and the sand-land ratio of 40% to 60% is a high-quality sand body development zone [42]. Therefore, the region defined by the 40m sand thickness contour and a sand-to-mud ratio > 0.4 (Table 3), integrated with the boundary of the distributary channel from the sedimentary facies map, serves as the constraining boundary for delineating favorable sand bodies. This approach identified two key fairways of favorable sand bodies: the western sector and the southwestern sector of the study area (Figure 1). Prediction results indicate a sand thickness of 40–50 m in Favorable Area I. The sand body is widely distributed in an east–west direction, and most of the drilling wells are located in the favorable area, which is the main oil and gas exploration and development target area in the study area. The sand body extends extensively east–west, with most wells clustered within the Favorable Area, the study area’s primary exploration and development target, the Favorable sand body development work area in the southeastern part of the study area has a sand body thickness of 30~50 m, which serves as a secondary exploration and development target area within the study area. Combining the above prediction results, it is recommended to strengthen the evaluation of deep oil and gas development in the Favorable sand body development I area at the next stage, and to take the Favorable sand body development work area in the southwestern part of the country as the subsequent exploration and development evaluation area (Figure 12c).

4.4. Sedimentary Mode

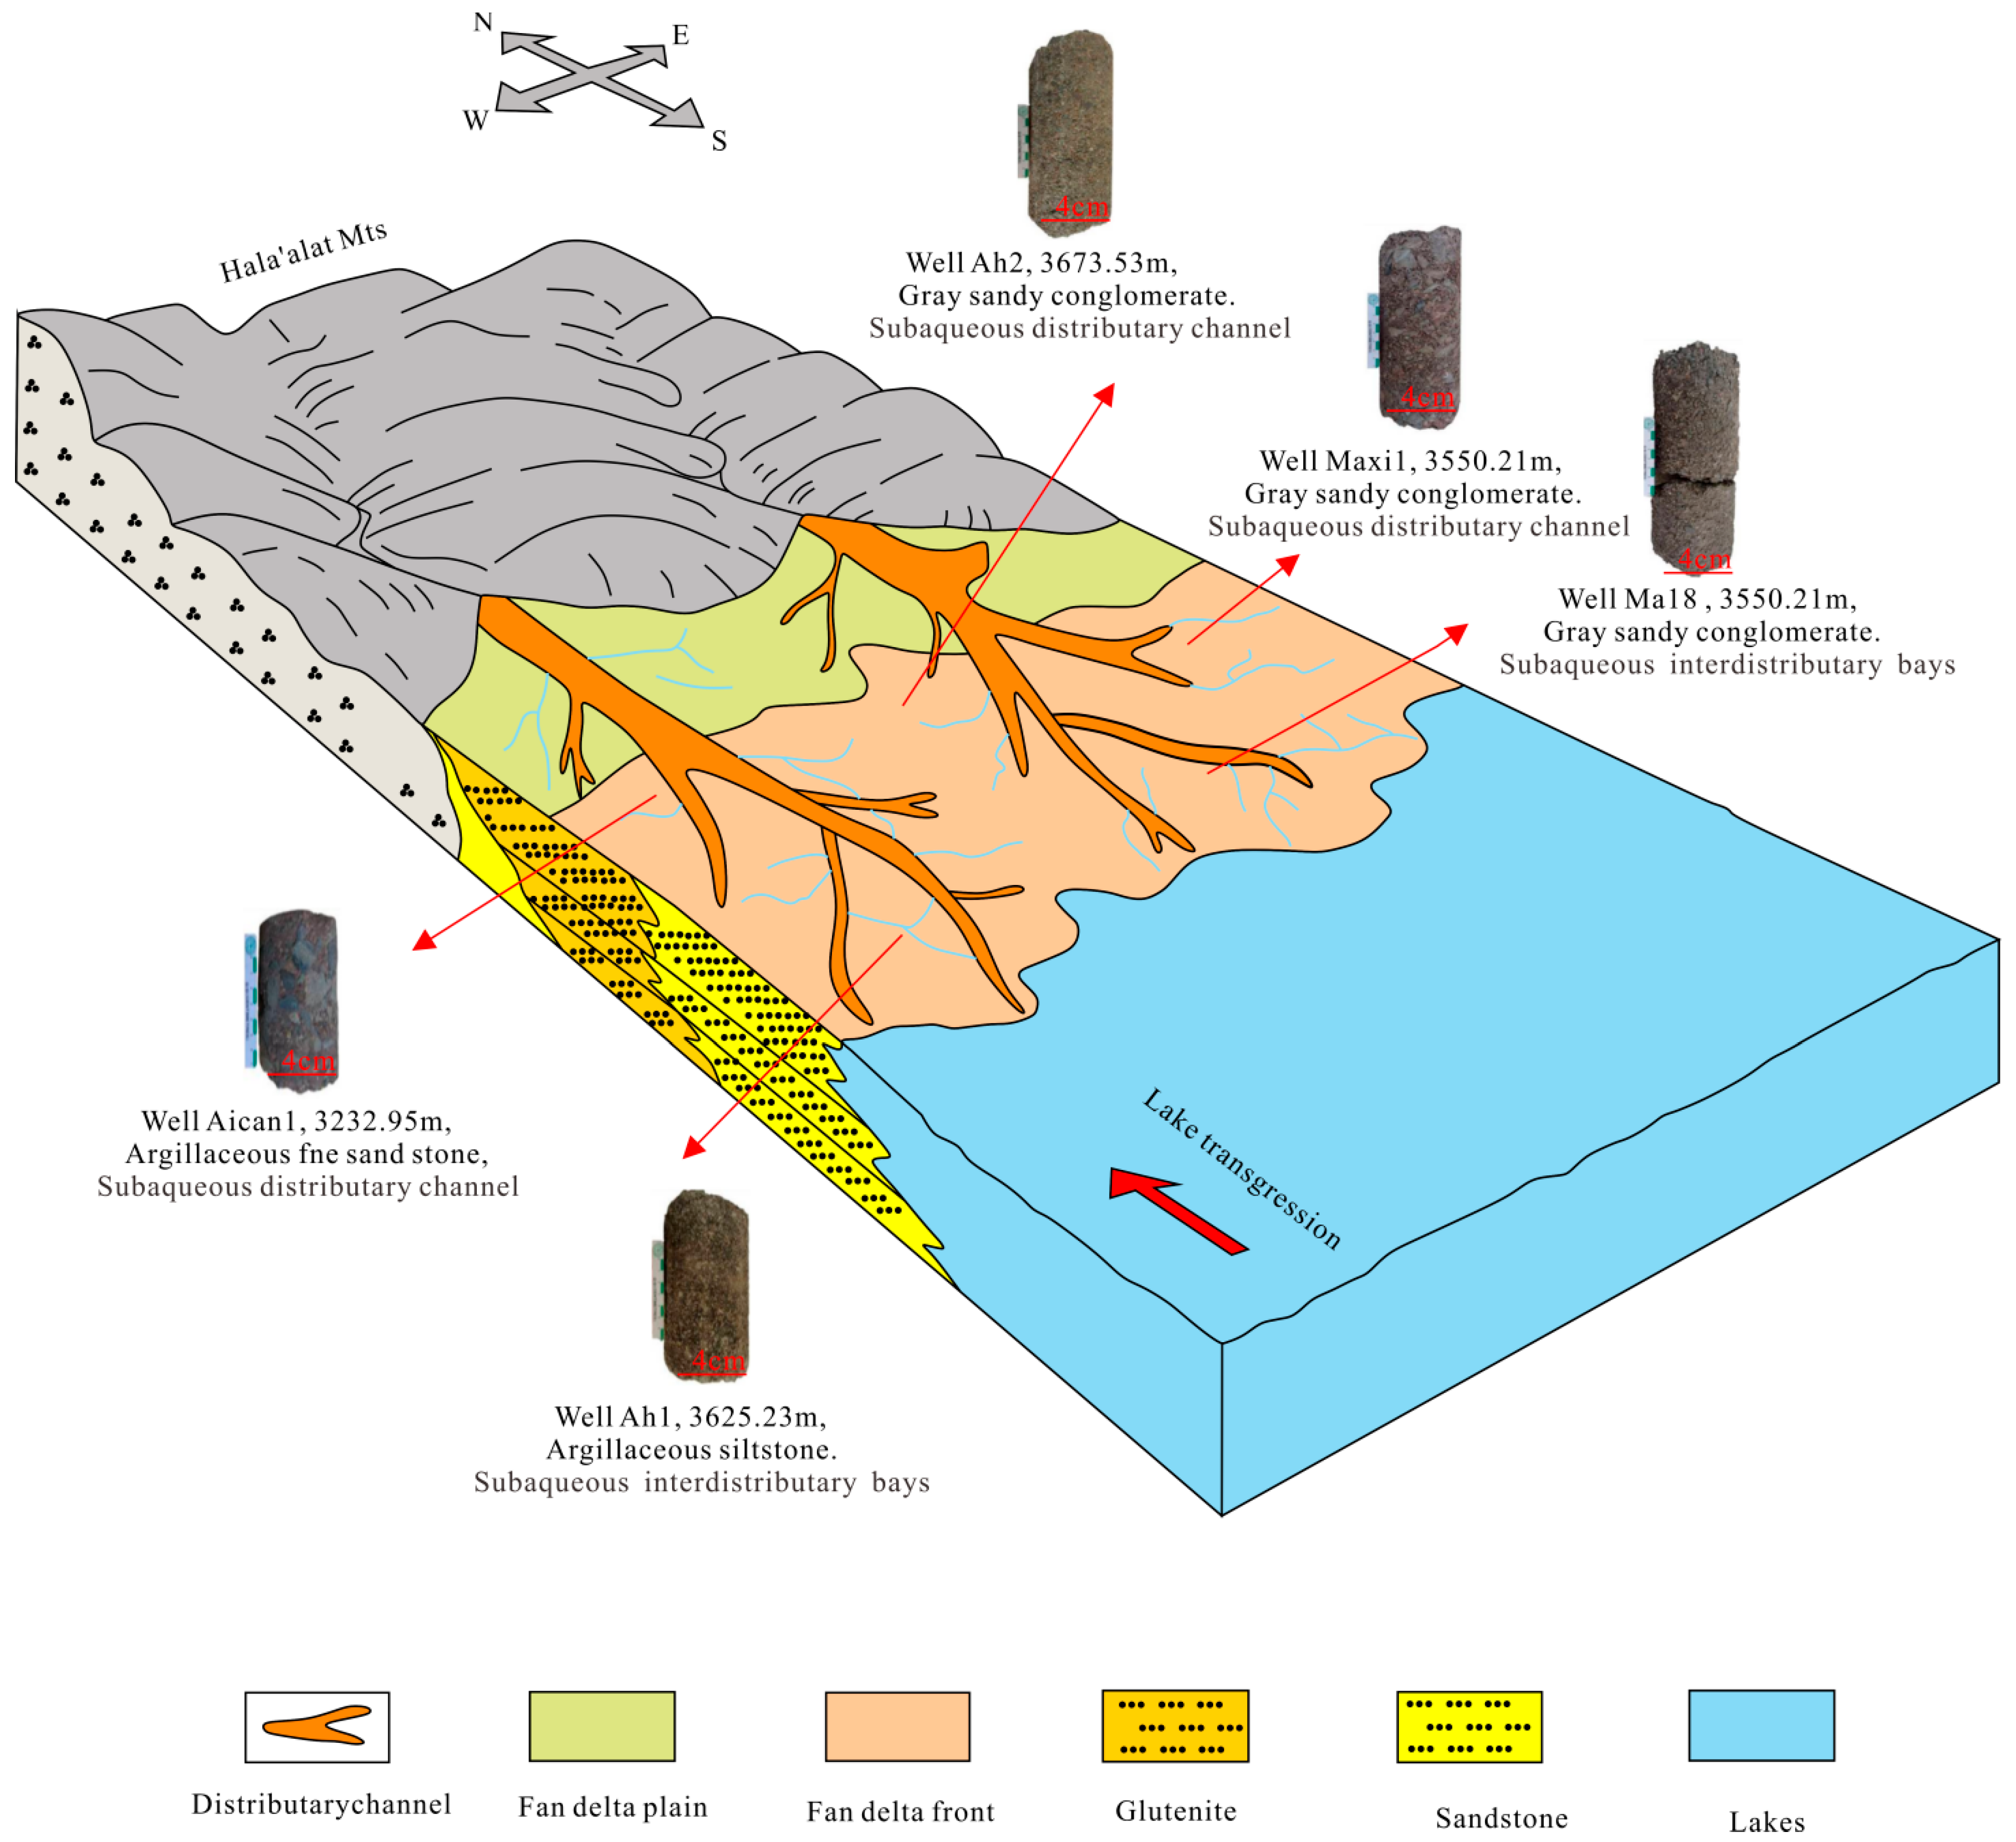
The Triassic sequence in the study area is characterized by fan-delta facies deposited in association with a shallow lacustrine environment. The northern Hala’alat Mountains served as the primary sediment source, with fluvial processes transporting sediments from these highlands and depositing fan-delta systems along the basin margin. The Hala’alat Mountains to the north supplied sediments that were transported by water and deposited to form fan-delta facies along the proximal basin margin. The distributary channels are characterized by coarse-grained sediments, where high-energy flows transport debris in a southerly direction. Upon entering the lake, the river’s hydrodynamic energy decreases, enabling only fine-grained sediments to be transported. Subsequent lake transgression leads to a rise in lake level, which enhances wave action and strengthens longshore currents. Sediments deposited along the margin of the lake basin are subsequently reworked through sedimentary processes and ultimately develop into an extensive fan-delta system (Figure 13).

5. Conclusions

The study reached the following conclusions:
(1)
The second member of the Baikouquan Formation (T1b2) is predominantly composed of fan delta front deposits. These are subdivided into three main sedimentary microfacies: subaqueous distributary channels, subaqueous interdistributary bays, and distal bars. The subaqueous distributary channel facies, primarily consisting of grayish-green sandy conglomerates, represents the most favorable reservoir unit.
(2)
The distribution of sand bodies is controlled by northwestern sediment sources and a gentle paleo-slope. Two major NW-SE trending distributary channel systems are identified, which converge in the BAI65 well area. These channels exhibit a radial pattern and form vertically stacked and laterally contiguous sand bodies, with significant accumulation around the MAXI1, AIHU10, AICAN1 well areas and west of the MA18 well.
(3)
Seismic Waveform Indicative Inversion (SWII), effectively constrained by stratal slicing and sedimentary facies boundaries, was successfully applied to predict high-quality sand bodies. The inversion results reveal that favorable subaqueous distributary channel sands are predominantly distributed in the central and western parts of the study area, covering a cumulative area of approximately 159.2 km2. And by comparing the actual drilling data of 10 Wells with the predicted data, the prediction coincidence rate in the target layer section with the highest drilling encounter rate was 100% (Table 4).
(4)
The fan delta plain comprises tight sandstones, while high-quality reservoirs are primarily developed within the fan delta front subfacies. The methodology employed in this study, which integrates geological boundaries with seismic inversion, provides a practical and effective means for reservoir prediction during the rolling exploration and development phase, as demonstrated by its successful application in guiding well placement.

Author Contributions

Conceptualization, X.C. and A.S.; methodology, X.C.; software, J.W. and Y.H.; validation, J.W.; formal analysis, J.W.; investigation, J.W.; resources, X.L.; data curation, X.L.; writing—original draft preparation, J.W.; writing—review and editing, X.C.; visualization, J.W.; supervision, J.W.; project administration, X.C.; funding acquisition, X.C. All authors have read and agreed to the published version of the manuscript.

Funding

The authors are grateful for the funding support from The Hubei Key Laboratory of Complex Shale Oil and Gas Geology and Development in Southern China (SSOG202401), National Science and Technology Project: (2025ZD1402301) and The State Key Laboratory of Geological Processes and Mineral Resources, China University of Geosciences (GPMR202207).

Data Availability Statement

All data and materials are available on request from the corresponding author. The data are not publicly available due to ongoing studies using part of the data.

Conflicts of Interest

Xiaohu Liu was employed by the Urumqi Branch of Geophysical Research Institute, BGP, CNPC, Urumqi 830000, China. The remaining authors declare that the research was conducted in the absence of any commercial or financial relationships that could be construed as a potential conflict of interest.

References

  1. Zeng, H.; GEOB. From Seismic Stratigraphy to Seismic Sedimentology: A Sensible Transition. Am. Assoc. Pet. Geol. Bull. 2001, 85, 413–420. [Google Scholar]
  2. Zeng, H.; Xu, L.; Wang, G. Prediction of ultrathin lacustrine sandstones by joint investigation of tectonic geomorphology and sedimentary geomorphology using seismic data. Mar. Pet. Geol. 2016, 78, 759–765. [Google Scholar] [CrossRef]
  3. Posamentier, H.W. Seismic Geomorphology: Imaging Elements of Depositional Systems from Shelf to Deep Basin Using 3D Seismic Data: Implications for Exploration and Development; Geological Society: London, UK, 2004; Volume 29, pp. 11–24. [Google Scholar]
  4. Posamentier, H.W.; Kolla, V. Seismic Geomorphology and Stratigraphy of Depositional Elements in Deep-Water Settings. J. Sediment. Res. 2003, 73, 367–388. [Google Scholar] [CrossRef]
  5. Kolla, V.; Bourges, P.; Urruty, J. Evolution of Deep-Water Tertiary Sinuous Channels Offshore Angola (West Africa) and Implications for Reservoir Architecture. GeoScienceWorld 2001, 85, 1373–1405. [Google Scholar]
  6. Zeng, H.; Zhu, X.; Zhu, R. Guidelines for seismic sedimentologic study in non-marine postrift basins. Pet. Explor. Dev. Online 2012, 39, 295–304. [Google Scholar] [CrossRef]
  7. Wu, W.; Li, Q.; Yu, J. The Central Canyon depositional patterns and filling process in east of Lingshui Depression, Qiongdongnan Basin, northern South China Sea. Geol. J. 2018, 53, 3064–3081. [Google Scholar] [CrossRef]
  8. Xu, Z.; Hu, S.; Wang, L. Seismic sedimentologic study of facies and reservoir in middle Triassic Karamay Formation of the Mahu Sag, Junggar Basin, China. Mar. Pet. Geol. 2019, 107, 222–236. [Google Scholar] [CrossRef]
  9. Jia, H.; Ji, H.; Wang, L. Controls of a Triassic fan—Delta system, Junggar Basin, NW China. Geol. J. 2018, 53, 3093–3109. [Google Scholar] [CrossRef]
  10. Tan, C.; Yu, X.; Liu, B. Conglomerate categories in coarse-grained deltas and their controls on hydrocarbon reservoir distribution, a case study of the Triassic Baikouquan Formation, Mahu Depression, NW China. Pet. Geosci. 2017, 23, 403–414. [Google Scholar] [CrossRef]
  11. Gao, C.; Ji, Y.; Ren, Y. Geomorphology and sedimentary sequence evolution during the buried stage of paleo-uplift in the Lower Cretaceous Qingshuihe Formation, Junggar Basin, northwestern China: Implications for reservoir lithofacies and hydrocarbon distribution. Mar. Pet. Geol. 2017, 86, 1224–1251. [Google Scholar] [CrossRef]
  12. Xiao, Z.; Chen, S.; Zhao, R. Total organic carbon logging evaluation of Fengcheng source rock in the western Mahu Sag, Junggar Basin, China. Energy Sources Part A Recovery Util. Environ. Eff. 2025, 47, 7856–7866. [Google Scholar] [CrossRef]
  13. Guo, X.; Luo, X.; Mao, R. The genesis of solid bitumen and its effect on reservoir physical properties. Energy Sources Part A Recovery Util. Environ. Eff. 2025, 47, 430–443. [Google Scholar] [CrossRef]
  14. Wu, W.; Tang, Y.; Zhao, J. Model of Tight Conglomerate Oil Accumulation in the Mahu Sag, Junggar Basin, Northwest China. J. Earth Sci. 2025, 36, 1149–1167. [Google Scholar] [CrossRef]
  15. Liu, D.W.; Ji, Y.L.; Gao, C.L.; Zhong, J. Lithofacies characteristics and sedimentary model of a gravelly braided river-dominated fan: A case study of modern Poplar River alluvial fan (northwest Junggar Basin, China). Aust. J. Earth Sci. 2021, 68, 1179–1200. [Google Scholar] [CrossRef]
  16. Su, A.; Chen, H.; Lei, M. Paleo-pressure evolution and its origin in the Pinghu slope belt of the Xihu Depression, East China Sea Basin. Mar. Pet. Geol. 2019, 107, 198–213. [Google Scholar] [CrossRef]
  17. Xie, A.; Wu, H.; Tang, Y. Classification and Analysis of Dominant Lithofacies of the Fengcheng Formation Shale Oil Reservoirs in the Mahu Sag, Junggar Basin, NW China. Processes 2025, 13, 1065. [Google Scholar] [CrossRef]
  18. Lv H, J.; Hu, T.; Zhang, W. Microscopic oil occurrence in the Permian alkaline lacustrine shales, Fengcheng formation, Mahu Sag, Junggar basin. Pet. Sci. 2025, 22, 1407–1427. [Google Scholar] [CrossRef]
  19. Wang, S.; Wang, G.; Zeng, L. New method for logging identification of natural fractures in shale reservoirs: The Fengcheng formation of the Mahu Sag, China. Mar. Pet. Geol. 2025, 176, 107346. [Google Scholar] [CrossRef]
  20. Yang, L.; Junming, W.; Wenquan, Z. Analysis of various parameters in soaking: A case study of Permian Fengcheng Formation in Mahu Sag, Junggar Basin, China. Arab. J. Geosci. 2025, 18, 60. [Google Scholar] [CrossRef]
  21. Tang, Y.; Jia, C.; Chen, F. Relationship between pore throat structure and crude oil mobility of full particle sequence reservoirs in Permian Fengcheng Formation, Mahu Sag, Junggar Basin, NW China. Pet. Explor. Dev. Online 2025, 52, 112–124. [Google Scholar] [CrossRef]
  22. Tang, Y.; Wei, X.; Yan, D. The Effect of Pre–Triassic Unconformity on a Hydrocarbon Reservoir: A Case Study from the Eastern Mahu Area, Northwestern Junggar Basin, China. Minerals 2024, 14, 1277. [Google Scholar] [CrossRef]
  23. Zhang, C.; Hu, Q.; Wang, Q. Effects of solvent extraction on pore structure properties and oil distribution in shales of alkaline lacustrine basins. Mar. Pet. Geol. 2024, 171, 107207. [Google Scholar] [CrossRef]
  24. Jia, L.; Yang, Z.; Gao, Z. The Occurrence Characteristics and Enrichment Patterns of Shale Oil in Different Lithofacies: A Case Study of the Fengcheng Formation in the Mahu Sag. ACS Omega 2024, 9, 46505–46518. [Google Scholar] [CrossRef]
  25. Li, M.; Zhang, Q.; Zhu, Z. Pore structure characteristics of low oil saturation reservoirs in Badaowan Formation of Mahu Sag, Junggar Basin, China. Geosyst. Eng. 2024, 27, 319–335. [Google Scholar] [CrossRef]
  26. Chen, P.; Qiu, H.; Chen, X. Refined 3D Numerical Simulation of In Situ Stress in Shale Reservoirs: Northern Mahu Sag, Junggar Basin, Northwest China. Appl. Sci. 2024, 14, 7644. [Google Scholar] [CrossRef]
  27. Liu, G.; Tang, Y.; Liu, K. Comparison of Pore Structure Characteristics of Shale-Oil and Tight-Oil Reservoirs in the Fengcheng Formation in Mahu Sag. Energies 2024, 17, 4027. [Google Scholar] [CrossRef]
  28. Lu, G.; Zeng, L.; Liu, G. Bedding-parallel fracture density prediction using graph convolutional network in continental shale oil reservoirs: A case study in Mahu Sag, Junggar basin, China. Mar. Pet. Geol. 2024, 167, 106992. [Google Scholar] [CrossRef]
  29. Chang, J.; Jiang, Z.; Jin, Z. Complementary laboratory experiments and molecular dynamics simulation method to investigate the mobility of shale oil: The Permian Fengcheng Formation in the Mahu Sag, Junggar Basin. Mar. Pet. Geol. 2024, 167, 106974. [Google Scholar] [CrossRef]
  30. Yu, Z.; Yan, D.; Zhao, G. Applying seismic sedimentology to characterize the architecture of a fan delta complex: Triassic Baikouquan formation, Mahu Sag, Junggar Basin, western China. Mar. Pet. Geol. 2024, 167, 106933. [Google Scholar] [CrossRef]
  31. Yu, K.; Du, S.; Cao, Y. Opaline silica precipitations in the Permian Fengcheng Formation indicate hot spring environments in north Mahu Sag, NW China. Mar. Pet. Geol. 2024, 166, 106924. [Google Scholar] [CrossRef]
  32. Su, A.; Chen, H.; Chen, X. New insight into origin, accumulation and escape of natural gas in the Songdong and Baodao regions in the eastern Qiongdongnan basin, South China Sea. J. Nat. Gas Sci. Eng. 2018, 52, 467–483. [Google Scholar] [CrossRef]
  33. Deng, M.; Zhao, G.; Lin, X. Sedimentary Facies, Paleogeography, and Depositional Models of the Middle–Late Permian in the Sichuan Basin, Southwest China. Minerals 2023, 13, 1406. [Google Scholar] [CrossRef]
  34. Hassan, A.R.; Radwan, A.A.; Mahfouz, K.H.; Leila, M. Sedimentary facies analysis, seismic interpretation, and reservoir rock typing of the syn-rift Middle Jurassic reservoirs in Meleiha concession, north Western Desert, Egypt. J. Pet. Explor. Prod. Technol. 2023, 13, 2171–2195. [Google Scholar] [CrossRef]
  35. Su, A.; Wang, Z.C.; Chen, H.H.; Feng, Y.X.; Zhao, J.X. Temporal constraints on hydrothermal circulation associated with strike-slip faulting in the Permian Maokou carbonates, central Sichuan Basin (SW China). Mar. Pet. Geol. 2024, 160, 106643. [Google Scholar] [CrossRef]
  36. Su, A.; Chen, H.; He, C. Complex accumulation and leakage of YC21-1 gas bearing structure in Yanan sag, Qiongdongnan basin, South China Sea. Mar. Pet. Geol. 2017, 88, 798–813. [Google Scholar] [CrossRef]
  37. Angshuman, D.; Pradipta, C.; Rohan, D. Prediction of large-strain cyclic behavior of clean sand using artificial neural network approach. Int. J. Adv. Eng. Sci. Appl. Math. 2022, 14, 60–79. [Google Scholar] [CrossRef]
  38. Wang, J.B.; Chen, Z.J.; Chen, C. Predicting gas content in coalbed methane reservoirs using seismic waveform indication inversion: A case study from the Upper Carboniferous Benxi Formation, eastern Ordos Basin, China. Acta Geophys. 2022, 70, 623–638. [Google Scholar] [CrossRef]
  39. Eshiet, K.; Sheng, Y. Influence of rock failure behaviour on predictions in sand production problems. Environ. Earth Sci. 2013, 70, 1339–1365. [Google Scholar] [CrossRef]
  40. Sen, M.K.; Roy, I.G. Seismic Waveform Inversion: Practical aspects and Application to field seismic data. ASEG Ext. Abstr. 2003, 2003, 1–4. [Google Scholar] [CrossRef]
  41. Su, A.; Chen, H.; Feng, Y. Dating and characterizing primary gas accumulation in Precambrian dolomite reservoirs, Central Sichuan Basin, China: Insights from pyrobitumen Re-Os and dolomite U-Pb geochronology. Precambrian Res. 2020, 350, 105897. [Google Scholar] [CrossRef]
  42. Flood, S.Y.; Hampson, J.G. Analysis of Floodplain Sedimentation, Avulsion Style and Channelized Fluvial Sand Body Distribution in an Upper Coastal Plain Reservoir: Middle Jurassic Ness Formation, Brent Field, UK North Sea; Special Publications; Geological Society: London, UK, 2017; Volume 444, pp. 109–140. [Google Scholar]
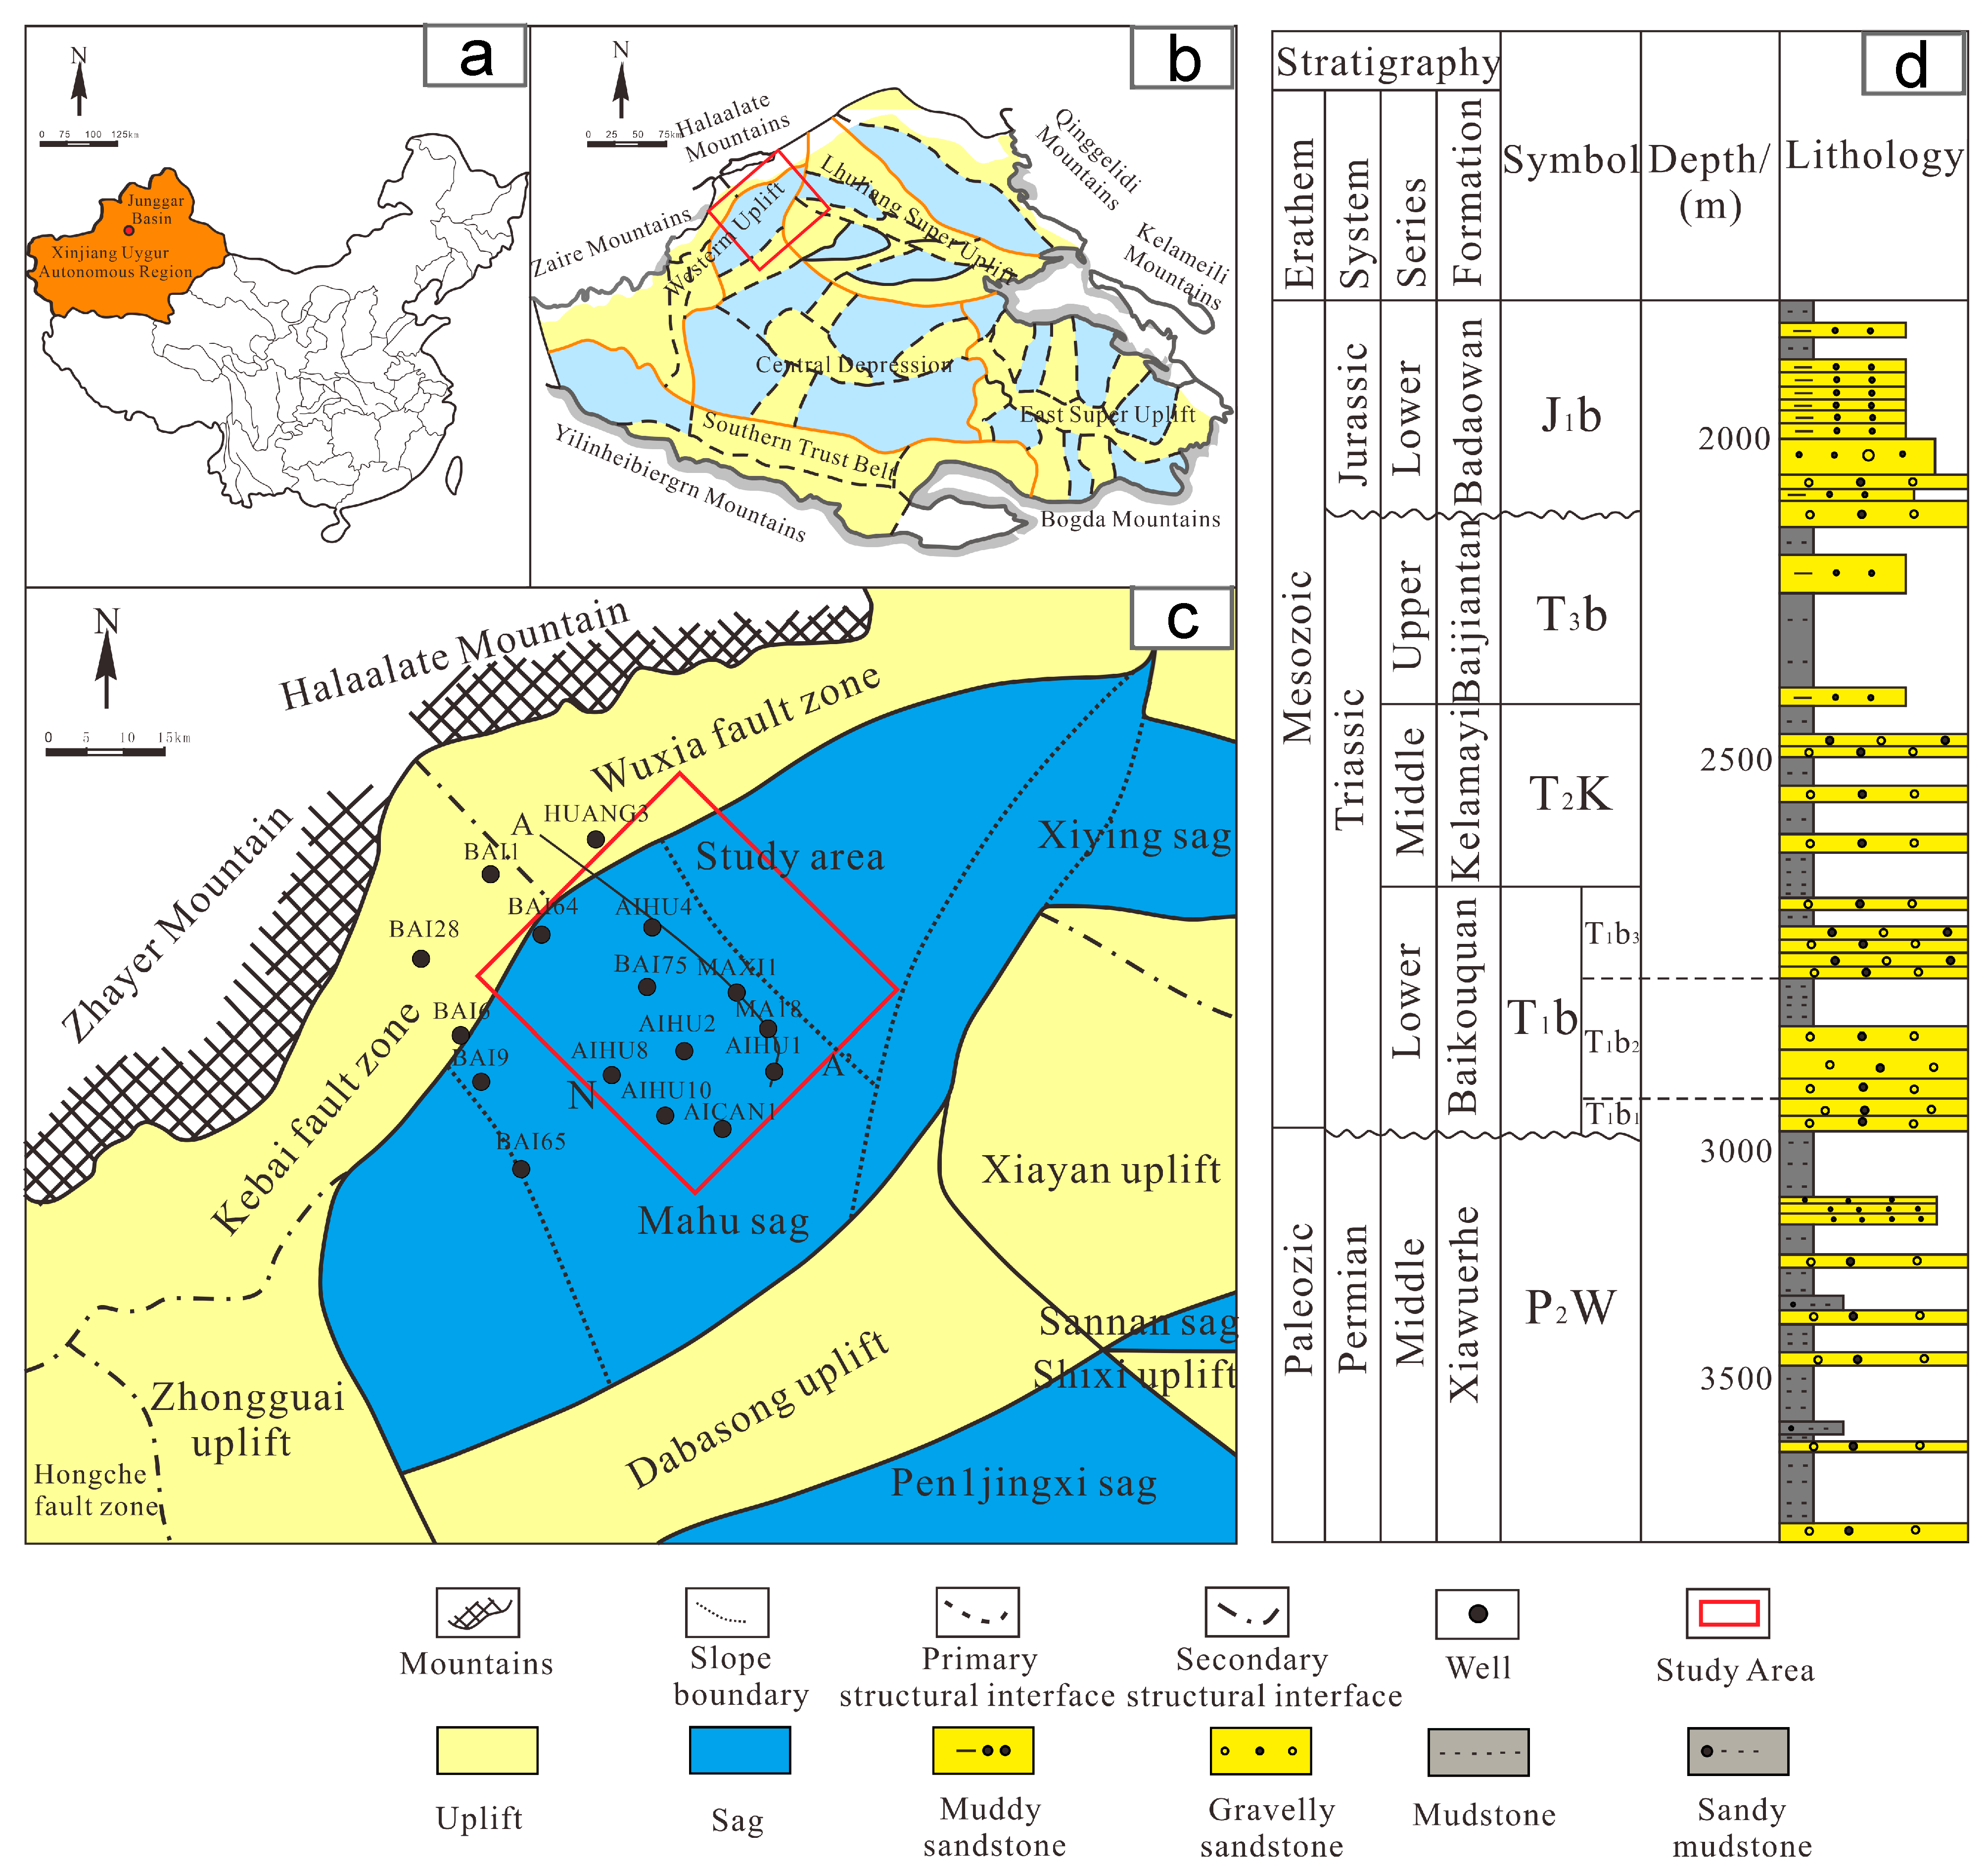
Figure 1. (a). The Junggar Basin is located in the territory of China. (b). Geological map of the Junggar Basin. (c). Tectonic Position of the Western Flank of Mahu Sag, Junggar Basin. (d). Comprehensive stratigraphic column of the Permian to Jurassic.
Applsci 15 10908 g001
Figure 2. Photomicrographs illustrating dominant pore types in the Second Member of Baikouquan Formation. (a). Well Huang 4, T1b2, 3896.27 m, gray gravel sandstone. (b). Well Ma 18, T1b2 3862.44 m gray sandstone and conglomerate. (c). Well AIHU1, T1b2 3217.89 m gray sandstone and conglomerate. (d). Well Xia 9, T1b2 2702.5 m gray-green sandy conglomerate. (e). Well Ma 6, T1b2 3832.12 m gray-green sand conglomerate. (f). Well Ma 13, T1b2 3100.73 m grayish-green gravelly medium to coarse sandstone.
Applsci 15 10908 g002
Figure 3. Principal characteristics of the fan delta deposits in the Triassic Baikouquan Formation, situated on the western margin of the Mahu sag in the Junggar Basin. (a). Fan-delta plain channel deposit, Well AIHU1, 2594.5~2594.66 m; (b). Fan-delta plain channel deposit, Well MA18, 2558.47~2558.62 m; (c). Subaqueous distributary bay in fan delta front, Well AIHU4, 2559~2560 m; (d). Subaqueous distributary bay in fan-delta front, Well AIHU10, 2558.2 ~ 2561.52 m; (e). fan delta front deposit, Well AICAN1, 2548.3~2548.52 m; (f). Fan delta front deposit, Well MAXI1, 2540.2~2540.41 m.
Applsci 15 10908 g003
Figure 4. Lithofacies log of the Triassic Baikouquan Formation on the western flank of the Mahu sag in the Junggar Basin. (a). Thick-layer box type, Well MAXI1, 3525.0~3575.0 m. (b). Bell shape, Well AIHU1, 3275.0~3325.0 m. (c). Finger shape, Well MA18, 3825.0~3875.0 m. (d). Funnel-shape, Well AIHU4, 3275.0~3325.0 m. (e). Linear type, Well AICAN1, 3725.0~3775.0 m.
Applsci 15 10908 g004
Figure 5. Seismic facies features of the Triassic Baikouquan Formation within the western Mahu Sag, Junggar Basin.
Applsci 15 10908 g005
Figure 6. Root mean square attribute slicing (a) with corresponding sedimentary facies interpretations (b).
Applsci 15 10908 g006
Figure 7. Correlation profile of Triassic Baikouquan Formation sedimentary facies, Western Mahu Sag Slope, Junggar Basin. (a). Sedimentary facies profile of the well. (b). The RMS attribute of the second segment of the Baikouquan Formation.
Applsci 15 10908 g007
Figure 8. Statistical histogram illustrating Porosity and Permeability of the Baikouquan Formation on the west slope of Mahu sag. (a) Porosity in the fan delta front of the second member of the Baikouquan Formation ranges from 0.6% to 12.01%, with an average value of 7.22%. (b) Permeability in the fan delta front of the second member ranges from 0.01 mD to 337 mD, averaging 1.39 mD. (c) In the second segment of the BaiKouQuan Formation, the fans’ average porosity extended between 1.17% and 23%, mean at 8.03%, and the middle value at 6.83%. (d) Permeability in the fan-delta plain of the second member varies between 0.01 mD and 396.28 mD, with an average of 1.04 mD.
Applsci 15 10908 g008
Figure 9. Flowchart of Seismic Waveform Indicative Inversion.
Applsci 15 10908 g009
Figure 10. Template for Reservoir Characterization in the Second Member of the Baikouquan Formation, Area X, Mahu Sag Western Slope, Junggar Basin. (a). Intersection diagram of longitudinal wave impedance and longitudinal and transverse wave velocity ratio of AIHU1, MA18, MAXI1, BAI75, and AIHU2. (b). Intersection diagram of longitudinal wave impedance and longitudinal and transverse wave velocity ratio of AIHU4, AIHU5, AIHU6, AIHU8, and AIHU9.
Applsci 15 10908 g010
Figure 11. (a). Seismic inversion profile. (b). Conventional seismic inversion profiles. (c). Waveform-Indicative Inversion Profile. (d). Planar distribution of inverted wave impedance in the second member of the Baikouquan Formation.
Applsci 15 10908 g011
Figure 12. (a). Sandstone proportion in the Baikouquan Formation T1b2 on Mahu sag’s western slope. (b). Contour map of sandstone thickness for the Baikouquan Formation T1b2 on the Mahu sag’s west slope. (c). Preferred area of T1b2 within the Baikouquan Formation on the Mahu sag’s west slope.
Applsci 15 10908 g012
Figure 13. Sedimentary pattern of Baikouquan Formation in the west slope of Mahu sag.
Applsci 15 10908 g013
Table 1. Correlation between RMS amplitude attribute and sandstone thickness.
Statistical WellHorizonConforming WellsConformity Rate
MAXIT1b2conformity0.83
AICAN1conformity
MA18conformity
AIHU1conformity
AIHU2conformity
AIHU10conformity
BAI9inconformity
BAI75conformity
BAI65conformity
BAI64inconformity
HUANG3conformity
MAHU1conformity
Table 2. Sand thickness statistics of T1b2 interval, Baikouquan Formation.
WellPredicted Thickness/mActual Thickness/m
MAXI16.216.53
AIHU16.236.34
AIHU46.236.38
MA186.226.31
AIHU26.356.46
AIHU106.476.56
BAI96.436.55
BAI756.536.61
BAI656.766.81
BAI646.556.69
HUANG36.326.58
MAHU16.146.32
Table 3. Evaluation criteria for favorable sand bodies of Baikouquan Formation.
Favorable Sand Body TypeSand Body Thickness/mSand RatioPorosity/%Permeability/×10−3
Mu m2
Class I>40>0.6>14>12
Class II>30>0.4
Class III>15>0.2
Table 4. Statistical data of coincidence between reservoir prediction and development wells in the Member second of the Baikouquan Formation in X area in west slope of Mahu sag, Junggar Basin.
Horizontal Well NameAverage Value of Actual Wave ImpedanceLithology of Actual DrillingPredict the Average Value of Wave ImpedancePredict the ReservoirMatching Condition
MAXI110,800High-quality sandstone11,300High-quality sandstoneMatch
AIHU111,000High-quality sandstone11,250High-quality sandstoneMatch
AICAN110,800High-quality sandstone11,000High-quality sandstoneMatch
MA1810,700High-quality sandstone11,300High-quality sandstoneMatch
MAHU19200Mudstone9500MudstoneMatch
MAHU1019000Mudstone9500MudstoneMatch
HUANG310,500High-quality sandstone10,750High-quality sandstoneMatch
KE8110,400High-quality sandstone11,500High-quality sandstoneMatch
AIHU211,500High-quality sandstone11,200High-quality sandstoneMatch
XIA8511,400High-quality sandstone11,950High-quality sandstoneMatch
Disclaimer/Publisher’s Note: The statements, opinions and data contained in all publications are solely those of the individual author(s) and contributor(s) and not of MDPI and/or the editor(s). MDPI and/or the editor(s) disclaim responsibility for any injury to people or property resulting from any ideas, methods, instructions or products referred to in the content.