Abstract
In contemporary business environments, manufacturing companies must continuously enhance their performance to ensure competitiveness. Material feeding systems are of pivotal importance in the optimization of productivity, with attendant improvements in quality, reduction of costs, and minimization of delivery times. This study investigates the selection of material feeding methods, including Kanban, line-storage, call-out, and kitting systems, within a manufacturing company. The research employs six machine learning (ML) algorithms—logistic regression (LR), decision trees (DT), random forest (RF), support vector machines (SVM), K-nearest neighbors (K-NN), and artificial neural networks (ANN)—to develop a multi-class classification model for material feeding system selection. Utilizing a dataset comprising 2221 materials and an 8-fold cross-validation technique, the ANN model exhibits superior performance across all evaluation metrics. Shapley values analysis is employed to elucidate the influence of pivotal input parameters within the selection process for material feeding systems. This research provides a comprehensive framework for material feeding system selection, integrating advanced ML models with practical manufacturing insights. This study makes a significant contribution to the field by enhancing decision-making processes, optimizing resource utilization, and establishing the foundation for future studies on adaptive and scalable material feeding strategies in dynamic industrial environments.
1. Introduction
In the context of the contemporary era, manufacturing companies are engaged in efforts to enhance their competitiveness in the global market. This is pursued through the pursuit of two key objectives: the maximization of quality and the minimization of costs and delivery times. Material feeding systems represent a significant factor influencing productivity. Manufacturing companies must select the optimal material feeding method by considering variables such as material variety, size and weight, product demand volume, space requirements, and labor force. Material feeding systems can be classified into three categories: stocking of materials, transportation of materials, and material feeding policy. In the literature, material feeding policies are analyzed under four distinct categorizations, as follows: continuous feeding (line storage), material feeding with Kanban, kitting, and hybrid approaches.
The objective of the line-storage strategy is to ensure the storage and distribution of materials in a separate container or on a dedicated shelf located in close proximity to the assembly line. The quantity of materials stored in the container is determined by the specific product type and is replenished when the container is empty. The operator responsible for assembly or material preparation retrieves the requisite materials from the designated storage location and prepares them in accordance with the specifications outlined in the production plan. In the event of a material shortage on the assembly line, production can continue uninterrupted by procuring new products directly from the adjacent container, as a consistent supply of materials is maintained in close proximity to the line. In manufacturing companies with a high degree of product variety, the time spent searching for the requisite parts and the space required for their placement next to the assembly line are considerable [1].
Kanban is a tool that facilitates the communication of information in accordance with the principles of lean production pull. Kanban facilitates the transfer of materials by enabling the circulation of information from the final production stage to the initial production stage. Upon withdrawal of the product from the designated area, a signal is generated to indicate the transition to the preceding stage of the process. The Kanban method is a material feeding technique that is employed to prevent overproduction and to reduce the number and cost of components in the production process that are not yet complete. The subsequent process stage transmits a signal to the preceding process stage, indicating whether production should continue or cease, utilizing a Kanban card. As the production decision is based on information from the subsequent process, there is no requirement for external planning, and the process is straightforward to manage.
The term “kit” is used generically to describe a box containing parts used in one or more assembly steps [2]. A kit is defined as a specialized collection of parts [3] and a collection of materials that are required to produce a product or complete a production step [4]. The term ‘kitting’ is defined as the process of supplying the requisite components by placing predetermined quantities of parts together in specially designed containers and the process of handling only those parts that have been defined as necessary for a specific period and dispatching them to designated stations [5]. The use of kits represents an advantageous material feeding method in manufacturing companies characterized by high product variety, low product demand, and a low number of standard components [6]. Limere et al. [7] identified several advantages associated with kitting. These include a reduction in stock levels, a reduction in the time operators spend locating and retrieving materials, a reduction in the time required to search for materials, an improvement in ergonomic conditions, and easier access for operators to ergonomically designed kits.
Hybrid approaches are those in which two or more material feeding methods are used together. A hybrid approach may be defined as one in which two or more material feeding methods are employed in conjunction with one another. Moreover, this approach may entail the feeding of a defined subset of materials from line storage or the utilization of Kanban management while another subset is fed from the warehouse or kitting.
This study considers the problem of material feeding method decision-making to assembly lines in a hydraulic motor manufacturing company in Turkey. This study presents a number of issues encountered by a manufacturing company engaged in the production of hydraulic motors, as follows:
- The system exhibits a high order of volume yet displays a low production capacity;
- The assembly lines are subject to lengthy lead times;
- A substantial number of tasks are performed by the assembly operator that does not enhance the value of their work;
- The space requirements for the purchase of new machinery with the objective of increasing production capacity;
- A review of customer complaints revealed a recurring issue with incorrect material assembly on the assembly line;
- Given the extensive range of available materials, identifying the most appropriate ones is a time-consuming task;
- The operational procedures of the assembly line and the activities of the operators are not optimally efficient;
- The lack of sufficient space for materials next to the line has been identified as a potential issue;
- The demand for each material varies considerably depending on customer requirements.
To address the issues that have been identified, it was decided that a standardized and systematic material feeding method should be selected for use on assembly lines. The objective of this study is to identify the most efficient material feeding method for existing materials in assembly lines with varying value streams in the factory and to determine an effective material feeding method for new materials. The remainder of this paper is organized as follows. Section 2 presents a literature review. Section 3 explains the proposed approaches. Developed models and results are provided in Section 4. Finally, conclusions are presented in Section 5.
2. Literature Review
This study investigates assembly line feeding methods and material feeding method selection problems in the literature. In many studies in the literature, material feeding methods are compared with each other, and various methods are used to solve the material selection problem. In this section, different material feeding methods in the literature are explained. Just-in-time production, line-side stocking, kitting, Kanban, sequencing, and hybrid material feeding methods are mentioned in the literature. In the articles, line-side storage, kitting, and just-in-time production material feeding methods are mostly mentioned [8].
There is an urgent demand to improve the material feeding performance in automobile mixed-model assembly lines [9]. For automotive mixed-model assembly lines, the excessive work-in-process inventory will cause confusion in the assembly line, which will damage the product quality and reduce the enterprise’s reputation [9]. Zhou and Zhao [9] proposed a fuzzy-neural model-based model for the material feeding problem for the Kanban strategy. The fundamental principle of the material feeding strategy is the determination of whether the supply of materials is continuous or discontinuous [10]. As an alternative to kitting, the Kanban method is a continuous supply strategy that allows a stock of each needed part type to be continuously held at the workstation with small-sized containers. Conversely, when substantial quantities of parts are stored in larger containers along the production line, and these containers are replenished at regular intervals, this is referred to as line storage [10]. Kitting is the feeding of multiple specific parts required at a specific workstation for the production of a specific product [11].
Tardif and Maaseidvaag [12] established the definition of “Kanban” as a material flow-control mechanism. This mechanism is employed to regulate the appropriate quantity and temporal allocation of products, ensuring that only the necessary quantity is produced. In a Kanban material feeding system, each bin is associated with a card containing information about the product. Kanban cards always move through the processes together with the products. The Kanban card refills stations with relevant parts based on consumption [13,14]. The Kanban material feeding method reduces inventory costs, increases flexibility as production occurs in line with customer demand, and does not require an additional management system [15]. The Kanban system has been demonstrated to exhibit a high degree of adaptability in responding rapidly to fluctuations in demand [9].
Line-storage feeding is considered to be the process of moving parts from a central warehouse to an area in which they will be utilized. Parts are stocked in the relevant area, and when the operator on the assembly line requires material, it is obtained from the stock areas adjacent to the line. Conversely, when a specific component is no longer required, or the designated parts bin is depleted, it is returned to the central warehouse, thereby freeing up space in the line-side stock area [16]. This systematic approach ensures the continuous availability of materials in the stock area adjacent to the assembly line. In the automotive industry, line-storage feeding is the most common parts feeding strategy due to its simplicity and the low material handling efforts it entails [17]. However, this approach is associated with higher space utilization and no time savings during the assembly worker’s picking process [18]. Kitting is collecting the parts required to produce a specific product in the required quantity and bringing them to the assembly line in a designated box [16]. The time needed to prepare the kit is non-value added time; additional space is needed to prepare the kit, the list of materials needed must be shared with the kitting operators in advance, and additional planning is required. Handling is high and risky for parts that may suffer quality damage or be stolen. It can be challenging to place extensive and heavy or tiny parts into the kit [2]. It has been demonstrated that each material feeding strategy has its own advantages and disadvantages. This poses a significant challenge to the effective allocation of each part to a feeding strategy [7,19].
The assembly line feeding problem was first formulated and investigated by Bozer and McGinnis [2]. This pioneering research paper explores the impact of various feeding policies through cost-based comparisons. A notable constraint of the study is its utilization of a binary approach, presupposing that a single feeding policy is implemented for the feeding of all components. Descriptive models and optimization-based models are widely used for material feeding strategy selection in the literature. In the existing literature, there is a wide prevalence of both descriptive [5,20,21] and optimization-based models [11,22,23,24,25] in the context of the material feeding strategy selection problem. Bozer and McGinnis [2] presented the differences between line-storage feeding and kitting and developed a decision-making model to determine the material feeding strategy by using a linear programming model. Bozer and McGinnis [2] compared two material feeding systems based on the amount of inventory between processes, the space requirements for a central warehouse and a line-storage warehouse, and the material handling quantity criterion. Caputo and Pelagagge [20] evaluated kitting and line-storage feeding with an optimization model that aims to minimize the cost of labor, space requirement, and in-process stock quantity parameters. Wänström and Medbo [26] compared line-storage and sequential feeding systems by examining how they affect labor, production flexibility, material planning parameters, and assembly process performance. Battini et al. [27] conducted a study for a pallet to workstation, trolley to workstation, and locking as a part of the feeding methods. They evaluated the most important factors affecting the material feeding strategy as follows: the distance between the line and the warehouse, the average number of components of each finished product, the average lot size, and the number of stations on the line. Hua and Johnson [28] explained the factors for choosing the right line feeding method as follows: the effect of the product and components on production volume, the effect of the variety and size, the effect of component stocking and material handling, the effect of production control, and the effect of system selection on operational performance. Caputo and Pelagagge [21] demonstrated a model to support decision-making for kitting, just-in-time Kanban-based continuous feeding, and line-storage feeding methods. Hanson et al. [29] compared the time taken to bring materials from kitting and line-storage stocking to the assembly line in the automobile industry. It was interpreted that kitting increases material picking and counting, line-side stocking increases in-process material stock and increases the holding cost, and if the same component is to be used in different assembly stations, it will require multiple space requirements in the line. Limere et al. [30] developed a labor-based mathematical cost method to select a material feeding strategy comparing kitting and line-storage methods. Hanson and Brolin [31] defined line storage and kitting regarding product quality, assembly support, flexibility, finished product inventory level, and required stock space. Caputo et al. [22] developed a mathematical model to select the optimal material feeding method for parts fed to the assembly line to minimize the total cost. Labor costs, investment costs, in-process inventory holding costs, and factory floor space costs were considered as parameters. Limere et al. [7] developed a mixed-integer programming model to minimize logistics costs to choose between line-storage feeding and kitting. Sali et al. [23] examined the kit, line-side, and sequencing methods with a total cost formulation that evaluates material preparation costs before assembly, picking, transportation from the central warehouse to the assembly line, and stocking. Caputo et al. [10] developed a cost model for supplying materials to assembly lines according to the kit, line-storage, and just-in-time production methods that depend on the part characteristics and performed sensitivity and parametric analyses to determine the best method for each material. Baller et al. [18] extended the mixed-integer programming formulations in the literature by allowing flexible line-edge spacing by modeling different line feeding methods per material family for different material feeding methods. Zennaro et al. [32] developed a mathematical model that aims to reduce the cost of a material feeding system. Kang et al. [33], Bertolini et al. [34], Moretti et al. [35], and Zangaro et al. [36] investigated the potential of machine learning (ML) methodologies in addressing the material feeding problem. Moretti et al. [35] presented a DT model for the material feeding problem. Faccio et al. [37] presented a simulation-based model and statistical analysis for the material feeding strategy problem. As asserted by Kang et al. [33], artificial neural network (ANN), decision tree (DT), random forest (RF), support vector machine (SVM), and K-nearest neighbor (K-NN) are the most frequently applied ML models, and binary classification is the major dependent variable for production line problems.
A literature review reveals significant advancements in understanding and modeling the problems associated with feeding materials during the assembly process. Many extant studies, beginning with Bozer and McGinnis [2], adopt a binary or uniform approach, presuming a uniform feeding policy for all components. This simplification does not reflect the complexity of real-world assembly lines, where different components may require different material feeding strategies. In practice, many assembly lines are characterized by the deployment of multiple material feeding systems, which are utilized concurrently to accommodate various product types, production volumes, part characteristics, and supply chain constraints. This necessitates exploring hybrid material feeding systems capable of integrating and dynamically adjusting between different feeding methods. The implementation of such systems would enable manufacturers to optimize material handling processes in a flexible and adaptive manner, allowing for real-time adjustments based on shifting production needs and environmental conditions. Research on hybrid feeding systems, where multiple feeding strategies coexist and incorporate dynamic decision-making frameworks, ensuring that material feeding systems can be switched or combined in response to specific operational requirements, remains limited. Integrating traditional material feeding strategies with data, predictive analytics, and ML models can potentially optimize manufacturing systems’ performance and cost efficiency. Recent research (e.g., Kang et al. [33]; Moretti et al. [35]) introduces ML-based methodologies for material feeding problems, but applications remain exploratory and limited to specific ML models. Most models primarily aim to minimize costs, neglecting other crucial performance metrics that influence assembly lines’ overall performance and effectiveness. In environments with high variability or frequent product changes, a system optimized only for the cost may lack flexibility and efficiency. Material feeding strategies prioritizing cost minimization can lead to quality issues or delays. The rapid pace of technological advancements in manufacturing, driven by Industry 4.0, increases the importance of system adaptability. Therefore, there is a need for multi-criteria decision-making models that address broader operational and strategic objectives beyond cost reduction. The lack of empirical evidence and case studies on the implementation and effectiveness of proposed models in diverse industrial settings also needs to be addressed. ML models have demonstrated considerable potential in predicting the optimal material feeding strategy. Nevertheless, a pivotal element of their implementation, namely the interpretability of the models, is frequently disregarded. For manufacturing companies to confidently adopt ML-based decision-making systems, providing clear insights into how various input features influence the model’s predictions is essential. One promising method to enhance interpretability is the application of Shapley values, a concept from cooperative game theory that can quantify the contribution of each input feature to the final prediction of a model. Despite the potential of combining Shapley values with ML models, this approach remains underexplored in the material feeding strategy literature. The incorporation of Shapley values into ML models has the potential to generate actionable insights that elucidate the rationale behind the selection of a specific feeding strategy in a given context. However, there is a lack of research exploring the potential of Shapley values to enhance the interpretability of ML models, particularly in the context of multi-class classification problems such as material feeding strategy selection.
3. Materials and Methods
ML algorithms can be classified into four subclasses as follows: (1) supervised learning, where the algorithm uses a set of labeled training data to derive a function between the input(s) and the output(s); (2) unsupervised learning, where the algorithm does not require labeled data; (3) semi-supervised learning, where the training dataset includes both labeled and unlabeled data, and (4) reinforcement learning, where the algorithm rewards positive actions and penalizes negative actions using a feedback mechanism [33]. Although the availability and quality of data are critical to the performance of ML algorithms, supervised learning usually achieves better results than semi-supervised and unsupervised learning approaches [33].
A DT is a supervised ML model that supports decision-making processes. It is represented as a logical tree, with a range of conditions and conclusions as nodes and branches [38,39]. At each stage of the decision-making process, a decision tree takes a decision and considers alternative choices of action, selecting the most relevant alternatives [40]. It employs estimates and probabilities to calculate probable outcomes and assist in determining the net gain from a decision. Various techniques are employed to accomplish classification, including information gain, chi-square, Gini, entropy, and others [41]. The DT method is characterized by its simplicity, ease of understanding and visualization, rapid execution, minimal data preprocessing requirements, and capacity to effectively handle both categorical and numerical data; however, it should be noted that this algorithm can occasionally result in a complex tree structure that lacks sufficient generalization, and it is a relatively unstable model [42].
The RF model can be considered an ensemble learning method for regression and classification [43]. The RF model builds an ensemble of DTs using a training sample, which, in turn, results in the appropriate classification of data or the provision of suitable predictors for one or more characteristics of the individual trees. The RF method is employed in the construction of a bagging ensemble, with the process being informed by DTs and introducing random attribute selection during the training process [44]. The RF algorithm divides the training set into multiple subsets, and each subset is then assigned an independent DT [45]. The model’s output is determined by a voting system that integrates the outputs from all the DTs [46]. In contradistinction to alternative conventional methods, which necessitate a substantial computational load, the RF model entails a reduced computational demand for the DT and enhances prediction accuracy [47]. Zhai et al. [48] demonstrated that a single DT is sensitive to the noise present within the training dataset. However, the RF classifier has been shown to be capable of reducing the correlation between the trained multiple DTs, thereby effectively reducing the overfitting problem.
The logistic regression (LR) model aims to construct a linear model of the output, which can be interpreted as an estimate of the posteriori probability of class membership [49]. LR is a widely used classification algorithm in industry and because of its simplicity and efficiency, LR still attracts wide attention from researchers [50]. LR is a statistical model with an assumption that the variables are independently and identically distributed. LR is one of the wrapper methods known for its decent predictability performance but is computationally expensive [51]. LR does not require the optimization of any hyperparameter and is thus easier to implement [52]. Based on the observation of input variables, LR describes the probability of realization of the output variable(s). LR applies the Newton–Raphson algorithm to determine the coefficients of the regression equation [53].
The SVM is an algorithm that is capable of handling both regression and classification tasks, although they are more effective for classification [42]. The SVM involves the separation of objects in an n-dimensional space using a hyperplane. The closest vectors between these categories are referred to as support vectors [54]. The initial n-dimensional spatial domain is thus transformed into a space of a higher degree of complexity, known as a Hilbert space, wherein the dot product is determined by a function designated as the ‘kernel’. The SVM is equipped with a variety of kernels, encompassing linear, polynomial, Gaussian, and sigmoidal types [55]. The performance of the SVM model is dependent upon the construction of the hyperplane; if this is executed competently, the model will demonstrate high performance [42]. SVMs are characterized by their strong capacity for generalization, which renders them particularly useful when dealing with many attributes and limited data points [56].
In K-NN classification, all available data are stored and the class of a new instance is predicted based on the similarity measurements from the nearest neighbors in terms of likelihood. K-NN reduces the computational cost of checking and applying the appropriate distance function between the new observation and all k numbers of different data points stored. It then determines the label of the new data point without constructing a mapping function or internal model, in contrast to other classification algorithms [40]. The K-NN classifier is employed to allocate the query into the class that is most prevalent among its K-nearest neighbors in the training set, in accordance with the majority voting rule [54,57]. The K-NN’s primary shortcoming lies in the requirement for recalculation of the distance from all k neighbors for each new instance, which results in a significant computational expenditure [42].
The ANN can be defined as a powerful data modeling tool that simulates the cognitive learning process of the human brain system. The key strength of the ANN lies in its capacity to represent both linear and nonlinear relationships and to learn such relationships directly from the data being modeled. The structural composition of an ANN entails interconnected neuron clusters, with the fundamental configuration comprising three layers: the input layer and the output layer, which are employed for the training of the model, and the hidden layer(s), which facilitate the establishment of a connection between the input and output [58]. The structural design of the artificial neural network (ANN) model is determined by the specific characteristics of the problem and the data, and consequently, there is no single standard structure that can be universally applied to all problems [59]. The training of the network can be defined as a process of changing the weights of neurons, where the initial weights of the neurons are randomly determined [60]. The objective of a training algorithm is to identify a decision function that facilitates the modification of the network’s weights. A multitude of training algorithms have been documented in the extant literature; however, identifying the most appropriate algorithm is a challenging task. The backpropagation (BP) ANN is extensively utilized in the modeling of nonlinear and complex problem types [61,62]. The BP training algorithm employs a methodology (first-order steepest descent techniques) to adjust the weights of the neurons based on the estimation of the gradient of the sum squared error for each layer. This process is intended to increase the training speed and to avoid local minimum solutions. The error term is defined as the difference between the network response and the expected output. The rectified linear unit (ReLU), as proposed by Nair and Hinton [63], has been shown to exhibit excellent nonlinear properties and is considered to be one of the most widely utilized activation functions in ANNs [64]. For each input element, the ReLU activation function performs a threshold operation. If the argument is negative, the value is zero; if the argument is non-negative, the value is the variable itself. The ReLU activation function (σ) can be represented by the following Equation (1):
where x represents the input.
The classification tasks in ML models can also be broadly categorized based on the number of outputs and the range of possible values for each output. Binary classification is the process of assigning instances to one of two possible classes for a single output variable. In this context, the functional class requirements are characterized by the presence of distinguishing features that serve to differentiate them from non-functional class requirements [65]. In contrast, multi-class classification extends this by allowing the single output variable to belong to one of several distinct classes, thus offering a more nuanced approach to categorization [66]. In multi-class classification, individual classes of requirements often have few distinguishable features, which can result in challenges in terms of predictor performance [65].
Shapley values, as initially defined by Shapley [67], represent a classical concept in cooperative game theory. These values have recently been applied to the interpretation of ML models’ predictions [68]. Shapley values can also be interpreted as representing an equitable or reasonable distribution of feature importance, given a specific model output. Features contribute to the output or prediction of the model to a different degree, both quantitatively and qualitatively. This phenomenon is accommodated by the use of Shapley values. In this manner, the Shapley values can be considered as estimates of feature import, i.e., the magnitude of a feature’s contribution to the prediction, as well as the direction of this contribution, i.e., its sign. Features with a positive sign contribute positively to the prediction of activity, whereas features with a negative sign contribute negatively to the prediction of inactivity [69]. The importance of an input i is defined by the Shapley value as in Equation (2):
where corresponds to the output of the ML model to be explained using a set of inputs, and is the complete set of all inputs. The Shapley value of input () is determined as the average of its contributions across all possible permutations of an input set. The performance of ML algorithms is evaluated using a number of different metrics, including accuracy, precision, recall, F1-score, and kappa statistic. Accuracy is the proportion of instances that are correctly classified, precision is the proportion of instances classified as positive that are truly positive, recall is the proportion of positive instances that are correctly classified as positive, and the F1-score combines the precision and recall [55]. The following equations (Equations (3)–(6)) are used for the accuracy, precision, recall, and F1-score metrics:
where true positive () and true negative () represent the correctly classified instances, and false positive () and false negative () represent the incorrectly classified instances.
4. Results
The company where this study was conducted is a manufacturer of hydraulic and pneumatic motors and pumps for agricultural and industrial vehicles. The company employs cellular manufacturing techniques and has five different product groups, with the selected product group comprising three different assembly lines. It is necessary to pre-assemble certain subcomponents that are employed in three assembly lines. Two pre-assembly stages are identified. One of the three assembly lines is a manual assembly line, which has the longest production lead time. This line was selected as the pilot assembly line for the implementation of the proposed methodology. Prior to the introduction of all components into the pilot assembly line, a number of components are transformed into intermediate products in two pre-assembly lines. This requires the implementation of an appropriate material feeding method.
A total of 2221 unique materials are assembled on the pilot line. Of the total number of materials, 1150 are produced internally, while 1071 are purchased from external suppliers. While 1047 materials are stored next to the assembly line (in Figure 1a), 103 different types of materials are managed in accordance with the Kanban principle with a two-box system (Figure 1b), and 1071 materials are supplied from the central warehouse via a call-out system (Figure 1c) when the relevant material is required on the assembly line.
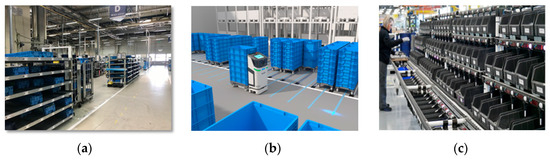
Figure 1.
Material feeding systems in the company (a) for line storage, (b) for Kanban system, and (c) for call-out system.
Different types of materials have different sizes and weights, and product groups have different demand values. The handling of materials should not result in any deterioration in quality. In the current situation, the assembly operator is responsible for preparing the requisite materials for the assembly line in accordance with the production plan received from the logistics unit. The logistics unit disseminates the production plan to the pre-assembly and other assembly lines. The high number of similar types located next to the assembly line results in a considerable investment of time in searching for the requisite materials. This consequently results in an increase in the assembly lead time. In accordance with the established protocol, the assembly operator is obliged to notify the warehouse at least four hours in advance of the materials that are to be supplied from the warehouse. The materials supplied from the warehouse are used as often as required, and the warehouse is informed of the impending delivery, given the lack of available space next to the assembly line. The team leaders, who are responsible for the assembly line, make the decision regarding the material feeding method based on their experience. The organization of material feeding methods is subject to change for a number of reasons, including the performance of non-value-added work by assembly operators, the lack of sufficient space within the company for the introduction of new machines and assembly lines, the objective of increasing the number of assembly line outputs, and the receipt of complaints from customers due to material mix-ups on the assembly line. Given the considerable time required for the team leaders to make decisions regarding materials across the entire company, it was decided that a method should be developed that could be applied to all product groups within the company. Kitting, which is not currently employed as a material feeding method, is proposed as a potential solution given the company’s diverse product range and low demand volume. It is anticipated that this approach could address the space constraints next to the line, enhance the assembly line output by reducing the workload of the assembly operator, and improve quality by minimizing the risk of incomplete or incorrect assembly.
Six different classification-based ML algorithms, LR, DT, RF, SVM, K-NN, and ANN, are used for the material feeding method selection problem. LR is a suitable choice for the multi-class material feeding strategy problem due to its simplicity, interpretability, and ability to handle multiple classes [40]. DT models’ decision processes are similar to human reasoning and can identify the key features affecting material feeding strategies [70]. RF is attributed to its ensemble nature, leading to enhanced prediction accuracy and reduced overfitting for multi-class problems [71,72]. SVMs are effective for cases with small datasets and valuable for distinguishing between closely related classes, such as when differentiating between similar material feeding strategies [73]. The non-parametric nature of the K-NN model allows it to adapt to complex material feeding patterns [74]. ANNs can learn complex patterns in data with multiple variables and possess practical generalizing ability for multi-class problems [61,62]. A review of the literature revealed a variety of inputs that could be employed in the selection of a material feeding method. These were evaluated in the context of the inputs currently in use within the company, and five input parameters were determined as follows:
- Mode of supply: The supply method employed for the pilot assembly line is a combination of in-house production and external sourcing. Some of the materials used are manufactured on-site in the company’s machining facilities, while others are purchased from external suppliers.
- Annual demand: It is crucial to ascertain the extent of demand that the materials will have in a year. In order to reduce the in-plant logistics costs, products with high annual demand volumes may be situated next to the assembly line. Conversely, products with low annual demand may be supplied from the warehouse when required, thus optimizing the utilization of space in close proximity to the assembly line.
- Finished product reference number (Reference No): The final product produced on the assembly line is composed of between 100 and 150 sub-materials, the precise number depending on the specific type of product. It is possible for each material to be a sub-material of one or more finished products.
- Use case in pre-assembly (Use case): It is possible that the final products may consist of sub-assembled or semi-assembled materials. It is recommended that the pre-assembly step should commence at a specific point in time before the assembly step. It should be noted that feeding material at the same time as the pilot line may cause problems in compliance with the production plan on the line.
- Compatibility of the material size with the kitting vehicle (Compatibility with KV): It should be noted that each material may have disparate dimensional characteristics. Products with dimensions spanning the range from 0.01 mm to 1000 mm are assembled in the pilot line. Given that the volume of the kitting vehicle is designed for a limited range of products, it is crucial to assess the suitability of the products for transportation with the kitting vehicle.
The description of the inputs determined for the material feeding method is given in Table 1.

Table 1.
Description of input parameters.
The output parameter comprises four different material feeding systems, including line storage, Kanban, kitting, and a call-out system. The framework of the proposed study can be seen in Figure 2.

Figure 2.
The framework of the proposed study.
The dataset contains the material details obtained from the company’s enterprise resource planning (ERP) system, production logs, and warehouse inventory records. The data preprocessing applied in the study includes removing duplicate records for the materials listed under more than one product category, correcting missing values for the demand rates by interpolation based on historical production data, and correcting inconsistencies in the material feeding strategy classification labels. Categorical inputs are encoded using binary and one-hot encoding methods to facilitate model interpretation. It was established that annual demand values significantly deviating from production trends were to be identified as outliers and then validated against production schedules to confirm the validity of the data and correct data entry errors. It is imperative to acknowledge the potential for bias inherent in the observed data, which may have originated from historical preferences concerning feeding methods or long-standing practices in the company.
The MRMR algorithm is used to observe the material feeding method for different values of input parameters. The MRMR algorithm, first proposed by Peng et al. [75], measures the redundancies among input parameters and the relevance between input parameters and output class labels for a given set of inputs. The primary function of the MRMR algorithm is to minimize the redundancy of an input set and maximize the relevance of an input set to the output variable [76,77]. The inputs that were ranked highest by MRMR are considered to exhibit an optimal balance between relevance to the output and minimal redundancy. The MRMR method is characterized by its high level of computational efficiency and its capacity for generalization concerning different ML models [78]. In the MRMR algorithm, each input is assigned a weight that signifies its importance or relevance to the output variable, with higher weights deemed more relevant. The MRMR weights for the input parameters have been calculated and are presented in Table 2. The MRMR algorithm results indicated that all selected inputs were relevant to the material feeding method.
Table 2.
Results of the MRMR algorithm.
The training dataset, which consists of 2221 rows, is split into two sets (training and testing) before running the ML algorithms. Cross-validation (CV) is a popular strategy to split the data (one or more times), in which the split part of the data is used to train the algorithm, and the remaining part is used to estimate the risk of the algorithm [59]. CV also helps to prevent overfitting to biased subsets of data and increase generalizability [79].
The ML algorithms are run with the following hyperparameters: a maximal depth of 7; a maximum number of splits of 100, the “Gini index” as a split criterion for the DT algorithm; ridge regularization with the regularization strength (lambda) of 0.00046 and One-vs-One multi-class coding for LR; a kernel scale of 1; a box constraint level of 1 with One-vs-One multi-class coding for SVM; a number of learners (30), number of trees (20), and maximum number of splits (2173) for RF; a number of neighbors (10) and Euclidean distance metric for K-NN; 10 and 12 neurons in two hidden layers; and the ReLU activation function for a bi-layered ANN.
To improve the performance of the ML models, the parameters are optimized using Bayesian optimization (BO). Fundamental principles of BO involve utilizing a surrogate model of a Gaussian process and an acquisition function to determine the subsequent point to be evaluated [80]. BO is an effective search algorithm capable of generating performance results for all values within the user-defined parameter range [81]. Table 3 demonstrates the hyperparameters of the ML models used in the BO hyperparameter optimization procedure.
Table 3.
The hyperparameters of the ML models used in BO.
The performance metrics of the models for the training set can be seen in Table 4. In the context of the training set, the RF model consistently demonstrates optimal performance, both with and without parameter optimization, attaining near-perfect scores of 99.6%. The ANN model also exhibits high performance, exhibiting only a slight decline in performance relative to the RF model. The DT model exhibits lower accuracy than the other ML models. The LR and SVM models demonstrate competitive results, particularly after parameter optimization. The optimization of parameters has been demonstrated to enhance the accuracy of both DT and SVM. The accuracy for DT has increased from 89.8% to 91.27%, and for SVM, from 93.6% to 94.38%. Minimal enhancements in performance metrics are observed for the ANN with parameter optimization; however, a substantial increase in CPU time is evident, rising from 4.47 s to over 528 s.
Table 4.
Performance metrics of ML models for the training set.
Heatmaps of the confusion matrices of ML models for the training set can be seen in Figure 3.
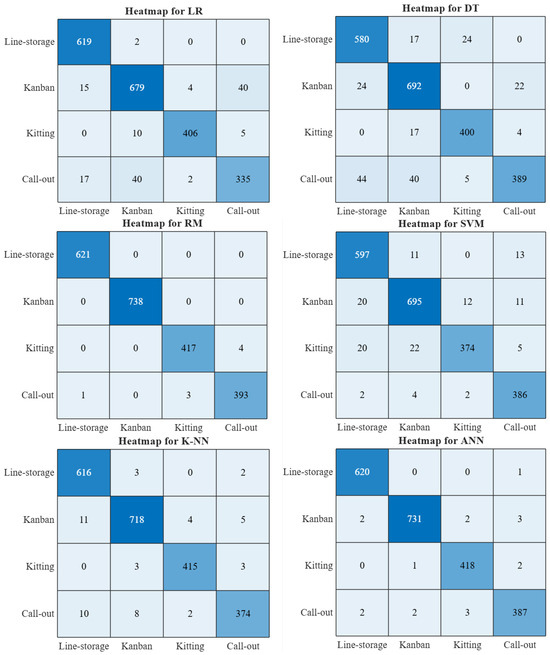
Figure 3.
Heatmap of the confusion matrices of ML models with parameter optimization for the training set (While the lightest shade of blue indicates a lower quantity, the darkest shade of blue indicates a higher quantity).
Trained ML models are validated with the validation set (including 47 rows), which have not been used during training. The performance metrics of the ML models for the validation set can be seen in Table 5.
Table 5.
Performance metrics of ML models for the validation set.
As illustrated in Table 5, the ANN model demonstrates superior performance across all metrics when identifying the correct material feeding method for the validation dataset. The RF model demonstrates strong performance with consistent metrics, while the K-NN model performs well but falls short of the RF and ANN models. The LR model is a simple, interpretable model, but it might not capture complex patterns in the validation data compared to the RF or ANN models. The DTs are prone to overfitting and might not generalize well without pruning or ensemble techniques, and the SVM model has the lowest performance metrics compared to the other ML models. In the validation dataset context, the ANN achieves the highest accuracy (95.6%) and superior performance in all performance metrics. The RF model exhibits a noteworthy accuracy of 94.3%. LR and K-NN demonstrate commendable performance, achieving 85.1% and 87.2% accuracy, respectively. In contrast, the performance of the SVM and DT is comparatively lower, with the SVM demonstrating the least optimal results (81.9% accuracy). Notably, the performance of the ANN notably improves to 97.82% accuracy after parameter optimization. K-NN enhances performance (87.2% to 89.36% accuracy), signifying its sensitivity to parameter optimization. On the other hand, the SVM exhibited modest gains in precision but encountered difficulties in maintaining recall, underscoring challenges in classifying certain classes even after parameter optimization. The performance of RF, which reached 94.3% accuracy without parameter optimization, slightly declined to 93.61% accuracy with parameter optimization. Despite the RF model demonstrating optimal performance for the training set, the ANN model exhibits superior performance for the validation set compared to other ML models. The performance of the RF model on the validation set is observed to decrease, and this decline, occurring on the validation data despite robust outcomes on the training set, may suggest the occurrence of overfitting for the RF model.
In order to identify the impact of input parameters on the decision-making process concerning the selection of material feeding methods, a Shapley value analysis of the input parameters was conducted.
Table 6 presents the Shapley values of the input parameters with respect to the material feeding method. Figure 4 illustrates the graphical summary of the Shapley values for the ANN model.
Table 6.
Shapley values for ANN model.

Figure 4.
Graphical summary of Shapley values for ANN model.
As demonstrated in Table 6 and Figure 4, the application of demand has a substantial positive influence on Kanban (Shapley value = 0.6479), highlighting Kanban’s adaptability to varying demand levels and a negative effect on line storage possibly due to inefficiencies or space constraints when handling large quantities, kitting likely due to inefficiencies in preparing kits for high-volume production, and call-out indicating that is not well-suited for high-demand scenarios (most significant negative effect of −0.4117 on call-out). The compatibility with KV has a minor effect on Kanban, with a value of 0.0029, indicating compatibility considerations may favor Kanban, and on call-out, with a value of 0.1192, suggesting compatibility considerations favor call-out. However, it demonstrates a negative impact on kitting, with a value of −0.122, possibly due to the difficulty of integrating kits into existing systems and no significant effect on line storage. Use case has a positive effect on Kanban with a value of 0.0481, showing Kanban’s versatility in different production contexts, and kitting with a value of 0.0644, showing kitting works well in specific specialized production scenarios. A negative effect on line storage, with a value of −0.1142, indicates that the specific use-case scenarios do not favor line-storage feeding and have a minimal effect on call-out, with a value of 0.0017 showing minimal impact from specific use-case scenarios. The reference number exhibits a negative effect on Kanban with a value of −0.0871, suggesting reference numbers are less compatible with Kanban strategies; a positive effect on call-out with a value of 0.0817, indicating call-out benefits from specific reference number configurations; a lesser degree of effect on kitting with a value of 0.008, suggesting a minor role in determining kitting suitability; and a minimal effect on line storage with a negative value of −0.0025, indicating that the reference number plays a negligible role. The supply mode has a minimal contribution across all input parameters and has a positive influence on line storage with a value of 0.0008, suggesting that the supply mode plays a minor role in the material feeding method selection process and on kitting, with a value of 0.0017, indicating that it favors kitting to a mild degree. However, it has minor negative impacts on Kanban and call-out systems.
It is imperative to acknowledge that the demand value has the most significant impact on the ANN model, both positively and negatively. Consequently, fluctuations in demand may result in a change to the material feeding method. Due to its continuous supply model and adaptability, the Kanban method is the most influenced by demand, making it suitable for environments with fluctuating or high demand. The implementation of a Kanban material feeding strategy in automotive assembly lines, characterized by frequent demand changes, contributes to the assurance of uninterrupted production flow and the mitigation of overstocking risks. Conversely, line-storage, kitting, and call-out systems are adversely affected by demand due to space constraints, increased preparation times, and inefficiency in handling large quantities, rendering them less optimal for high-volume operations. The compatibility with KV and supply mode parameters exhibits low contributions across material feeding methods. The call-out method demonstrates sensitivity to demand and suggests that compatibility considerations favor call-out. The results indicate that if the company is required to develop a demand-driven material feeding strategy, the implementation of a Kanban system can be advantageous, while the kitting and line-storage processes are streamlined for stable, low-demand operations. This approach is expected to enhance operational efficiency and effective cost management. If the company places emphasis on customization and precision in its material feeding strategy, the call-out system has the potential to be effective in high-variability, high-precision manufacturing environments.
Table 7 presents a comparison of the current application for the material feeding system in the company and the application suggested by the proposed ANN model.
Table 7.
Comparison of number of materials for current application and suggested application.
As illustrated in Table 7, the implementation of the proposed ANN-based solution will result in a 48.9% reduction in the number of materials located adjacent to the line, from 1047 to 513 types. This reduction in material types will lead to significant space savings next to the line.
The application indicates a substantial reduction, suggesting that resources are being allocated unnecessarily to line storage and that they could be redirected elsewhere for greater efficiency. Considering the size of the products and the containers in which they are stored, it is expected to result in a 48.9% reduction in the number of material types that need to be placed next to the production line, resulting in the availability of approximately 100 m2 of space in the production area. However, as these materials will be stored in the central warehouse, it was determined that an additional 50 m2 of space would need to be allocated within the central warehouse. The company’s inadequate capacity to meet customer demand was a key issue. Consequently, it was imperative to allocate space to introduce new manufacturing equipment. The warehouse space cost was less than the profit from the new machines, thus making the decision appropriate in the context of a feasibility analysis. Prior to the execution of the proposed study, the kitting method had not been employed in the pilot assembly line. However, the kitting application has been proposed for 461 materials within the proposed system. Implementing the kitting application involves assigning a logistics operator to prepare the kit and allocating a designated area within the warehouse for kit preparation. During the preliminary commissioning phase of the application, an emergency material feeding vehicle was allocated to the designated area to ensure the production line’s uninterrupted operation, thereby mitigating the risk of material feeding issues. To ensure the system’s adaptability, the identification of emerging problems was facilitated by implementing the daily continuous improvement process (CIP) board, action plans were devised, and the transition and adaptation process was successfully completed. Logistics operators were trained in kitting to facilitate employees’ adaptation to the kitting system.
Due to the company’s production capacity constraints, the utilization of fast production changeover was imperative. In the event of a changeover in production on the assembly line, it was the responsibility of the assembly operators to locate and deliver the necessary materials to the line. The configuration of the production system was characterized by a high number of material types and a low number of units in each type. This resulted in a lack of clearly designated locations for the materials, which led to assembly operators seeking materials in a designated common area. Moreover, material containers were occasionally positioned in a stacked configuration due to limited available space within the production area. It is posited that the implementation of the proposed system will result in a 49.8% reduction in the number of materials located in the assembly line. It is estimated that the relocation of non-essential materials away from the assembly line will result in a reduction of time spent searching for materials. This, in turn, is expected to reduce the amount of production-related stress experienced by the operator. It is also expected that implementing this system will reduce non-ergonomic activities, such as repeatedly moving materials around the production area and taking material containers over each other. As most materials are currently fed to the assembly line in standard material boxes, the remaining materials after production are repackaged and directed to the warehouse. The study proposes increasing the number of materials fed using the Kanban and kitting methods. This will enable the operator to receive the required number of parts from the warehouse with the kit and Kanban system. The elimination of repackaging and subsequent re-dispatch of materials to the warehouse is a key benefit of this system, as is the reduction in warehouse waste. The advantages inherent to this system comprise the elimination of repackaging and the subsequent reshipment of materials to the warehouse, which consequently results in a reduction in warehouse waste and in-company logistics traffic. A reduction in in-house logistics traffic and the consequent reduction in forklift energy consumption will increase energy efficiency.
The increased use of Kanban systems is indicative of a reallocation of resources and tasks to this category, suggesting that the Kanban approach may be a more efficient or effective method for the current operations. The utilization of kitting is not currently employed; however, its implementation is recommended, with the allocation of substantial resources. This suggests a missed opportunity to optimize operations through kitting, which could potentially improve process flow or efficiency. It is evident that the call-out function is currently being used excessively in a manner comparable to line storage. The recommended reduction signifies the over-allocation of resources, which could be streamlined or redirected to underutilized areas such as Kanban or kitting. The presented model posits that there should be a reduction in reliance on line-storage and call-out systems. A substantial augmentation in the utilization of Kanban is imperative, accompanied by the integration of kitting. The implementation of these changes is expected to achieve a balanced utilization of resources, thereby enhancing efficiency and productivity.
The proposed ANN-based system has many advantages, but integrating the model into existing manufacturing systems will be challenging. The model’s accuracy depends on the data’s accuracy and real-world data quality (which can compromise the model’s accuracy due to noise, missing values, inconsistencies, and errors). The ANN is a supervised learning algorithm that requires labeled data. This data may not be readily available or can be costly and time-consuming to generate. Integrating data from multiple sources is challenging due to data formats and protocol heterogeneity. Integration of ANN models requires robust computing resources, which may require hardware or cloud upgrades. Maintaining consistency and integrating multiple production lines or sites is challenging because operators and management often resist new technology. The company should consider a strategic approach to implementation. This could mean introducing ANN-based models to minimize operational disruptions, automating and securing data collection and preprocessing, monitoring the performance of the ANN-based model, encouraging teams to include data scientists, engineers, and operators, and scheduling training to explain the benefits and procedures of the system. This will ensure that the ANN-based model is integrated and used effectively. These solutions will help manufacturers overcome the challenges of integrating ML models and open up new opportunities for efficiency, quality, and innovation.
5. Discussion
In the contemporary business environment, manufacturing companies are compelled to enhance their performance in order to maintain their competitive advantage. In order to compete, it is imperative that they enhance their productivity by improving the quality and reducing costs and delivery times. Material feeding systems represent a pivotal dimension that exerts a significant influence on productivity. The selection of appropriate materials feeding systems in manufacturing companies has been shown to result in a decrease in non-value-added work and quality problems, an increase in product output, an improvement in ergonomic conditions, and an enhancement in the ability to respond promptly to customer demands.
A wide range of material feeding methods have been listed in the extant literature, including line-storage, Kanban, kitting, demand-based, just-in-time, and hybrid approaches. Kanban is a material feeding system based on drawing the minimum and maximum stock defined. A notable advantage of this method is that it does not necessitate any additional planning. It is predicated on the assumption that the requisite stock quantity is available at the stipulated location. The line-side feeding method is advantageous in that materials are available next to the assembly line and can be easily accessed in case of any problem; however, it is disadvantageous in that it takes up space next to the line, and the time spent searching for materials is not value added. In contrast, the on-call demand-based feeding method involves the request of materials from a central warehouse when they are to be used in the assembly line. The requested materials are delivered in a box, the required amount of material is consumed, and the remaining material is delivered back to the assembly line. Despite the lack of spatial proximity to the assembly line, this method results in inefficiency due to the movement of materials. Kitting is a material feeding method that ensures that the materials required for the assembly line are placed in a defined quantity in a defined container and delivered to the specified place at the specified time. This method is considered advantageous in enterprises where product variety is high and product demand volume is low. The reduction in material intermediate stocks has been shown to decrease the time spent searching for components. It has been demonstrated that kitting can increase productivity by reducing non-value-added activities. It also helps to prevent incomplete or incorrect assembly by providing a defined and visual management system. However, it is important to note that this method does come with certain disadvantages, including the requirement for dedicated kitting preparation time and labor. Inadequate implementation or a less developed kitting system within the supply chain can result in assembly line downtime.
This study was conducted at a manufacturing company specializing in the production of hydraulic and pneumatic motors and agricultural and industrial vehicles. The company deploys cellular manufacturing techniques and has five distinct product groups, with the selected product group encompassing three separate assembly lines. The company is engaged in the production of motors, characterized by a high degree of product variety and a comparatively low-demand volume. A comprehensive investigation was conducted into hybrid approaches that may be suitable for the company, with a focus on Kanban, line-storage feeding, call-out, and kitting systems. While the requirement for additional space for new machines and assembly lines is acknowledged, there is also a demand to increase the number of outputs through enhanced productivity of assembly operators. Additionally, there is a requirement for a material feeding system that is straightforward to implement, capable of expeditious decision-making, and conducive to assembly lines with diverse value streams within the factory environment.
The material feeding method selection problem is structured based on a multi-class classification problem, with four output parameters and five input parameters being determined. Six different classification-based ML algorithms, LR, DT, RF, SVM, K-NN, and ANN, are used for the material feeding method selection problem. The training dataset, which consists of 2221 materials, is split into two sets (training and testing) before running ML algorithms. In this study, the 8-fold CV technique is applied to the dataset, and random sampling is used to determine the folds. The ANN model demonstrates superior performance across all metrics when identifying the correct material feeding method. The Shapley values of the input parameters are analyzed for the developed ANN model. While the ANN method is commonly referred to as a ‘black box’ method, the analysis of Shapley values provides actionable insights into the influence of input parameters on material feeding system selection. According to the Shapley value results, fluctuations in demand may result in a change to the material feeding method. The Kanban method is the most influenced by demand and use-case parameters. The compatibility with KV and supply mode parameters exhibits low contributions across the material feeding methods. The call-out method demonstrates sensitivity to demand and compatibility with the KV parameters.
In traditional manufacturing companies, material feeding method selection frequently depends on human decision-making, leading to hidden costs associated with inefficiencies in operational activities, excess inventory, and disruptions in material feeding. In contrast, the proposed ANN-based approach enhances the accuracy of the material feeding method selection, reducing downtime and enhancing productivity. The analysis encompasses implementation costs, including hardware upgrades for data collection, software licenses for ML platforms, and personnel training. These are then weighed against the long-term savings from decreased waste, reduced stock levels, and faster response times to production changeovers. For example, a reduction in incorrect assembly line feeding has been estimated to reduce re-work costs by a significant margin. These comparisons underscore the economic feasibility and strategic value of transitioning to a data-driven, ANN-based material feeding system. It is acknowledged that the ANN model incurs higher initial costs than traditional human-based models; however, it has been demonstrated that the operational savings resulting from reduced labor, inventory, and storage requirements result in favorable long-term cost efficiency. The ANN-driven solution can accommodate additional product lines, different material types, and varying demand levels in contrast to traditional methods. The transition to an ANN-driven material feeding strategy has been shown to deliver significant productivity, efficiency, and cost savings benefits. Despite the substantial initial investment and training costs, the long-term return on investment (ROI) is significant due to the enhanced operational efficiencies, improved decision-making processes, and increased operator productivity.
This study makes a significant contribution to the advancement of knowledge concerning material feeding systems in manufacturing environments, thereby facilitating an improved understanding and enhanced application of such systems. The present study addresses the unique challenges faced by manufacturers operating in high-variety, low-volume production environments. This study was conducted within the context of a manufacturing company specializing in the production of hydraulic and pneumatic motors, along with agricultural and industrial vehicles. The findings of this research endeavor to offer significant real-world relevance, providing practical insights that can be directly applied in industry. The framework of the proposed study is predicated on a range of production-related factors, including, but not limited to, demand fluctuations, product variety, and physical space limitations. The integration of ML models provides a robust and innovative approach to address the complexities of this decision-making process. The integration of six classification-based ML algorithms, including LR, DT, RF, SVM, K-NN, and ANN, by incorporating a multi-class classification system, represents a pioneering advancement in the field, demonstrating the application of advanced computational techniques within the material feeding system selection process. This methodological innovation has been demonstrated to enhance the accuracy, efficiency, and scalability of the decision-making process within dynamic manufacturing environments. The present study establishes a foundation for future investigations into the intersection of advanced analytics and engineering applications by combining ML models with manufacturing operations research. It opens avenues for refining and expanding material feeding systems to meet evolving industry needs. The study’s comprehensive and interdisciplinary approach offers both theoretical advancements and practical benefits, thereby establishing itself as a valuable resource for researchers and practitioners in the fields of manufacturing and supply chain management. Overall, this study bridges the gap between theoretical research and practical application, providing a comprehensive and adaptable framework for material feeding system selection in manufacturing. The findings are not only relevant to the specific case study but also serve as a foundation for broader applications and future innovations in engineering and operations management.
This study adopts a comprehensive approach; however, the practical challenges of integrating advanced ML models into existing manufacturing workflows, such as data preparation and system integration, require further exploration. This study utilizes a static dataset for the training and testing of ML models, which does not account for real-time changes in demand, production schedules, or supply chain disruptions. The incorporation of dynamic, real-time data could provide a more adaptive and responsive framework for material feeding system selection. Despite the study’s mention of ergonomic conditions, a more detailed analysis is required to ascertain the impact of the proposed material feeding systems on workers’ physical demands and environmental considerations, such as waste reduction and energy efficiency. By acknowledging these limitations, future research can build on the study’s findings, addressing these gaps and broadening the scope to create more versatile and widely applicable solutions for material feeding in manufacturing systems.
Author Contributions
Conceptualization, M.S.Ç.; methodology, M.S.Ç. and A.A.; project administration, M.S.Ç.; supervision, A.A.; writing—original draft preparation, M.S.Ç. and A.A.; writing—review and editing, M.S.Ç. and A.A. All authors have read and agreed to the published version of the manuscript.
Funding
This research received no external funding.
Institutional Review Board Statement
Not applicable.
Informed Consent Statement
Not applicable.
Data Availability Statement
The data supporting the findings of this study are available upon request from the corresponding author. Public access is restricted to protect privacy.
Conflicts of Interest
Author Müge Sinem Çağlayan was employed by the company Jaguar Land Rover-Solihull. The remaining authors declare that the research was conducted in the absence of any commercial or financial relationships that could be construed as a potential conflict of interest.
References
- Faccio, M. The impact of production mix variations and models varities on the parts-feeding policy selection in a product assembly system. Int. J. Adv. Manuf. Technol. 2014, 72, 543–560. [Google Scholar] [CrossRef]
- Bozer, Y.; McGinnis, L. Kitting versus line stocking: A conceptual framework and a descriptive model. Int. J. Prod. Econ. 1992, 28, 1–19. [Google Scholar] [CrossRef]
- Brynzer, H.; Johansson, M. Design and performance of kitting and order picking systems. Int. J. Prod. Econ. 1995, 41, 115–125. [Google Scholar] [CrossRef]
- Choobineh, F.; Mohebbi, E. Material planning for production kits under uncertainty. Prod. Plan. Control 2004, 15, 63–70. [Google Scholar] [CrossRef]
- Sali, M.; Sahin, E.; Patchong, A. An empirical assessment of the performances of three line feeding modes used in the automotive sector: Line stocking vs. kitting vs. sequencing. Int. J. Prod. Res. 2015, 53, 1439–1459. [Google Scholar] [CrossRef]
- Çevikcan, E.; Sol, E.; Satoğlu, Ş.I.; Durmuşoğlu, M.B. Set making based design of in-plant logistics processes and an application. J. Uludag Univ. Fac. Eng. 2018, 23, 83–98. [Google Scholar] [CrossRef]
- Limere, V.; Landeghem, H.V.; Goetshalckx, M. A decision model for kitting and line stocking with variable operator walking distances. Assem. Autom. 2015, 35, 47–56. [Google Scholar] [CrossRef]
- Kilic, H.S.; Durmusoglu, M.B. Advances in assembly line parts feeding policies: A literature review. Assem. Autom. 2015, 35, 57–68. [Google Scholar] [CrossRef]
- Zhou, B.; Zhao, Z. A hybrid fuzzy-neural-based dynamic scheduling method for part feeding of mixed-model assembly lines. Comput. Ind. Eng. 2022, 163, 107794. [Google Scholar] [CrossRef]
- Caputo, A.C.; Pelagagge, P.M.; Salini, P. Selection of assembly lines feeding policies based on parts features and scenario conditions. Int. J. Prod. Res. 2018, 56, 1208–1232. [Google Scholar] [CrossRef]
- Schmid, N.A.; Montreuil, B.; Limere, V. Modeling and solving integrated assembly line balancing, assembly line feeding, and facility sizing problems. Int. J. Prod. Econ. 2024, 277, 109354. [Google Scholar] [CrossRef]
- Tardif, V.; Maaseidvaag, L. An adaptive approach to controlling Kanban systems. Eur. J. Oper. Res. 2001, 132, 411–424. [Google Scholar] [CrossRef]
- Faccio, M.; Gamberi, M.; Persona, A.; Regattieri, A.; Sgarbossa, F. Design and simulation of assembly line feeding system in the automative sector using supermarkets, kanbans and tow trains: A general framework. J. Manag. Cont. 2013, 24, 187–208. [Google Scholar] [CrossRef]
- Kumar, C.S.; Pannerselvam, R. Literature review of JIT-Kanban system. Int. J. Adv. Manuf. Technol. 2007, 32, 393–408. [Google Scholar] [CrossRef]
- Savino, M.M.; Mazza, A. Kanban-driven parts feeding within a semi-automated O-shaped assembly line: A case study in the automotive industry. Assem. Autom. 2015, 35, 3–15. [Google Scholar] [CrossRef]
- Zammori, F.; Braglia, M.; Castellano, D. Just-in-time parts feeding policies for paced assembly lines: Possible solutions for highly constrained layouts. Int. Trans. Oper. Res. 2015, 23, 691–724. [Google Scholar] [CrossRef]
- Ostermeier, F.F.; Jaehnert, J.; Deuse, J. Joint modelling of the order-dependent parts supply strategies sequencing, kitting and batch supply for assembly lines: Insights from industrial practice. Prod. Manuf. Res. 2023, 11, 2200808. [Google Scholar] [CrossRef]
- Baller, R.; Hage, S.; Fontaine, P.; Spinler, S. The assembly line feeding problem: An extended formulation with multiple line feeding policies and a case study. Int. J. Prod. Econ. 2020, 222, 107489. [Google Scholar] [CrossRef]
- Müllerklein, D.; Fontaine, P.; Ostermeier, F. Integrated consideration of assembly line scheduling and feeding: A new model and case study from the automotive industry. Comput. Ind. Eng. 2022, 170, 108288. [Google Scholar] [CrossRef]
- Caputo, A.C.; Pelagagge, P.M. Effects of product design on assembly lines performances: A concurrent engineering approach. Ind. Manag. Data Syst. 2008, 108, 726–749. [Google Scholar] [CrossRef]
- Caputo, A.C.; Pelagagge, P.M. A methodology for selecting assembly systems feeding policy. Ind. Manag. Data Syst. 2011, 111, 84–112. [Google Scholar] [CrossRef]
- Caputo, A.C.; Pelagagge, P.M.; Salini, P. A decision model for selecting parts feeding policies in assembly lines. Ind. Manag. Data Syst. 2015, 155, 974–1003. [Google Scholar] [CrossRef]
- Sali, M.; Sahin, E. Line feeding optimization for just in time assembly lines: An application to the automotive industry. Int. J. Prod. Econ. 2016, 174, 54–67. [Google Scholar] [CrossRef]
- Fedtke, S.; Boysen, N.; Schumacher, P. In-line kitting for part feeding of assembly lines: Workload balancing and storage assignment to reduce the workers’ walking effort. OR Spectr. 2023, 45, 717–758. [Google Scholar] [CrossRef]
- Wang, Z.; Hu, H.; Liu, T. Iterated-local-search-based chaotic differential evolution algorithm for hybrid-load part feeding scheduling optimization in mixed-model assembly lines. Eng. Comput. 2023, 40, 2693–2729. [Google Scholar] [CrossRef]
- Wänström, C.; Medbo, L. The impact of materials feeding design on assembly process performance. J. Manuf. Technol. Manag. 2008, 20, 30–51. [Google Scholar] [CrossRef]
- Battini, D.; Faccio, M.; Persona, A.; Sgarbossa, F. Design of the optimal feeding policy in assembly system. Int. J. Prod. Econ. 2009, 121, 233–254. [Google Scholar] [CrossRef]
- Hua, S.; Johnson, D. Research issues on factors influencing the choice of kitting versus line stocking. Int. J. Prod. Res. 2010, 48, 779–800. [Google Scholar] [CrossRef]
- Hanson, R.; Medbo, L.; Medbo, P. Assembly station design: A quantitative comparison of the effects of kitting and continuous supply. J. Manuf. Technol. Manag. 2012, 23, 315–327. [Google Scholar] [CrossRef]
- Limere, V.; Landeghem, H.V.; Goetshalckx, M.; Aghezzaf, E.; McGinnis, L. Optimising part feeding in the automotive assembly industry: Deciding between kitting and line stocking. Int. J. Prod. Res. 2012, 50, 4046–4060. [Google Scholar] [CrossRef]
- Hanson, R.; Brolin, A. A comparison of kitting and continuous supply in in-plant materials supply. Int. J. Prod. Res. 2013, 51, 979–992. [Google Scholar] [CrossRef]
- Zennaro, I.; Finco, S.; Battini, D.; Calzavara, M. A parts feeding model for big size products: The active and idle assembly islands strategy. Int. J. Adv. Oper. Manag. 2020, 12, 211–236. [Google Scholar] [CrossRef]
- Kang, Z.; Çatal, Ç.; Tekinerdogan, B. Machine learning applications in production lines: A systematic literature review. Comput. Ind. Eng. 2020, 149, 106773. [Google Scholar] [CrossRef]
- Bertolini, M.; Mezzogori, D.; Neroni, M.; Zammori, F. Machine Learning for industrial applications: A comprehensive literature review. Expert Syst. Appl. 2021, 175, 114820. [Google Scholar] [CrossRef]
- Moretti, E.; Tappia, E.; Limère, V.; Melacini, M. Exploring the application of machine learning to the assembly line feeding problem. Oper. Manag. Res. 2021, 14, 403–419. [Google Scholar] [CrossRef]
- Zangaro, F.; Minner, S.; Battini, D. A supervised machine learning approach for the optimisation of the assembly line feeding mode selection. Int. J. Prod. Res. 2021, 59, 4881–4902. [Google Scholar] [CrossRef]
- Faccio, M.; Granata, I.; Maretto, L. Modelling and managing “station-sequence” parts feeding in the I4.0 Era: A simulation approach for ın-plant logistics. Appl. Sci. 2023, 13, 1725. [Google Scholar] [CrossRef]
- Banerjee, S.; Bhowmik, P.S. A machine learning approach based on decision tree algorithm for classification of transient events in microgrid. Electr. Eng. 2023, 105, 2083–2093. [Google Scholar] [CrossRef]
- Kotsiantis, S.B.; Zaharakis, I.; Pintelas, P. Supervised machine learning: A review of classification techniques. Emerg. Artif. Intel. Appl. Comput. Eng. 2007, 160, 3–24. [Google Scholar]
- Ghasemkhani, B.; Balbal, K.F.; Birant, K.U.; Birant, D. A novel classification method: Neighborhood-based positive unlabeled learning using decision tree (NPULUD). Entropy 2024, 26, 403. [Google Scholar] [CrossRef]
- Aziz, U.; Bradshaw, A.; Lim, J. Classification of defects in additively manufactured nickel alloys using supervised machine learning. Mat. Sci. Technol. 2023, 39, 2464–2468. [Google Scholar] [CrossRef]
- Sen, P.C.; Hajra, M.; Ghosh, M. Supervised classification algorithms in machine learning: A survey and review. In Emerging Technology in Modelling and Graphics; Mandal, J., Bhattacharya, D., Eds.; Advances in Intelligent Systems and Computing; Springer: Singapore, 2020; Volume 937, pp. 99–111. [Google Scholar] [CrossRef]
- Ho, T.K. The random subspace method for constructing decision forests. IEEE Trans. Pattern Anal. Mach. Intell. 1998, 20, 832–844. [Google Scholar] [CrossRef]
- Breiman, L. Random forests. Mach. Learn. 2001, 45, 5–32. [Google Scholar] [CrossRef]
- Ong, A.K.S.; Cordova, L.N.Z.; Longanilla, F.A.B.; Caprecho, N.L.; Javier, R.A.V.; Borres, R.D.; German, J.D. Purchasing ıntentions analysis of hybrid cars using random forest classifier and deep learning. World Electr. Veh. J. 2023, 14, 227. [Google Scholar] [CrossRef]
- Jiang, M.; Wang, J.; Hu, L.; He, Z. Random forest clustering for discrete sequences. Pattern Recognit. Lett. 2023, 174, 145–151. [Google Scholar] [CrossRef]
- Sun, M.; Qian, L.; Mukherjee, A.; Xiang, D. An EWMA chart for high dimensional process with multi-class out-of-control information via random forest learning. Qual. Technol. Quant. Manag. 2024, 21, 722–748. [Google Scholar] [CrossRef]
- Zhai, X.; Xu, R.; Wang, Z.; Zheng, Z.; Shou, Y.; Tian, S.; Tian, L.; Hu, X.; Chen, L.; Xu, N. Classification of arctic sea ice type in CFOSAT scatterometer measurements using a random forest classifier. Remote Sens. 2023, 15, 1310. [Google Scholar] [CrossRef]
- Talbot, N.L.C.; Cawley, G.C. The evidence framework applied to sparse kernel logistic regression. Neurocomputing 2005, 64, 119–135. [Google Scholar] [CrossRef]
- Khandezamin, Z.; Naderan, M.; Rashti, M.J. Detection and classification of breast cancer using logistic regression feature selection and GMDH classifier. J. Biomed. Inf. 2002, 111, 103591. [Google Scholar] [CrossRef]
- Wichitaksorn, N.; Kang, Y.; Zhang, F. Random feature selection using random subspace logistic regression. Expert Syst. Appl. 2023, 217, 119535. [Google Scholar] [CrossRef]
- Nusinovici, S.; Tham, Y.C.; Yan, M.Y.C.; Ting, D.S.W.; Li, J.; Sabanayagam, C.; Wong, T.Y.; Cheng, C.-Y. Logistic regression was as good as machine learning for predicting major chronic diseases. J. Clin. Epidemiol. 2020, 122, 56–69. [Google Scholar] [CrossRef]
- Rymarczyk, T.; Kozłowski, E.; Kłosowski, G.; Niderla, K. Logistic Regression for Machine Learning in Process Tomography. Sensors 2019, 19, 3400. [Google Scholar] [CrossRef]
- Luna-Benoso, B.; Martinez-Perales, J.C.; Morales-Rodriguez, U.S.; Flores-Carapia, R.; Silva-Garcia, V.M. A new classification model using a decision tree generated from hyperplanes in dimensional space. Appl. Artif. Intell. 2024, 38, 2426377. [Google Scholar] [CrossRef]
- Gopi, A.P.; Jyothi, R.N.S.; Narayana, V.L.; Sandeep, K.S. Classification of tweets data based on polarity using improved RBF kernel of SVM. Int. J. Inf. Tecnol. 2023, 15, 965–980. [Google Scholar] [CrossRef]
- Azam, Z.; Islam, M.M.; Huda, M.N. Comparative analysis of ıntrusion detection systems and machine learning-based model analysis through decision tree. IEEE Access 2023, 11, 80348–80391. [Google Scholar] [CrossRef]
- Wang, Y.; Pan, Z.; Dong, J. A new two-layer nearest neighbor selection method for kNN classifier. Knowl.-Based Syst. 2022, 235, 107604. [Google Scholar] [CrossRef]
- Xia, Y. Chapter eleven: Correlation and association analyses in microbiome study integrating multiomics in health and disease. In Progress Molecular Biology and Translational Science; Sun, J., Ed.; Academic Press: Cambridge, MA, USA, 2020; Volume 171, pp. 309–491. [Google Scholar] [CrossRef]
- Arlot, S.; Celisse, A.A. Survey of cross-validation procedures for model selection. Stat. Surv. 2010, 4, 40–79. [Google Scholar] [CrossRef]
- Marcineková, K.; Janáková Sujová, A. Multi-objective optimization of manufacturing process using artificial neural networks. Systems 2024, 12, 569. [Google Scholar] [CrossRef]
- Bourdeau, M.; Zhai, X.-Q.; Nefzaoui, E.; Guo, X.; Chatellier, P. Modeling and forecasting building energy consumption: A review of data-driven techniques. Sustain. Cities Soc. 2019, 48, 101533. [Google Scholar] [CrossRef]
- Maghraoui, A.E.; Hammouc, F.E.; Ledmaoui, Y.; Chebak, A. Smart energy management system: A comparative study of energy consumption prediction algorithms for a hotel building. In Proceedings of the 4th Global Power, Energy and Communication Conference (GPECOM), Cappadocia, Turkey, 4 June 2022; pp. 529–534. [Google Scholar] [CrossRef]
- Nair, V.; Hinton, G.E. Rectified linear units improve restricted boltzmann machines. In Proceedings of the 27th International Conference on International Conference on Machine Learning (ICML’10), Omnipress, Madison, WI, USA, 21–24 June 2010; pp. 807–814. [Google Scholar]
- Han, J.; Wang, Z.; Shen, J.; Tang, H. Symmetric-threshold ReLU for fast and nearly lossless ANN-SNN conversion. Mach. Intell. Res. 2023, 20, 435–446. [Google Scholar] [CrossRef]
- Saleem, S.; Asim, M.N.; Van Elst, L.; Junker, M.; Dengel, A. MLR-Predictor: A versatile and efficient computational framework for multi-label requirements classification. Front. Artif. Intell. 2024, 7, 1481581. [Google Scholar] [CrossRef]
- Ghasemkhani, B.; Balbal, K.F.; Birant, D. A new predictive method for classification tasks in machine learning: Multi-class multi-label logistic model tree (MMLMT). Mathematics 2024, 12, 2825. [Google Scholar] [CrossRef]
- Shapley, L.S. A Value for n-Person Games. In Contributions to the Theory of Games, Volume II; Kuhn, H.K., Tucker, A.W., Eds.; Princeton University Press: Princeton, NJ, USA, 1953; pp. 307–318. [Google Scholar] [CrossRef]
- Smith, M.; Alvarez, F. Identifying mortality factors from machine learning using Shapley values—A case of COVID19. Expert Syst. Appl. 2021, 176, 114832. [Google Scholar] [CrossRef]
- Rodríguez-Pérez, R.; Bajorath, J. Interpretation of machine learning models using shapley values: Application to compound potency and multi-target activity predictions. J. Comput. Aided Mol. Des. 2020, 34, 1013–1026. [Google Scholar] [CrossRef]
- Zhang, S.; Chen, X.; Ran, X.; Li, Z.; Cao, W. Prioritizing causation in decision trees: A framework for interpretable modeling. Eng. Appl. Artif. Intel. 2024, 133, 108224. [Google Scholar] [CrossRef]
- Akinola, O.O.; Ezugwu, A.E.; Agushaka, J.O.; Abu Zitar, R.; Abualigah, L. Multiclass feature selection with metaheuristic optimization algorithms: A review. Neural Comput. Appl. 2022, 34, 19751–19790. [Google Scholar] [CrossRef]
- Mienye, D.; Sun, Y. A survey of ensemble learning: Concepts, algorithms, applications, and prospects. IEEE Access 2022, 10, 99129–99149. [Google Scholar] [CrossRef]
- Del-Pozo-Bueno, D.; Kepaptsoglou, D.; Peiró, F.; Estradé, S. Comparative of machine learning classification strategies for electron energy loss spectroscopy: Support vector machines and artificial neural networks. Ultramicroscopy 2023, 253, 113828. [Google Scholar] [CrossRef]
- Wedagedara, H.; Witharana, C.; Fahey, R.; Cerrai, D.; Parent, J.; Perera, A.S. Non-parametric machine learning modeling of tree-caused power outage risk to overhead distribution powerlines. Appl. Sci. 2024, 14, 4991. [Google Scholar] [CrossRef]
- Peng, H.; Long, F.; Ding, C. Feature selection based on mutual information criteria of max-dependency, max-relevance, and min-redundancy. IEEE Trans. Pattern Anal. Mach. Int. 2005, 27, 1226–1238. [Google Scholar] [CrossRef]
- Jo, I.; Lee, S.; Oh, S. Improved Measures of Redundancy and Relevance for mRMR Feature Selection. Computers 2019, 8, 42. [Google Scholar] [CrossRef]
- Hermo, J.; Bolón-Canedo, V.; Ladra, S. Fed-mRMR: A lossless federated feature selection method. Inf. Sci. 2024, 669. [Google Scholar] [CrossRef]
- Mahapatra, M.; Majhi, S.K.; Dhal, S.K. MRMR-SSA: A hybrid approach for optimal feature selection. Evol. Int. 2022, 15, 2017–2036. [Google Scholar] [CrossRef]
- Allgaier, J.; Pryss, R. Cross-Validation visualized: A narrative guide to advanced methods. Mach. Learn. Knowl. Extr. 2024, 6, 1378–1388. [Google Scholar] [CrossRef]
- Kazemi, F.; Asgarkhani, N.; Jankowski, R. Optimization-based stacked machine-learning method for seismic probability and risk assessment of reinforced concrete shear walls. Expert Syst. Appl. 2024, 255, 124897. [Google Scholar] [CrossRef]
- Abdumalikov, S.; Kim, J.; Yoon, Y. Performance analysis and improvement of machine learning with various feature selection methods for EEG-based emotion classification. Appl. Sci. 2024, 14, 10511. [Google Scholar] [CrossRef]
Disclaimer/Publisher’s Note: The statements, opinions and data contained in all publications are solely those of the individual author(s) and contributor(s) and not of MDPI and/or the editor(s). MDPI and/or the editor(s) disclaim responsibility for any injury to people or property resulting from any ideas, methods, instructions or products referred to in the content. |
© 2025 by the authors. Licensee MDPI, Basel, Switzerland. This article is an open access article distributed under the terms and conditions of the Creative Commons Attribution (CC BY) license (https://creativecommons.org/licenses/by/4.0/).