

Machine Learning Models for Predicting Mortality in Hemodialysis Patients: A Systematic Review

 , , , ,
  , ,
, ,
Abstract
1. Introduction
2. Materials and Methods
2.1. Study Design and Protocol Registration
2.2. Literature Review
2.3. Eligibility Requirements and Study Selection
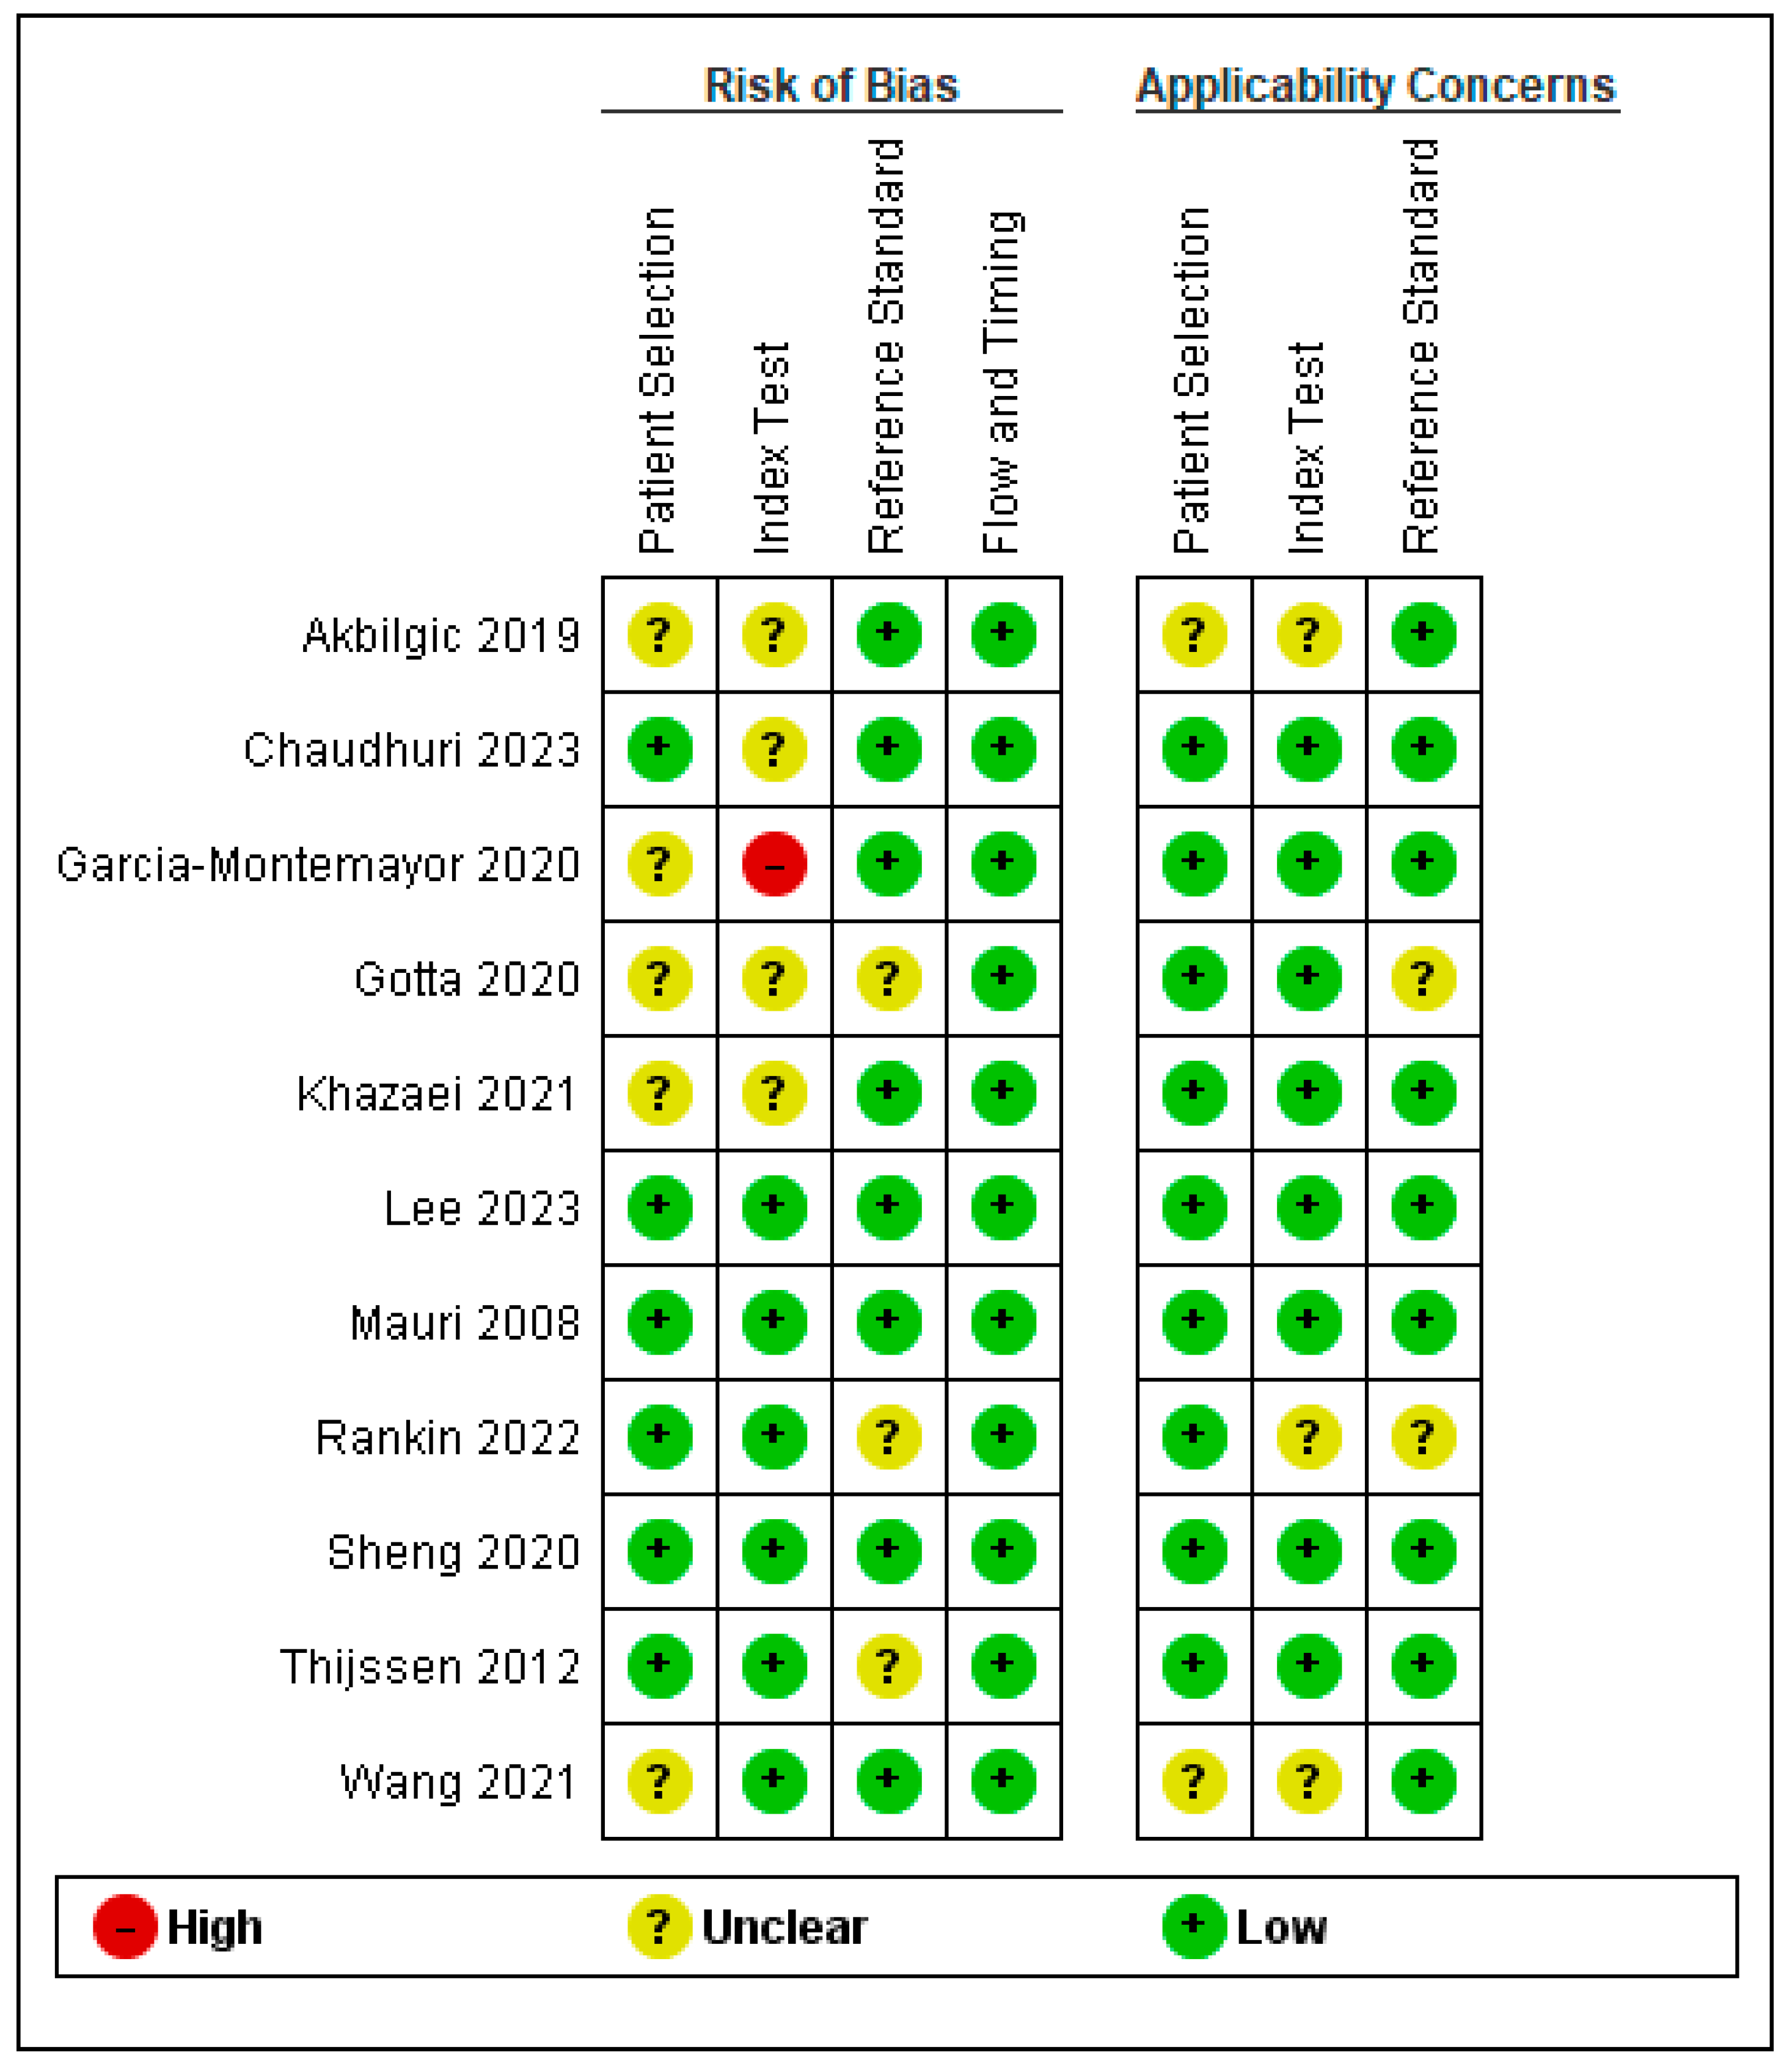
2.4. Assessment of Study Quality
2.5. Data Extraction
2.6. Statistical Analysis
2.7. Outcomes Measures
3. Results
3.1. Study Selection
3.2. Baseline Characteristics of the Included Patients
3.3. Quality Assessment Results
3.4. Outcomes Measure Results
Performance Characteristics of ML Models
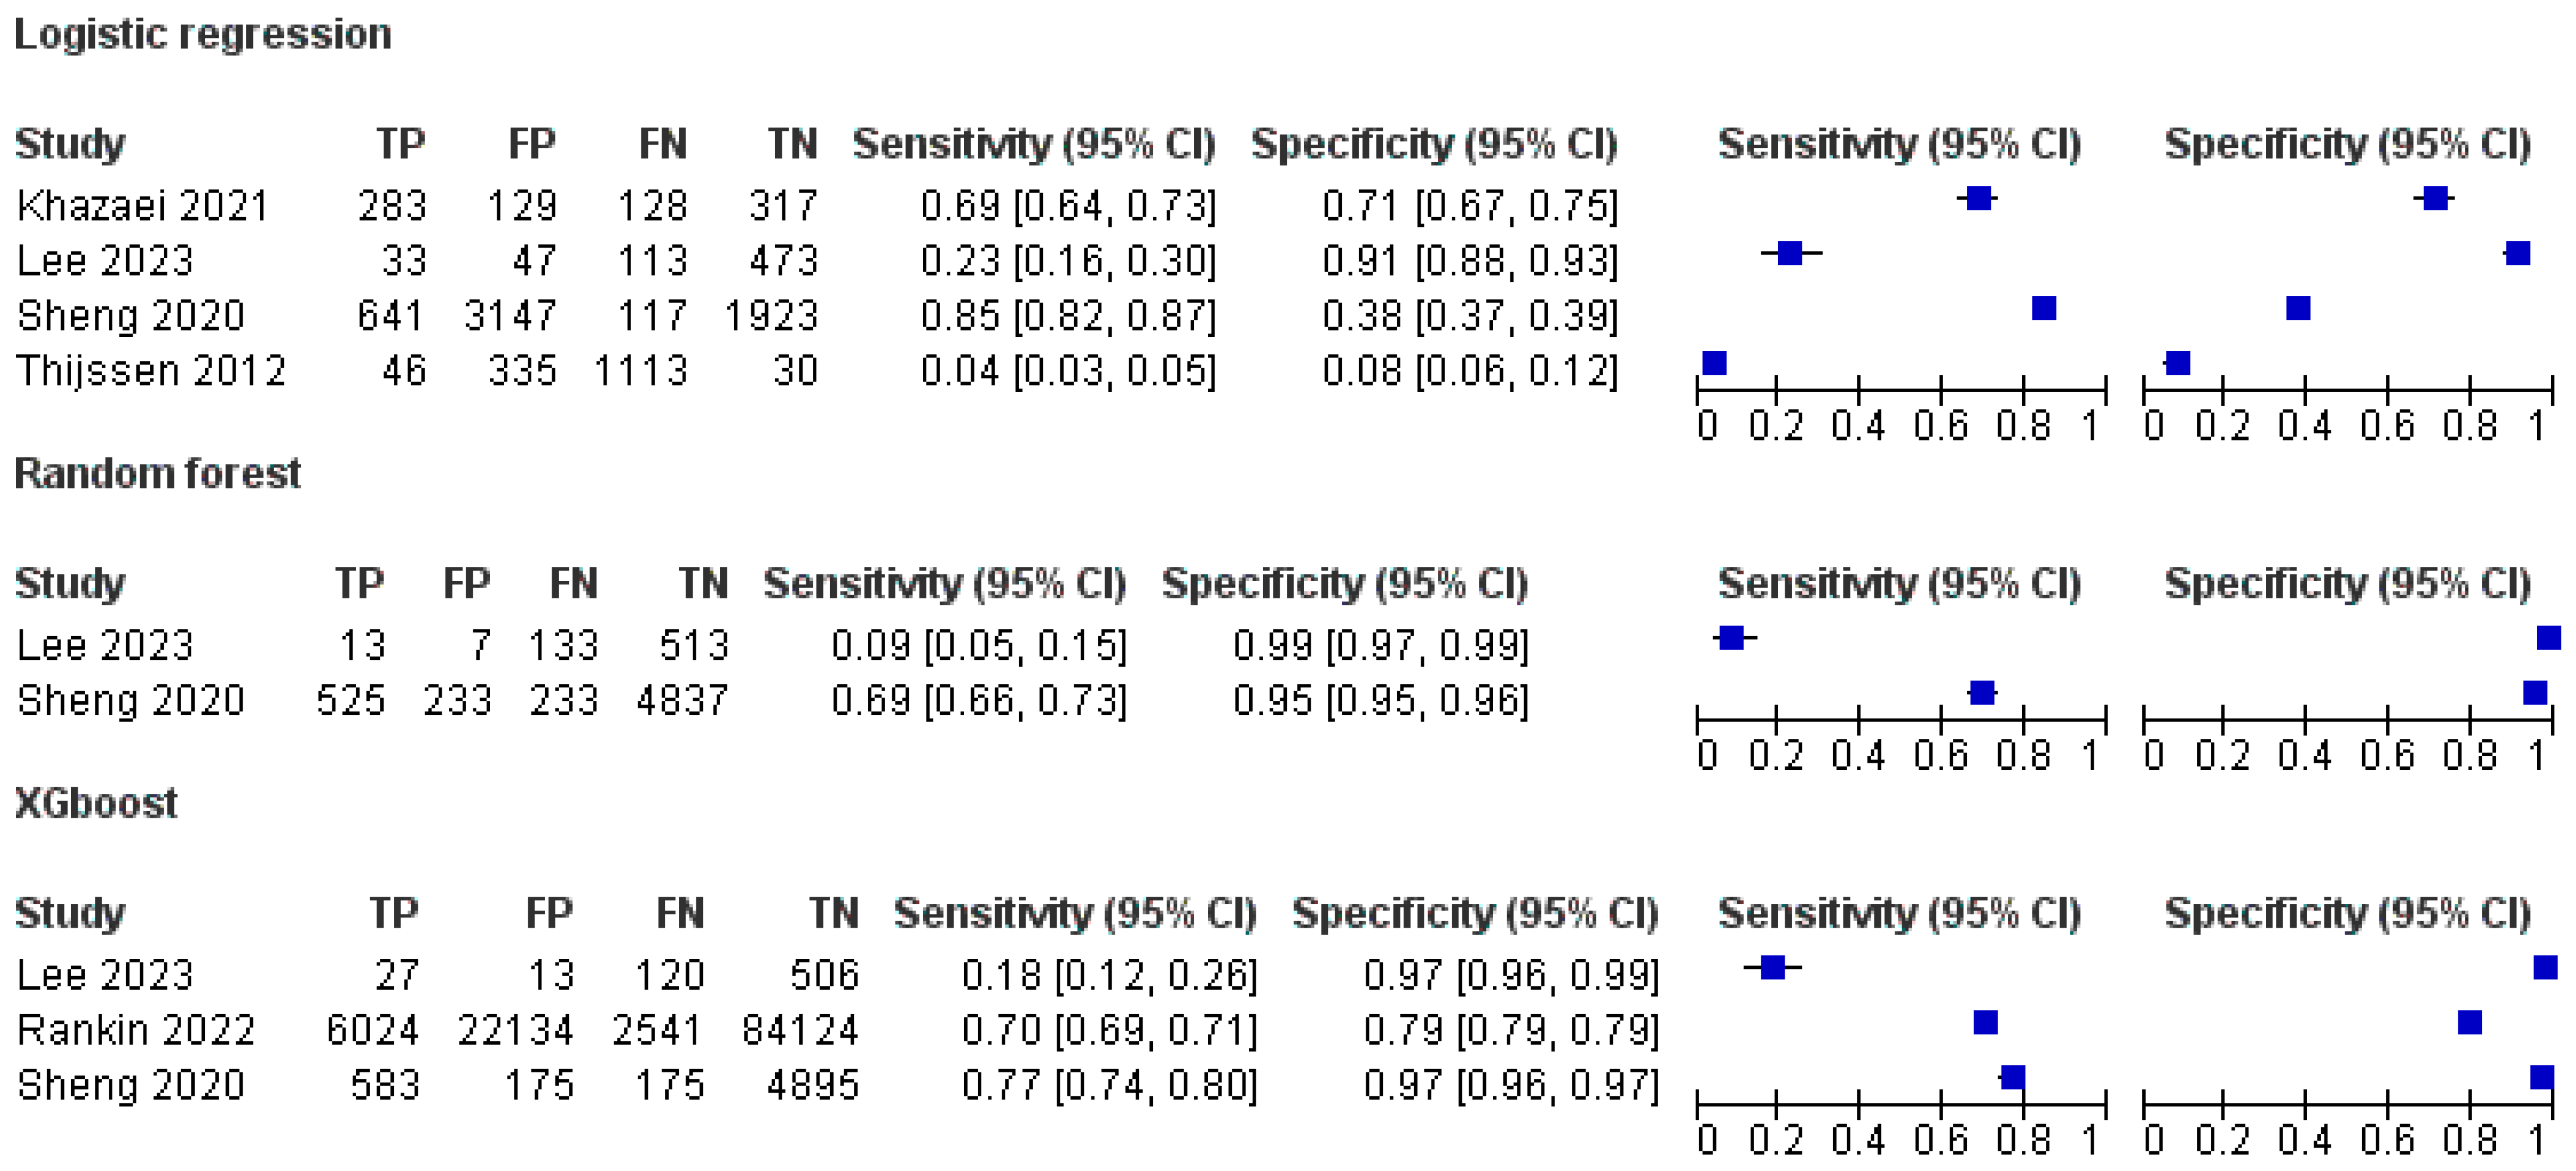
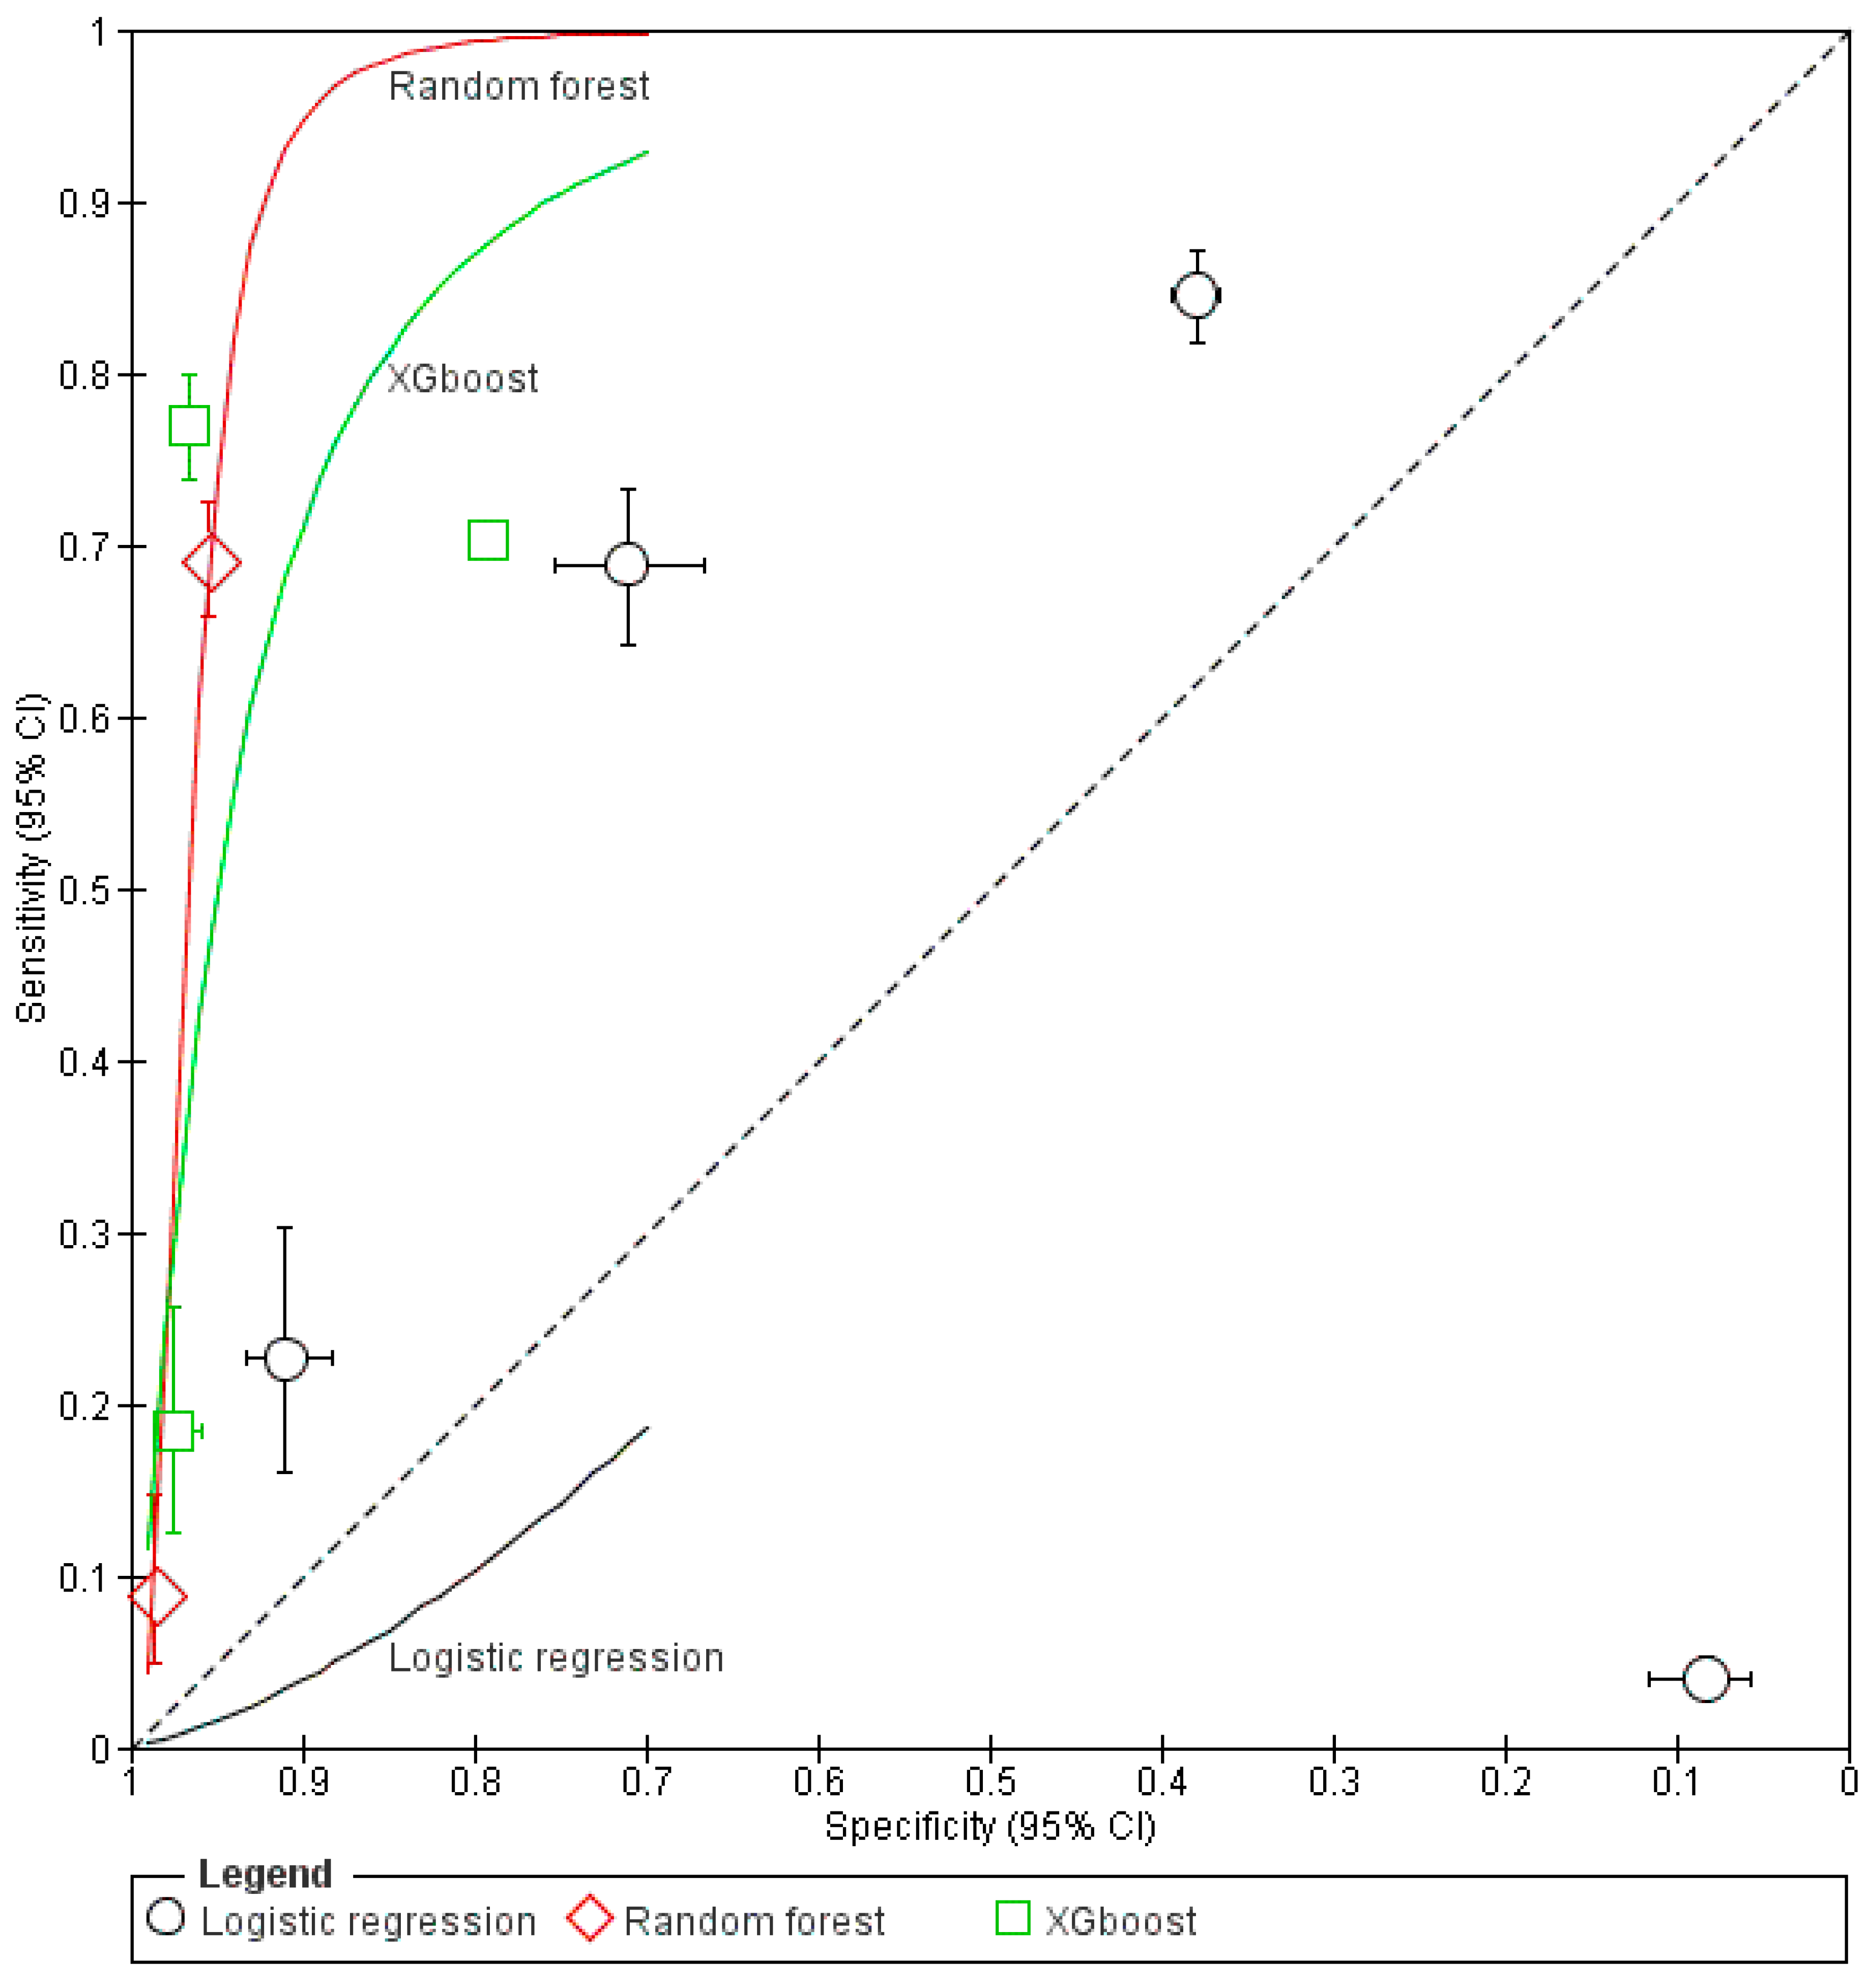
3.5. Sensitivity and Specificity of ML Models
3.6. Predictive Performance of the Models Based on Area Under the Curve (AUC)
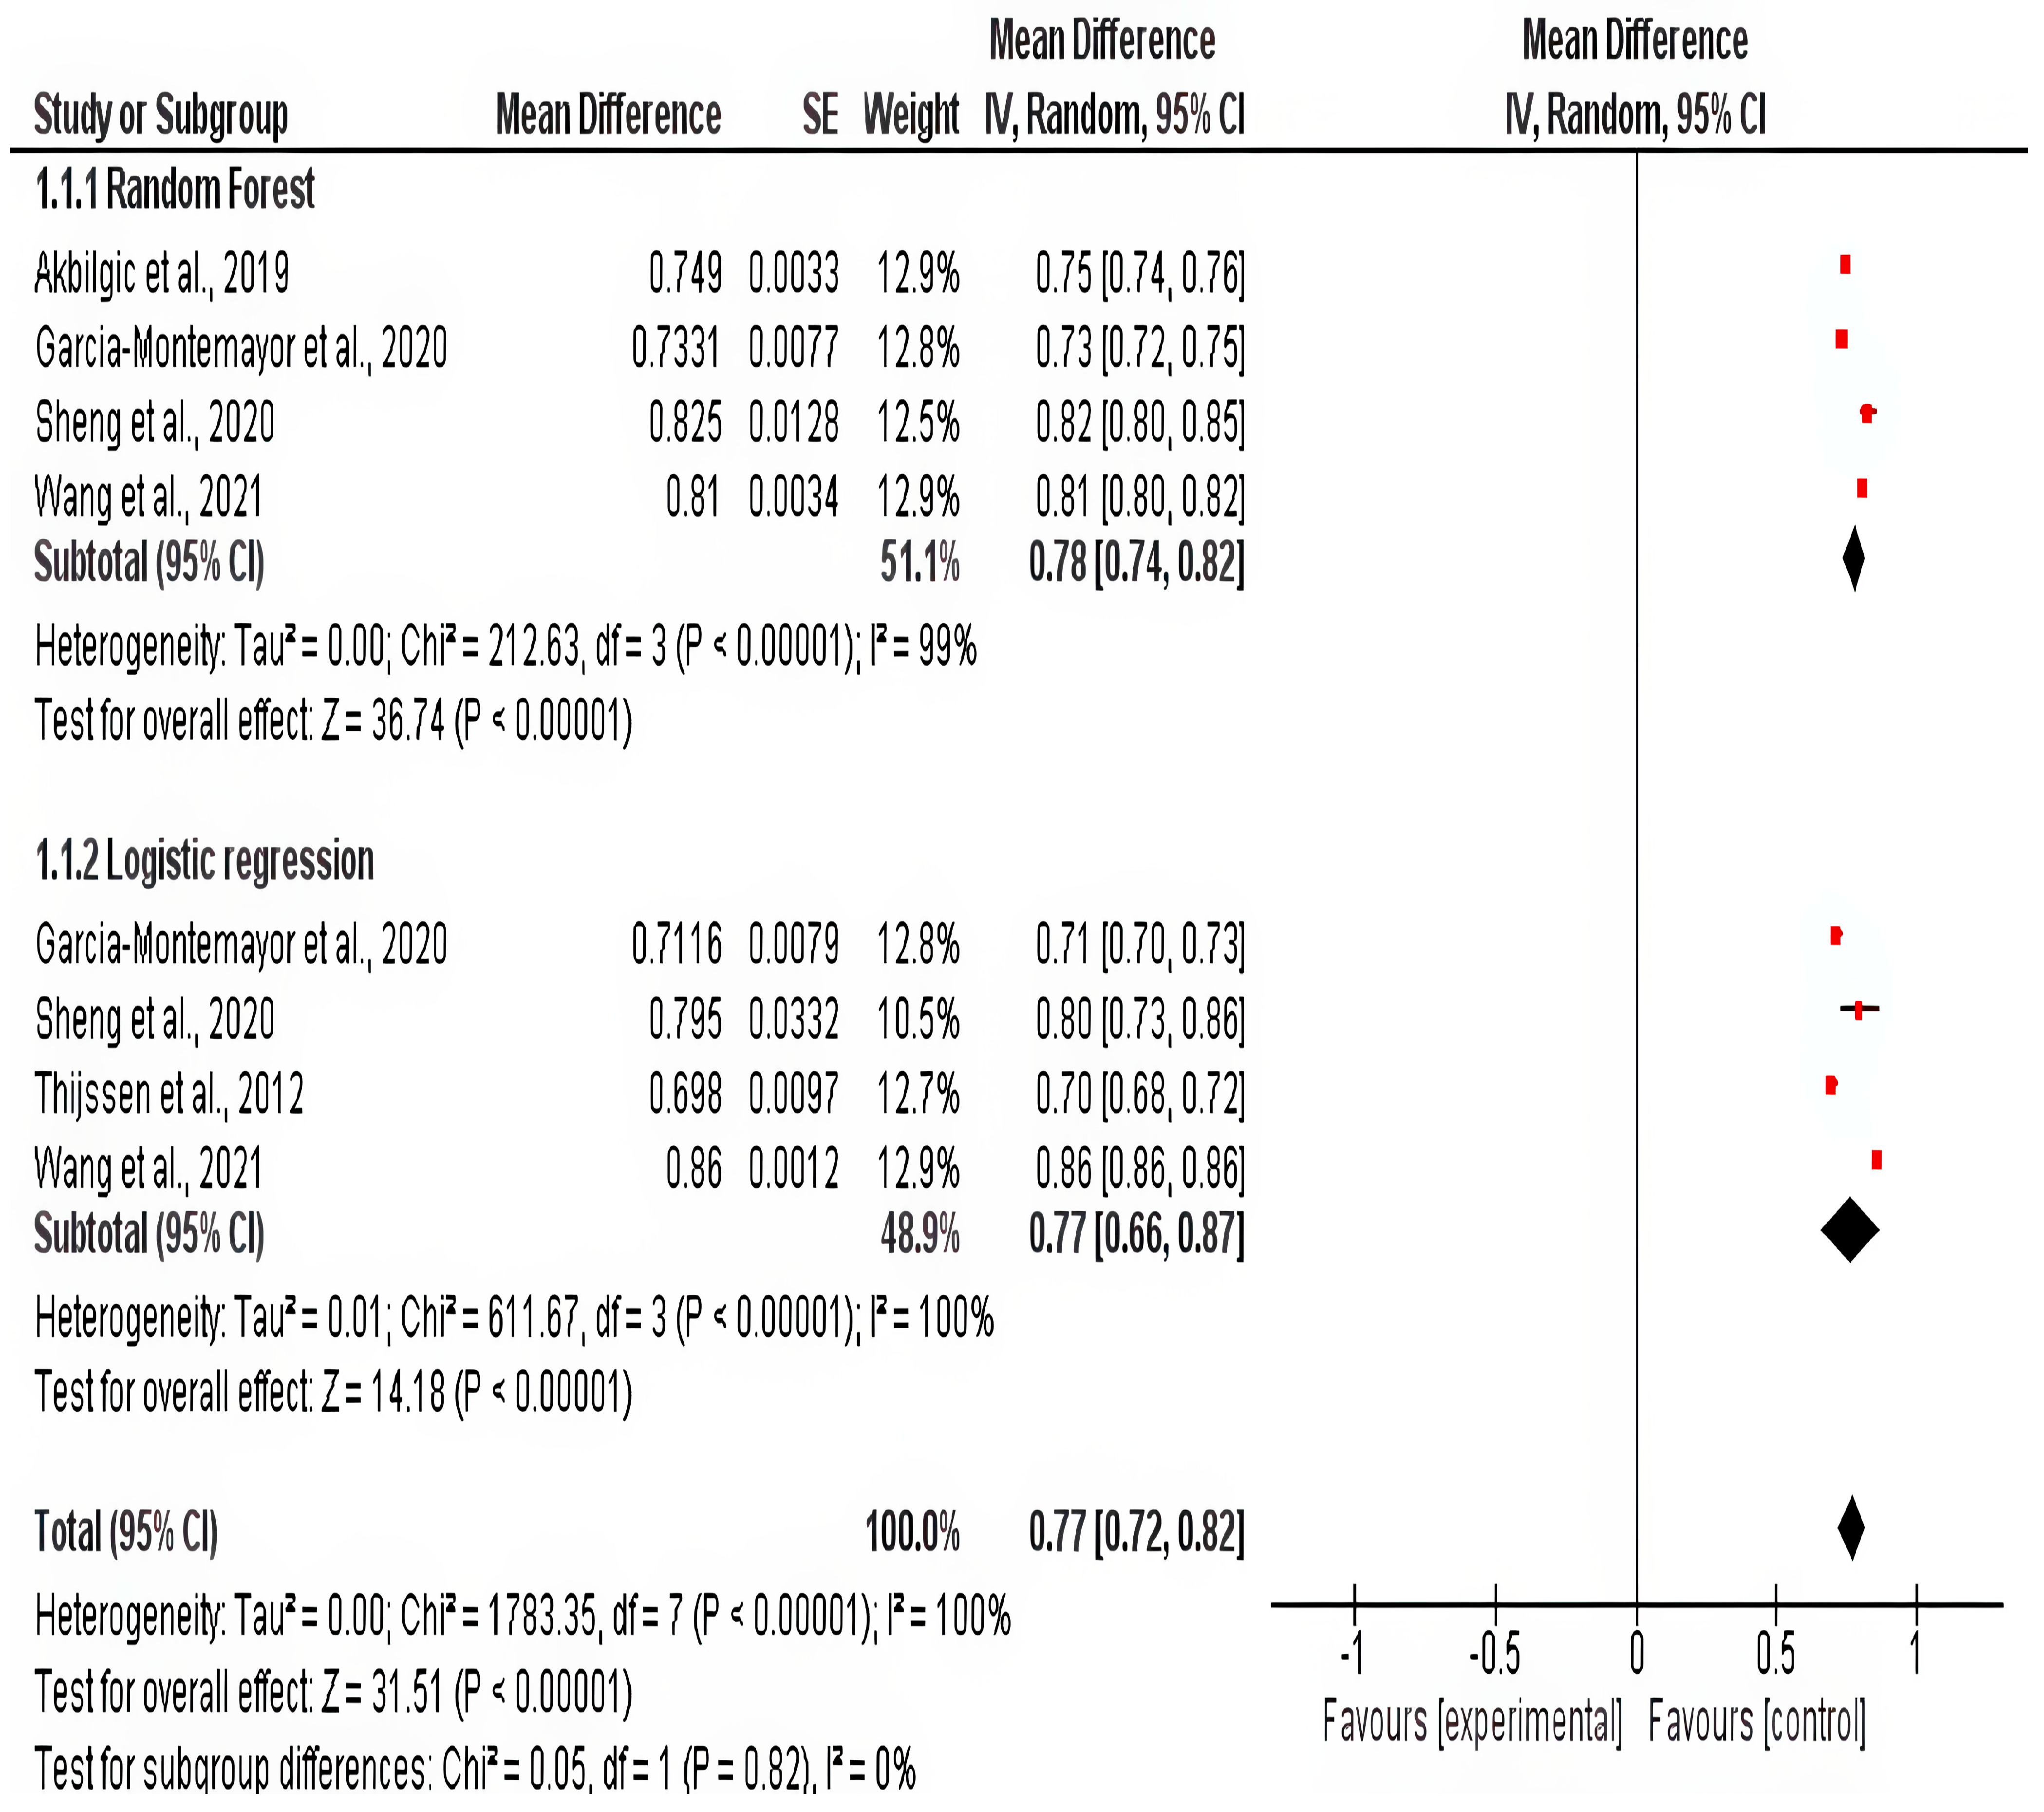
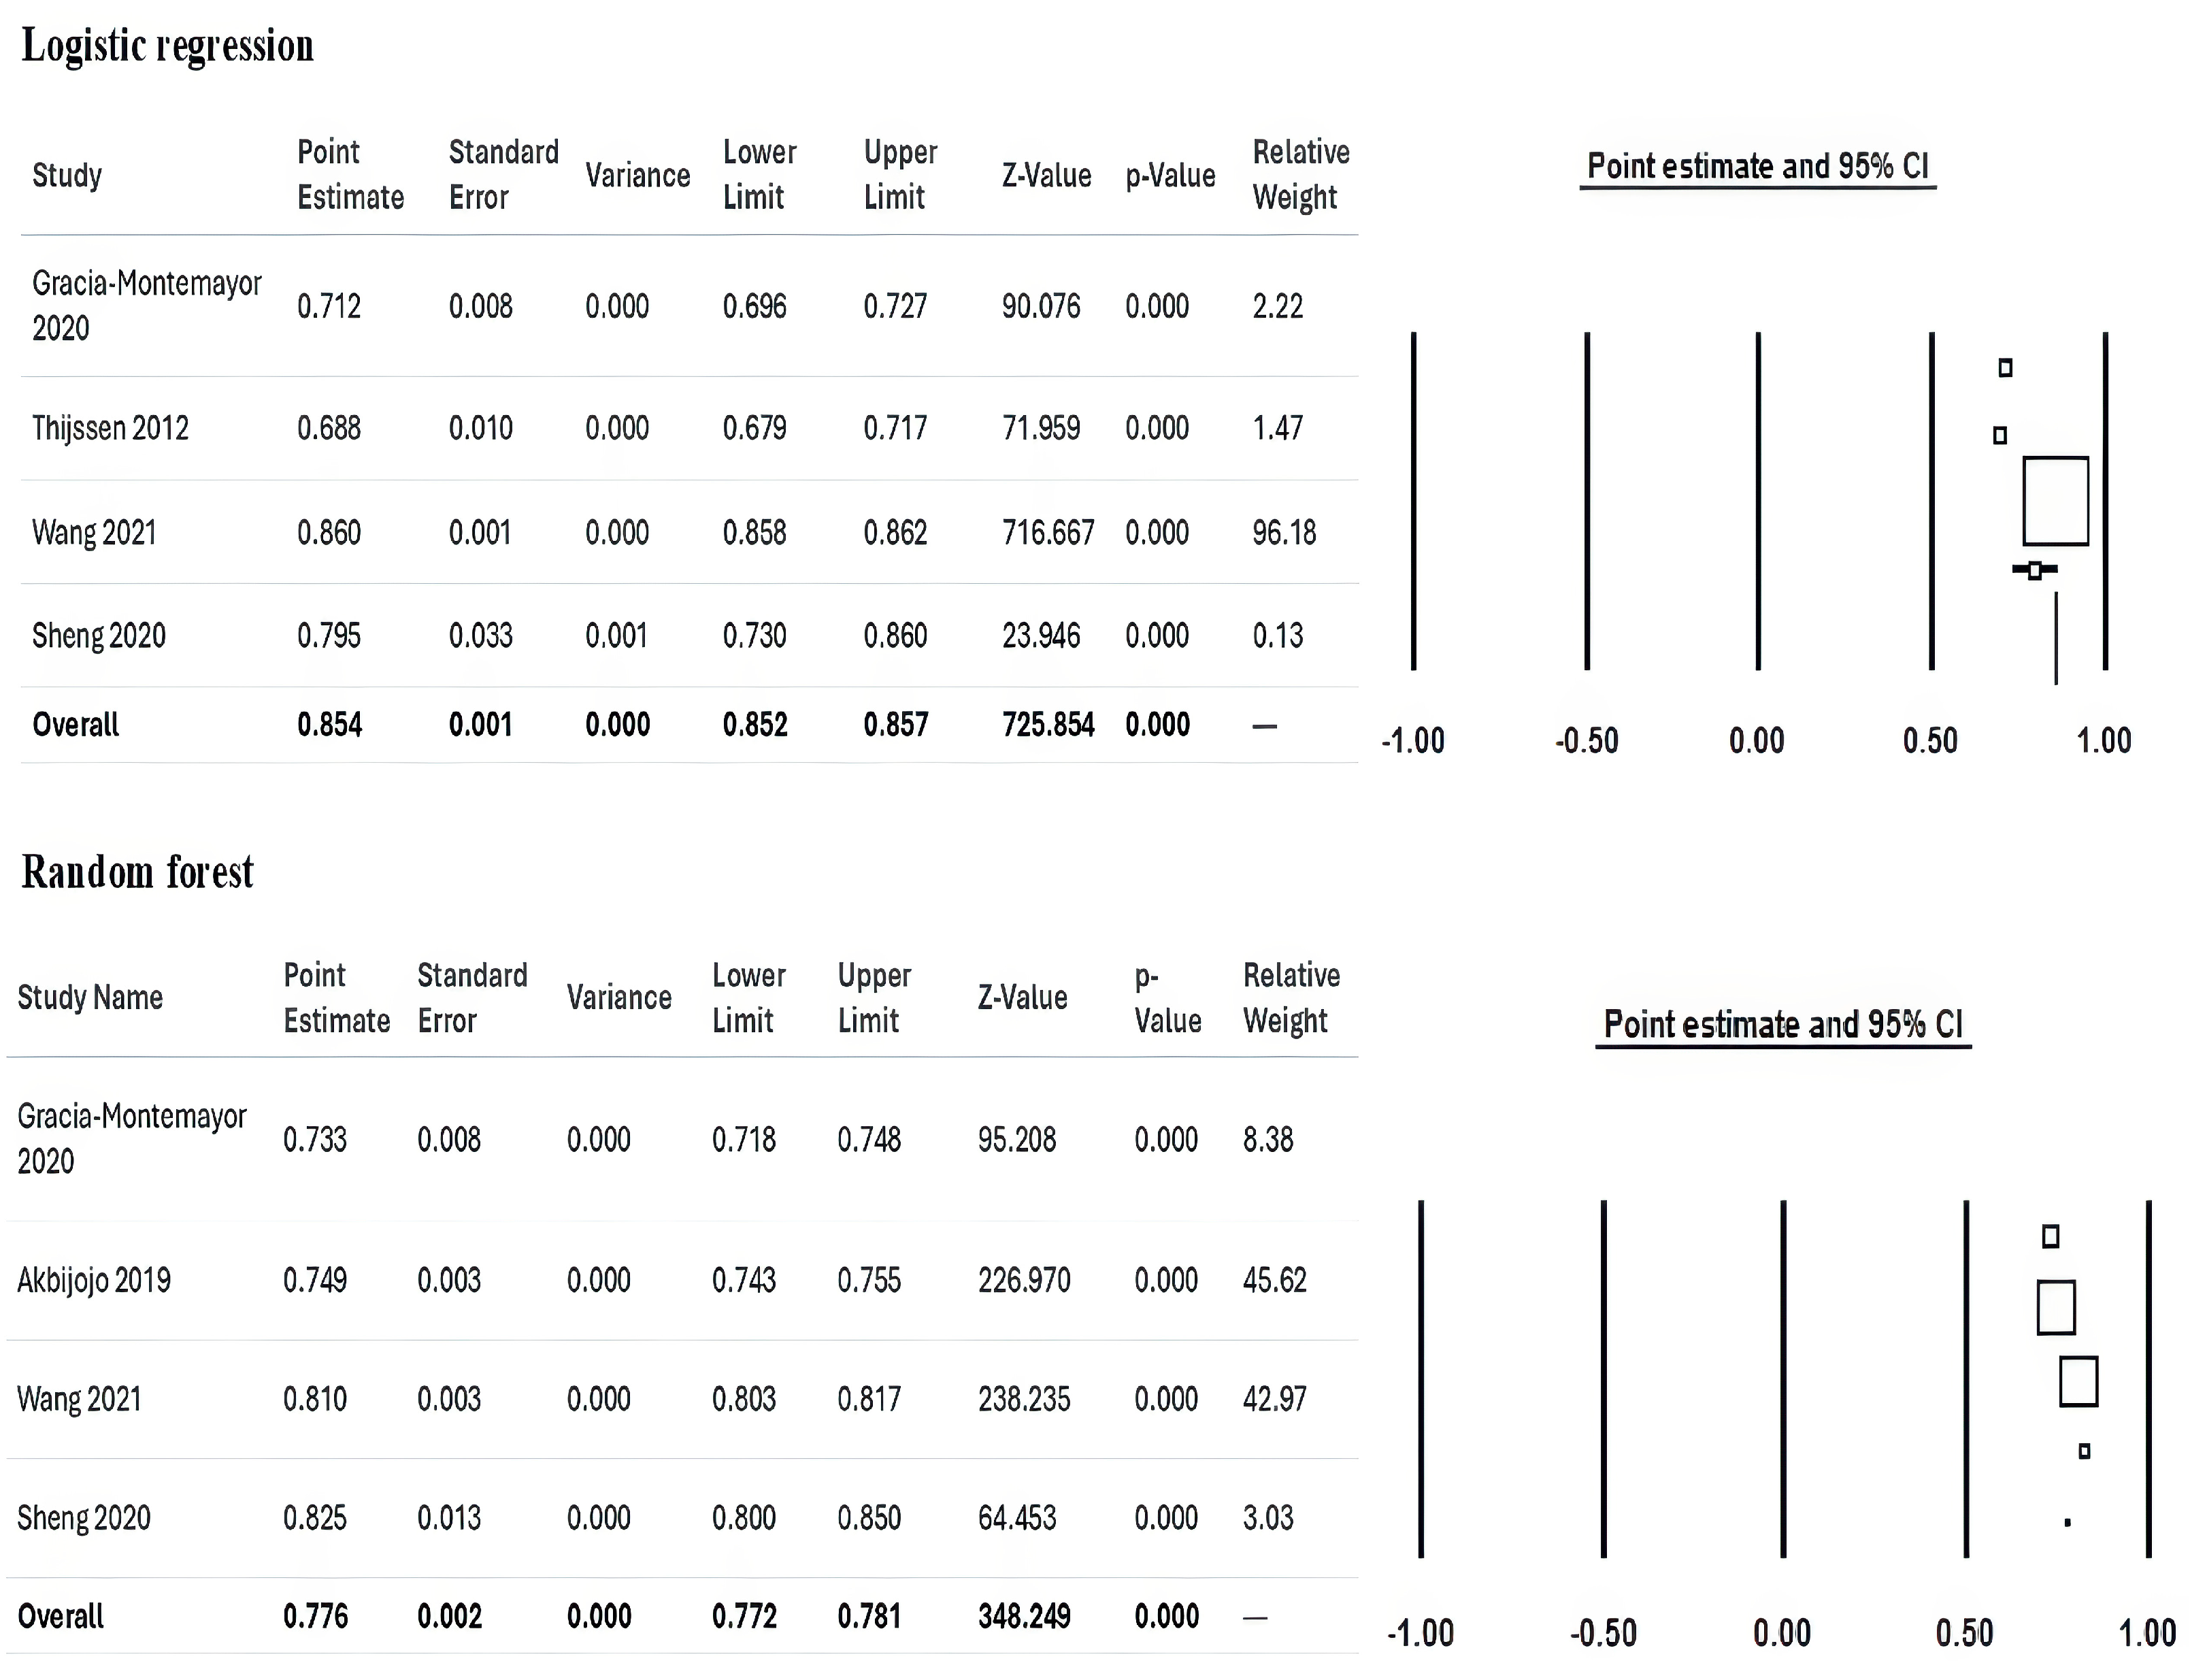
3.7. Meta-Analysis
Clinical Significance of the Present Study
4. Discussion
5. Limitations
6. Conclusions
Author Contributions
Funding
Institutional Review Board Statement
Informed Consent Statement
Data Availability Statement
Conflicts of Interest
References
- Himmelfarb, J.; Vanholder, R.; Mehrotra, R.; Tonelli, M. The current and future landscape of dialysis. Nat. Rev. Nephrol. 2020, 16, 573–585. [Google Scholar] [CrossRef]
- Yang, Q.Z.C. Timing of dialysis initiation and end-stage kidney disease incidence. JAMA Intern. Med. 2021, 181, 724–725. [Google Scholar] [CrossRef] [PubMed]
- Venuta, F.; Rendina, E.A. Combined pulmonary artery and bronchial sleeve resection. Oper. Tech. Thorac. Cardiovasc. Surg. 2008, 13, 260–273. [Google Scholar] [CrossRef]
- Lai, A.C.; Bienstock, S.W.; Sharma, R.; Skorecki, K.; Beerkens, F.; Samtani, R.; Coyle, A.; Kim, T.; Baber, U.; Camaj, A.; et al. A Personalized Approach to Chronic Kidney Disease and Cardiovascular Disease: JACC Review Topic of the Week. J. Am. Coll. Cardiol. 2021, 77, 1470–1479. [Google Scholar] [CrossRef]
- Karaboyas, A.; Morgenstern, H.; Waechter, S.; Fleischer, N.L.; Vanholder, R.; Jacobson, S.H.; Sood, M.M.; Schaubel, D.E.; Inaba, M.; Pisoni, R.L.; et al. Low hemoglobin at hemodialysis initiation: An international study of anemia management and mortality in the early dialysis period. Clin. Kidney J. 2019, 13, 425–433. [Google Scholar] [CrossRef] [PubMed]
- Karaboyas, A.; Morgenstern, H.; Li, Y.; Bieber, B.A.; Hakim, R.; Hasegawa, T.; Jadoul, M.; Schaeffner, E.; Vanholder, R.; Pisoni, R.L.; et al. Estimating the Fraction of First-Year Hemodialysis Deaths Attributable to Potentially Modifiable Risk Factors: Results from the DOPPS. Clin. Epidemiol. 2020, 12, 51. [Google Scholar] [CrossRef]
- Saleh, T.; Sumida, K.; Molnar, M.Z.; Potukuchi, P.K.; Thomas, F.; Lu, J.L.; Gyamlani, G.G.; Streja, E.; Kalantar-Zadeh, K.; Kovesdy, C.P. Effect of Age on the Association of Vascular Access Type with Mortality in a Cohort of Incident End-Stage Renal Disease Patients. Nephron 2017, 137, 57–63. [Google Scholar] [CrossRef]
- Wick, J.P.; Turin, T.C.; Faris, P.D.; MacRae, J.M.; Weaver, R.G.; Tonelli, M.; Manns, B.J.; Hemmelgarn, B.R. A Clinical Risk Prediction Tool for 6-Month Mortality After Dialysis Initiation Among Older Adults. Am. J. Kidney Dis. 2017, 69, 568–575. [Google Scholar] [CrossRef] [PubMed]
- Jassal, S.V.; Karaboyas, A.; Comment, L.A.; Bieber, B.A.; Morgenstern, H.; Sen, A.; Gillespie, B.W.; De Sequera, P.; Marshall, M.R.; Fukuhara, S.; et al. Functional Dependence and Mortality in the International Dialysis Outcomes and Practice Patterns Study (DOPPS). Am. J. Kidney Dis. 2016, 67, 283–292. [Google Scholar] [CrossRef]
- Garcia-Montemayor, V.; Martin-Malo, A.; Barbieri, C.; Bellocchio, F.; Soriano, S.; de Mier, V.P.R.; Molina, I.R.; Aljama, P.; Rodriguez, M. Predicting mortality in hemodialysis patients using machine learning analysis. Clin. Kidney J. 2021, 14, 1388. [Google Scholar] [CrossRef]
- Kasza, J.; Wolfe, R.; McDonald, S.P.; Marshall, M.R.; Polkinghorne, K.R. Dialysis modality, vascular access and mortality in end-stage kidney disease: A bi-national registry-based cohort study. Nephrology 2016, 21, 878–886. [Google Scholar] [CrossRef] [PubMed]
- Chen, Y.M.; Wang, Y.C.; Hwang, S.J.; Lin, S.H.; Wu, K.D. Patterns of Dialysis Initiation Affect Outcomes of Incident Hemodialysis Patients. Nephron 2015, 132, 33–42. [Google Scholar] [CrossRef] [PubMed]
- Bradbury, B.D.; Fissell, R.B.; Albert, J.M.; Anthony, M.S.; Critchlow, C.W.; Pisoni, R.L.; Port, F.K.; Gillespie, B.W. Predictors of Early Mortality among Incident US Hemodialysis Patients in the Dialysis Outcomes and Practice Patterns Study (DOPPS). Clin. J. Am. Soc. Nephrol. 2007, 2, 89–99. [Google Scholar] [CrossRef]
- Canaud, B.; Tong, L.; Tentori, F.; Akiba, T.; Karaboyas, A.; Gillespie, B.; Akizawa, T.; Pisoni, R.L.; Bommer, J.; Port, F.K. Clinical practices and outcomes in elderly hemodialysis patients: Results from the Dialysis Outcomes and Practice Patterns Study (DOPPS). Clin. J. Am. Soc. Nephrol. 2011, 6, 1651–1662. [Google Scholar] [CrossRef] [PubMed]
- Foley, R.N.; Parfrey, P.S.; Hefferton, D.; Singh, I.; Simms, A.; Barrett, B.J. Advance Prediction of Early Death in Patients Starting Maintenance Dialysis. Am. J. Kidney Dis. 1994, 23, 836–845. [Google Scholar] [CrossRef]
- Wagner, M.; Ansell, D.; Kent, D.M.; Griffith, J.L.; Naimark, D.; Wanner, C.; Tangri, N. Predicting mortality in incident dialysis patients: An analysis of the United Kingdom Renal Registry. Am. J. Kidney Dis. 2011, 57, 894–902. [Google Scholar] [CrossRef]
- Chen, J.Y.; Tsai, S.H.; Chuang, P.H.; Chang, C.H.; Chuang, C.L.; Chen, H.L.; Chen, P.L. A comorbidity index for mortality prediction in Chinese patients with ESRD receiving hemodialysis. Clin. J. Am. Soc. Nephrol. 2014, 9, 513–519. [Google Scholar] [CrossRef]
- Couchoud, C.G.; Beuscart, J.B.R.; Aldigier, J.C.; Brunet, P.J.; Moranne, O.P. Development of a risk stratification algorithm to improve patient-centered care and decision making for incident elderly patients with end-stage renal disease. Kidney Int. 2015, 88, 1178–1186. [Google Scholar] [CrossRef]
- Couchoud, C.; Labeeuw, M.; Moranne, O.; Allot, V.; Esnault, V.; Frimat, L.; Stengel, B.; French Renal Epidemiology and Information Network (REIN) registry. A clinical score to predict 6-month prognosis in elderly patients starting dialysis for end-stage renal disease. Nephrol. Dial. Transplant. 2009, 24, 1553–1561. [Google Scholar] [CrossRef]
- Hsu, J.Y.; Roy, J.A.; Xie, D.; Yang, W.; Shou, H.; Anderson, A.H.; Landis, J.R.; Jepson, C.; Wolf, M.; Isakova, T.; et al. Statistical Methods for Cohort Studies of CKD: Survival Analysis in the Setting of Competing Risks. Clin. J. Am. Soc. Nephrol. 2017, 12, 1181–1189. [Google Scholar] [CrossRef]
- Lancet, T. Artificial intelligence in health care: Within touching distance. Lancet 2017, 390, 2739. [Google Scholar] [CrossRef]
- Genuer, R.; Poggi, J.M.; Tuleau-Malot, C. Variable selection using random forests. Pattern Recognit. Lett. 2010, 31, 2225–2236. [Google Scholar] [CrossRef]
- Matsuki, K.; Kuperman, V.; Van Dyke, J.A. The Random Forests statistical technique: An examination of its value for the study of reading. Sci. Stud. Read. 2016, 20, 20–33. [Google Scholar] [CrossRef]
- Dankowski, T.; Ziegler, A. Calibrating random forests for probability estimation. Stat. Med. 2016, 35, 3949–3960. [Google Scholar] [CrossRef] [PubMed]
- Su, X.; Peña, A.T.; Liu, L.; Levine, R.A. Random forests of interaction trees for estimating individualized treatment effects in randomized trials. Stat. Med. 2018, 37, 2547–2560. [Google Scholar] [CrossRef] [PubMed]
- Moher, D.; Liberati, A.; Tetzlaff, J.; Altman, D.G.; Group, P. Preferred reporting items for systematic reviews and meta-analyses: The PRISMA statement. PLoS Med. 2009, 6, e1000097. [Google Scholar] [CrossRef]
- Brooker, J.; Synnot, A.; McDonald, S.; Elliott, J.; Turner, T.; Hodder, R.; Weeks, L.; Ried, J.; MacLehose, H.; Akl, E.; et al. Guidance for the Production and Publication of Cochrane Living Systematic Reviews: Cochrane Reviews in Living Mode; Cochrane Community: London, UK, December 2019: 60. Available online: https://community.cochrane.org/sites/default/files/uploads/inline-files/Transform/201912_LSR_Revised_Guidance.pdf (accessed on 9 May 2025).
- Whiting, P.F.; Rutjes, A.W.S.; Westwood, M.E.; Mallett, S.; Deeks, J.J.; Reitsma, J.B.; Leeflang, M.M.; Sterne, J.A.; Bossuyt, P.M.; QUADAS-2 Group. Quadas-2: A revised tool for the quality assessment of diagnostic accuracy studies. Ann. Intern. Med. 2011, 155, 529–536. [Google Scholar] [CrossRef] [PubMed]
- Chaudhuri, S.; Larkin, J.; Guedes, M.; Jiao, Y.; Kotanko, P.; Wang, Y.; Usvyat, L.; Kooman, J.P. Predicting mortality risk in dialysis: Assessment of risk factors using traditional and advanced modeling techniques within the Monitoring Dialysis Outcomes initiative. Hemodial. Int. 2023, 27, 62–73. [Google Scholar] [CrossRef]
- Sheng, K.; Zhang, P.; Yao, X.; Li, J.; He, Y.; Chen, J. Prognostic machine learning models for first-year mortality in incident hemodialysis patients: Development and validation study. JMIR Med. Inform. 2020, 8, e20578. [Google Scholar] [CrossRef]
- Akbilgic, O.; Obi, Y.; Potukuchi, P.K.; Karabayir, I.; Nguyen, D.V.; Soohoo, M.; Streja, E.; Molnar, M.Z.; Rhee, C.M.; Kalantar-Zadeh, K.; et al. Machine learning to identify dialysis patients at high death risk. Kidney Int. Rep. 2019, 4, 1219–1229. [Google Scholar] [CrossRef]
- Lee, W.T.; Fang, Y.W.; Chang, W.S.; Hsiao, K.Y.; Shia, B.C.; Chen, M.; Tsai, M.H. Data-driven, two-stage machine learning algorithm-based prediction scheme for assessing 1-year and 3-year mortality risk in chronic hemodialysis patients. Sci. Rep. 2023, 13, 21453. [Google Scholar] [CrossRef]
- Mauri, J.M.; Cleries, M.; Vela, E.; Registry, C.R. Design and validation of a model to predict early mortality in haemodialysis patients. Nephrol. Dial. Transplant. 2008, 23, 1690–1696. [Google Scholar] [CrossRef] [PubMed]
- Thijssen, S.; Usvyat, L.; Kotanko, P. Prediction of mortality in the first two years of hemodialysis: Results from a validation study. Blood Purif. 2012, 33, 165–170. [Google Scholar] [CrossRef]
- Rankin, S.; Han, L.; Scherzer, R.; Tenney, S.; Keating, M.; Genberg, K.; Rahn, M.; Wilkins, K.; Shlipak, M.; Estrella, M. A machine learning model for predicting mortality within 90 days of dialysis initiation. Kidney360 2022, 3, 1556–1565. [Google Scholar] [CrossRef] [PubMed]
- Wang, Y.; Zhu, Y.; Lou, G.; Zhang, P.; Chen, J.; Li, J. A maintenance hemodialysis mortality prediction model based on anomaly detection using longitudinal hemodialysis data. J. Biomed. Inform. 2021, 123, 103930. [Google Scholar] [CrossRef]
- Khazaei, S.; Najafi-GhOBADI, S.; Ramezani-Doroh, V. Construction data mining methods in the prediction of death in hemodialysis patients using support vector machine, neural network, logistic regression and decision tree. J. Prev. Med. Hyg. 2021, 62, E222. [Google Scholar]
- Gotta, V.; Tancev, G.; Marsenic, O.; Vogt, J.E.; Pfister, M. Identifying key predictors of mortality in young patients on chronic haemodialysis—A machine learning approach. Nephrol. Dial. Transplant. 2021, 36, 519–528. [Google Scholar] [CrossRef]
- Hueso, M.; Vellido, A.; Montero, N.; Barbieri, C.; Ramos, R.; Angoso, M.; Cruzado, J.M.; Jonsson, A. Artificial intelligence for the artificial kidney: Pointers to the future of a personalized hemodialysis therapy. Kidney Dis. 2018, 4, 1–9. [Google Scholar] [CrossRef] [PubMed]
- Krumholz, H.M. Big data and new knowledge in medicine: The thinking, training, and tools needed for a learning health system. Health Aff. 2014, 33, 1163–1170. [Google Scholar] [CrossRef]
- Pisoni, R.L.; Gillespie, B.W.; Dickinson, D.M.; Chen, K.; Kutner, M.H.; Wolfe, R.A. The Dialysis Outcomes and Practice Patterns Study (DOPPS): Design, data elements, and methodology. Am. J. Kidney Dis. 2004, 44, 7–15. [Google Scholar] [CrossRef]
- Chan, K.E.; Maddux, F.W.; Tolkoff-Rubin, N.; Karumanchi, S.A.; Thadhani, R.; Hakim, R.M. Early outcomes among those initiating chronic dialysis in the United States. Clin. J. Am. Soc. Nephrol. 2011, 6, 2642–2649. [Google Scholar] [CrossRef] [PubMed]


| Study | Design | Country | Period | Sample Size | ML Models | Summary |
|---|---|---|---|---|---|---|
| Garcia-Montemayor (2020) [10] | Retrospective Cohort | Spain | 1995–2015 | 1571 | Random Forest, Logistic Regression | Random Forest showed superior performance over logistic regression for mortality prediction in hemodialysis (HD) patients. |
| Chaudhuri (2023) [29] | Retrospective Cohort | Multicenter | Not Specified | 95,142 | XGBoost, Logistic Regression | Developed ML and traditional models for 3-year mortality risk classification in prevalent HD patients, demonstrating good accuracy. |
| Sheng (2020) [30] | Retrospective Cohort | China | 2007–2019 | 5828 | Various ML Models (e.g., Adaptive Boosting, XGBoost) | Developed and validated ML models to stratify first-year mortality risk in HD patients, aiding early risk identification. |
| Akbilgic (2019) [31] | Retrospective Cohort | US | 2007–2014 | 27,615 | Random Forest | Accurately predicted short-term mortality in incident ESRD patients, supporting clinical decision-making. |
| Lee (2023) [32] | Retrospective Cohort | Taiwan | 2006–2012 | 800 | Logistic Regression, Decision Tree, XGBoost | Provided insights for nephrologists on short-term mortality risks, enhancing patient-centered decision-making. |
| Mauri (2008) [33] | Retrospective Cohort | Spain | 1997–2003 | 946 | Logistic Regression | Developed a prognostic model for 1-year mortality, highlighting modifiable risk factors for targeted interventions. |
| Thijssen (2012) [34] | Retrospective Cohort | US | 2000–2009 | 2326 | Logistic Regression | Suggested potential for prediction models to evolve into alert systems for timely intervention in high-risk patients. |
| Rankin (2022) [35] | Retrospective Cohort | US | 2008–2017 | 345,305 | XGBoost | Developed an XGBoost model with excellent calibration for early mortality prediction post-dialysis initiation. |
| Wang (2021) [36] | Retrospective Cohort | China | 2007–2016 | 1200 | Multiple ML Models (e.g., SVM, LSTM) | Employed anomaly detection with LSTM autoencoder, effectively identifying high-risk patients using longitudinal HD data. |
| Khazaei (2021) [37] | Retrospective Cohort | Iran | 2007–2017 | 758 | Decision Tree, SVM, Logistic Regression | Logistic Regression outperformed other models; key predictors included gender, age, iron levels, CRP status, and URR. |
| Gotta (2020) [38] | Retrospective Cohort | US | 2004–2016 | 363 | Random Forest | Identified key predictors (e.g., LDH, RDW) in pediatric HD patients, emphasizing the need for tailored management strategies. |
| Study ID | Age | Males | BMI | Albumin (g/dL) | Sodium (mEq/L) | Potassium (mEq/L) | Calcium (mg/dL) | Phosphorus (mg/dL) | Creatinine (mg/dL) | Hemoglobin (g/dL) |
|---|---|---|---|---|---|---|---|---|---|---|
| Garcia-Montemayor 2020 [10] | 62.33 ± 15.89 * | 953 (61%) | 27.1± 5.41 | 3.54± 0.55 | NR | 4.91 ± 0.89 | 9.04 ± 3.88 | 5.04 ± 1.66 | 7.3 ± 4.4 | 10.08 ± 2.79 |
| Chaudhuri 2023 [29] | 61.73 ± 15.08 * | 54.611 (57.4%) | 25.13 ± 5.53 | 3.78± 0.42 | NR | 4.87 ± 0.62 | 8.86 ± 0.64 | 4.27 ± 1.59 | 7.40 ± 2.48 | NR |
| Sheng 2020 [30] | 62.53 ± 62.45 * | 3524 (60.47%) | 21.73 ± 21.83 | 3.6 ± 0.68 | NR | NR | NR | NR | 12.9 ± 6.1 | NR |
| Akbilgic 2019 [31] | 68.7 ± 11.2 * | 27,101 (98.1%) | 29.9 ± 6.7 | 3.4 ± 0.7 | 138.9 ± 3.8 | NR | NR | NR | NR | NR |
| Lee 2023 [32] | 63.30 ± 13.26 * | 405 (50.63%) | NR | NR | 139.28 ± 3.70 | 4.70 ± 0.69 | NR | 5.20 ± 1.48 | 9.41 ± 2.3 | 10.31 ± 1.49 |
| Mauri 2008 [33] | 64.6 ± 14.4 * | 3567 (62.2%) | NR | NR | NR | NR | NR | NR | NR | NR |
| Thijssen 2012 [34] | 61.7 ± 15.5 * | 1314 (56.5%) | NR | 3.7 ± 0.4 | 138.5 ± 2.6 | NR | NR | 5.2 ± 1.2 | 7.3 ± 2.7 | 11.7 ± 1.1 |
| Rankin 2022 [35] | 63± 15 * | 198,347 (57.4%) | 30 ± 68 | 3.2 ± 0.7 | NR | NR | NR | NR | 6.46 ± 3.52 | 9.66 ±1.64 |
| Wang 2021 [36] | 52.69 ±16.94 * | 665 (63.03%) | NR | NR | NR | NR | NR | NR | NR | NR |
| Khazaei 2021[37] | 50.29 ± 15.73 * | 464 (54.2%) | 23.09 ± 4.21 | 3.74 ± 0.73 | 138.78 ± 6.8 | 4.9 ± 0.94 | 8.9 ± 0.90 | 5.11 ± 1.55 | NR | 10.48 ± 2.06 |
| Gotta 2020 [38] | 12.7(9–28.7) ** | 1473 (55%) | NR | 4 ± 0.45 | NR | NR | NR | NR | 9.9 ± 4.38 | 11.43 ± 1.79 |
| Study | Follow-Up | ML Model | True Positive | False Positive | True Negative | False Negative | Total | Patients Died | ||
|---|---|---|---|---|---|---|---|---|---|---|
| Sheng 2020 [30] | 1 year | Adaptive Boosting | 525 | 350 | 4720 | 233 | 5828 | 764 | ||
| Decision Tree | 466 | 117 | 4954 | 291 | 5828 | 764 | ||||
| Gradient Boosting | 525 | 116 | 4954 | 233 | 5828 | 764 | ||||
| K-Nearest Neighbor | 408 | 58 | 5012 | 350 | 5828 | 764 | ||||
| Light Gradient Boosting | 583 | 175 | 4895 | 175 | 5828 | 764 | ||||
| Logistic Regression | 641 | 3147 | 1923 | 117 | 5828 | 764 | ||||
| Random Forest | 525 | 233 | 4837 | 233 | 5828 | 764 | ||||
| XGBoost | 583 | 175 | 4895 | 175 | 5828 | 764 | ||||
| Lee 2023 [32] | 1 year | Logistic Regression | 0 | 23 | 691 | 46 | 760 | 42 | ||
| Decision Tree | 8 | 15 | 699 | 38 | 760 | 42 | ||||
| Random Forest | 0 | 0 | 714 | 46 | 760 | 42 | ||||
| Gradient Boosting | 0 | 0 | 714 | 46 | 760 | 42 | ||||
| XGBoost | 0 | 23 | 692 | 45 | 760 | 42 | ||||
| 3 years | Logistic Regression | 33 | 47 | 473 | 113 | 666 | 147 | |||
| Random Forest | 13 | 7 | 513 | 133 | 666 | 147 | ||||
| Gradient Boosting | 27 | 13 | 506 | 120 | 666 | 147 | ||||
| XGBoost | 27 | 13 | 506 | 120 | 666 | 147 | ||||
| Thijssen 2012 [34] | 7–12 months | Logistic Regression | 93 | 535 | 1651 | 47 | 2326 | 133 | ||
| 13–18 months | Logistic Regression | 75 | 448 | 37 | 1306 | 1866 | 121 | |||
| 19–24 months | Logistic Regression | 46 | 335 | 30 | 1113 | 1524 | 80 | |||
| Rankin 2022 [35] | 3 months | XGBoost | 6024 | 22,134 | 84,124 | 2541 | 114,823 | 86,083 | ||
| Khazaei 2021 [37] | 2.29 years | Decision Tree | 267 | 145 | 300 | 145 | 857 | 408 | ||
| Neural Network | 241 | 128 | 317 | 171 | 857 | 408 | ||||
| Support Vector Machine | 274 | 137 | 309 | 137 | 857 | 408 | ||||
| Logistic Regression | 283 | 129 | 317 | 128 | 857 | 408 | ||||
| Study | Follow Up | ML Model | Sensitivity | Specificity |
|---|---|---|---|---|
| Sheng 2020 [30] | 1 year | Adaptive Boosting | 72.33 | 93.45 |
| Decision Tree | 63.52 | 97.45 | ||
| Gradient Boosting | 67.92 | 97.97 | ||
| k-Nearest Neighbor | 52.2 | 98.89 | ||
| Linear Discriminant Analysis | 82.81 | 37.76 | ||
| Light Gradient Boosting | 75.68 | 96.86 | ||
| Logistic Regression | 81.76 | 37.58 | ||
| Random Forest | 70.02 | 94.86 | ||
| XGBoost | 78.62 | 96.92 | ||
| Lee 2023 [32] | 1 year | Logistic Regression | 4.4 | 96.7 |
| Decision Tree | 15.6 | 98.3 | ||
| Random Forest | 0 | 100 | ||
| Gradient Boosting | 2.2 | 99.9 | ||
| XGBoost | 4.4 | 96.7 | ||
| 3 years | Logistic Regression | 24.3 | 91.6 | |
| Decision Tree | 28.6 | 86.5 | ||
| Random Forest | 9.6 | 99.2 | ||
| Gradient Boosting | 17.1 | 97 | ||
| XGBoost | 17.5 | 97 | ||
| Thijssen 2012 [34] | 7–12 months | Logistic Regression | 65 | 75 |
| 13–18 months | Logistic Regression | 69 | 74 | |
| 19–24 months | Logistic Regression | 58 | 77 | |
| Rankin 2022 [35] | 3 months | XGBoost | 70.3 | 79.1 |
| Support Vector Machine | 66 | 70 | ||
| Logistic Regression | 69 | 72 |
| Study | Follow Up | ML Model | AUC | 95% CI | |
|---|---|---|---|---|---|
| LL | UL | ||||
| Garcia-Montemayor 2020 [10] | 6 months | Random Forest | 0.7 | 0.68 | 0.72 |
| 1 year | 0.73 | 0.72 | 0.75 | ||
| 2 years | 0.73 | 0.71 | 0.74 | ||
| 6 months | Logistic Regression | 0.69 | 0.67 | 0.71 | |
| 1 year | 0.71 | 0.7 | 0.73 | ||
| 2 years | 0.69 | 0.67 | 0.7 | ||
| Chaudhuri 2023 [29] | 3 years | XGBoost | 0.8 | NR | NR |
| 3 years | Logistic Regression | 0.75 | NR | NR | |
| Sheng 2020 [30] | 1 year | Adaptive Boosting | 0.83 | 0.8 | 0.84 |
| Gradient Boosting | 0.84 | 0.82 | 0.85 | ||
| K-Nearest Neighbor | 0.82 | 0.81 | 0.86 | ||
| Light Gradient Boosting | 0.85 | 0.8 | 0.85 | ||
| Logistic Regression | 0.73 | 0.73 | 0.86 | ||
| Random Forest | 0.82 | 0.8 | 0.85 | ||
| XGBoost | 0.85 | 0.81 | 0.86 | ||
| Akbilgic 2019 [31] | 1 month | Random Forest | 0.719 | 0.699 | 0.738 |
| 3 months | 0.745 | 0.735 | 0.755 | ||
| 6 months | 0.750 | 0.743 | 0.758 | ||
| 1 year | 0.749 | 0.742 | 0.755 | ||
| Lee 2023 [32] | 1 year | Logistic Regression | 0.734 | NR | NR |
| Decision Tree | 0.59 | NR | NR | ||
| Random Forest | 0.806 | NR | NR | ||
| Gradient Boosting | 0.793 | NR | NR | ||
| XGBoost | 0.734 | NR | NR | ||
| 3 years | Logistic Regression | 0.756 | NR | NR | |
| Decision Tree | 0.66 | NR | NR | ||
| Random Forest | 0.763 | NR | NR | ||
| Gradient Boosting | 0.773 | NR | NR | ||
| XGBoost | 0.788 | NR | NR | ||
| Mauri 2008 [33] | 1 year | Logistic Regression | 0.78 | NR | NR |
| Thijssen 2012 [34] | 7–12 months | Logistic Regression | 0.698 | 0.679 | 0.717 |
| 13–18 months | Logistic Regression | 0.717 | 0.696 | 0.737 | |
| 19–24 months | Logistic Regression | 0.67 | 0.646 | 0.694 | |
| Wang 2021 [36] | 3 months | Logistic Regression | 0.8 | 0.797 | 0.802 |
| 6 months | 0.77 | 0.768 | 0.772 | ||
| 1 year | 0.86 | 0.8577 | 0.8623 | ||
| 3 months | Support Vector Machine | 0.77 | 0.7667 | 0.7733 | |
| 6 months | 0.75 | 0.7484 | 0.7516 | ||
| 1 year | 0.8 | 0.7982 | 0.8018 | ||
| 3 months | Random Forest | 0.84 | 0.8365 | 0.8435 | |
| 6 months | 0.81 | 0.8084 | 0.8116 | ||
| 1 year | 0.81 | 0.8034 | 0.8166 | ||
| Gotta 2020 [38] | 3 years | Random Forest | 0.89 | NR | NR |
| 5 years | 0.82 | NR | NR | ||
| 8 years | 0.77 | NR | NR | ||
Disclaimer/Publisher’s Note: The statements, opinions and data contained in all publications are solely those of the individual author(s) and contributor(s) and not of MDPI and/or the editor(s). MDPI and/or the editor(s) disclaim responsibility for any injury to people or property resulting from any ideas, methods, instructions or products referred to in the content. |
© 2025 by the authors. Licensee MDPI, Basel, Switzerland. This article is an open access article distributed under the terms and conditions of the Creative Commons Attribution (CC BY) license (https://creativecommons.org/licenses/by/4.0/).
Share and Cite
Motofelea, A.C.; Mihaescu, A.; Olariu, N.; Marc, L.; Chisavu, L.; Pop, G.N.; Crintea, A.; Jura, A.M.C.; Ivan, V.M.; Apostol, A.; et al. Machine Learning Models for Predicting Mortality in Hemodialysis Patients: A Systematic Review. Appl. Sci. 2025, 15, 5776. https://doi.org/10.3390/app15105776
Motofelea AC, Mihaescu A, Olariu N, Marc L, Chisavu L, Pop GN, Crintea A, Jura AMC, Ivan VM, Apostol A, et al. Machine Learning Models for Predicting Mortality in Hemodialysis Patients: A Systematic Review. Applied Sciences. 2025; 15(10):5776. https://doi.org/10.3390/app15105776
Chicago/Turabian StyleMotofelea, Alexandru Catalin, Adelina Mihaescu, Nicu Olariu, Luciana Marc, Lazar Chisavu, Gheorghe Nicusor Pop, Andreea Crintea, Ana Maria Cristina Jura, Viviana Mihaela Ivan, Adrian Apostol, and et al. 2025. "Machine Learning Models for Predicting Mortality in Hemodialysis Patients: A Systematic Review" Applied Sciences 15, no. 10: 5776. https://doi.org/10.3390/app15105776
APA StyleMotofelea, A. C., Mihaescu, A., Olariu, N., Marc, L., Chisavu, L., Pop, G. N., Crintea, A., Jura, A. M. C., Ivan, V. M., Apostol, A., & Schiller, A. (2025). Machine Learning Models for Predicting Mortality in Hemodialysis Patients: A Systematic Review. Applied Sciences, 15(10), 5776. https://doi.org/10.3390/app15105776