Article

Near-Field Aeroacoustics of Spanwise Forcing on a Transonic Wing: A DNS Study

1
Dipartimento di Scienze e Tecnologie Aerospaziali, Politecnico di Milano, Via La Masa 34, 20156 Milano, Italy
2
Institute of Fluid Mechanics, Karlsruhe Institute of Technology, Kaiserstraße 10, 76131 Karlsruhe, Germany
3
Dipartimento di Meccanica e Aeronautica, Università di Roma “La Sapienza”, Via Eudossiana 18, 00184 Rome, Italy
*
Author to whom correspondence should be addressed.
Appl. Sci. 2025, 15(2), 814; https://doi.org/10.3390/app15020814
Submission received: 15 November 2024 / Revised: 30 December 2024 / Accepted: 13 January 2025 / Published: 15 January 2025
(This article belongs to the Special Issue Computational Active Flow and Noise Control)

Abstract

:
The transonic airflow around a supercritical wing with a shock wave is described via direct numerical simulations. Flow control for turbulent drag reduction is applied via streamwise traveling waves of spanwise velocity applied on a finite portion of the suction side. The near-field modifications caused by the forcing are studied via the analysis of the wake profile downstream of the trailing edge. Moreover, for the first time, the effects of spanwise forcing on aeroacoustic noise are considered to establish whether active flow control for drag reduction could possibly increase noise. By extracting the acoustic signals on a circumference placed in the near-field around the wing and by studying them in terms of sound intensity and frequency content, it is found that noise intensity is not significantly increased by spanwise forcing and that frequency content is only minimally altered. Furthermore, if the angle of attack is reduced to take into account the increased lift and the reduced drag made possible by the control action, changes in the noise characteristics become negligible.

1. Introduction

Flow control is the branch of fluid mechanics where techniques to manipulate a flow in view of a technological objective are studied. Among the most pursued goals of flow control, aerodynamic drag reduction and noise reduction stand out as crucial technological challenges.
The former is particularly relevant in the turbulent regime, where the comparatively large wall shear stresses lead to a large consumption of energy required to drive the flow, for instance, as energy required to pump a fluid through a duct or to propel a body through a still fluid. A large number of drag-reducing techniques have been developed over the last decades; they are typically classified as ‘passive’ or ‘active’, depending on whether or not energy is introduced in the flow [1]. Losses due to skin-friction are particularly difficult to abate, as they are intrinsic of near-wall turbulence and descend directly from the interaction between the structure of turbulence and the solid wall. A classic example of a passive skin-friction drag reduction technique is represented by riblets, which are probably the most promising passive approach to date. Riblets are tiny streamwise corrugations of the wall surface which yield skin-friction reduction up to 9% in a turbulent channel flow at low speed [2]. This figure is bound to reduce significantly down to 1–2% of the aerodynamic drag once a typical aircraft in cruise flight is considered [3]. Hence, to achieve larger drag reduction, active approaches are considered. Among them, a class known as ‘spanwise forcing’ stands out for its robustness, performance, and simplicity. A recent review of spanwise forcing for drag reduction can be found in Ref. [4]. In this type of forcing, the boundary condition of the spanwise component of the flow velocity at the wall is imposed as an unsteady, spatially periodic distribution. The most efficient technique of this class is the use of streamwise traveling waves of spanwise velocity (StTWs), introduced by Quadrio et al. [5]. Within this framework, the spanwise velocity component of the velocity at the wall varies in time and space according to
w w ( x , t ) = A sin κ x x ω t
where A is the amplitude of the forcing, κ x and ω are the spatial and temporal frequencies of the waves, and x and t denote the streamwise and temporal coordinates, respectively. StTWs modify the near-wall velocity profile and are capable of reducing skin-friction drag with rates up to 48 % for intermediate values of A; furthermore, this kind of control yields the largest net energy savings among the active techniques [5]. Experimental realizations of such forcing were provided in a pipe flow [6]; the actuator was later adapted to planar geometry [7,8]. Gallorini and Quadrio [9] characterized the spatially discrete waveform that is typical of these experiments. The effects of the Reynolds number ( R e ) on skin-friction reduction induced by StTWs was assessed in the thorough study by Gatti et al. [10]. The compressibility effects in a plane channel flow were assessed by Gattere et al. [11], who showed that no beneficial or detrimental effects derive from compressibility, once the comparison with the unmanipulated flow is carried out properly. The performance of StTWs in non-planar geometries was analyzed by Quadrio et al. [12]. The latter study carried out a preliminary analysis on the effects of StTWs applied on a transonic wing slab: they employed direct numerical simulations (DNSs) to simulate the turbulent flow around the wing at a cruise Mach number and at a relatively small value of the Reynolds number. Their analysis was recently extended by Berizzi et al. [13], who carried out a parametric study on the same setup by varying the control input of the forcing and the angle of attack of the airflow. It was shown that the drag of the airfoil alone can be reduced up to 4%; extrapolating the savings to a full aircraft, a potential reduction of 12% in the total drag force of the aircraft at a negligible power cost was estimated. They also provided the first description of the effects of StTWs on the flow field on the wing, focusing in particular on the interaction between the control effects, the suction-side shock wave, and the turbulent boundary layer.
Flow control for noise reduction is clearly a different topic, where again active and passive strategies coexist. Passive techniques for noise reduction rely, for example, on superficial roughness or on porous media coatings [14]. The primary effect of the surface treatment is the partial dissipation of acoustic energy into heat, or its reflection towards the original source [1]. Another important example of passive noise reduction is the technique adopted in the jet flows exiting from airplane engines: since the radiated noise increases with the Mach number, the solution typically exploited is to increase the so-called ‘bypass ratio’ of the outflow, thus reducing the speed and the temperature of the outflow, eventually lowering noise. Recently, the reduction in the tonal, trailing-edge noise of a NACA0012 airfoil at relatively low Reynolds and Mach numbers was attempted by placing small superficial roughness elements at the wall [15,16]. Examples of active control techniques for noise reduction in aeronautical applications are the blowing and/or suction of the boundary layer [17] and the use of plasma actuators [18]. A third group of sound-abating technologies is made by the ‘reactive’ noise suppression systems [1]. These rely on the generation of additional noise which, due to its amplitude and phase, interferes destructively with the noise generated by the sound source, thus reducing it locally. Also in this case, a supply of energy is required; the approach is inevitably more complicated than the former ones, as elements such as an acoustic sensor and a controller for generating the so-called “anti-sound” are needed. These kinds of systems have been employed successfully, for example, in combustion chambers, where they have drastically reduced noise and flame instabilities, thus improving the performance and efficiency of this component of thermal engines.
Flow control for turbulent drag and noise reduction are typically two distinct research domains and are thus seldom addressed together. Hence, only a limited number of studies exists, where the effect of one kind of flow control on the goal of the other is considered. Two of the few examples are the recent work by Zhang et al. [14], who showed the effects of a uniform porous coating on both drag and noise reduction in a cylinder configuration, and by Muhammad and Chong [19], who performed an experiment by placing riblets on a portion of an aerodynamic profile; they concluded that the passive device could potentially reduce the airfoil self-noise in low and high frequency ranges. To the authors’ knowledge, the effects of spanwise forcing for skin-friction drag reduction on the aeroacoustic field have never been considered so far in the literature. The present study intends to investigate, via direct numerical simulations (DNSs), the effects of spanwise forcing for turbulent drag reduction on the near-field pressure fluctuations around a transonic wing. Our goal is to assess the near-field changes induced by the control, and to observe whether this type of forcing, that is very effective in drag reduction, possibly yields noise increase as an undesired side effect. To this aim, the dataset produced by Berizzi et al. [13] will be studied for the physical setup of a compressible, transonic flow around a wing slab with a shock wave. While the simulations have been carried out and described in that previous study, their analysis presented here is entirely original.
The paper is structured as follows: Section 2 briefly presents the numerical methods adopted for the computations, while Section 3 shows the main modifications of the near-wing flow field ensuing from the forcing. Section 4 describes the main effects of StTWs on the noise field close to the profile by focusing on its intensity and frequency content, while in Section 5 we further analyze the noise modifications in relationship with the classically adopted performance indicators of the wing. Finally, Section 6 presents the conclusions of the study.

2. Numerical Method and Description of the Dataset

2.1. Solver, Setup, and Procedures

The analysis presented in this work derives stems from the database of 29 DNSs of the transonic flow around a wing slab performed in Berizzi et al. [13]. The database has been marginally extended to consider longer integration times for a few selected cases. The main features of the dataset are reported here; the reader is referred to the original studies for further details.
The numerical code adopted for the computations was presented and validated extensively in Memmolo et al. [20]. The code solves the compressible Navier–Stokes equations for an ideal gas, with the Newtonian fluid hypothesis and Fourier’s law adopted for describing the viscous stress tensor and the heat flux, respectively. The code employs a second-order, energy-consistent finite-volumes method [21], which switches to a third-order weighted essentially non-oscillatory scheme close to shock waves. The switch is governed by a modified version [21] of the Ducros sensor [22]. A low-storage, third order Runge–Kutta scheme is employed for temporal advancement.
A C-grid with approximately 536 × 10 6 points, uniformly extruded in the spanwise direction, and with a hyperbolic tangent clustering in the wall-normal direction is adopted. The dimensions of the smallest, near-wall cells ensure that all the turbulent scales are well resolved, as Δ x + < 10 , Δ y + < 0.5 and Δ z + < 5 (where Δ denotes the grid spacing, and the ‘+’ superscript indicates scaling with the inner viscous quantities, i.e., the friction velocity u τ and the viscous length scale δ ν ). The mesh features a radius of 25 chords (c) and a spanwise extension of 0.1 c , while the outlet is placed 25 c downstream of the trailing edge of the wing. The temporal discretization uses a fixed time step Δ t = 1.5 × 10 4 c / U , which ensures that the CFL number is maintained below unity, therefore granting numerical stability.
The supercritical V2C airfoil, designed within the European project TFAST and purposely developed for transonic flow conditions, is studied. The free stream airflow is steady, with M U / a = 0.7 (where M is the Mach number, U and a are the velocity and speed of sound, respectively, and the ‘’ subscript denotes the undisturbed flow) and R e U c / ν = 3 × 10 5 (where ν is the kinematic viscosity). The angle of attack is fixed to α = 4 , at which the profile is known to have maximum aerodynamic efficiency; other incidences are considered when flow control alters the wing efficiency. The inflow is laminar. Since the value of R e adopted in the computations is not sufficiently high to grant a naturally well-developed turbulent boundary layer, turbulence is tripped numerically at x = 0.1 c downstream of the leading edge on both sides of the airfoil through a Gaussian blob of random wall-normal forces, following a well established practice [23].
After the flow reaches stationary conditions, statistics for each simulation are accumulated; the initial transient length is determined with a case-by-case analysis. Convergence and uncertainty of the computed mean values are checked with the algorithm presented by Russo and Luchini [24]; the standard deviation of the main integral aerodynamic coefficients remains below 1 % of the coefficient’s mean value across all simulations. Complete details on the numerical procedures are contained in Ref. [13].

2.2. The Dataset

The entire database contains the results of 29 direct numerical simulations, where the control parameters of the streamwise traveling waves described by Equation (1) are varied. In a canonical channel flow, this type of spanwise forcing only features three control parameters: the amplitude A and the spatial and temporal frequencies κ x and ω . On the wing, two additional parameters are introduced, namely the beginning and the end of the actuated region ( x b and x e , respectively). An exponential damping function, acting close to the edges of the forcing, ensures that no discontinuities in the spanwise wall velocity component arise, as conducted in [25] for a different type of spanwise forcing. One simulation (case REF) is performed for the unmanipulated flow, while in the remaining simulations the control is activated.
In particular, 20 simulations (cases C1–C20, shown in Figure 1) consider different values of the pair κ x , ω for the fixed control amplitude A = 0.684 U . Simulations C1—C20 are divided in three sub-groups: cases C1–C5 are performed with ω = 0 , cases C6–C15 feature constant wavenumber κ x and varying frequency ω , and finally, cases C16–C20 are characterized by variations in both control frequencies. The colormap in the figure represents the percentage skin-friction reduction rate (i.e., the drag reduction indicator in a plane channel flow), conventionally defined as
Δ C f , % = 100 C f , 0 C f C f , 0
where C f = 2 τ w / ρ U 2 is the friction coefficient (with τ w , ρ denoting the wall shear stress and the free stream density, respectively).
As already mentioned in Section 1, the control action increases the lift force, therefore allowing a reduction in the angle of attack to obtain the same lifting force, hence ultimately reducing drag. Hence, one of the best performing cases, namely case C10 (indicated with a white diamond in Figure 1), is computed again with the same control input, but the incidence is reduced at α = 3 . 45 to match the lift of the reference case; its label is R10. The corresponding uncontrolled case at reduced incidence is labeled RREF. The only simulation yielding lift disruption is case C12, and it is represented by the white circle in Figure 1. The analysis presented in this paper will focus on the uncontrolled cases REF and RREF, as well as on cases C10 (skin-friction reduction) and R10 (skin-friction reduction at α = 3 . 45 ). The reader is again referred to Berizzi et al. [13] for further details.
Note that every quantity hereinafter denoted with a ‘ Δ ’ represents the variation in the controlled case with respect to the reference unmanipulated simulation, unless otherwise specified. Hence, a positive Δ represents an increase.

2.3. Probing the Pressure Field

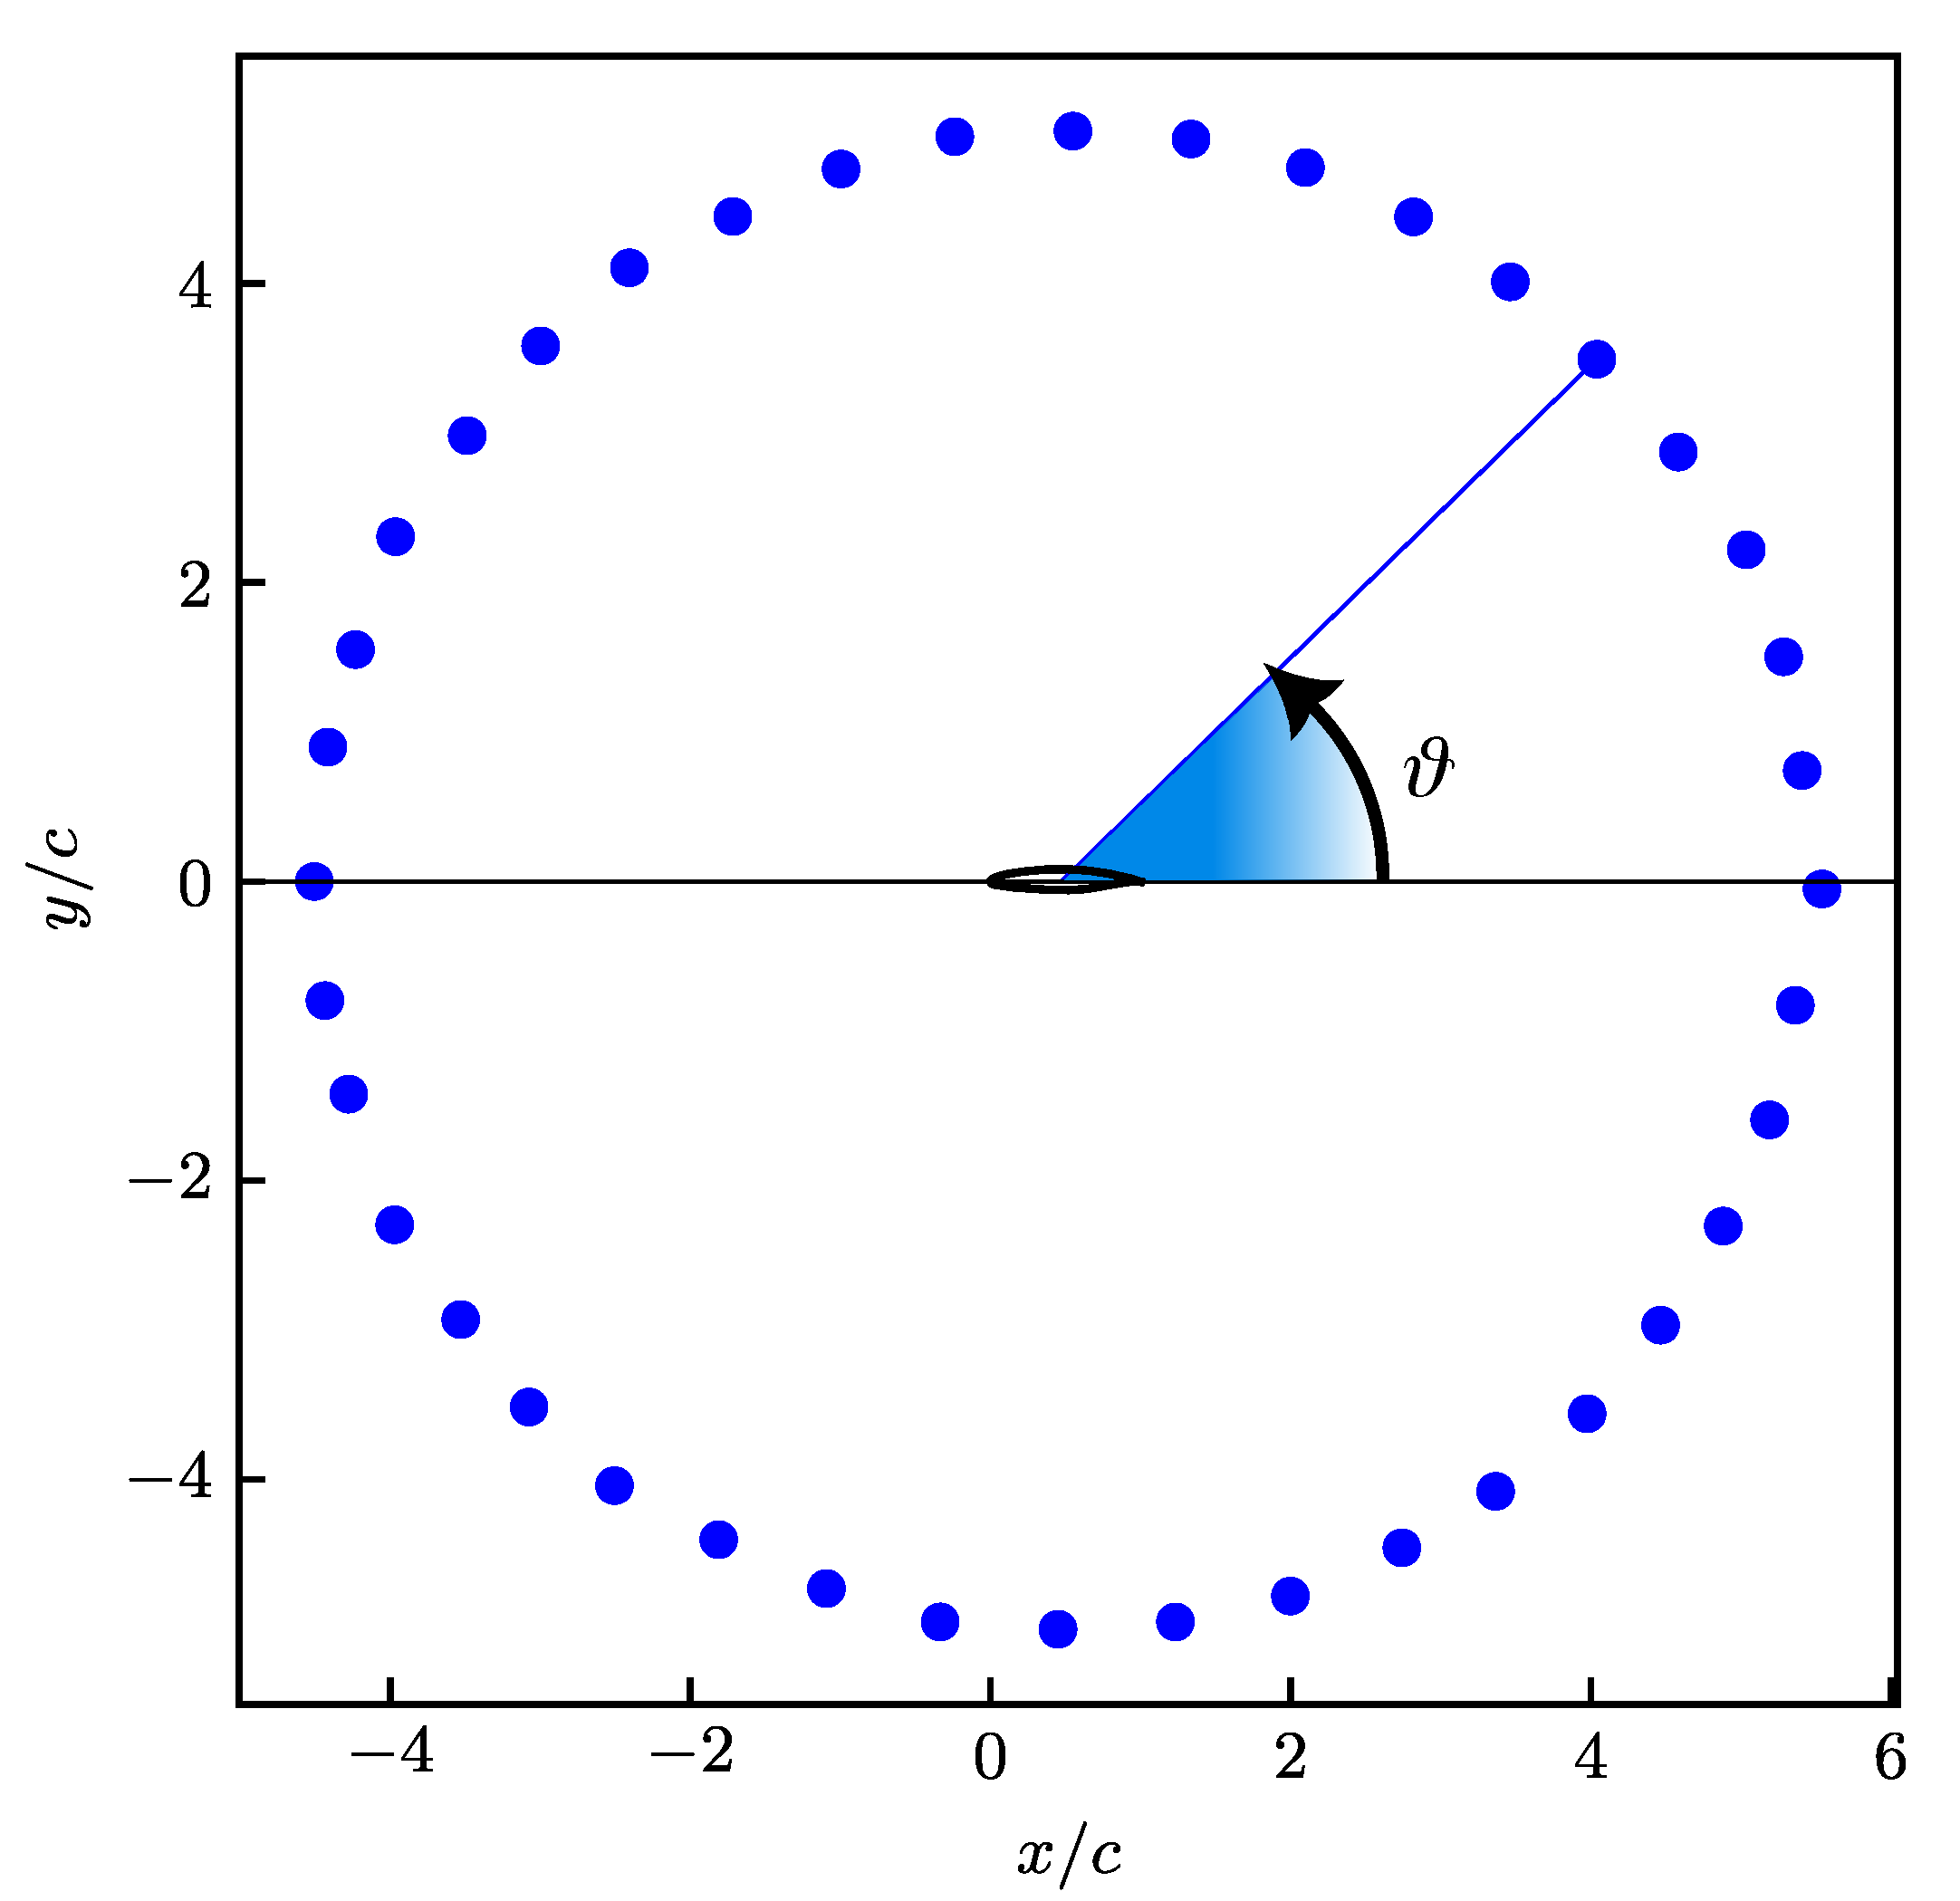
The acoustic information studied in this work is derived from time histories of pressure p measured for a set of 40 observers (also named ‘probes’) placed on a circumference of radius 5 c , centered mid-chord and lying in the xy centerplane. In particular, the analysis focuses on the two uncontrolled cases REF and RREF, and on the two corresponding controlled cases C10 and R10. Additionally, case C12 is also considered. These five simulations can be considered representative of the possible outcomes of applying StTWs on the transonic wing, as cases C10 and R10 feature skin-friction reduction (and lift increase) while case C12 features skin-friction increase (and lift disruption). The pressure signals presented in the remainder of the paper are complete time histories of point probes. Samples are stored every computational time step, i.e., every Δ t = 1.5 × 10 4 c / U , and cover a total time span of 120 c / U . The positions of the probes are depicted in Figure 2. Hereinafter, the angle of the observer is denoted as θ , and is computed as the angle between the position vector of the probe with respect to the center of the profile, and the horizontal positive x-axis (see Figure 2).
The overall sound pressure level (OASPL), a common indicator for the intensity of the acoustic signals, is computed in decibels for each observer as
O A S P L = 20 log p r m s p h t
where p r m s denotes the root-mean-square of the unsteady part of the pressure signals and p h t is the hearing threshold, conventionally set to p h t = 20 μ Pa. Since the simulations solve the Navier–Stokes equations in non-dimensional form, the free-stream pressure for retrieving the dimensional value of p r m s , used in (3) is set equal to the atmospheric pressure at sea level, i.e., p a t m = 101,325 Pa.

3. The Near-Field Flow

We start by describing the effects of flow control via StTWs on the wall stresses close to the trailing edge of the wing, linking them to the modifications of the near-field velocity field, with a particular emphasis on its wake. Our previous analysis described in Ref. [13] was focused on the aerodynamic forces acting on the wing, and did not consider the flow field around it.
Figure 3 plots an instantaneous snapshot of the spatial distribution of the pressure fluctuations of the transonic flow around the wing in the reference uncontrolled (REF) simulation. The figure gives an overview of the rich physics of the flow, and of how well it can be captured with a DNS. A thorough description of the flow was already given in [12,13] and will not be repeated in detail here. In a nutshell, the initially subsonic flow is compressed and slowed down by approaching the leading edge. Then, on the suction side the airflow undergoes an abrupt acceleration (or ‘expansion’) and rapidly becomes supersonic, remaining so for about half the profile chord. The supersonic region (delimited by the white sonic line) is terminated by a shock wave, which results from the compression of the supersonic flow in the aft part of the wing. The shock interacts with the boundary layer, increasing its thickness and enhancing pressure fluctuations downstream of the interaction. Close to the trailing edge, the flow is further slowed down by the adverse pressure gradient, which eventually causes flow separation. On the pressure side, instead, the flow is accelerated downstream of the leading edge, but does not reach supersonic conditions. The most intense pressure fluctuations are detected in the post-shock region above the suction side, and below the pressure side. Large-scale eddies, visualized as pressure fluctuations of alternating signs, characterize the wake and the boundary layers. The latter, which become turbulent downstream of the tripping (see Section 2), feature different characteristics depending on the wing side: on the suction side, fluctuations are relatively weak down to the shock wave/boundary layer interaction region, which enhances turbulence (a common source of noise, together with the trailing-edge separation). Beneath the profile, instead, pressure fluctuations are significant only in the trailing-edge region.
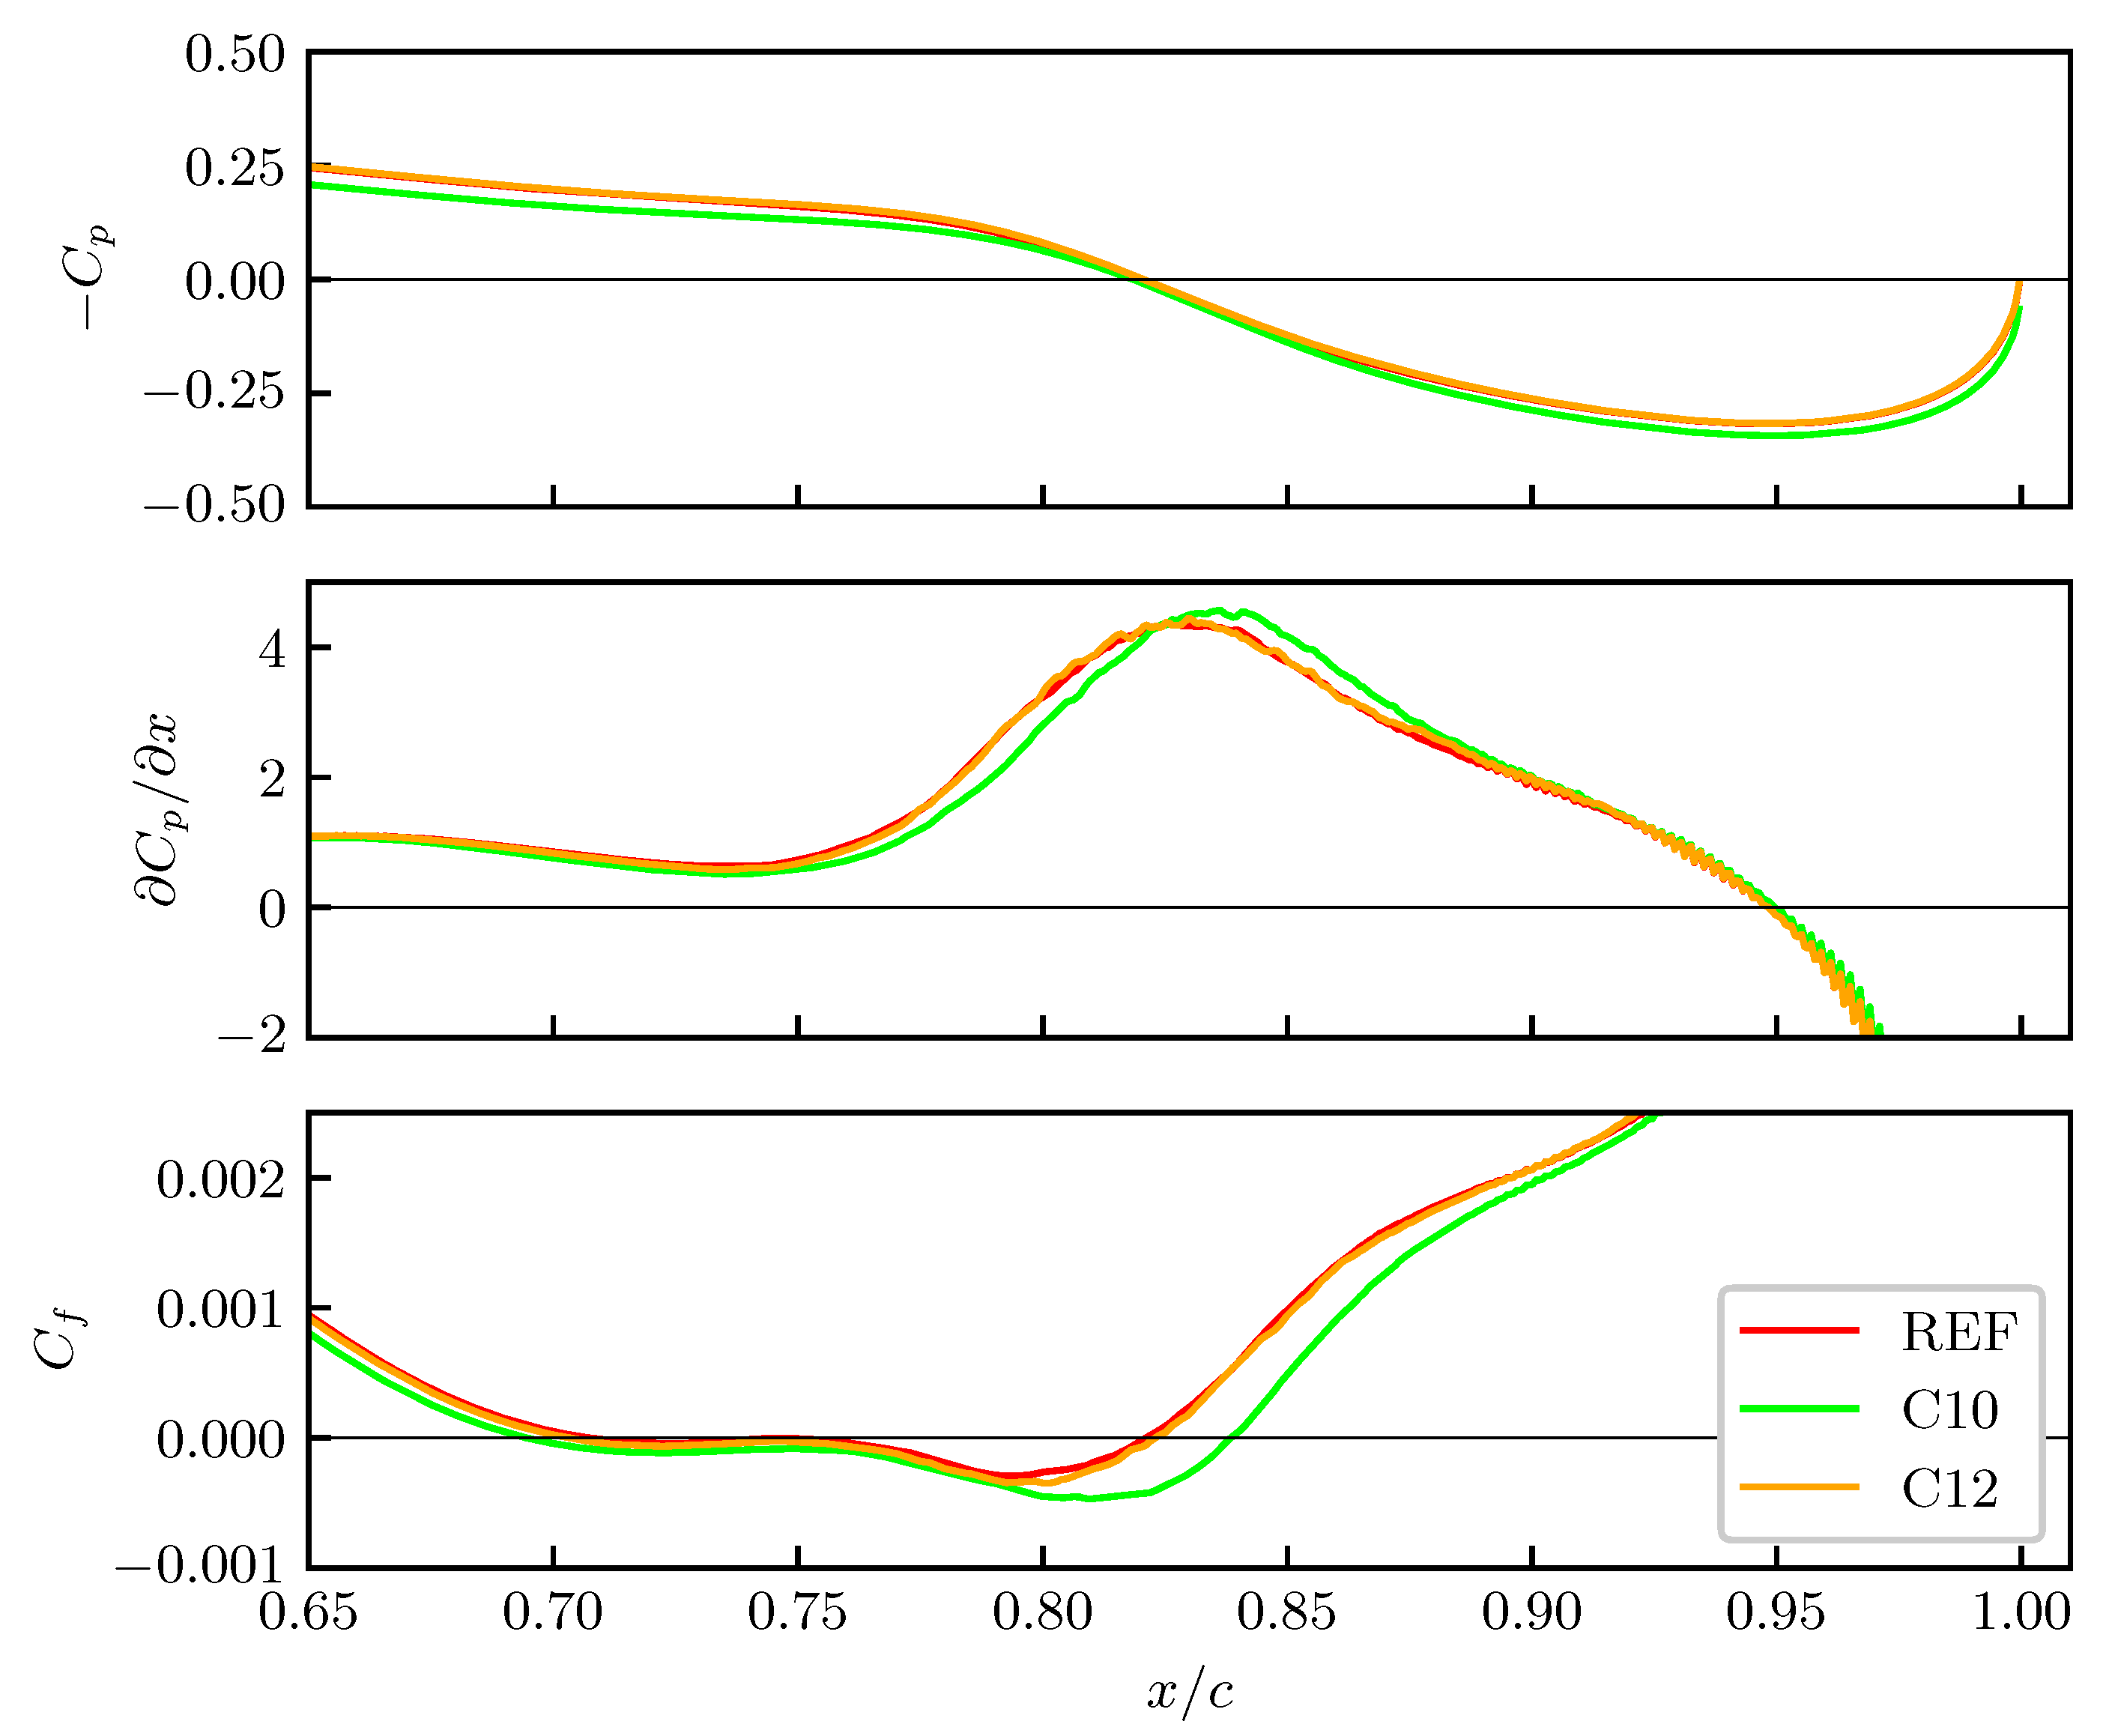
Figure 4 plots, for cases REF, C10, and C12, a detail of the mean pressure ( C p = 2 ( p p ) / ρ U 2 ) and friction ( C f ) coefficients, together with the x-derivative of the pressure gradient ( C p / x ), close to the trailing edge of the wing on its pressure side. StTWs, albeit applied on the suction side only, do have a minimal influence on the flow properties of the pressure side too, as a consequence of the changes to the airfoil circulation. On the upper panel, the pressure coefficients of cases REF and C12 basically overlap. The curve relative to simulation C10, instead, features slightly higher values of C p . In the lower panel, a region of separated flow is detected by the negative values of the friction coefficient: the regions where C f < 0 in cases REF and C12 overlap, while the one relative to case C10 is larger by some percent chord units. In Ref. [13], it was shown for the suction side how the StTWs contribute to the generation of a recirculation bubble in the region of the shock foot. In particular, it was shown that spanwise forcing induces a separation, whose extension is enlarged in a measure that depends on the the position of the shock and on the skin-friction reduction rate. Here, on the contrary, we observe that on the opposite pressure side, separation is already present in the unmanipulated flow. Interestingly, StTWs modify the adverse pressure gradient on the pressure side; this is shown in the central panel via the x-derivative of the pressure coefficient. When lift is increased (case C10), the peak of C p / x observed in case REF is slightly delayed and intensified, thus leading to a stronger separation. The link between the forcing applied on the suction side and the recirculation bubble below the pressure side is arguably a variation in the characteristics of the wake and of the circulation around the profile.
The left panel of Figure 5 shows the velocity profile in the wake, for the reference simulation (black dashed line) and for a subset of ten simulations extracted among cases C1–C20. At a first glance, the wake profiles for the controlled cases appear to overlap with the non-controlled one. However, it is possible to observe that, in general, the wake is slightly translated downstream when the control is applied. Furthermore, the colormap, which encodes the variation in the lift coefficient of the wing, brings to light that larger increases in the lift coefficient correspond to larger shifts of the wake towards negative values of y / c .
For each point of the wake profile, the percentage variation in the controlled cases with respect to the reference simulation is computed as
Δ u t % ( y ) = 100 u t ( y ) u t , 0 ( y ) u t , 0 ( y )
and the results are shown in the right panel of Figure 5. The already mentioned downward shift of the wake, which in the left panel is somehow difficult to identify, becomes evident here as positive values of Δ u t % in the upper half, and negative values in the lower half of the wake. The only case in which the velocity in the wake is globally reduced with respect to the reference case is simulation C12, i.e., the one in which the control parameters of StTWs yield skin-friction increase and lift decrease (indeed, Δ C L = 1.2 % ). In this case, in fact, Δ u t is negative for the whole transversal extent of the wake. Finally, it is worth highlighting that the percentage variations in the velocity profiles never exceed 2.5 % .

4. The Near-Field Acoustics

4.1. Overall Sound Pressure Level

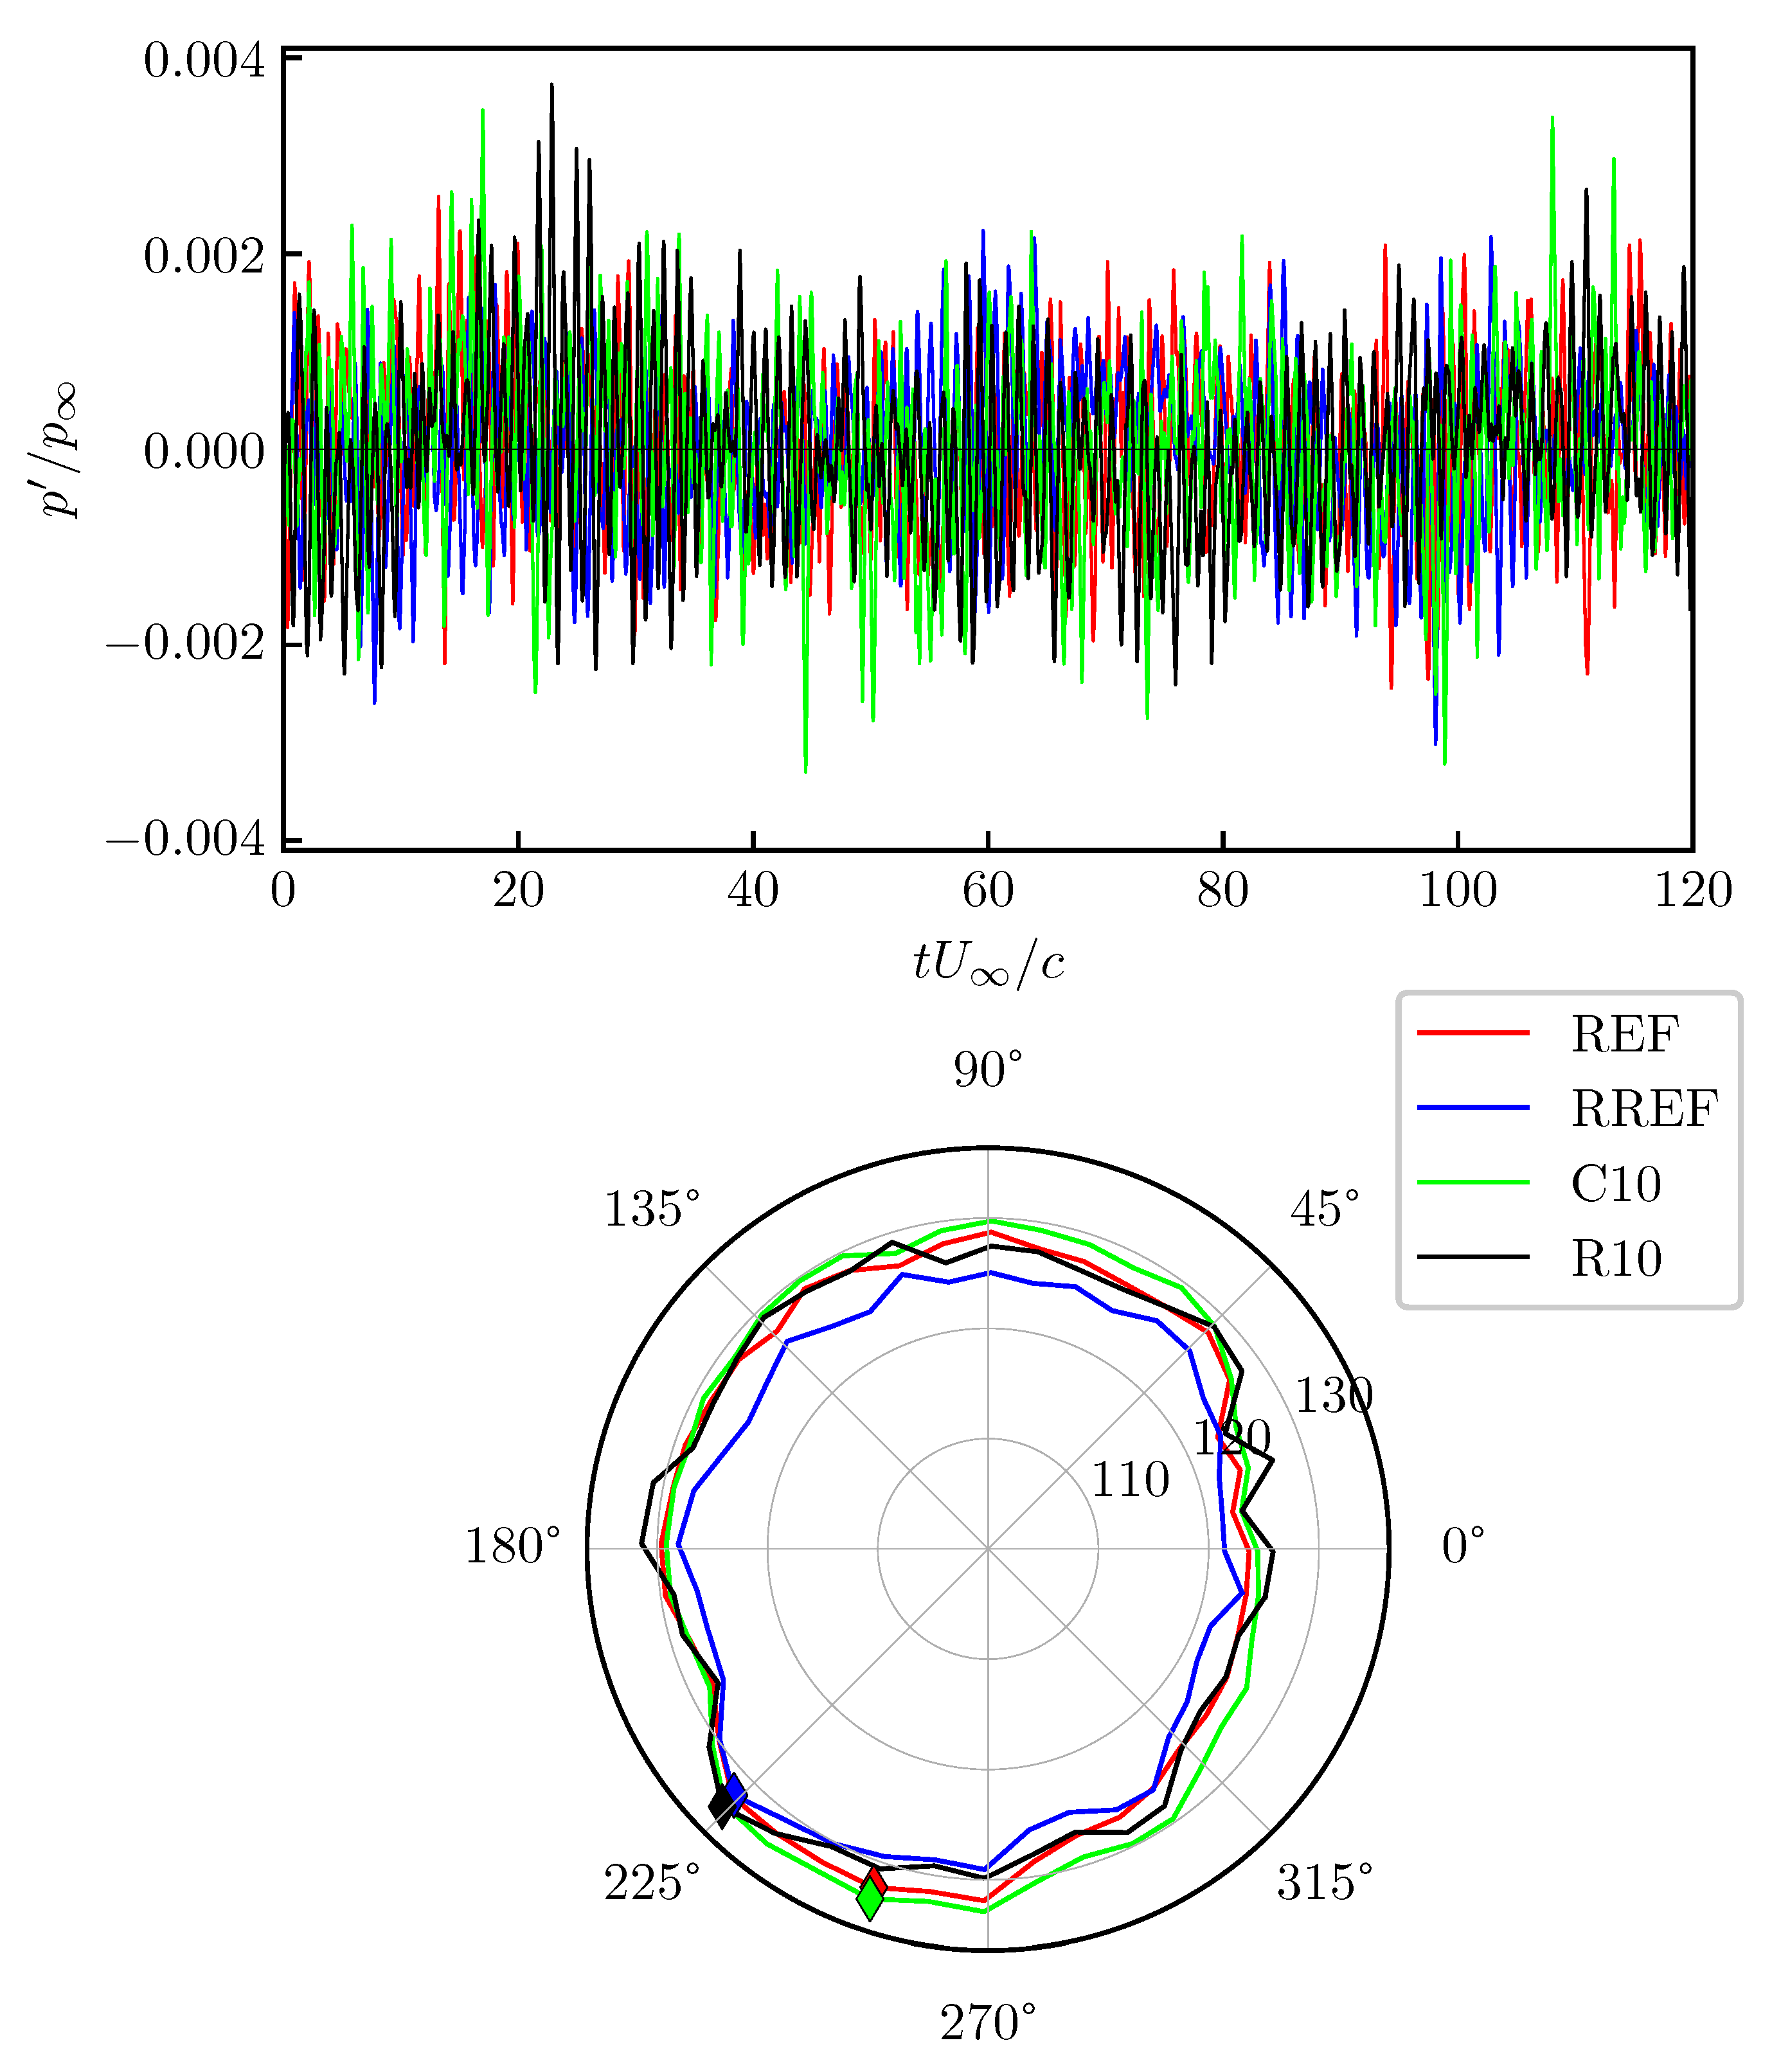
Figure 6 (upper panel) shows the time histories of the fluctuating part of the pressure signals for simulations REF, RREF, C10, and R10. The signals are extracted at the probes which detect the largest overall sound pressure level, namely θ 251 for cases REF and C10, and θ 224 for cases RREF and R10. Each signal is characterized by a wide range of low and high frequencies. For a quantitative analysis, the OASPLs at every azimuthal position are presented in the lower panel of Figure 6, comparing the four cases REF, RREF, C10, and R10. The latter pair feature StTWs with the same control parameters. On a global perspective, the largest OASPL values are found in simulation C10, while simulation RREF registers the weakest noise. The direction of the maximum OASPL is highlighted with a diamond on each curve: quite surprisingly, the largest intensity is not found at angles corresponding to the shock (i.e., θ 50 ), or located anywhere above the suction side of the wing. On the contrary, the direction of the maximum OASPL is in the diametrically opposite location, beneath the pressure side of the airfoil. This is probably due to the weak intensity of the shock (recall that M = 0.7 ), as well as to its limited excursion around its equilibrium position, which consequently does not generate intense acoustic waves. In all cases, the weakest OASPL is obtained downstream of the trailing edge ( θ 0 ). Other important information deduced from Figure 6 is that the minor change in the angle of attack between the two pairs of simulations is not visible in the directionality of the noise, since the shape of the directivity plots is essentially unchanged.
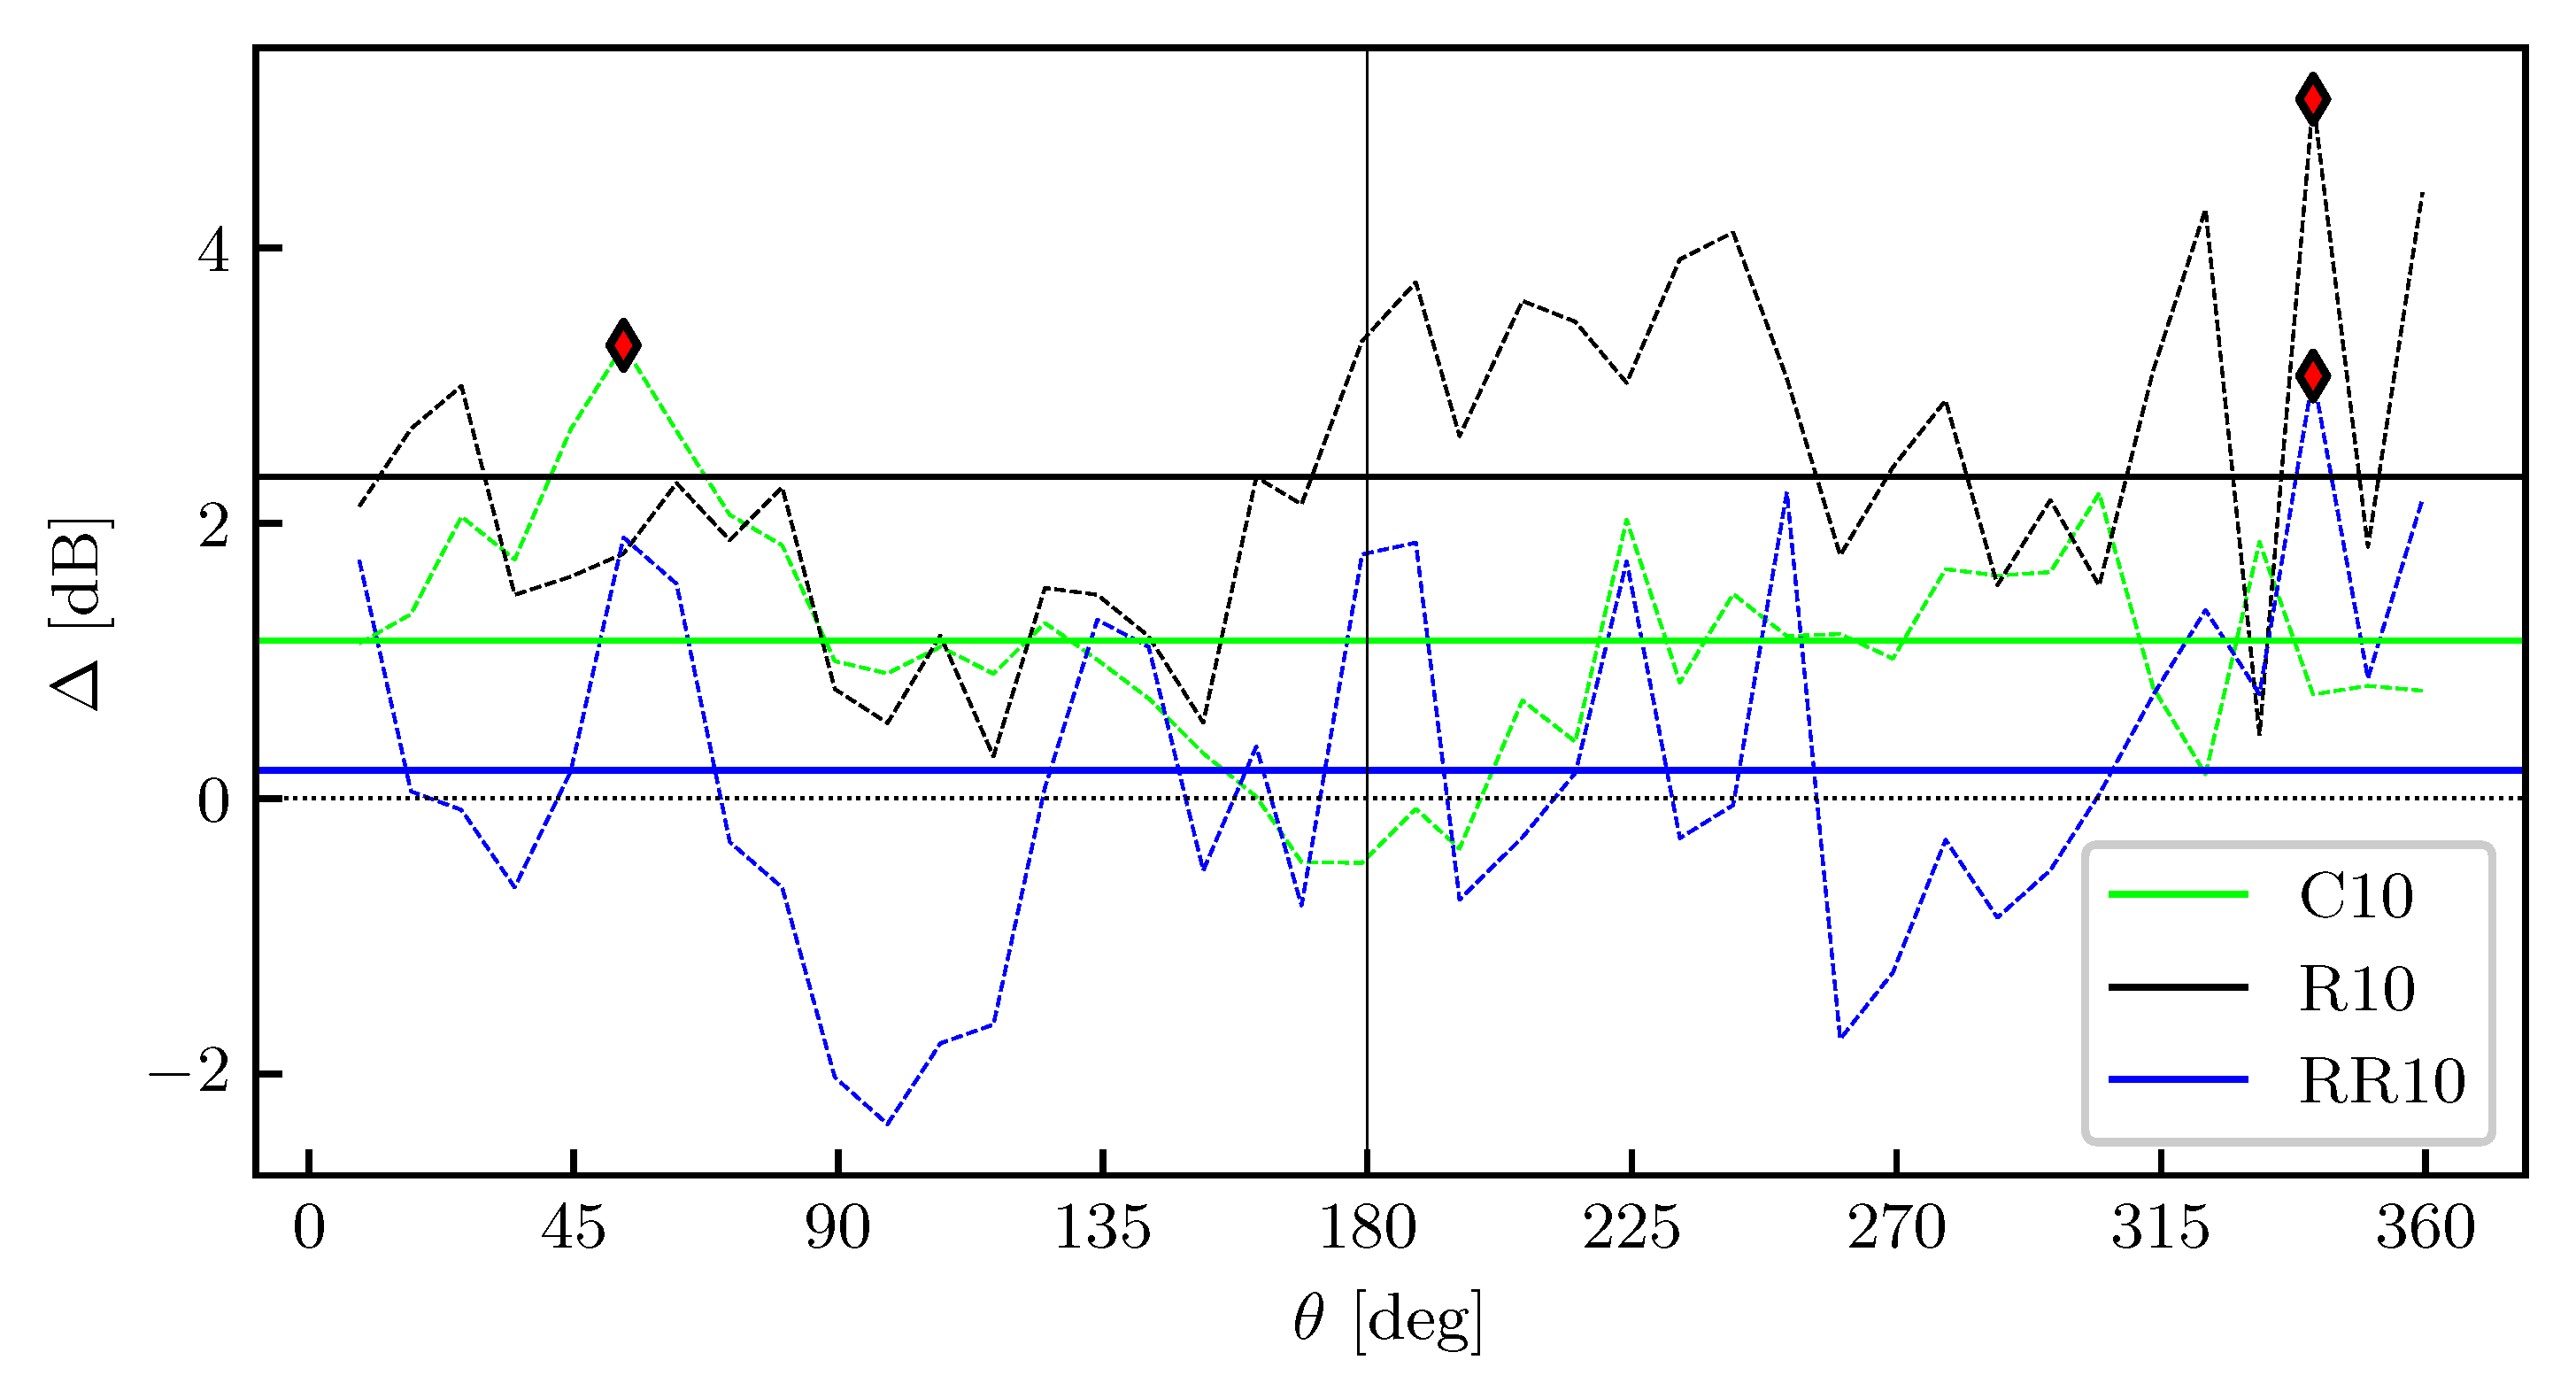
The variation Δ in the OASPL between the forced and the reference cases is now computed for each observer. Figure 7 presents the relative changes as a function of the position of the observer θ . The polar axis of Figure 6 has been switched to a Carthesian axis. The horizontal solid lines show the mean OASPL value averaged across all the azimuthal positions.
It is evident that, at least for the cases considered, controlling the flow via StTWs slightly increases the overall sound pressure level for almost every observer at both angles of attack, with changes that on average amount to a small 1–2 dB. The difference in noise intensity at α = 4 appears to be marginally higher above the suction side of the wing ( θ 0 ÷ 180 ). The largest OASPL increase was obtained in case R10, indicating that the noise increase is larger at the reduced incidence when the control is applied. This is due to the fact that, as shown above for the OASPL when discussing Figure 6, at α = 3 . 45 the uncontrolled simulation (RREF) features lower intensities than the corresponding case at α = 4 (REF), while the intensities of case R10 are similar to those computed in case C10.
However, one should bear in mind how StTWs should be employed in practical applications: the increase in wing lift should be exploited to reduce the angle of attack α of the aircraft, therefore achieving lower global aerodynamic drag to produce the required lift. The line marked as ‘RR10’ in Figure 7 is computed as the relative difference between the data of the controlled case at α = 3 . 45 (R10) and the reference case at α = 4 (REF). Hence, RR10 reflects the actual changes in the noise that would be detected in the practical scenario. This case presents its maximum increase in the OASPL for the probe located at θ 345 , and a comparable decrease at θ 90 . Overall, the azimuthal average of the OASPL changes for RR10 is essentially negligible. The reader, however, should be aware of the limitations of the numerical values presented in Figure 7. The temporal span of the computations, i.e., 120 c / U , is long enough to account for the intrinsic unsteadiness of the turbulent flow when computing acoustic metrics. The uncertainty on the values of the OASPL has been assessed with the algorithm described in Ref. [24], starting form the time histories of pressure fluctuations; it turns out that the OASPL uncertainty due to the finite averaging time is below 1 dB. Hence, while we cannot make a claim on the precise values of Δ , the qualitative information derived from Figure 7 is reliable and allows us to state that the main differences in the noise intensity are caused by the variation in the angle of attack, and not by the spanwise forcing itself.

4.2. Frequency Content

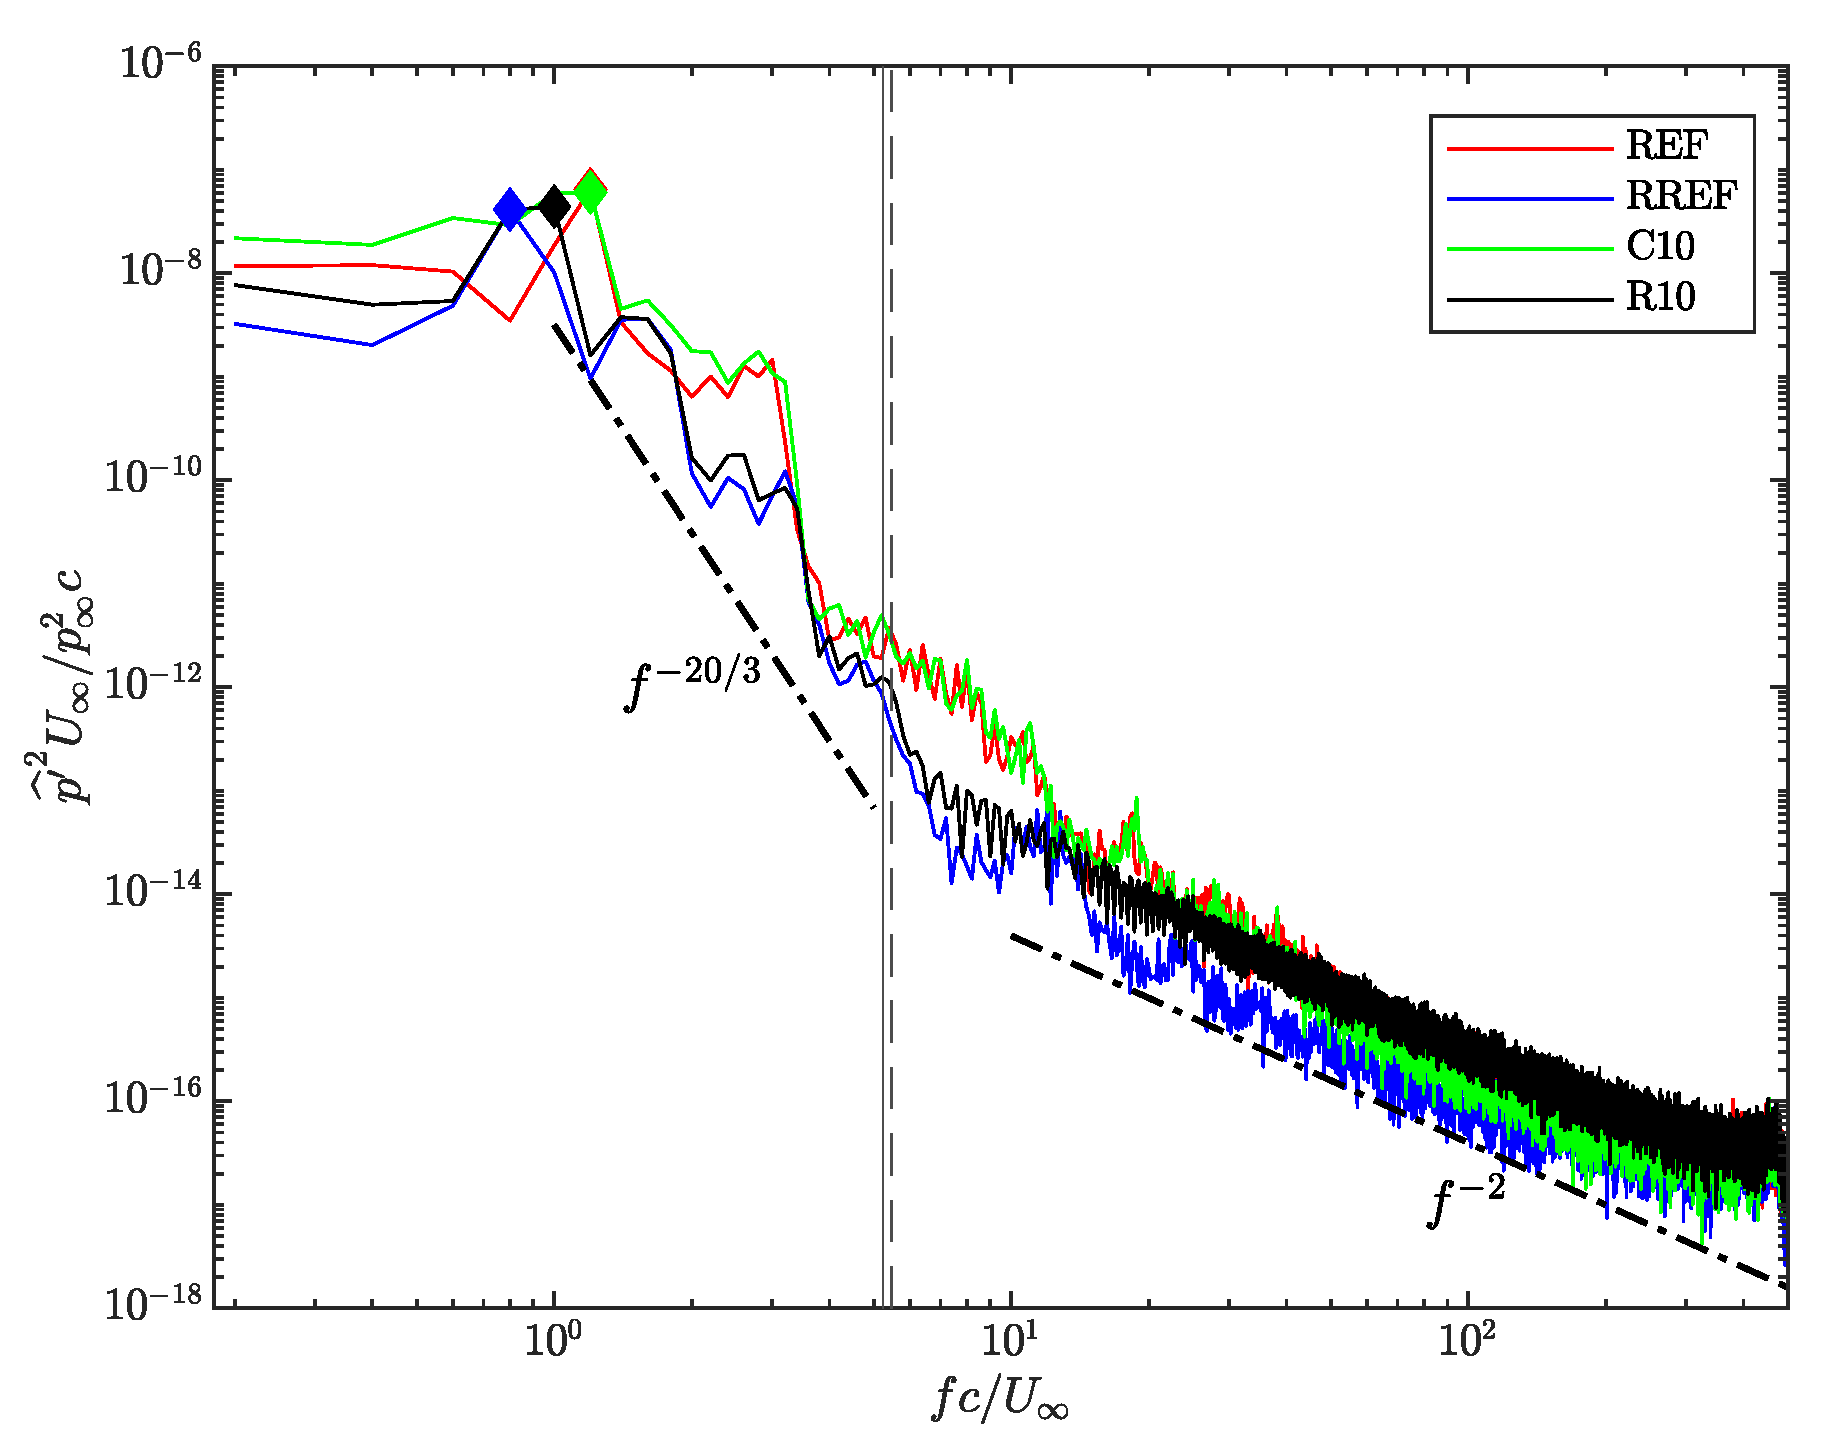
The OASPL analysis can be enhanced by studying the changes in the frequency content of the radiated noise. We computed the square p ^ 2 of the Fourier coefficients of the pressure signals, obtained through Welch’s method [26]. Figure 8 presents the pressure spectra for cases REF, RREF, C10, and R10. Specifically, the curves are computed starting from the pressure time histories measured by the probes corresponding to the largest overall sound pressure levels, whose angular position θ is indicated by the colored diamonds in Figure 6. The signals have been subdivided into partially overlapping windows with a time span of Δ T 5 c / U and 50% overlap; additionally, a Hanning window was applied to each segment. The Fourier transforms employed in the computation of the spectra were computed on each segment and then averaged together. The Nyquist frequency f N is constrained by the temporal time step of the simulation (hence f N = 1 / 2 Δ t 3.3 × 10 3 U / c ), while the frequency resolution is Δ f = 1 / Δ T 0.2 U / c .
Figure 8, with the logarithmic scaling that provides a balanced view on the whole range of frequencies, shows clearly that StTWs do not significantly alter the frequency content of noise. Despite the difference in the position of the observers ( θ 251 for simulations REF and C10, and θ 224 for simulations RREF and R10, see Figure 6), some analogies across the curves can be identified. In fact, all the spectra feature a rather large low-frequency content, while the Fourier coefficients for f > 3.5 U / c are drastically reduced. The angle of attack seems to be the most influential variable in terms of frequency content, too. In fact, when α = 4 , the frequency corresponding to the largest Fourier coefficient is fixed at f 1.2 U / c , while at α = 3 . 45 the peak shifts from f 1 U / c (case RREF) to f 0.8 U / c (case R10). In the intermediate frequency range f c / U 1 ÷ 5 , the spectra appear to collapse to a power-law dependence on the frequency of f 20 / 3 . At the highest frequencies, instead, the decay of the spectra is slower, and proportional to f 2 . Both power laws have been already observed, albeit in a different framework, by Grizzi and Camussi [27], who detected them in the spectrum of the pressure signals in the near-field around a subsonic jet flow. The theoretical background for these power laws was laid down by Arndt et al. [28], who derived them starting from the quadrupole solution to the spherical wave equation, coupled with the unsteady Bernoulli equation of the velocity potential in the irrotational part of the flow. They highlighted that the decays of the spectra with frequency descends either from the assumption of intertial subrange of the turbulent energy spectrum of the flow or from energy conservation, and denoted the f 20 / 3 and f 2 dependencies as ’near-field’ and ’far-field’ behavior, respectively. The reason for such nomenclatures lies in that p ^ 2 actually depends on the product of the frequency f and the distance from the sound source r: if the former is constant, the spectrum of the acoustic signals evolves either as r 20 / 3 or r 2 , depending on whether the probe is located in the near-field or in the far-field. Finally, Coiffet et al. [29] explained that the former power law is related to pressure fluctuations induced by large turbulent structures, while the latter is linked to the propagation of the weaker acoustic waves.
Two characteristics emerge in the comparison among the cases considered. In particular, significant differences in the energetic content of the signals are detected at f c / U 2 ÷ 3 and f c / U 4 ÷ 10 . We have considered whether these could be directly related to StTWs by comparing them with characteristic frequencies of this forcing. The temporal frequency of StTWs of cases C10 and R10 ( f = ω / 2 π 5.3 U / c ) is denoted in Figure 8 by the vertical black solid line. Additionally, it is explained in Ref. [5] how an ‘equivalent oscillation period’ T (and therefore frequency) can be defined for StTWs, derived from the relative velocity between the convecting coherent, near-wall turbulent structures, and the traveling wave of the forcing. In particular,
T = λ x U c U ϕ
where λ x = 2 π / κ x is the forcing wavelength, U c is the convective velocity of the turbulent structures in the near-wall region, which can be considered constant in viscous units [30] at 10 times the friction velocity u τ , and U ϕ = ω / κ x is the phase velocity of StTWs. In Figure 8, the ’equivalent frequency’ 1 / T nearly overlaps with the temporal frequency of StTWs, consistently with the small phase speed of the forward-traveling waves. The figure makes it quite clear that the presence of noise caused by, or directly related to StTWs, can be ruled out, as no peak is discernible at the two aforementioned forcing frequencies. The increase in p ^ 2 in the two ranges described above for cases REF and C10 cannot be attributed to the forcing, as the former simulation is uncontrolled. Therefore, differences in the spectra are arguably due to the difference in the angle of the attack.
Figure 9 plots the spectrum of the acoustic signal detected at the probe of the largest OASPL for the REF case (the same presented in Figure 8), and compares it with the spectrum computed for the time history of the signal expressing the instantaneous position of the shock wave, namely for the quantity x s ( t ) . The latter expresses the excursion of the instantaneous position x s ( t ) of the shock from its time-averaged position. Both quantities are computed with a fast Fourier transform algorithm using the time histories truncated at 120 c / U and modified with a Hanning window. The signal x s ( t ) was recorded during the simulation at the somewhat lower temporal resolution of 370 Δ t ; however, this only hampered the very high-frequency content of the transform. The important observation deduced from this figure is that the movement of the shock wave contains much smaller frequencies than those important for pressure fluctuations, suggesting that buffeting takes place at time scales separated enough from those significant for noise production. The frequency corresponding to the peak of the acoustic signal ( f 1.2 U / c , which identifies a tonal noise) is decoupled from the peak corresponding to the frequency of the movement of the shock wave ( f 0.01 U / c ). Hence, the most intense tonal noise observed is not caused by an oscillation of the shock wave.

5. Discussion

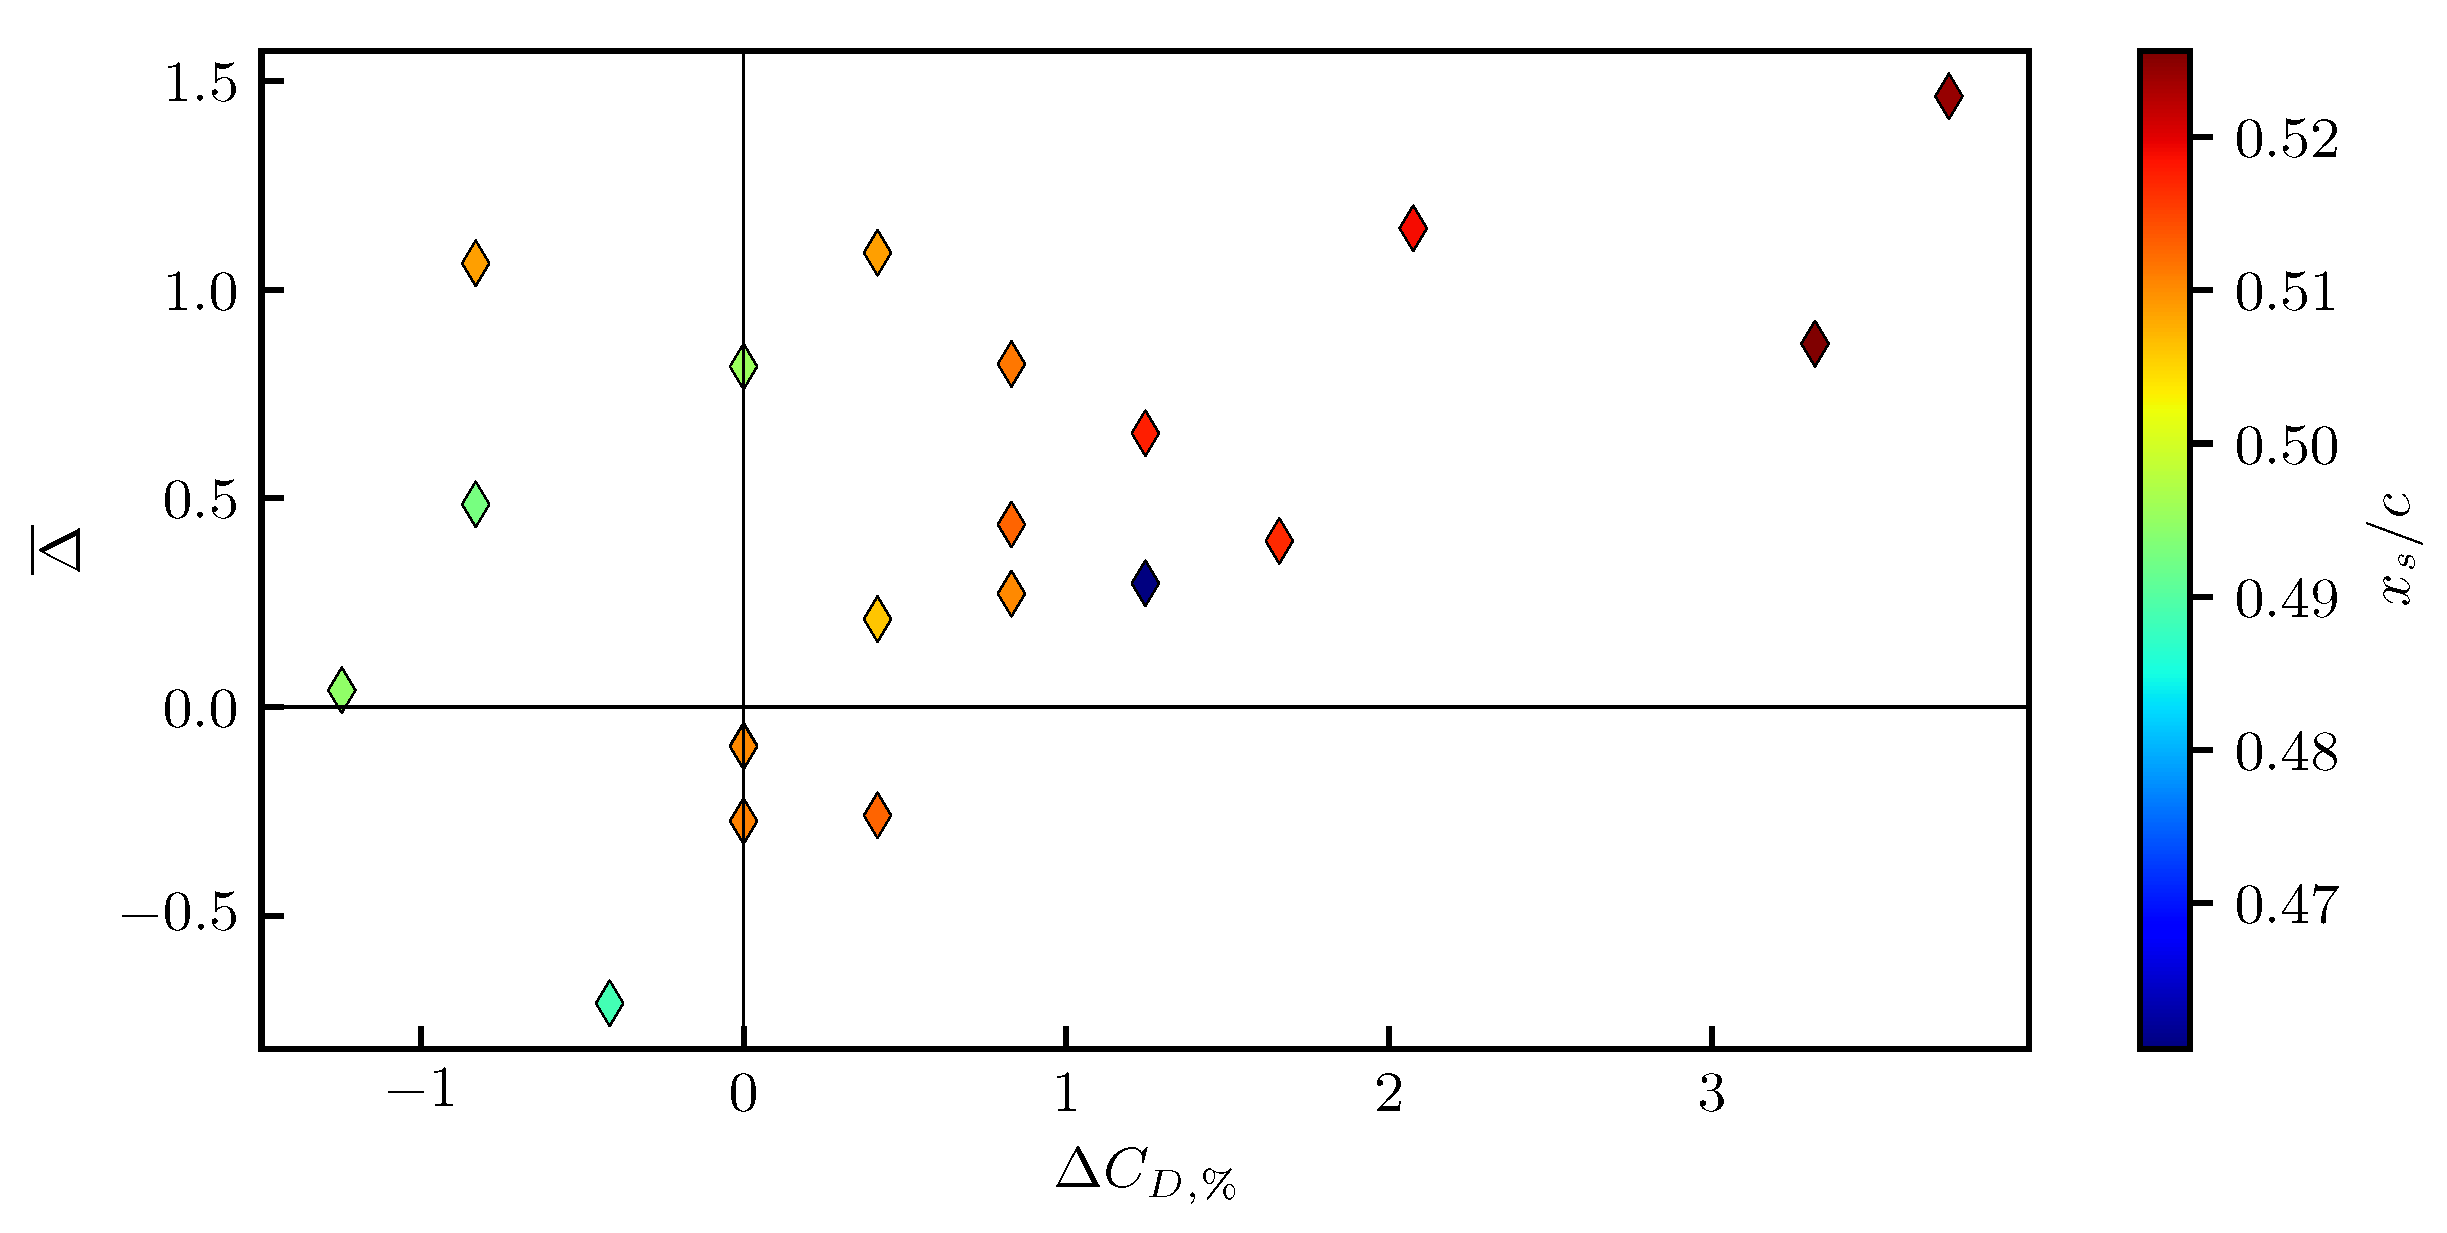
In this section, we connect the application of flow control via StTWs to the variation in noise intensity, previously discussed in Section 4. In particular, we consider the relationship between the changes Δ plotted in Figure 7 and the percentage increase in the lift and drag coefficients of the wing ( Δ C L , % and Δ C D , % , respectively) that derive from the activation of spanwise forcing.
We have also observed that mean, azimuthally averaged changes in OASPL Δ ¯ and the lift coefficient do not share a similar dependency on the control parameters. A quantitative link between OASPL and the drag coefficient, instead, is provided in Figure 10. Here, we compare the averaged change Δ ¯ of OASPL with the percentage change in the drag coefficient Δ C D , % for the simulations at constant forcing intensity A and angle of attach α , namely cases C1–C20. The figure shows that the larger is Δ C D , % , the larger is the mean increase in the overall sound pressure level, and vice versa. The mean position of the shock wave x s / c , which affects the lift and the drag coefficients [13], is color-coded in Figure 10. While the cases with the largest drag reduction also feature the most delayed shock, Figure 10 does not provide evidence for the existence of a clear relationship between x s and Δ ¯ . For instance, the data point corresponding to the largest Δ ¯ is the one featuring the largest x s , but the simulation with the lowest drag increase ( Δ C D , % = 1.3 % ) does not yield the most upstream shock. Hence, we conclude that the observed noise increase should be arguably related to the increase in the aerodynamic drag, and not to the displacement of the shock wave.
In Section 4.2, we have described the variations in the frequency content of the noise signal measured by a single specific observer. It is useful to verify whether or not those observations can be extended to probes in other azimuthal positions. Hence, we investigate the Fourier transforms for the acoustic signals of all observers in the reference uncontrolled case (REF), and in one controlled case at α = 4 (C10). Figure 11 represents at once the absolute value of the Fourier coefficients obtained from the data of all the probes in the REF case (left panel) and in case C10 (right panel). In each panel, the distance of a point from the center of the picture represents a fixed value of frequency (for instance, the radius of the red circle corresponds to the temporal frequency of the forcing in case C10). The angle identified by the position vector of a point in the plot and the horizontal axis, instead, represents the angular position θ of the probe. Since only 40 discrete probes are available, the values of this ‘directional’ Fourier transform between the probes have been azimuthally interpolated for the plot.
In the left panel, the largest values of the Fourier transform are found, as expected by the previous analysis of the OASPL presented in Section 4, in the direction opposite to the shock wave, i.e., at θ 225 . The distinct peaks at θ 225 and θ 270 could be the trace of tonal noise, probably generated at the trailing edge of the wing. In fact, the presence of a separation bubble in this region (previously mentioned in Section 3) is the necessary condition for the generation of tonal noise, as explained by Nash et al. [31]. Their experimental study considered subsonic flow at moderate values of the Reynolds number, with almost zero turbulence intensity: instabilities due to laminar–turbulent transition above the laminar separation bubble were the cause for tonal noise development. Indeed, the interaction between the upper and lower surface boundary layers at the trailing edge can produce either tonal noise (if one flow is turbulent and the other is transitional) or broadband noise (if both flows are turbulent) [32]. Pröbsting et al. [33] studied experimentally the self-noise of a NACA0012 airfoil with both tripped and non-tripped boundary layers. In particular, they studied the tonal noise as a function of the Reynolds number and the angle of attack. When tripping was applied on both sides, they observed a drastic reduction in the tonal component, which becomes negligible for R e > 10 5 at α = 4 . Hence, since the current study involves a numerical tripping on both sides of the airfoil (see Section 2), the source of such tonal component is unclear. We hypothesize that either an instability in the separated trailing edge, pressure-side shear layer, or an additional fixed-frequency vortex shedding in the wake might explain the observed presence of tonal noise; other factors which may play a role are the asymmetric geometry of the V2C airfoil (as opposed to the symmetric NACA0012 profile), as well as the presence of the shock wave above the suction side. However, in Section 4 we have ruled out a connection between tonal noise observed at θ 225 and buffeting, since the frequencies corresponding to the two peaks of the Fourier transforms are separated (see Figure 9).
Broadband noise is perceived at θ 225 (i.e., in the region of the maximum OASPL, see Figure 6). This kind of noise, generated by turbulence, characterizes four symmetric ‘branches’ at θ 45 , θ 135 , and θ 315 , together with the already mentioned θ 225 . Indeed, turbulence is probably the reason why most of the high-frequency contributions are perceived by the observers located at the angles θ 135 ÷ 135 : these, in fact, are the regions facing the turbulent boundary layers (downstream of the numerical tripping) and the wake. On the contrary, negligible contributions are perceived in front of the leading edge, where the incoming airflow is in fact laminar (see Section 2). It should be remembered that, at this relatively low value of R e , the required artificial boundary layer tripping is quite large, and can therefore generate some noise by itself. For example, the two symmetric branches observed in front of the leading edge at θ = 135 and θ = 215 could be ascribable to the body force employed for tripping the boundary layer. Tonal noise due to tripping, however, can be ruled out, because of the random nature of the body force ([23]).
In the controlled C10 case, shown in the right panel of Figure 11, the largest Fourier coefficients are detected in the direction opposite to the shock, albeit weak scattered spots appear above the suction side at θ 60 and θ 130 . On the pressure side, the peak at θ 225 previously observed is slightly intensified, whereas a reduction in the frequency content at θ 270 is observed. Finally, the broadband noise in the aforementioned branches at θ 135 , θ 225 , and θ 315 is slightly intensified; this is also reflected in the higher OASPL values perceived at the same angles (see Figure 6). It is worth highlighting that the scale of these differences is tiny. Once again, the presence of tonal noise specifically related to the forcing can be ruled out, since the Fourier coefficients at the frequency corresponding to StTWs in cases C10 and R10 ( f = 5.3 c / U ) are negligible.
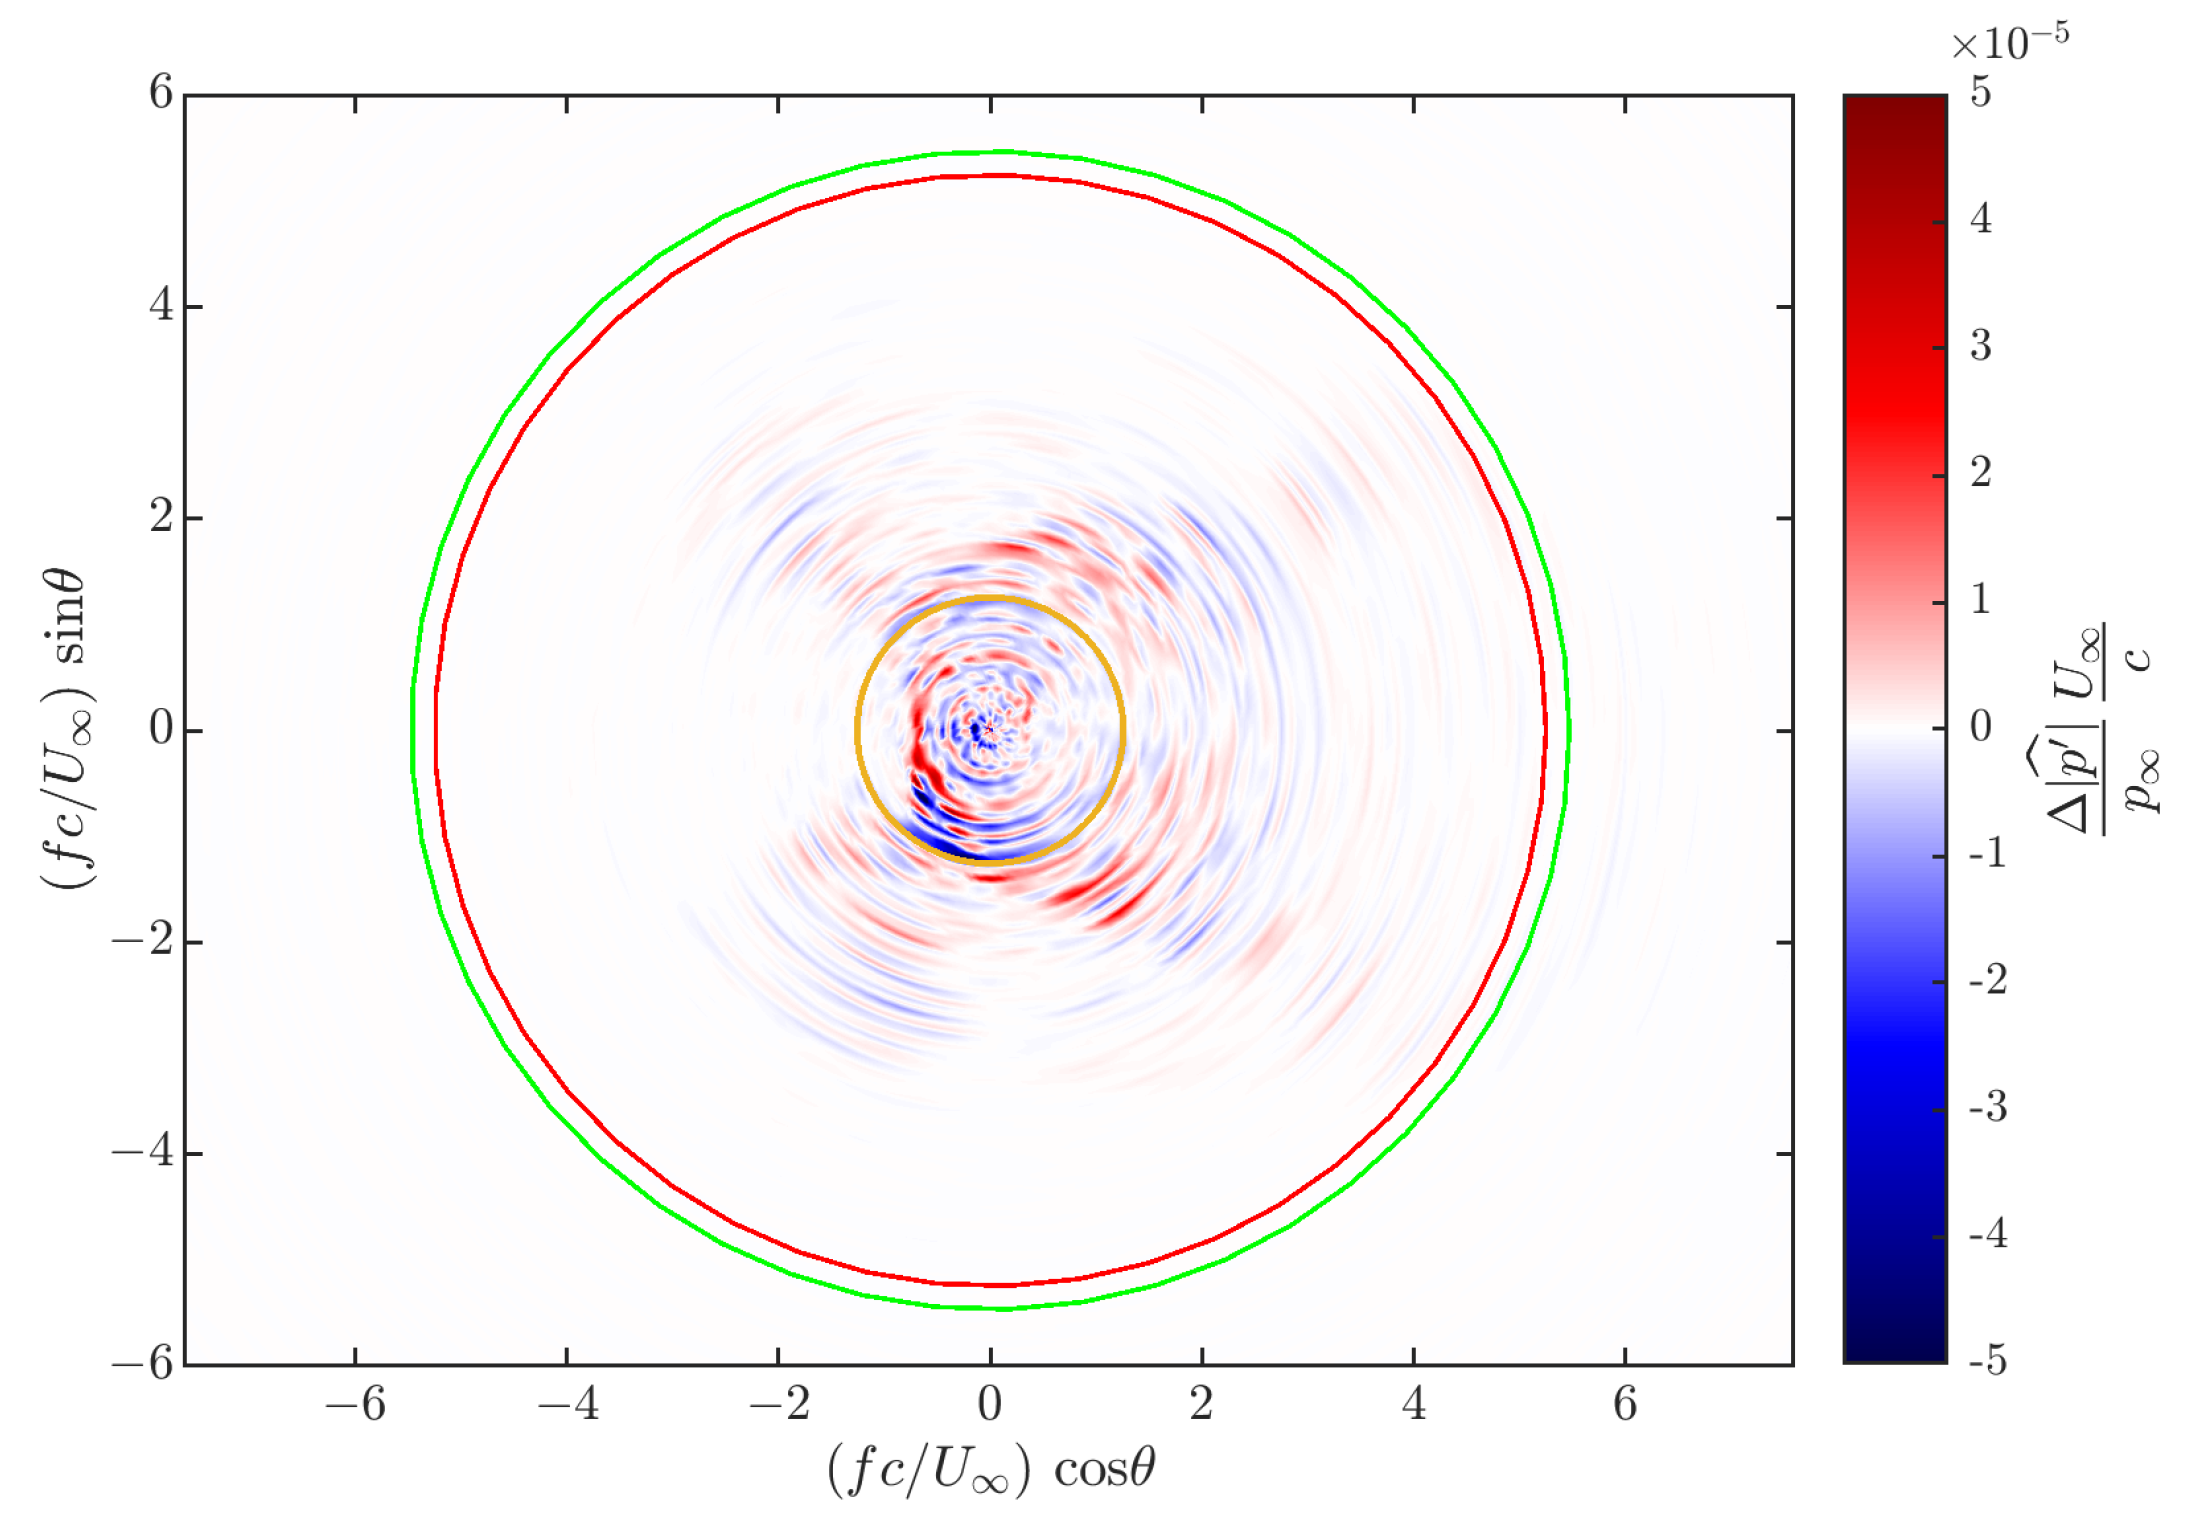
In view of the importance of applying StTWs at the reduced incidence to obtain the lift of the uncontrolled wing with less drag, we also compute the directional Fourier transform for the controlled R10 simulation, in which α = 3 . 45 while the control parameters match those of case C10. We plot in Figure 12 the difference between the magnitudes of the Fourier coefficients between cases R10 and REF (labeled as Δ | p ^ | / p ), with the same rationale behind curve RREF of Figure 7 in Section 4. The largest effects are observed at low frequencies, as above f 3 U / c the two transforms are basically identical regardless of θ . In terms of directions, the probes located upstream of the leading edge detect little to no difference in the frequency content of noise. In fact, the larger effects are observed on symmetric branches at θ 45 , θ 135 , θ 225 , and θ 315 . This pattern resembles indeed what was previously described in Figure 7 for the curve RR10. Furthermore, we note a general reduction in the low-frequency content below the pressure side of the wing ( θ 225 ÷ 315 ), which could be the cause of the lower OASPL values depicted in Figure 6 in the same region. Finally, we wish to remark that the values of Δ | p ^ | induced by StTWs, combined with those caused by the reduction in the angle of attack, are tiny from the point of view of the frequency content, too.
In conclusion, this preliminary near-field analysis has determined only a slight intensification of the aeroacoustics noise when StTWs are employed on a transonic wing slab to reduce drag. The frequency content of noise is minimally altered, too. Once the angle of attack of the wing is reduced to take into account the increased lift due to the forcing and to actually achieve drag reduction, both the noise intensification and the modification of its frequency content become negligible.

6. Conclusions

In this paper, we have extended the analysis recently carried out in Ref. [13], where it was studied how spanwise forcing for turbulent skin-friction drag reduction (StTW) affects the transonic flow field surrounding a supercritical wing slab with a shock wave above the suction side. The dataset considered in this work derives from the previous study; here, we describe the near-field modifications in terms of wake characteristics and radiated sound. This work represents the first of its kind, as to our knowledge no study of the interaction between spanwise forcing for skin-friction reduction and the aeroacoustic field has been published so far.
We have shown that, when flows with and without control are compared at the same angle of attack, spanwise forcing results into a small downwards displacement of the wake, as a consequence of the increased lift. On the contrary, when the control parameters of StTWs were such that skin-friction drag was actually increased, lift was diminished, and the flow velocity in the wake was further reduced. However, the percentage variation in the velocity component parallel to the free stream in the wake was quite limited, and was never found to exceed 2%. We have also shown that StTWs, which are applied on the suction side only, do bear a minimal influence on the flow on the pressure side of the airfoil, mediated by the downward displacement of the wake: in fact, when lift is increased, the small recirculation bubble that is naturally present beneath the wing becomes slightly enlarged, due to the stronger adverse pressure gradient experienced by the flow.
This paper has presented the first assessment of the acoustic effects of spanwise forcing implemented via StTWs, in terms of the near-field acoustic signals extracted from a number of equally spaced probes placed on a circumference of radius 5 c centered on the profile. We have shown that, for cases at a constant angle of attack, noise is slightly increased at almost all angular positions as an effect of the forcing. The direction in which the largest sound intensity is perceived, which does not match the direction of the shock wave, is not altered by the application of control, and depends instead on the flow incidence only. However, in this application, StTWs are meant as a strategy to reduce the aerodynamic drag through an increase in aerodynamic efficiency of the wing. Therefore, one should compare with the flow at the reduced angle of attack that restores the original lift. When the comparison with/without StTWs is carried out at constant lift, the noise perceived by all probes is, on average, unaltered. The frequency spectrum of the pressure fluctuations is not particularly affected by the presence of this type of flow control technology. In fact, both the spectrum of the probe detecting the largest sound intensity and the directional Fourier transforms show but minimal alterations after the forcing is applied. The available evidence thus indicates that no negative interaction takes place between spanwise forcing and the aeroacoustics of the wing.
This work only constitutes a preliminary study, and its results are limited. Work is ongoing to employ more advanced tools such as wavelets transforms and spatial correlations of the pressure signals in order to analyze changes in the acoustic signature around the profile. Furthermore, we are planning to investigate modifications to the far-field aeroacoustic noise. Changes away from the profile, indeed, may differ from the variation in the near-field acoustics. We also plan to consider the wall-pressure signature, which could be more sensitive to changes in the boundary conditions with respect to near-field (or far-field) acoustic signals. Finally, the possibility that StTWs could be employed as a means to alter the noise generated by the turbulent flow cannot be ruled out, provided the combination of parameters is properly tuned towards a goal that is different from turbulent skin-friction drag reduction.

Author Contributions

Conceptualization, D.G., M.Q., and S.P.; methodology, D.G. and S.P.; software, N.B., G.S., and S.P.; validation, N.B.; investigation, N.B. and D.G.; resources, D.G.; data curation, N.B.; writing—original draft preparation, N.B. and M.Q.; writing—review and editing, N.B., D.G., G.S., S.P., and M.Q.; supervision, M.Q.; project administration, M.Q. All authors have read and agreed to the published version of the manuscript.

Funding

This research received no external funding.

Data Availability Statement

The data presented in this study are available on request from the corresponding author.

Acknowledgments

All the simulations were performed on the Hawk Cluster in Stuttgart, Baden–Württemberg, Germany. N.B. would like to thank Riccardo Bertoncello for discussions on the directionality of the Fourier coefficients.

Conflicts of Interest

The authors declare no conflicts of interest.

References

  1. Gad-el-Hak, M. Flow Control—Passive, Active and Reactive Flow Management; Cambridge University Press: Cambridge, UK, 2000. [Google Scholar]
  2. Bechert, D.; Bruse, M.; Hage, W.; Hoeven, J.V.D.; Hoppe, G. Experiments on Drag-Reducing Surfaces and Their Optimization with an Adjustable Geometry. J. Fluid Mech. 1997, 338, 59–87. [Google Scholar] [CrossRef]
  3. Cacciatori, L.; Brignoli, C.; Mele, B.; Gattere, F.; Monti, C.; Quadrio, M. Drag Reduction by Riblets on a Commercial UAV. Appl. Sci. 2022, 12, 5070. [Google Scholar] [CrossRef]
  4. Ricco, P.; Skote, M.; Leschziner, M.A. A Review of Turbulent Skin-Friction Drag Reduction by near-Wall Transverse Forcing. Prog. Aerosp. Sci. 2021, 123, 100713. [Google Scholar] [CrossRef]
  5. Quadrio, M.; Ricco, P.; Viotti, C. Streamwise-Traveling Waves of Spanwise Wall Velocity for Turbulent Drag Reduction. J. Fluid Mech. 2009, 627, 161–178. [Google Scholar] [CrossRef]
  6. Auteri, F.; Baron, A.; Belan, M.; Campanardi, G.; Quadrio, M. Experimental Assessment of Drag Reduction by Traveling Waves in a Turbulent Pipe Flow. Phys. Fluids 2010, 22, 115103. [Google Scholar] [CrossRef]
  7. Marusic, I.; Chandran, D.; Rouhi, A.; Fu, M.; Wine, D.; Holloway, B.; Chung, D.; Smits, A. An Energy-Efficient Pathway to Turbulent Drag Reduction. Nat. Commun. 2021, 12, 5805. [Google Scholar] [CrossRef]
  8. Knoop, M.; Hartog, F.; Schrijer, F.; van Campenhout, O.; van Nesselrooij, M.; van Oudheusden, B. Experimental Assessment of Square-Wave Spatial Spanwise Forcing of a Turbulent Boundary Layer. Exp Fluids 2024, 65, 65. [Google Scholar] [CrossRef]
  9. Gallorini, E.; Quadrio, M. Spatial Discretization Effects in Spanwise Forcing for Turbulent Drag Reduction. J. Fluid Mech. 2024, 982, A11. [Google Scholar] [CrossRef]
  10. Gatti, D.; Quadrio, M. Reynolds-Number Dependence of Turbulent Skin-Friction Drag Reduction Induced by Spanwise Forcing. J. Fluid Mech. 2016, 802, 553–558. [Google Scholar] [CrossRef]
  11. Gattere, F.; Zanolini, M.; Gatti, D.; Bernardini, M.; Quadrio, M. Turbulent Drag Reduction with Streamwise-Travelling Waves in the Compressible Regime. J. Fluid Mech. 2024, 987, A30. [Google Scholar] [CrossRef]
  12. Quadrio, M.; Chiarini, A.; Banchetti, J.; Gatti, D.; Memmolo, A.; Pirozzoli, S. Drag Reduction on a Transonic Airfoil. J. Fluid. Mech. 2022, 942, R2. [Google Scholar] [CrossRef]
  13. Berizzi, N.; Gatti, D.; Soldati, G.; Pirozzoli, S.; Quadrio, M. Direct Numerical Simulations of the Transonic Flow over an Airfoil with Spanwise Forcing for Drag Reduction. In Proceedings of the European Drag Reduction and Flow Control Meeting—EDRFCM 2024, Turin, Italy, 10–13 September 2024. [Google Scholar]
  14. Zhang, C.; Xiong, X.; Chen, G.; Li, X.; Wang, J.; Wang, H. Numerical Study on Passive Flow and Noise Control for Flow Past Cylinder by Porous Media Coatings. Phys. Fluids 2024, 36, 095115. [Google Scholar] [CrossRef]
  15. Alva, E.; Yuan, Z.; Araújo, T.B.; do Amaral, F.R.; Hanifi, A.; Cavalieri, A.V.G. Airfoil Tonal Noise Reduction by Roughness Elements Part I—Experimental Investigation. arXiv 2024, arXiv:2410.05134. [Google Scholar]
  16. Yuan, Z.; Alva, E.; de Araújo, T.B.; Cavalieri, A.V.G.; Hanifi, A. Airfoil Tonal Noise Reduction by Roughness Elements. Part II—Direct Simulations. arXiv 2024, arXiv:2410.05129. [Google Scholar]
  17. Szőke, M.; Fiscaletti, D.; Azarpeyvand, M. Influence of Boundary Layer Flow Suction on Trailing Edge Noise Generation. J. Sound Vib. 2020, 475, 115276. [Google Scholar] [CrossRef]
  18. Al-Sadawi, L.; Chong, T.; Kim, J. Aerodynamic Noise Reduction by Plasma Actuators for a Flat Plate with Blunt Trailing Edge. J. Sound Vib. 2019, 439, 173–193. [Google Scholar] [CrossRef]
  19. Muhammad, C.; Chong, T. Mitigation of Turbulent Noise Sources by Riblets. J. Sound Vib. 2022, 541, 117302. [Google Scholar] [CrossRef]
  20. Memmolo, A.; Bernardini, M.; Pirozzoli, S. Scrutiny of Buffet Mechanisms in Transonic Flow. Int. J. Numer. Methods Fluids 2018, 28, 1031–1046. [Google Scholar] [CrossRef]
  21. Pirozzoli, S. Numerical Methods for High-Speed Flows. Annu. Rev. Fluid Mech. 2011, 43, 163–194. [Google Scholar] [CrossRef]
  22. Ducros, F.; Ferrand, V.; Nicoud, F.; Weber, C.; Darracq, D.; Gacherieu, C.; Poinsot, T. Large-Eddy Simulation of the Shock/Turbulence Interaction. J. Comp. Phys. 1999, 152, 517–549. [Google Scholar] [CrossRef]
  23. Schlatter, P.; Örlü, R. Turbulent Boundary Layers at Moderate Reynolds Numbers: Inflow Length and Tripping Effects. J. Fluid Mech. 2012, 710, 5–34. [Google Scholar] [CrossRef]
  24. Russo, S.; Luchini, P. A Fast Algorithm for the Estimation of Statistical Error in DNS (or Experimental) Time Averages. J. Comput. Phys. 2017, 347, 328–340. [Google Scholar] [CrossRef]
  25. Yudhistira, I.; Skote, M. Direct Numerical Simulation of a Turbulent Boundary Layer over an Oscillating Wall. J. Turbulence 2011, 12, N9. [Google Scholar] [CrossRef]
  26. Welch, P. The Use of Fast Fourier Transform for the Estimation of Power Spectra: A Method Based on Time Averaging over Short, Modified Periodograms. IEEE Trans. Audio Electroacoust. 1967, 15, 70–73. [Google Scholar] [CrossRef]
  27. Grizzi, S.; Camussi, R. Wavelet Analysis of Near-Field Pressure Fluctuations Generated by a Subsonic Jet. J. Fluid Mech. 2012, 698, 93–124. [Google Scholar] [CrossRef]
  28. Arndt, R.E.A.; Long, D.F.; Glauser, M.N. The Proper Orthogonal Decomposition of Pressure Fluctuations Surrounding a Turbulent Jet. J. Fluid Mech. 1997, 340, 1–33. [Google Scholar] [CrossRef]
  29. Coiffet, F.; Jordan, P.; Delville, J.; Gervais, Y.; Ricaud, F. Coherent Structures in Subsonic Jets: A Quasi-Irrotational Source Mechanism? Int. J. Aeroac. 2006, 5, 67–89. [Google Scholar] [CrossRef]
  30. Quadrio, M.; Luchini, P. Integral Time-Space Scales in Turbulent Wall Flows. Phys. Fluids 2003, 15, 2219–2227. [Google Scholar] [CrossRef]
  31. Nash, E.C.; Lowson, M.V.; McAlpine, A. Boundary-Layer Instability Noise on Aerofoils. J. Fluid Mech. 1999, 382, 27–61. [Google Scholar] [CrossRef]
  32. Gageik, M.; Klioutchnikov, I.; Olivier, H. Comprehensive Mesh Study for a Direct Numerical Simulation of the Transonic Flow at Rec = 500,000 around a NACA 0012 Airfoil. Comput. Fluids 2015, 122, 153–164. [Google Scholar] [CrossRef]
  33. Pröbsting, S.; Scarano, F.; Morris, S.C. Regimes of Tonal Noise on an Airfoil at Moderate Reynolds Number. J. Fluid Mech. 2015, 780, 407–438. [Google Scholar] [CrossRef]
Figure 1. Control parameters of the simulations at constant A = 0.684 U . The white symbols highlight two cases discussed in the present work: the diamond denotes case C10 (large skin-friction reduction), and the dot denotes case C12 (skin-friction increase). The underlying colormap is the skin-friction reduction rate Δ C f , % obtained from the dataset by [10], i.e., incompressible turbulent channel flow.
Applsci 15 00814 g001
Figure 2. Position of the probes employed for extracting the pressure fluctuations. θ represents the angle of the observer.
Applsci 15 00814 g002
Figure 3. Instantaneous fluctuating pressure distribution around the wing in a x y plane, for the reference uncontrolled simulation. The white contour identifies the sonic line with M = 1 , while the red line positioned in the wake is where the wake velocity profile is extracted (see text).
Applsci 15 00814 g003
Figure 4. Trailing-edge detail of the mean pressure coefficient (upper panel), its x-derivative (central panel), and friction coefficient on the pressure side of the wing. Data from simulations REF, C10, and C12.
Applsci 15 00814 g004
Figure 5. The velocity profile in the wake for a subset of ten cases within simulations C1–C20. The left panel portrays the free-stream-parallel velocity component u t on the segment illustrated in Figure 3, with the black line denoting the unmanipulated flow. The right panel depicts the percentage variation in the velocity profile with respect to the reference case. Lines are colored according to the increase in lift Δ C L , % .
Applsci 15 00814 g005
Figure 6. Upper panel: temporal history of the pressure fluctuations, recorded at the position of the largest OASPL. Lower panel: the OASPL (expressed in decibels on the radial axis) of simulations REF, RREF, C10, and R10, as a function of the angular position of the observer θ (expressed in degrees in the azimuthal direction). The colored diamond on each line represents the azimuthal position of the maximum OASPL.
Applsci 15 00814 g006
Figure 7. Variation Δ of the OASPL with respect to the REF case, as a function of the angular position of the observer θ : cases at α = 4 (C10) and α = 3 . 45 (R10). RR10 portraits changes in the OASPL between REF and R10. The horizontal solid lines mark the azimuthally averaged value, and the diamonds represent the local maxima.
Applsci 15 00814 g007
Figure 8. Energy spectrum of the acoustic signals measured at the azimuthal location of the largest OASPL (visible in Figure 6), for simulations REF, RREF, C10, and R10. The colored diamonds mark the peak value of the spectrum. The vertical solid line denotes the temporal frequency of StTWs in cases C10 and R10, while the (nearly overlapping) vertical dashed line denotes the ‘equivalent frequency’ (see text) of the forcing.
Applsci 15 00814 g008
Figure 9. Spectra of the pressure fluctuations (case REF) extracted at the location of the highest OASPL (left y-axis), and of the displacement of the shock wave around its time-averaged location (right y-axis). The two colored diamonds denote the peak of the relative spectrum.
Applsci 15 00814 g009
Figure 10. Comparison between the azimuthally averaged change Δ ¯ in the OASPL and the drag coefficient increase Δ C D , % . Data points are colored according to the position of the shock wave x s / c . The dataset includes the simulations at constant forcing amplitude (cases C1–C20); note that two points overlap.
Applsci 15 00814 g010
Figure 11. Magnitude of the Fourier coefficients | p ^ | of the REF (left) and C10 (right) cases, as a function of the frequency (radial coordinate) and the azimuthal position of the probe. The three circles denote the peak frequency of the REF case (yellow), and the ‘equivalent’ and temporal frequencies of StTW (green and red, respectively).
Applsci 15 00814 g011
Figure 12. Difference between the absolute values of the Fourier coefficients of the controlled simulation at α = 3 . 45 (R10) and the uncontrolled simulation at α = 4 (REF). The three circles denote the same frequencies described in Figure 11.
Applsci 15 00814 g012
Disclaimer/Publisher’s Note: The statements, opinions and data contained in all publications are solely those of the individual author(s) and contributor(s) and not of MDPI and/or the editor(s). MDPI and/or the editor(s) disclaim responsibility for any injury to people or property resulting from any ideas, methods, instructions or products referred to in the content.