
A Seismic Landslide Hazard Assessment in Small Areas Based on Multilevel Physical and Mechanical Parameters: A Case Study of the Upper Yangzi River

Abstract
1. Introduction
2. Study Area and Geological Setting
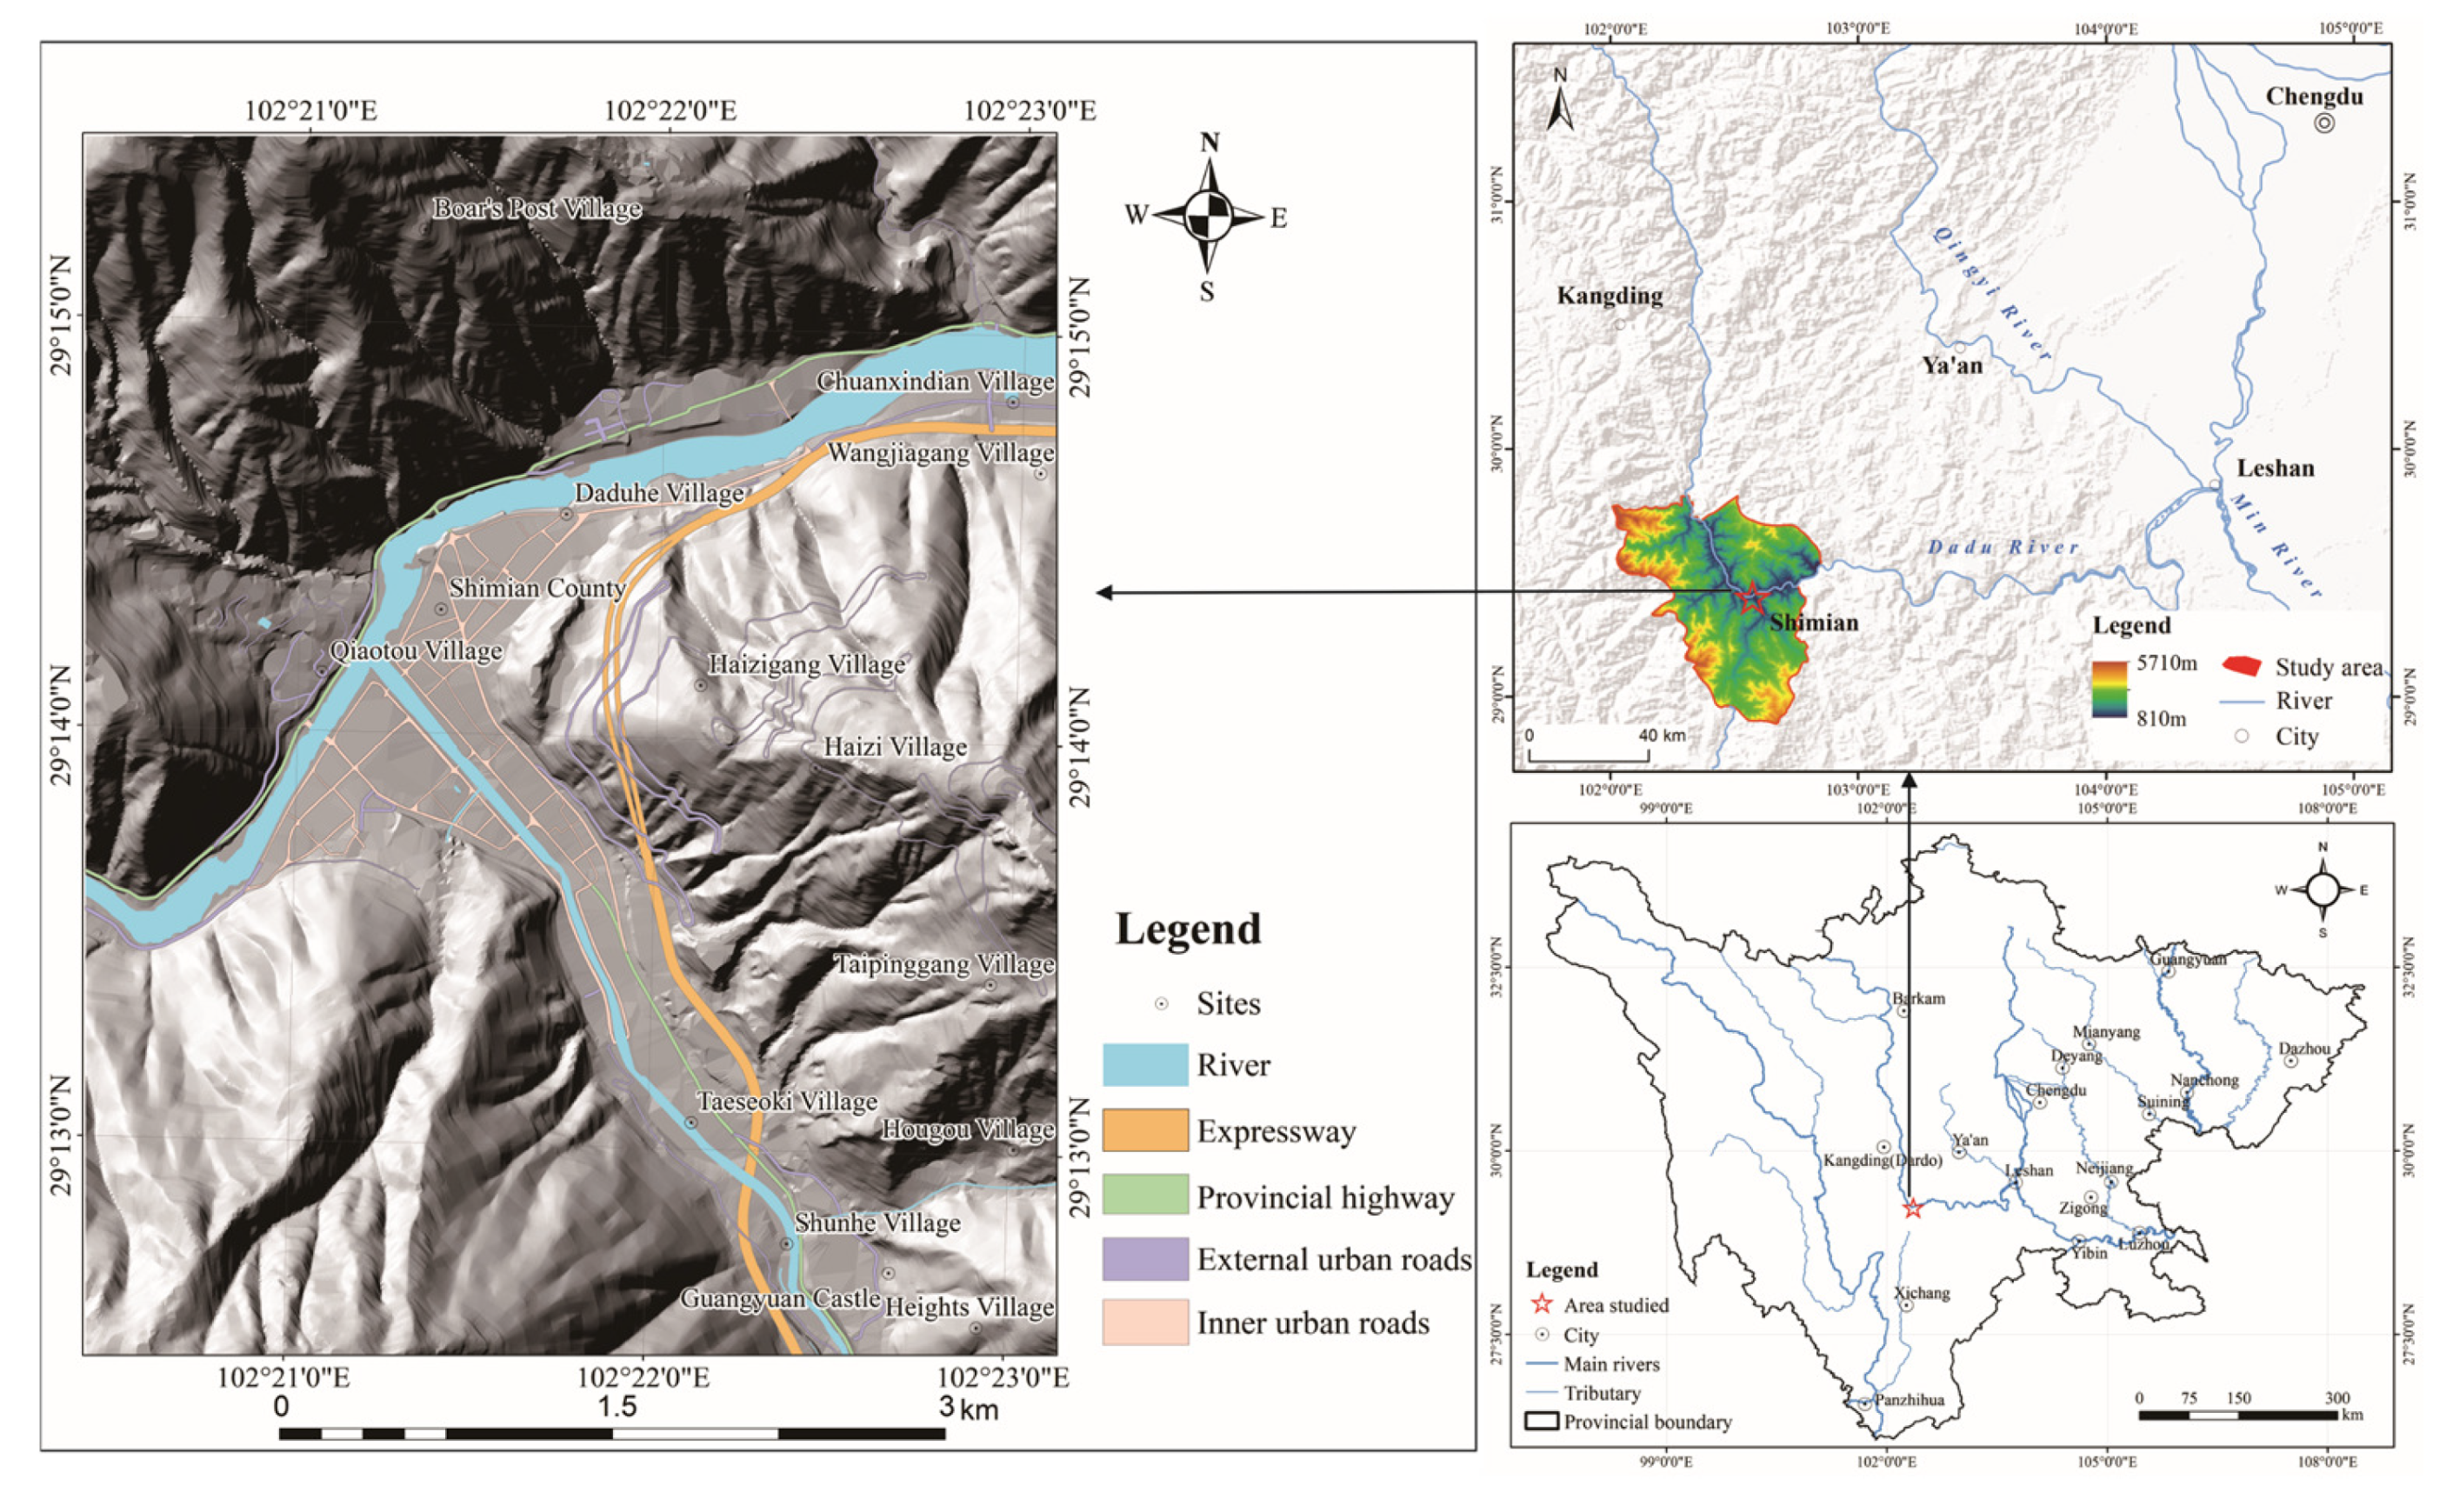
2.1. Geographical Location
2.2. Geological Conditions
3. Materials and Methods
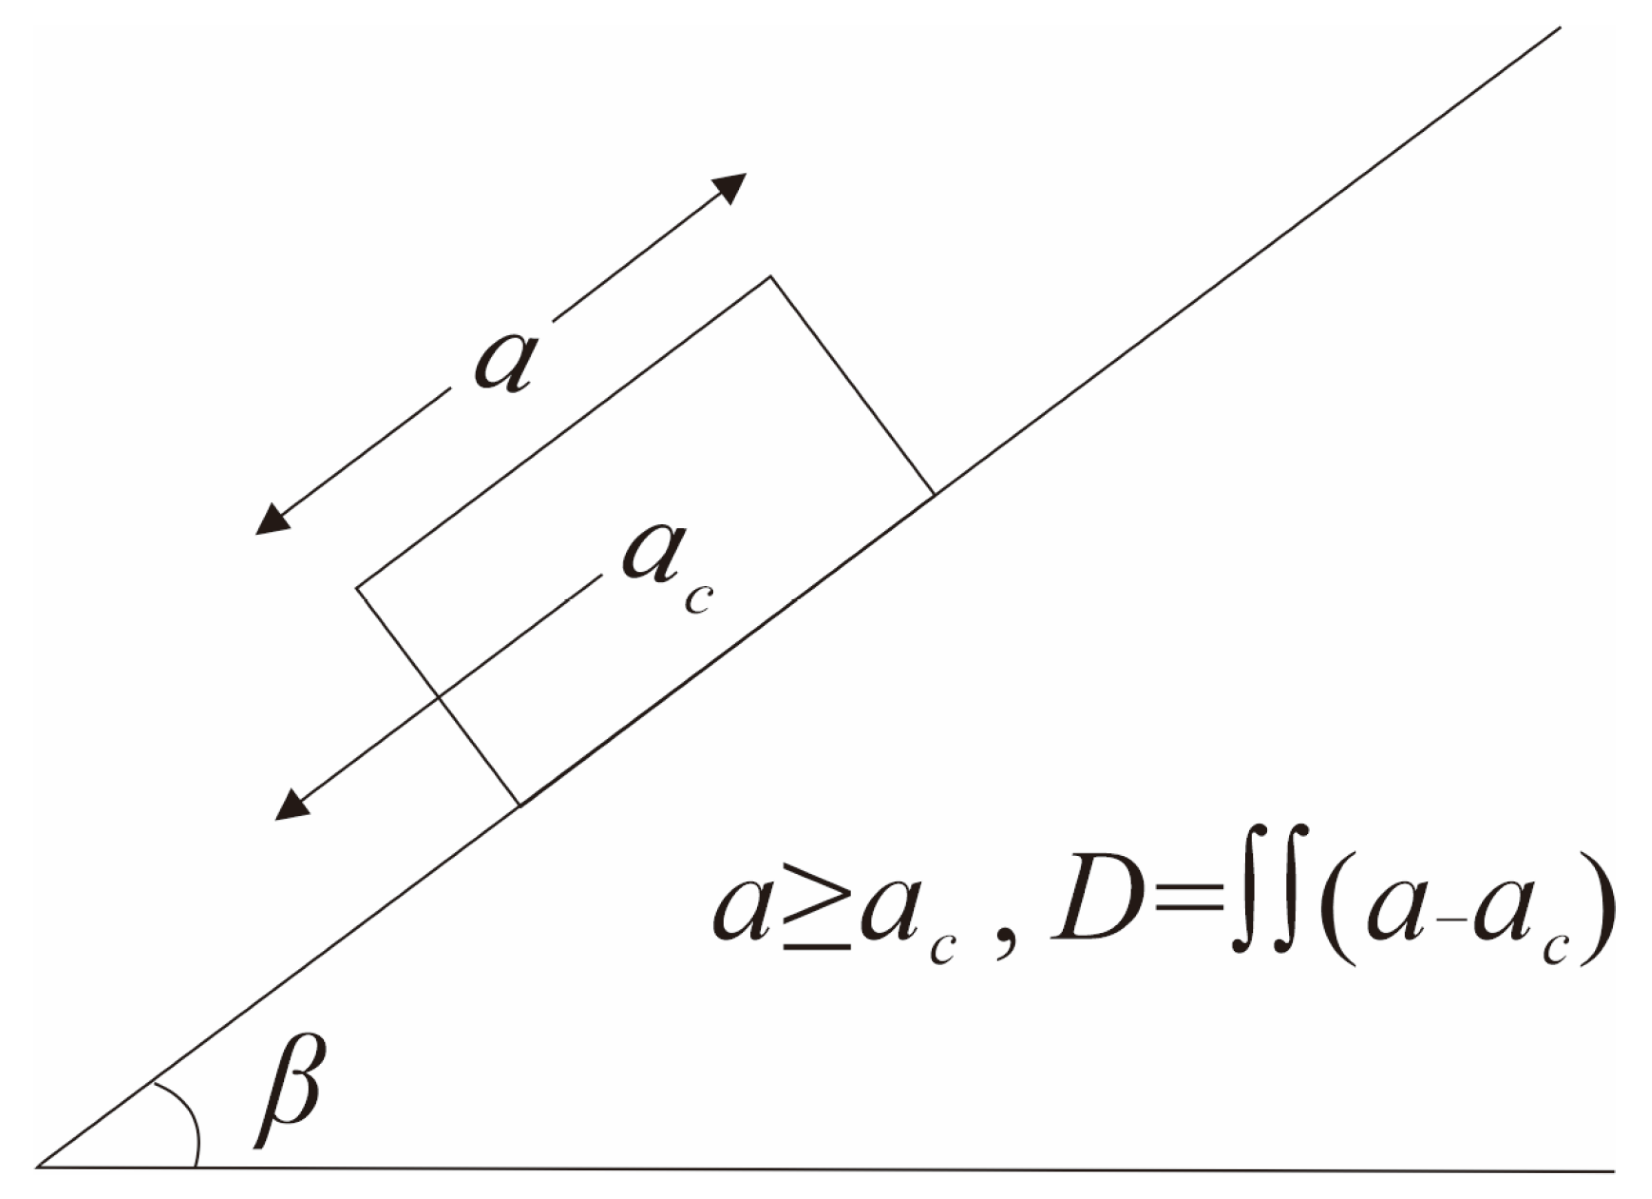
3.1. Newmark Displacement Model
- (1)
- Calculate the simplified critical acceleration (ac)
- (2)
- Calculate the displacement (D)
3.2. Modified Model
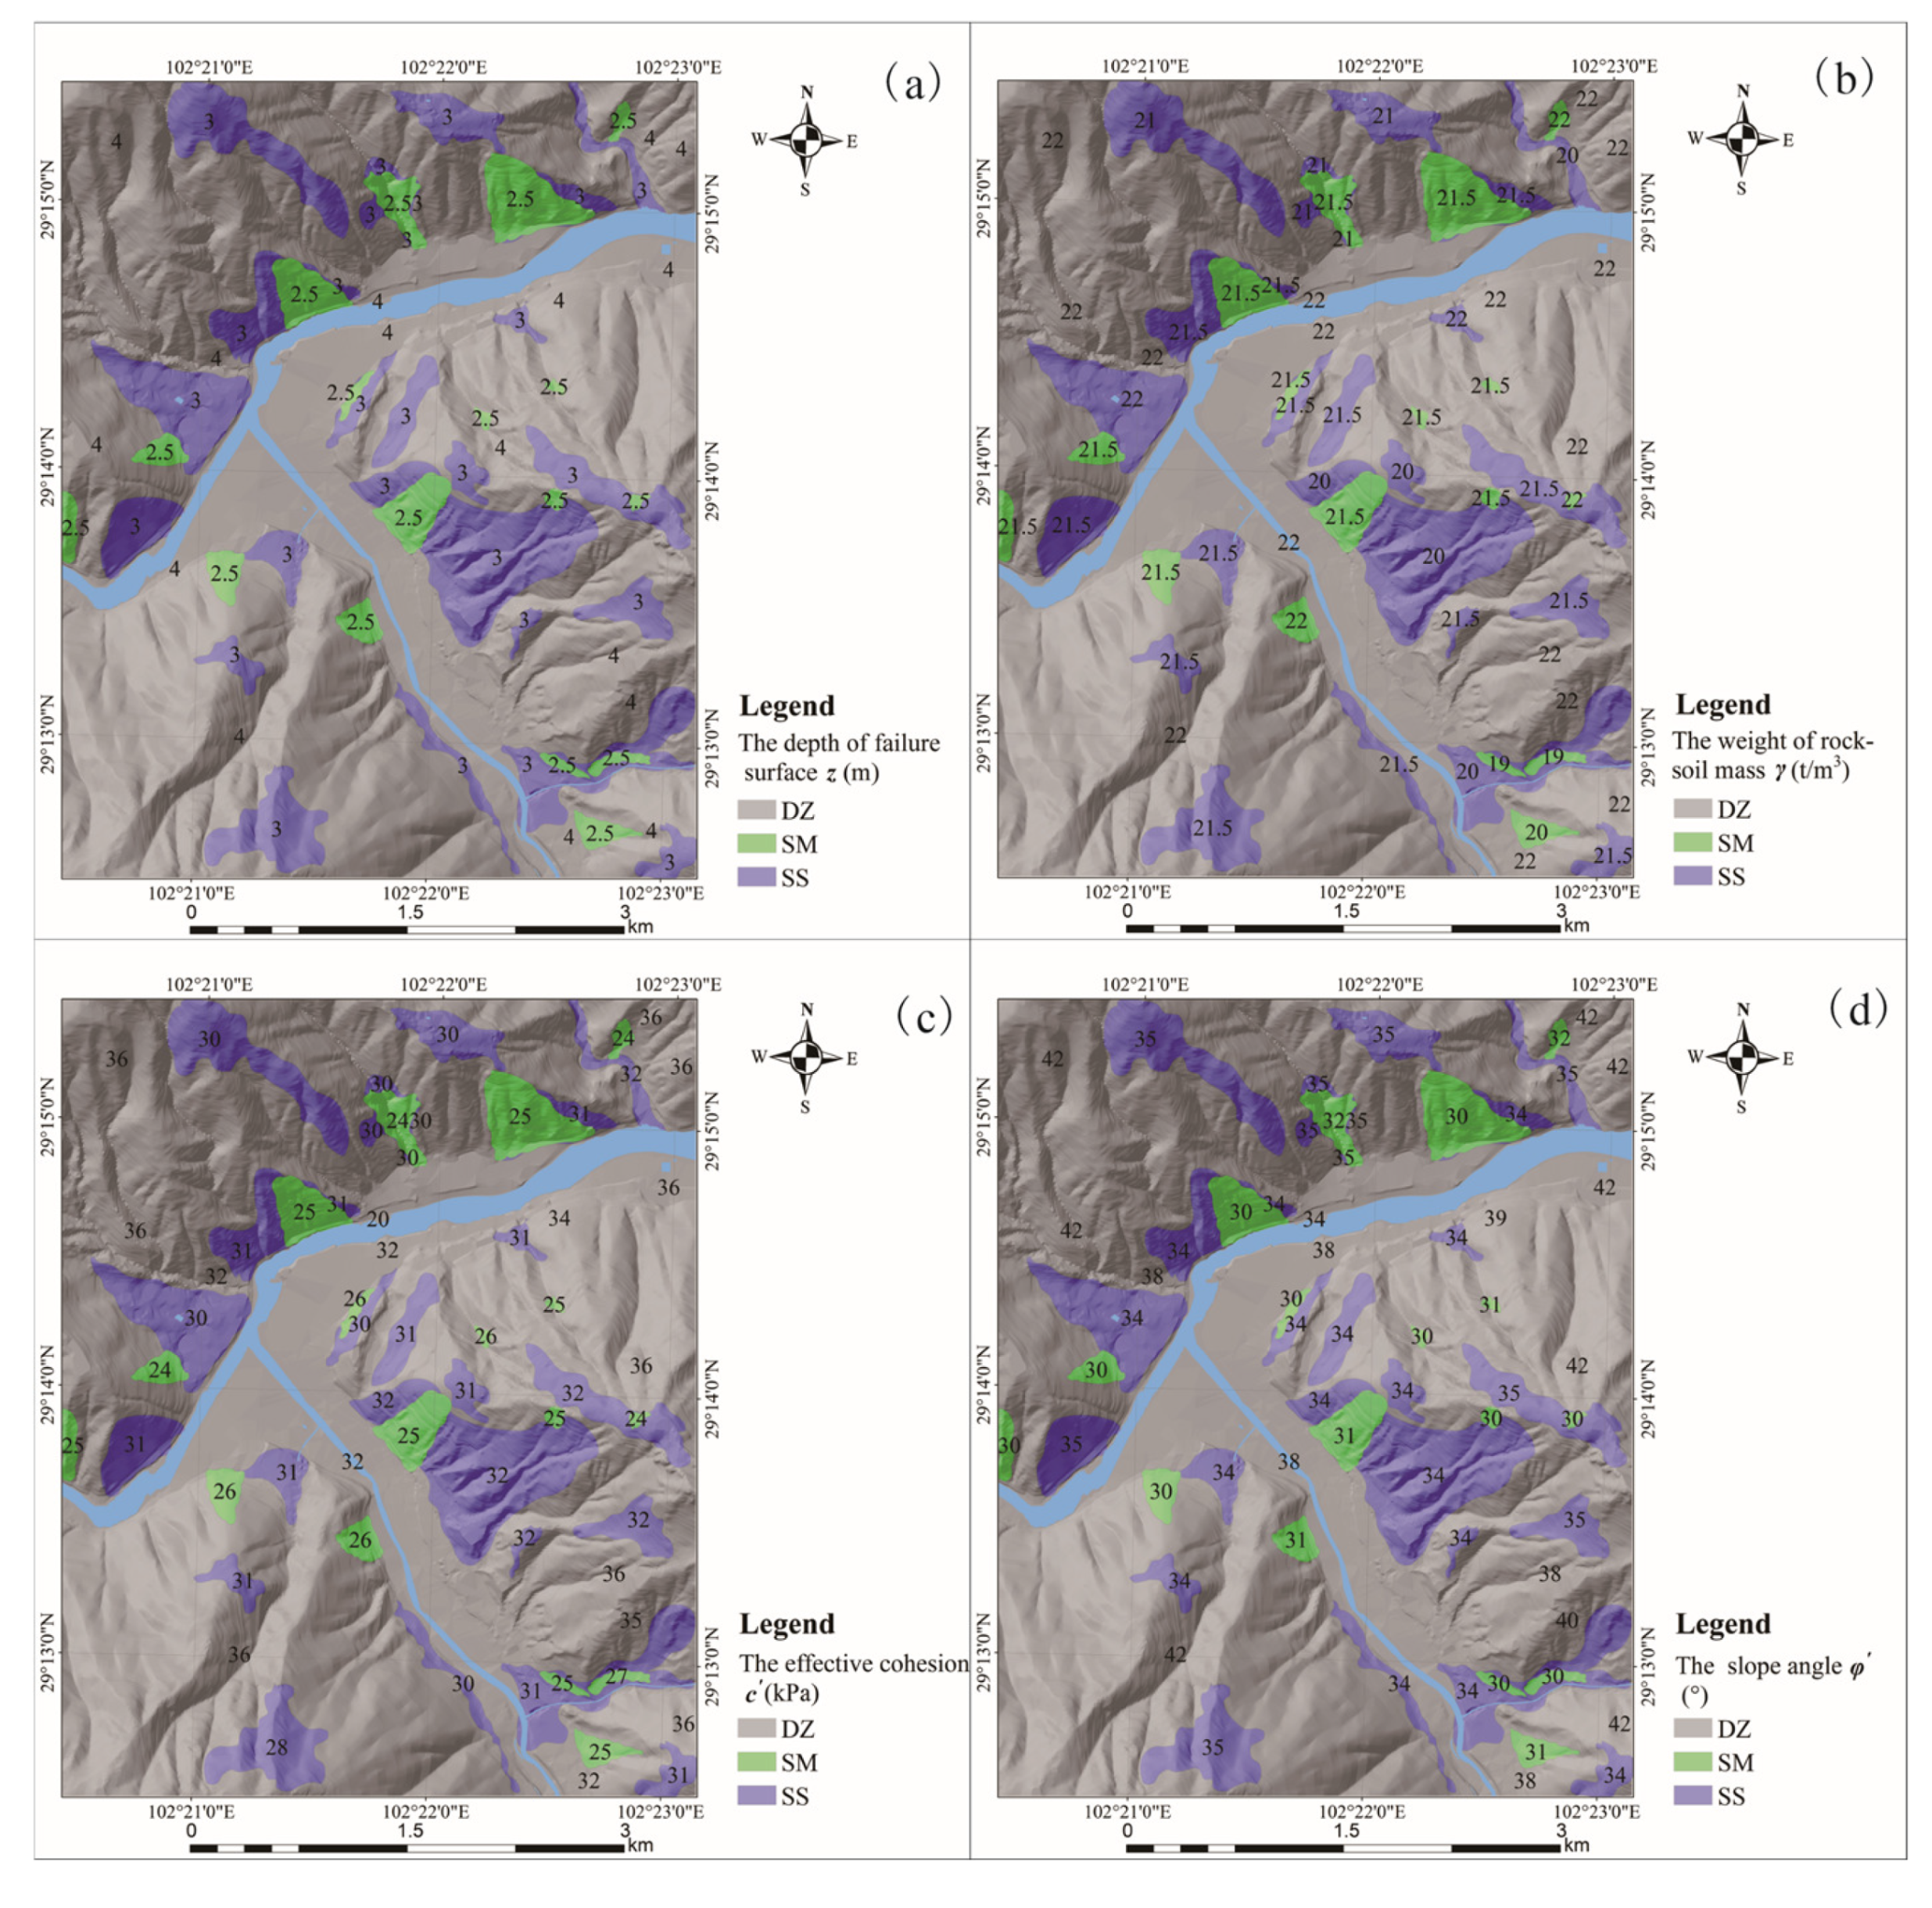
3.3. Physical and Mechanical Parameter System
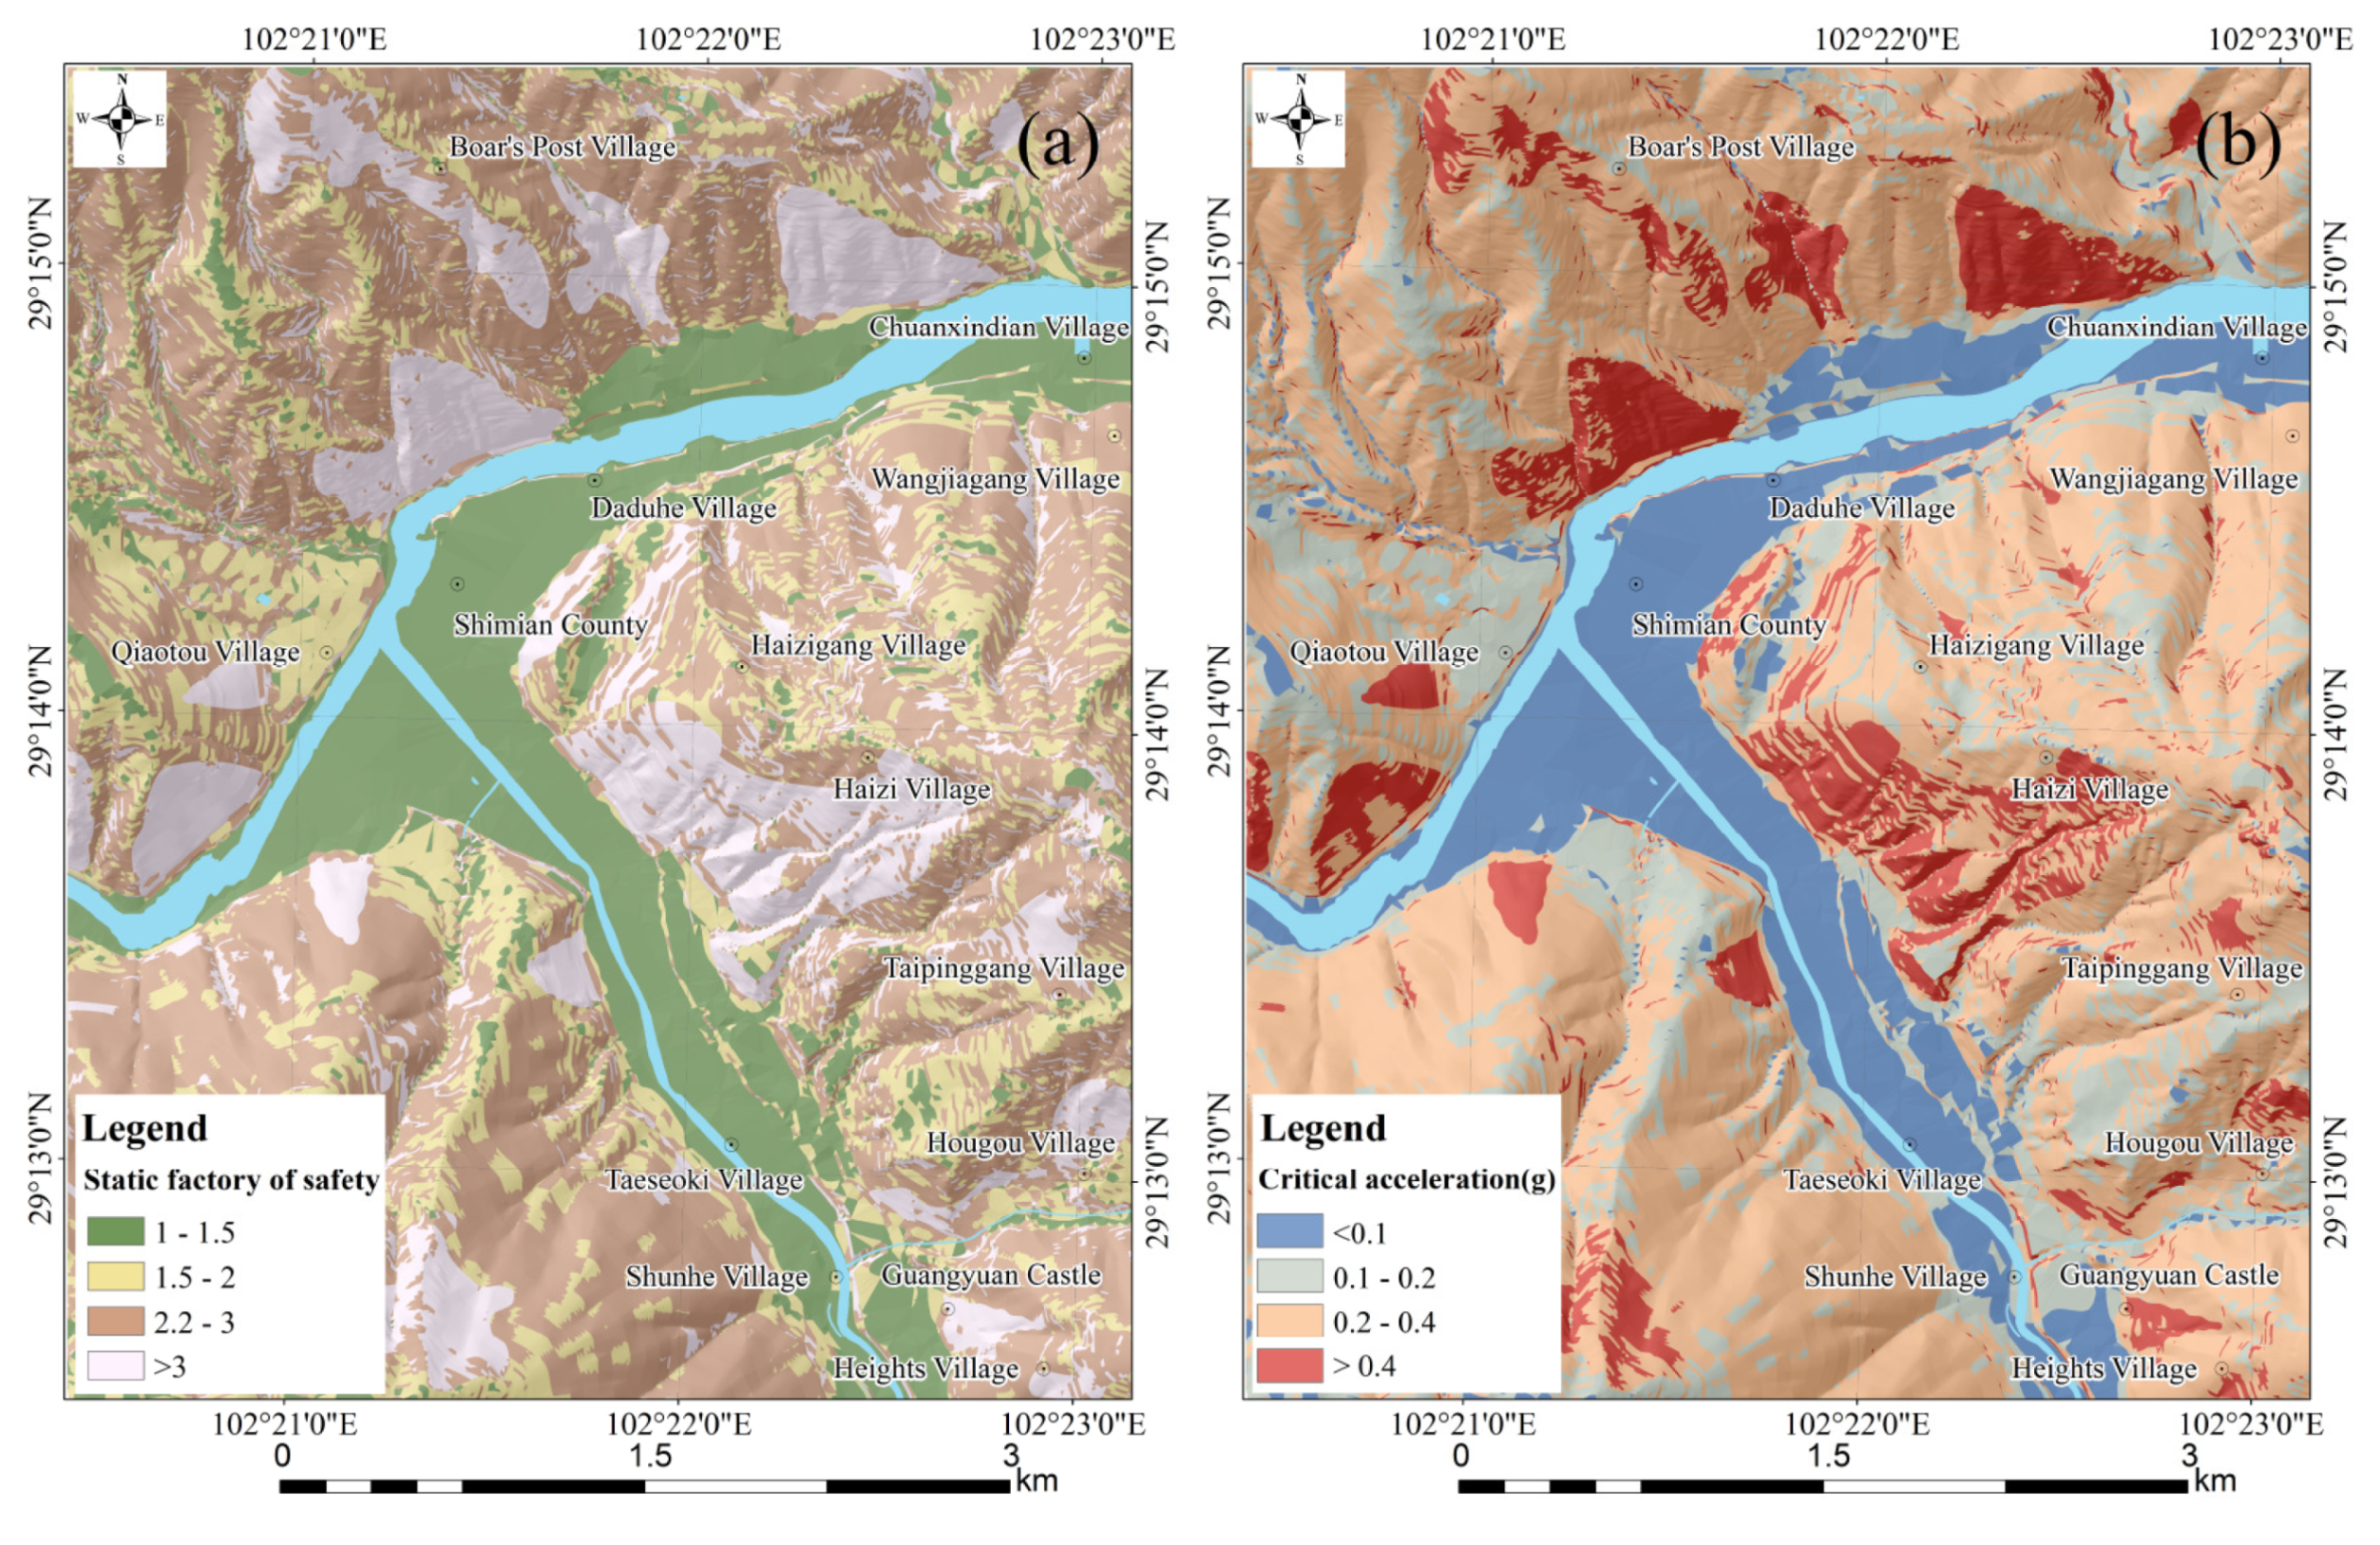
4. Results
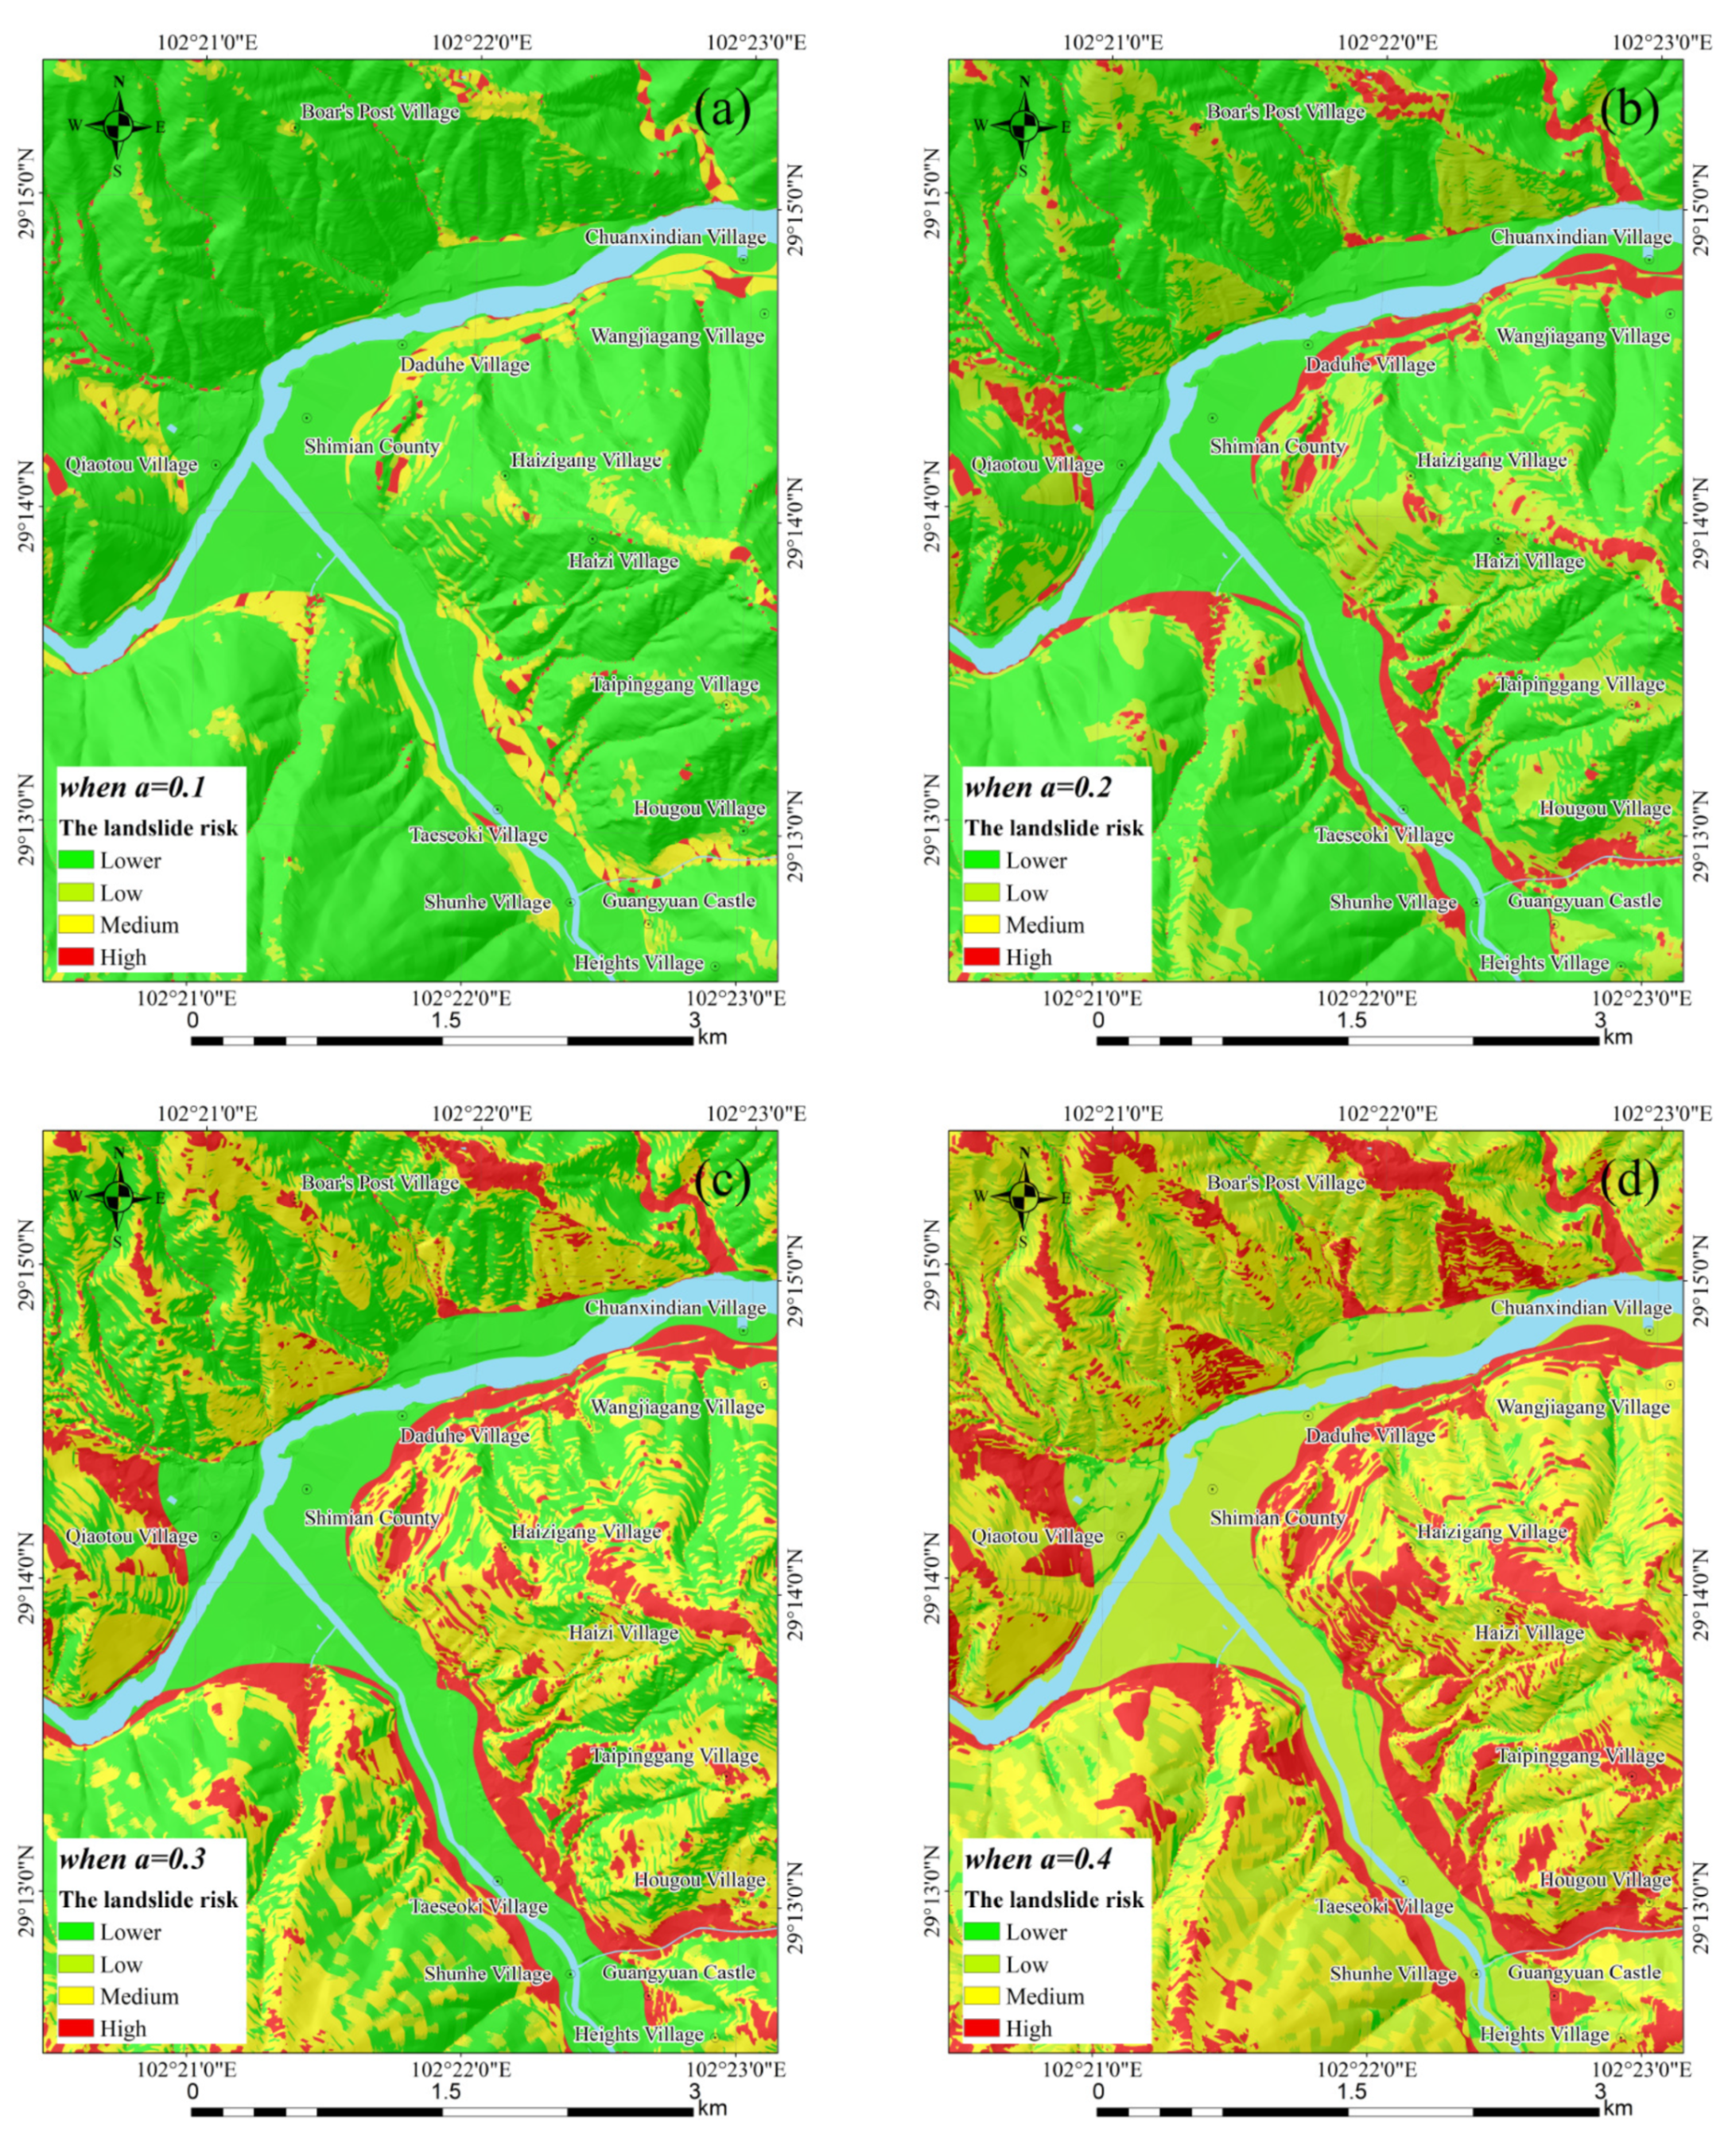
- When a = 0.1
- When a = 0.2
- When a = 0.3
- When a = 0.4
5. Discussion
6. Conclusions
- (1)
- A multilevel physical and mechanical parameter system was established on the basis of the Newmark displacement model, which includes a landslide inventory, a loose accumulation layer, and a geologic unit and the accuracy gradually decreases from the first level to the third level. The accuracy of input parameters is effectively improved, demonstrating the rationality of the parameter system;
- (2)
- The Newmark displacement model with a modified correlation coefficient is used to assess the hazards of regional seismic landslides in four scenarios (a = 0.1, 0.2, 0.3, 0.4). The calculated result was modified by the information value model and the seismic landslide hazard area was delimited scientifically on the basis of the results;
- (3)
- Improving the accuracy of input parameters is important for improving the assessment results of the Newmark displacement model, such as the division of the study unit, the rationality of parameter inputs or the quantity of seismic events. In future work, improving relevant parameters for the Newmark displacement model can be further studied.
Author Contributions
Funding
Institutional Review Board Statement
Informed Consent Statement
Data Availability Statement
Conflicts of Interest
References
- Wang, Y.; Song, C.Z.; Lin, Q.G.; Li, J. Occurrence probability assessment of earthquake-triggered landslides with Newmark displacement values and logistic regression: The Wenchuan earthquake, China. Geomorphology 2016, 258, 108–119. [Google Scholar] [CrossRef]
- Sharma, L.P.; Patel, N.; Ghose, M.K.; Debnath, P. Development and application of Shannon’s entropy integrated information value model for landslide susceptibility assessment and zonation in Sikkim Himalayas in India. Nat. Hazards 2015, 75, 1555–1576. [Google Scholar] [CrossRef]
- Clerici, A.; Perego, S.; Tellini, C.; Vescovi, P. A procedure for landslide susceptibility zonation by the conditional analysis method. Geomorphology 2002, 48, 349–364. [Google Scholar] [CrossRef]
- Ho, T.K. The random subspace method for constructing decision forests. IEEE Trans. Pattern Anal. Mach. Intell. 1998, 20, 832–844. [Google Scholar]
- Gomez, H.; Kavzoglu, T. Assessment of shallow landslide susceptibility using artificial neural networks in Jabonosa River Basin, Venezuela. Eng. Geol. 2005, 78, 11–27. [Google Scholar] [CrossRef]
- Yuan, R.M.; Tang, C.L.; Deng, Q.H. Effect of the acceleration component normal to the sliding surface on earthquake-induced landslide triggering. Landslides 2015, 12, 335–344. [Google Scholar] [CrossRef]
- Dai, L.X.; Fan, X.M.; Jansen, J.D.; Xu, Q. Landslides and fluvial response to landsliding induced by the 1933 Diexi earthquake, Minjiang River, eastern Tibetan Plateau. Landslides 2021, 18, 3011–3025. [Google Scholar] [CrossRef]
- Newmark, N.M. Effects of Earthquakes on Dams and Embankments. Géotechnique 1965, 15, 139–160. [Google Scholar] [CrossRef]
- Ambraseys, N.N.; Menu, J.M. Earthquake-induced ground displacements. Earthq. Eng. Struct. Dyn. 1988, 16, 985–1006. [Google Scholar] [CrossRef]
- Miles, S.B.; Ho, C.L. Rigorous landslide hazard zonation using Newmark’s method and stochastic ground motion simulation. Soil Dyn. Earthq. Eng. 1999, 18, 305–323. [Google Scholar] [CrossRef]
- Peng, W.F.; Wang, C.L.; Chen, S.T.; Lee, S.T. Incorporating the effects of topographic amplification and sliding areas in the modeling of earthquake-induced landslide hazards, using the cumulative displacement method. Comput. Geosci. 2009, 35, 946–966. [Google Scholar] [CrossRef]
- Dreyfus, D.; Rathje, E.M.; Jibson, R.W. The influence of different simplified sliding-block models and input parameters on regional predictions of seismic landslides triggered by the Northridge earthquake. Eng. Geol. 2013, 163, 41–54. [Google Scholar] [CrossRef]
- Li, C.; Su, L. Influence of critical acceleration model on assessments of potential earthquake-induced landslide hazards in Shimian County, Sichuan Province, China. Landslides 2021, 18, 1659–1674. [Google Scholar] [CrossRef]
- Jibson, R.W.; Harp, E.L.; Michael, J.A. A Method for Producing Digital Probabilistic Seismic Landslide Hazard Maps. Eng. Geol. 2000, 58, 271–289. [Google Scholar] [CrossRef]
- Fan, X.M.; Juang, C.H.; Wasowski, J.; Huang, R.Q.; Xu, Q.; Scaringi, G.; Westen, C.J.; Havenith, H.B. What we have learned from the 2008 Wenchuan Earthquake and its aftermath: A decade of research and challenges. Eng. Geol. 2018, 241, 25–32. [Google Scholar] [CrossRef]
- Huang, R.Q.; Li, W.L. Analysis of the geo-hazards triggered by the 12, May 2008 Wenchuan earthquake, China. Bull. Eng. Geol. Environ. 2009, 68, 363–371. [Google Scholar] [CrossRef]
- Keefer, D.K. Investigating landslides caused by earthquakes: Ahistorical review. Surv. Geophys. 2002, 23, 473–510. [Google Scholar] [CrossRef]
- Chengdu Institute of Geology and Mineral Resources. Detailed Survey of the Geo-Hazard in Shimian, Sichuan Province; Chengdu Institute of Geology and Mineral Resources: Chengdu, China, 2009. [Google Scholar]
- Zheng, W.M.; Ba, R.J.; Liu, Y.J.; Ni, H.Y. Risk evaluation of urban seismogeology and geological hazards in Kangding, western Sichuan. Sediment. Geol. Tethyan Geol. 2012, 32, 75–78. [Google Scholar]
- Xu, W.; Tie, Y.B.; Zhang, X.; Yin, W.Q.; Fu, X.L.; Ou, W.; Bai, Y.J.; Ireneusz, M.; Małgorzata, W. Development characteristics and temporal-spatial distribution of geological hazards in Liangshan Prefecture. Sediment. Geol. Tethyan Geol. 2024, 44, 478–492. [Google Scholar]
- Jibson, R.W. Regression methods for estimating coseismic landslide displacement. Eng. Geol. 2007, 90, 209–218. [Google Scholar] [CrossRef]
- Das, R.; Menesis, C.; Urrutia, D. Regression relationships for conversion of body wave and surface wave magnitudes toward Das magnitude scale, Mwg. Nat. Hazards 2023, 117, 365–380. [Google Scholar] [CrossRef]
- Das, R.; Sharma, M.L.; Wason, H.R.; Choudhury, D.; Gonzalez, G. A Seismic Moment Magnitude Scale. Bull. Seismol. Soc. Am. 2019, 109, 1542–1555. [Google Scholar] [CrossRef]
- Li, W.B.; Fan, X.M.; Huang, F.M. Influence law of different environmental factor connection methods and data-based models on landslide susceptibility prediction modeling. Earth Sci. 2021, 46, 3777–3795. [Google Scholar]
- Harp, E.L.; Keefer, D.K.; Sato, H.P.; Yagi, H. Landslide inventories: The essential part of seismic landslide hazard analyses. Eng. Geol. 2011, 122, 9–21. [Google Scholar] [CrossRef]
- GB 50021-2001; Code for Geotechnical Engineering Investigation. National Bureau of Quality Inspection: Beijing, China, 2009. (In Chinese)
- GB/T50218; Standard for Engineering Classification of Rock Masses. Standards Press of China: Beijing, China, 2014. (In Chinese)
- GB50011-2010; Code for Seismic Design of Building. China Building Industry Press: Beijing, China, 2010. (In Chinese)
- Liu, J.M.; Shi, J.S.; Wang, T.; Wu, S.R. Seismic landslide hazard assessment in the Tianshui area, China, based on scenario earthquakes. Bull. Eng. Geol. Environ. 2018, 77, 1263–1272. [Google Scholar] [CrossRef]
- Nayek, P.S.; Gade, M. Seismic landslide hazard assessment of central seismic gap region of Himalaya for a Mw 8.5 scenario event. Acta Geophys. 2021, 69, 747–759. [Google Scholar] [CrossRef]
- Huang, S.; Lyu, Y.J.; Sha, H.J.; Xiu, L.W. Seismic performance assessment of unsaturated soil slope in different groundwater levels. Landslides 2021, 18, 2813–2833. [Google Scholar] [CrossRef]
- Xu, G.X.; Yao, L.K.; Li, C.H.; Wang, X.F. Predictive Models for Permanent Displacement of Slopes Based on Recorded Strong-Motion Data of Wenchuan Earthquake. Chin. J. Geotech. Eng. 2012, 34, 1131–1136. [Google Scholar]
- Yuan, R.M.; Deng, Q.H.; Cunningham, D.; Han, Z.J.; Zhang, D.L.; Zhang, B.L. Newmark displacement model for landslides induced by the 2013 Ms 7.0 Lushan earthquake, China. Front. Earth Sci. 2016, 10, 740–750. [Google Scholar] [CrossRef]
- Ma, S.Y.; Xu, C. Applicability of Two Newmark Models in the Assessment of Coseismic Landslide Hazard and Estimation of Slope-Failure Probability: An Example of the 2008 Wenchuan Mw 7.9 Earthquake Affected Area. J. Earth Sci. 2019, 30, 1020–1030. [Google Scholar] [CrossRef]
- Huang, D.R.; Wang, G.; Du, C.Y.; Jin, F.; Feng, K.W.; Chen, Z.W. An integrated SEM-Newmark model for physics-based regional coseismic landslide assessment. Soil Dyn. Earthq. Eng. 2020, 132, 106066. [Google Scholar] [CrossRef]
- Du, G.L.; Zhang, Y.S.; Zou, L.; Yang, Z.H.; Yuan, Y.; Ren, S.S. Co-seismic landslide hazard assessment of the 2017 Ms 6.9 Milin earthquake, Tibet, China, combining the logistic regression–information value and Newmark displacement models. Bull. Eng. Geol. Environ. 2022, 81, 446. [Google Scholar] [CrossRef]


| Groups | Number | Z/m | γ/(t·m−3) | c′/kPa | φ′/(°) |
|---|---|---|---|---|---|
| Landslide inventory (first level) | SM448 | 2.5 | 19.0 | 27 | 30 |
| SM506 | 2.5 | 19.0 | 25 | 30 | |
| SM505 | 2.5 | 20.0 | 25 | 31 | |
| SM107 | 2.5 | 22.0 | 26 | 31 | |
| SM311 | 2.5 | 21.5 | 25 | 31 | |
| SM125 | 2.5 | 21.5 | 26 | 30 | |
| SM121 | 2.5 | 21.5 | 25 | 30 | |
| SM309 | 2.5 | 21.5 | 24 | 30 | |
| SM310 | 2.5 | 21.5 | 25 | 30 | |
| SM312 | 2.5 | 21.5 | 24 | 32 | |
| SM313 | 2.5 | 21.5 | 25 | 30 | |
| SM452 | 2.5 | 22.0 | 24 | 32 | |
| SM205 | 2.5 | 21.5 | 25 | 31 | |
| SM206 | 2.5 | 21.5 | 26 | 30 | |
| SM203 | 2.5 | 22.0 | 24 | 30 | |
| SM204 | 2.5 | 21.5 | 25 | 30 | |
| SM209 | 2.5 | 21.5 | 26 | 30 | |
| Loose accumulation (second level) | SS01 | 3.0 | 21.5 | 28 | 35 |
| SS02 | 3.0 | 21.5 | 31 | 34 | |
| SS03 | 3.0 | 21.5 | 30 | 34 | |
| SS04 | 3.0 | 21.5 | 31 | 34 | |
| SS05 | 3.0 | 21.5 | 32 | 34 | |
| SS06 | 3.0 | 21.5 | 32 | 35 | |
| SS07 | 3.0 | 21.5 | 32 | 35 | |
| SS08 | 3.0 | 20.0 | 31 | 34 | |
| SS09 | 3.0 | 22.0 | 31 | 34 | |
| SS10 | 3.0 | 22.0 | 30 | 34 | |
| SS11 | 3.0 | 21.5 | 31 | 34 | |
| SS12 | 3.0 | 21.5 | 31 | 35 | |
| SS13 | 3.0 | 21.0 | 30 | 35 | |
| SS14 | 3.0 | 21.5 | 31 | 34 | |
| SS15 | 3.0 | 20.0 | 32 | 35 | |
| SS16 | 3.0 | 21.5 | 31 | 34 | |
| SS17 | 3.0 | 21.5 | 30 | 34 | |
| SS18 | 3.0 | 20.0 | 32 | 34 | |
| SS19 | 3.0 | 20.0 | 31 | 34 | |
| SS20 | 3.0 | 21.5 | 31 | 34 | |
| SS21 | 3.0 | 21.0 | 30 | 35 | |
| SS22 | 3.0 | 21.0 | 30 | 35 | |
| Geological units (third level) | DZ01 | 4.0 | 22.0 | 32 | 38 |
| DZ02 | 4.0 | 22.0 | 36 | 42 | |
| DZ03 | 4.0 | 22.0 | 36 | 42 | |
| DZ04 | 4.0 | 22.0 | 34 | 39 | |
| DZ05 | 4.0 | 22.0 | 36 | 38 | |
| DZ06 | 4.0 | 22.0 | 36 | 42 |
| Primary Index | Sub Index | Rank | Information Value/I |
|---|---|---|---|
| Topography | Relative height difference/m | <100 | 0.03 |
| [100, 200) | 0.94 | ||
| [200, 300) | 0.54 | ||
| [300, 400) | −0.28 | ||
| [400, 550) | −4.27 | ||
| [550, 700) | −2.75 | ||
| [700, 850) | −2.06 | ||
| [850, 1000) | −1.71 | ||
| >1000 | 0 | ||
| Slope/° | <10 | 0.4 | |
| [10, 20) | 0.08 | ||
| [20, 30) | −0.29 | ||
| [30, 40) | −0.18 | ||
| ≥40 | −1.81 | ||
| Geological condition | Lithological group | Alluvial accumulation | 0.19 |
| Ordinary granite | −0.54 | ||
| Rhyolite porphyry | −0.54 | ||
| Granite porphyry | 0.74 | ||
| Ultrabasic rock | 0.07 | ||
| River | −0.77 | ||
| Distance to the fault/m | [0, 100) | −0.43 | |
| [100, 300) | 0.18 | ||
| [300, 600) | 0.36 | ||
| [600, 1500) | −0.22 | ||
| ≥1500 | 0.04 |
| Condition | Distribution Area/km2 | Control Factors | |
|---|---|---|---|
| High Hazard | Medium Hazard | ||
| a = 0.1 | 2.78 | 4.01 | Landslide inventory |
| a = 0.2 | 3.42 | 6.29 | The rock properties and landslide inventory |
| a = 0.3 | 6.78 | 10.02 | Slope and rock properties |
| a = 0.4 | 11.62 | 13.28 | Slope |
Disclaimer/Publisher’s Note: The statements, opinions and data contained in all publications are solely those of the individual author(s) and contributor(s) and not of MDPI and/or the editor(s). MDPI and/or the editor(s) disclaim responsibility for any injury to people or property resulting from any ideas, methods, instructions or products referred to in the content. |
© 2025 by the authors. Licensee MDPI, Basel, Switzerland. This article is an open access article distributed under the terms and conditions of the Creative Commons Attribution (CC BY) license (https://creativecommons.org/licenses/by/4.0/).
Share and Cite
Zhan, Y.; Song, Z.; Li, D.; Xue, L.; Huang, T. A Seismic Landslide Hazard Assessment in Small Areas Based on Multilevel Physical and Mechanical Parameters: A Case Study of the Upper Yangzi River. Appl. Sci. 2025, 15, 777. https://doi.org/10.3390/app15020777
Zhan Y, Song Z, Li D, Xue L, Huang T. A Seismic Landslide Hazard Assessment in Small Areas Based on Multilevel Physical and Mechanical Parameters: A Case Study of the Upper Yangzi River. Applied Sciences. 2025; 15(2):777. https://doi.org/10.3390/app15020777
Chicago/Turabian StyleZhan, Yunxin, Zhi Song, Dan Li, Lian Xue, and Tianju Huang. 2025. "A Seismic Landslide Hazard Assessment in Small Areas Based on Multilevel Physical and Mechanical Parameters: A Case Study of the Upper Yangzi River" Applied Sciences 15, no. 2: 777. https://doi.org/10.3390/app15020777
APA StyleZhan, Y., Song, Z., Li, D., Xue, L., & Huang, T. (2025). A Seismic Landslide Hazard Assessment in Small Areas Based on Multilevel Physical and Mechanical Parameters: A Case Study of the Upper Yangzi River. Applied Sciences, 15(2), 777. https://doi.org/10.3390/app15020777