
Damage Evolution and Failure Precursor of Rock-like Material Under Uniaxial Compression Based on Strain Rate Field Statistics

 ,
,
Abstract
1. Introduction
2. Numerical Simulations
3. Results and Discussion
3.1. Case 1: Intact Specimen
3.2. Case 2: Specimen with an Open Flaw
3.3. Comparative Analysis
4. Conclusions
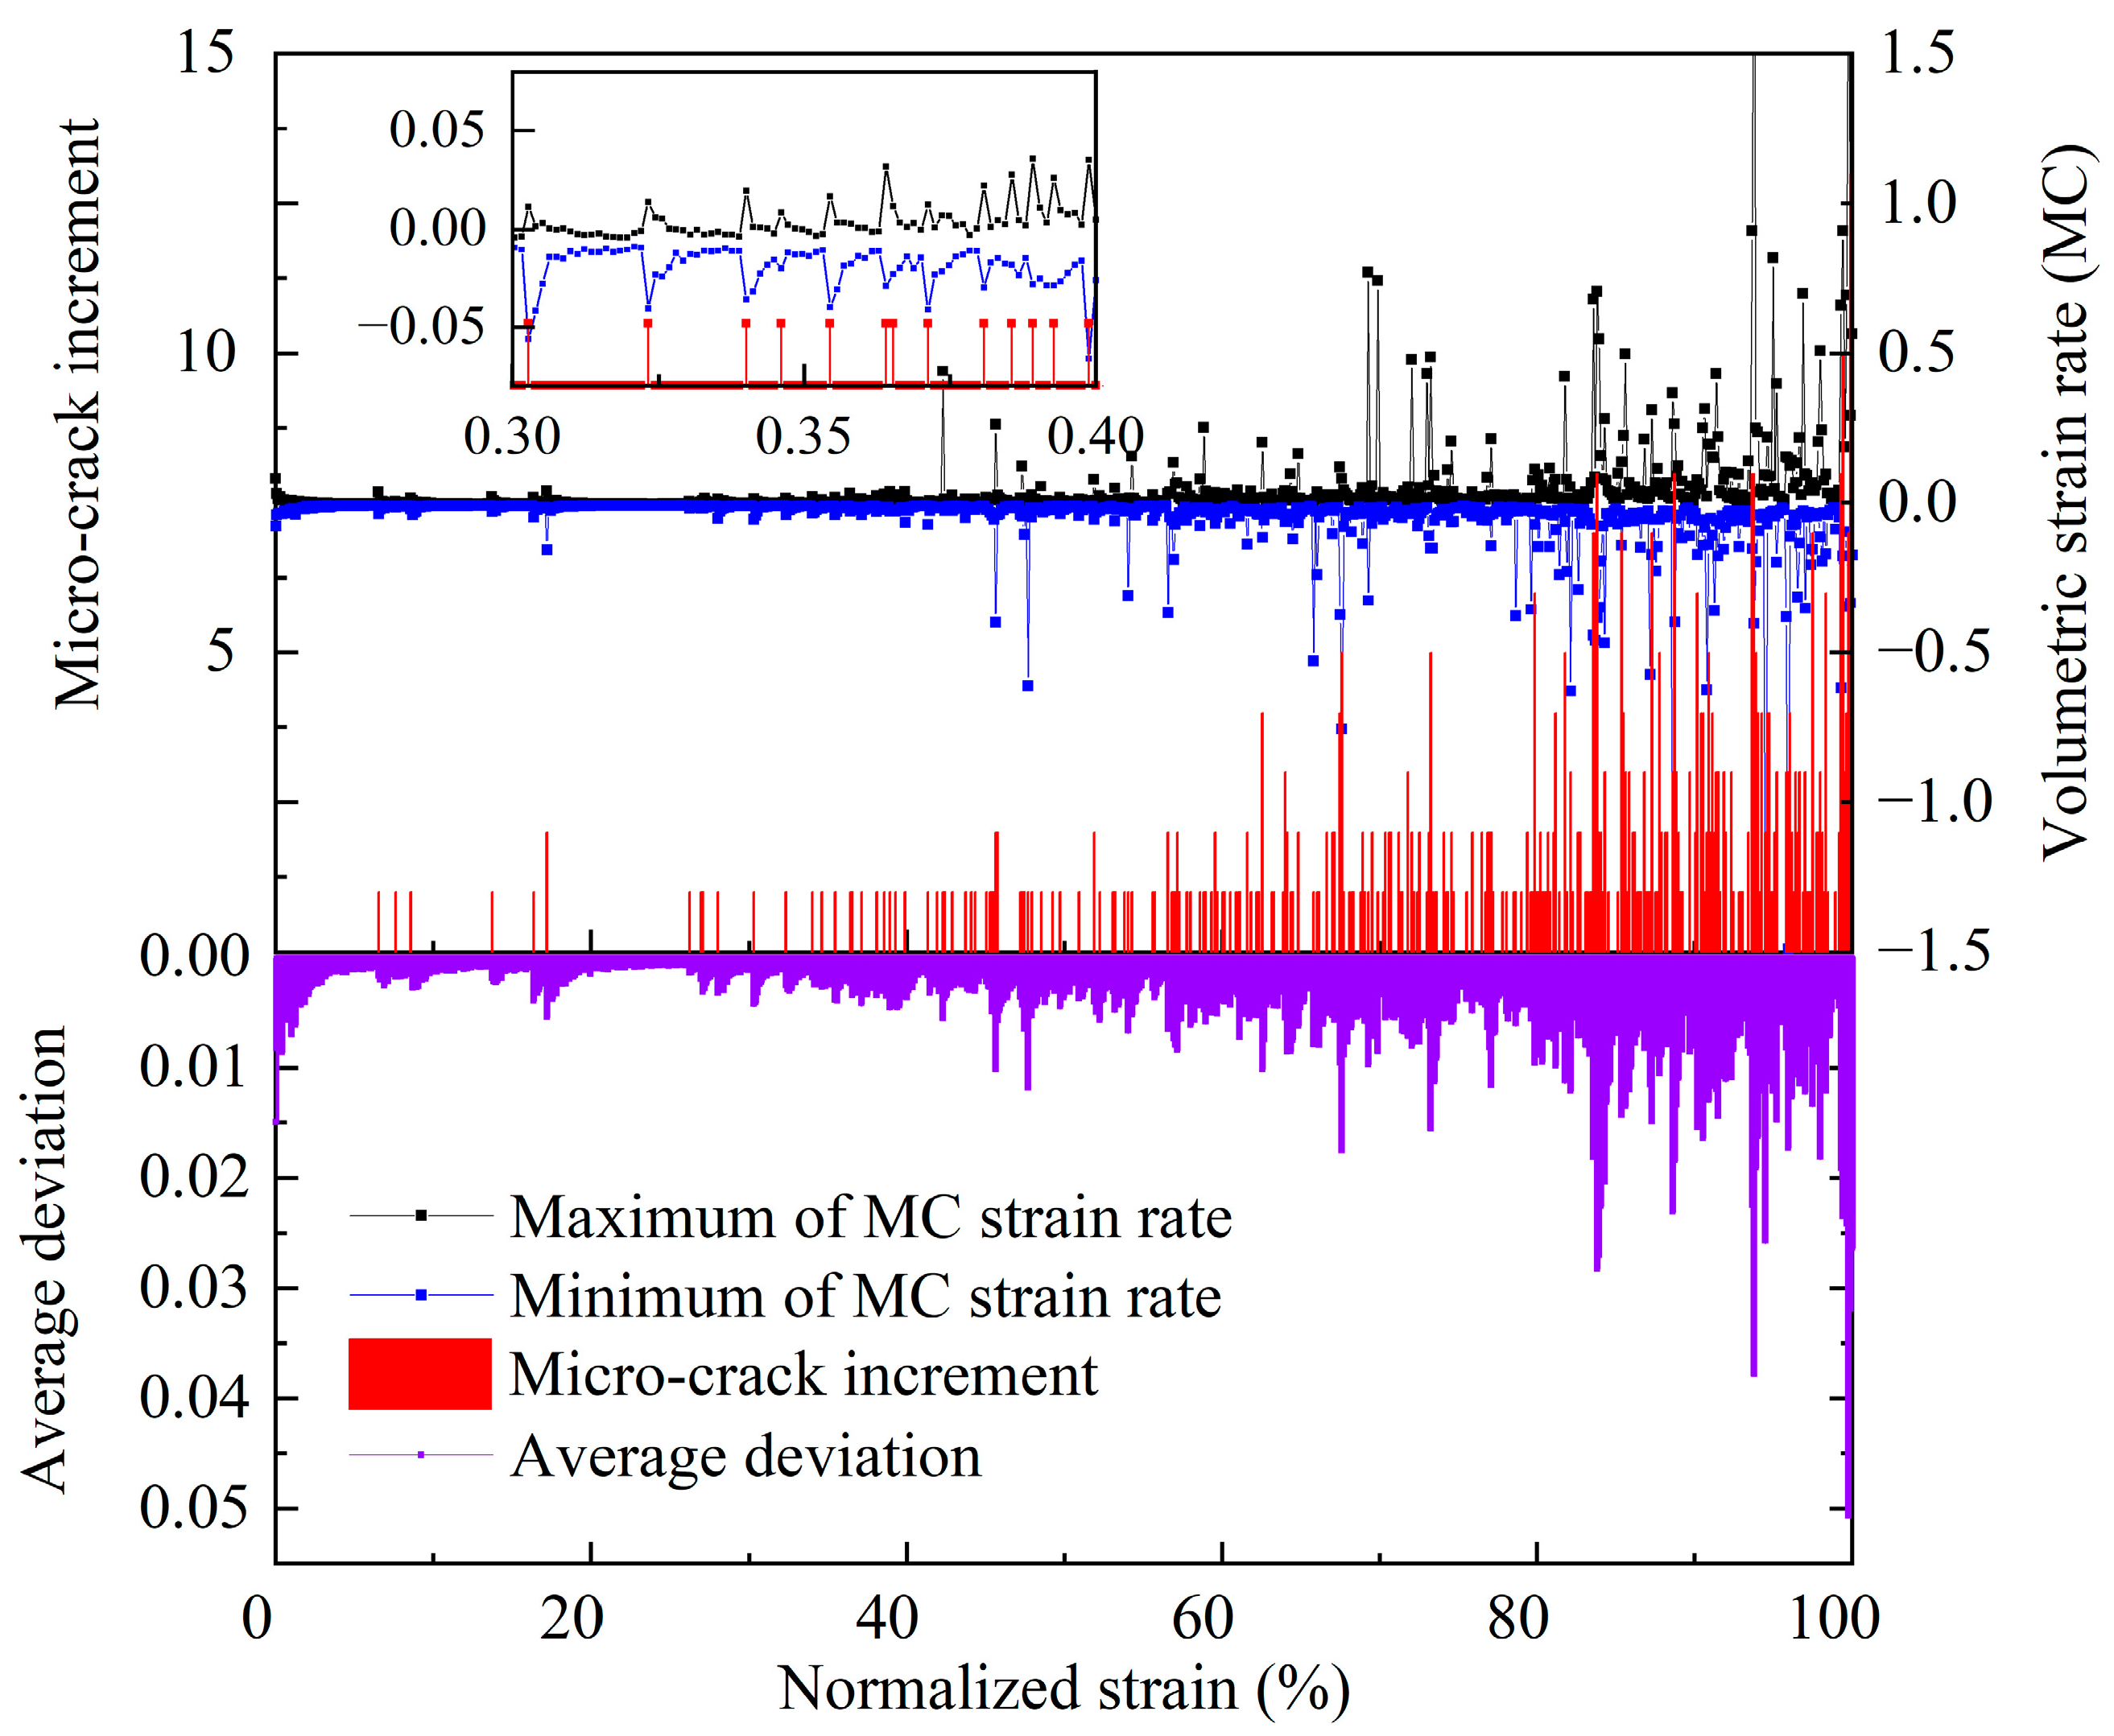
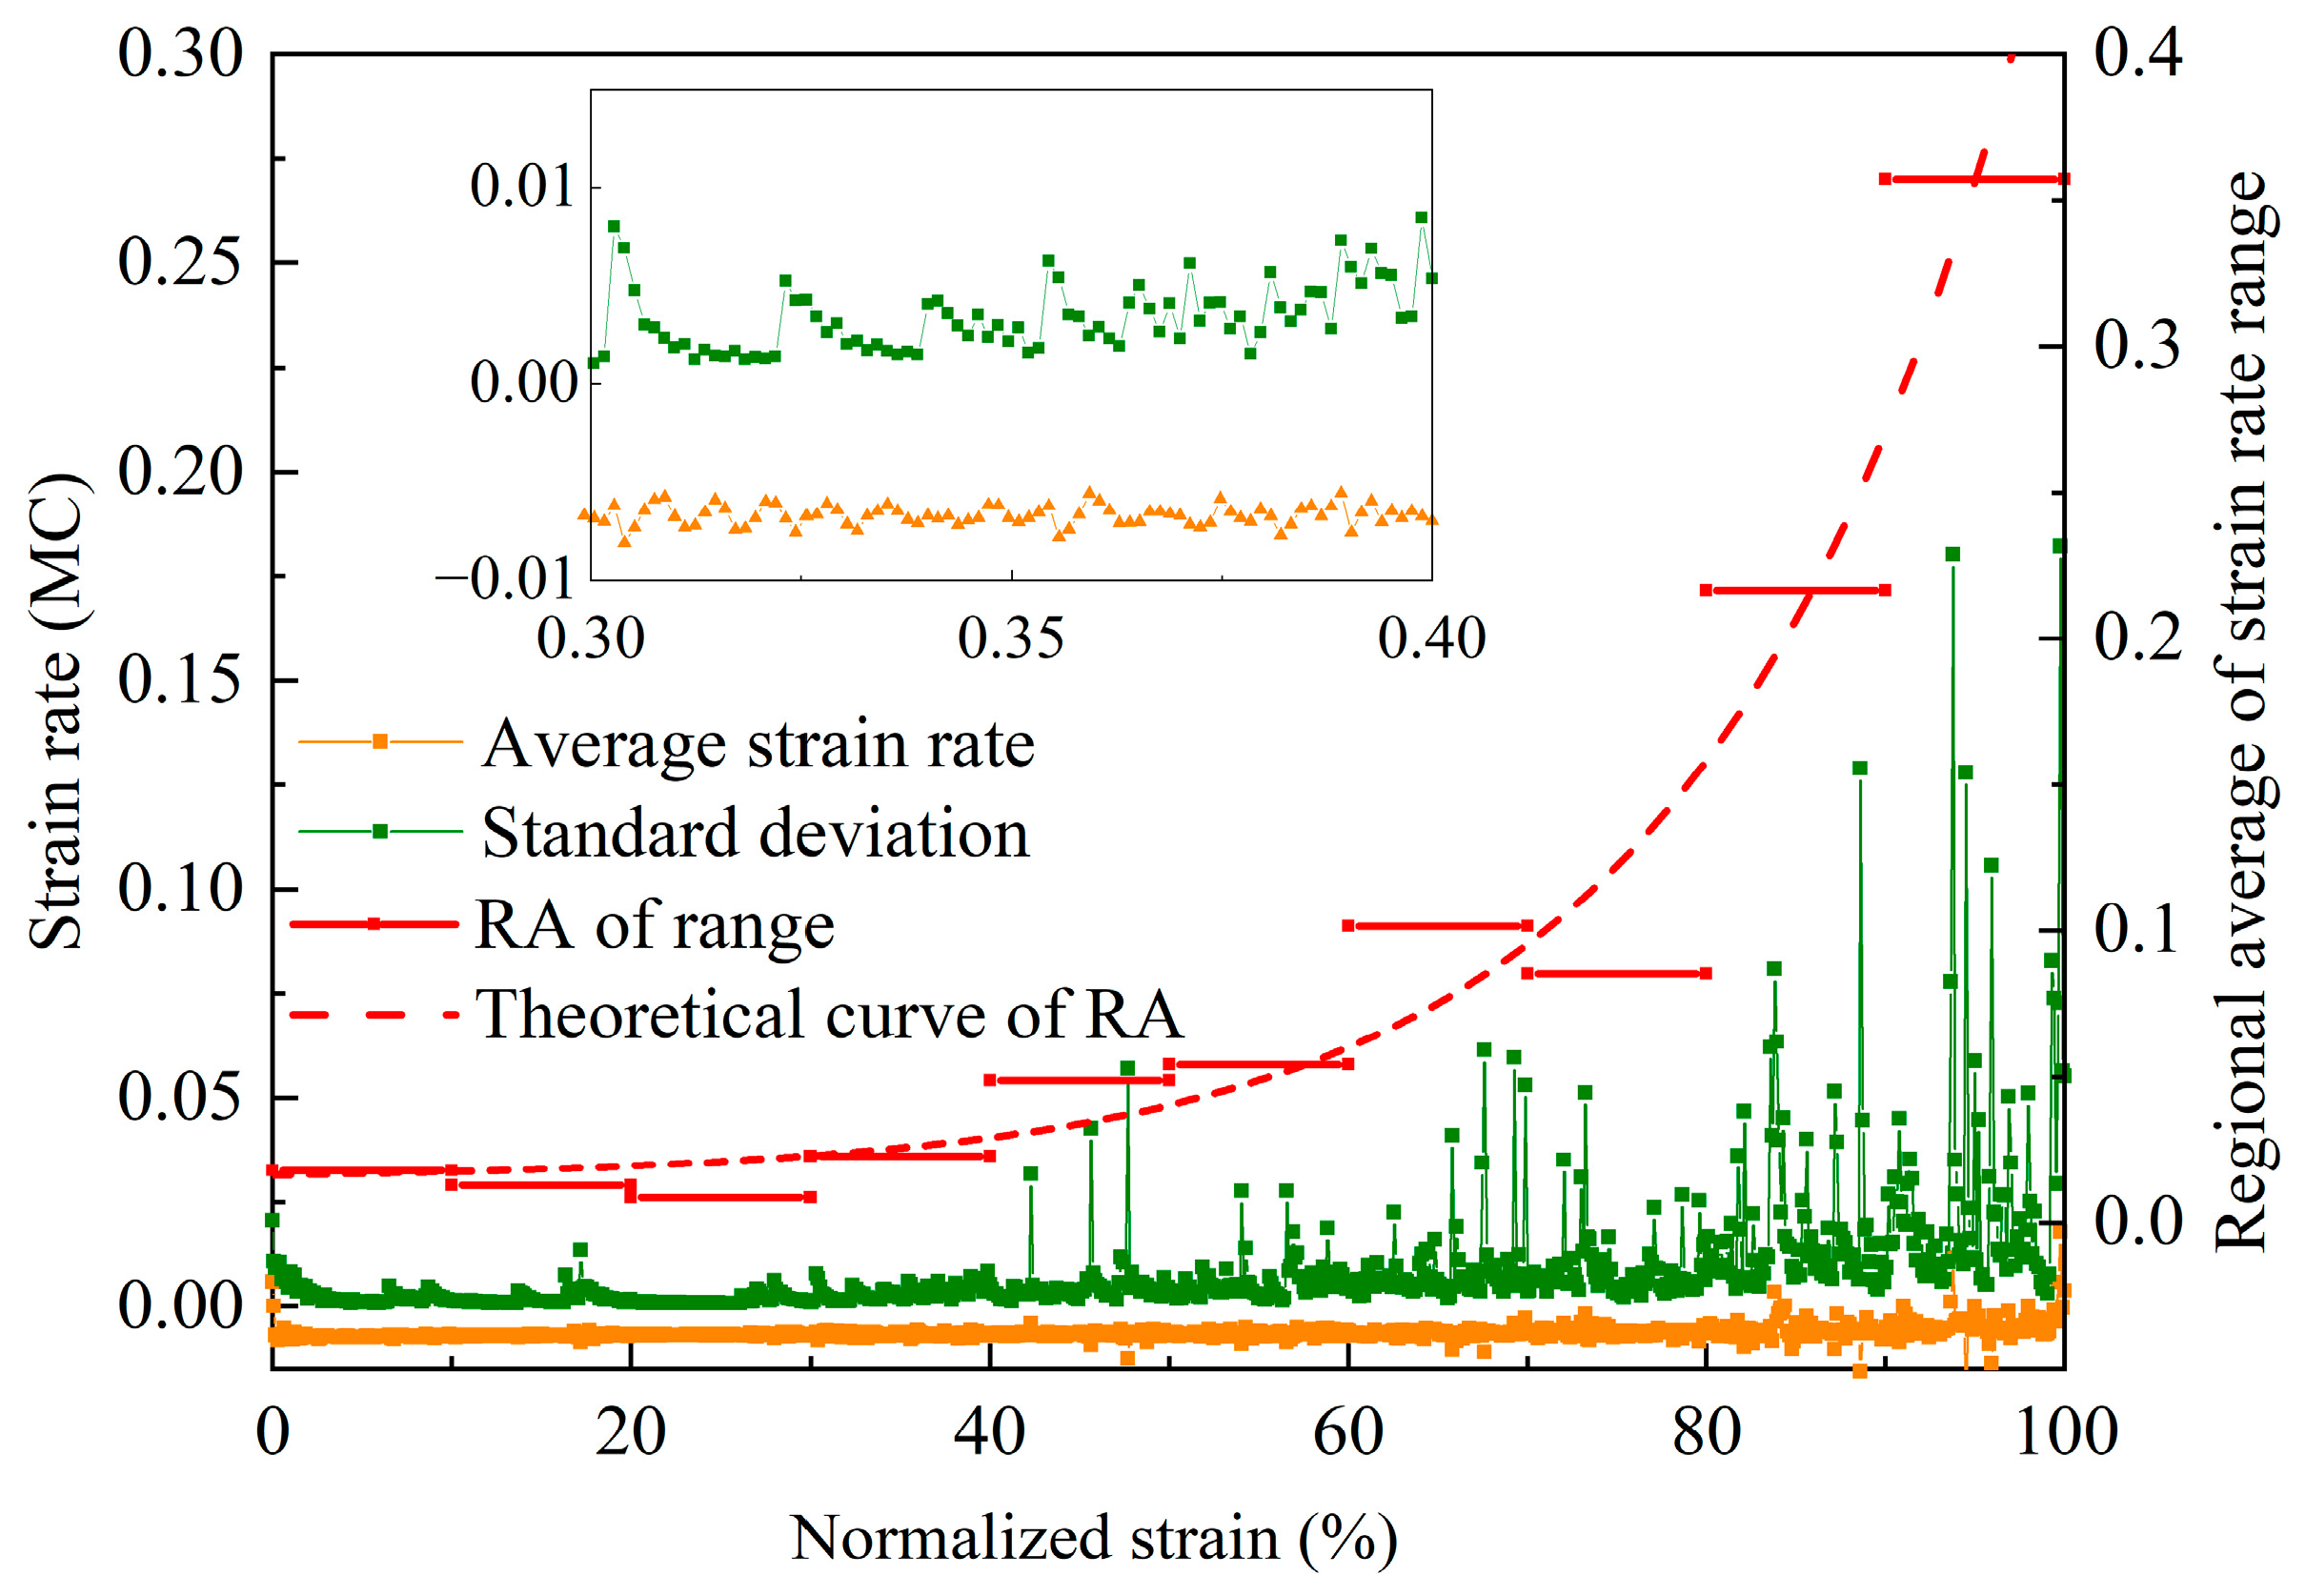
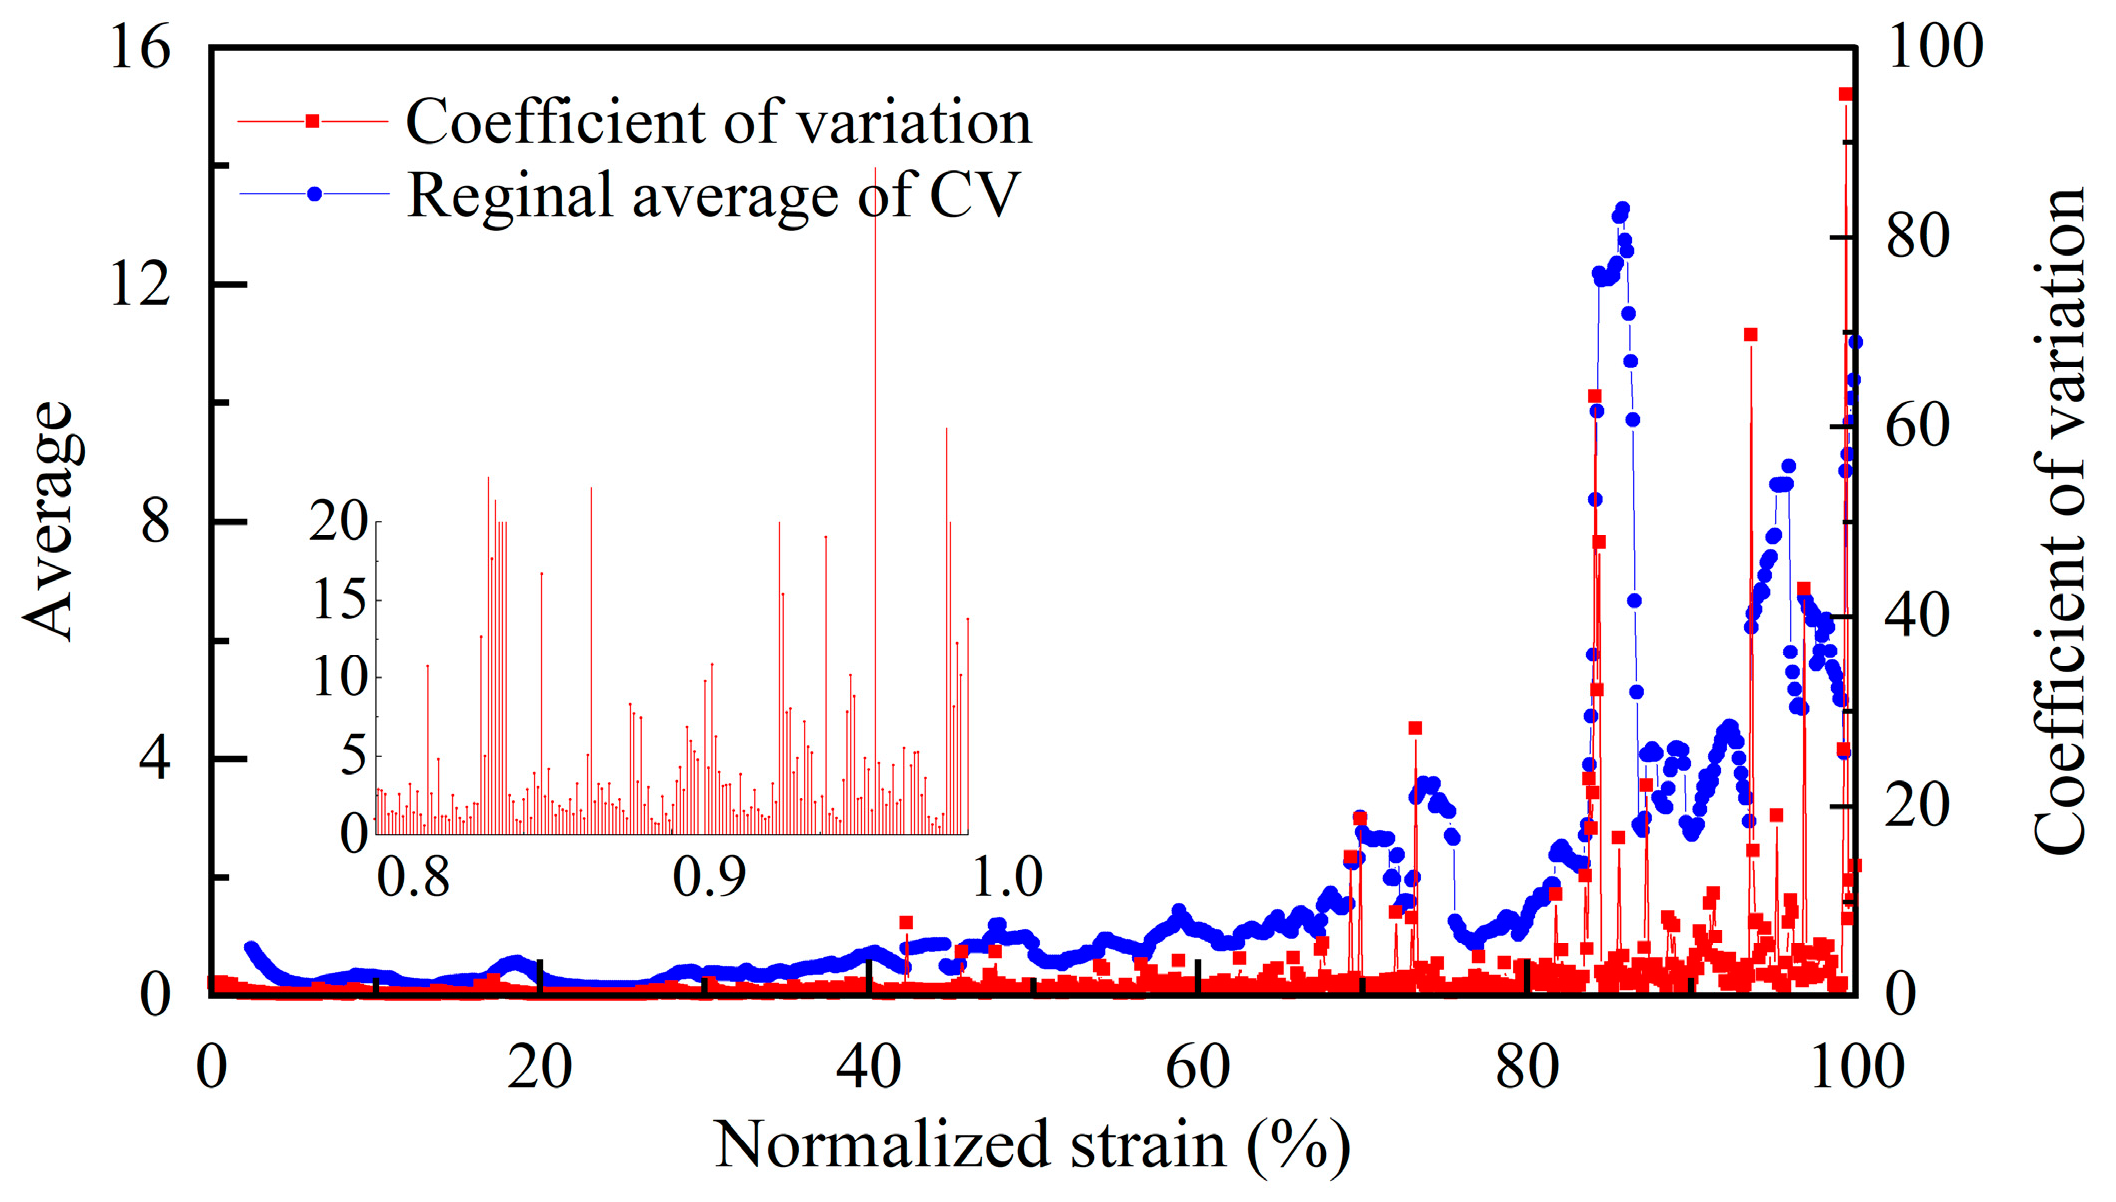
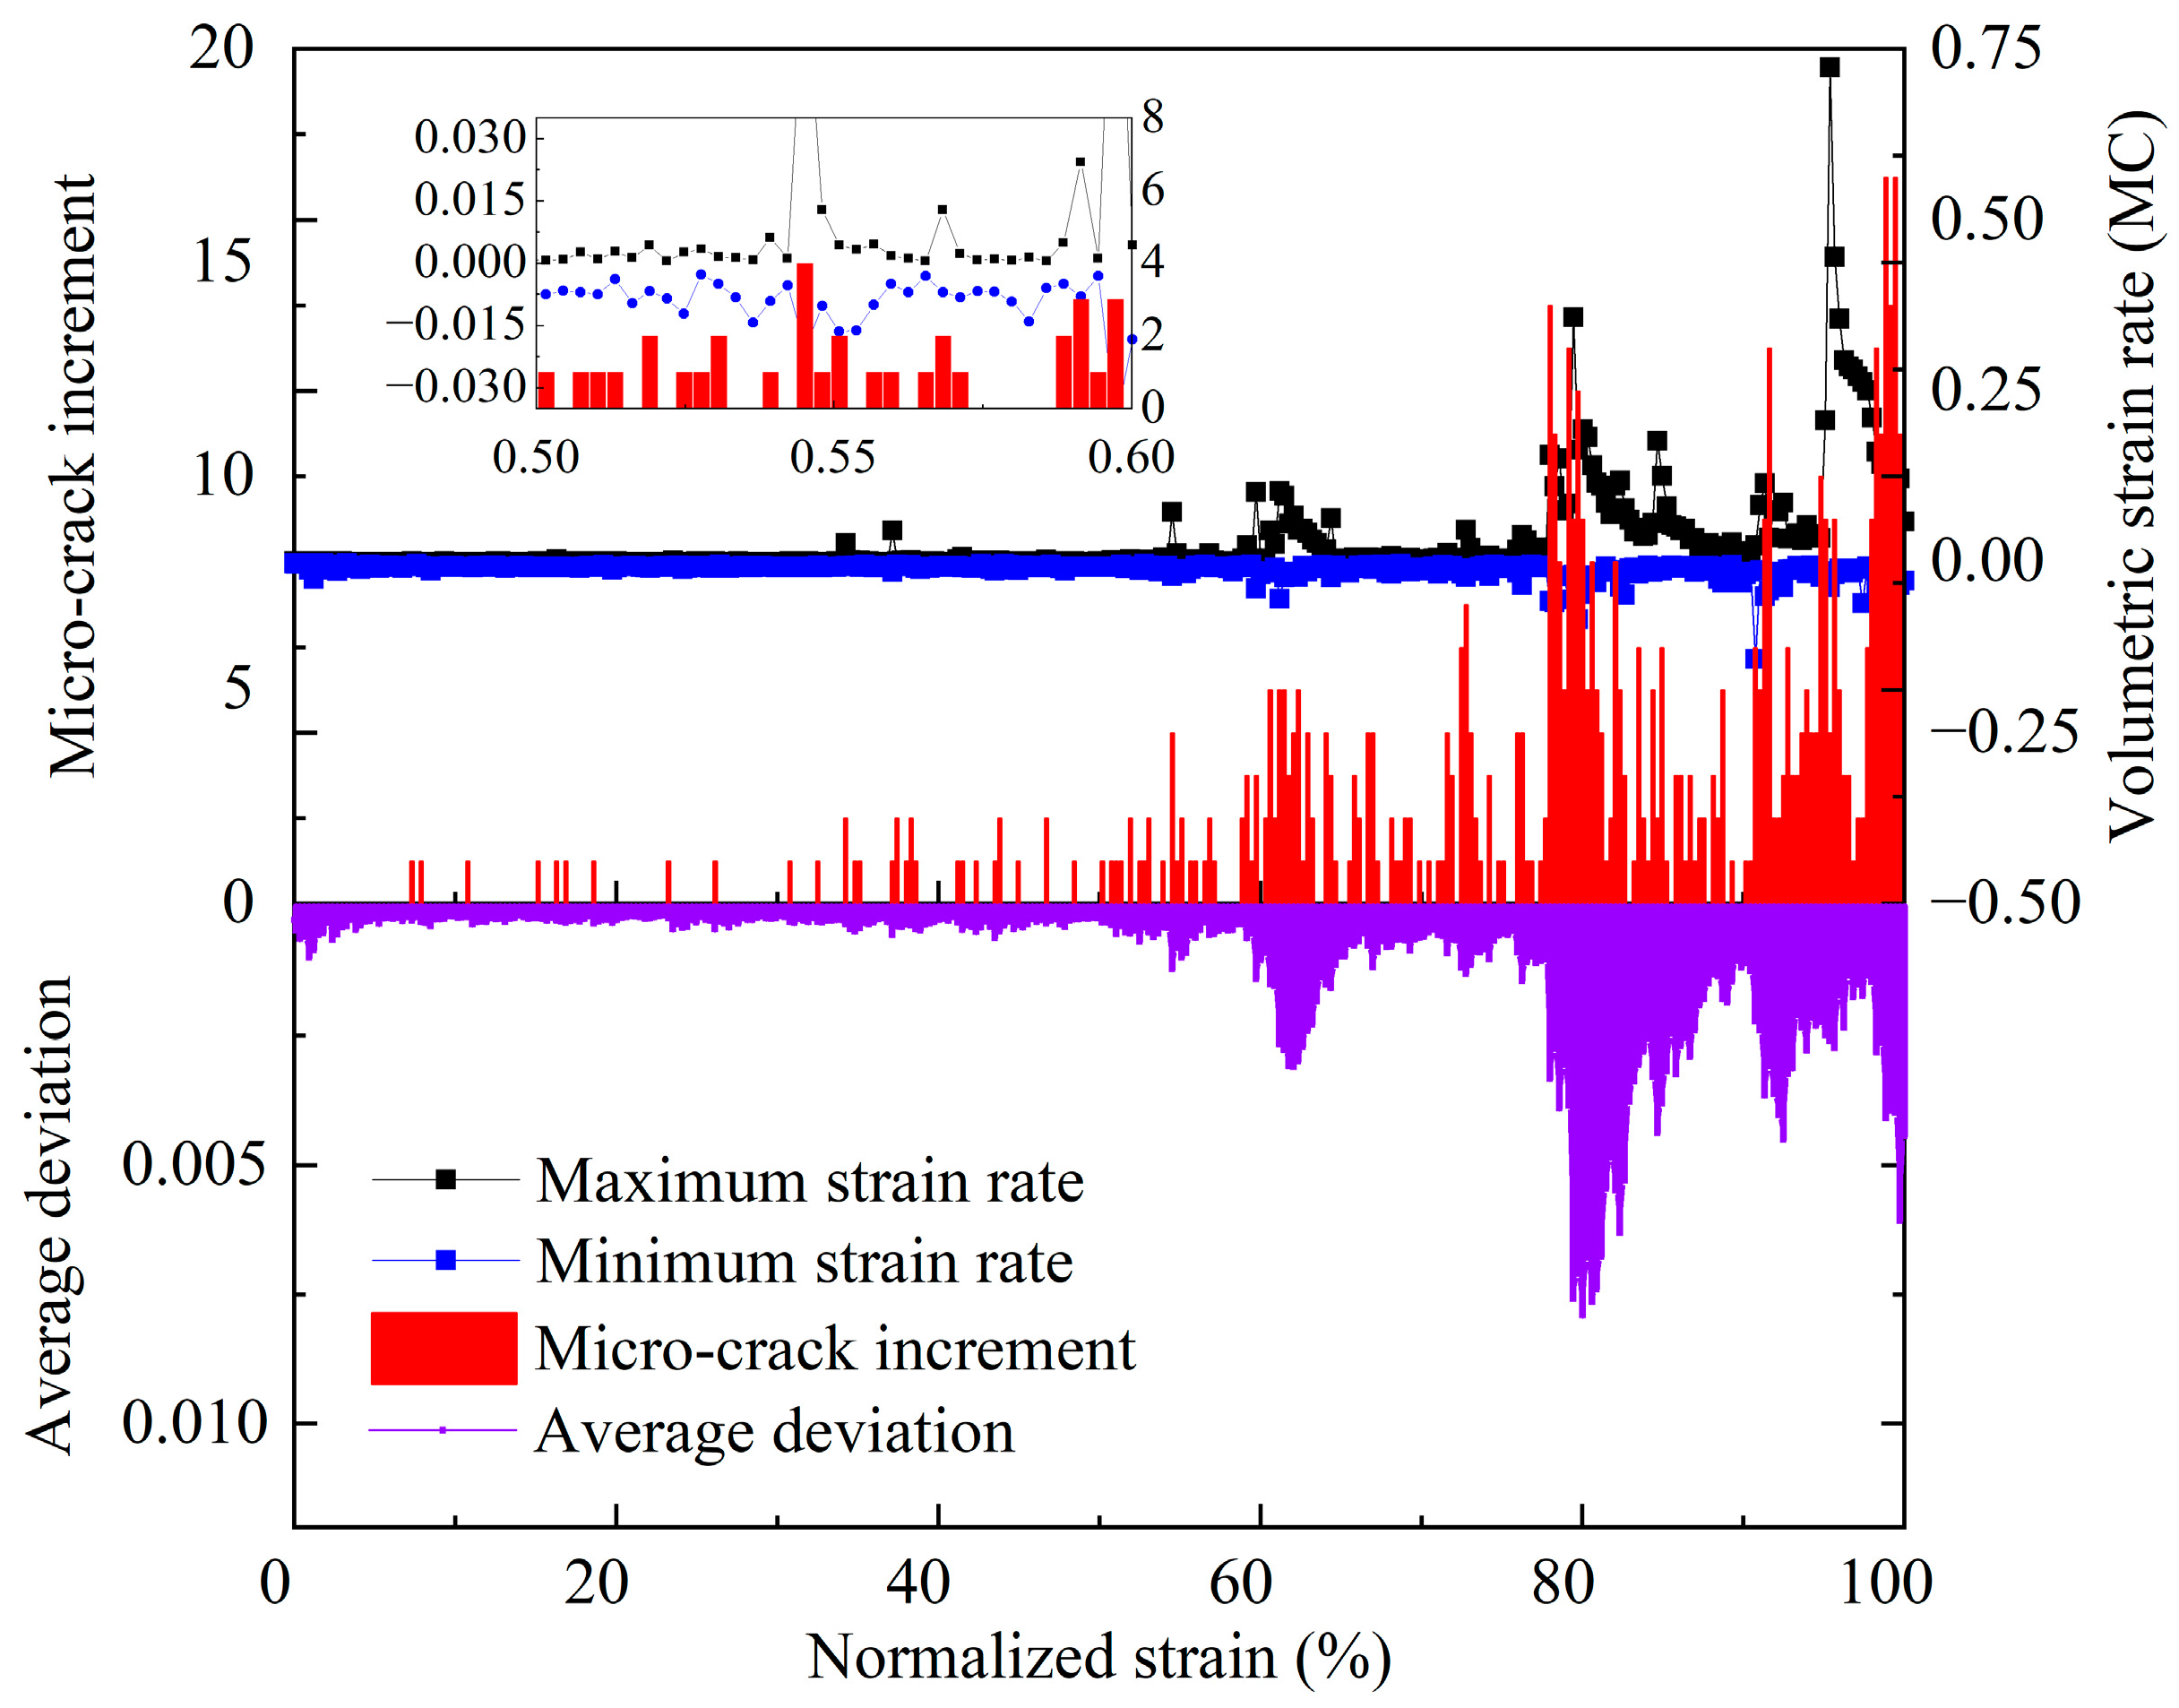
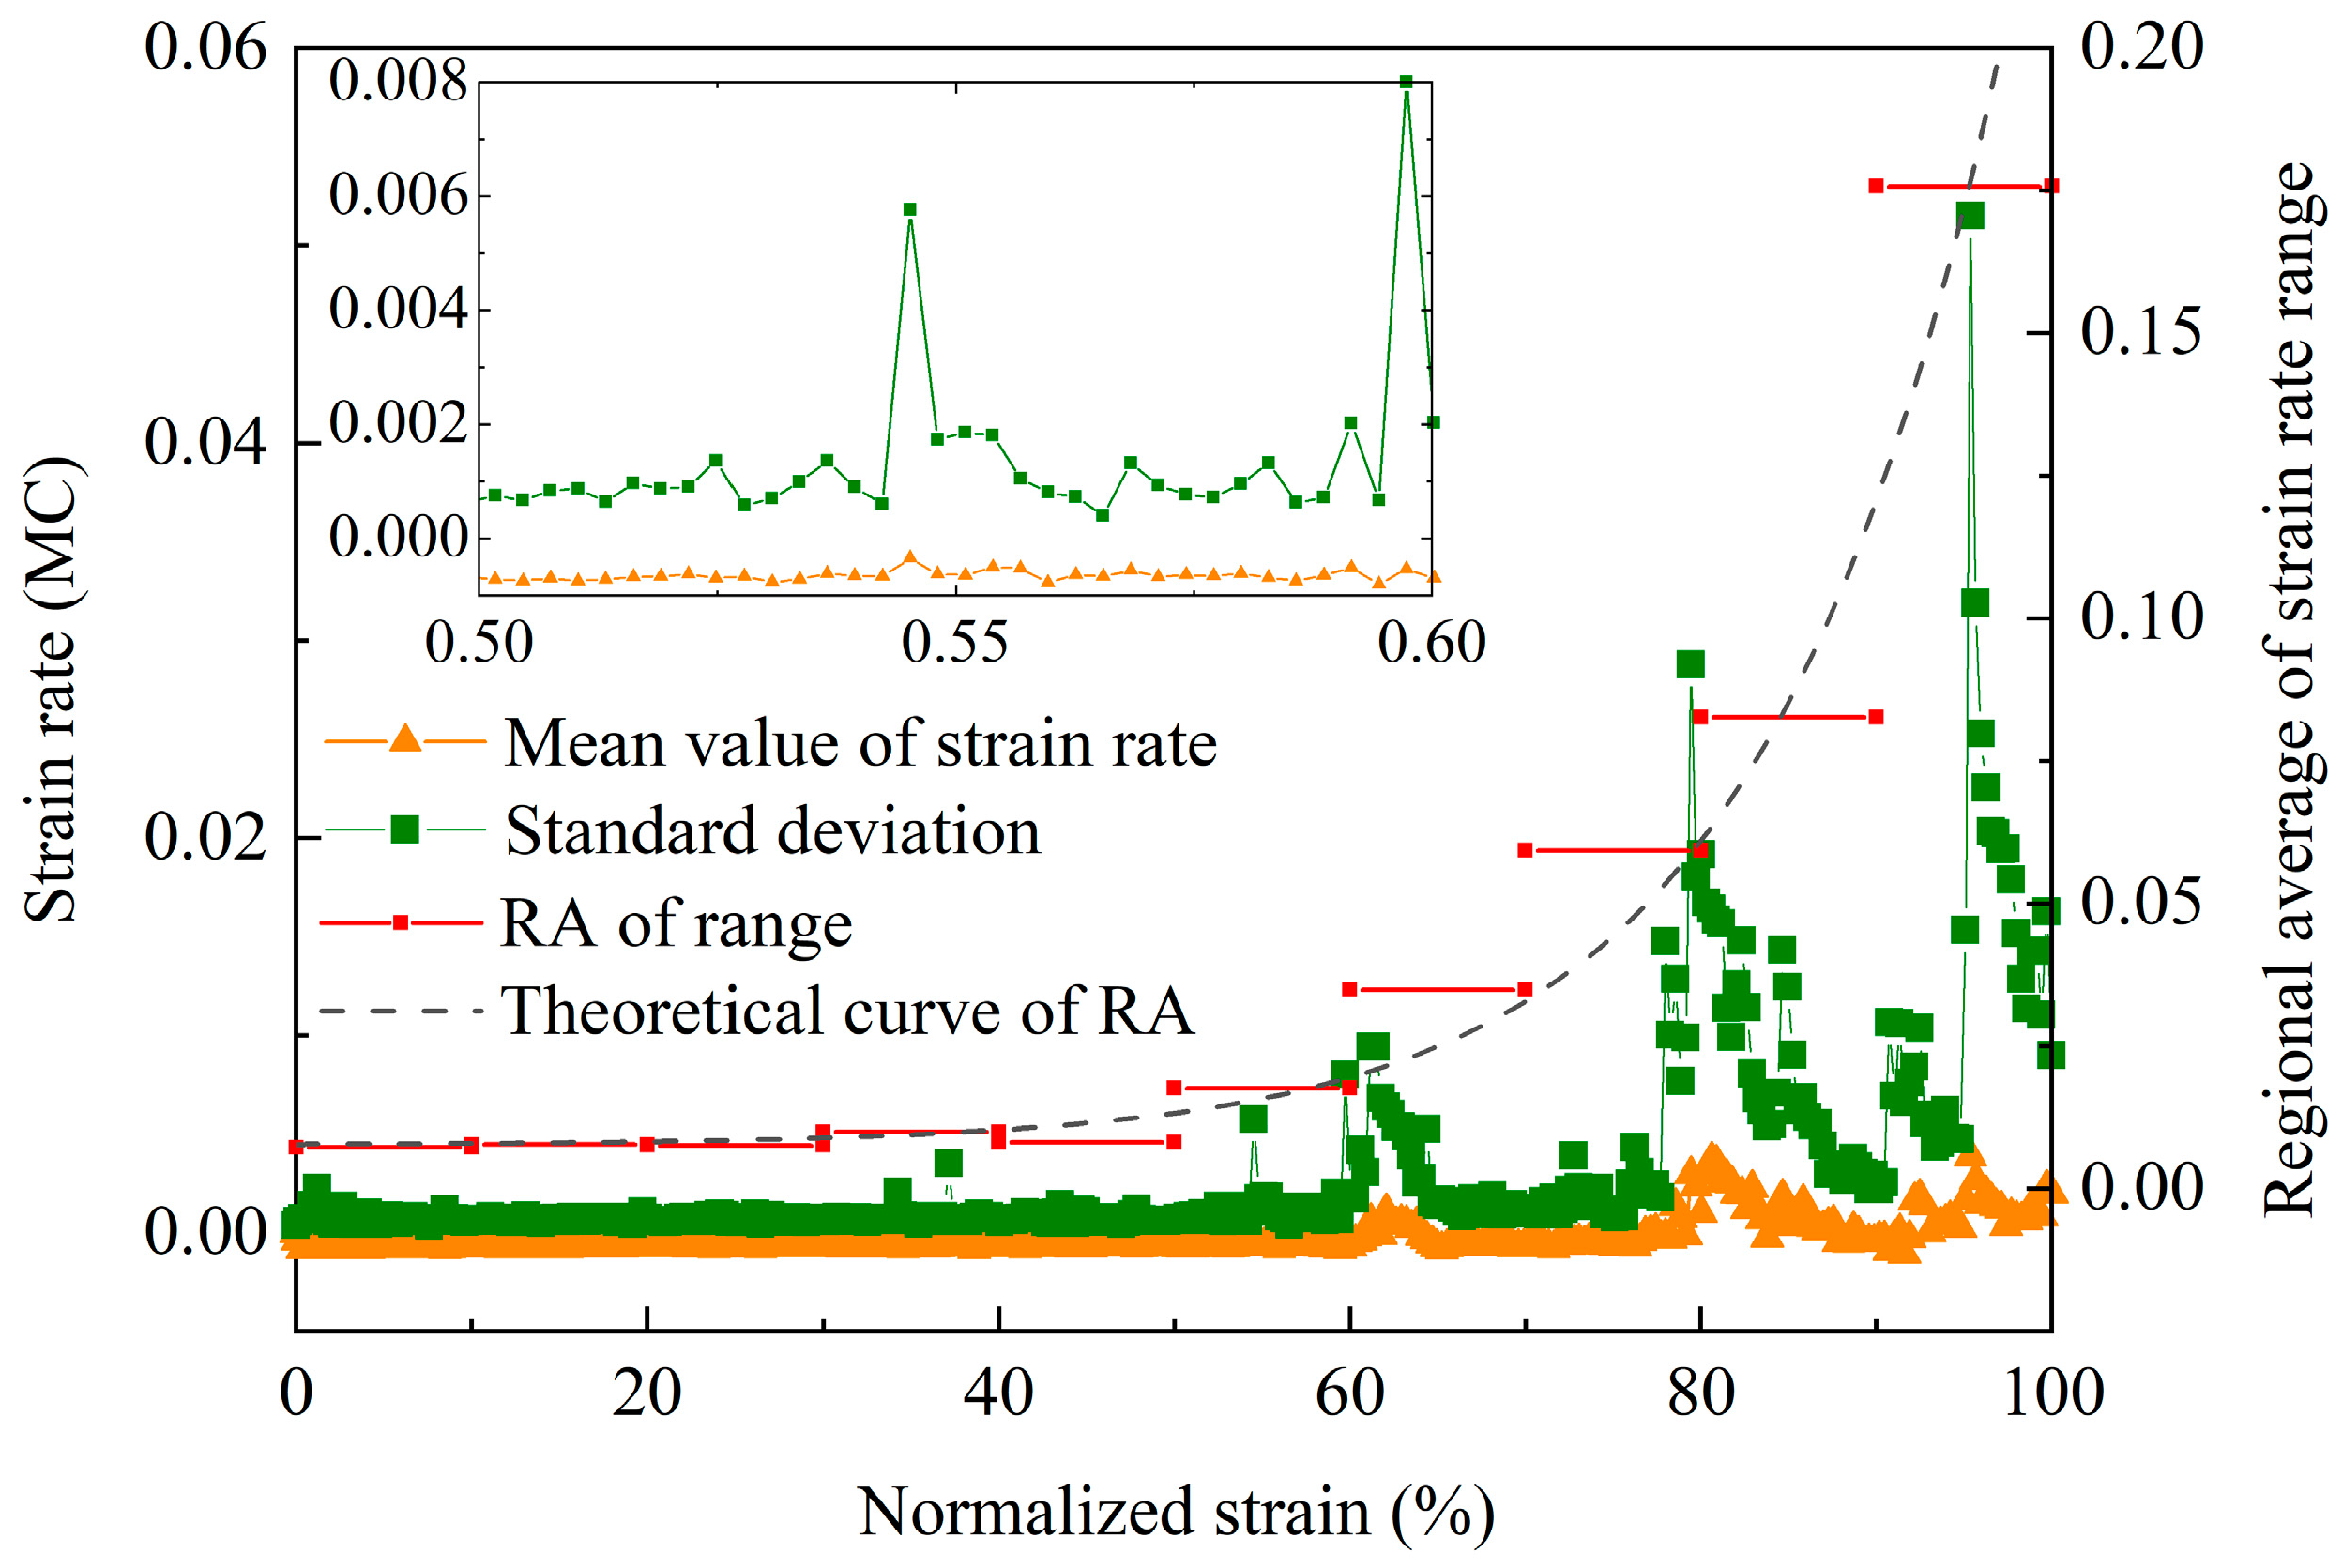
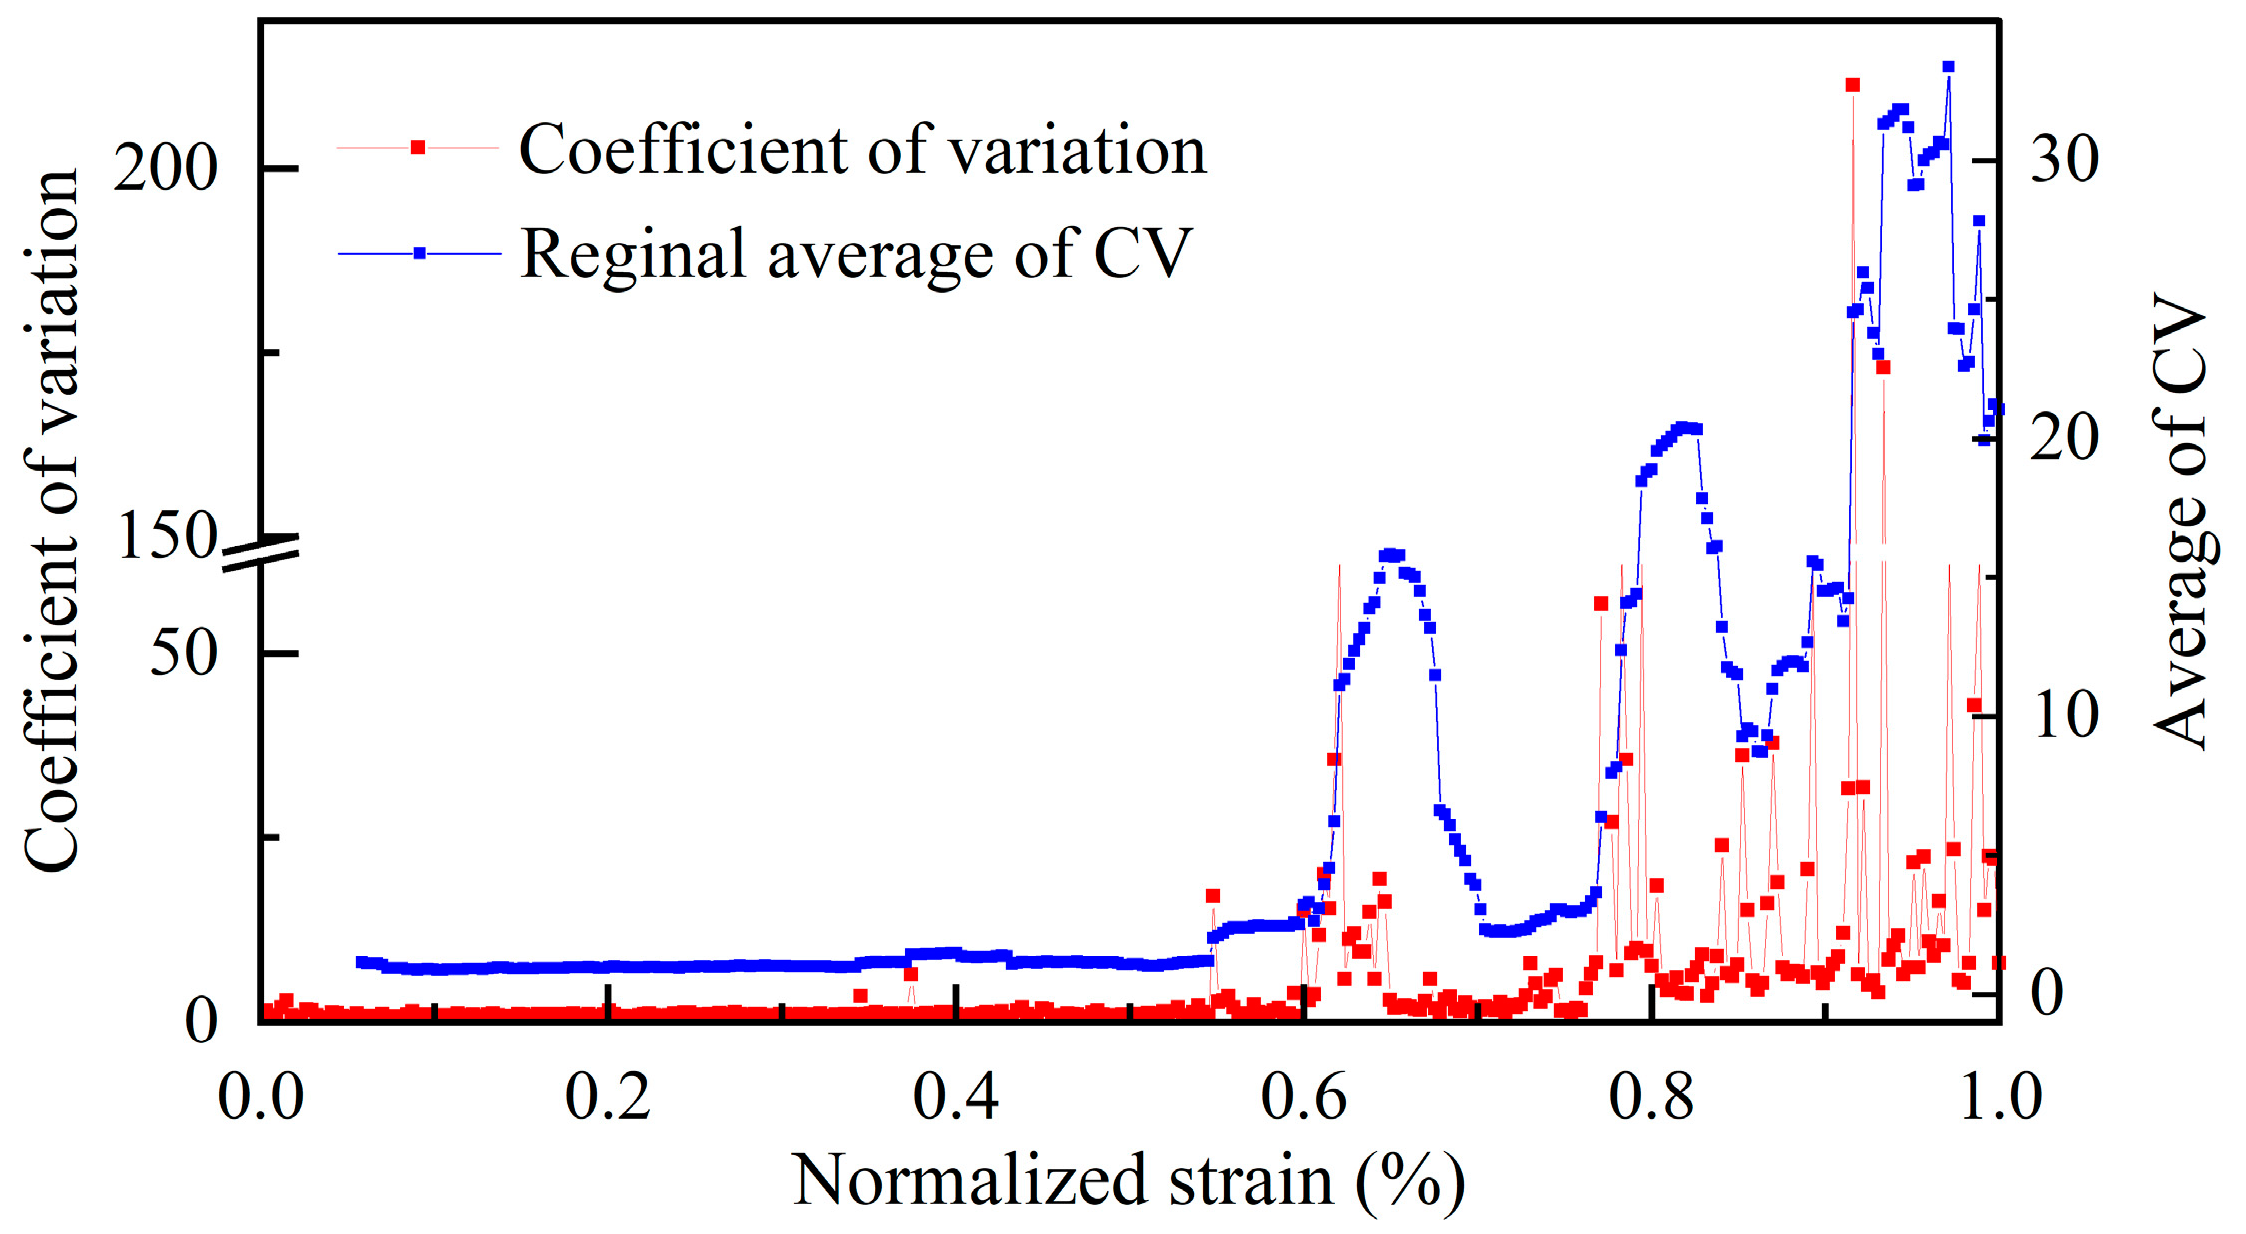
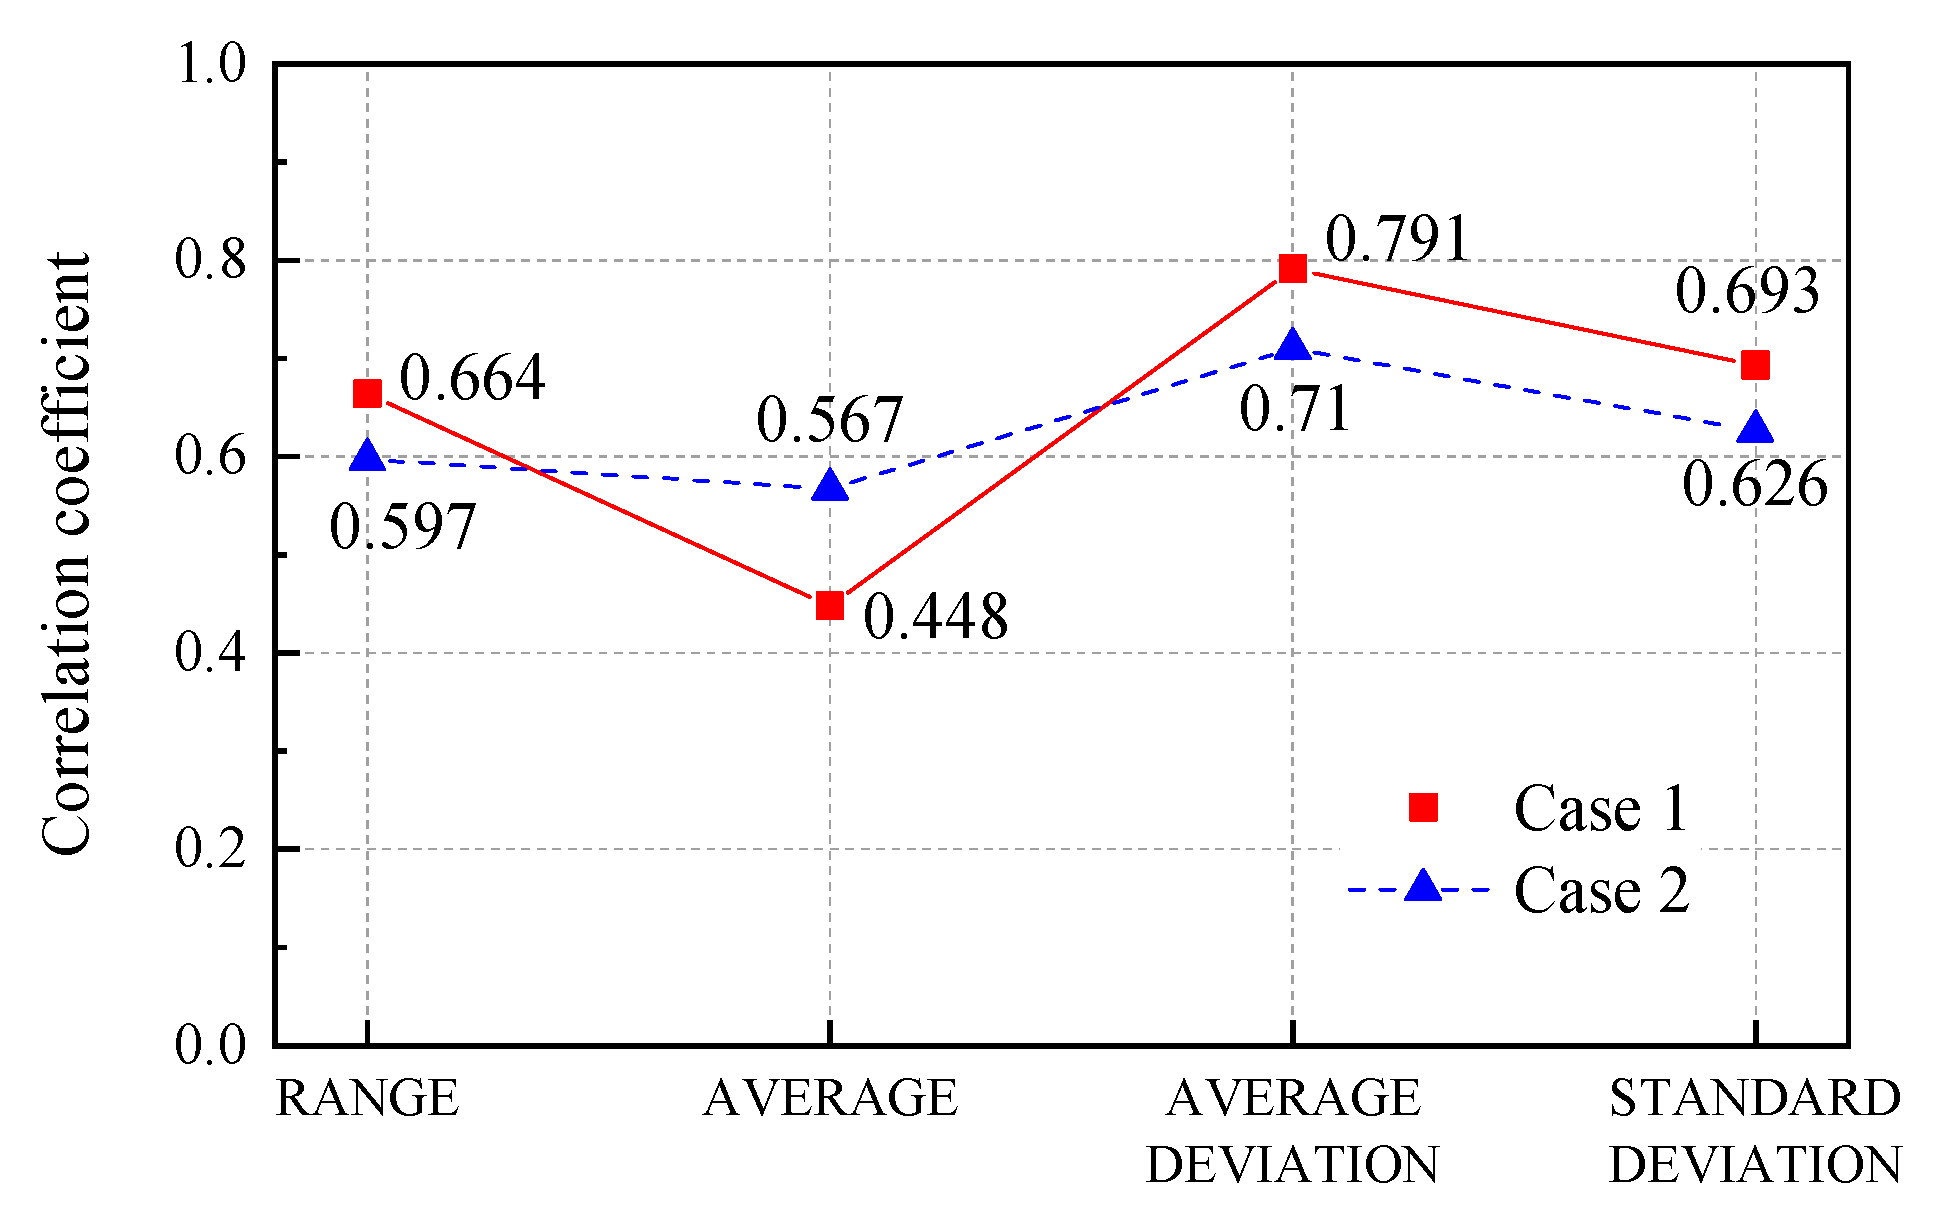
- Several relationships between the damage evolution of the rock-like material and statistical data of the volumetric strain rate field have been built in this paper. The micro-crack increasement, or the damage accumulation, corresponds to large gaps between the strain rate extremums. In the stage of the pre-peak loading, statistical data always have growth and volatility, and the corresponding regional averages rise higher as the strain increases. The results showed that all types of statistical data positively correlate with the microcrack increment, and the regional average of the strain rate range has an exponential raise as the strain increases.
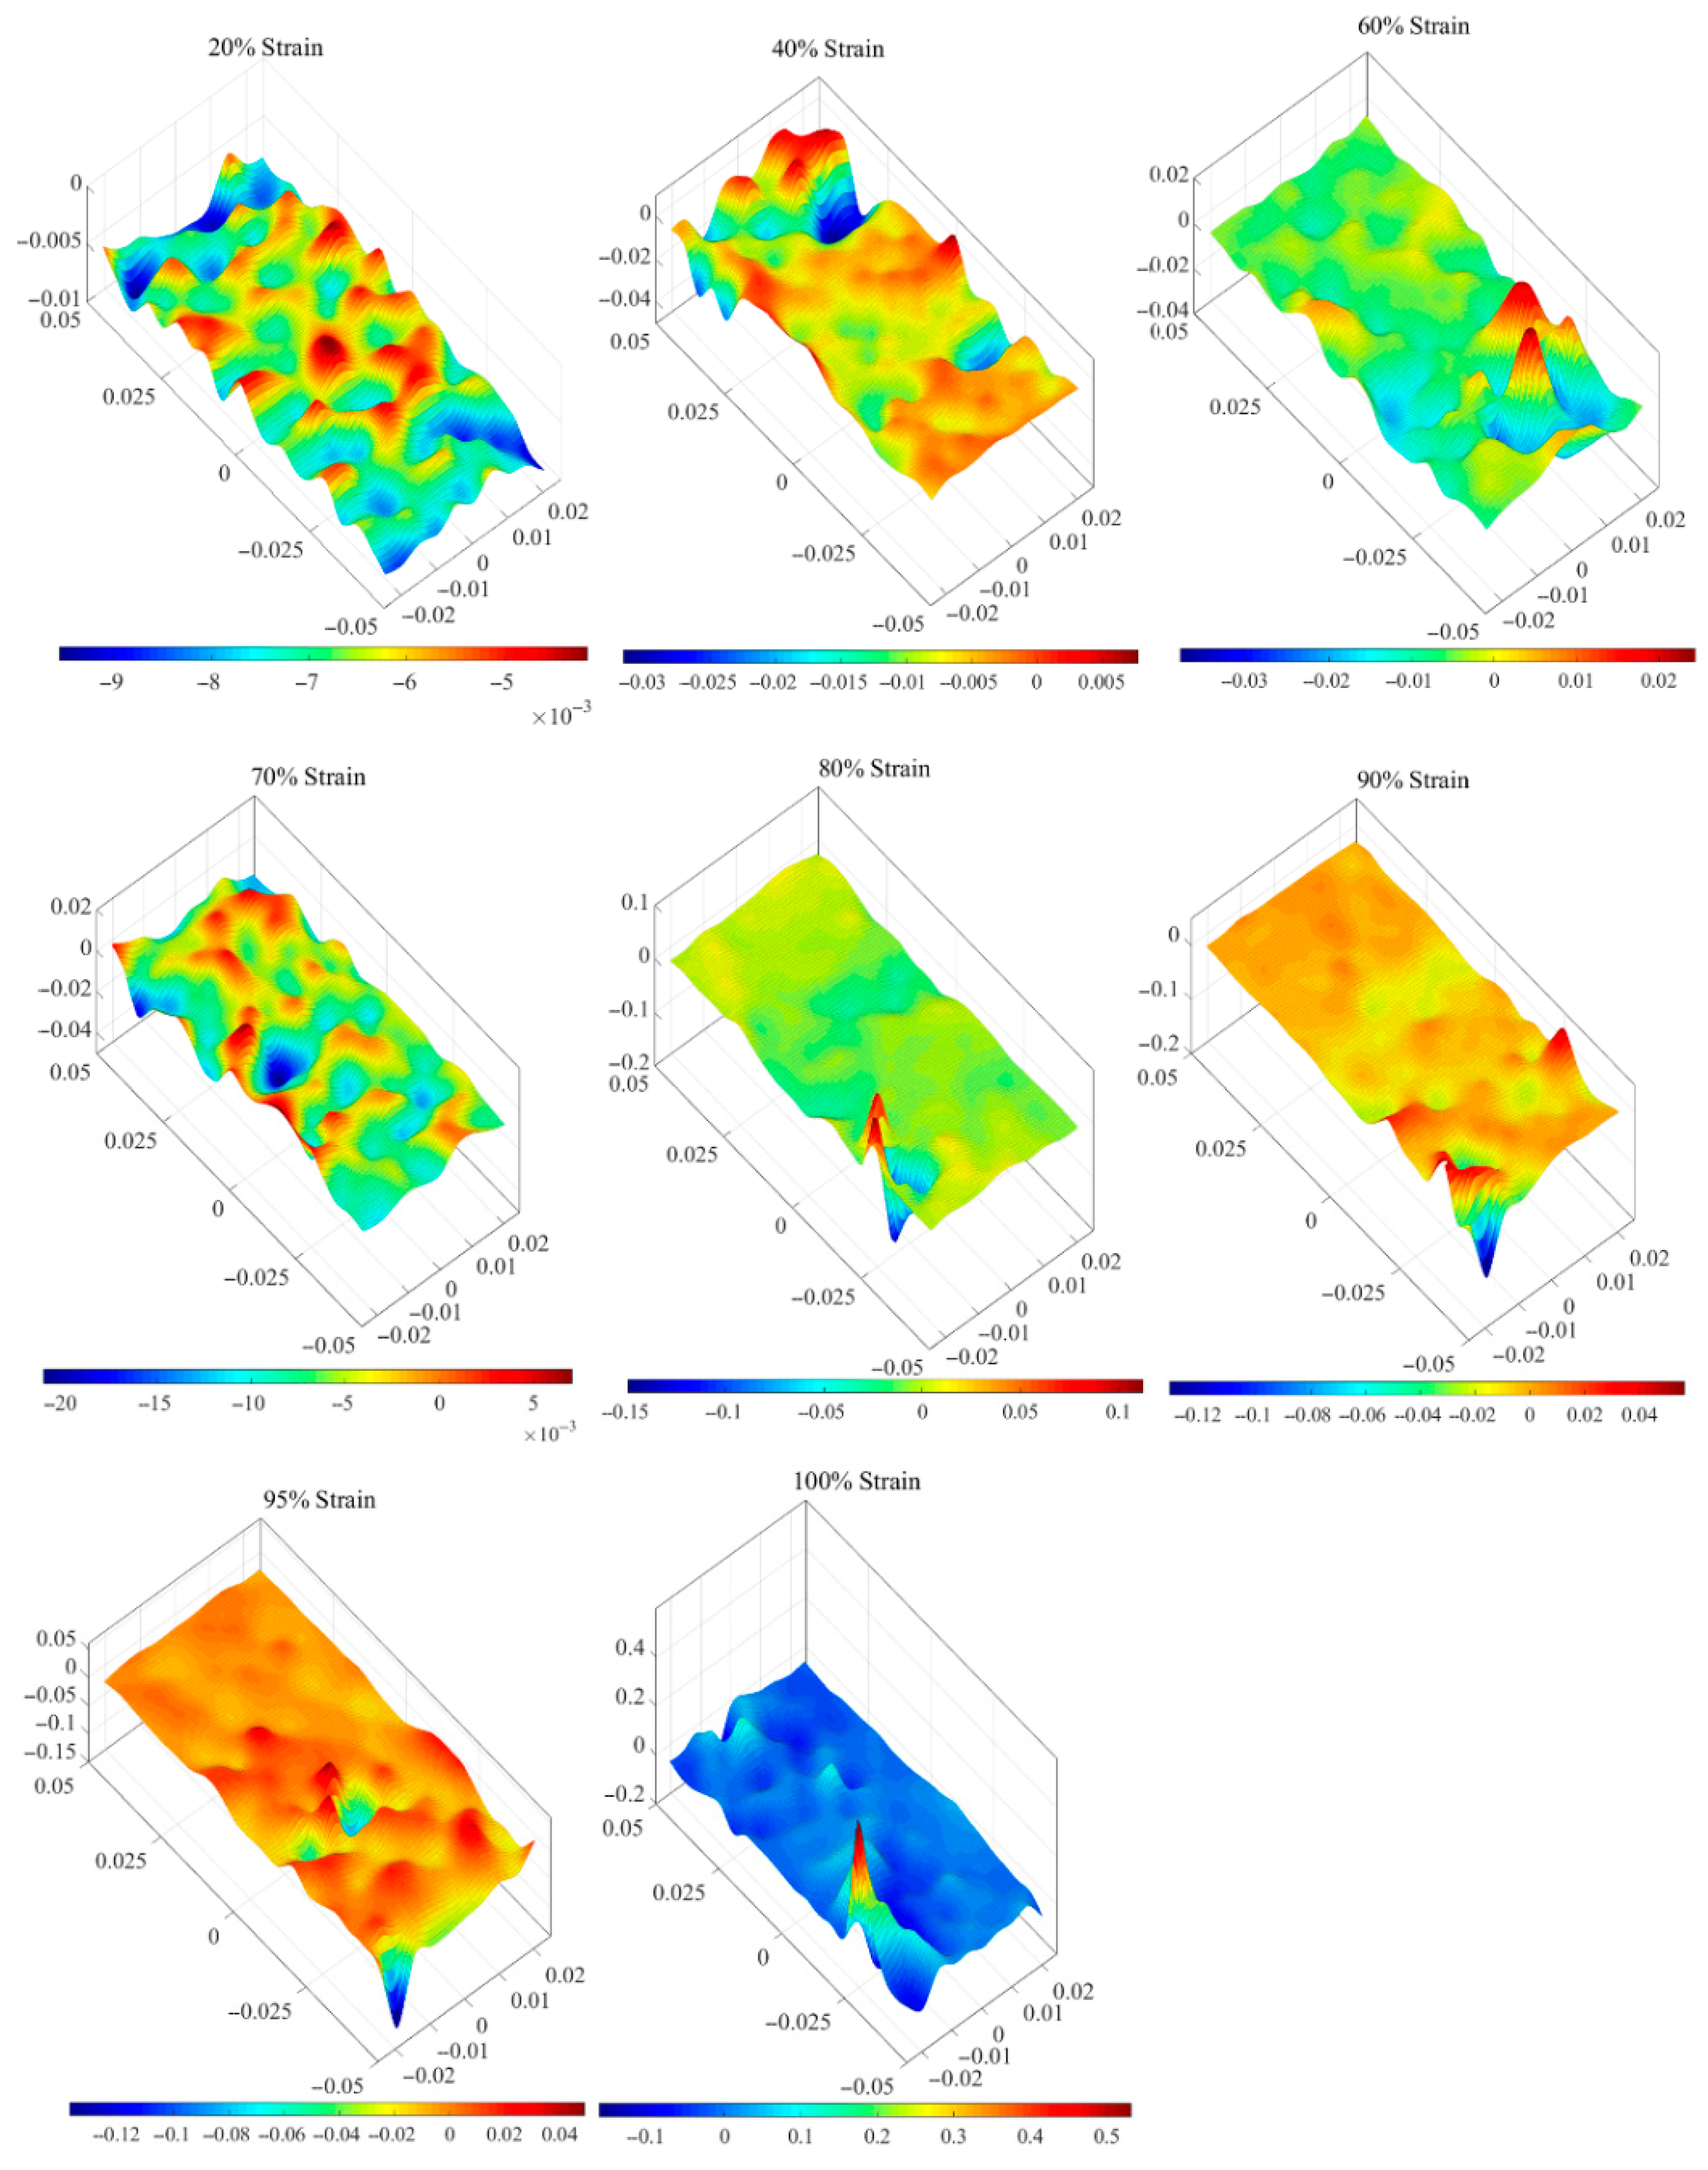
- Based on the comprehensive analysis of the variation characteristics of all MC strain rate statistic data, the damage evolution of the pre-peak loading stage could be separated into three sections. In section 1, the strain rate field is relatively flat, and all the statistical data are flat. In section 2, all types of statistic data of case 1 have different variation patterns from those of case 2. However, in section 3, relatively large - scale local fluctuations occur in the strain rate field,, and all the statistical data rapidly increased. Among all types of statistics, the standard deviation, the regional average of range, and the CV are more distinguished than others.
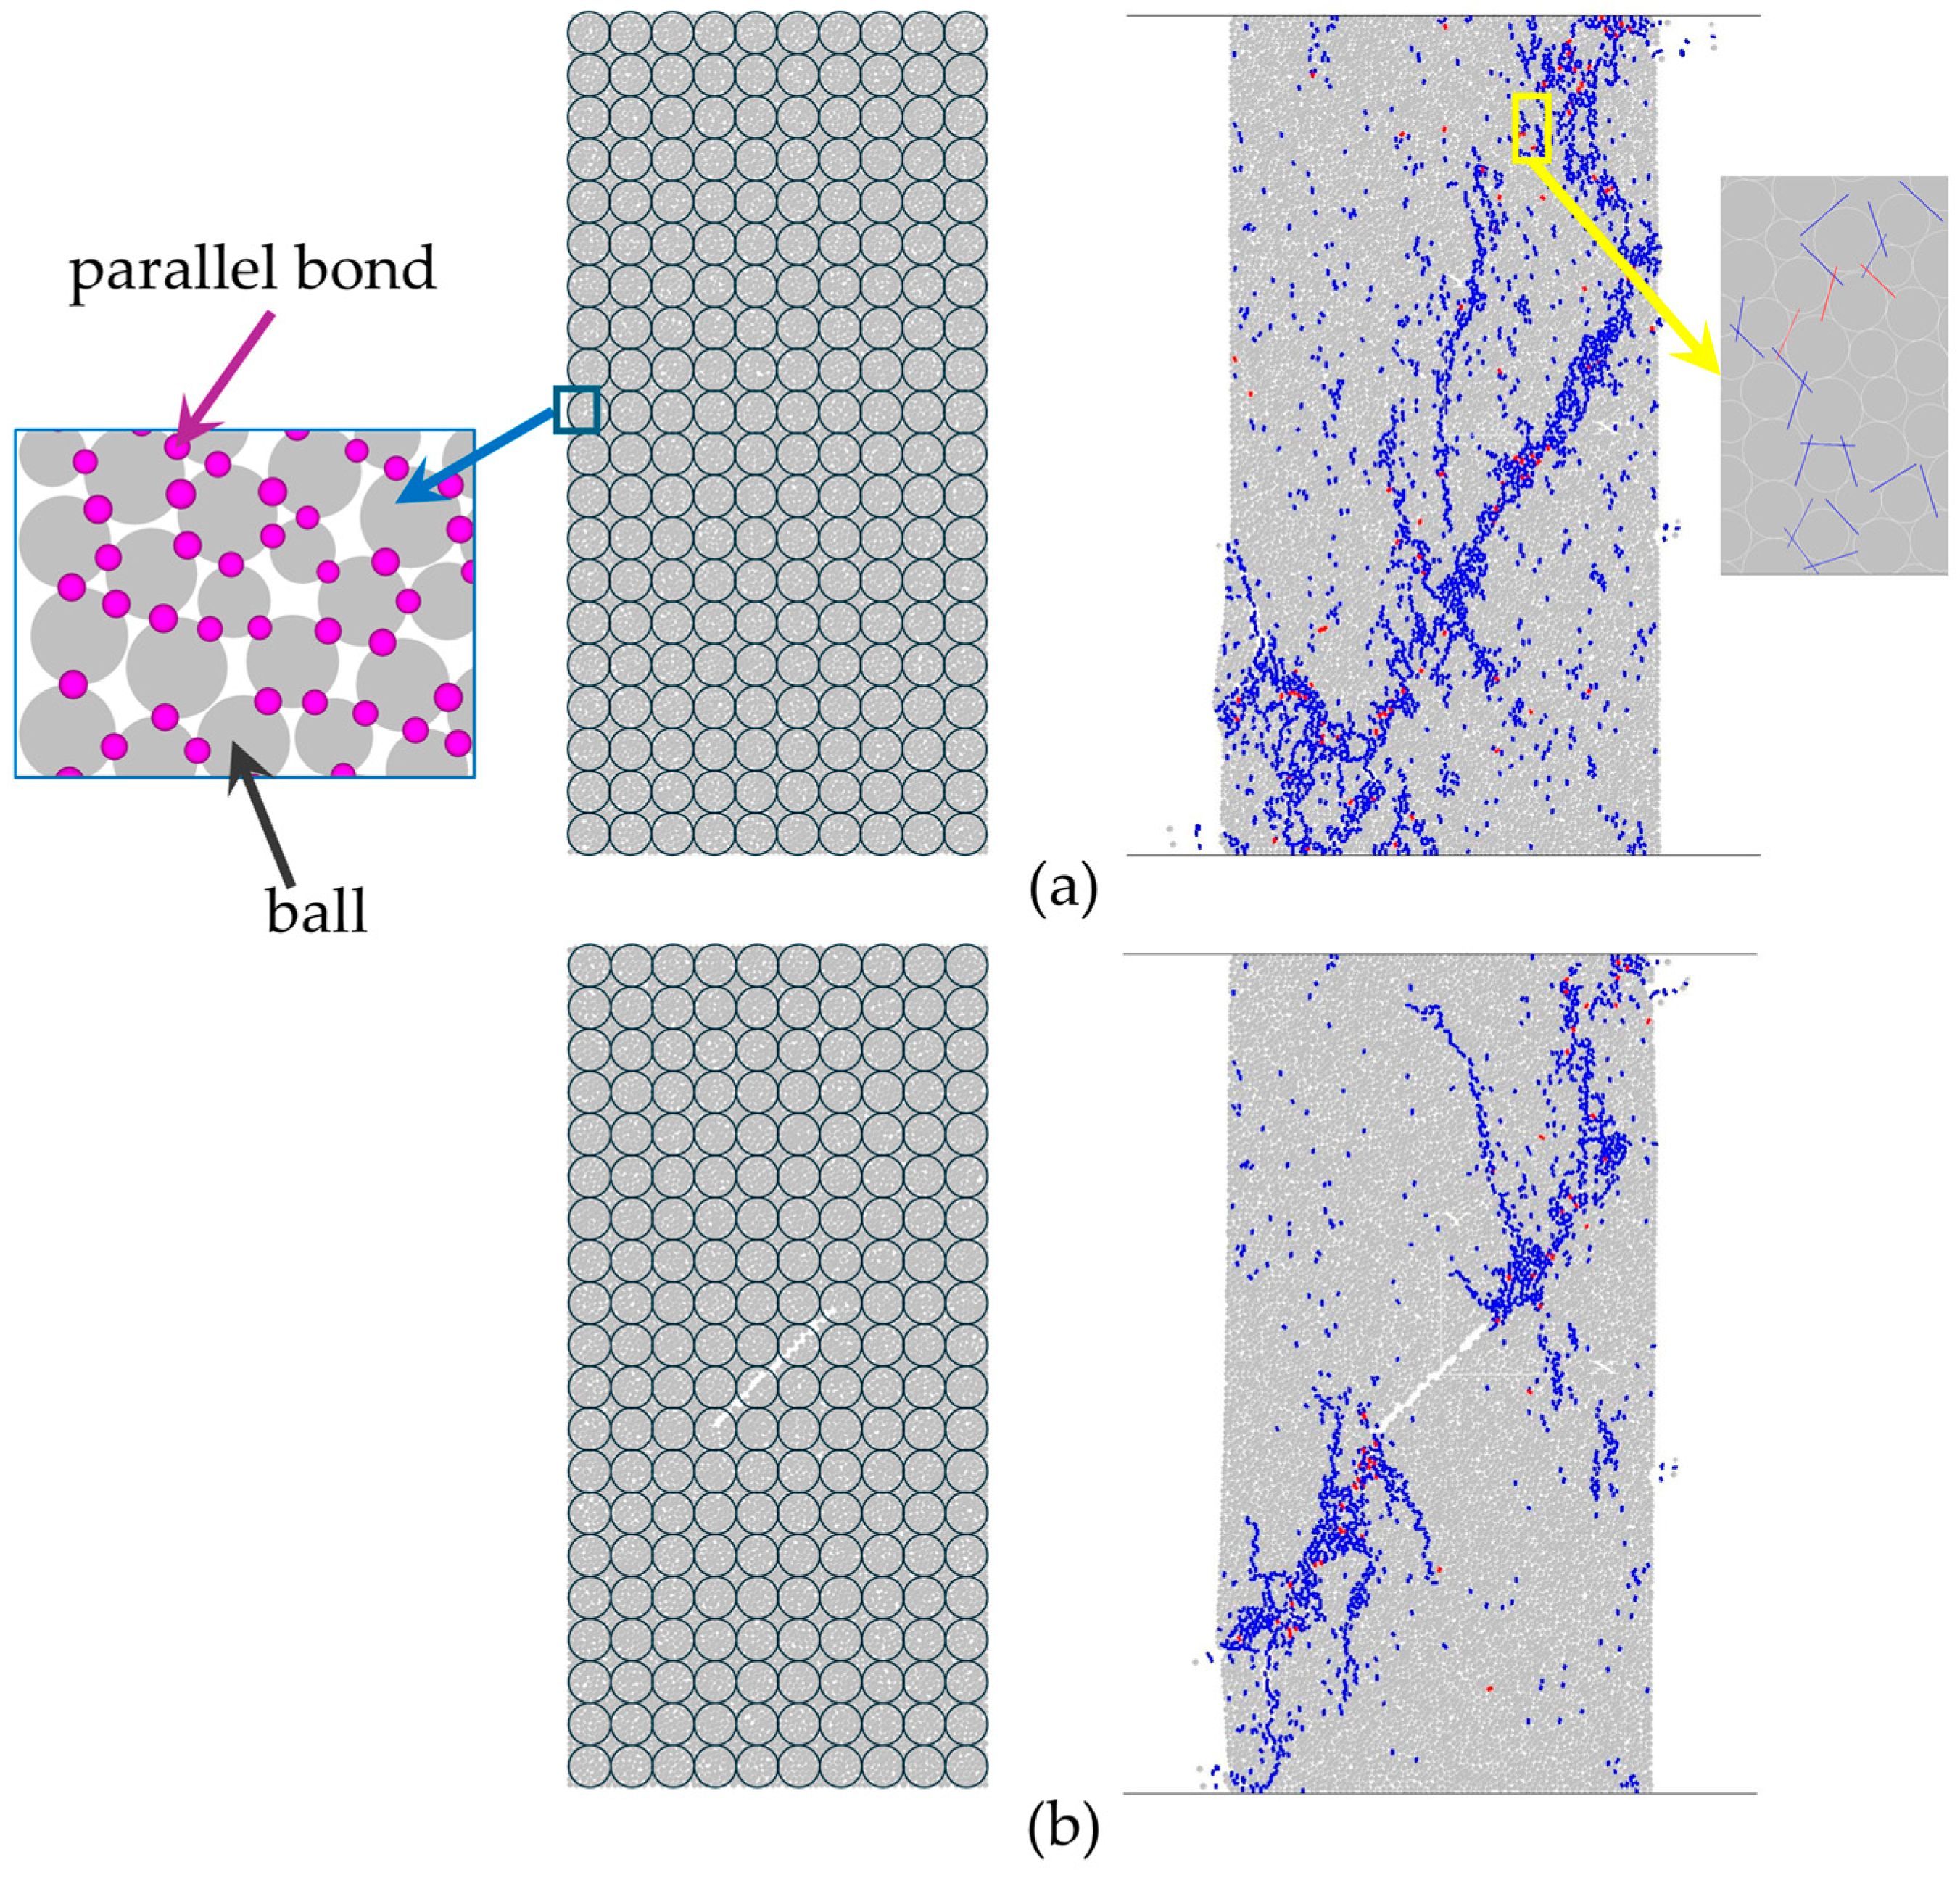
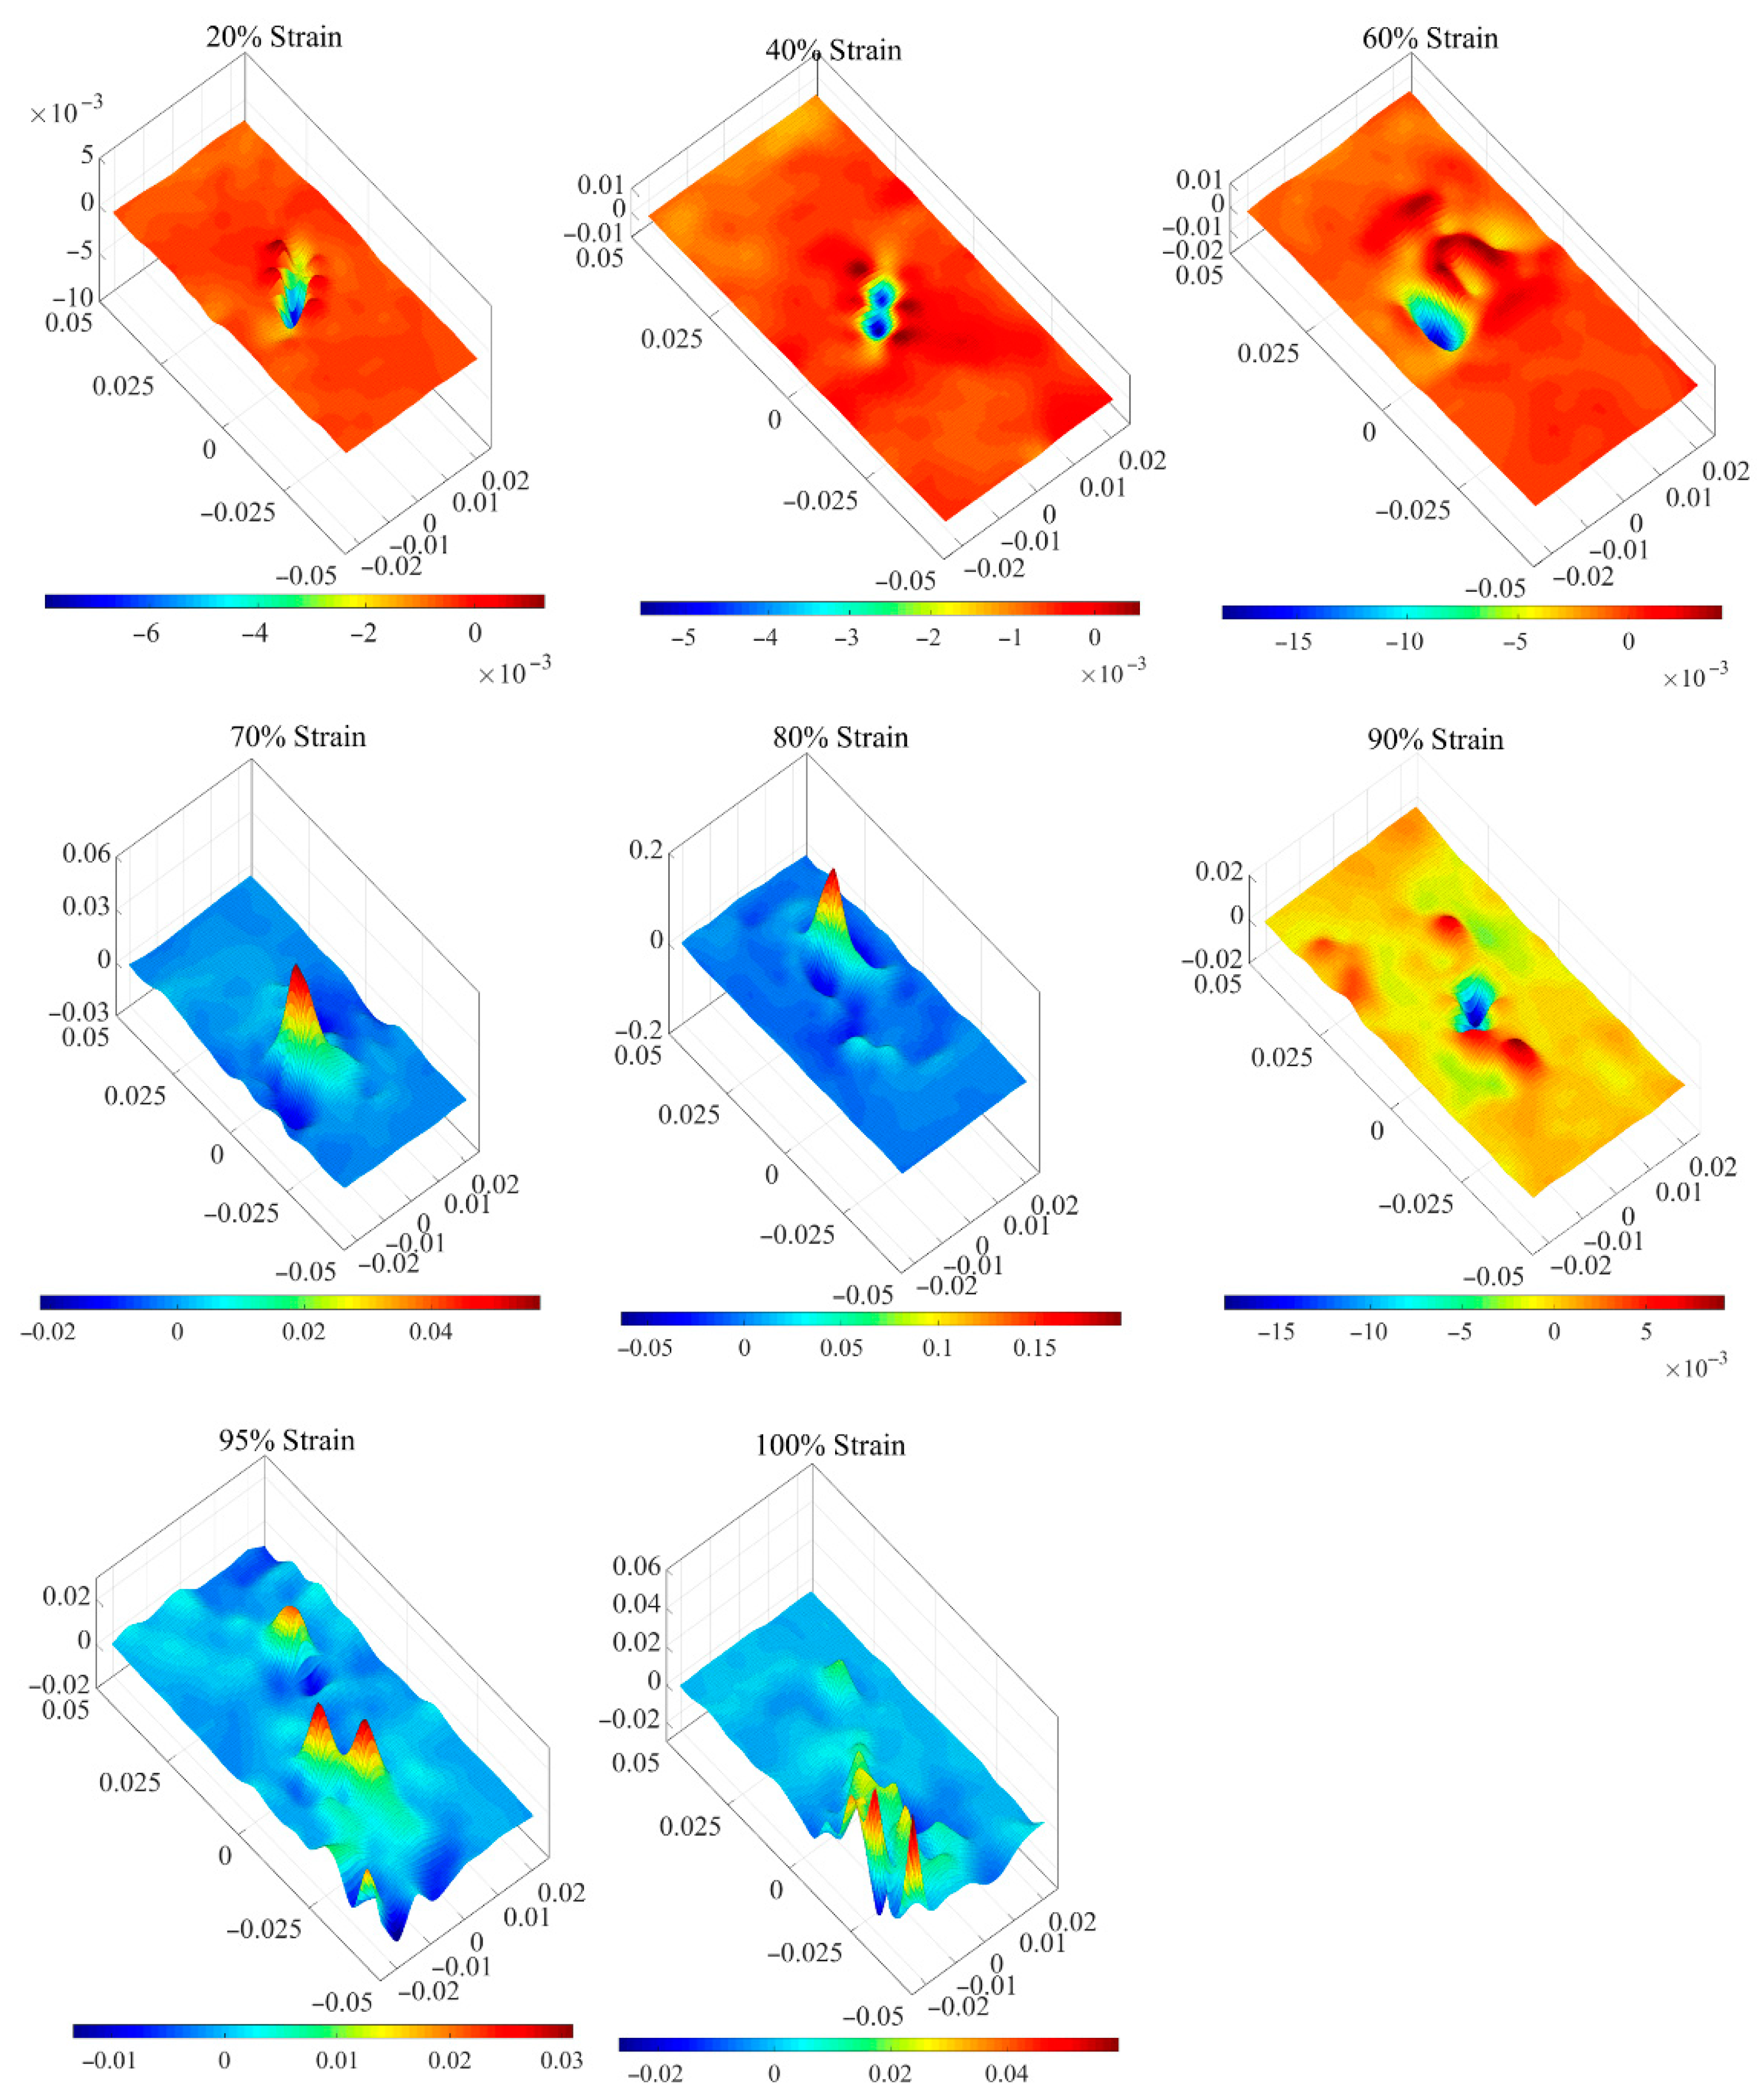
- Due to the pre-existing flaw, the development of the strain localization of case 1 and case 2, the intact sample, and the flawed sample is different from each other. The pre-existing flaw accelerates the damage evolution. The intact specimen in section 1 has a strain rate field with a regular fluctuation pattern, and, in section 2-1, the strain rate field has peaks randomly distributed. The damage evolution of the intact sample developed to the stage of the distributed damage. Meanwhile, the strain rate field of the flawed sample has the strain localization around the flaw. In section 2 and section 3, the pre-existing flaw has made all curves of the statistics fluctuate with some regular patterns.
- By taking full advantage of the volumetric strain rate field, the status of the damage evolution of the rock-like material sample can be analyzed and evaluated. The field contour maps of the MC strain rate can tell the damage position; the average deviation curve can judge the crack increment; the region average of the variation coefficient can indicate the damage section. This strain rate field can provide assistance on the prediction of catastrophic failure of rock-like material.
Author Contributions
Funding
Institutional Review Board Statement
Informed Consent Statement
Data Availability Statement
Acknowledgments
Conflicts of Interest
References
- Cook, N.G.W. The failure of rock. Int. J. Rock Mech. Min. Sci. Geomech. Abstr. 1965, 2, 389–403. [Google Scholar] [CrossRef]
- Ashby, M.F.; Sammis, C.G. The damage mechanics of brittle solids in compression. Pure Appl. Geophys. 1990, 133, 489–521. [Google Scholar] [CrossRef]
- Martin, C.D.; Chandler, N.A. The progressive fracture of Lac du Bonnet granite. Int. J. Rock Mech. Min. Sci. Geomech. Abstr. 1994, 31, 643–659. [Google Scholar] [CrossRef]
- Xu, X.; Ma, S.; Xia, M.; Ke, F.; Bai, Y. Damage evaluation and damage localization of rock. Theor. Appl. Fract. Mech. 2004, 42, 131–138. [Google Scholar] [CrossRef]
- Liang, C.; Li, X.; Wang, S.; Li, S.; He, J.; Ma, C. Experimental investigations on rate-dependent stress-strain characteristics and energy mechanism of rock under uniaixal compression. Yanshilixue Yu Gongcheng Xuebao/Chin. J. Rock Mech. Eng. 2012, 31, 1830–1838. [Google Scholar]
- Nikolic, M.; Ibrahimbegovic, A. Rock mechanics model capable of representing initial heterogeneities and full set of 3D failure mechanisms. Comput. Methods Appl. Mech. Eng. 2015, 290, 209–227. [Google Scholar] [CrossRef]
- Schön, J.H. Physical Properties of Rocks—Fundamentals and Principles of Petrophysics (first edition); Pergamon Press, Ltd.: Oxford, UK, 2004; pp. 3–4. [Google Scholar]
- Soloviev, S.P.; Spivak, A.A. Electromagnetic signals generated by the electric polarization during the constrained deformation of rocks. Izv. Phys. Solid Earth 2009, 45, 347–355. [Google Scholar] [CrossRef]
- Larionov, I.; Malkin, E.; Uvarov, V. Deformation-Electromagnetic Relations in Lithospheric Activity Manifestations. E3s Web Conf. 2018, 62, 03002. [Google Scholar] [CrossRef]
- Song, X.; Li, X.; Li, Z.; Cheng, F.; Zhang, Z.; Niu, Y. Experimental research on the electromagnetic radiation (EMR) characteristics of cracked rock. Environ. Sci. Pollut. Res. 2017, 25, 6596–6608. [Google Scholar] [CrossRef]
- Carlà, T.; Intrieri, E.; Di Traglia, F.; Nolesini, T.; Gigli, G.; Casagli, N. Guidelines on the use of inverse velocity method as a tool for setting alarm thresholds and forecasting landslides and structure collapses. Landslides 2016, 14, 517–534. [Google Scholar] [CrossRef]
- Liu, S.; Xu, Z.; Wei, J.; Huang, J.; Wu, L. Experimental Study on Microwave Radiation From Deforming and Fracturing Rock Under Loading Outdoor. IEEE Trans. Geosci. Remote Sens. 2016, 54, 5578–5587. [Google Scholar] [CrossRef]
- Shi, D.; Wang, J.; Xiong, L. Study on Noise Correction Algorithm of Infrared Emissivity of Rock under Uniaxial Compression. Sustainability 2022, 14, 12769. [Google Scholar] [CrossRef]
- Huang, L.-Q.; Wu, X.; Li, X.-B.; Wang, S.-F. Influence of sensor array on MS/AE source location accuracy in rock mass. Trans. Nonferrous Met. Soc. China 2023, 33, 254–274. [Google Scholar] [CrossRef]
- Bai, Y.; Xia, M.; Ke, F.; Li, H. Damage Field Equation and Criterion for Damage Localization. In IUTAM Symposium on Rheology of Bodies with Defects; Solid Mechanics and its Applications; Wang, R., Ed.; Springer: Dordrecht, The Netherlands, 1999; Volume 64, pp. 55–66. [Google Scholar] [CrossRef]
- Hao, S.; Wang, H.; Xia, M.; Ke, F.; Bai, Y. Relationship between strain localization and catastrophic rupture. Theor. Appl. Fract. Mech. 2007, 48, 41–49. [Google Scholar] [CrossRef]
- Cheng, J.; Yang, S.; Chen, K.; Ma, D.; Li, F.; Wang, L.M. Uniaxial experimental study of the acoustic emission and deformation behavior of composite rock based on 3D digital image correlation (DIC). Acta Mech. Sin. 2017, 33, 999–1021. [Google Scholar] [CrossRef]
- Ma, S.; Zhou, H. Surface strain field evolution of rock specimen during failure process. Chin. J. Rock Mech. Eng. 2008, 27, 1667–1673. [Google Scholar]
- Cheng, H.; Yang, X.; Zhang, C.; Ning, Z.; Li, Y. Characteristics of heterogeneous deformation and identification model of unstable damage state in pre-existing crack sandstone. J. Min. Saf. Eng. 2023, 40, 1290–1300. [Google Scholar] [CrossRef]
- Song, H.; Zhang, H.; Fu, D.; Kang, Y.; Huang, G.; Qu, C.; Cai, Z. Experimental study on damage evolution of rock under uniform and concentrated loading conditions using digital image correlation. Fatigue Fract. Eng. Mater. Struct. 2013, 36, 760–768. [Google Scholar] [CrossRef]
- Munoz, H.; Taheri, A.; Chanda, E.K. Pre-Peak and Post-Peak Rock Strain Characteristics During Uniaxial Compression by 3D Digital Image Correlation. Rock Mech. Rock Eng. 2016, 49, 2541–2554. [Google Scholar] [CrossRef]
- Sun, Q.; Cai, C.; Zhang, S.; Tian, S.; Li, B.; Xia, Y.; Sun, Q. Study of localized deformation in geopolymer cemented coal gangue-fly ash backfill based on the digital speckle correlation method. Constr. Build. Mater. 2019, 215, 321–331. [Google Scholar] [CrossRef]
- Salje, E.K.; Soto-Parra, D.E.; Planes, A.; Vives, E.; Reinecker, M.; Schranz, W. Failure mechanism in porous materials under compression: Crackling noise in mesoporous SiO2. Philos. Mag. Lett. 2011, 91, 554–560. [Google Scholar] [CrossRef]
- Nataf, G.F.; Castillo-Villa, P.O.; Baró, J.; Illa, X.; Vives, E.; Planes, A.; Salje, E.K. Avalanches in compressed porous SiO2-based materials. Phys. Review. E Stat. Nonlinear Soft Matter Phys. 2014, 902, 022405. [Google Scholar] [CrossRef] [PubMed]
- Zhao, Y.; Liu, H.; Xie, K.; Salje, E.K.; Jiang, X. Avalanches in Compressed Sandstone: Crackling Noise under Confinement. Crystals 2019, 9, 582. [Google Scholar] [CrossRef]
- Ma, J.; Li, D.; Luo, P.; Zhang, C.; Gao, F. Dynamic Damage and Failure of Layered Sandstone with Pre-cracked Hole Under Combined Cyclic Impact and Static Loads. Rock Mech. Rock Eng. 2022, 56, 2271–2291. [Google Scholar] [CrossRef]
- Gao, G.; Yao, W.; Xia, K.; Li, Z. Investigation of the rate dependence of fracture propagation in rocks using digital image correlation (DIC) method. Eng. Fract. Mech. 2015, 138, 146–155. [Google Scholar] [CrossRef]
- Xianyu, W.; Lu, X.; Zhao, Q.; Han, G. Strength and deformation characteristics of rock with single pre-existing fissure under different loading conditions. China Meas. Test 2017, 43, 124–129. [Google Scholar]
- Zhao, Y.; Gao, Y.; Wu, S.; Chen, L.; Zhang, C. Experimental and numerical study of failure characteristics of brittle rocks with single internal 3D open-type flaw. Acta Geotech. 2021, 16, 3087–3113. [Google Scholar] [CrossRef]
- Ding, X.; Xiao, X.-C.; Lv, X.-F.; Wu, D.; Pan, Y. Analysis of Similarities and Differences between Acoustic Emission and Charge Signal Based on Fractal Characteristics of Coal Fracture. Adv. Civ. Eng. 2020, 2020, 8745039. [Google Scholar] [CrossRef]
- Li, N.; Zhang, K.; Bao, R.; Fan, W. Quantitative description of fracture behavior and mechanical anisotropy of fractured rock mass: Sand 3D printing and DIC explorations. Theor. Appl. Fract. Mech. 2023, 127, 104065. [Google Scholar] [CrossRef]
- Misra, S. Deformation localization at the tips of shear fractures: An analytical approach. Tectonophysics 2011, 503, 182–187. [Google Scholar] [CrossRef]
- Zhou, X.; Zhang, Y.; Ha, Q.; Wang, J. Analysis of the localization of damage and the complete stress-strain relation for mesoscopic heterogeneous brittle rock subjected to compressive loads. Appl. Math. Mech. 2004, 25, 1039–1046. [Google Scholar] [CrossRef]
- Wang, X.; Hou, W.; Dong, W. Assessment of the failure precursors of the strain fields for the coal specimens in the uniaxial compression based on the digital image correlation method. J. Saf. Environ. 2018, 18, 1237–1245. [Google Scholar] [CrossRef]
- Zhang, K.; Li, N. Evolution law of strain field and precursor identification of flawed sandstone based on Digital Image Correlation method. Hydrogeol. Eng. Geol. 2021, 48, 150–156. [Google Scholar] [CrossRef]
- Wang, P.; Liu, Q.; Zhang, Y.; Huang, Z. Identifying rock fracture precursor by multivariate analysis based on the digital image correlation technique. Theor. Appl. Fract. Mech. 2023, 126, 103987. [Google Scholar] [CrossRef]
- Zhu, J.; Zhai, T.; Liao, Z.; Yang, S.; Liu, X.; Zhou, T. Low-Amplitude Wave Propagation and Attenuation Through Damaged Rock and a Classification Scheme for Rock Fracturing Degree. Rock Mech. Rock Eng. 2020, 53, 3983–4000. [Google Scholar] [CrossRef]
- Zhang, L.; Yang, D.; Chen, Z.; Liu, A. Deformation and failure characteristics of sandstone under uniaxial compression using distributed fiber optic strain sensing. J. Rock Mech. Geotech. Eng. 2020, 12, 1046–1055. [Google Scholar] [CrossRef]
- Hegger, S.; Vlachopoulos, N.; Poles, T.; Diederichs, M.S. Measuring the Full-Field Strain Response of Uniaxial Compression Test Specimens Using Distributed Fiber Optic Sensing. Rock Mech. Rock Eng. 2021, 55, 2615–2630. [Google Scholar] [CrossRef]
- Jin, J.; Cao, P.; Chen, Y.; Pu, C.; Mao, D.; Fan, X. Influence of single flaw on the failure process and energy mechanics of rock-like material. Comput. Geotech. 2017, 86, 150–162. [Google Scholar] [CrossRef]
- Sun, Q.; Liu, X.; Zhang, G.; Liu, C.; Jin, F. The mesoscopic structures of dense granular materials. Adv. Mech. 2017, 47, 263–308. [Google Scholar] [CrossRef]

| Intact Specimen | 45° Flaw Specimen | |||
|---|---|---|---|---|
| BPM | Physical Experiment | BPM | Physical Experiment | |
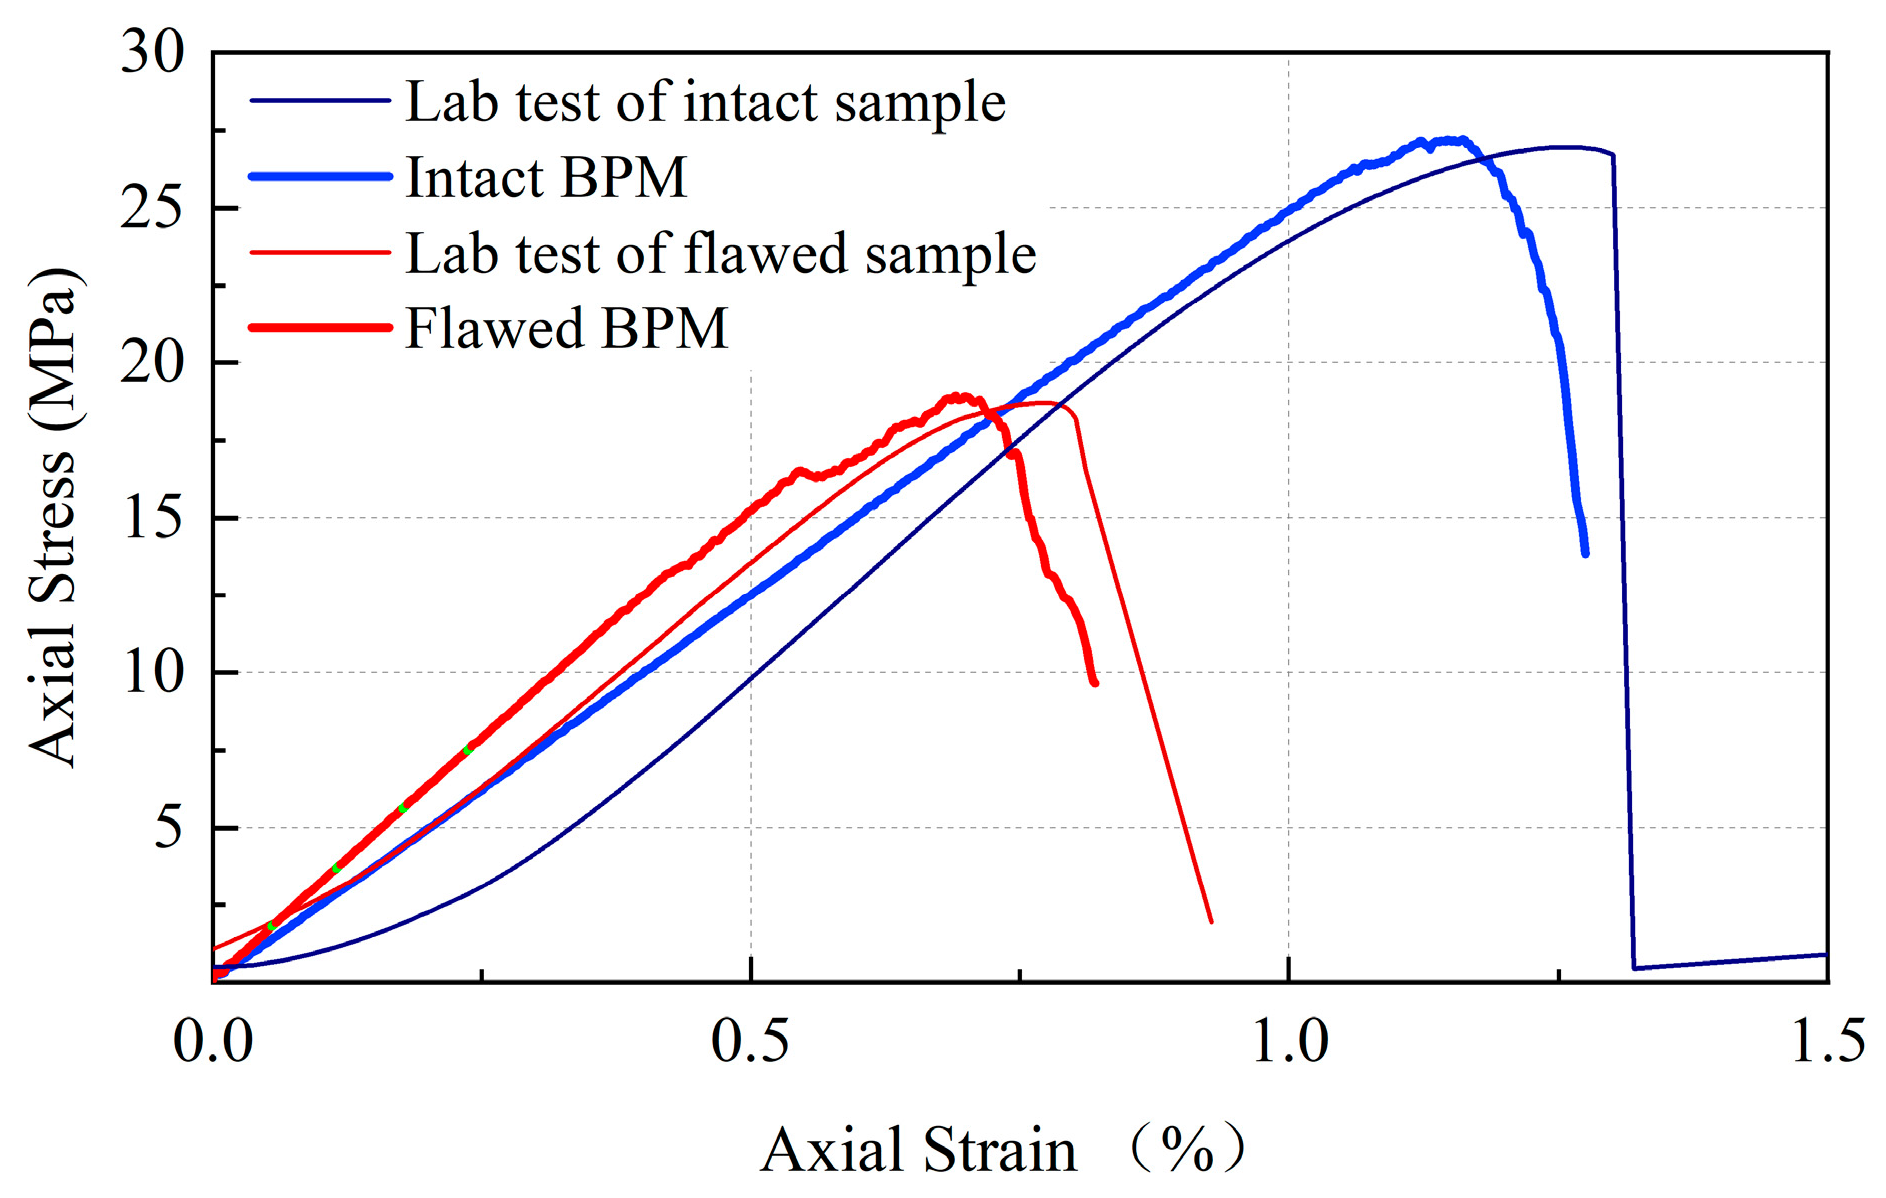
| Uniaxial compressive strength (UCS)/MPa | 27.58 | 26.96 | 18.9 | 19.12 |
| Elastic modulus/GPa | 3.2 | 3.0 | 2.9 | 3.0 |
| Poisson’s ratio | 0.24 | 0.17 | 0.28 | -- |
| Crack Increment | Damage Discriminating Judgment | Damage Position | |
|---|---|---|---|
| Range | + | + | − |
| Average | + | + | − |
| Average deviation | +++ | + | − |
| Standard deviation | + | + | − |
| Coefficient of variation | + | + | − |
| Range RA | + | +++ | − |
| CV RA | + | +++ | − |
| Contour map of strain rate field | + | + | +++ |
Disclaimer/Publisher’s Note: The statements, opinions and data contained in all publications are solely those of the individual author(s) and contributor(s) and not of MDPI and/or the editor(s). MDPI and/or the editor(s) disclaim responsibility for any injury to people or property resulting from any ideas, methods, instructions or products referred to in the content. |
© 2025 by the authors. Licensee MDPI, Basel, Switzerland. This article is an open access article distributed under the terms and conditions of the Creative Commons Attribution (CC BY) license (https://creativecommons.org/licenses/by/4.0/).
Share and Cite
Jin, J.; Cao, P.; Zhang, J.; Wang, Y.; Miao, C.; Li, J.; Bai, X. Damage Evolution and Failure Precursor of Rock-like Material Under Uniaxial Compression Based on Strain Rate Field Statistics. Appl. Sci. 2025, 15, 686. https://doi.org/10.3390/app15020686
Jin J, Cao P, Zhang J, Wang Y, Miao C, Li J, Bai X. Damage Evolution and Failure Precursor of Rock-like Material Under Uniaxial Compression Based on Strain Rate Field Statistics. Applied Sciences. 2025; 15(2):686. https://doi.org/10.3390/app15020686
Chicago/Turabian StyleJin, Jin, Ping Cao, Jun Zhang, Yanchao Wang, Chenxi Miao, Jie Li, and Xiaohong Bai. 2025. "Damage Evolution and Failure Precursor of Rock-like Material Under Uniaxial Compression Based on Strain Rate Field Statistics" Applied Sciences 15, no. 2: 686. https://doi.org/10.3390/app15020686
APA StyleJin, J., Cao, P., Zhang, J., Wang, Y., Miao, C., Li, J., & Bai, X. (2025). Damage Evolution and Failure Precursor of Rock-like Material Under Uniaxial Compression Based on Strain Rate Field Statistics. Applied Sciences, 15(2), 686. https://doi.org/10.3390/app15020686