Article

Research on the Identification of Rock Mass Structural Planes and Extraction of Dominant Orientations Based on 3D Point Cloud

1
Faculty of Land and Resources Engineering, Kunming University of Science and Technology, Kunming 650093, China
2
City College, Kunming University of Science and Technology, Kunming 650051, China
3
Yunnan Geological Engineering the Second Investigation Institute, Kunming 650213, China
*
Authors to whom correspondence should be addressed.
Appl. Sci. 2024, 14(21), 9985; https://doi.org/10.3390/app14219985
Submission received: 22 September 2024 / Revised: 26 October 2024 / Accepted: 29 October 2024 / Published: 31 October 2024
(This article belongs to the Special Issue Recent Advances in Rock Mass Engineering)

Abstract

:
The different spatial distribution forms of rock mass structural planes create weak zones in the rock mass, which is also a key factor in controlling rock mass stability. Accurately and efficiently identifying rock mass structural planes and obtaining their dominant orientations is critical for rock mass engineering design and construction. Traditional surveying methods for high and steep rock mass structural planes pose high safety risks, offer limited data, and make comprehensive statistical analysis difficult. This paper utilizes complex rock mass surface 3D point cloud data obtained through 3D laser scanning technology and uses the Hough space transform method to calculate the normal vectors of the 3D point cloud. Based on the difference in normal vectors and surface variation, region growing segmentation is applied to identify and extract rock mass structural planes. Additionally, the fast search and density peak clustering method (CFSFDP) is used for clustering analysis of the rock mass structural planes to obtain dominant orientations. This method was applied to a highway’s high and steep rock slope, successfully identifying 281 structural planes and two sets of dominant structural planes. The orientation of the dominant structural planes identified through RocScience Dips 7.0 analysis showed a deviation of no more than ±3°, complying with engineering standards. The research results offer a feasible solution for the identification of high and steep rock mass structural planes and the extraction of the orientation of dominant structural planes.

1. Introduction

Rock mass structural planes refer to natural or artificial discontinuities in rock masses, including fractures, faults, joints, bedding, and shear zones. The structural planes developed within the rock mass are the weakest geological interfaces in terms of mechanical properties and are critical factors that determine the mechanical behavior and stability of the rock mass [1]. Accurate and efficient identification of rock mass structural planes and the extraction of dominant orientations have always been key concerns in the fields of geotechnical and geological engineering [2,3]. Traditional methods for surveying structural planes primarily rely on manual operations using simple tools such as measuring tapes and geological compasses for contact measurements. However, when dealing with high and steep rock masses or slopes, these methods are inefficient and carry significant safety risks [4]. Additionally, the data obtained from manual measurements are limited, and these discrete local data points are difficult to integrate for analysis, making comprehensive assessment of the entire rock mass or slope challenging.
With the development of non-contact measurement technologies, photogrammetry (UAV) and terrestrial laser scanning (TLS) have been widely applied in geological engineering. Photogrammetry can capture two-dimensional images of rock mass surfaces, and many researchers have used multi-view vision techniques to quickly reconstruct 3D models of the study area and obtain structural plane information from rock masses based on these 2D images [5,6,7]. However, photogrammetry is influenced by factors such as image resolution, camera parameters, 3D model construction algorithms, and external environmental conditions. As a result, the final 3D model often has low coordinate accuracy, low automation in structural plane identification, and significant errors in the extracted structural plane information. Terrestrial laser scanning technology overcomes the limitations of single-point measurements and can acquire high-precision, high-density 3D point cloud data that represent the structural features of the rock mass surface, providing fundamental data for structural plane identification and clustering analysis. As early as the late 20th century, Hoppe [8] began research on identifying specific planes within 3D point clouds by searching the neighborhood of each core point, applying the PCA method to fit local planes, and calculating the normal vectors of these planes to replace the core point’s normal vector. This approach offered a new idea for accurately computing the normal vectors of point cloud data. S. Slob [9] constructed a triangulated mesh from point cloud data and calculated the orientation of each triangular facet, implementing a fuzzy K-means clustering algorithm to identify structural planes and calculate their spacing. Gigli G [10] set a coplanarity threshold and used a variable-sized search cube to select points that met the coplanarity threshold for plane fitting and developed the structural plane analysis software DiAna. Ge [11] processed point cloud data by meshing, set appropriate region-growing thresholds, and achieved intelligent identification of rock mass structural planes, summarizing the impact of threshold changes on identification results. Chen [12] applied an improved RANSAC algorithm and an enhanced Graham scan algorithm to identify rock mass structural planes and provide a refined description of structural plane boundaries. She developed the RDD (RANSAC discontinuity detection) program, which can extract orientation and size information of structural planes. Kong et al. [13] utilized the KNN algorithm to search for the optimal neighborhood, calculated the point cloud normal vectors based on coplanarity criteria and the least squares method, and then converted them into orientation information. Finally, the KDE and DBSCAN algorithms were combined to cluster the point cloud data, achieving the extraction of rock mass structural plane information. Gou [14] applied the Firefly Algorithm (FA) and Fuzzy C-means (FCM) algorithm for semi-automated clustering analysis of rock mass structural planes based on normal vectors. Gao [15] proposed a new method for identifying discontinuous sets of rock masses based on fast search and density peak identification and validated the accuracy of the method using regular geometric datasets. Cui, Chen, and Wang et al. [16,17,18] improved the traditional K-means algorithm using variable-length string genetic algorithms, maximum sample density, and the Artificial Fish Swarm Algorithm (AFSA), achieving clustering analysis of rock mass structural plane orientations. Kong et al. [19] used the fast search and density peak identification (CFSFDP) algorithm for clustering analysis of structural planes and used Fisher’s K-index to filter out noise points, thus improving the accuracy of the clustering centers.
In summary, many scholars at home and abroad have long been dedicated to the automatic extraction of rock mass structural plane information from 3D point cloud data. Since 3D point cloud data is inherently discrete and lacks topological relationships, data mining methods are needed to extract characteristic values that represent rock mass structural planes, with the accurate calculation of normal vectors being particularly crucial [20,21,22,23]. Factors such as noise, point density, and the complexity of the rock mass surface can affect the accuracy of normal vector calculations. Therefore, this paper adopts the Hough space transform method based on statistical principles to accurately calculate the normal vectors of 3D point clouds and uses the differences in normal vectors between adjacent points for region-growing segmentation, achieving the automatic identification and information extraction of rock mass structural planes. The extraction of dominant orientations of structural planes plays an irreplaceable role in the stability analysis of rock masses. Dominant structural planes determine the sliding direction and failure modes of rock masses under different stress conditions. Accurate extraction of dominant orientations not only provides key input parameters for rock mass stability evaluation but also offers scientific guidance for support design and optimization of construction plans [24,25]. Existing clustering algorithms for rock mass structural planes are numerous but generally rely on trial and error and experience to determine the clustering centers and the number of clusters, making the results susceptible to subjective influences and limiting the amount of input data. In this paper, the sine squared value of the normal vectors is used as a similarity measure, and the fast search and density peak clustering method (CFSFDP) is applied for clustering analysis. This method automatically determines the clustering centers and numbers, avoiding subjective parameter settings, thereby improving the efficiency and accuracy of clustering and ensuring the precise extraction of the orientation of dominant structural planes [26,27,28].

2. Methods

Based on 3D point cloud data, this paper addresses the limitations in rock mass structural planes recognition and clustering methods. The Hough space transform method is employed to compute the normal vectors of the point cloud data. The differences in normal vectors are used as criteria for region growing segmentation, leading to the development of an effective and noise-resistant method for rock mass structural planes recognition and information extraction. Subsequently, the rock mass structural planes are used as clustering objects, and clustering analysis is performed using the Clustering by Fast Search and Find of Density Peaks (CFSFDP) method to extract the orientations of dominant structural planes. The specific workflow is shown in Figure 1.

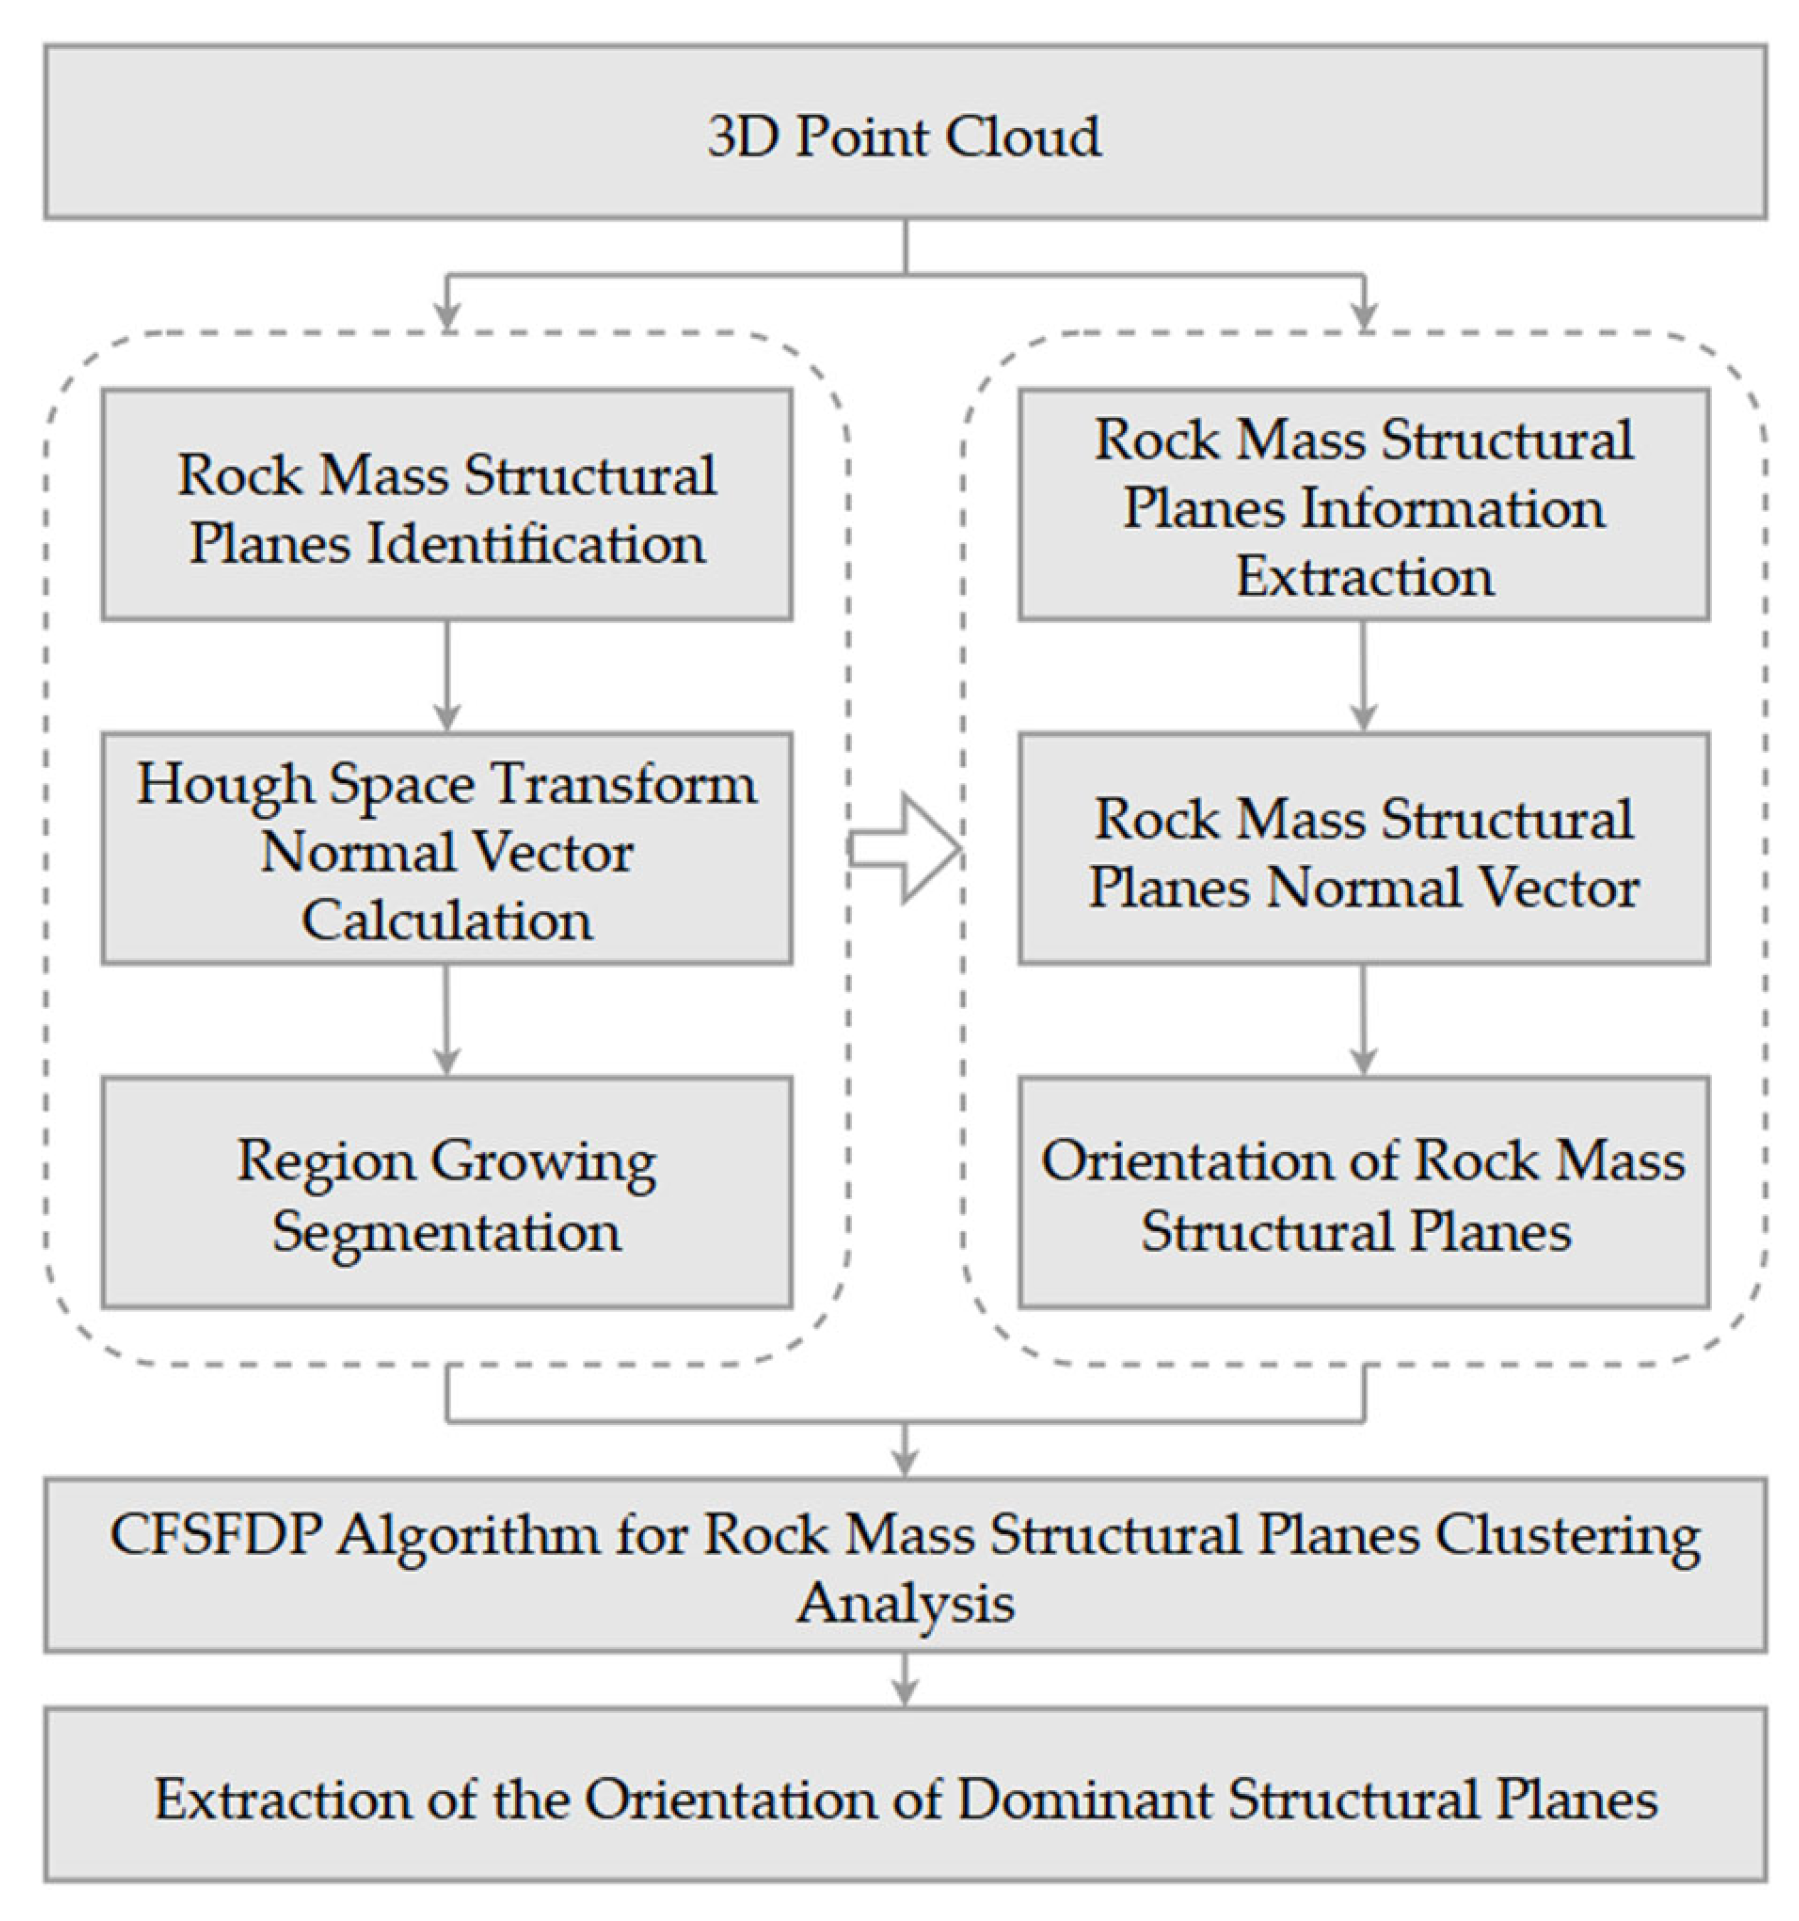
2.1. Identification and Information Extraction of Rock Mass Structural Planes

2.1.1. Rock Mass Structural Planes Identification

The core idea of region growing is to use certain common features of point cloud data as the basis for judgment. By selecting arbitrary points and comparing them with neighboring points in one or multiple dimensions, points with similar features are segmented and merged. There are three key issues to consider during the region growing process [29].
  • Selection of Seed Points
Region growing is a seed-point-based point cloud segmentation algorithm. The initial seed points should be selected from areas with relatively high flatness to improve the computation speed. The surface variation S V i of each point is calculated, where S V i represents the surface roughness within the neighborhood. The points are sorted in ascending order based on their surface variation values, and the point with the smallest S V i is chosen as the initial seed point.
2.
Feature Judging Criteria
Rock mass structural planes are typically composed of relatively flat planes and sharp edges, with field investigations primarily using sharp edges as boundaries. In the identification of rock mass structural planes, the normal vector serves as a crucial feature for differentiating between various planes; points within the same rock mass structural plane should have similar or identical normal vector orientations. The difference in normal vectors between adjacent points is used as a criterion for region-growing segmentation of the point cloud data.
The Hough transform employs statistical principles to effectively enhance the noise resistance and computation of normal vectors on complex rock surfaces. The core of this method involves randomly selecting two points from the neighborhood and a seed point to form a plane, calculating the normal vector of that plane, and traversing all combinations to statistically identify the most frequently occurring normal vector as the final normal vector for the seed point. In the context of structural surfaces, any given point in space can be classified into three positional states: (1) away from the edge, (2) near the edge, and (3) on the edge. When the seed point is in states 1 or 2, two non-collinear points are randomly selected from the defined neighborhood K to form a plane with the seed point. The normal vectors calculated from all combinations will exhibit a “random” normal distribution, allowing for the determination of the most probable normal vector. When the point is in the third positional state (on the edge), due to the potential differences in point cloud density on either side of the edge, the method can still identify the most probable normal vector as the final normal vector for the seed point by appropriately setting the maximum number of plane combinations ( T max ) and confidence level. This approach effectively addresses the challenges posed by complex geometries and enhances the accuracy of rock structural surface extraction.
3.
Stopping Conditions for Growth
When calculating the normal vector of the point cloud using the Hough space transform, if the K value is too large or the point cloud density within the neighborhood is too high, numerous planes will be generated during the combination process. Region growing stops when the number of planes exceeds the maximum plane count T max , or when the confidence level satisfies the requirement. If the number of clustered points in a structural plane is less than the minimum cluster point count C min , region growing will also stop.
The region growing process based on the normal vector differences using the Hough space transform is as follows:
(1)
Set the neighborhood size K , calculate the surface variation S V i of the point cloud, sort the point cloud data in ascending order by S V i , and select the point with the smallest S V i as the initial seed point.
(2)
Randomly select two points from the neighborhood and the current seed point to form a plane T i . Calculate the normal vector N i of the plane T i , then vote all normal vectors into the corresponding storage container. Region growing stops when the combination satisfies T max and the confidence level is met. The mean of the normal vectors in the container with the highest vote count is selected as the final normal vector for the point.
(3)
Set the normal vector angle threshold θ t h , calculate the angle Δ θ i between the normal vector of the neighboring point and the current seed point. If Δ θ i < θ t h , the neighboring point is added to the current region.
(4)
Set the surface variation threshold S V t h , calculate the difference Δ S V i between the surface variation of the neighboring point and the current seed point. If Δ S V i < S V t h , remove the current seed point and designate the neighboring point as the new seed point, continuing the growth process with the new seed point.
(5)
Repeat steps (3) and (4). If the number of clustered points is less than C min , the region growing process for that area is complete, and the region is added to the cluster array.
(6)
Repeat step (5) until all points are traversed.

2.1.2. Extraction of Rock Mass Structural Planes Information

After region growing, the points within the same structural planes are grouped together to form a point set with different point sets assigned different colors to distinguish each structural plane. Based on the least squares principle, plane fitting is performed for each point set, and the normal vector of the plane is calculated. Using principles of analytical geometry, the normal vector is converted into the structural plane’s orientation information, specifically dip direction and dip angle.
Let the normal vector of the structural planes be N = ( a , b , c ) T with c > 0 , and the formulas for calculating the dip direction α and dip angle β of the structural planes can be applied, as verified and used by Dong [30]. In the geographic coordinate system, assuming the positive direction of the Y-axis is north, the positive direction of the X-axis is east, and the positive direction of the Z-axis is upward, the formulas for calculating the dip direction α and dip angle β are as follows:
β = arccos ( c ) i f   a 0 , b 0 , α = arcsin ( a / sin β ) i f   a < 0 , b < 0 , α = 360 arcsin ( a / sin β ) i f   a 0 , b 0 , α = 180 arcsin ( a / sin β ) i f   a 0 , b 0 , α = 180 + arcsin ( a / sin β )

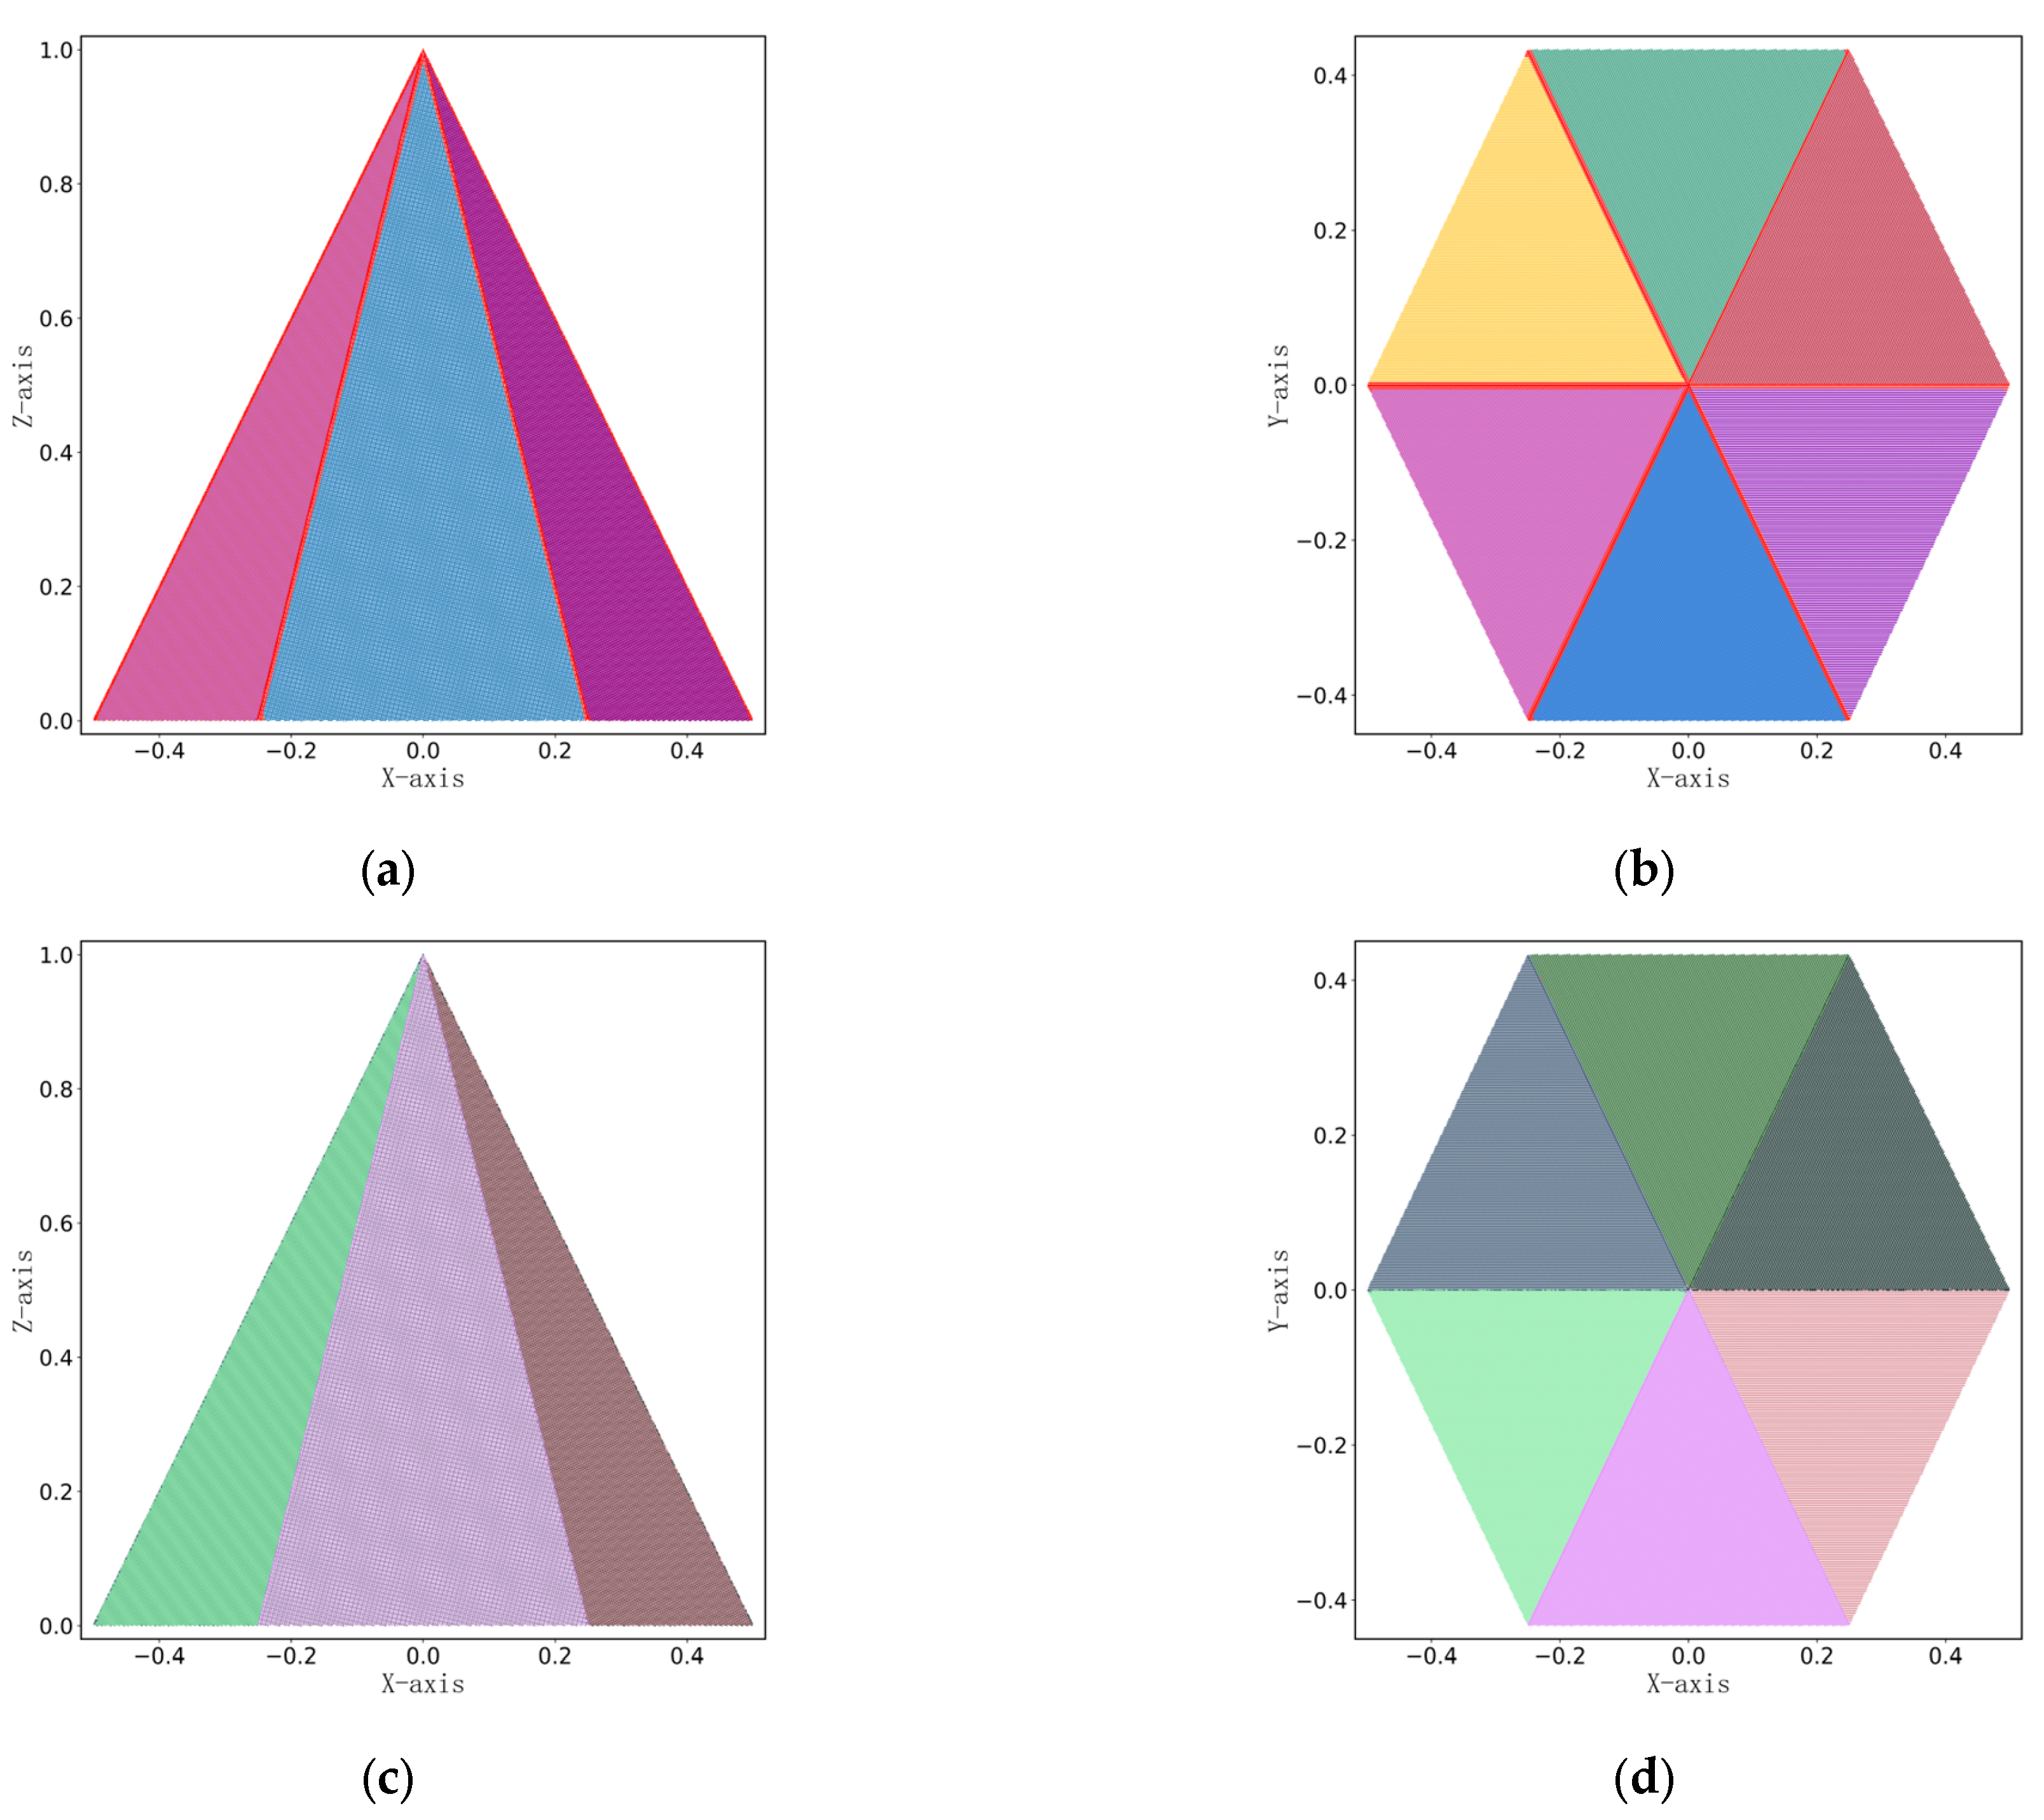
2.1.3. Application Analysis of Rock Mass Structural Planes Identification and Information Extraction

4.
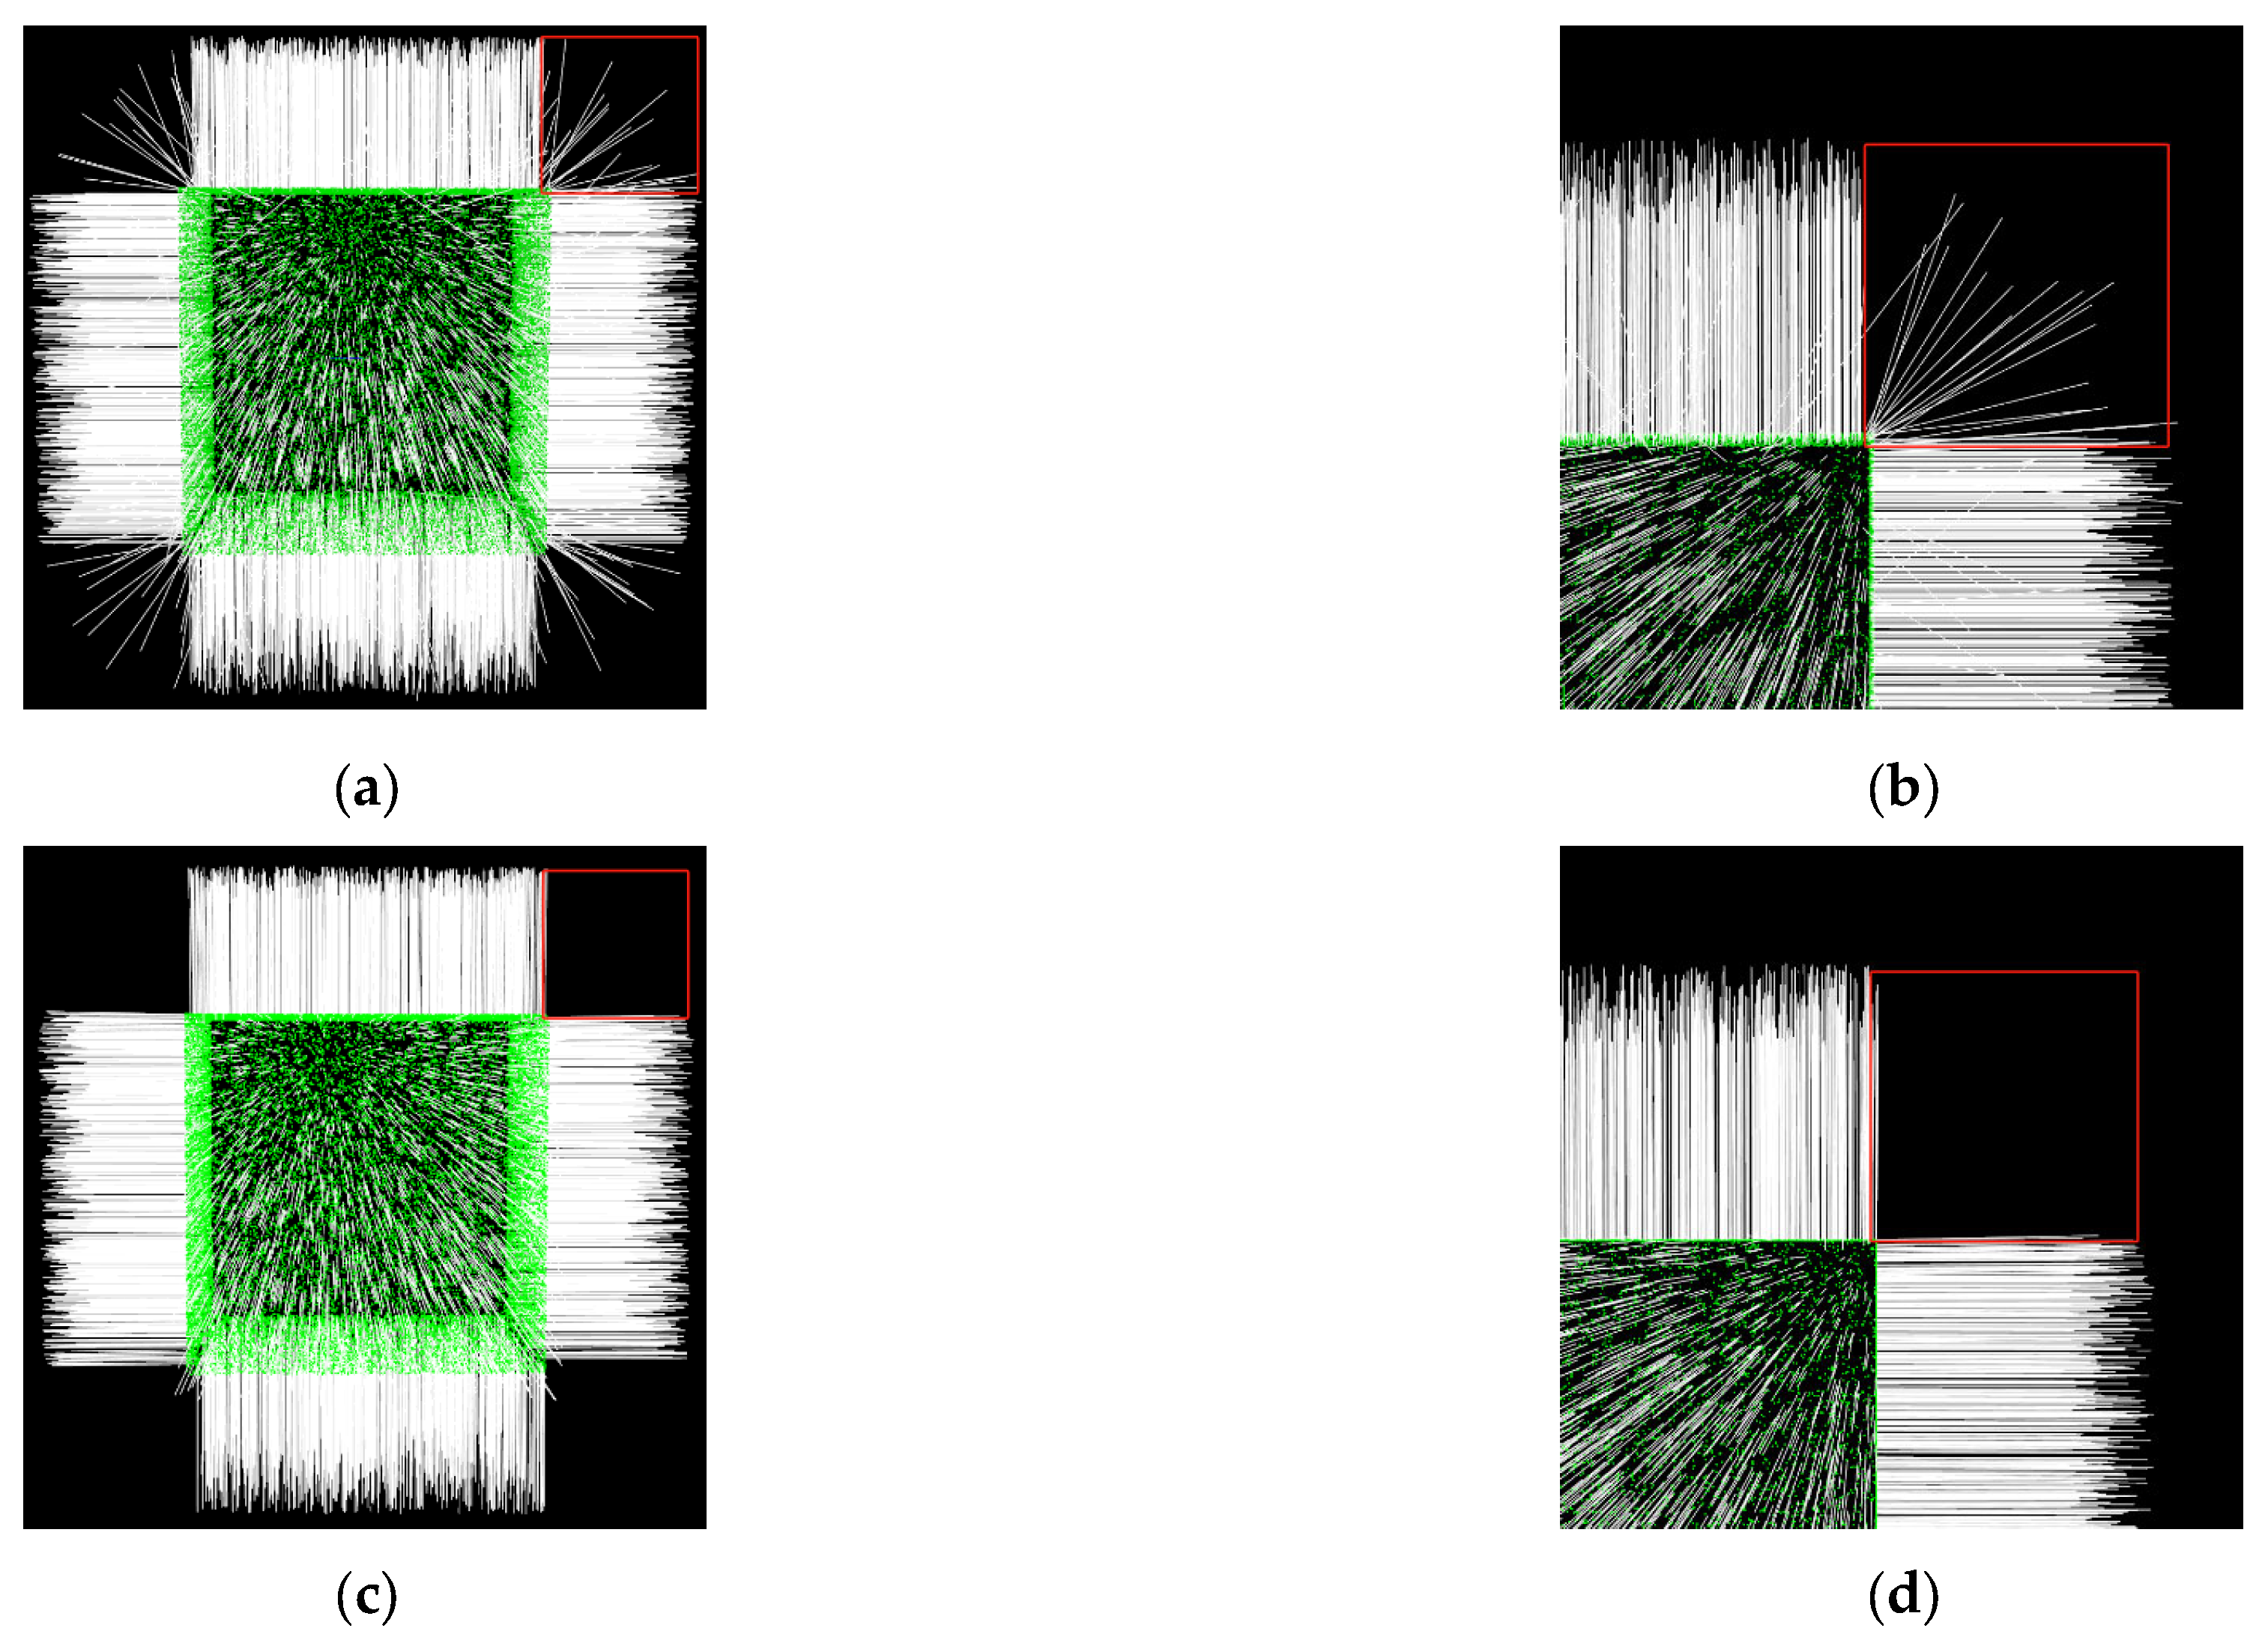
Visualization Analysis of Normal Vectors
To further demonstrate the advantage of the Hough space transform in calculating the normal vectors of point clouds near the edges of structural planes, this paper uses both the Hough space transform and the PCA method to calculate the normal vectors of point cloud data for a cube. The normal vectors are then visualized using the PCL point cloud library. If the normal vector of each point is displayed, the result would be too cluttered to discern the distribution of the normal vectors at the edges of structural planes. Therefore, a normal vector is displayed every 10 points, and the length of each normal vector is set to 0.5. The visualization results are shown in Figure 2.
In the figure, the green parts represent the point cloud, and the white line segments represent the normal vectors. The direction of each white line indicates the normal direction at that point. Each face of the cube represents a structural plane, and each edge represents the boundary of a structural plane. As shown in Figure 2, in flat areas, the normal vectors calculated by both methods perform well. In Figure 2b, the normal vectors near the edges are divergent, and the change in the direction of the normal vectors is relatively smooth. However, in Figure 2d, at the same locations, the normal vectors are perpendicular to the planes on both sides of the edges, and the distribution shows a more distinct variation trend. The Hough space transform method significantly outperforms the PCA method in calculating normal vectors near the edges of structural planes. The main reason is that the PCA method calculates the normal vector of a core point using the spatial relationship of all points in its neighborhood. When the core point is near or on the edge of a structural plane, points from another structural plane can affect the accuracy of the core point’s normal vector. In contrast, the Hough space transform method randomly selects two points in the neighborhood to form a plane with the core point and calculates its normal vector. The most voted normal vector is then selected as the core point’s normal vector, effectively eliminating the influence of points from other structural planes on the calculation and providing excellent noise resistance.
5.
Analysis of Region Growing Results
The normal vector difference-based region growing algorithm using the Hough space transform involves several key parameters: neighborhood size K , normal vector angle threshold θ t h , surface variation threshold S V t h , maximum number of planes T max , confidence level, and minimum number of cluster points C min . K represents the number of points in the neighborhood of point P i ; the smaller the K value, the stronger the seed point’s characteristics, and the more fragmented the structural plane’s segmentation becomes. The normal vector angle threshold θ t h and the surface variation threshold S V t h are limiting parameters. The θ t h 0 , π is set too high, points with small feature differences will be merged, reducing the number of identified structural planes. The S V t h 0 , 5 is used for seed point determination, and the smaller the value, the longer the algorithm takes, though it has minimal effect on the structural planes recognition result. The maximum number of planes T max and the confidence level control the balance between computation time and accuracy. Generally, when T max = 800 , the confidence level exceeds 0.95. C min represents the minimum number of points within structural planes after region growing, and in practical applications, this value should be determined based on the point cloud density, typically ranging from 50 to 150.
After visualizing the normal vectors in the previous section, we further validate the reliability of this method using point cloud data generated for a regular hexagonal pyramid through the Open3D library. The hexagonal pyramid has a height of 1 m and a base edge length of 0.5 m, with an average point spacing of 4 mm. The number of points on each face is known, with a total of 146,913 points. Each face of the hexagonal pyramid represents a structural plane, and two opposite faces form a group, resulting in three groups of structural planes. First, we use both the PCA method and the Hough space transform to calculate the normal vectors of the hexagonal pyramid point cloud data. The same region growing parameters are set, and then region growing segmentation is performed on the point cloud data of the hexagonal pyramid. The results of the region growing process are shown in Figure 3.
After region growing, the point cloud data within the same plane is assigned random colors and projected onto the XOZ and XOY planes to draw the front views (a), (c) and top views (b), (d) of the region growing results using the PCA method and Hough space transform. As shown in Figure 3, it is clear from the front and top views that each side of the regular hexagonal pyramid has been successfully identified and segmented. In Figure 3a,b, the point clouds along the edges and vertices of the hexagonal pyramid are red, indicating points that were not successfully identified. In contrast, in Figure 3c,d, only a small number of points in the same areas remain unrecognized. According to the study by Guo Ge [19], to quantify the effect of region growing, statistical analysis was performed on the number of identified and unidentified points within each plane. The recognition accuracy of region growing is measured by the identification rate ω , which is calculated using the following formula:
ω = J n i J n
In the formula: J n represents the total number of points within the structural plane, and J n i represents the number of successfully identified points within the structural plane.
Table 1 first lists the total number of points within the six structural planes of the hexagonal pyramid before region growing. Then, it shows the number of identified points within the six structural planes after region growing using the PCA method and the Hough space transform. The identification rate ω for both methods is calculated using Formula (2). The lowest identification rate using the PCA method was 94.45%, and the highest was 97.23%. In contrast, the lowest identification rate using the Hough space transform was 99.12%, and the highest was 99.65%. For each structural plane, the identification rate of the Hough space transform was higher than that of the PCA method. In terms of overall identification rate, the Hough space transform improved the identification rate by 3.9%.
Based on the visual results of region growing and the identification rate statistics in Table 1, both methods achieved similar identification accuracy in the central regions of the structural planes. However, the Hough space transform was less affected by sharp spatial changes, resulting in higher identification accuracy at the edges of the structural planes.

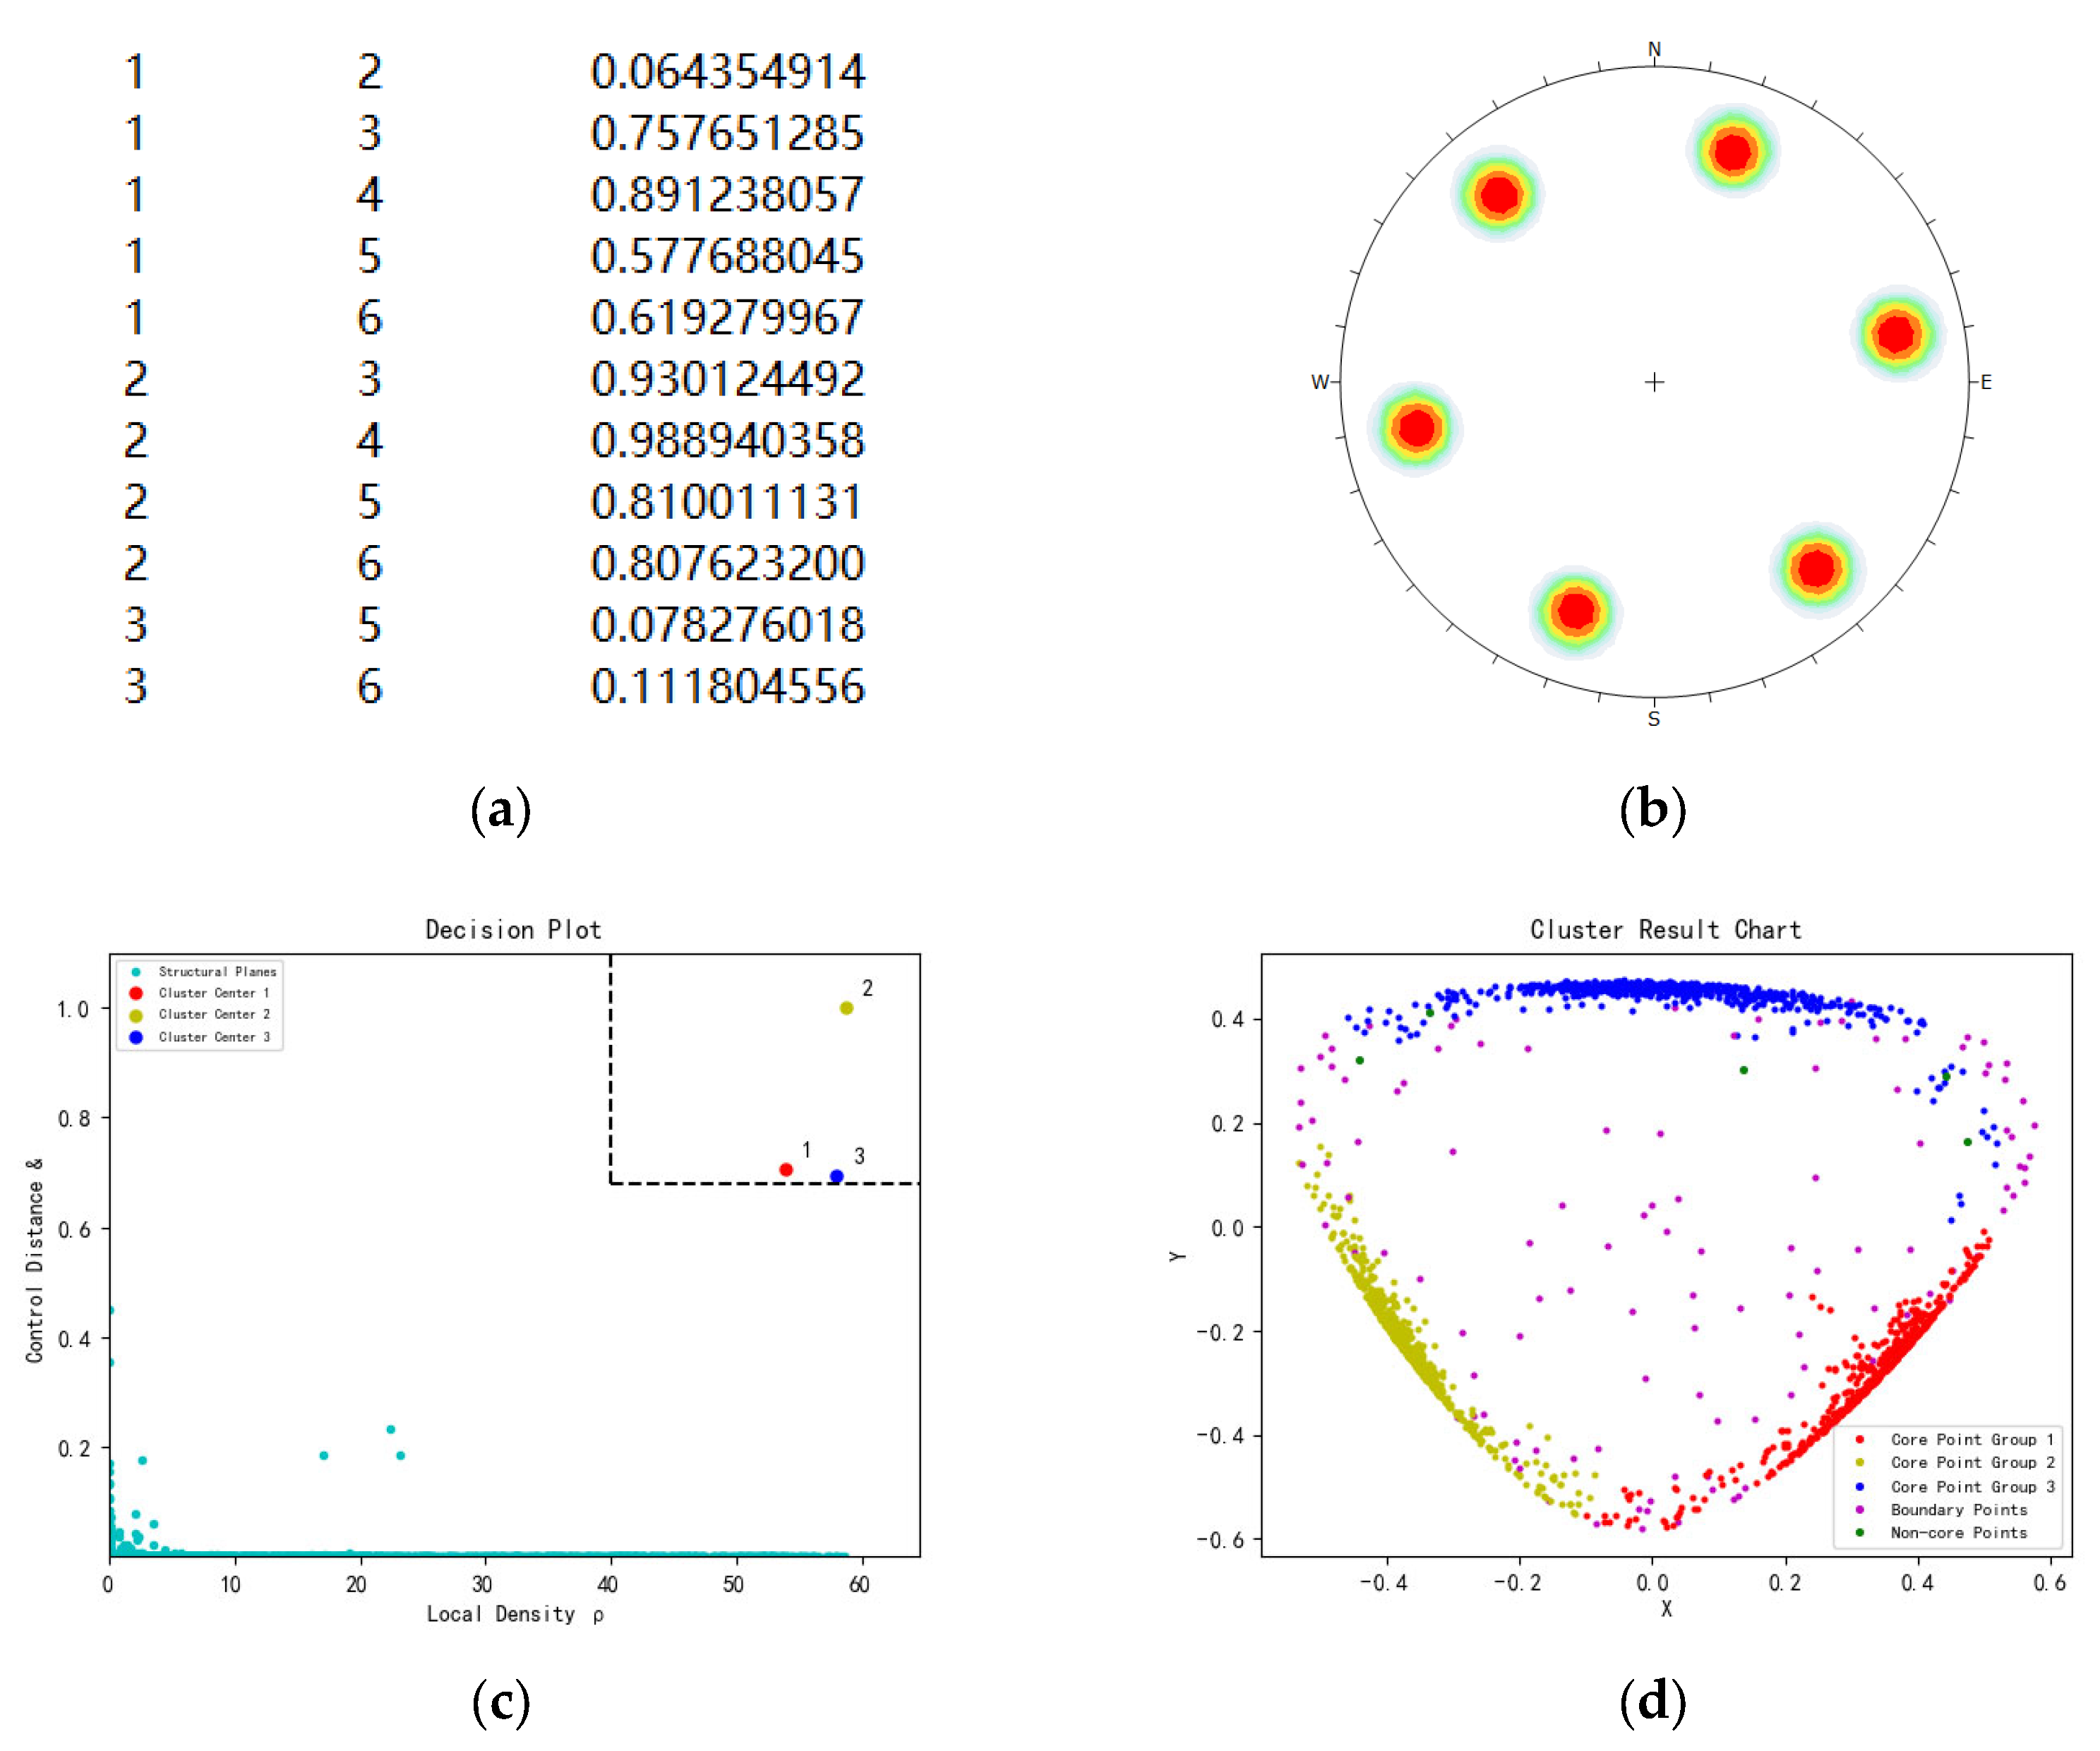
2.2. Cluster Analysis of Rock Mass Structural Planes

Cluster analysis of rock mass structural planes involves grouping multiple structural planes to extract the orientation information of dominant structural planes. Referring to the Clustering by Fast Search and Find of Density Peaks (CFSFDP) method [31], the sine square value of the normal vectors of the structural planes is used as the metric for measuring the similarity between different structural planes. The decision value for each structural plane is calculated, and a decision graph is plotted to automatically identify the cluster centers and the number of clusters. The remaining non-central structural planes are assigned to clusters, and based on local density, the structural planes are divided into core and outlier planes. This method is suitable for large-scale cluster analysis of high and steep rock mass structural planes. The basic steps of the CFSFDP clustering algorithm are as follows:
  • Calculate the sine square value of the angle between the normal vectors of different structural planes, which serves as the clustering distance d d i s t ( n i , n j ) ;
  • Set the cutoff distance d c and calculate the local density ρ i , which can effectively identify outlier structural planes;
  • Arrange the local density ρ i in descending order and calculate the control distance δ i ;
  • Plot the decision graph using the local density ρ i as the horizontal axis and the control distance δ i as the vertical axis and identify the cluster centers and the number of clusters;
  • Assign the remaining points (non-central points) to the nearest category with a higher density than the point, completing the assignment of all non-central points in one iteration;
  • Set the local density percentage, calculate the boundary density, and divide the structural planes into core and boundary points to identify outliers, thus improving clustering accuracy.
In Section 2.1.3, the region growing algorithm based on Hough space transform normal vector differences is used to identify the structural planes. By combining Formula (1), the dominant orientation information of the structural planes can be further extracted, and the CFSFDP clustering algorithm is applied to perform cluster analysis of the structural planes to obtain the orientation of dominant structural planes.
According to the spatial relationships of each face of the regular hexagonal pyramid, the six faces can be divided into three groups of structural planes with the same dip angle and dip directions differing by 180°. If conventional metrics such as Euclidean distance or Manhattan distance are used as the similarity measure between two structural planes, they would be classified into different categories. However, by using the sine square value of the normal vector angle as the clustering distance, this issue can be effectively resolved. The clustering distance calculation results for some structural planes are shown in Figure 4a. Additionally, as shown in Figure 4c,d, the number of clusters for the structural planes of the regular hexagonal pyramid is three, with the cluster centers of the three groups of structural planes represented by red, yellow, and blue. The extracted orientation information of the structural planes was also imported into RocScience Dips 7.0 to generate the polar density map, and the grouping results are shown in Figure 4b. The clustering results from both methods are consistent.

3. Example Analyses

The data used in this paper was obtained from Slob’s personal page on Research Gate, available at: https://www.researchgate.net/publication/289523409_raw_point_cloud_data_-ascii_x_y_z_intensity-_metadata, accessed on 27 May 2024 [32]. The data was collected along the slopes of highway TP 7403 km 06, near the village of Torroja, Spain. The study area consists entirely of Carboniferous rocks, primarily composed of shales and sandstones, which are commonly interbedded and resemble flysch deposits. These sediments have undergone low-grade metamorphism, resulting in the formation of slates, metasandstones, and greywackes, reflecting their complex geological history. The thickness of the Carboniferous sediments can reach up to 2000 m and experienced folding during the Hercynian orogeny, leading to the development of distinct layering and structural surfaces. The well-developed structural surfaces of the Carboniferous rocks make the exposures within these rocks highly suitable for demonstrating the methods proposed in this thesis.
The research data were obtained using the ILRIS_3D three-dimensional laser scanner from Optech, with an average point spacing of 6 mm. The data is stored in PCD format and includes three-dimensional coordinates (X, Y, Z) and RGB attribute information. Figure 5a shows a field image of the scanned area. This study only selected a portion of the point cloud data from the slope, indicated by the black rectangular box in Figure 5a, which is enlarged in Figure 5b. The overall dimensions of the selected research area are 3.8 m × 3 m. The point cloud data for the selected area underwent filtering to remove vegetation points or isolated points. The final number of points in the selected research area is 30,633, as illustrated in Figure 5.
Figure 6b shows the identification results of rock mass structural planes after applying the Hough space transformation and normal vector difference region growing method. Different colored areas represent different rock mass structural planes, with a total of 281 planes identified. For the regular planar rock mass structural planes, the region growing identification performs well, with only a few points at the edges of the planes not successfully segmented. The black rectangular box in Figure 6 highlights the locations of non-planar rock mass structural planes or complex areas of rock surfaces, where the segmentation of rock mass structural planes is fragmented. This fragmentation is due to the inherent randomness when using only the normal vector as the criterion for region growing. After successfully identifying the rock mass structural e planes, the clustering distances (sine squared values), local density, and control distances between any two the rock mass structural planes are calculated, followed by clustering analysis using the CFSFDP clustering algorithm.
As shown in Figure 7a,b, the number of clustered structural planes in the study area is two, indicating the presence of two dominant structural plane groups. Additionally, the 281 identified structural planes are imported into RocScience Dips 7.0 software to generate poles and equal density plots. The number of dominant structural plane groups and their orientations are obtained, and a comparative analysis of the orientations derived from the two methods is conducted.
As shown in Figure 8, the number of dominant structural plane groups obtained using RocScience Dips 7.0 software is still two, consistent with the clustering analysis results of this study. The orientations of the dominant structural planes obtained by both methods are presented in Table 2. Compared to the results from the open-source geological analysis software RocScience Dips 7.0, the orientation errors for the J1 and J2 dominant structural plane groups are within 3°. This demonstrates that the method proposed in this study not only provides rapid and accurate identification of rock mass structural planes but also automatically determines the cluster centers and the number of clusters, thus obtaining the orientations of dominant structural planes. This method offers significant advantages over traditional geological exploration methods.

4. Discussion

In the complex environments of various engineering projects, there are often many slopes of high and steep gradients formed either naturally or by human activity, making it impossible for geological survey personnel to conduct investigations using traditional contact measurement methods. This paper focuses on high and steep highway slopes, utilizing non-contact measurement methods to obtain 3D point cloud data from the study area. Based on this 3D point cloud data, we propose a method for rock mass structural plane identification using Hough space transformation and normal vector interpolation region growing, along with a CFSFDP clustering method for rock mass structural planes. This method is applied to a regular assembly model to verify its effectiveness. Below are three points of discussion regarding the research methods and results:
This paper employs the Hough space transform and vector interpolation region growing algorithm for rock mass structural plane identification and information extraction. The algorithm consists of two parts: Hough space transform for point cloud normal vector calculation and vector interpolation region growing. Both the Hough space transform and PCA methods calculate normal vectors based on neighborhood point relationships. PCA treats all points within a neighborhood as a whole, constructs a covariance matrix, performs eigenvalue decomposition, and finds the corresponding eigenvectors. The eigenvector with the largest variance represents the normal vector of the core point. When the core point is near or on the edge of a structural plane, points from non-core surfaces may be included in the covariance matrix, leading to inaccurate normal vector calculations. The core idea of the Hough space transform is to randomly select two points within the neighborhood to form a plane with the core point and calculate its normal vector. The normal vectors are stored in an accumulator container through a voting process. To ensure computational speed, a maximum number of planes is set; once this number is reached, it is assumed that sufficient confidence is obtained to ensure the accuracy of the point cloud normal vector. The normal vector with the highest number of votes is selected as the core point normal vector. This approach reduces the impact of points from non-core surfaces, making the Hough space transform method robust to noise and accurate in calculating the normal vectors at the edges of rock mass structural planes. In the cube point cloud normal vector visualization analysis experiment, the normal vectors calculated using the Hough space transform were perpendicular to the planes on both sides of the edges, showing a clear trend in normal vector changes. This demonstrates that the method has distinct advantages in calculating normal vectors for complex rock mass surface point clouds. Region growing, which only uses normal vector differences as the growth criterion, exhibits significant randomness. In practical applications, it is also evident that the identification of non-planar rock mass structural planes or complex areas of rock surfaces shows a decline in performance. To address this issue, future research could explore other descriptors that can represent the spatial characteristics of point clouds. Establishing a multi-dimensional feature fusion mechanism could replace the single-feature criterion with multi-dimensional feature values as criteria for region growing, thereby enhancing the effectiveness of rock mass structural planes identification.
The Fast Search and Find of Density Peaks (CFSFDP) algorithm is simple in steps, can automatically find clustering centers and determine the number of clusters, and does not rely on complex parameter tuning. Although the overall efficiency is high, calculating the clustering distance d d i s t ( n i , n j ) remains complex. Direct clustering of massive point cloud data requires calculating the clustering distance between each point and every other point, which involves a large amount of computation. This study first uses the region growing algorithm for rock mass structural plane identification and information extraction. After region growing, the point cloud data are segmented or merged into many blocks, each representing a rock mass structural plane. The number of structural planes is much smaller than the number of point clouds, making rock mass structural planes suitable for clustering and effectively addressing the problem of CFSFDP’s high clustering distance complexity, which is only suitable for small datasets. In terms of computational resources, this study utilized a platform equipped with two Intel Xeon E5-2630 v4 processors, each having 10 cores and 20 threads, along with a system memory of 32 GB and a 1 TB mechanical hard drive. The total runtime for the computational process was approximately 15 min, demonstrating good efficiency. To effectively extend this method to broader research areas, we suggest that future work consider employing hierarchical processing and parallel computing strategies, which would further enhance the applicability and computational efficiency of the method in larger study regions.
In real scenarios, rock mass surfaces often have structural planes with the same dip angle but a 180° difference in dip direction. Using traditional Euclidean distance, Manhattan distance, Chebyshev distance, or spherical distance as clustering distances would misclassify such structural planes into different groups. By using the sine squared value of the angle between the normal vectors of different structural planes as the clustering distance d d i s t ( n i , n j ) , this type of clustering error can be effectively avoided. Additionally, a cutoff distance d c is set to effectively remove outlier structural planes, which helps handle noise points in the data and maintain the stability and accuracy of the clustering results.

5. Conclusions

Based on 3D point cloud data, this study utilizes Hough space transform to calculate point cloud normal vectors and employs vector differences as criteria for region growing, effectively achieving the identification and information extraction of rock mass structural planes. In the experimental validation using a hexagonal pyramid, six structural planes were successfully identified. The accuracy of the region growing was evaluated using visualization methods and recognition rates ω . The number of rock mass structural planes identified by this method matched the theoretical results, and the precision of the extracted structural plane orientations also met engineering specification requirements.
After completing the identification and information extraction of the mass structural planes, these surfaces were used as clustering objects, with the sine squared value of the normal vector differences serving as the clustering distance d d i s t ( n i , n j ) . A cutoff distance d c was set to filter out outlier surfaces, and the Fast Search and Find of Density Peaks (CFSFDP) clustering method was employed for clustering analysis of the identified surfaces. This approach not only addresses the issue of high complexity in calculating clustering distances with CFSFDP, which is suitable only for small datasets, but also improves clustering accuracy and noise resistance of the method. When applied to high and steep highway slope, the method successfully identified two dominant structural planes groups, with results closely matching those from RocScience Dips 7.0 clustering, and the orientation error of the dominant structural planes was within 3°. Overall, the method demonstrated strong practical value for large-scale geological surveys of high and steep rock masses. Future research will focus on further improving algorithm efficiency and handling larger datasets.

Author Contributions

Conceptualization, J.Z., Y.X., B.W., Z.Y. and K.Y.; methodology, J.Z., Y.X., B.W., Z.Y. and K.Y.; software, J.Z.; validation, J.Z., Y.X., B.W., Z.Y. and K.Y.; resources, Y.X., B.W., Z.Y. and K.Y.; data curation, J.Z., Z.Y. and K.Y.; writing—original draft preparation, J.Z.; funding acquisition, J.Z., Y.X., B.W., Z.Y. and K.Y. All authors have read and agreed to the published version of the manuscript.

Funding

This research was financially supported by the National Natural Science Foundation of China (No. 41861054).

Institutional Review Board Statement

Not applicable.

Informed Consent Statement

Not applicable.

Data Availability Statement

The data used to support the findings of this study are available from the first author upon request.

Acknowledgments

We thank the Second Survey Institute of Yunnan Geological Engineering for their technical support. We also thank the reviewers and editors of the Journal of Applied Sciences for their hard work.

Conflicts of Interest

Authors Ziliang Yang and Kaihua Yang were employed by the Yunnan Geological Engineering the Second Investigation Institute. The remaining authors declare that the research was conducted in the absence of any commercial or financial relationships that could be construed as a potential conflict of interest.

References

  1. Zhu, H.H.; Pan, B.G.; Wu, W.; Yong, H.; Liu, J.; Li, H.M. Review on Collection and Extraction Methods of Rock Mass Discontinuity Information. J. Basic Sci. Eng. 2023, 31, 1339–1360. [Google Scholar]
  2. Sun, G.Z. On the Theory of Structure-Controlled Rock Mass. J. Eng. Geol. 1993, 1, 14–18. [Google Scholar]
  3. Ge, Y.F.; Tang, H.M.; Huang, L.; Wang, L.Q.; Sun, M.J.; Fan, Y.J. A New Representation Method for Three-Dimensional Joint Roughness Coefficient of Rock Mass Discontinuities. Chin. J. Rock Mech. Eng. 2012, 31, 2508–2517. [Google Scholar]
  4. Wu, X.; Wang, F.Y.; Wang, M.C.; Zhang, X.Q.; Wang, Q.; Zhang, S. A New Method for Automatic Extraction and Analysis of Discontinuities Based on TIN on Rock Mass Surfaces. Remote Sens. 2021, 13, 2894. [Google Scholar] [CrossRef]
  5. Wang, F.Y.; Chen, J.P.; Fu, X.H.; Shi, B.F. Study on Geometrical Information of Obtaining Rock Mass Discontinuities Based on VirtuoZo. Chin. J. Rock Mech. Eng. 2012, 33, 169–175. [Google Scholar]
  6. Wang, S.H.; Mu, J.J.; Zhang, H.; Zhang, S.C. Spatial Modeling of Refined Structural Plane of Rock Mass and Block Stability Analysis. J. Northeast. Univ. (Nat. Sci.) 2019, 40, 1186–1189. [Google Scholar]
  7. Li, S.C.; Liu, H.L.; Li, L.P.; Shi, S.S.; Zhang, Q.Q.; Sun, S.Q.; Hu, J. A Quantitative Method for Rock Structure at Working Faces of Tunnels Based on Digital Images and Its Application. Chin. J. Rock Mech. Eng. 2017, 36, 1–9. [Google Scholar]
  8. Hoppe, H.; DeRose, T.; Duchamp, T.; McDonald, J.; Stuetzle, W. Surface Reconstruction from Unorganized Points. In Proceedings of the 19th Annual Conference on Computer Graphics and Interactive Techniques, New York, NY, USA, 1 July 1992; pp. 71–78. [Google Scholar]
  9. Slob, S.; Van Knapen, B.; Hack, R.; Turner, K.; Kemeny, J. Method for Automated Discontinuity Analysis of Rock Slopes with Three-Dimensional Laser Scanning. Transp. Res. Rec. 2005, 1913, 187–194. [Google Scholar] [CrossRef]
  10. Gigli, G.; Casagli, N. Semi-Automatic Extraction of Rock Mass Structural Data from High Resolution LIDAR Point Clouds. Int. J. Rock Mech. Min. Sci. 2011, 48, 187–198. [Google Scholar] [CrossRef]
  11. Ge, Y.F. Intelligent Identification and Extraction of Geometric Properties of Rock Discontinuities Based on Terrestrial Laser Scanning. J. Rock Mech. Eng. 2017, 36, 3050. [Google Scholar]
  12. Chen, N.; Cai, X.M.; Xia, J.W.; Zhang, S.; Jiang, Q.; Shi, C. Intelligent Interpretation of Rock Mass Discontinuity Based on Three—Dimensional Laser Point Cloud. Earth Sci. 2021, 46, 2351–2361. [Google Scholar]
  13. Kong, X.L.; Xia, Y.H.; Wu, X.Q.; Wang, Z.H.; Yang, K.H.; Yan, M.; Li, C.; Tai, H.Y. Discontinuity Recognition and Information Extraction of High and Steep Cliff Rock Mass Based on Multi-Source Data Fusion. Appl. Sci. 2022, 12, 11258. [Google Scholar] [CrossRef]
  14. Guo, J.T.; Liu, S.J.; Zhang, P.N.; Wu, L.X.; Zhou, W.H.; Yu, Y.A. Towards Semi-Automatic Rock Mass Discontinuity Orientation and Set Analysis from 3D Point Clouds. Comput. Geosci. 2017, 103, 164–172. [Google Scholar] [CrossRef]
  15. Gao, F.; Chen, D.P.; Zhou, K.P.; Niu, W.J.; Liu, H.W. A Fast-Clustering Method for Identifying Rock Discontinuity Sets. KSCE J. Civ. Eng. 2019, 23, 556–566. [Google Scholar] [CrossRef]
  16. Cui, X.J.; Yan, E.C.; Chen, W. Cluster analysis of discontinuity occurrence of rock mass based on improved genetic algorithm. Rock Soil Mech. 2019, 40, 374–380. [Google Scholar]
  17. Chen, J.Q.; Zhu, H.H.; Li, X.J. Automatic Extraction of Discontinuity Orientation from Rock Mass Surface 3D Point Cloud. Comput. Geosci. 2016, 95, 18–31. [Google Scholar] [CrossRef]
  18. Wang, S.H.; Ren, Y.P.; Chen, J.Z.; Zhang, Z.S. An Improved Fish Swarm Clustering Algorithm for Structural Grouping. J. Northeast. Univ. (Nat. Sci.) 2019, 40, 420. [Google Scholar]
  19. Kong, D.H.; Wu, F.Q.; Saroglou, C. Automatic Identification and Characterization of Discontinuities in Rock Masses from 3D Point Clouds. Eng. Geol. 2020, 265, 105442. [Google Scholar] [CrossRef]
  20. Daghigh, H.; Tannant, D.D.; Daghigh, V.; Lichti, D.D.; Lindenbergh, R. A Critical Review of Discontinuity Plane Extraction from 3D Point Cloud Data of Rock Mass Surfaces. Comput. Geosci. 2022, 169, 105241. [Google Scholar] [CrossRef]
  21. Hu, L.; Xiao, J.; Wang, Y. Efficient and Automatic Plane Detection Approach for 3-D Rock Mass Point Clouds. Multimed. Tools Appl. 2020, 79, 839–864. [Google Scholar] [CrossRef]
  22. Zhang, J.H. Intelligent Identification of Rock Mass Structural Plane and Stability Analysis of Rock Slope Block. Sci. Rep. 2022, 12, 16745. [Google Scholar] [CrossRef] [PubMed]
  23. Zhao, X.D.; Liu, J.; Zhang, H.X.; You, W.; Liu, F.T. Rock mass Structural Plane Digital Recognition and Stope Stability Classification Based on the Photographic Surveying Method. J. Min. Saf. Eng. 2014, 31, 127. [Google Scholar]
  24. Sheng, Y.; Song, T.J.; Chen, J.P.; Zhang, W. Clustering Analysis of Dominative Attitudes of Rock Mass Structural Plane Based on Firefly Algorithm. J. Northeast. Univ. (Nat. Sci.) 2015, 36, 284. [Google Scholar]
  25. Feng, Y.; Ma, F.S.; Gong, C.C.; Guo, J.; Wang, S.F.; Liu, Z.C. Data Analysis Method for Optimized and Dominant Orientations of Joints in Rock Mass. J. Eng. Geol. 2011, 19, 887–892. [Google Scholar]
  26. Ai, C.M.; Lu, Y.; Sun, P.P. Dynamic Cluster Grouping Analysis of Occurrence of Structural Plane in Natural Rock Mass. J. Yangtze River Sci. Res. Inst. 2023, 40, 106. [Google Scholar]
  27. Song, J.L.; Huang, R.Q.; Pei, X.J. Particle swarm optimization algorithm based fuzzy c-means cluster analysis for discontinuities occurrence in rock mass. J. Eng. Geol. 2012, 20, 591–598. [Google Scholar]
  28. Deng, J.H.; Chen, B.L.; Wu, X.M.; Xie, G.H. Self-Organized Cluster Analysis on Texture Plane Occurrence of Rock Mass. J. Yangtze River Sci. Res. Inst. 2011, 28, 50. [Google Scholar]
  29. Guo, G. Study on Rock Mass Structural Plane Identification and Rock Mass Integrity Evaluation Based on 3D Laser Scanning Technology. Master’s Thesis, Three Gorges University, Yichang, China, 2023. [Google Scholar]
  30. Dong, X.J. The Three-Dimensional Laser Scanning Technique and Research on Its Engineering Application. Master’s Thesis, Chengdu University of Technology, Chengdu, China, 2007. [Google Scholar]
  31. Rodriguez, A.; Laio, A. Clustering by Fast Search and Find of Density Peaks. Science 2014, 344, 1492–1496. [Google Scholar] [CrossRef]
  32. Slob, S. Automated Rock Mass Characterization Using 3-D Terrestrial Laser Scanning; ResearchGate: Berlin, Germany, 2010. [Google Scholar]
Figure 1. Flowchart of the Method for Identifying Rock Mass Structural Planes and Extracting Dominant Orientations.
Applsci 14 09985 g001
Figure 2. Visualization of Normal Vectors on a Cube. (a,b) PCA method; (c,d) Hough space transform method.
Applsci 14 09985 g002
Figure 3. Region Growing Result Graph for Hexagonal Pyramid. (a) Front View using PCA; (b) Top View using PCA; (c) Front View using Hough space transform; (d) Top View using Hough space transform.
Applsci 14 09985 g003
Figure 4. Cluster Analysis Graph of the Regular Hexagonal Pyramid Structural Planes. (a) Clustering distance calculation result graph; (b) Polar density map; (c) Decision graph; (d) Clustering result graph.
Applsci 14 09985 g004
Figure 5. Field images of the study area. (a) Schematic diagram of the study area location; (b) Local magnification of the study area.
Applsci 14 09985 g005
Figure 6. Point Cloud Data of High and Steep Highway Slopes. (a) before region growing; (b) after region growing.
Applsci 14 09985 g006
Figure 7. Clustering Graph of Rock Mass Structural Planes on Highway Slope. (a) Decision Tree graph; (b) Clustering Result graph.
Applsci 14 09985 g007
Figure 8. Pole Density Map of Rock Mass Structural Planes in Highway Slope.
Applsci 14 09985 g008
Table 1. Region Growing Identified Point Count Table.
Structural Plane IDTotal Points (Count)Identified Points (Count)Unidentified Points (Count)Identification
Rate ω (%)
PCAHoughPCAHoughPCAHough
J128,55927,21828,459134110095.3099.65
J228,47927,14228,356133712395.3199.57
J325,29223,88925,070140322294.4599.12
J421,99521,09521,85390014295.9199.35
J521,47520,88021,3785959797.2399.55
J621,11320,09920,935101417895.2099.16
Total146,913140,323146,051659086295.5199.41
Table 2. Statistical Table of the Orientations of Dominant Structural Planes in Highway Slope.
MethodJ1J2
Dip Direction < Dip AngleDip Direction < Dip Angle
RocScience Dips 7.0182.76° < 81.07°282.42° < 33.13°
Proposed Method183.08° < 82.32°284.65° < 33.95°
Disclaimer/Publisher’s Note: The statements, opinions and data contained in all publications are solely those of the individual author(s) and contributor(s) and not of MDPI and/or the editor(s). MDPI and/or the editor(s) disclaim responsibility for any injury to people or property resulting from any ideas, methods, instructions or products referred to in the content.

