Article

Regolith-Rich PEEK Composite Bricks: Steps Towards Space-Ready Lunar Construction Materials

1
European Astronaut Centre, European Space Agency, 51147 Cologne, Germany
2
Department of Mechanical and Aerospace Engineering, Politecnico di Torino, 10129 Turin, Italy
3
Department of Mechanical and Process Engineering, Federal Institute of Technology, 8092 Zurich, Switzerland
*
Author to whom correspondence should be addressed.
Appl. Sci. 2025, 15(2), 679; https://doi.org/10.3390/app15020679
Submission received: 3 December 2024 / Revised: 31 December 2024 / Accepted: 7 January 2025 / Published: 11 January 2025

Abstract

:
This study introduces a novel composite construction material composed of lunar regolith combined with PEEK in dry powder form. The work demonstrates significant advantages over alternative methods, primarily by reducing production power consumption and simplifying the manufacturing process. Building on previous research that explored binder optimization through process simplification and targeting predefined shapes, this work delves deeper into a comparative analysis of high-performance thermoplastics. Among the various options, PEEK demonstrates the most favorable properties. The study investigates key processing parameters and evaluates the effects of vacuum processing and temperature testing on mechanical properties. The research also evaluates the effects of vacuum processing and temperature testing to assess the material’s performance under lunar conditions. Comparative analysis is performed with standard performance of various reinforced and unreinforced concretes and with standard requirements for construction bricks as per ASTM standards. This shows that the composite, with an organic binder content as low as 5 wt%, has great potential. Notably, the improvements achieved through vacuum curing ensure compliance with lunar environmental conditions and alignment with most Earth-based engineering standards. Samples compacted at 7.50 MPa with 10 wt% binder, and tested at room temperature, achieve a compression strength of 16.3 MPa, exceeding that of industrial floor bricks and matching that of building bricks used on Earth. Bending strength (7.4 MPa) aligns with steel fiber-reinforced and high-strength concretes. Vacuum curing further enhances these properties, with an observed increase of +66% in bending strength and +33% in compression strength.

1. Introduction

In Situ Resource Utilization (ISRU) is critical for sustainable operations beyond Earth, as it prioritizes using local materials over transporting them, significantly reducing costs and logistical complexities [1]. For what concerns lunar missions and infrastructure manufacturing, this approach focuses on processing regolith, a layer of loose rock and dust, into resources such as construction materials, oxygen, water, and fuel [2,3,4].
In [5], the authors highlighted that brick-based structures offer several advantages: standardized elements provide uniformity, simplify construction, and optimize manufacturing. Their modular nature makes them ideal for early colonization, particularly when leveraging self-supporting designs (e.g., Nubian vaults) or interlocking shapes that eliminate the need for mortar. Building on these principles, the authors investigated aggregate bonding approaches and proposed a composite material whose manufacturing process utilizes minimal quantities of thermoplastics as binders. To demonstrate the feasibility of interlocking concepts, they presented two proof-of-concept designs: an interlocking brick (Figure 1a) [6], and an interlocking tile (Figure 1b) [7].
Aggregate bonding solutions are particularly appealing, as they enable complex designs without the high-temperature requirements of sintering or melting. However, they depend on a defined quantity of Earth-sourced consumables, which must be minimized. For practical implementation, these processes need to be robust, avoid reliance on sophisticated control systems, and be adaptable to autonomous operations on the Moon. While polymer-based solutions are discussed extensively in the literature [8,9,10,11,12,13,14], significant gaps remain in developing efficient, sustainable, and scalable methods for real-sized lunar components. Furthermore, limited efforts have been made to align or verify these requirements with processes compatible with the Moon’s environment.

1.1. Insights from Previous PLA-Based Samples

The manufacturing process developed in this study relies on a thermoplastic phase. This choice allows the raw powders to transform into the final product simply by heating above the polymer’s melting point, without any chemical reaction. Additionally, dry processing simplifies the initial blending and reduces overall complexity. Thermoplastics also offer recyclability [15]: components can be crushed, remelted, and reshaped, making them a sustainable and efficient choice for space applications. Selecting an appropriate grade is critical due to the extreme conditions in space, such as large temperature fluctuations (from +124 °C at the equator to −178 °C before sunrise [16]), high vacuum ( 10 11 mbar overnight to 10 9 mbar during the day [17]), radiation, and potential meteorite impacts. Additionally, the mechanical properties of the thermoplastic are essential, as they establish the performance limits of the composite material in this context [10].
In the companion paper [5], PLA (polylactic acid) was used as a non-space-grade option to simplify the initial phase of process understanding. This choice allowed for a rapid assessment of key parameters before transitioning to specialized polymers that are more challenging to process. The study focused on compression and bending strengths, finding that both properties improved with increased binder content (investigated between 5 wt% and 20 wt%), higher compaction pressures (0.50 MPa to 5.00 MPa), and a heterogeneous grain size distribution within the regolith phase. At just 10 wt% binder, the compression strength met the Earth construction requirements per the ASTM standards for industrial floor [18], building [19], and hollow bricks [20], while the equivalent requirements on the Moon, scaled down by the same factor as lunar gravity [21,22,23,24], were already met at 5 wt%. Compression strengths equivalent to concrete (grades 20 to 85 MPa) [25,26] for foundational and structural uses on the Moon were achieved with 5 wt% binder, though the bending strength results were less conclusive due to the setup limitations. This study seeks to further advance the technology by integrating advanced thermoplastics as the binder, optimizing process parameter selection, and evaluating the influence of critical environmental factors on both the manufacturing process and the quality of the final products.

1.2. Organic Phase Selection

This subsection provides a comparative analysis of high-performance thermoplastics frequently considered for space-grade applications, including polyetheretherketone (PEEK), thermoplastic polyimide (TPI), polyphenylene sulfide (PPS), polytetrafluoroethylene (PTFE), and polyetherimide (PEI). It examines their thermal and mechanical properties, as well as the effects of radiation and UV exposure. Notably, all materials considered meet the requirement for Total Mass Loss (TML) below 1% [27]. Based on reference values from the literature [28], these materials can be ranked from most to least performant as follows: PTFE, PPS, PEEK, TPI, and PEI.
The melting temperature is a critical parameter for processing, where, in principle, a lower melting temperature is advantageous for easier handling. However, both the melting and glass transition temperatures must be sufficiently high to withstand the Moon’s extreme temperatures. PEEK has a melting point (Tm) of 343 °C and a glass transition temperature (Tg) of 143 °C [29]. In comparison, TPI exhibits a significantly higher Tg of 250 °C and Tm of 388 °C [30]. PPS, lower in thermal resistance, has a melting point of 280 °C and a glass transition temperature of 85 °C [31]. PTFE presents a unique case; while its glass transition temperature remains debated [32], it has a melting point of 260 °C. Lastly, PEI offers a Tg of 215 °C; as an amorphous thermoplastic, it lacks a distinct melting point, but processing temperatures between 340 °C and 400 °C are generally used to achieve a molten state [33]. Another important thermal property to consider is the Coefficient of Thermal Expansion (CTE), as it indicates the material’s tendency to deform with temperature changes. Among the materials under consideration, PEEK performs best, with the lowest CTE at 46 × 10 6 1/°C, followed closely by PPS, TPI, and PEI, with values of 52, 55, and 65 × 10 6 1/°C, respectively. In contrast, PTFE is more affected, with a higher CTE around 124 × 10 6 1/°C.
Beyond mere survival, the material must retain key properties under the temperature fluctuations to be expected on the Moon. Thus, evaluating how they affect mechanical properties is essential. The tensile strength, for which data are available in the literature across a wide temperature range, can be considered as an indicator. At room temperature, PPS, TPI, PEEK, and PEI exhibit strong performance for structural applications, with yield strengths of 93, 92, 90, and 86 MPa, respectively. PTFE, however, shows a significantly lower yield strength of 21 MPa. At low temperatures (−196 °C), PPS stands out with the highest yield strength at 260 MPa, while PEEK and TPI also maintain structural stability with yield strengths of 200 MPa and 189 MPa. Although lower, PTFE and PEI still offer essential values for low-temperature applications, with 140 MPa and 101 MPa, respectively. At high temperatures (150 °C), TPI leads with a yield strength of 58 MPa, followed by PEEK at 35 MPa and PEI at 17 MPa. PPS and PTFE, however, experience significant declines at high temperatures, dropping to 3.5 MPa and 2 MPa, which limits their suitability.
The degradation of mechanical properties due to ionizing radiation varies significantly across different materials. In general, when polymers are irradiated, the breaking of the main molecular chains might occur [34], contributing to the decline in the material’s overall performance. When it comes to mechanical performance, residual tensile strength after irradiation is a good parameter for assessing material degradation. However, direct comparisons between different polymers are challenging due to the substantial variation in their initial properties. Moreover, experimental conditions, such as radiation sources and doses, differ across studies. For consistency, this paper compares the properties of the materials in their original state with those measured after exposure to a standardized dose of 1 MGy, if available. A study on high-performance plastics [35] demonstrated that both PEEK and PEI exhibit exceptional radiation resistance. PEI maintained its mechanical properties after a 1 MGy dose. Similarly, PEEK showed no significant degradation up to 5 MGy. Further confirmation of the stability of PEEK up to 8 MGy was provided in [36], along with that of PPS, which retained its tensile strength even after irradiation. Polyimides also display excellent radiation resistance as demonstrated by studies on Kapton [37] and AURUM [38], which showed no loss of tensile strength up to doses of 12 MGy. In contrast, PTFE is highly sensitive to radiation, with its mechanical properties deteriorating rapidly at relatively low doses [39,40]. No tensile strength data were available for PTFE at the 1 MGy level due to its fast degradation. However, the literature reports a significant reduction in tensile strength to 10.3 MPa after exposure to a dose of just 12 kGy [41].
To enhance the understanding of their performance across various criteria, Table 1 summarizes the properties discussed. When considering the full spectrum of temperature performance, PEEK exhibits the most favorable properties overall, alongside TPI. With PEEK, its slightly lower melting point, glass transition temperature, and TML further enhance its suitability. While TPI demonstrates superior tensile properties at elevated temperatures, these benefits appear to be achieved through commercial grades specifically formulated for such conditions. Furthermore, PEEK is already extensively used in extreme environments [42,43]. In the aerospace industry, PEEK plays a crucial role in high-performance components such as seals, gaskets, and insulation for jet engines and rocket propulsion systems, where it withstands extreme temperatures and mechanical stress. The material’s resistance to radiation and its stability in a vacuum make it indispensable in space exploration, being used in components for satellites, spacecraft, and lunar rovers. In the oil and gas sector [44], PEEK is found in seals, bearings, and valve seats for drilling equipment operating in deep-sea environments and at high temperatures, often above 250 °C, where it resists exposure to corrosive chemicals and intense pressures. Additionally, PEEK is used in applications involving intense thermal cycling, such as in high-performance electronics and military-grade equipment.
Beyond these considerations, it is worth mentioning that polymers are generally susceptible to photodegradation when exposed to UV radiation, which can result in material deterioration [57]. To enhance UV resistance, UV screeners are often used. Bragaglia et al. [58] demonstrated that incorporating TiO2 particles into PEEK slows and confines photodegradation to the material’s external surface. Notably, TiO2 is naturally abundant in lunar regolith, constituting approximately 10% of its composition in weight [59]. Furthermore, the limited organic phase content in the composite and the high weight percentage of regolith are expected to provide additional UV protection, acting as an effective shield for the material’s inner core.

2. The Manufacturing Process and Parameter Refinement

The manufacturing process builds on the methodology validated in [5], where PLA was used as a binder and EAC-1a as a lunar regolith simulant. EAC-1a is the lunar regolith simulant currently in use at the European Astronaut Centre. While it shares several physical and chemical similarities with lunar regolith, as with all simulants, it exhibits distinctions that, in principle, may influence its applicability. Detailed analyses of its grain size distribution and chemical composition are provided in [60]. The EAC-1a particle size distribution falls within the upper and lower boundaries observed in Apollo lunar regolith samples, although it exhibits a higher median grain size. Its particles display a variety of shapes similar to lunar regolith but lack the extreme angularity and features caused by space weathering, which might lead to differences in cohesion and compaction behavior. From a chemical standpoint, major mineralogical components are shared between EAC-1a and lunar regolith samples, but the simulant contains higher levels of alkali components (K2O and Na2O), feldspathoids, quartz, and chlorite, rare or absent in actual samples. These components, particularly the crystalline water in chlorite, could influence specific processes such as sintering and oxygen extraction. Additionally, EAC-1a features ilmenite in its oxidized state and lacks the reduced ilmenite and nanophase iron typical of lunar regolith, potentially impacting its magnetic properties. Despite these differences, the authors expect EAC-1a to perform effectively in particle binding processes, as the binder acts as the primary adhesive, while the simulant primarily serves as an inert filler.
Transitioning to a PEEK-based process requires refining several processing parameters, leveraging insights gained from the PLA-based process to focus on key factors. The core phases of the process and their respective refinements are detailed below; in addition, Figure 2 highlights the differences in the manufacturing steps between PEEK- and PLA-based samples.
  • Drying: Both the regolith simulant and the binder are dried to remove moisture. For PEEK, drying is performed at 80 °C for 12 h, and for EAC-1a at 250 °C for 2 h, using a Memmert UN30 universal oven.
  • Sieving: The regolith simulant is sieved to ensure that only particles within a specific size range are included in the process. The previous study demonstrated that a heterogeneous particle size distribution enhances the mechanical properties of the parts, especially when all particles are below 500 μm. Consequently, this threshold is set during sieving, performed using a Nexopart EML 200 sieve machine.
  • Mixing and Mold Filling: The dried regolith simulant and binder are mixed in the desired weight percentage (wt%) for a few minutes before being transferred into a metallic mold for shaping.
  • Compaction: The mixture within the mold is compacted using a press at the specified pressure level. Depending on the sample size and compaction pressure, the mixture is compacted using either a toggle press with a 2 kN load sensor or a 10-ton Unicraft WPP 10 hydraulic press.
  • Curing: The compacted green body undergoes heating to a temperature above the melting point of the binder. PLA-based samples show no significant differences within a narrow range above its melting point. For PEEK, curing is conducted at 400 °C using a Carbolite Gero STF 15/450 tube furnace. A preliminary study shows no significant variation in the material properties at higher temperatures, though shorter curing times are achievable. Both air and vacuum curing are examined, with a uniform curing time of 3 h chosen for consistency. For vacuum curing, an Edwards RV3 vacuum pump is used to maintain pressures of 0.17–0.23 mbar.
  • Cooling: After curing, samples are cooled in air at room temperature, as this parameter has no impact on the final properties of the processed parts.
PLA-based samples revealed that binder weight percentage (wt%) and compaction pressure ( p c ) have a major impact on the selected mechanical properties, specifically bending and compression strength. Therefore, the study with PEEK focuses solely on these two key factors. The levels of binder weight percentage are reduced to three: 5, 10, and 15 wt%. Higher values are not considered, as the ISRU context emphasizes optimizing the use of consumables brought from Earth. Additionally, the properties achieved within the 5 to 15 wt% range for PLA are already satisfactory. Four levels of compaction pressure are selected, instead: 0.5, 2.5, 5.0, and 7.5 MPa. Compared to the previous analysis, the 7.5 MPa value is added to determine whether an asymptote might occur in the mechanical properties at higher compaction pressures.
Introducing PEEK into the process also allows for considering two additional variables, both crucial for applying the material in real-world scenarios: vacuum processing and temperature behavior. The former variable is fundamental for assessing whether the material can be processed directly on the Moon’s surface. The letter is critical for providing an initial indication of how the material would perform across a range of temperatures. A summary of all the processing parameters is detailed in Table 2; Section 3 details how both the processing parameters and environmental variables are accounted for in the analysis.

3. Mechanical Characterization Campaign

Two experimental campaigns are conducted, each comprising both compression and bending tests. The first campaign is focused on evaluating the influence of manufacturing process parameters on the mechanical properties of the samples. A full-factorial Design of Experiments (DoE) is employed, combining the parameters and levels described in Section 2 to generate a DoE matrix (see Table 3), resulting in 12 sample combinations. Given the large number of samples, curing is performed in air, providing a simpler and faster setup.
After the processing parameters are fixed, a second experimental campaign is conducted, again including both compression and bending tests. In this case, the samples are cured under vacuum, and the testing temperature is varied across three levels to assess the material’s behavior at different temperatures.

Bending and Compression Tests

For both bending and compression tests, standardized procedures referenced from ASTM and ISO are followed, specifically targeting reinforced rigid plastics and concrete. To keep consistency with [5], the same prism-shaped and cylindrical molds are used. The internal surfaces of these molds are coated with a high-temperature release agent (Cirex Si 041 WB) to ensure easy demolding. After manufacturing, all specimens are measured for weight and dimensions before testing. Data on load and displacement are recorded at a frequency of 10 Hz. Prism specimens with rectangular cross sections (see Figure 3a) are prepared in molds with internal dimensions of 150 mm in length, 25 mm in width, and 25 mm in depth. The mold is filled with powder to a depth of 10 mm; powders are leveled with a spatula before compaction takes place. Each specimen undergoes a three-point bending test at a constant speed of 2 mm/min until failure, using an MTS QTest10 Universal Testing Machine equipped with a 1 kN load cell. Bending stress and strain are calculated according to [61], and bending strength is determined at the maximum load each sample can bear. Cylindrical specimens (see Figure 3b) are produced using molds with nominal dimensions of 14 mm in diameter and 30 mm in height. The mold is filled completely with powder, leveled before compaction takes place. Each specimen undergoes a compression test at a constant speed of 1.3 mm/min until failure, using an Instron 8801 Universal Testing Machine equipped with a 10 kN load cell. Compression stress and strain are calculated following [62], and compression strength is determined at the maximum load each sample can withstand.
The elastic moduli of the samples from both compression and bending tests are also evaluated. An adaptive and robust data analysis method is implemented to compensate for the variable behavior exhibited by specimens, due to differences in the manufacturing parameters. The heterogeneity of the samples results in stress–strain curves with varying trends and characteristics, particularly in the initial toe region, which often displays non-linear behavior due to the initial slack or settling of the material under stress. The algorithm dynamically identifies the linear region within each stress–strain curve by performing a rolling linear regression. A windowed approach is used, wherein the slope of the curve is calculated over multiple and overlapping windows. The consistency of these slopes is then assessed, identifying the most stable linear portion of the curve. This stability is quantified by requiring that the variation among the slopes does not exceed 10%. By progressing through the curve and recalculating the regression for each window, the algorithm can effectively adjust to variations in curve trends, allowing for the identification of the true linear region regardless of the initial non-linear characteristics presented by different specimens.

4. Discussion on the Material Properties

This section presents the results of the two campaigns. In both, six identical specimens are tested under bending and compression for each combination of process or environmental parameters. This approach allows the removal of potential outliers within each set while still meeting the ASTM requirements for statistical significance with five valid samples.
While this section presents graphical data for the quantities under study, Appendix A extends the discussion by presenting the specific values.

4.1. Impact of the Process Parameters

Figure 4 presents a summary of the first bending campaign, showing the strengths (Figure 4a) and moduli (Figure 4b) measured across the samples. The bars represent the average values for each run, with error bars indicating the standard deviation. The bars correspond to the data after removing (possible) outliers, which are excluded based on the two standard deviations criterion. In all cases, each sample set includes a minimum of five specimens as required by ASTM standards for mechanical characterization. Both bar charts are divided into three sections, each representing a different binder weight percentage (wt%). At the same binder weight percentage, the compaction pressure increases from left to right as described in Table 3. Significant variability is observed, with bending strengths ranging from 0.6 to 14.9 MPa and moduli from 66.0 to 1877.5 MPa, as both properties are strongly influenced by binder content and compaction pressure.
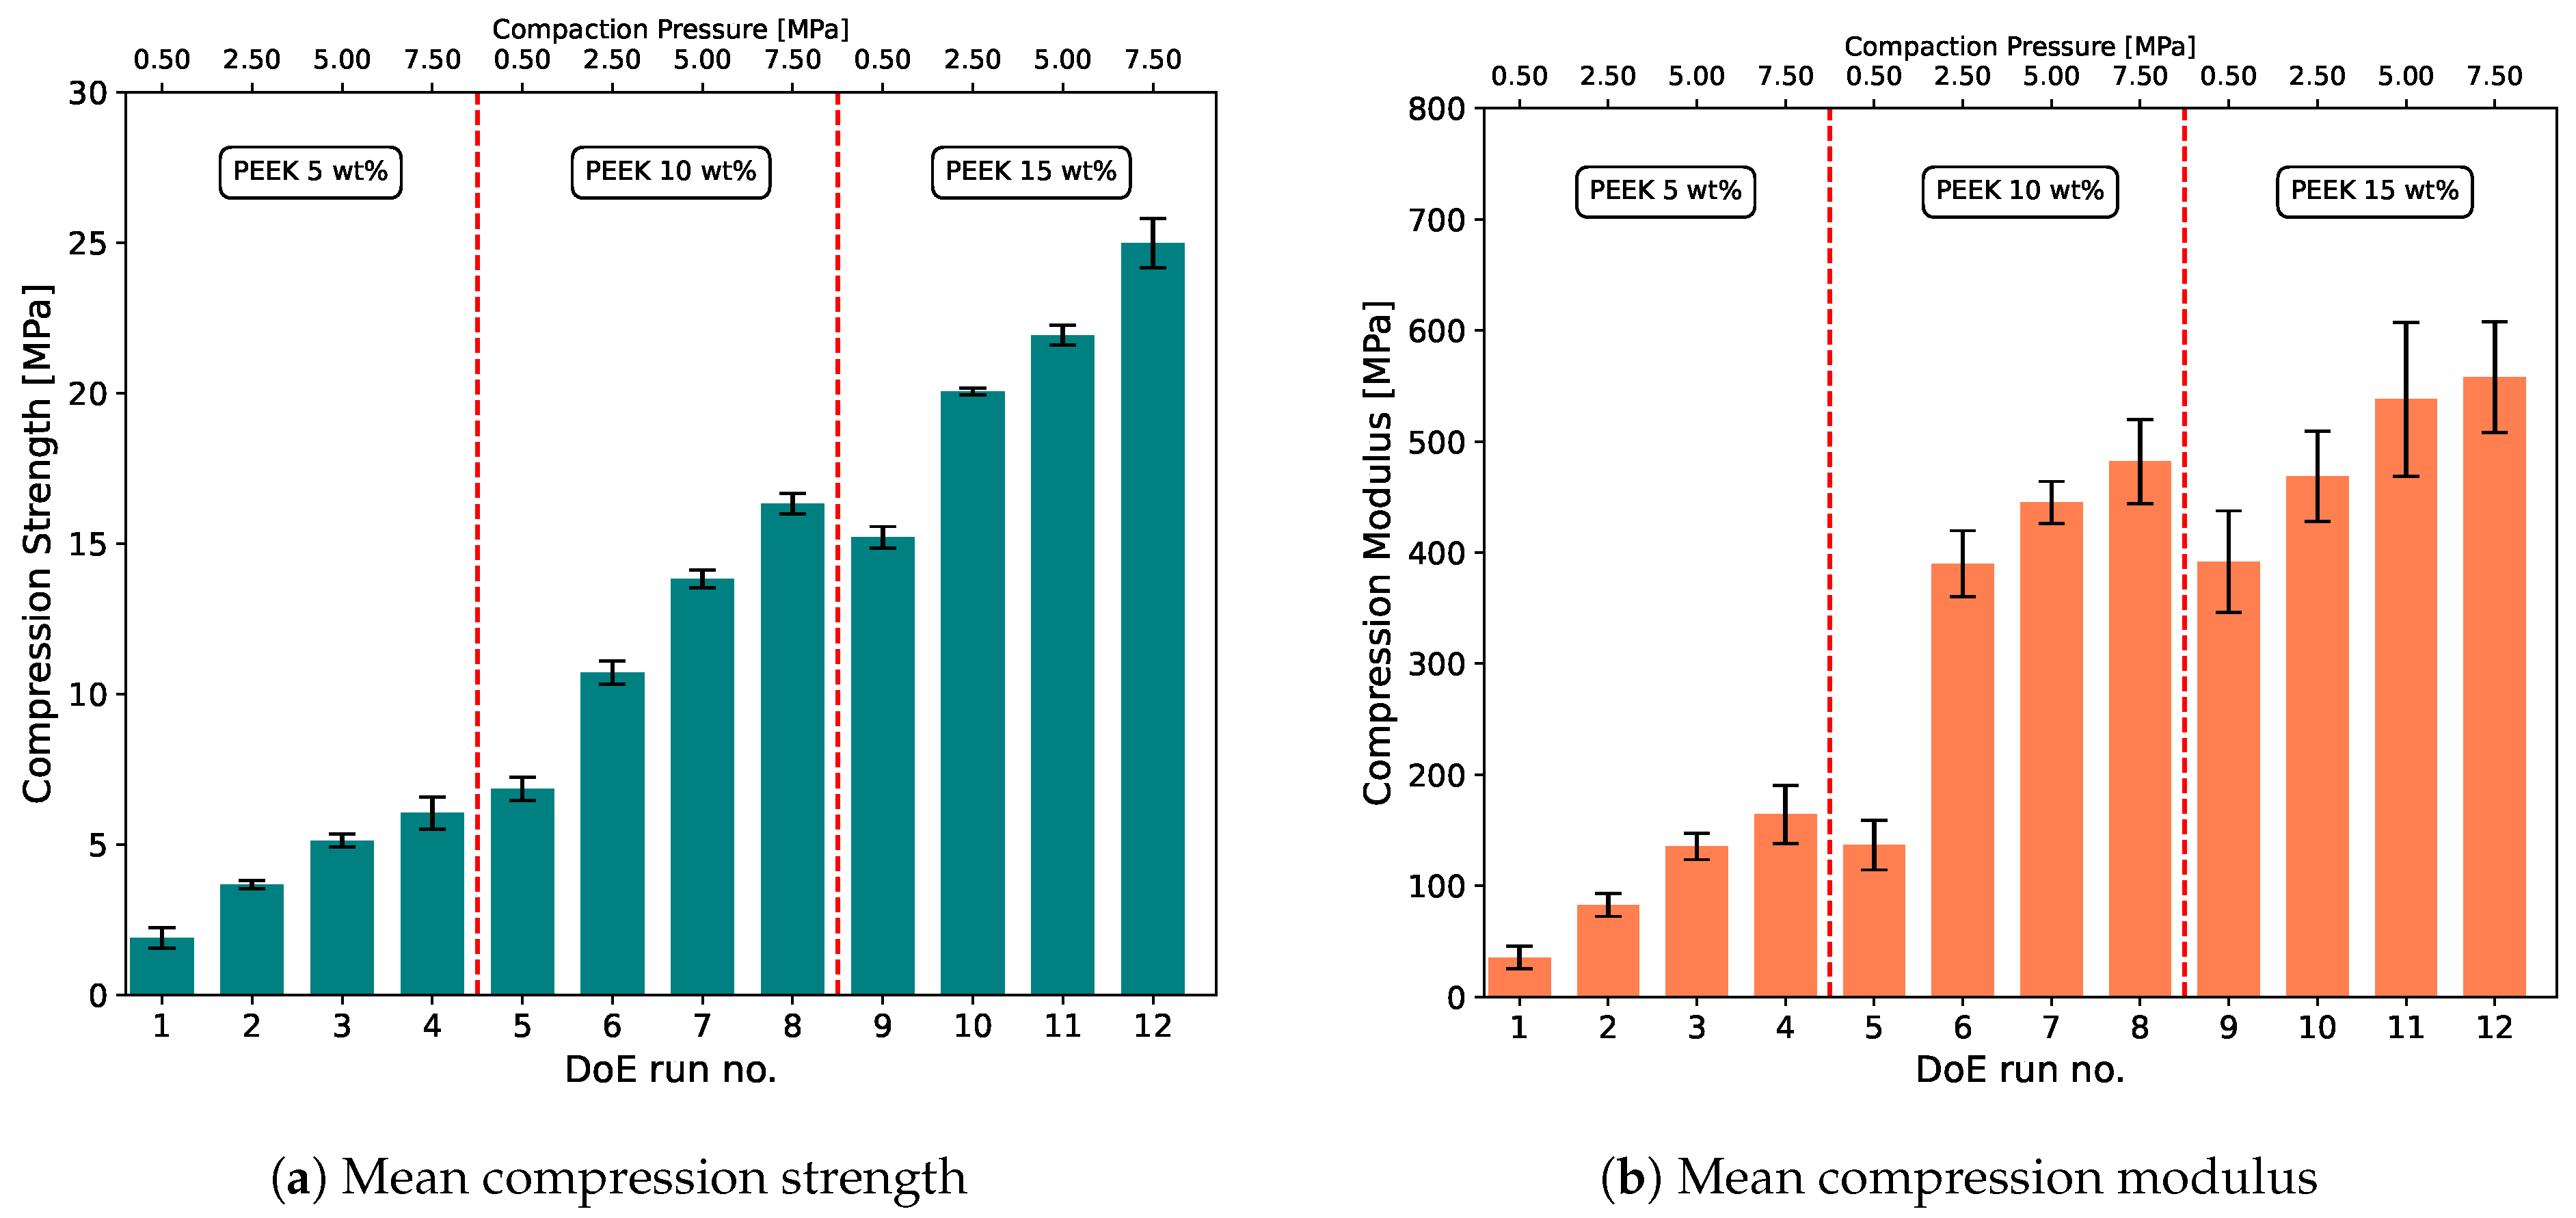
Figure 5 follows an analogous approach while presenting a summary of the compression campaign, showing the strengths (Figure 5a) and moduli (Figure 5b) measured across the tested samples. Similarly, the compression properties are significantly affected by the compaction pressure and binder weight percentage. There is notable variability across the full sample set, with compression strengths ranging from 1.9 to 25.0 MPa, and moduli from 35.5 MPa to 558.0 MPa.
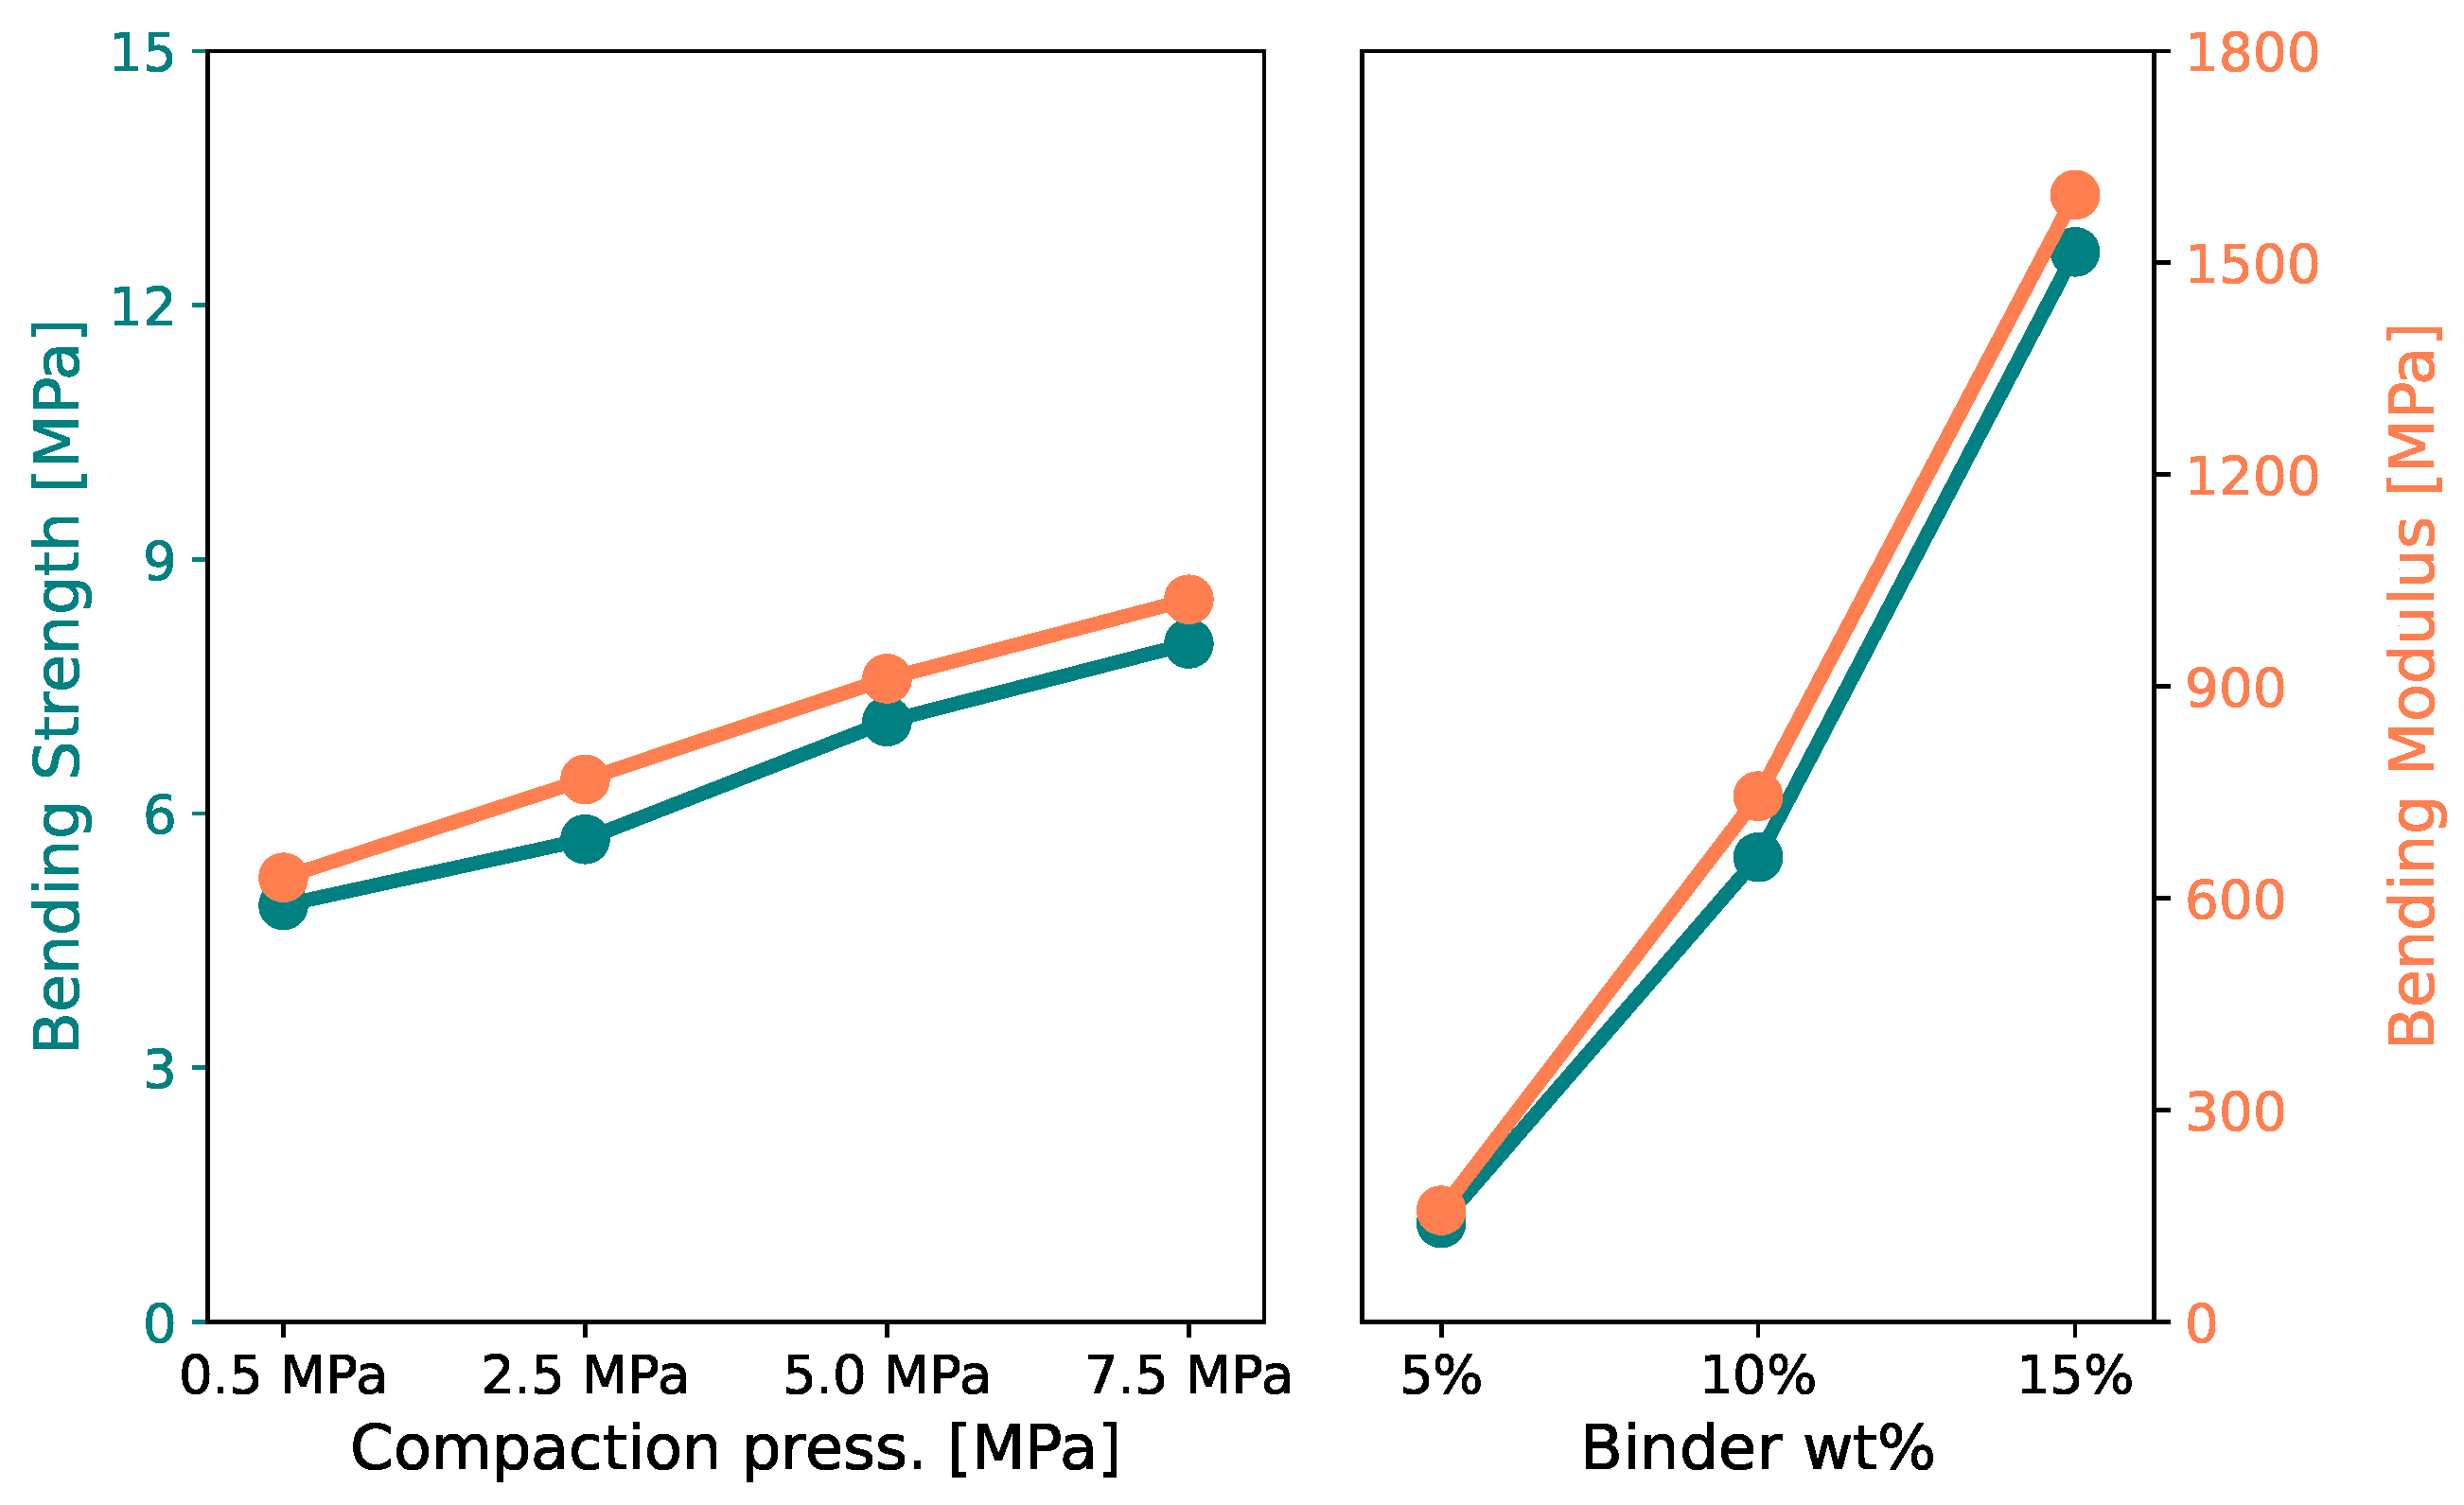
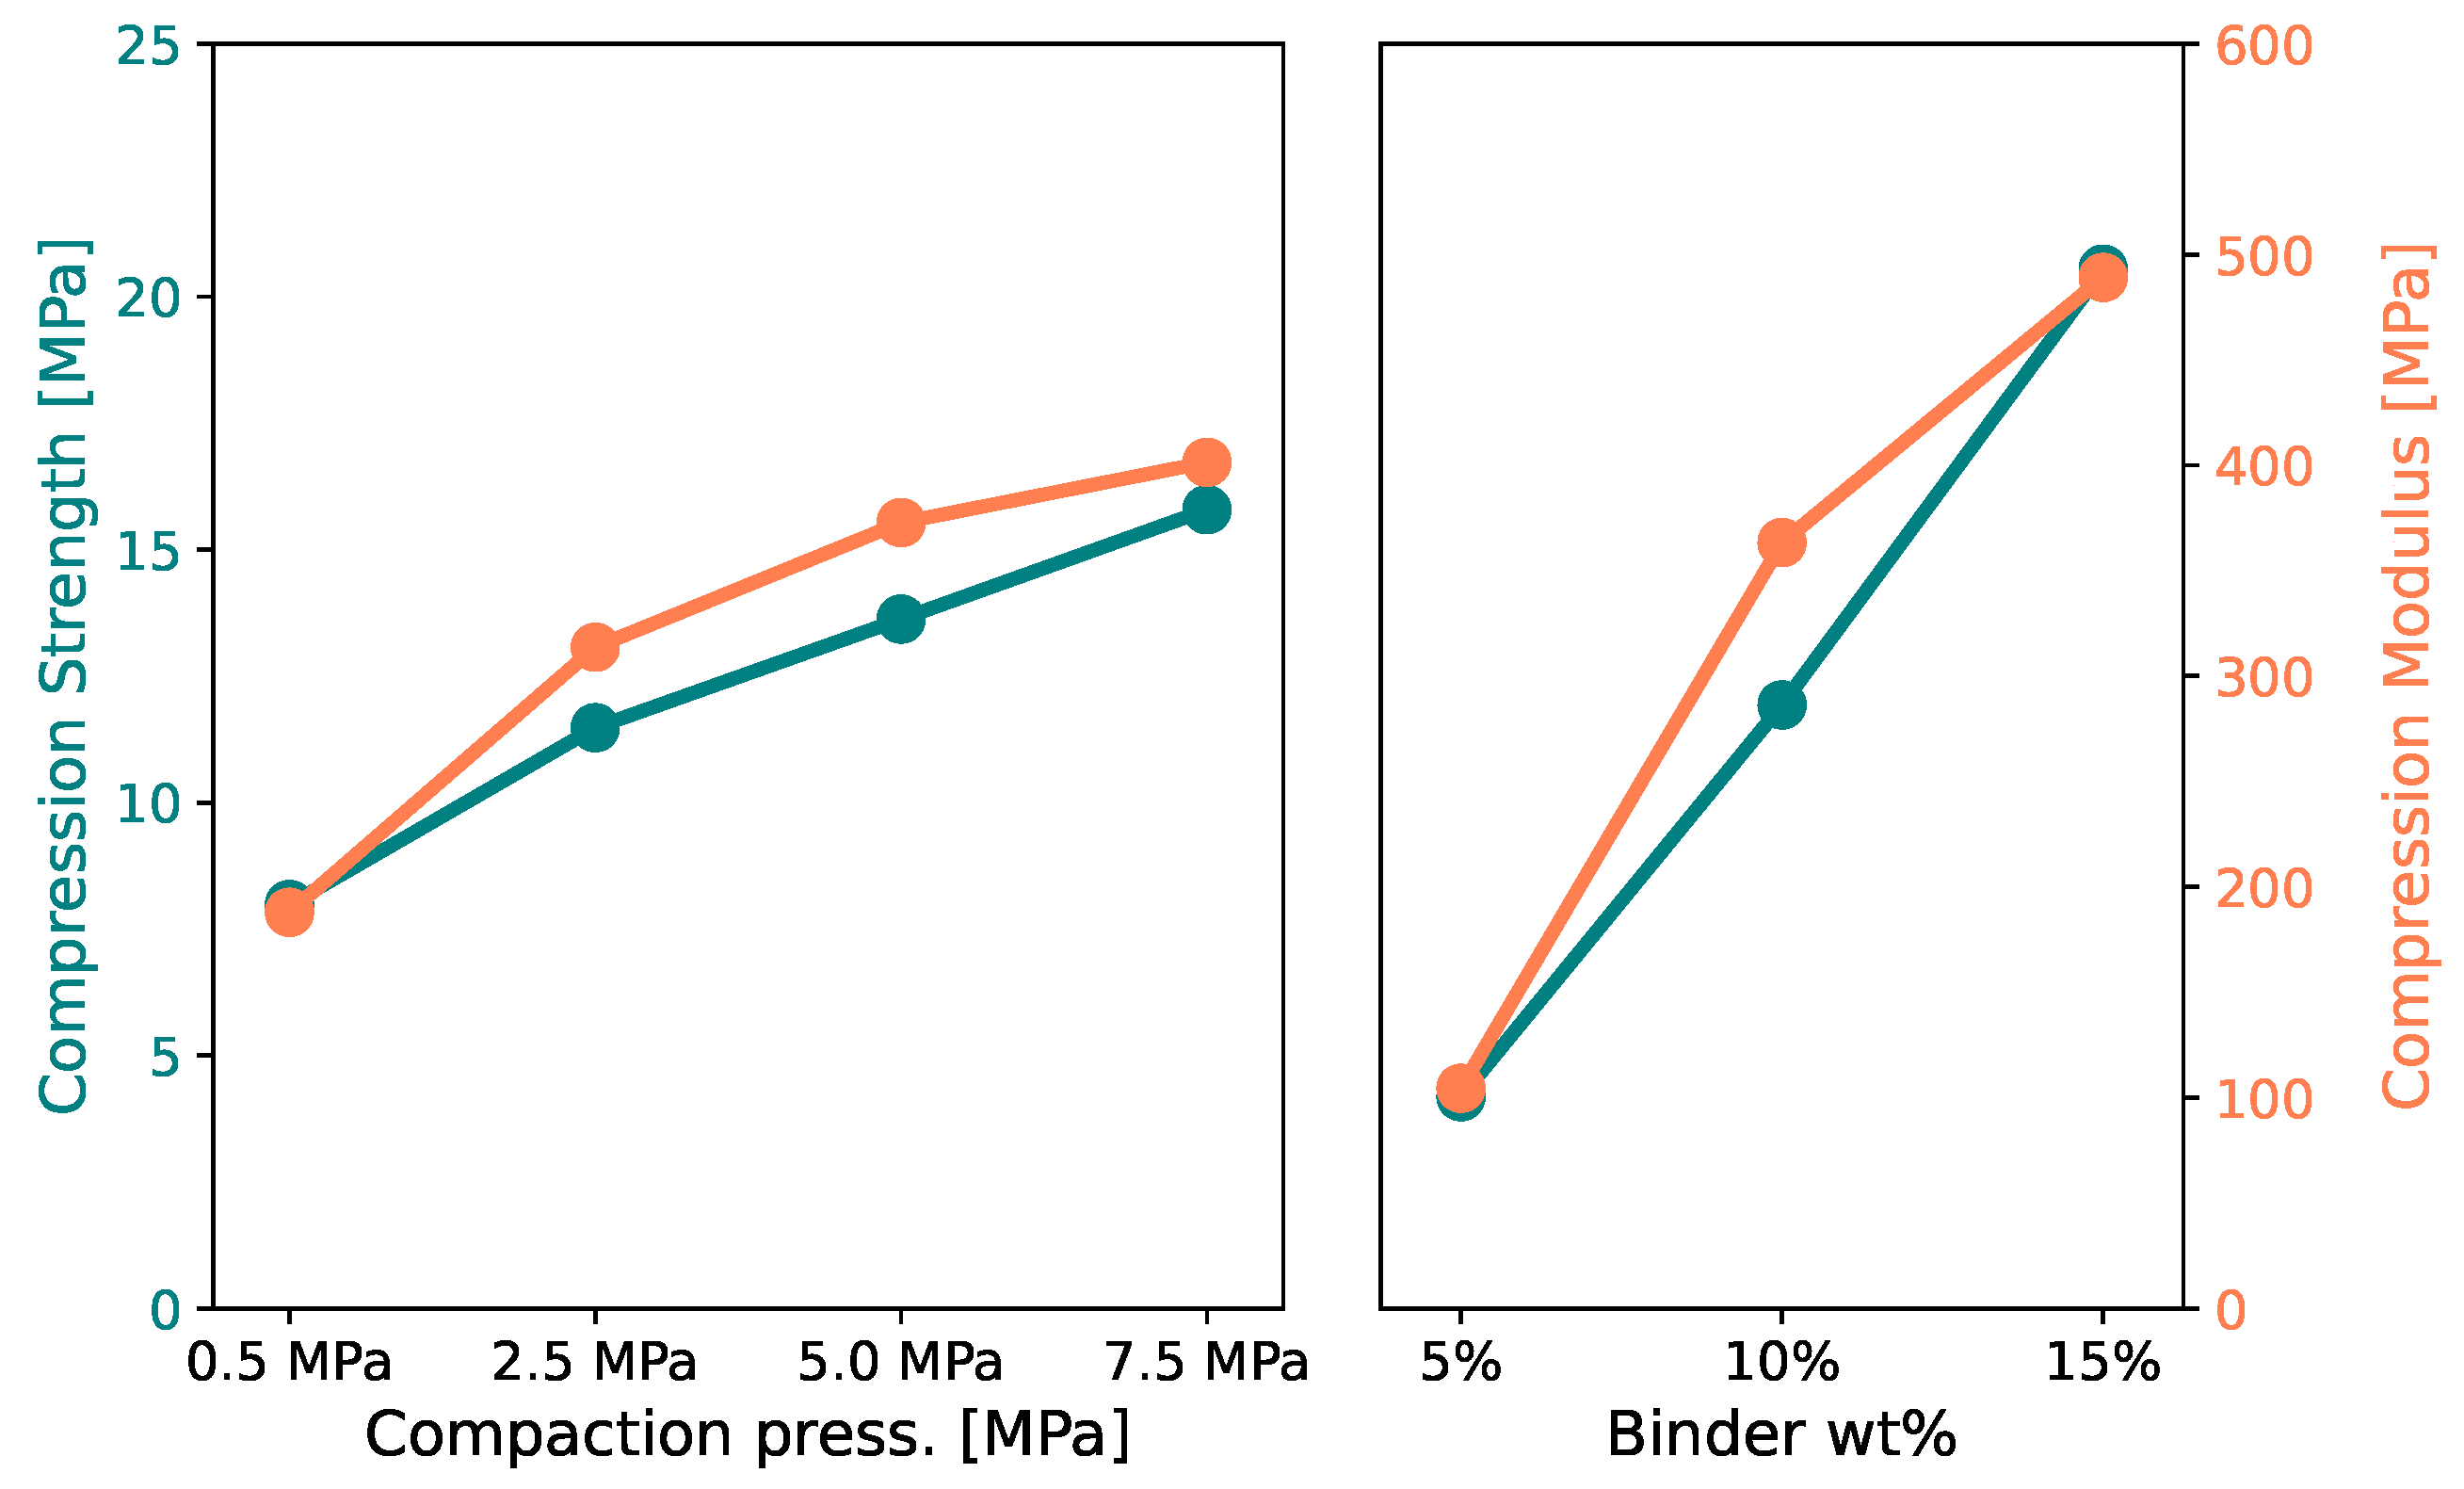
To separate the individual effects of the two processing parameters on the mechanical properties, Figure 6 and Figure 7 present the main effects plots for bending and compression properties. The vertical axes display the response variables, with blue representing the bending and compression strengths, and red indicating the bending and compression moduli. The horizontal axes show the levels of the control factors, specifically the compaction pressure and the binder weight percentage (wt%). The analysis confirms that both parameters are critical in determining the mechanical properties of the samples, as adjusting them enables tailoring the material properties by enhancing the strengths and moduli. When ranking the two parameters, the effect of the binder is far more pronounced than that of the compaction pressure. The trend appears monotonic across all response variables, following a consistent and overlapping pattern. Within the considered ranges, there is no clear indication of an asymptote or saturation point where the positive effects of increased binder content or compaction pressure diminish. This suggests that even higher mechanical properties could be achieved with further increases in these parameters. However, caution must be exercised in pushing these limits: binder weight percentage cannot be increased indefinitely, as minimizing the use of Earth-sourced raw materials is crucial. Similarly, compaction pressure should not be excessive, especially when considering applications for large-scale components.

4.2. Effects of Vacuum Processing and Temperature Testings

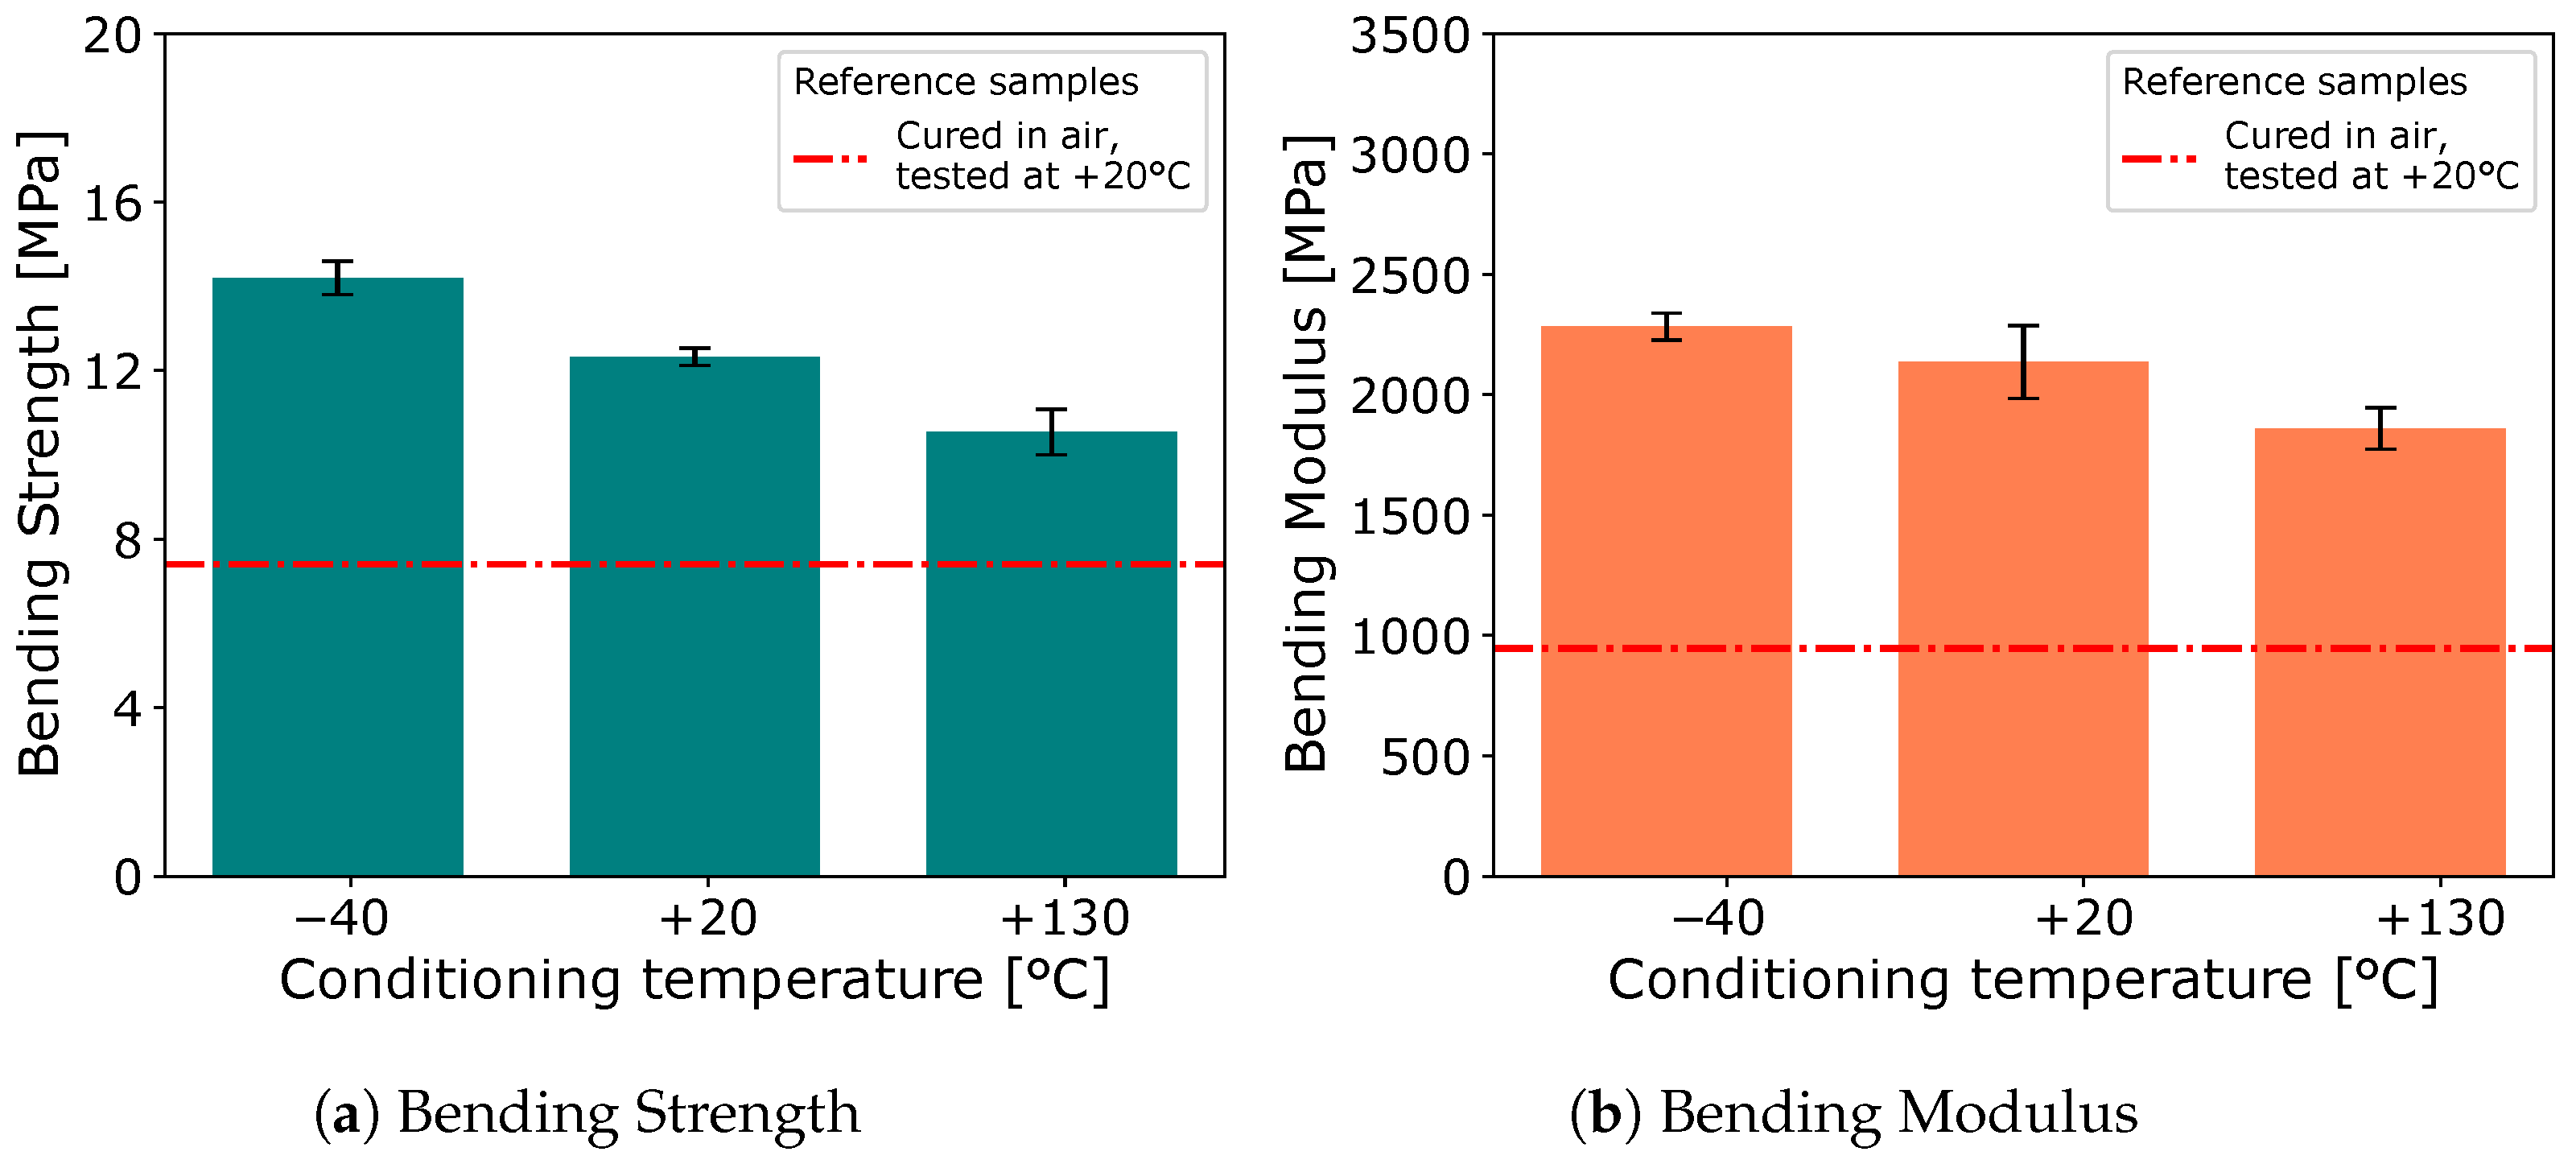
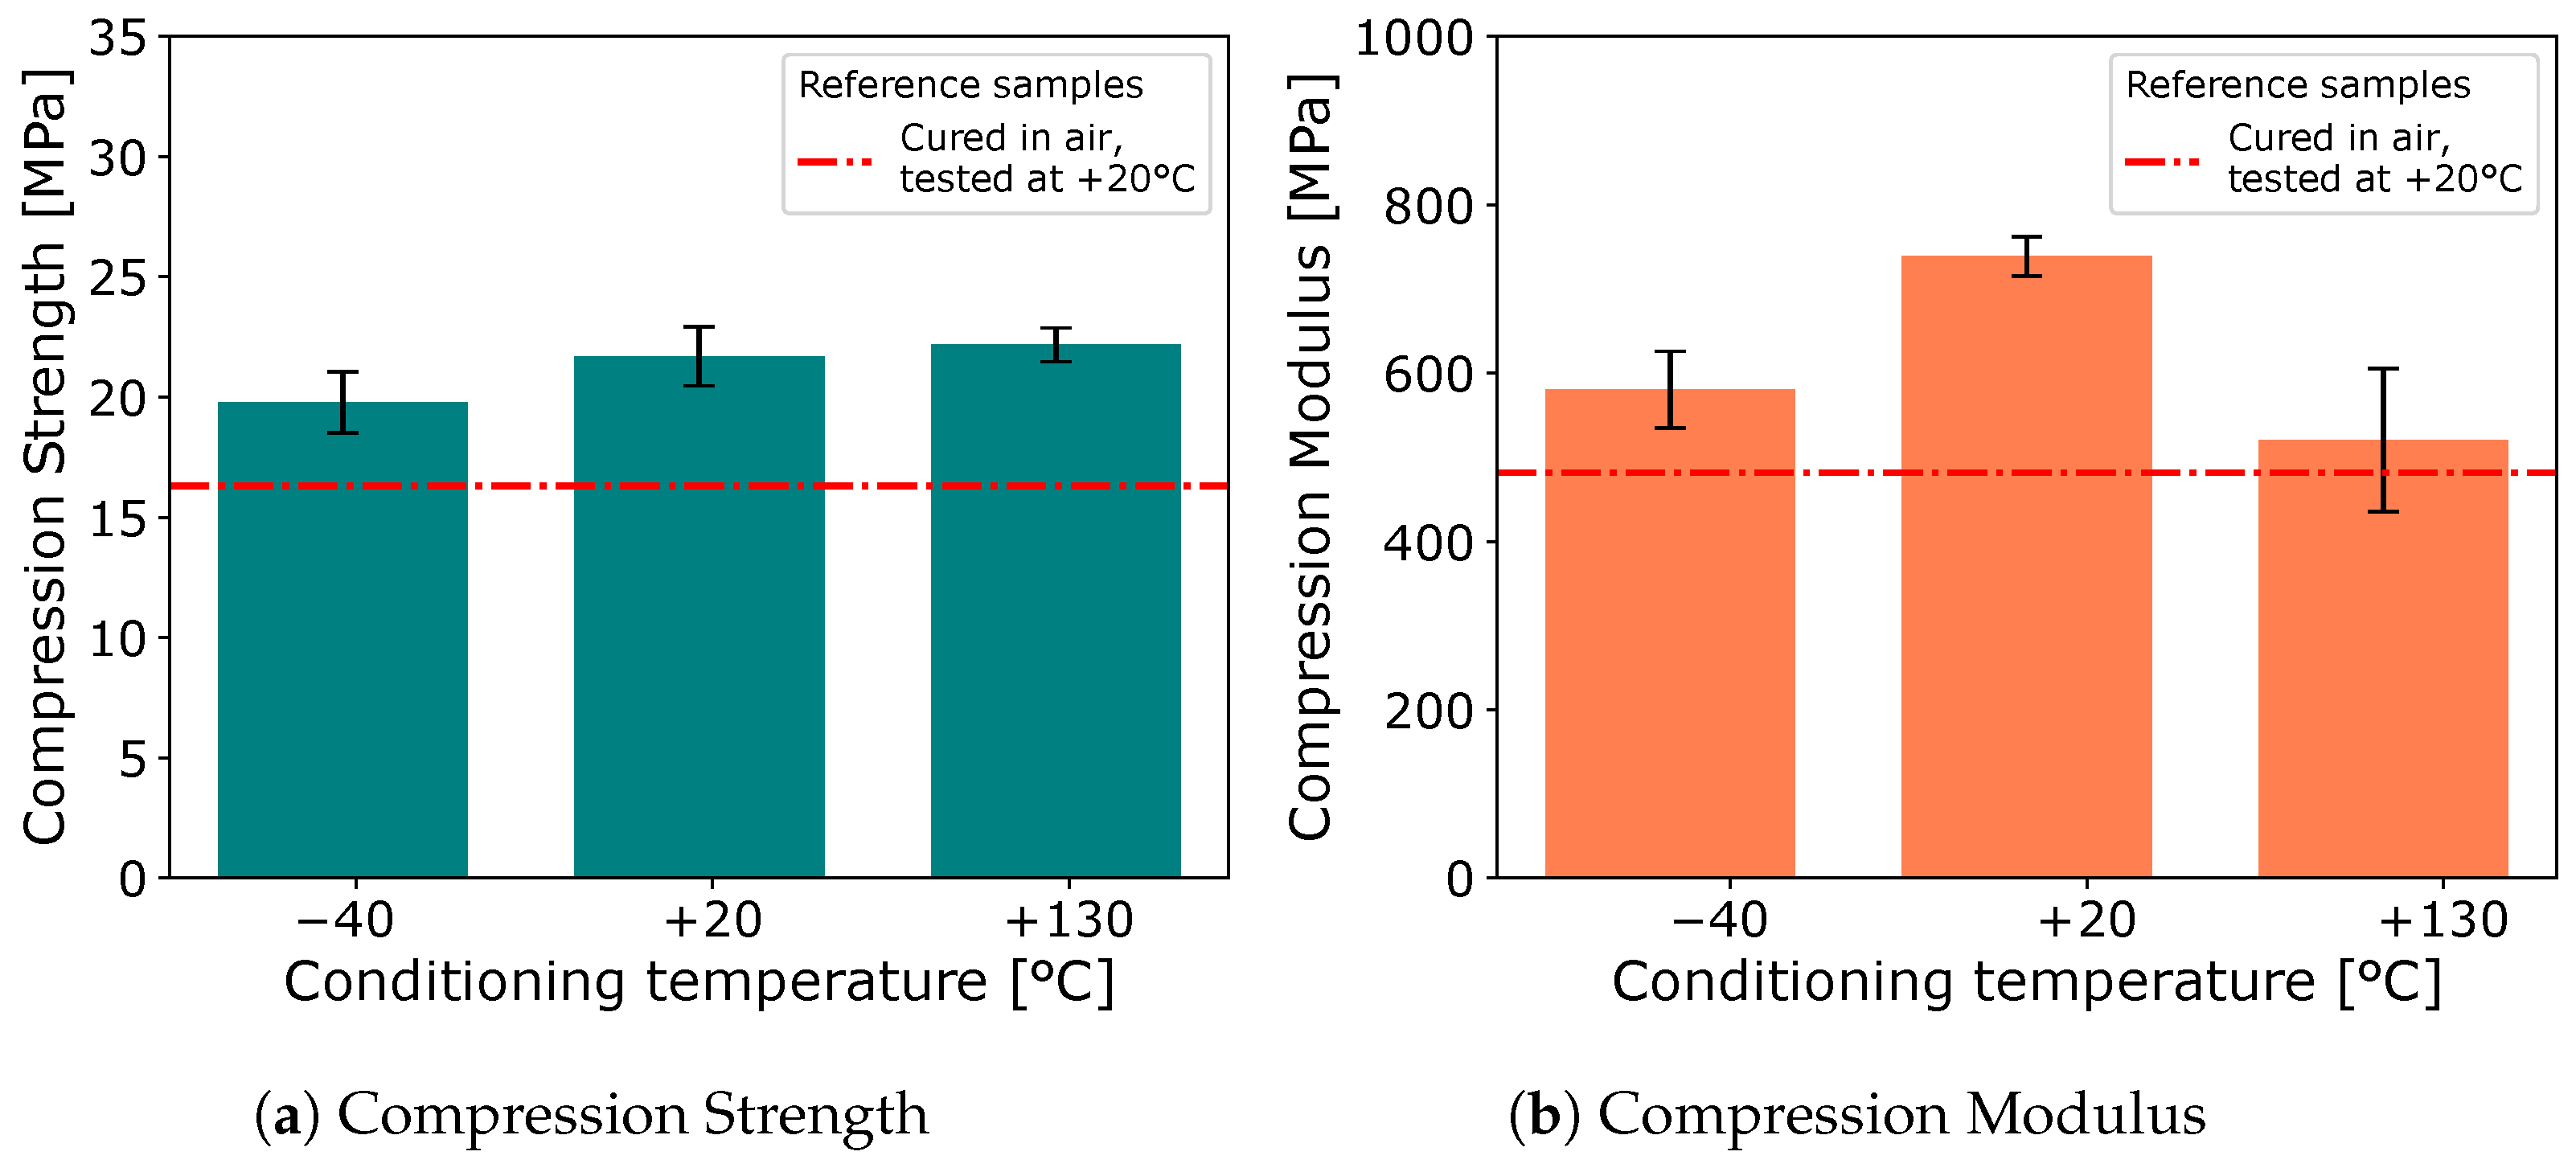
To evaluate the effects of vacuum processing and different testing temperatures, the decision is made to fix the processing parameters as follows: compaction pressure at 7.50 MPa and binder weight percentage at 10 wt%. As will be discussed in more detail in Section 4.3, these values already result in components that, processed in air and tested at ambient temperature, exhibit mechanical properties suitable for construction. The compression strength (16.3 MPa) exceeds that of industrial floor bricks and is comparable to that of the building bricks used in Earth applications, while the bending strength (7.4 MPa) falls within the range of steel fiber-reinforced concrete and high-strength concrete. Figure 8 and Figure 9 present the results of the second campaign, following a similar approach to the first one. In each graph, a red line highlights the reference value for the corresponding quantity (strength or modulus) measured at ambient temperature (20 °C) on the samples cured in air.
The effects of vacuum processing and conditioning temperature can be discussed separately by analyzing the graphs with different focus areas. The performance of the samples cured in vacuum and tested at room temperature is significantly superior to that of the corresponding samples cured in air. This improvement is evident across all the mechanical properties, with an increase of +66% in bending strength, +125% in bending modulus, +33% in compression strength, and +53% in compression modulus. The results indicate that the effect of vacuum processing is more pronounced on the moduli than on the strengths. Notably, the effect on the bending properties is approximately double that on the compression properties. Since bending involves a combination of both compression and tensile forces, this disparity implies that vacuum processing has a dramatic impact on the material’s tensile properties. This suggests that vacuum curing likely improves particle cohesion and reduces internal voids, resulting in a material that is not only stiffer but also better able to withstand tensile stresses.
The conditioning temperature has a distinct impact on both bending and compression properties, with varying effects on the strength and modulus. For the bending strength and modulus, there is a clear monotonic trend: lower conditioning temperatures enhance both properties, while higher temperatures degrade them. Specifically, at −40 °C, the bending strength and modulus show improvements of +15% and +7%, respectively, compared to the room temperature reference, while at +130 °C, the variations are −15% and −13%. However, these temperature-induced changes are secondary compared to the impact of vacuum processing. Even in the worst-case scenario, the bending properties of vacuum-cured samples remain superior to those of air-cured specimens tested at room temperature. In contrast, the trend for compression strength differs from that of bending strength. At −40 °C, compression strength decreases by −9% compared to the room temperature reference, while at +130 °C, it increases by 2%. The compression modulus behaves differently, reaching its peak at room temperature, with decreases observed at both −40 °C (−21%) and +130 °C (−29%). Again, despite these variations, the compression properties of vacuum-cured samples still outperform those of air-cured specimens tested at room temperature, underscoring the dominant effect of vacuum processing over temperature conditioning.
The conditioning temperatures are constrained by the capabilities of the climatic chamber used in the experiment, with the upper limit (130 °C) aligning with the maximum temperature observed on the lunar surface and the lower limit (−40 °C) still being relatively high compared to actual lunar conditions. Consequently, further validation using more representative temperature ranges will be necessary. Nonetheless, the literature provides encouraging insights, indicating that the tensile strength of PEEK increases at lower temperatures, a trend that is reflected in its bending strength at least down to −40 °C. For compressive strength, the observed decrease is minimal, with a reduction of only 9% when transitioning from room temperature to −40 °C.

4.3. Comparison with Standards for Bricks Classification

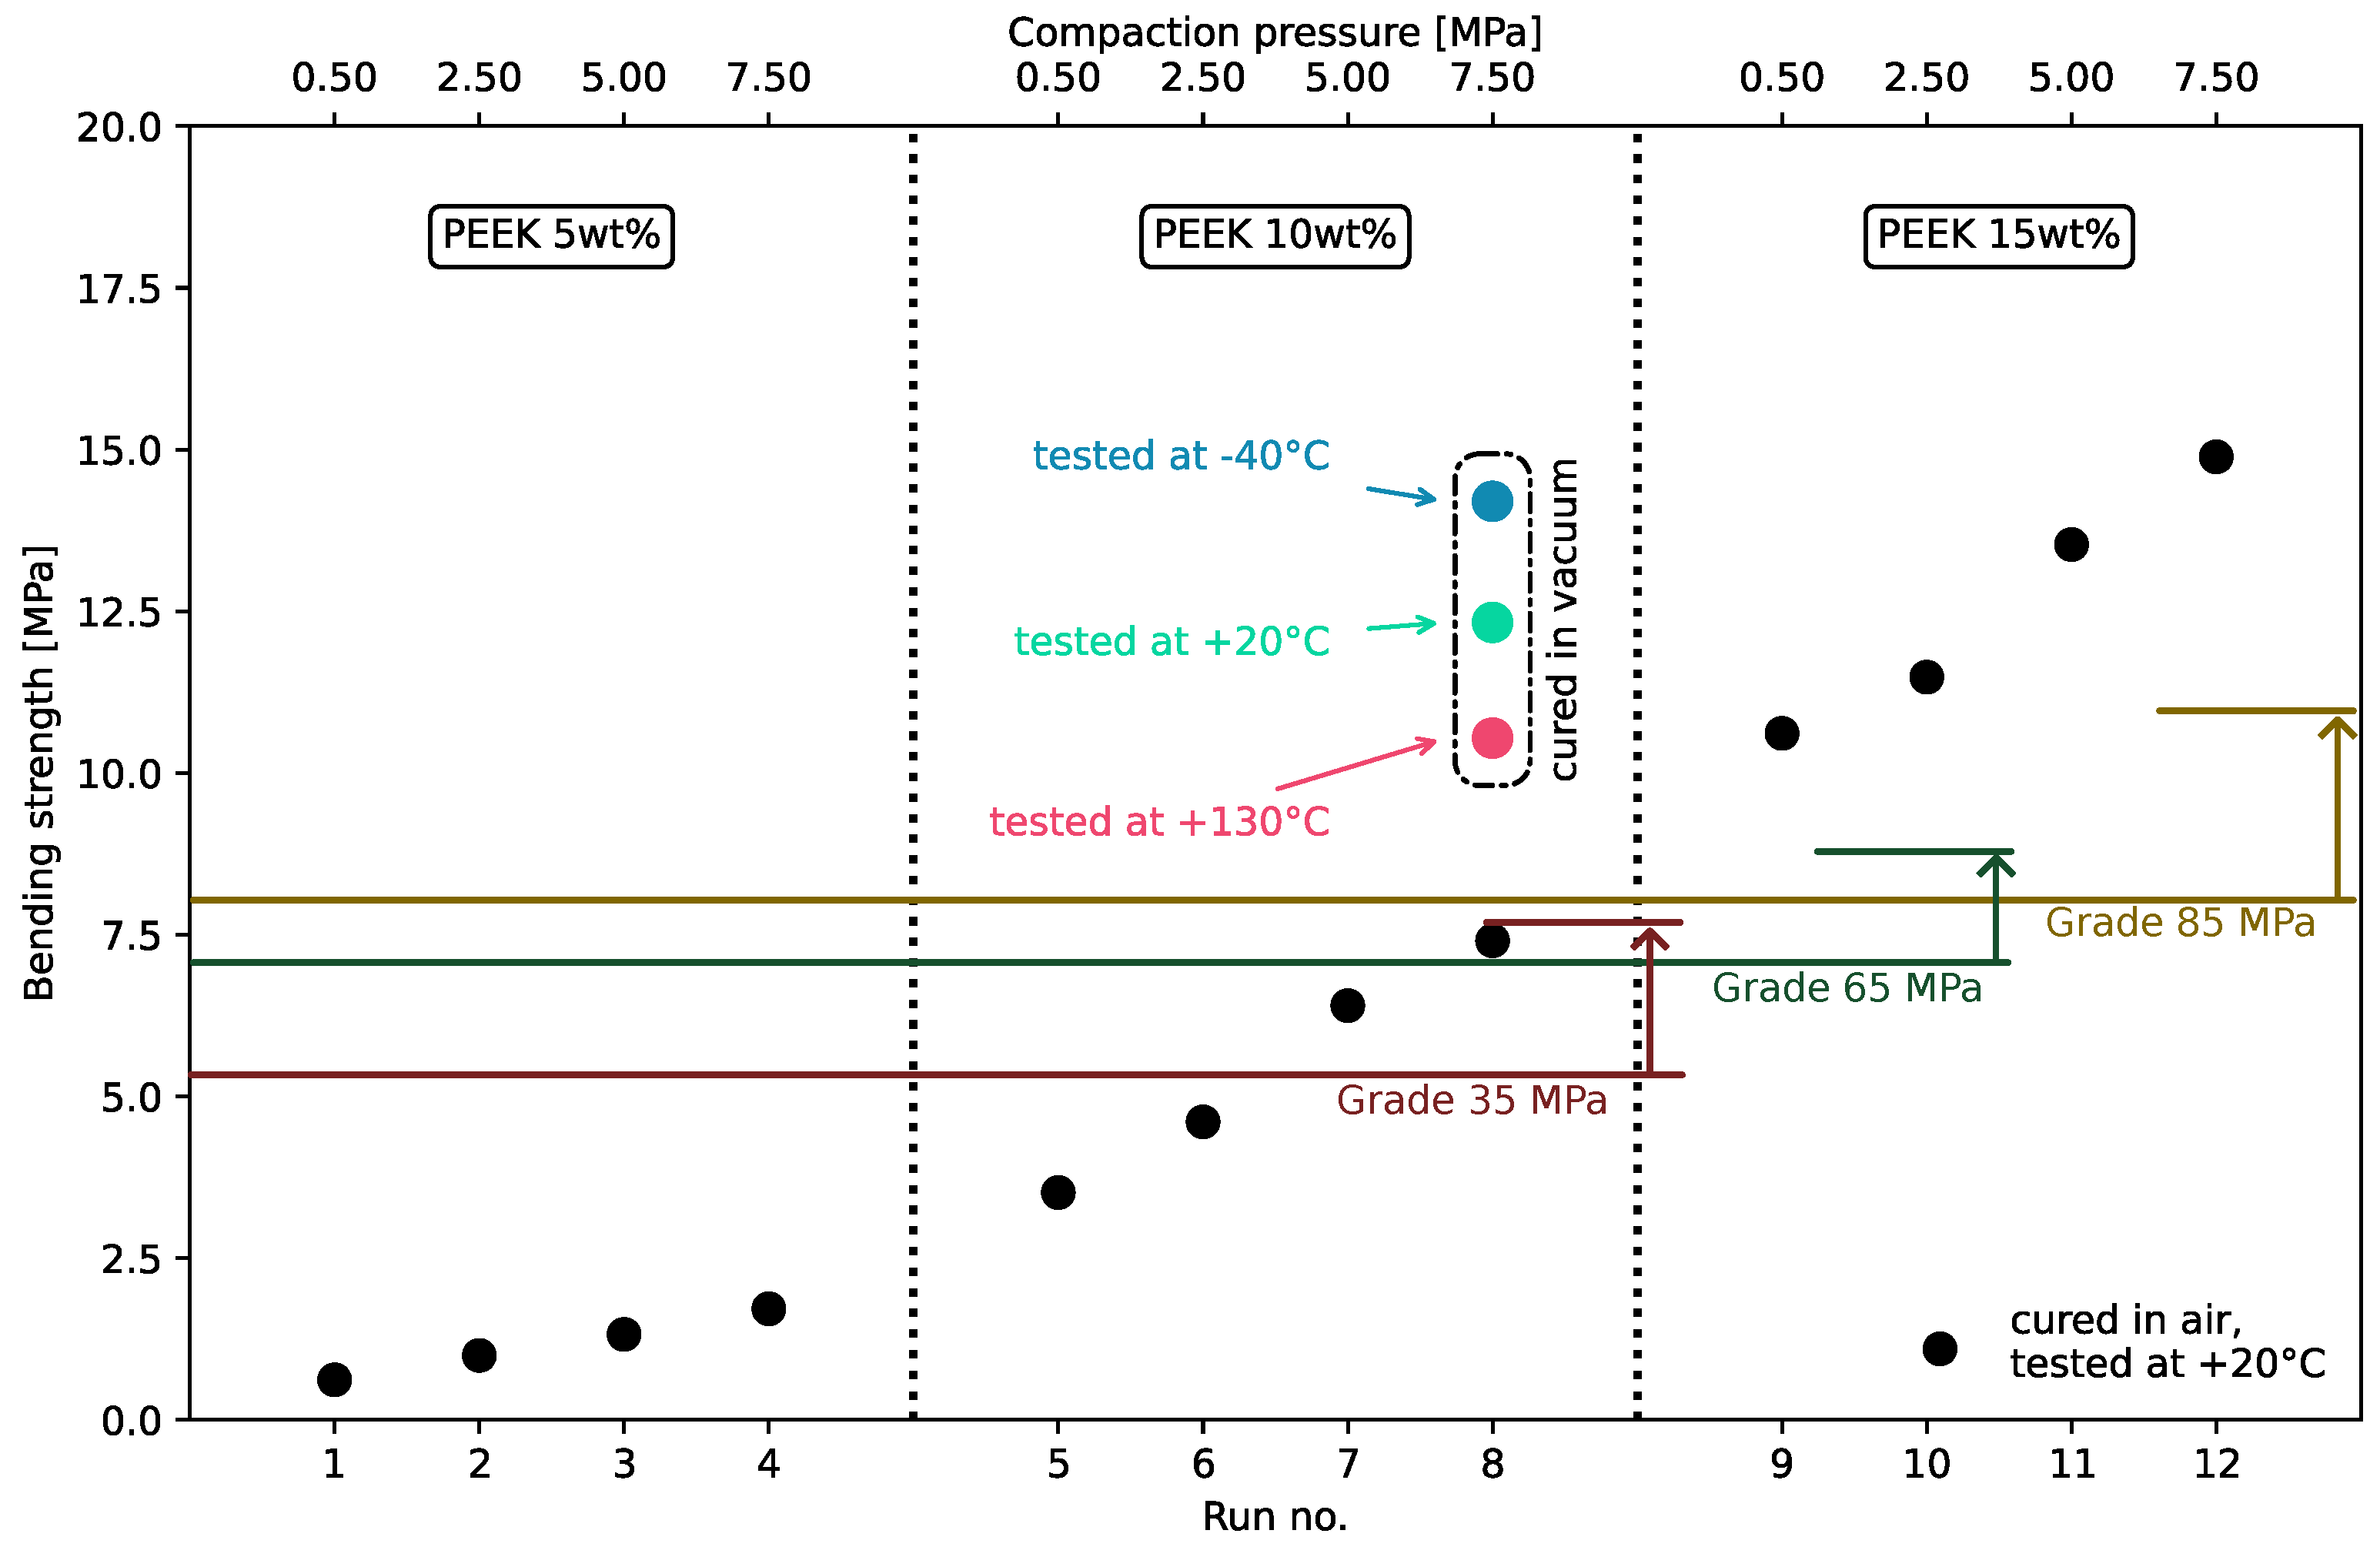
This section compares the experimental results with standard and experimental benchmarks commonly used for structural applications on Earth. In this sense, the comparison adopts a conservative approach, as preliminary estimates of strength requirements on the Moon [21,22,23,24] should be scaled down by the same factor as lunar gravity (1/6 of Earth’s gravity). Figure 10 shows the mean bending strengths of the DoE runs (black dots), with all samples cured in air and tested at +20 °C. Three additional data points, associated with run 8 (compaction pressure of 7.50 MPa and binder weight of 10 wt%), represent samples cured in vacuum and tested at different temperatures. Steel fiber-reinforced concrete in three different grades serves as a reference for comparison. For samples cured in air and tested at ambient temperature, all samples at 15 wt% PEEK meet or exceed all grade requirements, regardless of compaction pressure. The 10 wt% PEEK and compaction pressures above 5 MPa already meet the 35 MPa requirements, while the 10 wt% PEEK at 7.50 MPa meets those of the 65 MPa grade. On the other side, samples cured in vacuum exhibit bending strengths that meet or significantly exceed the requirements for all grades across all tested temperatures.
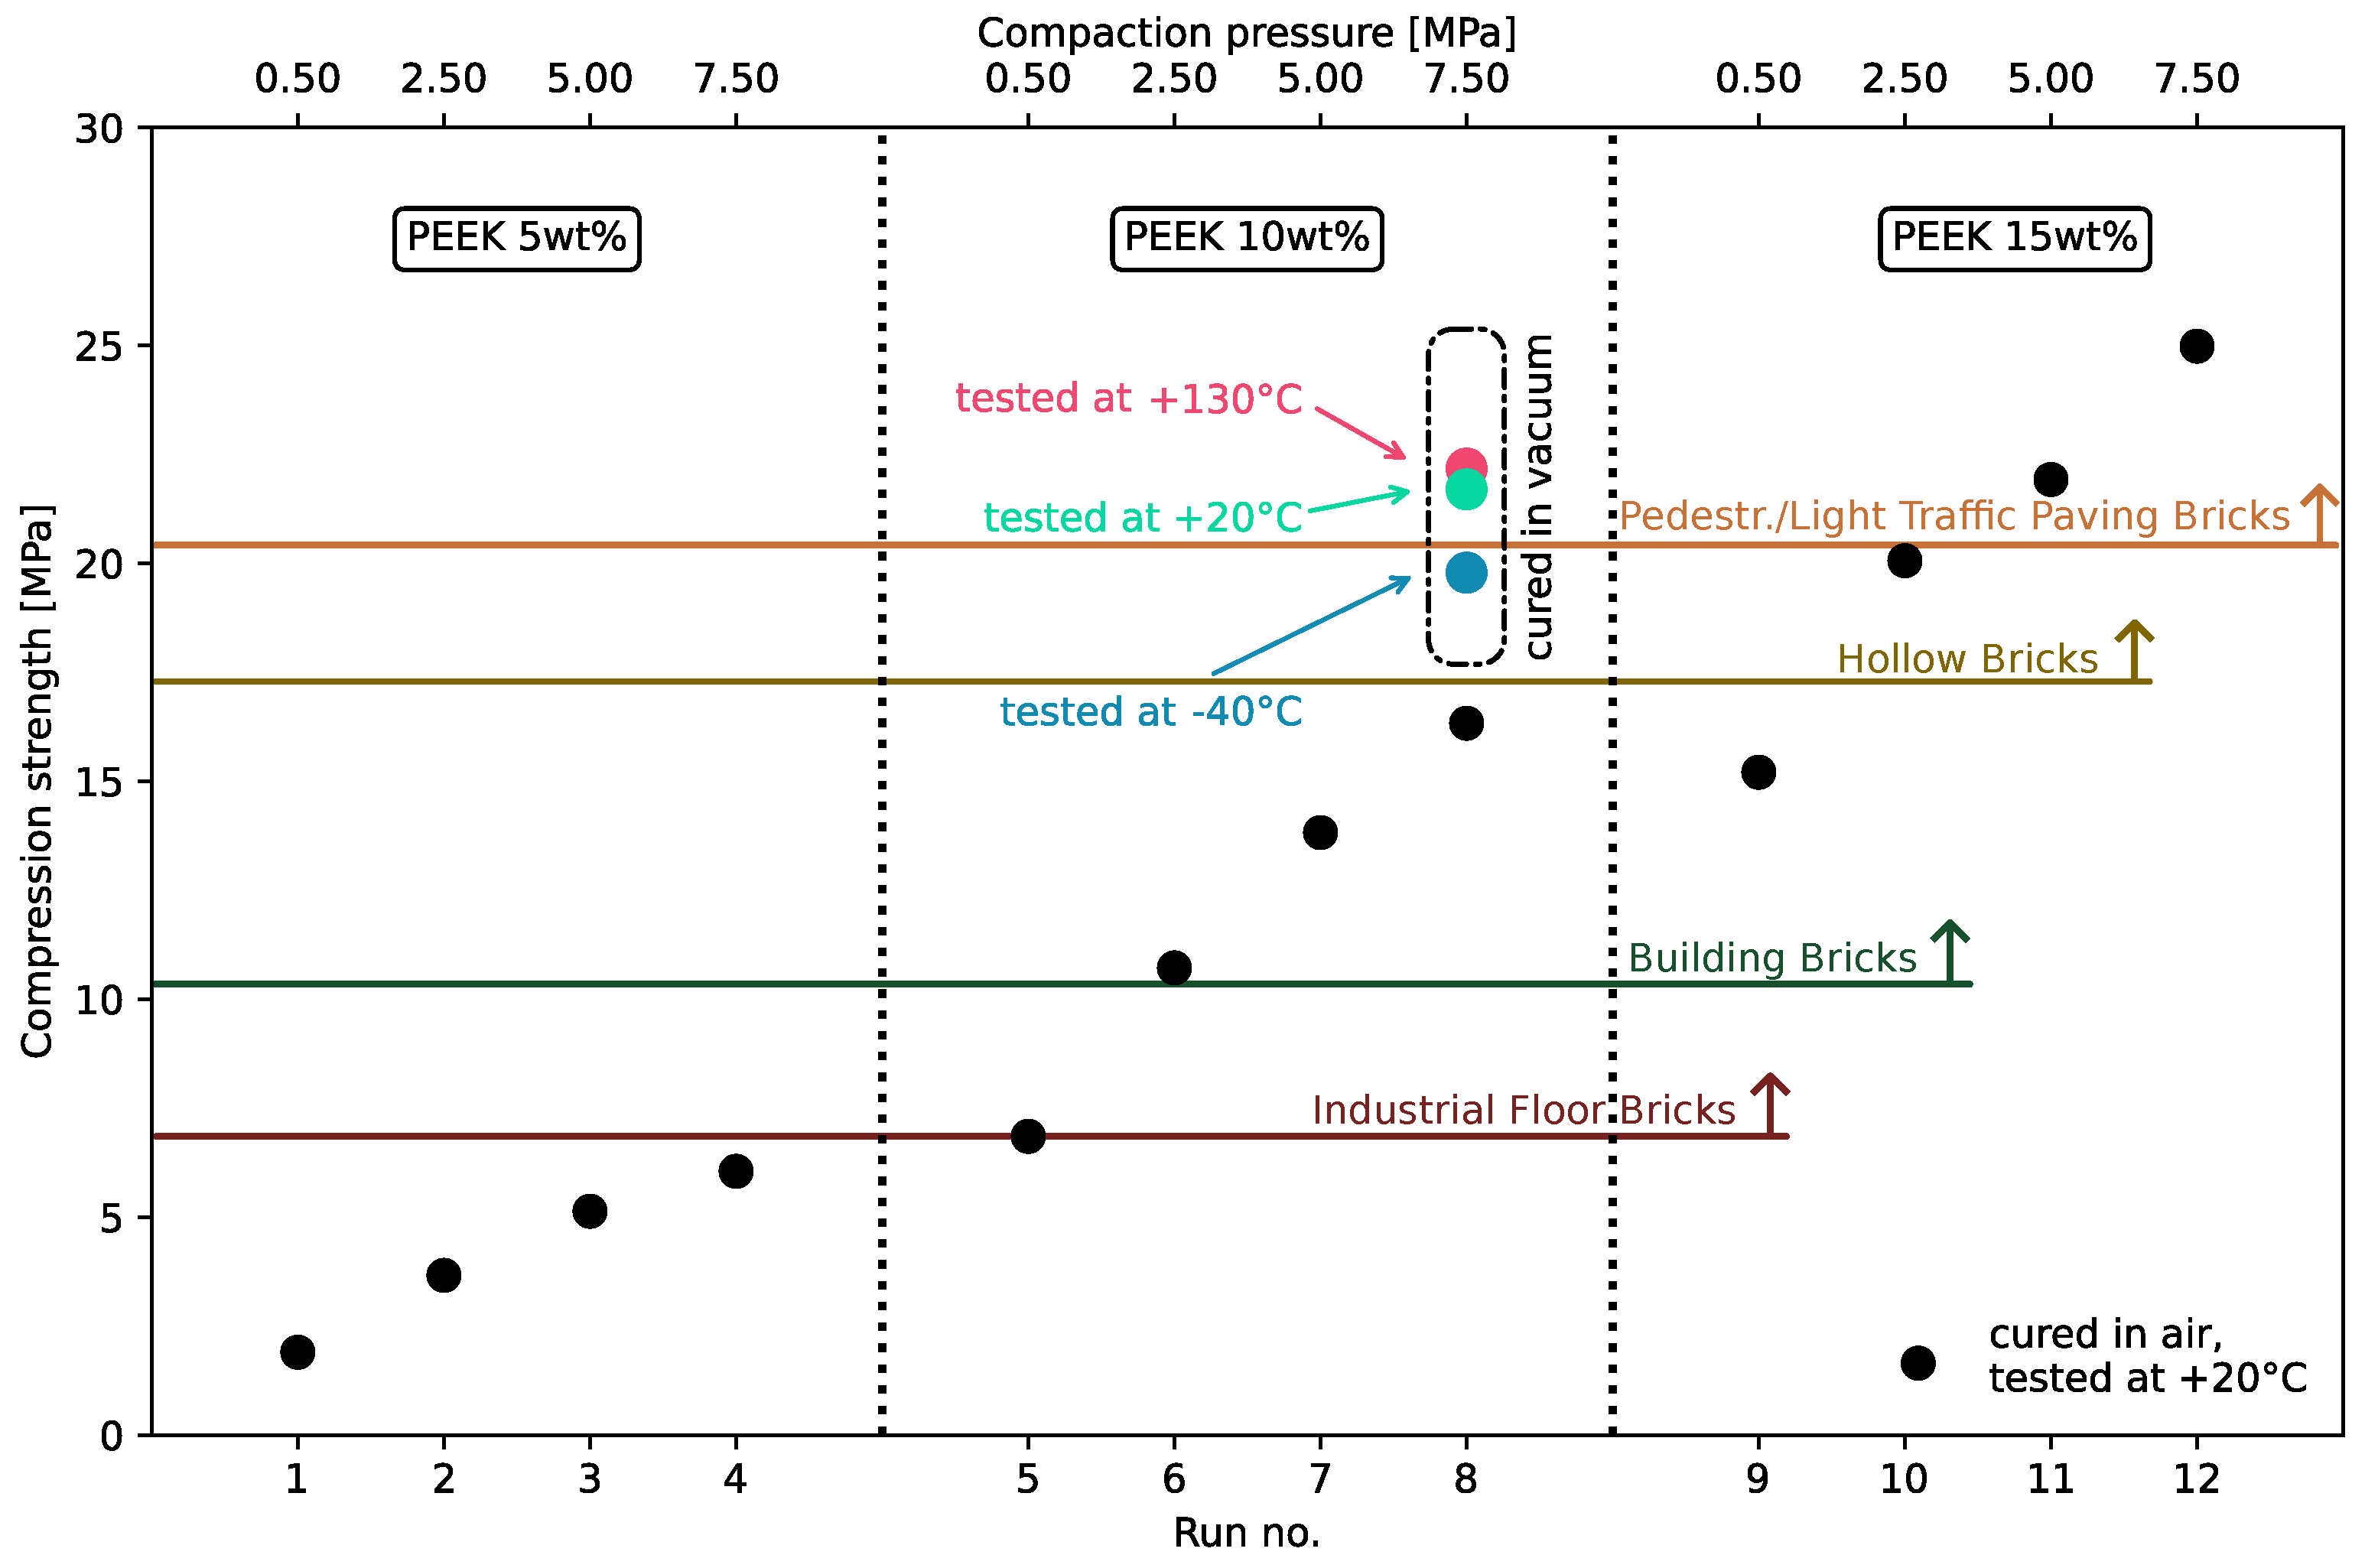
Figure 11 follows the same approach and presents the compression strength results, evaluated against the minimum requirements for various brick types as specified by ASTM standards. The analyzed combinations of compaction pressure and PEEK weight percentage accommodate the performance needs of industrial floor, building, hollow, and pedestrian/light-traffic paving bricks. Specifically, the requirements for hollow bricks and pedestrian/light-traffic paving bricks are met and exceeded with 15 wt% PEEK at compaction pressures above 2.50 MPa and 5.0 MPa, respectively. Industrial floor and building brick requirements are satisfied with 15 wt% PEEK regardless of compaction pressure and with 10 wt% PEEK when the compaction pressures exceed 0.5 MPa and 2.50 MPa, respectively. Samples cured in vacuum meet or exceed the requirements across all cases and tested temperatures, except for the sample tested at high-temperature, where performance slightly falls below the requirements for pedestrian/light-traffic paving.
Appendix B extends this comparison by incorporating requirements and standard values from a broader range of applications.

5. Conclusions

This study explored regolith-based composites with minimal thermoplastic binders, selecting PEEK as the binder after a thorough trade-off analysis of manufacturing and environmental constraints. The manufacturing process involved compacting regolith grains and binder powders in molds, heating to melt the binder, and cooling to solidify the composite. The effects of binder content and compaction on compression and bending properties were evaluated under varying conditions, including vacuum and different temperatures. The results demonstrated the feasibility of producing standardized components with mechanical properties compatible with or exceeding equivalent lunar construction requirements:
  • A binder content of 5 wt% met and exceeded equivalent compression strength requirements for lunar applications, including building and paving bricks.
  • The compression strength needed for lunar concrete applications, such as basement walls, slabs, and reinforced beams, was achieved with 5 wt% binder.
  • At 10 wt%, the composite satisfied strength requirements for similar Earth-based structures.
  • Bending strength results mirrored these trends, with 5 wt% meeting the equivalent performance for conventional and reinforced concretes on the Moon, and 10 wt% ensuring compliance for Earth-based requirements.
  • Vacuum curing significantly enhanced mechanical properties, enabling compatibility with all lunar and most Earth-based requirements.
  • Binder weight percentage and powder compaction positively influenced all mechanical properties. The minimal binder content and low pressures used in the process underscore its scalability for larger structures.
Despite these promising results, several limitations must be overcome before this formulation can be effectively adapted for applications on the lunar surface:
  • Thermal and Mechanical Constraints: The performance of PEEK-based composites under the combined extreme thermal cycling and radiation exposure on the Moon requires further validation. Current tests only partially replicate lunar conditions, and additional experimentation under representative environments will be crucial.
  • Processing Efficiency: Achieving vacuum processing on a medium to large scale with precise temperature control poses significant engineering challenges, especially given the limited power and mass budget of lunar missions.
  • Material Availability: While regolith is abundant on the Moon surface, ensuring the uniformity of particle size and composition for consistent performance remains a logistical and processing challenge at the time.
To build on the findings of this study, several avenues for future research are here proposed:
  • Environmental Testing: Conduct extended experiments under conditions that more accurately mimic the lunar environment, including prolonged exposure to high vacuum, thermal cycling, and micro-meteoroid impacts. To address these added issues in the real environment, novel solutions could be proposed such as the integration of additional fillers or external coatings to improve radiation resistance, and mechanical toughness.
  • Automation and In Situ Adaptability: Develop autonomous systems for regolith collection, material processing, and construction to align with lunar mission constraints.
  • Multi-functional Applications: Investigate the feasibility of these composites in multi-functional roles, such as structural components that also serve as radiation shielding or thermal insulation.
By addressing these limitations and pursuing these research directions, the potential for PEEK–regolith composites to serve as a cornerstone material for lunar construction can be significantly enhanced.

Author Contributions

Conceptualization, methodology, and software, R.T.; formal analysis, R.T. and L.B.; investigation, R.T., C.G.F. and L.B.; resources, A.C.; data curation, R.T. and L.B.; writing—original draft preparation, R.T. and L.B.; writing—review and editing, R.T., C.G.F., A.C. and L.B.; visualization, R.T.; supervision, A.C.; project administration, R.T.; funding acquisition, A.C. All authors have read and agreed to the published version of the manuscript.

Funding

This research received no external funding.

Data Availability Statement

The raw data supporting the findings of this study are available in the NOMAD repository with the identifier _H2QiBgJQrOwmY-q-N6Cmw. The post-processing script is available on GIT at https://github.com/rbr-to/RegoPEEK_DoE_proc.git (accessed on 6 January 2025).

Conflicts of Interest

The authors declare no conflicts of interest.

Abbreviations

The following abbreviations are used in this manuscript:
PEEKMultidisciplinary Digital Publishing Institute
ISRUIn Situ Resource Utilization
PLAPolylactic Acid
TPIThermoplastic Polyimide
PPSPolyphenylene Sulfide
PTFEPolytetrafluoroethylene
PEIPolyetherimide
TMLTotal Mass Loss
CTECoefficient of Thermal Expansion
TgGlass Transition Temperature
TmMelting Temperature
wt%Weight Percentage
pcCompaction Pressure
DoEDesign of Experiment
σ y Tensile Strength
LTLow Temperature
RTRoom Temperature
HTHigh Temperature

Appendix A

Appendix A.1

This appendix presents the detailed results of the mechanical characterization campaigns conducted on the material. Table A1 summarizes the compression and bending strengths and moduli obtained during the L12 DoE characterization campaign, where all specimens were cured in air under varying process parameters. Table A2 reports the corresponding data for samples cured in vacuum and subsequently conditioned at different temperatures. These results provide a comprehensive overview of the material behavior under varying curing and testing conditions.
Table A1. Summary of the compression and bending strengths and moduli, obtained during the L12 DoE characterization campaign. The process parameters for each Run follow the scheme outlined in Table 3. All specimens were cured in air. The values are reported in MPa; μ represents the mean value, and σ denotes the standard deviation, calculated after excluding potential outliers.
DoE
Run
CompressionBending
StrengthModulusStrengthModulus
μ σ μ σ μ σ μ σ
R011.900.3135.4610.300.620.0766.0211.07
R023.660.1282.7010.271.000.11109.5837.94
R035.130.20135.4211.911.320.17210.0318.51
R046.050.48164.2426.241.720.09245.4215.39
R056.850.34136.5022.203.520.28498.3833.56
R0610.720.35389.8929.804.610.28709.8247.29
R0713.820.26445.0419.026.400.48823.6786.22
R0816.330.31481.9337.737.410.43946.6075.44
R0915.210.32391.8745.7010.610.291323.4565.71
R1020.060.10468.4940.6111.480.331485.3975.24
R1121.920.29537.9269.2713.530.381699.0971.91
R1224.980.73558.0249.9114.890.481877.4596.1
Table A2. Summary of the compression and bending strengths and moduli for samples cured in vacuum and tested after conditioning at different temperatures. Values are reported in MPa, with μ representing the mean and σ denoting the standard deviation, calculated after excluding potential outliers.
Cond.
Temp.
CompressionBending
StrengthModulusStrengthModulus
μ σ μ σ μ σ μ σ
−40 °C19.791.13580.4945.4914.200.352282.8955.73
+20 °C21.701.10738.7023.1812.330.182135.97151.59
+130 °C22.170.63520.6684.9310.540.481859.9586.11

Appendix B

Appendix B.1

Table A3 summarizes the minimum compressive strength requirements for bricks in various Earth-based applications and compares them with the results of the experimental campaign. C indicates compliance with Earth-based standards, while C* denotes compliance with the reduced requirements for lunar applications (scaled to 1/6 of Earth’s values). N indicates non-compliance for both Earth and Moon applications. Table A4 shifts focus to concrete, listing strength requirements based on construction type, with the same notation applied. Table A5 examines flexural strength, comparing the experimental results to typical values for different concrete types. Samples classified as E demonstrate equivalent or superior performance to the reference concrete, E* indicates equivalence or superiority under lunar conditions, and N signifies non-equivalence. In all the tables, the first twelve columns consider the samples of the DoE, cured in air and tested at RT (+20 °C); the last three columns the samples processed in vacuum and tested at HT (+130 °C), RT, and LT (−40 °C). The comparisons highlight promising performance across both Earth and Moon contexts. Most runs with higher organic binder content met the stringent Earth-based requirements. Although increasing regolith content leads to reduced performance, the requirements for lunar applications are met in the majority of cases. Vacuum-processed samples satisfied most Earth-based standards across all testing temperatures and exceeded all criteria for lunar applications.
Table A3. Compressive strength: comparison of experimental values with standard requirements of various bricks. C denotes compliance, C* compliance under lunar conditions (requirements scaled by 1/6), and N non-compliance.
Ref. Min.DoE Run No.Vacuum Proc.
StandardCat.[MPa]010203040506070809101112HTRTLT
IBC [64]-10.3C*C*C*C*C*CCCCCCCCCC
ASTMT/H6.9C*C*C*C*C*CCCCCCCCCC
C410 a [18]M/L13.8NC*C*C*C*C*CCCCCCCCC
ASTM
C62 b [19]
NW10.3C*C*C*C*C*CCCCCCCCCC
MW17.2NC*C*C*C*C*C*C*C*CCCCCC
SW20.7NC*C*C*C*C*C*C*C*C*CCC*CC
ASTMMW17.2NC*C*C*C*C*C*C*C*CCCCCC
C652 c [20]SW20.7NC*C*C*C*C*C*C*C*C*CCC*CC
ASTMMX/NX20.7NC*C*C*C*C*C*C*C*C*CCC*CC
C902 d [63]SX55.2NNNNNC*C*C*C*C*C*C*C*C*C*
a Industrial Floor Brick. b Building Brick. c Hollow Brick. d Pedestrian and Light Traffic Paving Brick.
Table A4. Compressive Strength: comparison of experimental values with standard requirements of various concretes. C denotes compliance, C* compliance under lunar conditions (requirements scaled by 1/6), and N non-compliance.
Exp. Val.DoE Run No.Vacuum Proc.
[MPa]010203040506070809101112HTRTLT
[25](<17) aCCCCCCCCCCCCCCC
(17–24) bNC*C*C*C*C*C*C*C*CCCCCC
(21–28) cNC*C*C*C*C*C*C*C*C*CCC*CC
(21–48) dNC*C*C*C*C*C*C*C*C*CCC*CC
(28–48) eNNC*C*C*C*C*C*C*C*C*C*C*C*C*
(69–109) fNNNNNNC*C*C*C*C*C*C*C*C*
a Concrete fill. b Basement and foundation walls and slabs, walks, patios, steps, and stairs. c Driveways, garage, and industrial floor slabs. d Reinforced concrete beams, slabs, columns, and walls. e Precast and prestressed concrete. f High-rise buildings (columns).
Table A5. Bending strength/modulus of rupture: comparison of experimental values with standard performances of various concretes. E denotes equivalence or superiority, E* equivalence or superiority under lunar conditions (requirements scaled by 1/6), and N non-equivalent.
GradeExp. Value(s)DoE Run No.Vacuum Proc.
[MPa]010203040506070809101112HTRTLT
[65] a20 MPa3.5E*E*E*E*EEEEEEEEEEE
[26] b35 MPa5.2–7.6NE*E*E*E*E*EEEEEEEEE
65 MPa7.2–10NNE*E*E*E*E*EEEEEEEE
85 MPa8.0–11NNNE*E*E*E*E*EEEEEEE
[66]LWplain c4.4NE*E*E*E*EEEEEEEEEE
LWP d4.6–5.3NE*E*E*E*EEEEEEEEEE
LWS e5.2–7.9NE*E*E*E*E*EEEEEEEEE
NWHS f6.9NNE*E*E*E*E*EEEEEEEE
[67] g0.5 %vol8.2NNNE*E*E*E*E*EEEEEEE
1.0 %vol10.1NNNE*E*E*E*E*EEEEEEE
1.5 %vol12.3NNNNE*E*E*E*E*E*EEE*EE
2.0 %vol14.5NNNNE*E*E*E*E*E*E*EE*E*E*
a Standard Concrete. b Steel Fiber-Reinforced Concrete. c Plain Lightweight Concrete. d Steel Fiber-Reinforced Lightweight Concrete. e Polypropylene Fiber-Reinforced Lightweight Concrete. f Normal Weight High-Strength Concrete. g High-Strength Steel Fiber-Reinforced Concrete.

References

  1. Vallerani, E.; Ori, G.G.; Torre, A.; Grasso, M.; Guizzo, G.P.; Vukman, I. ISRU: Perspectives for Lunar Development. In Proceedings of the 57th International Astronautical Congress, Valencia, Spain, 2–6 October 2006; pp. 1–15. [Google Scholar] [CrossRef]
  2. Tilman, S.; Doris, B.; Torrence, V.J. The Encyclopedia of the Solar System; Elsevier: Amsterdam, The Netherlands, 2014. [Google Scholar] [CrossRef]
  3. Anand, M.; Crawford, I.; Balat-Pichelin, M.; Abanades, S.; Westrenen, W.; Péraudeau, G.; Jaumann, R.; Seboldt, W. A brief review of chemical and mineralogical resources on the Moon and likely initial In Situ Resource Utilization (ISRU) applications. Planet. Space Sci. 2012, 74, 42–48. [Google Scholar] [CrossRef]
  4. Cannon, K.M.; Mueller, R.P. Regolith Processing. In Handbook of Space Resources; Badescu, V., Zacny, K., Bar-Cohen, Y., Eds.; Springer International Publishing: Cham, Switzerland, 2023; pp. 399–427. [Google Scholar] [CrossRef]
  5. Torre, R.; Cowley, A.; Ferro, C. Low binder content bricks: A regolith-based solution for sustainable surface construction on the Moon. Discov. Appl. Sci. 2024, 6, 88. [Google Scholar] [CrossRef]
  6. Torre, R.; Cowley, A. Low binder content bricks: State of the art progress towards a sustainable surface construction on the Moon. In Proceedings of the Space Resources Week, Luxembourg, 25–27 March 2024. [Google Scholar]
  7. Ferro, C.G.; Florenzano, D.; Pastore, A.; Pasqualin, L.; Agozzino, M.; Fesa, S.; Tawfik, H.; Almatari, K.; Aimasso, A.; Valvano, S.; et al. Beyond Earth: A multidisciplinary approach to developing sustainable lunar outposts with the MOSS project. In Proceedings of the 75th International Astronautical Congress (IAC), Milan, Italy, 14–18 October 2024. [Google Scholar]
  8. Jakus, A.; Koube, K.; Geisendorfer, N.; Shah, R. Robust and Elastic Lunar and Martian Structures from 3D-Printed Regolith Inks. Sci. Rep. 2017, 7, 44931. [Google Scholar] [CrossRef] [PubMed]
  9. Liu, M.; Weizhe, T.; Duan, W.; Li, S.; Dou, R.; Wang, G.; Liu, B.; Wang, L. Digital light processing of lunar regolith structures with high mechanical properties. Ceram. Int. 2018, 45, 5829–5836. [Google Scholar] [CrossRef]
  10. Chen, T.; Chow, B.; Wang, M.; Shi, Y.; Zhao, C.; Qiao, Y. Inorganic–Organic Hybrid of Lunar Soil Simulant and Polyethylene. J. Mater. Civ. Eng. 2015, 28, 06015013. [Google Scholar] [CrossRef]
  11. Chen, T.; Chow, B.; Wang, M.; Zhong, Y.; Qiao, Y. High-Pressure Densification of Composite Lunar Cement. J. Mater. Civ. Eng. 2017, 29, 06017013. [Google Scholar] [CrossRef]
  12. Chen, T.; Chow, B.; Zhong, Y.; Wang, M.; Kou, R.; Qiao, Y. Formation of Polymer Micro-Agglomerations in Ultralow-Binder-Content Composite based on Lunar Soil Simulant. Adv. Space Res. 2017, 61, 830–836. [Google Scholar] [CrossRef]
  13. Oh, K.; Chen, T.; Kou, R.; Yi, H.; Qiao, Y. Ultralow-Binder-Content Thermoplastic Composites Based on Lunar Soil Simulant. Adv. Space Res. 2020, 66, 2245–2250. [Google Scholar] [CrossRef]
  14. Pichard, P.L.; Cowley, A.; Hand, A.; Schild, T.; Adiaconitei, A.; Katrakova-Kruger, D.; Spanheimer, V.; Ochsner. Regolith-based composite manufacturing by Fused Deposition Modelling (FDM). In Proceedings of the Space Resources Week, Luxembourg, 3–5 May 2022. [Google Scholar]
  15. Zhu, Y.; Romain, C.; Williams, C. Sustainable polymers from renewable resources. Nature 2016, 540, 354–362. [Google Scholar] [CrossRef] [PubMed]
  16. Williams, J.P.; Paige, D.; Greenhagen, B.; Sefton-Nash, E. The global surface temperatures of the Moon as measured by the Diviner Lunar Radiometer Experiment. Icarus Lunar Reconnaiss. Orbiter–Part II 2017, 283, 300–325. [Google Scholar] [CrossRef]
  17. Landis, G.A. Degradation of the lunar vacuum by a moon base. Acta Astronaut. 1990, 21, 183–187. [Google Scholar] [CrossRef]
  18. ASTM C410-13(2017); Standard Specification for Industrial Floor Brick. ASTM International: West Conshohocken, PA, USA, 2017. [CrossRef]
  19. ASTM C62-17; Standard Specification for Building Brick (Solid Masonry Units Made From Clay or Shale). ASTM International: West Conshohocken, PA, USA, 2017. [CrossRef]
  20. ASTM C652-21; Standard Specification for Hollow Brick (Hollow Masonry Units Made From Clay or Shale). ASTM International: West Conshohocken, PA, USA, 2021. [CrossRef]
  21. Benaroya, H.; Bernold, L. Engineering of lunar bases. Acta Astronaut. 2008, 62, 277–299. [Google Scholar] [CrossRef]
  22. Montes, C.; Broussard, K.; Gongre, M.; Simicevic, N.; Mejia, J.; Tham, J.; Allouche, E.; Davis, G. Evaluation of Lunar Regolith Geopolymer Binder as a Radioactive Shielding Material for Space Exploration Applications. Adv. Space Res. 2015, 56, 1212–1221. [Google Scholar] [CrossRef]
  23. Goulas, A.; Binner, J.G.; Engstrøm, D.S.; Harris, R.A.; Friel, R.J. Mechanical behaviour of additively manufactured lunar regolith simulant components. Proc. Inst. Mech. Eng. Part L J. Mater. Des. Appl. 2019, 233, 1629–1644. [Google Scholar] [CrossRef]
  24. Lee, S.; van Riessen, A. A Review on Geopolymer Technology for Lunar Base Construction. Materials 2022, 15, 4516. [Google Scholar] [CrossRef]
  25. Neville, G.B. The Concrete Manual; International Code Council: Falls Church, VA, USA, 2015. [Google Scholar]
  26. Job, T.; Ananth, R. Mechanical Properties of Steel Fiber-Reinforced Concrete. J. Mater. Civ. Eng. 2007, 19, 385–392. [Google Scholar] [CrossRef]
  27. ECSS-Q-ST-70-02C; Space Product Assurance. ECSS Secretariat ESA ESTEC: Noordwijk, The Netherlands, 2008; Chapter Thermal Vacuum Outgassing Test for the Screening of Space Materials.
  28. NASA. Outgassing Data for Selecting Spacecraft Materials; NASA: Washington, DC, USA, 2017.
  29. Rae, P.; Brown, E.; Orler, E. The mechanical properties of poly(ether-ether-ketone) (PEEK) with emphasis on the large compressive strain response. Polymer 2007, 48, 598–615. [Google Scholar] [CrossRef]
  30. Feng, X.; Liu, J. High Performance Polymers and Their Nanocomposites; Scrivener Publishing LLC: Beverly, MA, USA, 2018; Chapter Thermoplastic Polyimide (TPI); pp. 149–219. [Google Scholar] [CrossRef]
  31. Seo, K.; Park, L.; Baek, J.; Brostow, W. Thermal behaviour of poly (phenylene sulfide) and its derivatives. Polymer 1993, 34, 2524–2527. [Google Scholar] [CrossRef]
  32. Calleja, G.; Jourdan, A.; Ameduri, B.; Habas, J.P. Where is the glass transition temperature of poly(tetrafluoroethylene)? A new approach by dynamic rheometry and mechanical tests. Eur. Polym. J. 2013, 49, 2214–2222. [Google Scholar] [CrossRef]
  33. Ding, S.; Zou, B.; Wang, P.; Ding, H. Effects of nozzle temperature and building orientation on mechanical properties and microstructure of PEEK and PEI printed by 3D-FDM. Polym. Test. 2019, 78, 105948. [Google Scholar] [CrossRef]
  34. Reichmanis, E.; Frank, C.W.; O’Donnell, J.H.; Hill, D.J.T. Radiation Effects on Polymeric Materials. In Irradiation of Polymeric Materials; American Chemical Society: Washington, DC, USA, 1993; Chapter 1; pp. 1–8. [Google Scholar] [CrossRef]
  35. Tavlet, M.; van der Burgt, H. Radiation resistance and other safety aspects of high-performance plastics by ERTA. In Proceedings of the Workshop on Advanced Materials for High Precision Detectors, Archamps, France, 28–30 September 1994; pp. 157–167. [Google Scholar] [CrossRef]
  36. Yamaoka, H.; Miyata, K. Radiation effects on organic insulator films at low temperature. J. Nucl. Mater. 1985, 133–134, 788–790. [Google Scholar] [CrossRef]
  37. Sasuga, T.; Hayakawa, N.; Yoshida, K.; Hagiwara, M. Degradation in tensile properties of aromatic polymers by electron beam irradiation. Polymer 1985, 26, 1039–1045. [Google Scholar] [CrossRef]
  38. Mitsui Chemicals Inc. Radiation Resistance of AURUM - Technical Literature F-07; Mitsui Chemicals Inc.: Tokyo, Japan, 2018. [Google Scholar]
  39. Oshima, A.; Ikeda, S.; Seguchi, T.; Tabata, Y. Improvement of radiation resistance for polytetrafluoroethylene (PTFE) by radiation crosslinking. Radiat. Phys. Chem. 1997, 49, 279–284. [Google Scholar] [CrossRef]
  40. ESA. ESMAT (ESTEC Materials); ESA: Noordwijk, The Netherlands, 2017. [Google Scholar]
  41. Mohammadian-Kohol, M.; Asgari, M.; Shakur, H. Effect of gamma irradiation on the structural, mechanical and optical properties of polytetrafluoroethylene sheet. Radiat. Phys. Chem. 2018, 145, 11–18. [Google Scholar] [CrossRef]
  42. Tegginamath, A.; Petru, M. A Review: Thermoplastic Composites in Aerospace Applications. In Proceedings of the 62nd International Conference of Machine Design Departments (ICMD 2022), Harrachov, Czech Republic, 13–15 September 2022; Atlantis Press: Dordrecht, The Netherlands, 2024; pp. 329–336. [Google Scholar] [CrossRef]
  43. Indu Shekar, R.; Kotresh, T.M.; Damodhara Rao, P.M.; Kumar, K. Properties of high modulus PEEK yarns for aerospace applications. J. Appl. Polym. Sci. 2009, 112, 2497–2510. [Google Scholar] [CrossRef]
  44. Mohammed, M.H.; Banks, W.M.; Hayward, D.; Liggat, J.J.; Pethrick, R.A.; Thomson, B. Physical properties of poly(ether ether ketone) exposed to simulated severe oilfield service conditions. Polym. Degrad. Stab. 2013, 98, 1264–1270. [Google Scholar] [CrossRef]
  45. Bieglo GmbH. Product Data—Dexnyl PEEK, Technical Data Sheet; Bieglo GmbH: Hamburg, Germany, 2021. [Google Scholar]
  46. VICTREX. Product Data–VICTREX CT 100, Technical Data Sheet; VICTREX: Middlesbrough, UK, 2023. [Google Scholar]
  47. Mitsui Chemicals Inc. AURUM PL450C Thermoplastic Polyimide, Technical Data Sheet N. 961002; Mitsui Chemicals Inc.: Tokyo, Japan, 2018. [Google Scholar]
  48. Mitsui Chemicals Inc. Low-Temperature Properties of AURUM—Technical Literature F-10; Mitsui Chemicals Inc.: Tokyo, Japan, 2018. [Google Scholar]
  49. Mitsui Chemicals Inc. Outgassing from AURUM—Technical Literature I-02; Mitsui Chemicals Inc.: Tokyo, Japan, 2018. [Google Scholar]
  50. Kantor, L.; Michalik, K.; Laska, J. Engineering polymers with high mechanical and thermal resistance for electric motors. Sci. Technol. Innov. 2017, 1, 39–43. [Google Scholar] [CrossRef]
  51. The Chemours Company. Product Data—Teflon FEP, Technical Data Sheet C-10597; The Chemours Company: Wilmington, DE, USA, 2017. [Google Scholar]
  52. Kirby, R.K. Thermal Expansion of Polytetrafluo roethylene (Teflon) From −190° to +300 °C. J. Res. Natl. Bur. Stand. 1956, 57, 91. [Google Scholar] [CrossRef]
  53. Reed, R.; Schramm, R.; Clark, A. Mechanical, thermal, and electrical properties of selected polymers. Cryogenics 1973, 13, 67–82. [Google Scholar] [CrossRef]
  54. Sabic. Product Data—ULTEM 9085, Technical Data Sheet; Sabic: Riyadh, Saudi Arabia, 2024. [Google Scholar]
  55. Cruz, P.; Shoemake, E.D.; Adam, P.; Leachman, J. Tensile strengths of polyamide based 3D printed polymers in liquid nitrogen. IOP Conf. Ser. Mater. Sci. Eng. 2015, 102, 012020. [Google Scholar] [CrossRef]
  56. Volkov, Y.; Vorob’ev, E.; Drozdov, A.E.A. Effect of a Temperature on the Mechanical Characteristics of ULTEM 9085 Thermoplastic Produced by Additive Technology. Strength Mater. 2020, 52, 414–418. [Google Scholar] [CrossRef]
  57. Ching, Y.C.; Gunathilake, T.U.; Ching, K.Y.; Chuah, C.H.; Sandu, V.; Singh, R.; Liou, N.S. 18—Effects of high temperature and ultraviolet radiation on polymer composites. In Durability and Life Prediction in Biocomposites, Fibre-Reinforced Composites and Hybrid Composites; Jawaid, M., Thariq, M., Saba, N., Eds.; Woodhead Publishing: Sawston, UK, 2019; pp. 407–426. [Google Scholar] [CrossRef]
  58. Bragaglia, M.; Cherubini, V.; Nanni, F. PEEK—TiO2 composites with enhanced UV resistance. Compos. Sci. Technol. 2020, 199, 108365. [Google Scholar] [CrossRef]
  59. Duncan, A.R.; Erlank, A.J.; Sher, M.K.; Abraham, Y.C.; Willis, J.P.; Ahrens, L.H. Some trace element constraints on lunar basalt genesis. In Proceedings of the Lunar and Planetary Science Conference Proceedings, Houston, TX, USA, 15–19 March 1976; pp. 1659–1671. [Google Scholar]
  60. Engelschiøn, V.; Eriksson, S.; Cowley, A.; Fateri, M.; Meurisse, A.; Kueppers, U.; Sperl, M. EAC-1A: A novel large-volume lunar regolith simulant. Sci. Rep. 2020, 10, 5473. [Google Scholar] [CrossRef]
  61. ASTM D790-17; Standard Test Methods for Flexural Properties of Unreinforced and Reinforced Plastics and Electrical Insulating Materials. ASTM International: West Conshohocken, PA, USA, 2017. [CrossRef]
  62. ASTM D695-15; Standard Test Method for Compressive Properties of Rigid Plastics. ASTM International: West Conshohocken, PA, USA, 2015. [CrossRef]
  63. ASTM C902-20; Standard Specification for Pedestrian and Light Traffic Paving Brick. ASTM International: West Conshohocken, PA, USA, 2020. [CrossRef]
  64. International Building Code; International Code Council: Falls Church, VA, USA, 2020.
  65. Kumar, M. Strength characteristics of self-curing concrete. Int. J. Res. Eng. Technol. 2012, 1, 51–57. [Google Scholar] [CrossRef]
  66. Kayali, O.; Haque, M.; Zhu, B. Some characteristics of high strength fiber reinforced lightweight aggregate concrete. Cem. Concr. Compos. 2003, 25, 207–213. [Google Scholar] [CrossRef]
  67. Song, P.; Hwang, S. Mechanical properties of high-strength steel fiber-reinforced concrete. Constr. Build. Mater. 2004, 18, 669–673. [Google Scholar] [CrossRef]
Figure 1. Proof-of-concept designs for interlocking elements made from regolith-rich composite material, demonstrating the feasibility of constructing modular, mortar-free structures using minimal thermoplastic binders.
Applsci 15 00679 g001
Figure 2. Manufacturing steps for PEEK- and PLA-based samples: The blue boxes indicate the process parameters specific to PLA, highlighting where they differ from those used for PEEK.
Applsci 15 00679 g002
Figure 3. Example of reference bending and compression specimens used throughout the experimental campaign. The geometries shown are representative of all specimens, which were ideally identical and used for both air-cured and vacuum-cured samples.
Applsci 15 00679 g003
Figure 4. Experimental results: bending strength and modulus per DoE run.
Applsci 15 00679 g004
Figure 5. Experimental results: compression strength and modulus per DoE run.
Applsci 15 00679 g005
Figure 6. Bending strength and modulus: main effects plots for means.
Applsci 15 00679 g006
Figure 7. Compression strength and modulus: main effects plots for means.
Applsci 15 00679 g007
Figure 8. Summary of experimental results for the vacuum-processed samples: bending strength/modulus at different conditioning temperatures.
Applsci 15 00679 g008
Figure 9. Summary of experimental results for the vacuum-processed samples: compression strength/modulus at different conditioning temperatures.
Applsci 15 00679 g009
Figure 10. Bending strength: Comparison of the requirements for three grades of steel fiber-reinforced concrete [26] against experimental data. The black dots show the bending strengths of DoE samples (cured in air, tested at +20 °C); the additional points associated with run 8 (same compaction pressure and binder percentage) represent samples cured in vacuum and tested at various temperatures.
Applsci 15 00679 g010
Figure 11. Compression strength: comparison of the requirements for different brick applications [18,19,20,63] against experimental data. The black dots show the bending strengths of DoE samples (cured in air, tested at +20 °C); the additional points associated with run 8 (same compaction pressure and binder percentage) represent samples cured in vacuum and tested at various temperatures.
Applsci 15 00679 g011
Table 1. Comparison of advanced thermoplastics for space applications.
TmTgCTE b σ y TMLRefs.
°C°C1/°CLT cRTHT d@10GMy
PEEK DEXNYL34314346 × 10 6 2009035stable0.14[28,36,45,46]
TPI PL450C38825055 × 10 6 1899258stable0.58[47,48,49]
PPS2808552 × 10 6 260933.5stable0.05[28,31,36,50]
PTFE TEFLON260a124 × 10 6 140212lowers0.01[28,51,52,53]
PEI ULTEM34021765 × 10 6 1018617stable0.40[28,54,55,56]
a The exact glass transition temperature is debated [32]. b Measured at room temperature. c Measured at −196 °C. d Measured at 150 °C.
Table 2. Process parameters and levels.
Compaction
Pressure
Organic
Phase wt%
Grain Size
Distribution
Curing
Temp.
CuringCooling
Mode
LevelP.1P.2P.3P.4P.5P.6
1 0.50 MPa5%<500 μm400 °C3 h
air/vacuum
in air
2 2.50 MPa10%
3 5.00 MPa15%
4 7.50 MPa
Table 3. Processing parameters for the L12 DoE characterization campaign. The table lists the levels of each factor varied during the experimental design. The combinations follow the orthogonal array structure of an L12 design, ensuring a systematic exploration of the parameter space.
DoE Run No.010203040506070809101112
Organic phasewt%5%5%5%5%10%10%10%10%15%15%15%15%
Comp. press.MPa0.502.505.007.500.502.505.007.500.502.505.007.50
Disclaimer/Publisher’s Note: The statements, opinions and data contained in all publications are solely those of the individual author(s) and contributor(s) and not of MDPI and/or the editor(s). MDPI and/or the editor(s) disclaim responsibility for any injury to people or property resulting from any ideas, methods, instructions or products referred to in the content.