Article

Comparative Study of Phytolacca Species Through Morphological, Chloroplast Genome, and Phylogenetic Analysis

1
Department of Biology and Chemistry, Changwon National University, Changwon 51140, Republic of Korea
2
Department of Biology, Chungbuk National University, Cheongju 28644, Republic of Korea
*
Authors to whom correspondence should be addressed.
Appl. Sci. 2025, 15(2), 593; https://doi.org/10.3390/app15020593
Submission received: 29 November 2024 / Revised: 27 December 2024 / Accepted: 8 January 2025 / Published: 9 January 2025

Abstract

:
Phytolacca acinosa Roxb. and P. americana L. are recognized as the primary sources of Phytolaccae Radix, which is traditionally utilized for various medicinal purposes. However, because of their potent toxicity, it is essential to distinguish these species. This study has aimed to clarify the classification of Phytolacca species based on their morphology and genetic differences. The chloroplast genome of P. acinosa was sequenced and comparative analyses were conducted to identify the regions of variation and nucleotide diversity among the species. The results revealed that P. acinosa shares more sequence similarity with other Phytolacca species than with P. americana. Additionally, the dN/dS analysis showed that the ndhH gene of P. americana had a value of 1.0871, indicating positive selection. The phylogenetic tree, supported by strong bootstrap values and posterior probabilities, confirmed that P. acinosa and P. americana formed distinct clusters. Furthermore, the estimated divergence time between P. acinosa and P. americana was approximately 15.07 million years ago, indicating that they diverged earlier than P. insularis, P. polyandra, P. japonica, and P. latbenia. These findings indicated that P. acinosa and P. americana are phylogenetically distinct species, highlighting the need for accurate species identification and taxonomic reassessment to ensure the safe use of these toxic medicinal plants.

1. Introduction

The genus Phytolacca L., belonging to the family Phytolaccaceae, is a perennial herbaceous plant widely distributed globally, from temperate to tropical regions, with origins in Central and South America, North America, Asia, and Africa [1]. Commonly known as forkweeds, they comprise approximately 20–35 species of herbs, shrubs, and trees. In Korea, three species endemic to this genus have been reported: P. acinosa Roxb., P. americana L., and P. insularis Nakai [2,3]. In particular, P. acinosa (syn., P. esculenta Van Houtte), or Indian pokeweed, is an herbaceous herb mainly found in Asia, reaching up to 1.5 m in height [4]. It has erected and sturdy inflorescences that are densely arranged in color from white to pink flowers, and its infructescences are also erect. However, P. americana has lax, slender inflorescences with loosely arranged small flowers, and their infructescences are nodding and pendant [2,4].
The roots of both P. acinosa and P. americana are thick, conical, and fleshy, and they have been used as medicinal herbs for centuries in China, Korea, and Japan for their pharmacological properties. The Korean Herbal Pharmacopoeia has designated both P. acinosa and P. americana as Phytolaccae Radix, despite their morphological differences [5]. These plants have been used for various medicinal purposes, including their anti-inflammatory [6], antitumor [7], anti-ascitic [8], antioxidant [9], and antiproliferative activities [10]. They are also abundant in saponins [11], triterpenoid saponins [12], flavones [13], polysaccharides [14], and phenolic acids [15]. Despite their valuable pharmacological and chemical properties, P. acinosa and P. americana both synthesize toxic metabolites, which can cause severe side effects if misused [16,17]. There have been documented cases of poisoning caused by consumption of these plants, as they were mistaken for ginseng [18]. Therefore, careful consideration is required when using these plants for medicinal purposes. Accurate identification of Phytolaccae Radix is essential not only to ensure safe use of these species, but also to prevent harmful effects from misidentifying these plants or confusing them with other raw materials. Distinguishing between P. acinosa and P. americana is critical for avoiding such risks.
The chloroplast (cp) genome, a small circular DNA molecule found within the cp of plant cells, plays critical roles in photosynthesis and various essential metabolic pathways [19]. In most angiosperms, the cp genome typically ranges in size from 120 to 160 kilobases (kb) and consists of a conserved quadripartite structure, including a large single-copy (LSC) region, a small single-copy (SSC) region, and two inverted repeat (IR) regions [20,21]. The conserved structure of the cp genome is a result of maternal inheritance [22,23,24], along with its low recombination rate and slower evolutionary changes relative to the nuclear genome, making it ideal for evolutionary and phylogenetic studies [25,26,27]. These features contribute to the stable preservation of genetic traits over evolutionary periods, making cpDNA an important tool for constructing phylogenetic trees and also estimating divergence times among species [28,29]. In particular, phylogenetic analyses using the cp genome calibrated with fossil records or known geological events through molecular clock models have been shown to be valuable for estimating the divergence times of specific lineages [30,31]. Such studies not only reveal the timing of speciation events, but also provide deeper insights into how taxa have diversified over millions of years. For example, previous studies have explored both broad and specific evolutionary events. Some past studies have focused on the divergence of major angiosperm groups [32], providing a large-scale view of flowering plant evolution, whereas others have investigated the timing and evolutionary relationships within particular families, such as Rubiaceae [33]. Additionally, species-level studies, such as those examining divergence times within Lagerstroemia and the diversification of Agave, offer more detailed insights into the evolutionary processes occurring within specific plant groups [34,35]. These studies demonstrated that cpDNA is effective in explaining both large-scale and species-level diversification, thereby enhancing our understanding of plant evolution and diversification.
The structural stability and evolutionary significance of the cp genome extend to the analysis of selective pressures acting on its genes [36]. The dN/dS ratio, which compares the rate of non-synonymous (dN) to synonymous (dS) substitutions, is commonly used to assess selective pressure [37,38,39,40]. The dN/dS ratio can be used to identify genes under selective pressure at specific divergence points within a phylogenetic tree. By analyzing the dN/dS ratios of cp genes along particular branches of the tree, researchers can elucidate the direction and intensity of selection experienced by these genes during divergence events. A dN/dS ratio below 1 indicates purifying selection, in which deleterious mutations are removed to maintain gene function, which is a characteristic of evolutionary conservation [41,42]. A dN/dS ratio close to 1 indicates neutral evolution, in which mutations neither benefit nor harm the organism. In contrast, a ratio above 1 suggests positive selection, indicating that beneficial mutations drive adaptive changes.
In this study, we have described the original plant species morphology of Phytolaccae Radix in detail, analyzed the cp genome of P. acinosa, and performed a comprehensive comparative analysis of Phytolacca species. Using Maximum Likelihood (ML) and Bayesian Inference (BI) methods, we constructed phylogenetic trees to elucidate evolutionary relationships within the genus. Additionally, we calculated dN/dS to evaluate the selective pressures on cp genes and estimated divergence times to trace species diversification. These phylogenetic and evolutionary insights are crucial for the safe use of P. acinosa and P. americana as Phytolaccae Radix, ensuring accurate species identification and reducing toxicity risks in medicinal applications. This genomic approach highlights the importance of precise species delimitation to enhance the efficacy and safety of herbal treatments derived from these plants.

2. Results

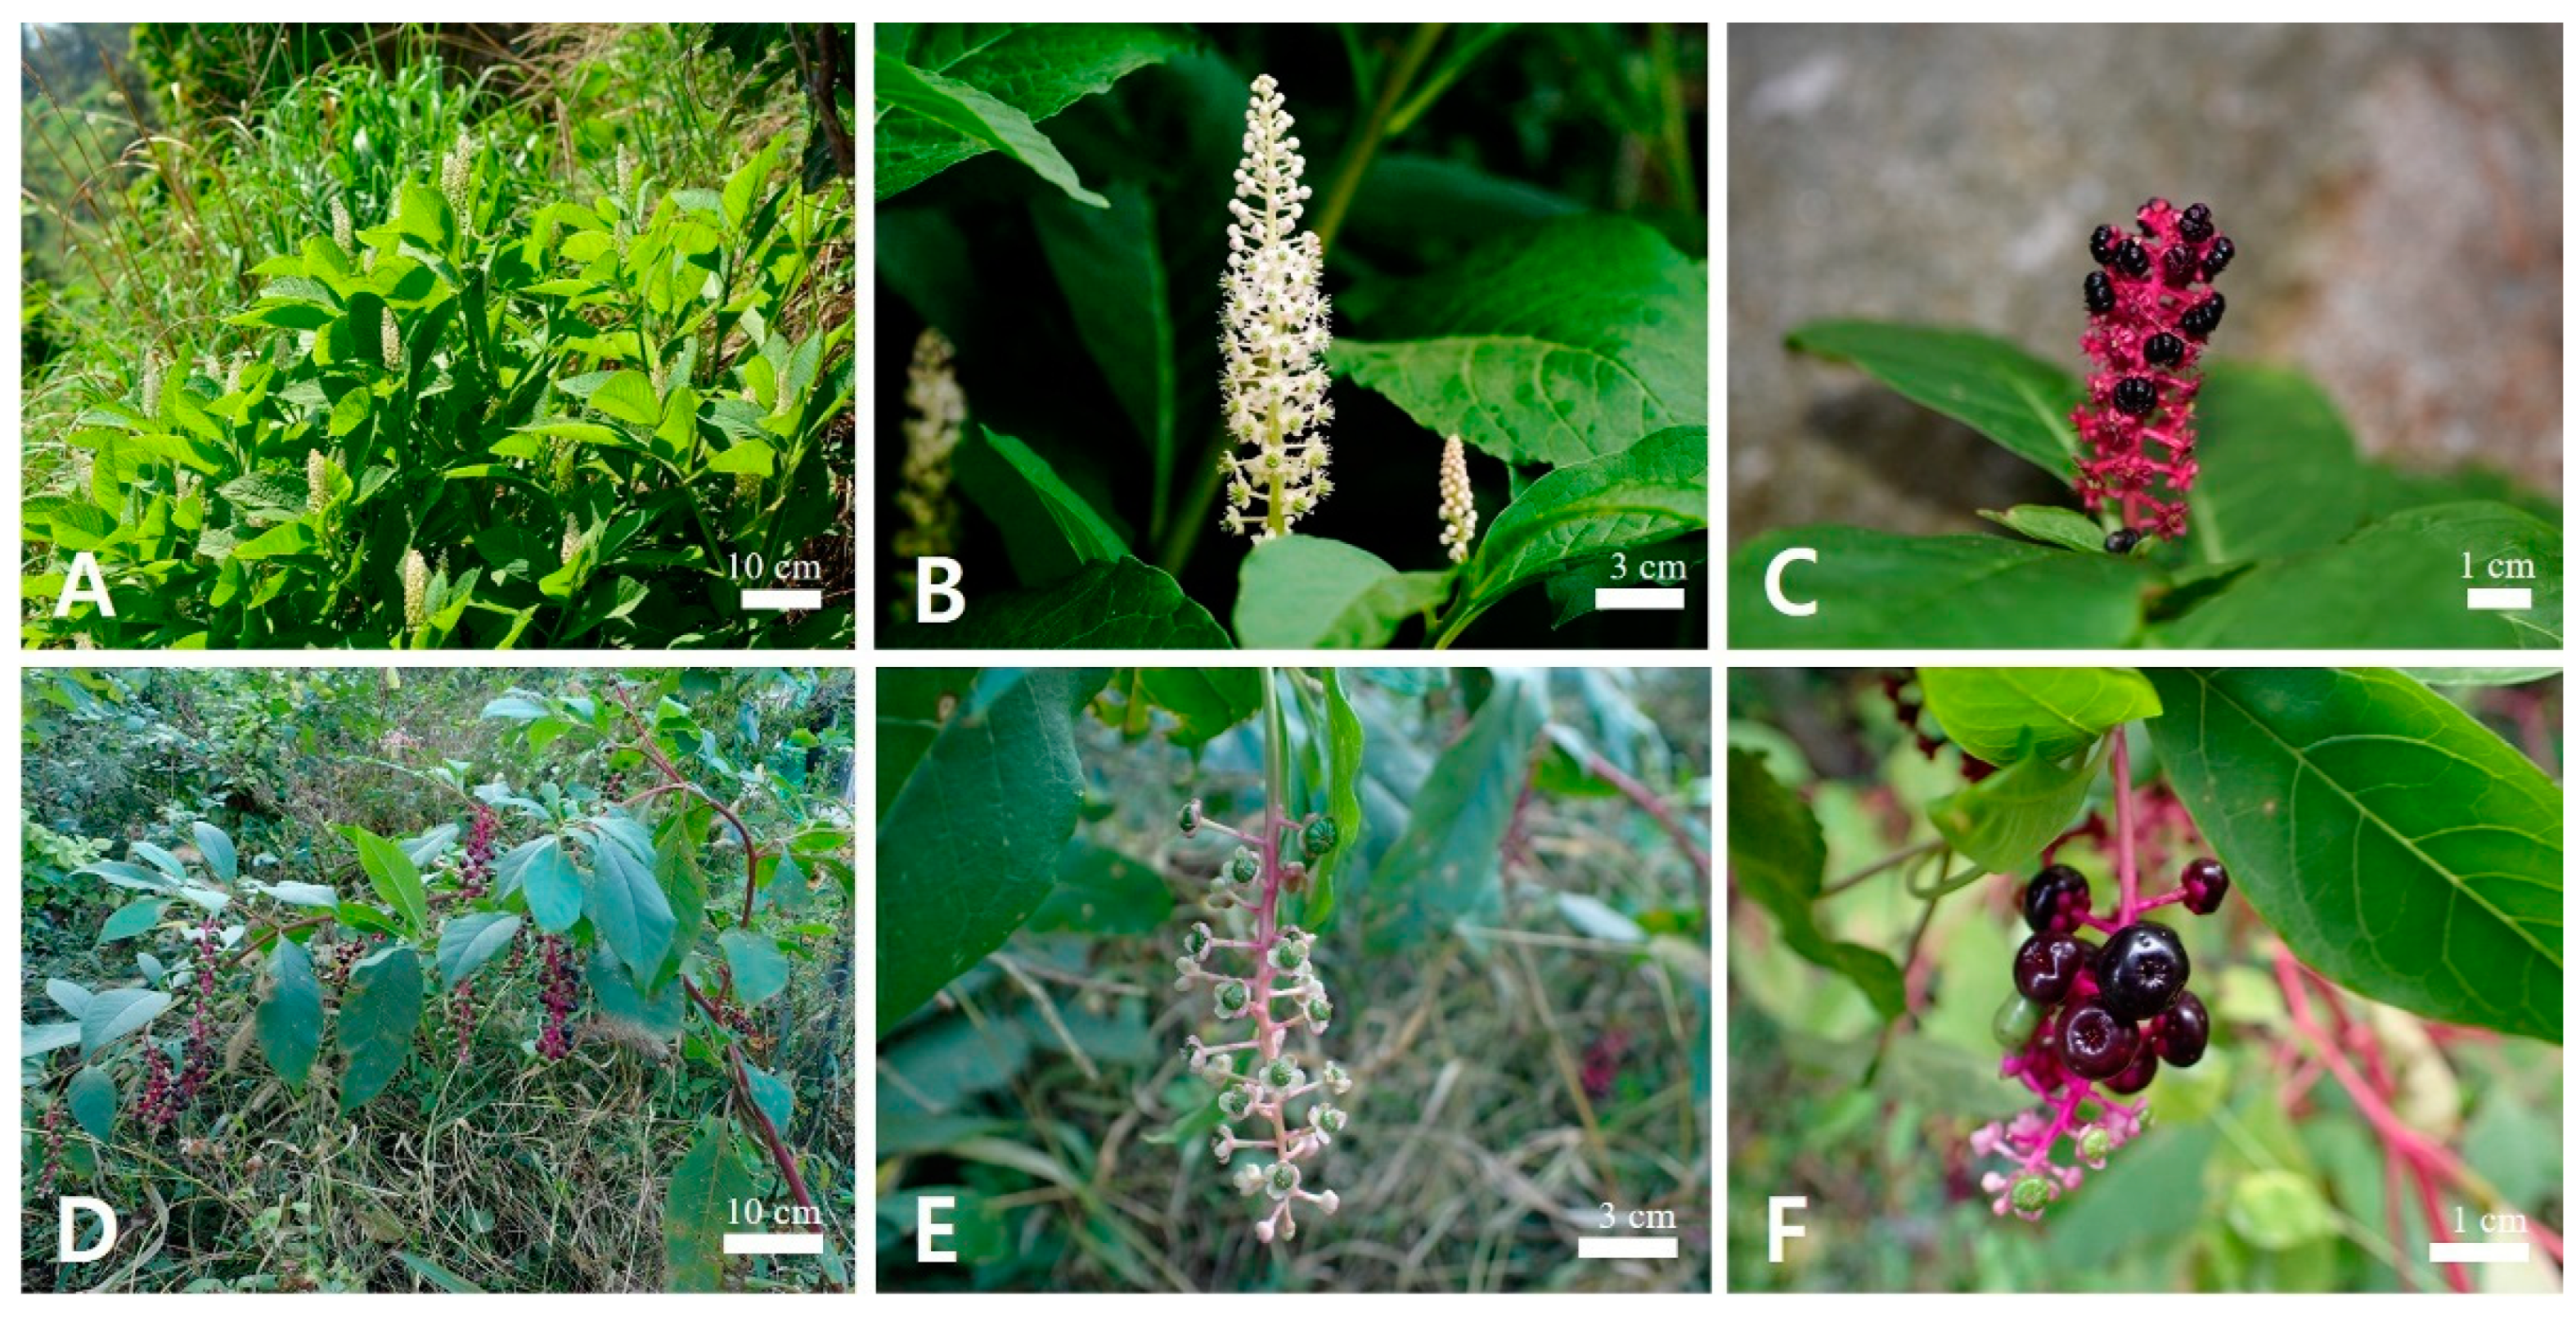
2.1. Comparative Morphology of Korean Phytolacca Species

The two species can be distinguished based on their inflorescence and carpel type (Figure 1). The inflorescence, a raceme of P. acinosa is erect (Figure 1A), its flowers are densely arranged along the axis (Figure 1B), and the carpels are 8–10 and apocarpous (Figure 1C). However, the inflorescence of P. americana is pendulous (Figure 1D), and its flowers are loosely arranged along the axis (Figure 1E). Moreover, their carpels are 10 and syncarpous (Figure 1F).

2.2. Chloroplast Genome Organization of Phytolacca Species

The sequencing of P. acinosa generated 208,993,788 input reads, which were subsequently trimmed to 204,511,620 reads after quality filtering (Table S1). The total number of raw bases was 31.56 Gb, which was reduced to 29.97 Gb after trimming. A total of 913,560 reads were aligned with the reference cp genome, resulting in an average coverage depth of 878× (Table S2). The final assembled cp genome was 156,433 bp in length. Sequencing was performed on a NovaSeq 6000 platform to ensure high-quality and comprehensive data for downstream genomic analyses (Table S3). A genome coverage map illustrating the depth of sequencing across the cp genome is shown in Figure S1. The cp genome of P. acinosa exhibited a circular structure consisting of four distinct regions (Figure 2): an LSC region of 86,120 bp, an SSC region of 18,335 bp, and two identical IR regions, each measuring 25,989 bp. The genome contains 113 unique genes, 79 of which are protein-coding genes, 30 are tRNA genes, and 4 are rRNA genes (Table 1). Among them, 17 genes included introns; 4 of them (ndhB, rps12, trnA-UGC, trnL-GAU) were located in the IR region, and the copies overlapped (Table S4). Additionally, 14 genes contained a single intron, whereas pafI and clpP1 contained two introns (Table S5). The overall GC content of the cp genome was 36.8%, and the GC content of each region was calculated as follows: 34.6% in the LSC region, 42.6% in the IR region, and 30.3% in the SSC region, with the IR region exhibiting the highest GC content, and the SSC region the lowest.

2.3. Codon Usage Bias and Repeat Sequence Distribution

A total of 26,803 codons were identified in P. acinosa. Analysis of relative synonymous codon usage (RSCU) revealed that arginine, leucine, and serine exhibited the highest RSCU values among the 20 amino acids and stop codons, indicating the preferential usage of specific codons for these amino acids (Figure S2). Comparative analysis of codon usage patterns in six species—P. acinosa, P. insularis, P. polyandra, P. japonica, P. latbenia, and P. americana—showed that codon usage bias was generally conserved across these species, suggesting similar selective pressures on codon selection. As illustrated in Figure S3, codons with strong bias (RSCU > 1) are represented in green, indicating a higher-than-expected frequency, whereas those with weaker bias (RSCU < 1) are shown in red, representing a lower-than-expected frequency.
In Phytolacca cp genomes, the number and characteristics of simple sequence repeats (SSRs) and tandem repeats as well as their distribution patterns across the genome were investigated (Figure 3). Most SSRs were identified in the LSC region, followed by the SSC region, and the fewest SSRs were found in the IR region. The number of SSRs in P. acinosa, P. insularis, P. polyandra, P. japonica, and P. latbenia showed similar patterns; however, P. americana had 11–15 fewer SSRs than the other five Phytolacca species. Additionally, the majority of SSRs were detected in the intergenic spacer (IGS) region, with more SSRs found in the introns of P. acinosa, P. insularis, and P. polyandra, whereas P. latbenia exhibited a higher number of exons. In contrast, P. japonica and P. americana exhibited an equal distribution of SSRs between exons and introns. Mononucleotide repeats were the most abundant SSR type, followed by tetranucleotide repeats, and dinucleotide repeats were the third most common. The highest frequency of tandem repeats was observed in the IGS region of LSC, whereas the SSC region contained the fewest tandem repeats. In the six Phytolacca species, over half of the tandem repeats were 20–40 bp long, with the 61–81 bp range being the least frequent. The numbers of forward and palindromic repeats in P. acinosa, P. insularis, and P. polyandra were 21 and 29, respectively. Similarly, in P. japonica and P. latbenia, the number of forward and palindromic repeats was found to be 20 and 30, respectively. However, P. americana displayed a distinct pattern, with 17 forward repeats, 32 palindromic repeats, and 1 reverse repeat.

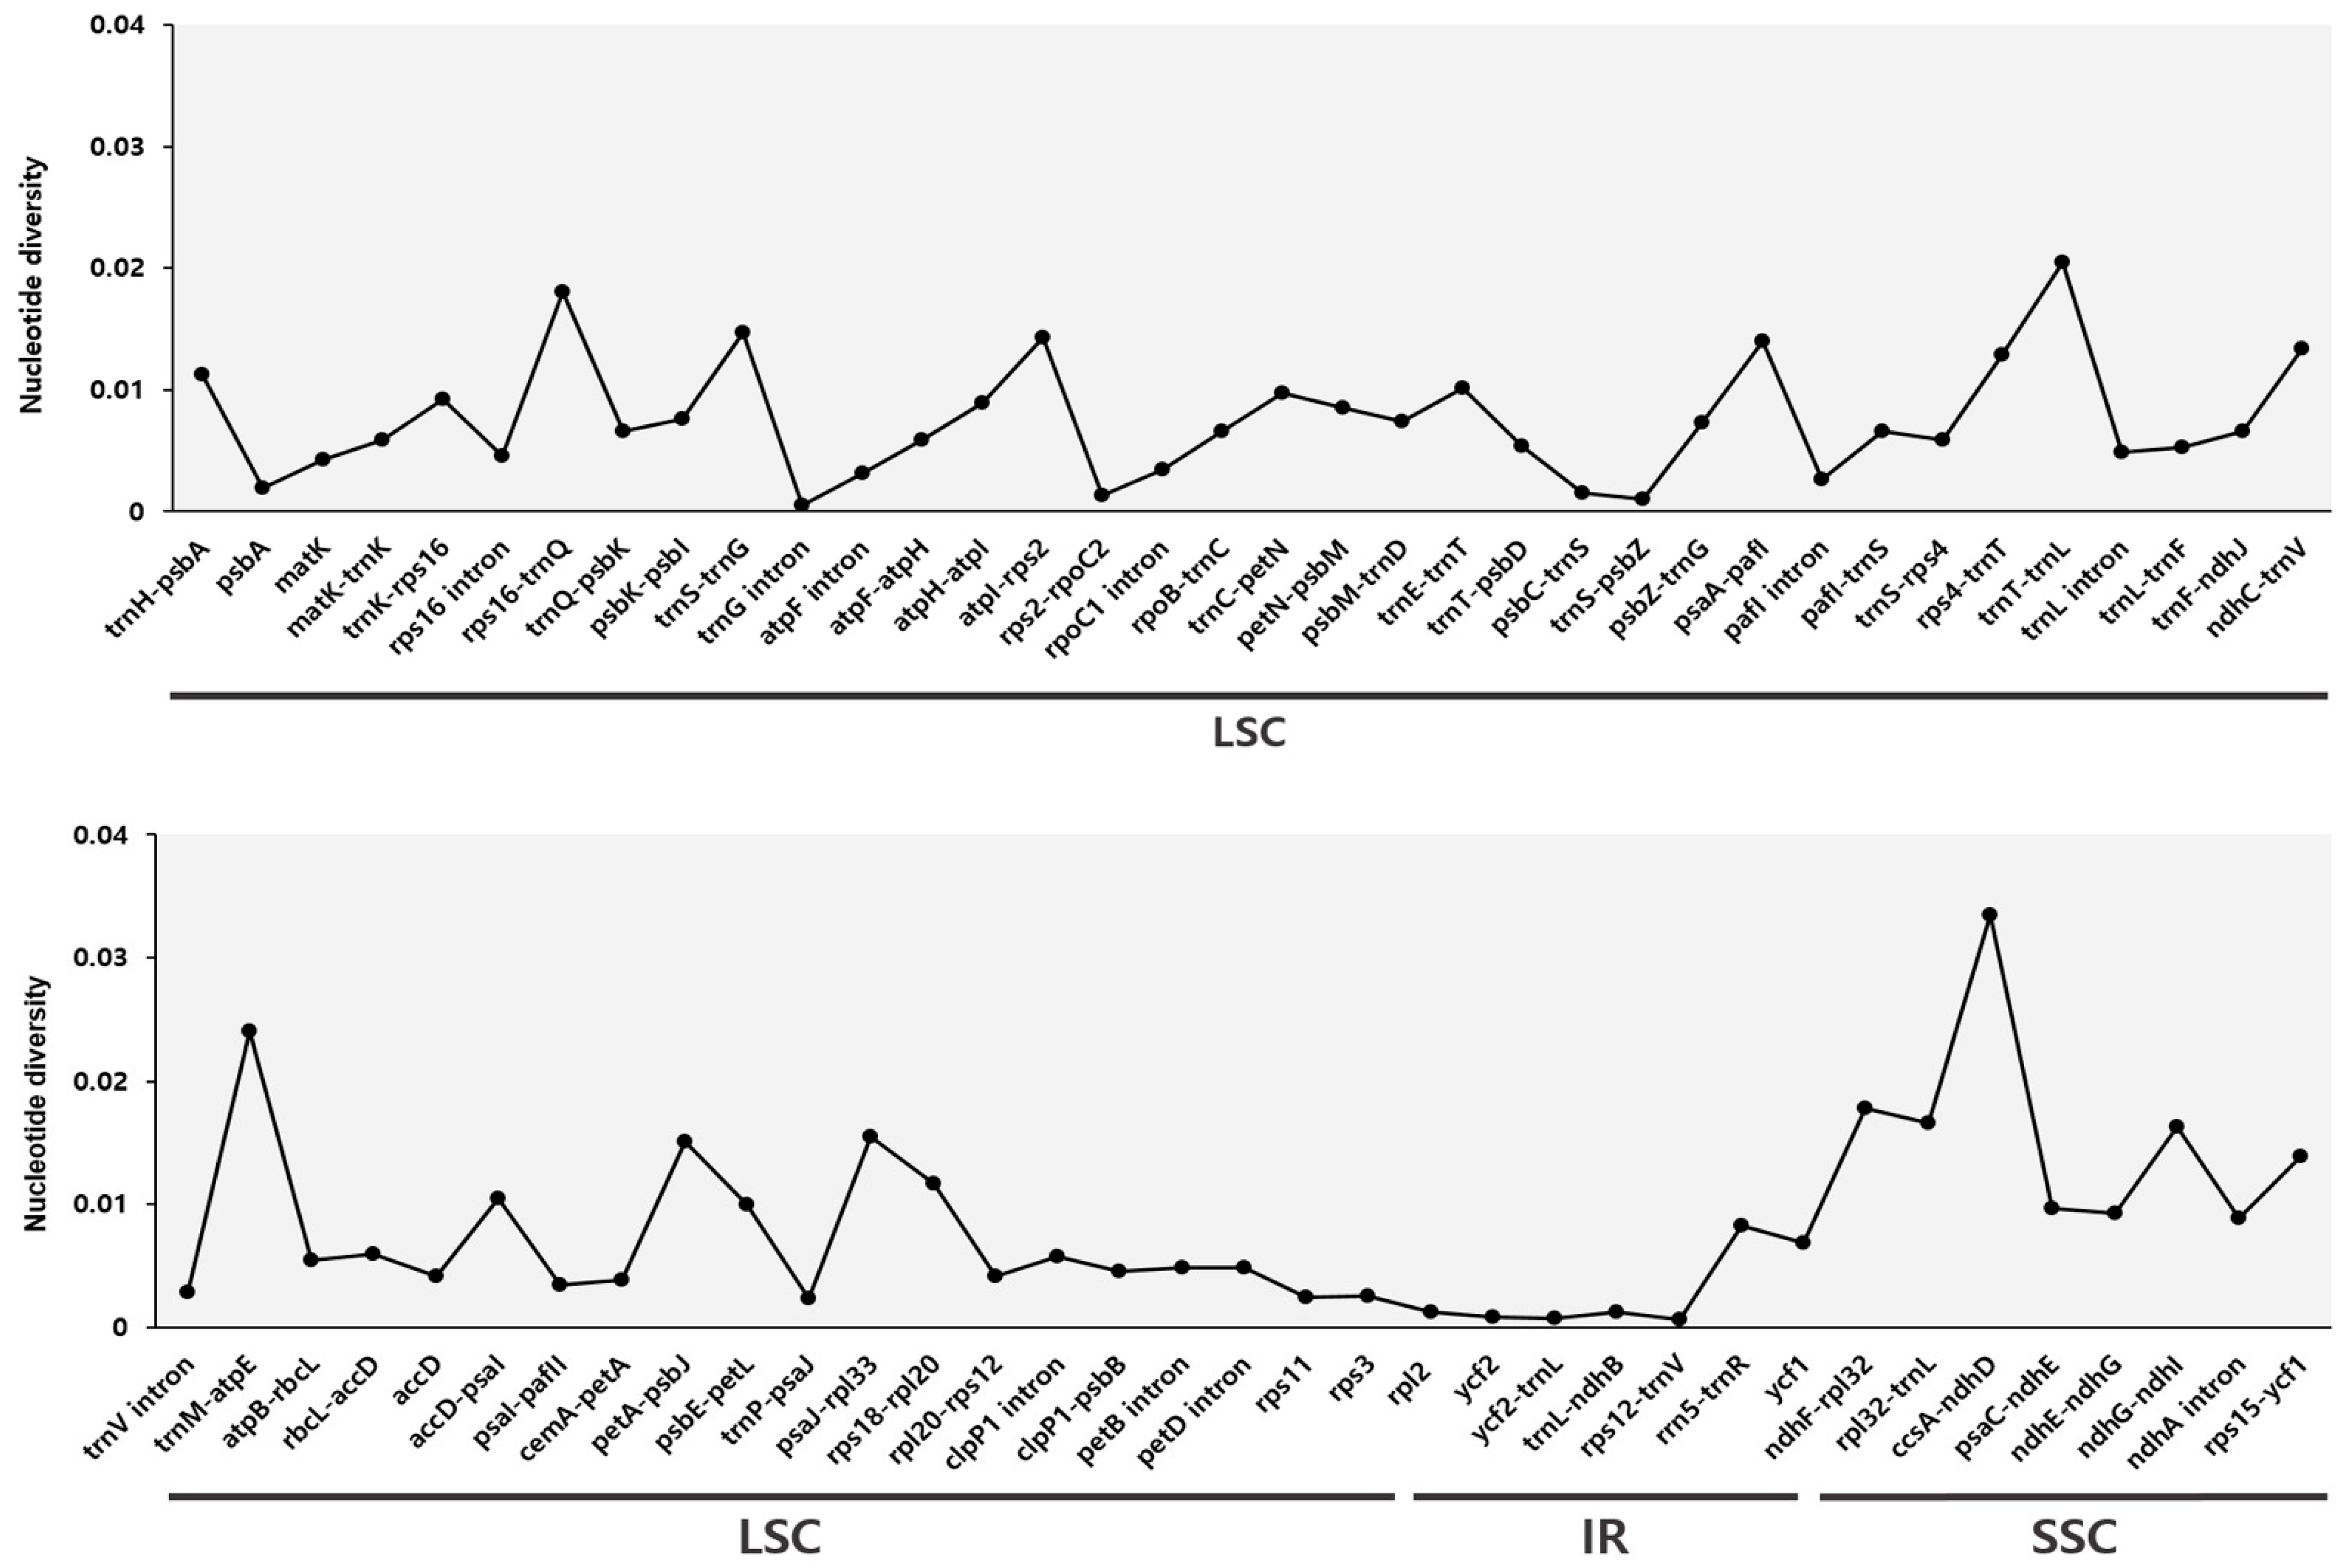
2.4. Comprehensive Comparative Analysis of Phytolacca Chloroplast Genomes

Comparative analysis of IR expansion and contraction in the six Phytolacca species, using Adgestis clematidea as a reference, revealed that five species (P. acinosa, P. insularis, P. polyandra, P. japonica, and P. latbenia) exhibited an IR expansion of approximately 210–218 bp, whereas P. americana showed a contraction of 150 bp (Figure S4). The rps19 gene, located at the LSC/IRb boundary, extended into the IRb region by 179 bp in five Phytolacca species, with the exception of P. latbenia. The ndhF gene, located at the IRb/SSC boundary, was uniformly included (1 bp) in the IRb region across all Phytolacca species. The ycf1 gene, located at the SSC/IRa boundary, is approximately 3874 bp in the SSC region for all Phytolacca species, except for P. americana, where it differs slightly at 3910 bp. The trnH gene, located at the LSC/IRa boundary, is 2–3 bp away from the IRa in most species; however, in P. americana, it is 28 bp away. Compared to the cp genome of A. clematidea, IR contraction was observed in P. americana, whereas IR expansion was observed in the other five Phytolacca species. However, the gene order and position within Phytolacca species were similar.
The sequences of the six Phytolacca species were compared using mVISTA, with P. acinosa as the reference, to visualize sequence similarities and differences (Figure 4). As a result of the comparison, most of the variations were found in the IGS regions, except for the ycf1 gene of P. americana. Among the six sequences, P. insularis showed the highest similarity with P. acinosa, whereas P. americana exhibited the greatest variation. P. americana-specific variations have been identified in several genes and IGS regions, including rps16-trnQ-UUC, trnS-GCU-trnG-UCC, pafI-trnS-GGA, pafII-cemA, psaJ-rpl33, and ycf1.
Additionally, to assess genetic variation, we calculated the nucleotide diversity (Pi) values for the genes and IGS regions of the cp sequences from the six Phytolacca species (Figure 5). Among the six Phytolacca species, the regions with the highest Pi values were ccsA-ndhD (0.0335), trnM-atpE (0.02405), trnT-trnL (0.02051), rps16-trnQ (0.01805), ndhF-rpl32 (0.01783), and rpl32-trnL (0.01655). When excluding regions with a Pi value of 0, the lowest Pi value was 0.00047, which was observed in the trnG intron. These results indicate that the cp genome sequences contained various regions of variation among the six species, with several hotspot regions of high Pi values, particularly in the LSC and SSC regions. This variation highlights the areas of increased Pi within the Phytolacca cp genomes.

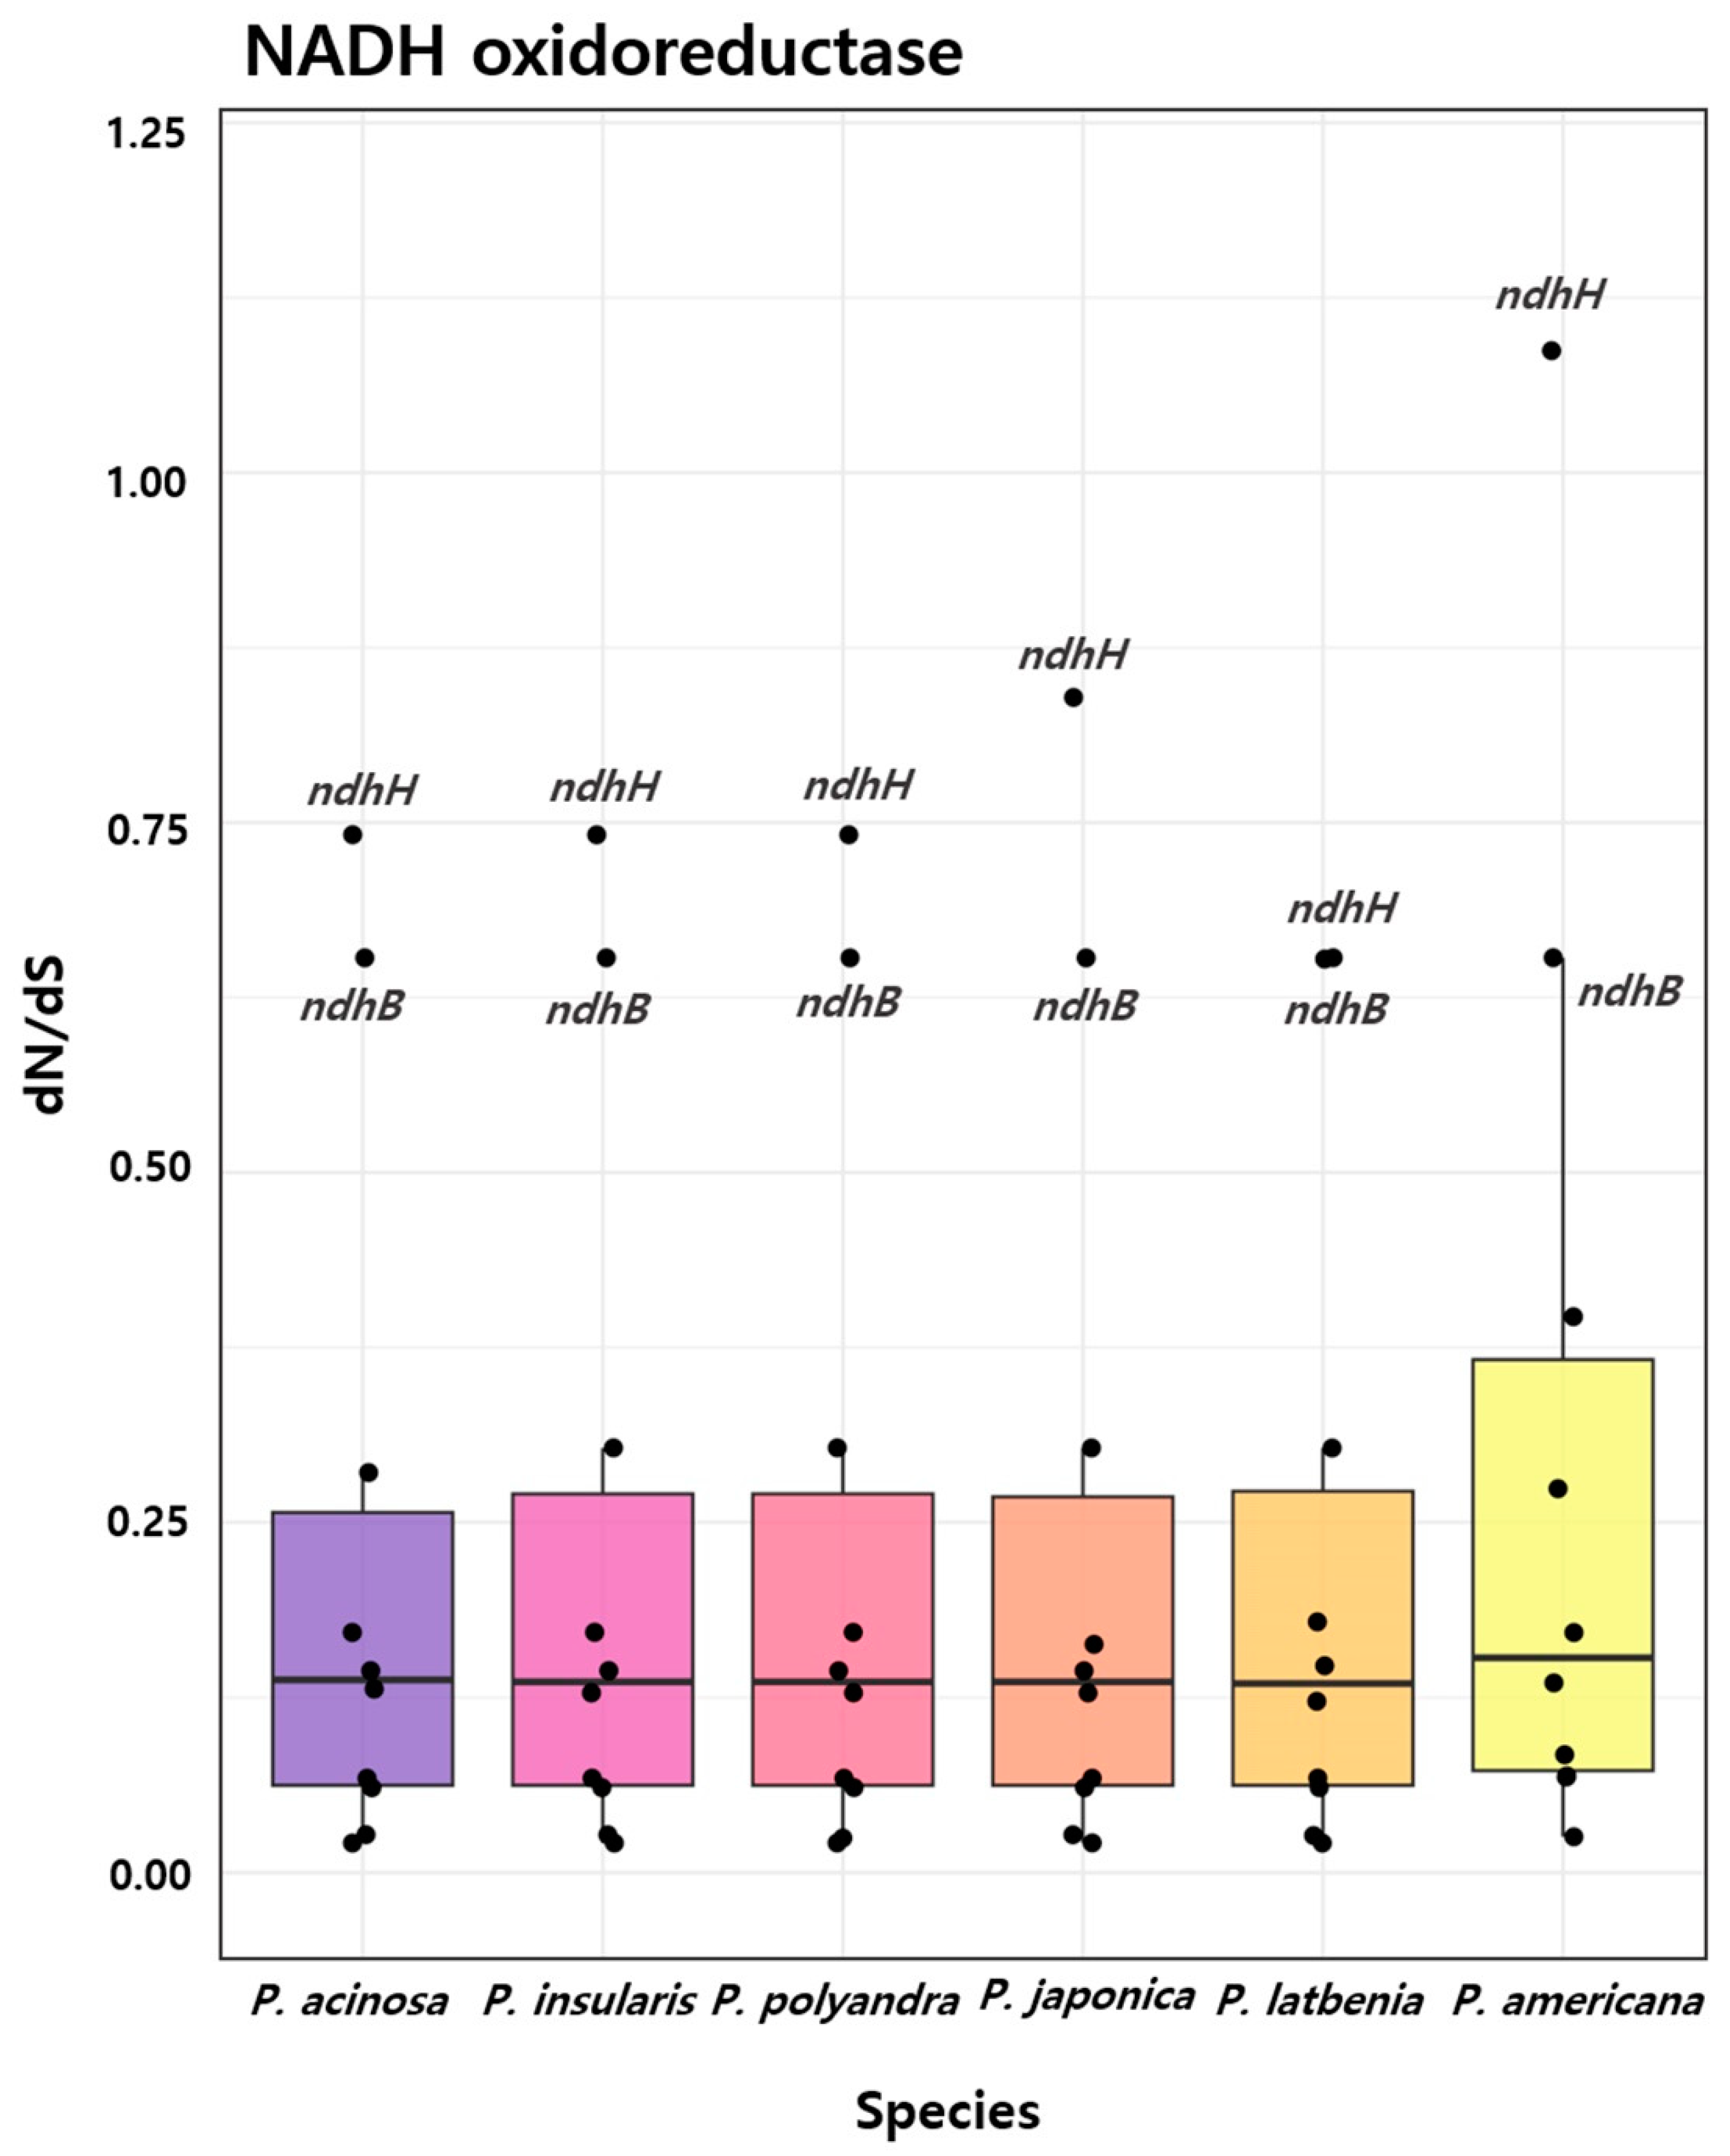
2.5. Selection Analysis

In this study, dN/dS ratios were analyzed across various genes in order to assess the evolutionary selective pressures among Phytolacca species (Figure 6). The analysis of the six species revealed that the NADH oxidoreductase gene group exhibited the most significant results. The dN/dS ratios for each analyzed gene are listed in Table S6. Most genes in this family exhibited dN/dS values <0.25, indicating widespread purifying selection. However, ndhH in P. americana displayed a dN/dS value of 1.0871, suggesting positive selection. In contrast, the ndhH gene in other species ranged from 0.0248 to 0.0683, whereas the ndhB gene consistently exhibited a dN/dS value of 0.6533 across all six species. These findings highlight the variability in evolutionary pressures within the NADH oxidoreductase gene family, with P. americana experiencing stronger selective pressures, whereas genes in other species remain more conserved.

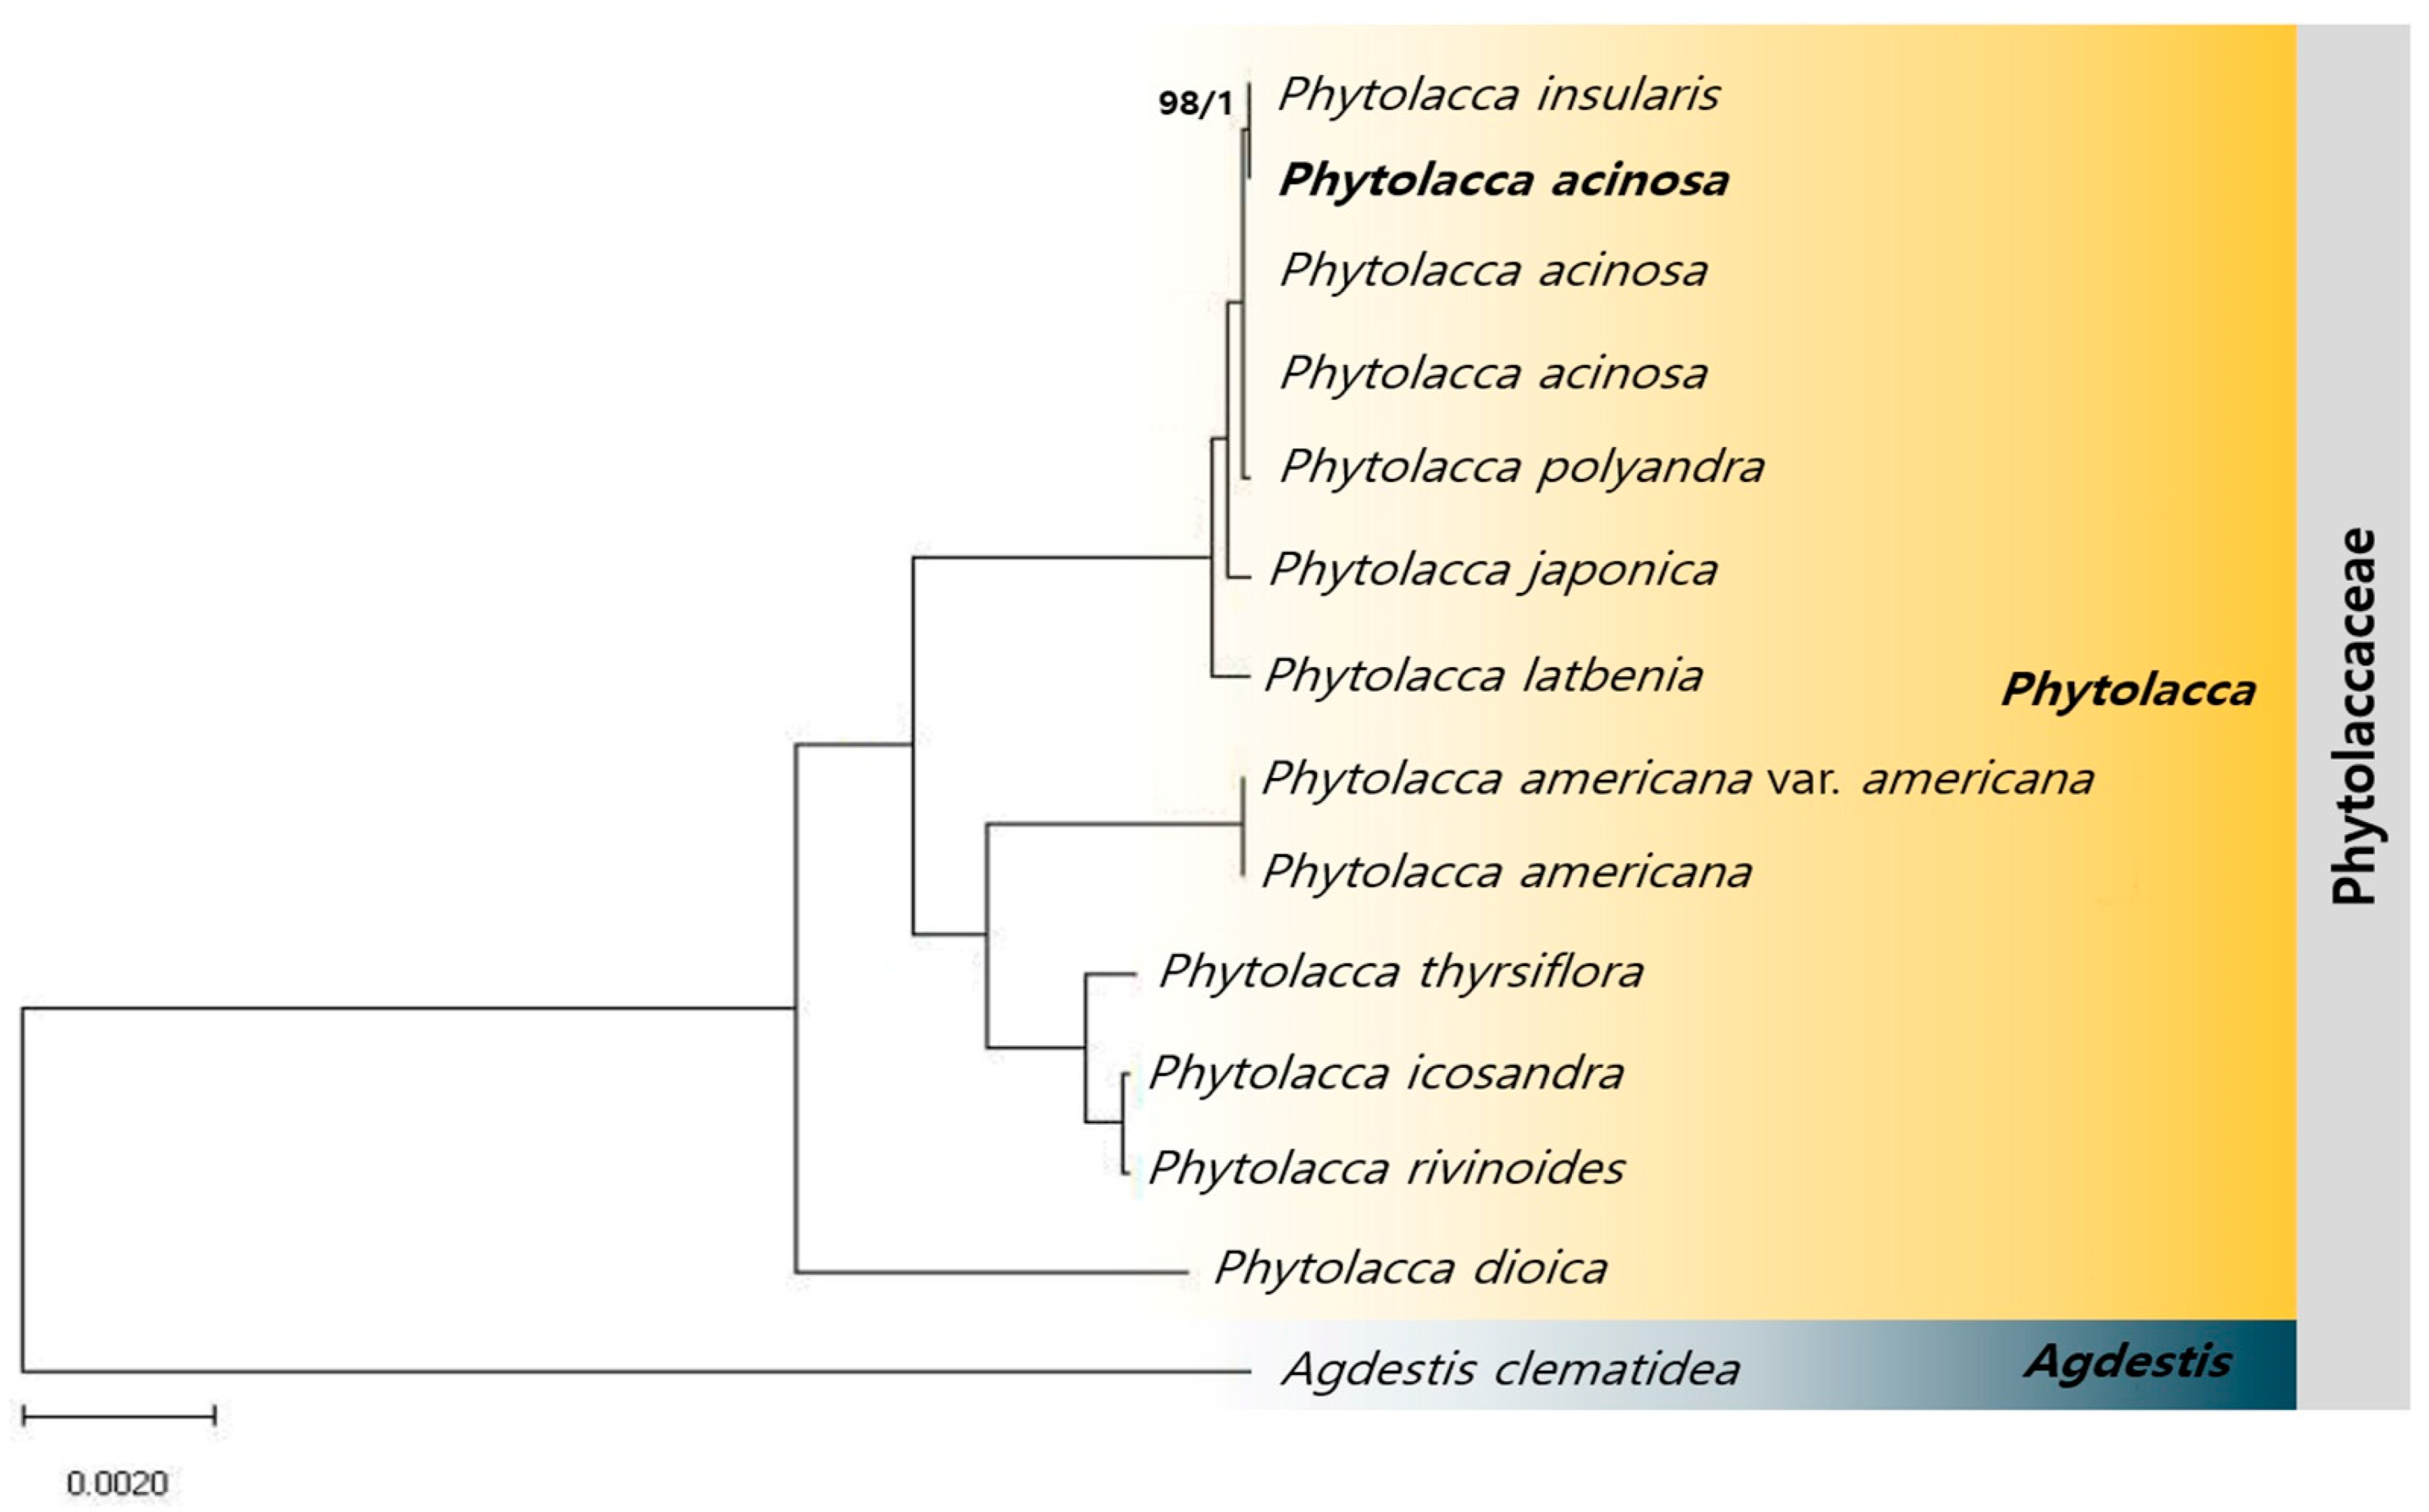
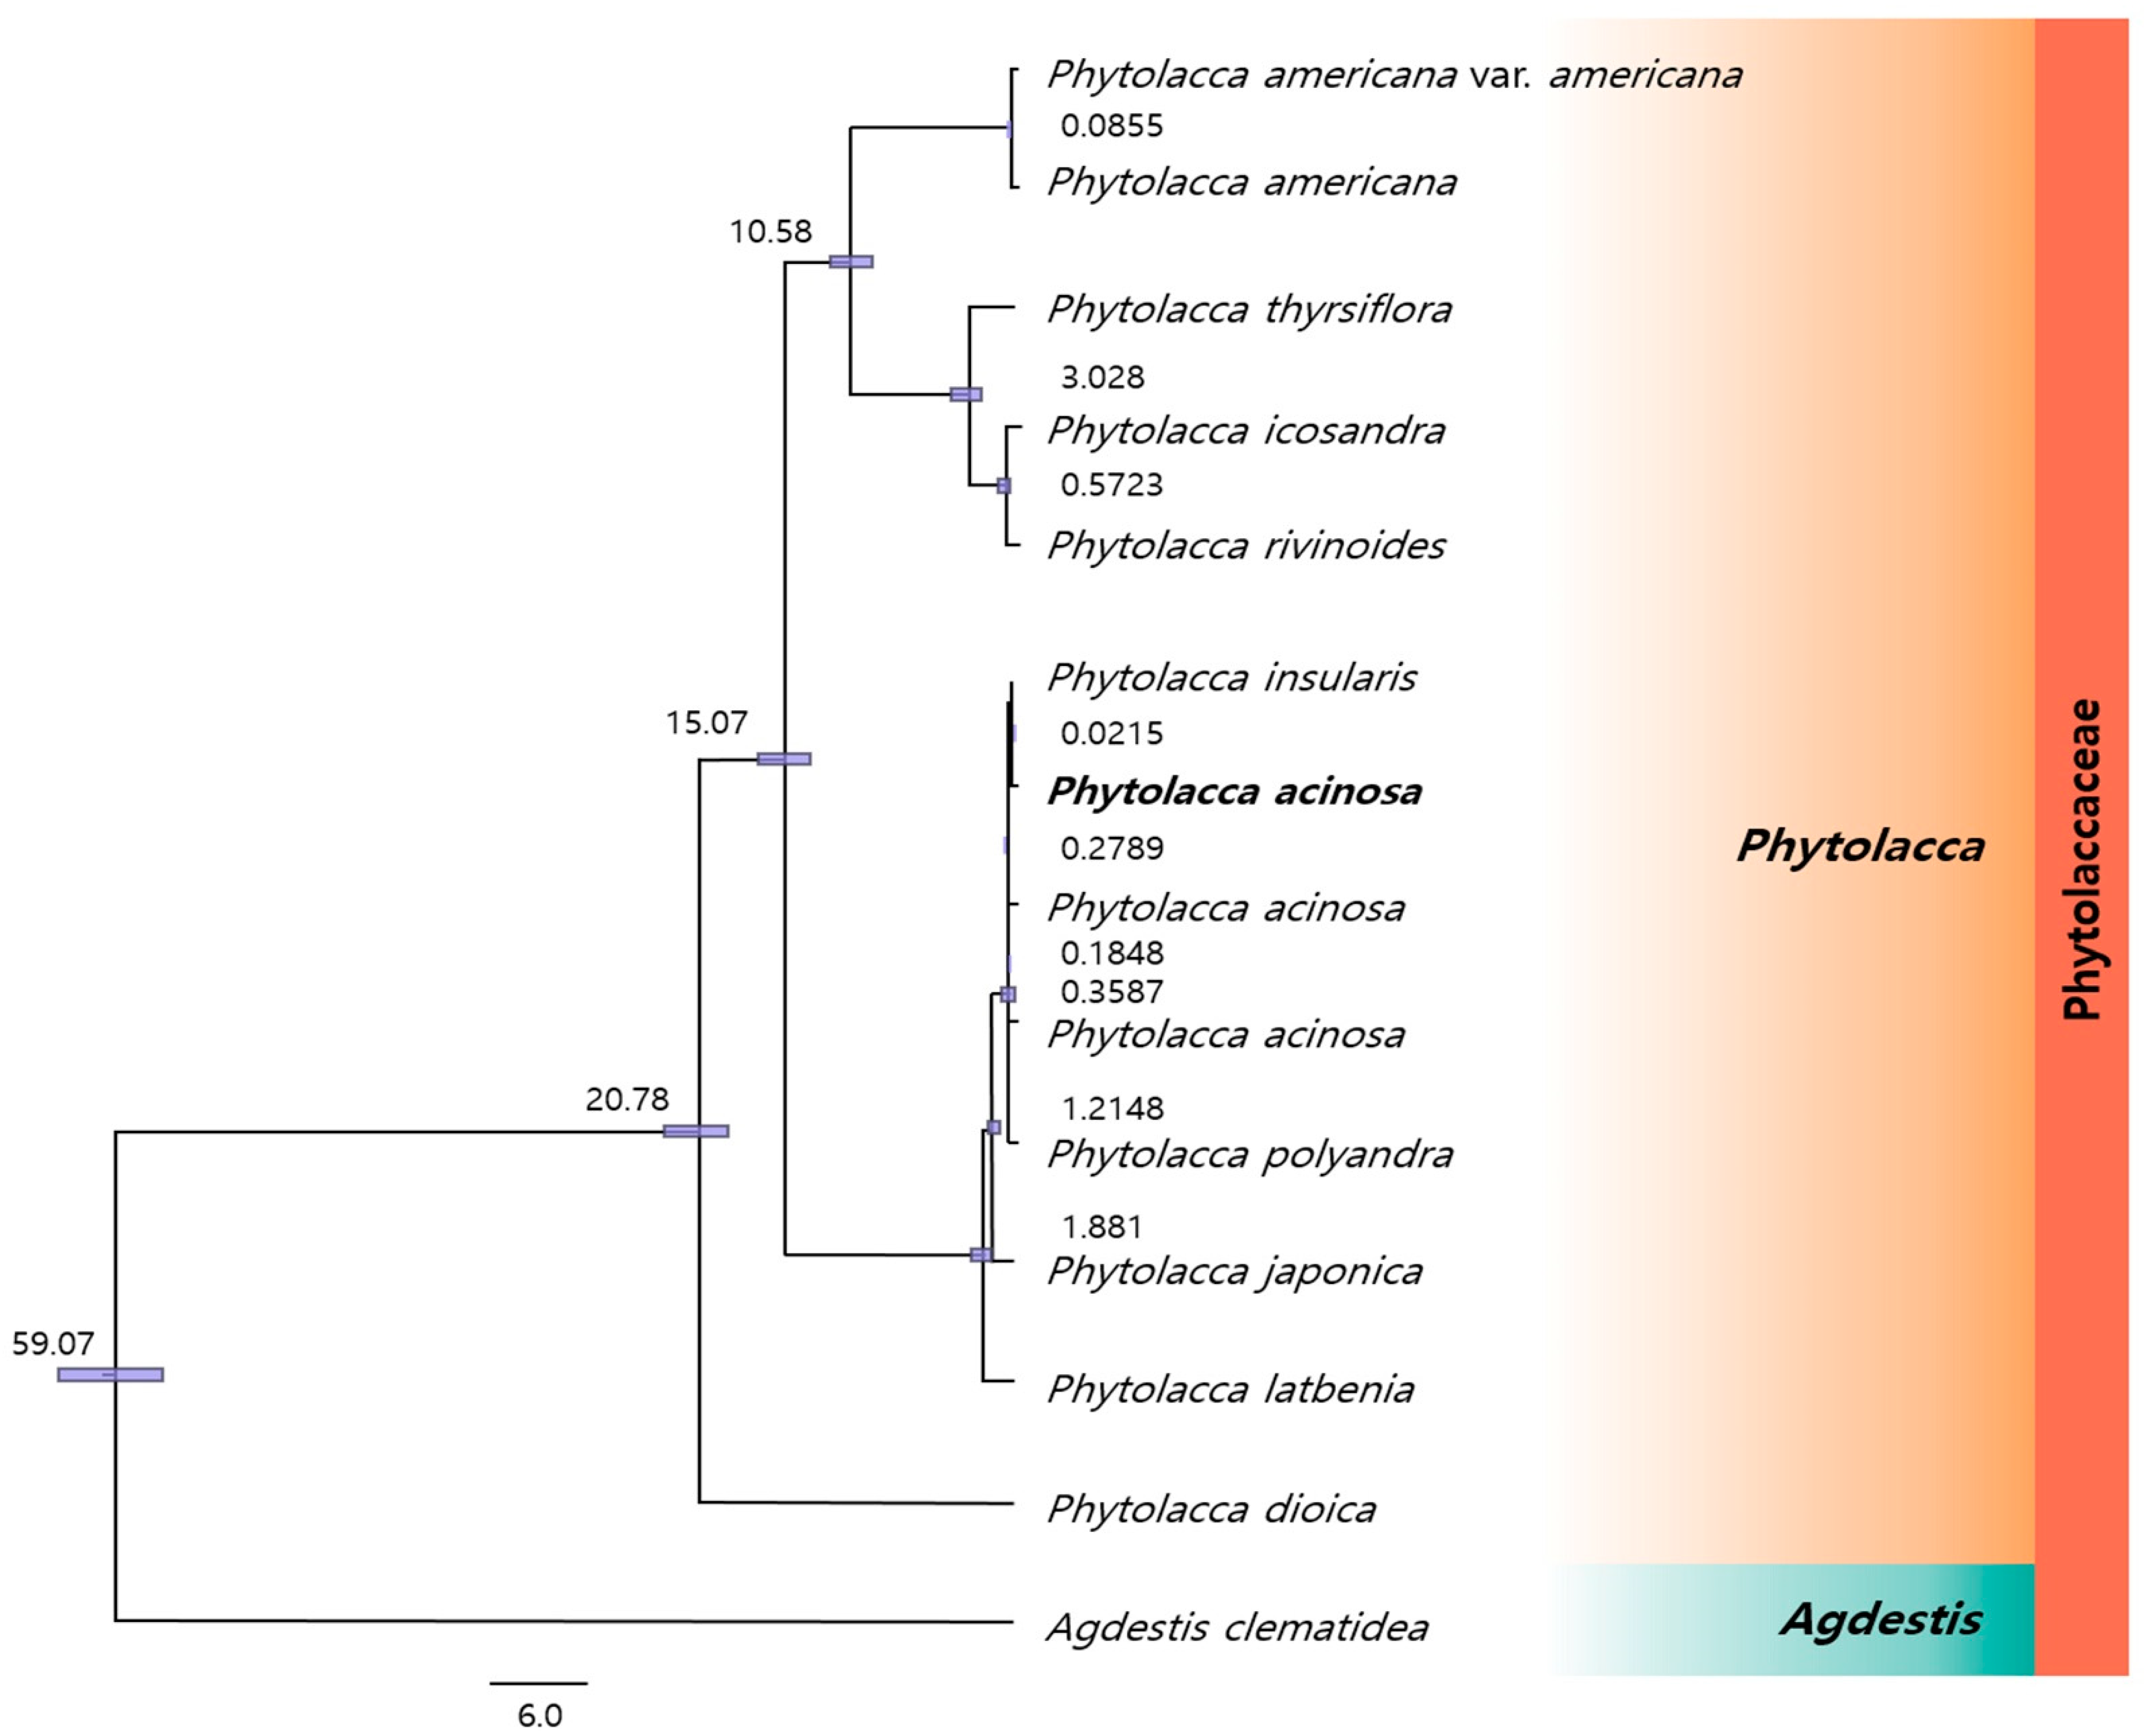
2.6. Phylogenetic Relationships Among Phytolacca

To analyze the phylogenetic relationships among Phytolacca species, 76 coding sequences (CDSs) from each of the 14 species (13 Phytolacca species and one Agdestis outgroup) were used to construct both ML and BI phylogenetic trees (Figure 7). In the phylogenetic tree constructed with A. clematidea as the outgroup, most relationships were strongly supported by high bootstrap values (ML = 100%, BI = 1.0), including P. insularis (ML = 98%, BI = 1.0). The results of the phylogenetic analysis indicated that P. acinosa shares a close sister group relationship with P. insularis and clusters with P. polyandra, P. japonica, and P. latbenia. In contrast, P. americana, which is also used as Phytolaccae Radix like P. acinosa, formed a separate cluster, indicating a clear distinction from P. acinosa. P. acinosa is more closely related to P. insularis, P. polyandra, P. japonica, and P. latbenia than to P. americana.
The results from both ML and BI phylogenetic trees were consistent with those observed in the divergence time-estimated phylogenetic tree (Figure 8). The Phytolacca species diverged from A. clematidea approximately 59.07 million years ago (mya), with P. dioica splitting off approximately 20.78 mya. A divergence event 15.07 mya separated a group that included P. americana var. americana, P. thyrsiflora, P. icosandra, and P. rivinoides from another group comprising P. acinosa, P. insularis, P. polyandra, P. japonica, and P. latbenia. Later, P. americana diverged from P. thyrsiflora, P. icosandra, and P. rivinoides approximately 10.58 mya. In contrast, species within the P. acinosa cluster diverged more recently. P. japonica and P. latbenia were estimated to have branched off around 1.881 mya and later, respectively. P. polyandra has a more distant evolutionary relationship with P. acinosa than with P. insularis, diverging by approximately 1.2148 mya. The closest relationship was observed between P. insularis and P. acinosa, which diverged approximately 0.0215 mya, indicating a very recent evolutionary split and high genetic similarity between the two species.

3. Discussion

The complete cp genome of P. acinosa was successfully assembled with a total length of 156,433 bp and a typical quadripartite structure comprising an LSC region, an SSC region, and two IR regions. The overall GC content was found to be 36.8%, with the IR regions displaying a notably higher GC content (42.6%) than the LSC (34.6%) and SSC (30.3%) regions. This pattern of elevated GC content in IR regions relative to single-copy regions aligns with the cp genomes of other angiosperms, indicating a conserved structural feature across diverse plant lineages [43,44]. The P. acinosa cp genome contains 113 unique genes, including 79 protein-coding genes, 4 rRNAs, and 30 tRNAs, which are typical of other angiosperms [26,45]. The conservation of gene content across species suggests that the cp genome of P. acinosa has remained largely unchanged over evolutionary time, underscoring the critical roles these genes play in essential functions such as photosynthesis, ATP synthesis, and transcription [46].
Codon usage is closely related to gene expression efficiency and accuracy, and offers insights into the evolutionary patterns of cp genomes [47]. In this study, P. acinosa and related species, including P. insularis, P. polyandra, P. japonica, P. latbenia, and P. americana, exhibited nearly identical codon numbers and relative synonymous codon usage (RSCU) values, suggesting a strong preference for certain synonymous codons. Analysis of the RSCU values showed that approximately half of the codons exhibited a notable bias (RSCU > 1), with those featuring an A or T at the third nucleotide position being especially favored. This pattern aligns with observations in various angiosperms, suggesting a conserved evolutionary trend in the cp genomes of these species [48,49]. Certain codons such as CGC (arginine), CTC, and CTG (both leucine) have relatively low RSCU values, whereas GCT (alanine), TAA (stop codon), and AGA (arginine) had higher RSCU values. This pattern likely reflects biases in codon usage influenced by mutational pressure and translational efficiency [50,51].
The distribution of SSRs across the six Phytolacca species showed a consistent pattern, with the majority concentrated in the LSC and SSC regions. A notable proportion of these SSRs are located in noncoding regions, such as the IGS. In these regions, relaxed selective pressure allows mutations to persist without disrupting essential functions, unlike in coding regions, where harmful mutations are often eliminated by natural selection [52,53,54]. This permissive environment fosters the accumulation of repetitive sequences such as SSRs through mechanisms such as replication slippage, recombination events, and associations with retrotransposons [55,56]. These mechanisms contribute to sequence expansion and genetic variation in these regions [57,58]. Interestingly, P. americana exhibited a lower overall number of SSRs than other species, suggesting species-specific genomic variation. This variation could be attributed to factors such as genome size, random mutations, or differential selection pressures, although this may not indicate significant evolutionary divergence [59,60,61]. Similarly, tandem repeats predominantly accumulated in noncoding regions across the LSC and SSC in all species. Although SSRs are shorter and simpler, tandem repeats exhibit a greater length and complexity, potentially contributing to genome stability or the formation of secondary DNA structures in specific contexts [62]. The analysis of repeat types across all species revealed that palindromic repeats were the most abundant, followed by forward repeats, with P. americana exhibiting similar patterns. However, P. americana uniquely showed the presence of a reverse repeat, which was not observed in other species. Reverse repeats may contribute to structural variations by influencing recombination events, potentially affecting the genome architecture in species-specific ways. Overall, the distribution of SSRs and tandem repeats across the LSC, SSC, and IR regions indicated a well-conserved genomic structure in Phytolacca species.
Analysis of the IR expansion and contraction in Phytolacca species revealed a largely conserved cp genome structure, consistent with patterns observed in other angiosperms. In this study, comparisons of the cp genome boundaries among six Phytolacca species and A. clematidea revealed distinct patterns of the IR region contraction and expansion among the species. Specifically, IR contraction has been observed in P. americana, whereas IR expansion has been observed in other Phytolacca species. Despite these variations in IR size, the overall gene arrangement and location were mostly conserved across Phytolacca species, indicating a stable genomic structure with some degree of flexibility at the IR boundaries. These findings indicate that although the cp genome of Phytolacca has undergone evolutionary changes in certain regions, particularly at the IR boundaries, it remains highly conserved in terms of gene order, which aligns with the evolutionary trends seen in other plant lineages [19,44].
The mVISTA comparison revealed that the cp genome of Phytolacca is highly conserved overall, particularly in the genic regions, which are more conserved than the IGS regions. This is a common trend in angiosperms, as genic regions play essential roles in biological functions [63]. Sequence comparisons using P. acinosa as a reference indicated high similarity between P. insularis and P. acinosa, suggesting a closer evolutionary relationship, whereas P. americana showed the greatest divergence in both the genic and IGS regions, particularly in genes such as rps16-trnQ-UUC, trnS-GCU-trnG-UCC, pafI-trnS-GGA, pafII-cemA, psaJ-rpl33, and ycf1, indicating greater genetic variability within the genus. Morphological analysis was also consistent with the genomic results. Based on reproductive characteristics, such as inflorescence and carpels, P. americana is clearly different from other Korean Phytolacca species. Furthermore, according to recent species concepts, P. insularis is treated as a form of P. acinosa [4] or as a recognized synonym of P. acinosa [64]. According to the Korean Herbal Pharmacopoeia, the dried roots of P. acinosa and P. americana, which are morphologically and genetically distinct, are used in the same herbal medicine Phytolaccae Radix. Our results and recent taxonomic concepts indicate that P. insularis is closely related to P. acinosa. Phylogenetic analysis of medicinal plants has proven to be a valuable predictive tool for more focused strategies [65]. According to our results, P. acinosa and P. insularis clustered in monophyly would have a similar effect. Thus, an analysis of the pharmacological and chemical properties of P. insularis is needed to clarify the medicinal properties and also the possibilities of the newly listed Korean Herbal Pharmacopoeia.
In addition to the mVISTA comparison, the Pi values across the six Phytolacca species revealed specific regions with elevated variability. Notably, regions such as ccsA-ndhD, trnM-atpE, and rps16-trnQ exhibited high Pi values, marking these as hotspots of nucleotide diversity. These regions, primarily located in the LSC and SSC regions, may play an important role in the evolutionary dynamics of the cp genomes of these species [45]. Identifying these hotspot regions is particularly valuable because they can serve as molecular markers for phylogenetic and population genetic studies within the genus [19]. Overall, the observed patterns of variation and nucleotide diversity in the cp genomes of Phytolacca species contribute to a more comprehensive understanding of genetic relationships within the genus.
The results of the dN/dS analysis provide significant insights into the evolutionary pressures acting on the NADH oxidoreductase gene family among Phytolacca species. Most of the genes in this family are subject to purifying selection, as evidenced by dN/dS values below 0.25, indicating strong selective constraints that maintain the critical functions of these genes in cellular respiration by limiting non-synonymous substitutions [66,67]. However, a notable exception is the ndhH gene in P. americana, where a dN/dS value of 1.0871 suggests potential positive selection. This positive selection implies that P. americana may have undergone adaptive changes in response to diverse environmental conditions. Unlike other Phytolacca species, P. americana has a vast native range across North America and parts of Mexico, and has been widely introduced to numerous regions worldwide, including Europe, Africa, and Asia [68,69]. This broad geographical distribution exposes P. americana to a wide variety of ecological niches, potentially driving adaptive evolution as the species responds to different climatic conditions, soil types, and environmental stressors [70,71,72]. Positive selection observed for the ndhH gene further supports the hypothesis of adaptation to these diverse environments. In contrast, the ndhB gene, with a consistent dN/dS value of 0.6533 across all six species, indicates relaxed purifying selection or possibly mild adaptive evolution, allowing for moderate variability while maintaining functional constraints. This may reflect selective pressures that permit some flexibility in function, possibly due to the varied ecological backgrounds of the species, particularly because some species (P. acinosa, P. polyandra, P. japonica) have also been introduced into new regions, such as Europe, which may impose additional environmental challenges [69]. Finally, although positive selection in the P. americana ndhH gene was suggested by dN/dS analysis, further research is needed to determine whether specific amino acid substitutions in this gene are located in key functional domains of the protein and how these changes might influence the function of the gene. Understanding the roles of these mutations in adaptive evolution will provide deeper insights into the functional significance of these evolutionary changes.
Phylogenetic analysis based on 76 CDSs across 14 species (13 Phytolacca species and 1 Agdestis outgroup) clarified distinct evolutionary relationships within the Phytolacca genus. Notably, P. acinosa and P. insularis formed a close sister group relationship, clustering with P. polyandra, P. japonica, and P. latbenia. These species demonstrated high genetic similarity, which likely reflects a recent divergence event. In contrast, P. americana, which is traditionally used as Phytolaccae Radix, formed a distinct cluster, underscoring its evolutionary distinction from P. acinosa. This suggests that P. americana has followed a separate evolutionary path that was potentially shaped by its broader geographic range and ecological pressures. Previous studies using the ITS1-5.8S-ITS2 region phylogenetic analysis identified P. dioica as the earliest-diverging lineage, with P. americana and P. acinosa forming separate clusters [73]. These results are consistent with the findings of the present study, which showed a significant evolutionary divergence between these species. Additionally, the ML and BI phylogenies constructed in this study closely match two separate phylogenetic trees presented in Song et al. [1]. In their study, one tree was inferred using the whole cp genome, whereas the other was constructed using 79 CDSs and 4 rRNA genes. Both trees provided similar insights into the phylogenetic relationships among Phytolacca species. This agreement across different datasets and methods provided robust validation of the findings, especially in confirming the clear evolutionary distinction between P. americana and P. acinosa.
Phylogenetic trees based on divergence time estimates provide a valuable method for examining evolutionary relationships and temporal splits among species [74,75]. By integrating genetic data and molecular evolution models, divergence time trees can be used to estimate when specific species diverged from their common ancestors. These trees are particularly useful for understanding the rate of genetic change over time and for associating evolutionary splits with historical environmental or ecological changes [76]. In this study, a divergence time tree was constructed using 76 CDSs from the cp genomes of various Phytolacca species. This phylogenetic tree, based on both the ML and BI methods, closely aligns with previous results. Interestingly, it showed strong congruence with the divergence tree reported by Song et al. (2022), who used a broader cp genome dataset that included both coding and rRNA genes [1]. Although the datasets were not identical, the consistency of the resulting phylogenies further validated the depicted evolutionary relationships, highlighting the reliability of the findings across different analytical approaches.
The divergence time estimates provided additional insights into the selective pressures acting on the NADH oxidoreductase gene family within the Phytolacca species. The recent divergence of P. acinosa and P. insularis (approximately 0.0215 mya) aligned with the dN/dS analysis, showing low dN/dS values (ranging from 0.0248 to 0.0683) across most genes, including ndhH, suggesting strong purifying selection. This supports the close evolutionary relationship between these species, which are likely to be subjected to fewer adaptive pressures, leading to genetic conservation. In contrast, P. americana, which diverged from its closest relatives approximately 10.58 mya, showed evidence of positive selection in ndhH (dN/dS = 1.0871), potentially linked to its broader geographic distribution and the resulting need to adapt to more varied environmental conditions. The earlier divergence of P. americana from species such as P. thyrsiflora and P. icosandra may correspond to its exposure to greater ecological challenges or geographic expansion, driving adaptive changes in ndhH. This suggests that selective pressures may have shaped P. americana over a significant period, as it adapted to different ecological niches.
Integrating divergence time estimates with dN/dS ratios revealed different evolutionary trajectories within the Phytolacca genus. Recent divergence and low dN/dS values in species such as P. acinosa and P. insularis suggest a conserved evolutionary path, whereas P. americana displays signs of adaptive evolution, likely related to its broader ecological range. Although both P. americana and P. acinosa are traditionally used as medicinal herbs, their distinct evolutionary histories indicate potential differences in their chemical compositions and biological activities, which may influence their medicinal properties. While further research is required to fully understand these implications, the findings underscore the importance of accurate species identification for medicinal use to ensure that species-specific differences are considered. By combining phylogenetic and molecular evolutionary analyses, this study enhanced our understanding of genetic distinctions relevant to the safe and effective use of Phytolacca species in traditional medicine.

4. Materials and Methods

4.1. Plant Material

Fresh P. acinosa leaves were collected from its native habitat in Korea (36°47′18.9″ N 128°54′26.1″ E, collect number: CBU-C-1) and, after drying, were registered as specimens at CBU. Information on the collection sites and voucher numbers of P. acinosa specimens used in this study is presented in Table S7. The dried samples were ground into a fine powder by immersion in liquid nitrogen and genomic DNA was extracted using a modified CTAB method [77]. The genomic DNA extracted from P. acinosa was used to determine DNA concentration and purity using a BioDrop µLite+ Microvolume Spectrophotometer (Harvard Bioscience, Inc., Holliston, MA, USA).

4.2. Genome Sequencing and Assembly

The Illumina library was prepared using the TruSeq Nano DNA Prep Kit, and paired-end reads were generated using the NovaSeq 6000 platform (Illumina, San Diego, CA, USA). The preprocessing step was performed using Trimmomatic v0.39 [78] program to check sequence quality and perform read cleaning (Phred quality score ≥ 20). Trimmed reads were assembled using the default parameters of GetOrganelle v1.7.7.1 [79]. The continuity and completeness of the assembled sequences were improved by filling the gaps using SOAPdenovo GapCloser v1.12 [80], which utilizes information from the aligned paired-end reads.

4.3. Chloroplast Genome Annotation

The assembled cp genome sequence of P. acinosa and the reference sequence, written as circular genomes, were input into GeSeq [81] for organelle genome annotation. Protein-coding sequences were curated using Artemis v18.0.0 [82] and cross-verified against the NCBI protein database. The tRNA was identified using tRNAscan-SE 1.21 [83]. Based on the P. acinosa cp genome annotation results, a cp genome map was created using Organellar GenomeDRAW v1.3.1 [84].

4.4. Codon Usage Pattern and Repeat Analysis

The GC content was determined using Geneious software v2025.0 (Biomatters, Auckland, New Zealand) [85], and codon usage, including codon numbers and RSCU, was analyzed using MEGA11 [86]. Euclidean distances were calculated based on codon usage frequencies within each gene of the six Phytolacca species: P. acinosa, P. insularis, P. polyandra, P. japonica, P. latbenia, and P. americana. Average linkage clustering was performed to group genes with similar codon usage patterns. The results were visualized using Heatmapper v1.4 [87].
Potential simple sequence repeats (SSRs) were identified using MISA v2.1 [88] with the following minimum repeat counts: 10 mononucleotides, 6 dinucleotides, 5 tri-nucleotides, 4 tetra-nucleotides, and 3 both penta- and hexa-nucleotides. Tandem repeats were identified using the Tandem Repeats Finder v4.10.0 [89], with the minimum alignment score set to 50 and the maximum period size set to 500. REPuter v2.0 [90] was used for forward, reverse, palindromic, and complementary repeats.

4.5. Comparative Analysis of Chloroplast Genomes

The IR regions of the cp genomes of the six Phytolacca species and A. clematidea were examined using Geneious software v2025.0 (Biomatters, Auckland, New Zealand) [90] to assess their expansion and contraction. To compare the cp genomes of six Phytolacca species, the mVISTA program (available at https://genome.lbl.gov/vista/mvista/submit.shtml, accessed on 7 January 2025) [91] was used to compare the cp genomes of six Phytolacca species. The shuffle-LAGAN mode [92], which allows for rearrangement between genomes during alignment, was employed to visually compare the conserved and divergent sequences across the cp genomes of each species. Nucleotide diversity values were analyzed using DnaSP v6 software [93] to calculate the level of variation at each nucleotide position within the cp genome. This analysis allowed the assessment of genetic diversity among Phytolacca cp genomes.

4.6. Selection Pressure Analysis

To understand the selection pressure applied during the evolution of genes, we examined the classification of dN/dS in six species of Phytolacca. Using the Geneious software v2025.0 (Biomatters, Auckland, New Zealand) [85], we separately aligned the cp genomes of six species: P. acinosa, P. insularis, P. polyandra, P. japonica, P. latbenia, and P. americana, with A. clematidea as the reference genome. Next, we extracted the CDSs from each aligned genome and calculated the dN/dS values for each extracted sequence using PAML v4.9 [94]. The tree file required the use of the CODEML model in PAML, which was generated using the Kimura 2-parameter (K2P) model in MEGA11 [86] (Tamura et al., 2021), which considers the differences in transition and transversion rates when calculating genetic distances. To further explore the selection pressures acting on the genes, we applied both the M0 (one-ratio) and M2a (positive selection) models to PAML. The M0 model assumes a single dN/dS ratio (ω) across all sites in the coding sequences, providing a baseline for the selective pressure analysis by averaging the effects across the entire gene. In contrast, the M2a model allows for more complex selective scenarios by incorporating three site categories: (1) those under purifying selection (ω < 1), (2) sites evolving neutrally (ω = 1), and (3) sites under positive selection (ω > 1). This model helps to identify the codons that may be under positive selection, suggesting functional adaptation. We performed a likelihood ratio (LR) test to compare these models and detect evidence of positive selection. The resulting LRT statistic was compared to a Chi-squared distribution with degrees of freedom equal to the difference in the number of parameters between the models, allowing us to determine whether the M2a model, which includes positive selection, significantly improves the fit compared with the simpler M0 model. The dN/dS values for the genes across the six Phytolacca species were visualized using the R package ggplot2 [95].

4.7. Phylogenetic Analysis and Divergence Time Estimation

For phylogenetic analysis, we utilized 10 Phytolacca cp genomes, with A. clematidea as the outgroup. The cp genomes were aligned using MAFFT v7 [96], which ensures accurate alignments, particularly in regions with moderate divergence, and provides high-quality results for plant genome analysis. The aligned sequences were then used to extract CDSs for further analysis. The extracted CDSs were refined using Gblocks v5 [97] to remove poorly aligned and highly variable regions. To determine the most suitable nucleotide substitution model, jModelTest v2.1.10 [98] and the GTR+I+G model was selected based on the Akaike information criterion (AIC). Using this model, we constructed an ML tree using MEGA11 [86], performing 1000 bootstrap replicates to assess the robustness of the tree topology, a number typically sufficient to provide reliable support values while balancing computational efficiency. A BI tree was generated using MrBayes v3.2.6 [99], running the Markov Chain Monte Carlo (MCMC) algorithm for 5,000,000 generations, with two independent runs of two chains each. The analysis was performed on a desktop computer equipped with a 13th Gen Intel(R) Core(TM) i5-13400F processor (2.50 GHz) (Intel, Santa Clara, CA, USA), 32 GB of RAM, and Windows 11 Education (64-bit). The total computation time was approximately 12 h. Trees were sampled every 100,000 generations, with the first 25% discarded as burn-ins. A 50% majority-rule consensus tree was used to estimate the posterior probabilities of phylogenetic relationships.
To estimate the divergence times of Phytolacca species, we selected 14 species, including those closely related to P. acinosa, based on the analysis of 76 CDSs extracted from their cp genomes. Species names and accession numbers of the cp genomes used in the divergence time analysis are summarized in Table S8. The settings for phylogenetic inference and divergence time estimation were configured using the BEAUti interface as follows. For nucleotide substitution, we applied the GTR+I model. A Yule tree prior, which assumes a constant speciation rate across the entire phylogeny, was used to model species diversification, making it suitable for species-level divergence analyses. In addition, a log-normal relaxed molecular clock model was employed to allow mutation rates to vary over time rather than assuming a constant rate of molecular evolution. Divergence times in the phylogenetic tree were calibrated using both fossil-based and molecular clock evidence, with four calibration points incorporated based on estimates from a previous study by Song et al. [1]. The divergence between A. clematidea and Phytolacca was set at 59.56 Ma. Divergence between P. dioica and other Phytolacca species was estimated to have occurred at 20.30 Ma. The divergence of the clade containing P. acinosa was estimated at 13.72 Ma, whereas the split between P. americana and the remaining Phytolacca species was estimated at 10.95 Ma. Each calibration point was used to constrain the corresponding nodes in the divergence time tree with the 95% highest posterior density (HPD) interval applied. The MCMC analysis was conducted over 50 million generations with a 10% burn-in and sampling every 500 generations.
Analysis was performed using BEAST v1.856 [100], a comprehensive software package for Bayesian evolutionary analysis, and posterior estimates, including effective sample sizes (ESS) and parameter convergence, which were assessed using Tracer v1.7 [101]. In addition, we summarized the posterior distribution of trees by estimating the average node heights, means, and 95% HPD intervals using TreeAnnotator v1.7 [101]. The resulting phylogenetic trees and divergence times were visualized using FigTree v1.4.4 [102], thus facilitating a detailed evaluation of evolutionary relationships and divergence time estimates across the sampled species. This approach, which integrates multiple analytical tools, enabled a thorough examination of the phylogenetic structure and timing of species divergence within the dataset. Except for the P. acinosa cp genome assembled in this study, all cp genomes were downloaded from the NCBI database, and their information is provided in Table S8.

5. Conclusions

In the present study, the cp genome of P. acinosa was sequenced and analyzed in comparison with related species within the genus, providing key insights into their genomic architecture and evolutionary dynamics. The cp genomes exhibited highly conserved gene order, structure, and content, with localized variations such as SSRs and tandem repeats concentrated in noncoding regions, potentially contributing to genome stability and adaptive evolution. Codon usage analysis revealed a preference for A/T-rich codons, while variations in IR region dynamics aligned with patterns typical of angiosperms, highlighting a balance between genomic stability and adaptability. The dN/dS analysis demonstrated strong purifying selection in most genes, underscoring their critical biological functions. Notably, the ndhH gene in P. americana exhibited evidence of positive selection (dN/dS = 1.0871), suggesting potential adaptive evolution, possibly influenced by its extensive geographic distribution and exposure to diverse environmental conditions. However, other factors, including gene-specific functional changes or ecological dynamics, may also have contributed to this observed pattern. In contrast, the low dN/dS values in P. acinosa and P. insularis (~0.0215 mya) reflect recent divergence and genetic conservation, consistent with their close evolutionary relationship. Phylogenetic analysis and divergence time estimation further clarified evolutionary trajectories within the genus. P. americana, diverging approximately 10.58 mya, exhibited significant genetic and evolutionary distinctiveness from P. acinosa and P. insularis. These findings underscore the importance of accurate species identification for the medicinal application of Phytolaccae Radix, as evolutionary and genomic distinctions may influence their chemical and biological properties. By integrating phylogenetic and molecular evolutionary analyses, this study enhances the understanding of genomic and evolutionary processes within the Phytolacca genus. Future research should focus on the functional characterization of genes under positive selection, such as ndhH, as well as the pharmacological and chemical properties of P. insularis and P. americana, to further elucidate their medicinal potential and ensure safe application.

Supplementary Materials

The following supporting information can be downloaded at: https://www.mdpi.com/article/10.3390/app15020593/s1, Figure S1: Coverage showing the number of paired-end reads mapped to the complete chloroplast genome of Phytolacca acinosa. LSC, large single-copy region; SSC, small single-copy region; IRa, inverted repeat a; IRb, inverted repeat b. Figure S2: Codon usage and Relative Synonymous Codon Usage (RSCU) values for the 20 amino acids and stop codons in P. acinosa. (a) Frequency of amino acids in the protein-coding sequences. (b) RSCU values for 20 amino acids and stop codons from 79 protein-coding genes. Figure S3: Codon usage heatmap of protein-coding genes across six Phytolacca species. Green indicates high RSCU values, and red indicates low RSCU values. Codon usage patterns were analyzed using hierarchical clustering, shown by the dendrogram on the left. Figure S4: Comparison of chloroplast genome structures in six Phytolacca species and Agdestis clematidea. Each genome was composed of an LSC region, an SSC region, and IRa and IRb regions. The lengths of these regions are indicated, with structural variations such as expansions, contractions, and shifts of the IR boundaries across the species highlighted. LSC, large single-copy region; SSC, small single-copy region; IRa, inverted repeat a; IRb, inverted repeat b. Table S1: Raw and trimmed read data. Table S2: Genome assembly data for the Phytolacca acinosa chloroplast genome. Table S3: Read data and sequencing platform information for the Phytolacca acinosa chloroplast genome. Table S4: Gene groups and their corresponding genes identified in the chloroplast genome of Phytolacca acinosa, categorized by functional roles such as photosynthesis, ribosomal proteins, and other essential cellular processes. Table S5: Intron-containing genes and their exon–intron structures in the chloroplast genome of Phytolacca acinosa. Genes are listed with their respective regions (LSC, SSC, IR), and the lengths of exon and intron segments are provided. Table S6: dN/dS values for various genes across six Phytolacca species, showing evolutionary pressure on protein-coding genes. Conserved genes have similar dN/dS values across species, while genes with varying values may be under different selective pressures, suggesting species-specific adaptations or functional divergence. Table S7: Voucher specimen information for chloroplast genome used in this study. Table S8: GenBank accession numbers of species used for maximum likelihood (ML), Bayesian inference (BI), and divergent phylogenetic tree construction in this study.

Author Contributions

Conceptualization, J.-H.S. and I.P.; methodology, J.-H.S. and I.P.; software, S.J. and Y.K.; validation, J.-H.S. and I.P.; formal analysis, Y.K.; investigation, S.J., Y.K. and H.J.; resources, H.J. and J.-H.S.; data curation, S.J. and Y.K.; writing—original draft preparation, S.J., Y.K. and H.J.; writing—review and editing, J.-H.S. and I.P.; visualization, S.J., Y.K. and H.J.; supervision, J.-H.S. and I.P.; project administration, J.-H.S. and I.P.; funding acquisition, J.-H.S. and I.P. All authors have read and agreed to the published version of the manuscript.

Funding

This research was funded by the ‘Student-Initiated Creative Research Project’ at Changwon National University in 2024, and this research was supported by Global Learning and Academic research institution for Master’s and Ph.D. students, and Postdocs (LAMP) Program of the National Research Foundation of Korea (NRF) grant funded by the Ministry of Education (No. RS2024-00444460) to I.P., and the National Research Foundation of Korea (NRF) grants funded by the Korean government (grant numbers RS-2023-00208589) to J.-H.S.

Institutional Review Board Statement

Not applicable.

Informed Consent Statement

Not applicable.

Data Availability Statement

The complete chloroplast genome of Phytolacca acinosa generated in this study was submitted to the NCBI database (https://www.ncbi.nlm.nih.gov/) under the GenBank accession number PQ584746. All chloroplast genomes used in this study can be found in GenBank, and the GenBank accessions are shown in Supplementary Tables S7 and S8. Other cp genomes used in this study were downloaded from the NCBI site.

Conflicts of Interest

The authors declare no conflicts of interest.

References

  1. Song, Y.; Jiang, F.; Shi, J.; Wang, C.; Xiang, N.; Zhu, S. Phylogenomics Reveals the Evolutionary History of Phytolacca (Phytolaccaceae). Front. Plant Sci. 2022, 13, 844918. [Google Scholar] [CrossRef] [PubMed]
  2. Hong, S.P. Phytolaccaceae. In The Genera of Vascular Plants of Korea; Academy Publishing Co.: Seoul, Republic of Korea, 2018. [Google Scholar]
  3. Korea National Arboretum. Checklist of Vascular Plants in Korea; Korea National Arboretum: Pocheon, Republic of Korea, 2020; pp. 377–378. [Google Scholar]
  4. Chae, S.H.; So, S.K.; Han, K.S.; Kim, M.Y.; Park, S.H.; Lee, J.K. A Taxonomic Review of Phytolacca insularis (Phytolaccaceae). Korean J. Plant Taxon. 2007, 37, 431–446. [Google Scholar] [CrossRef]
  5. Ministry Food and Drug Safety. The Korean Pharmacopoeia, 12th ed.; Ministry Food and Drug Safety: Cheongju, Republic of Korea, 2019. [Google Scholar]
  6. Bailly, C. Medicinal properties and anti-inflammatory components of Phytolacca (Shanglu). Digit. Chin. Med. 2021, 4, 159–169. [Google Scholar] [CrossRef]
  7. Jung, C.; Hong, J.-Y.; Bae, S.Y.; Kang, S.S.; Park, H.J.; Lee, S.K. Antitumor activity of Americanin A isolated from the seeds of Phytolacca americana by regulating the ATM/ATR signaling pathway and the Skp2–p27 axis in human colon cancer cells. J. Nat. Prod. 2015, 78, 2983–2993. [Google Scholar] [CrossRef] [PubMed]
  8. Wang, C.-X.; Yu, H.-L.; Wu, H.; Tao, X.-B.; Xie, Y.-W.; Cheng, Y.-Q.; Zeng, P.; Wang, H.-P.; Zhang, P.; Cui, X.-B. Anti-ascites effect of total saponins of Phytolaccae Radix on mice with ascites and mechanism. China J. Chin. Mater. Medica 2022, 47, 4411–4417. [Google Scholar]
  9. Zeb, A.; Hassan, M.; Ayaz, M. Carotenoid and Phenolic Profiles and Antioxidant and Anticholinesterase Activities of Leaves and Berries of Phytolacca acinosa. ACS Food Sci. Technol. 2024, 4, 282–289. [Google Scholar] [CrossRef]
  10. Saleri, F.D.; Chen, G.; Li, X.; Guo, M. Comparative analysis of saponins from different Phytolaccaceae species and their antiproliferative activities. Molecules 2017, 22, 1077. [Google Scholar] [CrossRef] [PubMed]
  11. Kang, S.S.; Woo, W.S. Two new saponins from Phytolacca americana. Planta Medica 1987, 53, 338–340. [Google Scholar] [CrossRef] [PubMed]
  12. Gao, H.-M.; Liu, J.-X.; Wang, Z.-M.; Wang, W.-H. Phytolacacinoside A, a new triterpenoid saponin from Phytolacca acinosa Roxb. J. Asian Nat. Prod. Res. 2009, 11, 433–438. [Google Scholar] [CrossRef] [PubMed]
  13. Ma, X.P.; Zhang, W.F.; Yi, P.; Lan, J.J.; Xia, B.; Jiang, S.; Lou, H.Y.; Pan, W.D. Novel Flavones from the Root of Phytolacca acinosa Roxb. Chem. Biodivers. 2017, 14, e1700361. [Google Scholar] [CrossRef]
  14. Wang, H.-B.; Zheng, Q.-Y. Effects of Phytolacca acinosa polysaccharides I with different schedules on its antitumor efficiency in tumor bearing mice and production of IL-1, IL-2, IL-6, TNF, CSF activity in normal mice. Immunopharmacol. Immunotoxicol. 1997, 19, 197–213. [Google Scholar] [CrossRef] [PubMed]
  15. Bylka, W.; Matlawska, I. Flawonoids and free phenolic acids from Phytolacca americana L. leaves. Acta Pol. Pharm. 2001, 58, 69–72. [Google Scholar] [PubMed]
  16. Ren, S.; Zhang, Z.; Song, Q.; Ren, Z.; Xiao, J.; Li, L.; Zhang, Q. Metabolic exploration of the developmental abnormalities and neurotoxicity of Esculentoside B, the main toxic factor in Phytolaccae radix. Food Chem. Toxicol. 2023, 176, 113777. [Google Scholar] [CrossRef] [PubMed]
  17. Choe, S.; Jeong, S.; Jang, M.; Yeom, H.; Moon, S.; Kang, M.; Yang, W.; Kim, S. Identification of phytolaccosides in biological samples from pokeweed intoxication patients using liquid chromatography-tandem mass spectrometry. J. Chromatogr. B 2020, 1149, 122123. [Google Scholar] [CrossRef] [PubMed]
  18. Jeon, C.-H.; Cho, C.-S. Phytolacca Radix Poisoning: A Case Report. J. Korean Orient. Intern. Med. 2020, 41, 241–247. [Google Scholar] [CrossRef]
  19. Daniell, H.; Lin, C.-S.; Yu, M.; Chang, W.-J. Chloroplast genomes: Diversity, evolution, and applications in genetic engineering. Genome Biol. 2016, 17, 134. [Google Scholar] [CrossRef]
  20. Palmer, J.D. Comparative organization of chloroplast genomes. Annu. Rev. Genet. 1985, 19, 325–354. [Google Scholar] [CrossRef] [PubMed]
  21. Wicke, S.; Schneeweiss, G.M.; Depamphilis, C.W.; Müller, K.F.; Quandt, D. The evolution of the plastid chromosome in land plants: Gene content, gene order, gene function. Plant Mol. Biol. 2011, 76, 273–297. [Google Scholar] [CrossRef] [PubMed]
  22. Clegg, M.T.; Gaut, B.S.; Learn Jr, G.H.; Morton, B.R. Rates and patterns of chloroplast DNA evolution. Proc. Natl. Acad. Sci. USA 1994, 91, 6795–6801. [Google Scholar] [CrossRef]
  23. Drouin, G.; Daoud, H.; Xia, J. Relative rates of synonymous substitutions in the mitochondrial, chloroplast and nuclear genomes of seed plants. Mol. Phylogenet. Evol. 2008, 49, 827–831. [Google Scholar] [CrossRef]
  24. Harris, S.A.; Ingram, R. Chloroplast DNA and biosystematics: The effects of intraspecific diversity and plastid transmission. Taxon 1991, 40, 393–412. [Google Scholar] [CrossRef]
  25. Kuroiwa, T.; Kawano, S.; Nishibayashi, S.; Sato, C. Epifluorescent microscopic evidence for maternal inheritance of chloroplast DNA. Nature 1982, 298, 481–483. [Google Scholar] [CrossRef] [PubMed]
  26. Palmer, J.D.; Stein, D.B. Conservation of chloroplast genome structure among vascular plants. Curr. Genet. 1986, 10, 823–833. [Google Scholar] [CrossRef]
  27. Sager, R.; Lane, D. Molecular basis of maternal inheritance. Proc. Natl. Acad. Sci. USA 1972, 69, 2410–2413. [Google Scholar] [CrossRef]
  28. Graham, S.W.; Olmstead, R.G. Utility of 17 chloroplast genes for inferring the phylogeny of the basal angiosperms. Am. J. Bot. 2000, 87, 1712–1730. [Google Scholar] [CrossRef] [PubMed]
  29. Raubeson, L.A.; Jansen, R.K. Chloroplast genomes of plants. In Plant Diversity and Evolution: Genotypic and Phenotypic Variation in Higher Plants; CABI Publishing: Wallingford, UK, 2005; pp. 45–68. [Google Scholar]
  30. Li, E.; Liu, K.; Deng, R.; Gao, Y.; Liu, X.; Dong, W.; Zhang, Z. Insights into the phylogeny and chloroplast genome evolution of Eriocaulon (Eriocaulaceae). BMC Plant Biol. 2023, 23, 32. [Google Scholar] [CrossRef]
  31. Renner, S.S.; Zhang, L.-B. Biogeography of the Pistia clade (Araceae): Based on chloroplast and mitochondrial DNA sequences and Bayesian divergence time inference. Syst. Biol. 2004, 53, 422–432. [Google Scholar] [CrossRef] [PubMed]
  32. Wikström, N.; Savolainen, V.; Chase, M.W. Evolution of the angiosperms: Calibrating the family tree. Proc. R. Soc. London. Ser. B Biol. Sci. 2001, 268, 2211–2220. [Google Scholar] [CrossRef] [PubMed]
  33. Bremer, B.; Eriksson, T. Time tree of Rubiaceae: Phylogeny and dating the family, subfamilies, and tribes. Int. J. Plant Sci. 2009, 170, 766–793. [Google Scholar] [CrossRef]
  34. Dong, W.; Xu, C.; Liu, Y.; Shi, J.; Li, W.; Suo, Z. Chloroplast phylogenomics and divergence times of Lagerstroemia (Lythraceae). BMC Genom. 2021, 22, 434. [Google Scholar] [CrossRef]
  35. Jiménez-Barron, O.; García-Sandoval, R.; Magallón, S.; García-Mendoza, A.; Nieto-Sotelo, J.; Aguirre-Planter, E.; Eguiarte, L.E. Phylogeny, diversification rate, and divergence time of Agave sensu lato (Asparagaceae), a group of recent origin in the process of diversification. Front. Plant Sci. 2020, 11, 536135. [Google Scholar] [CrossRef] [PubMed]
  36. Goldman, N.; Yang, Z. A codon-based model of nucleotide substitution for protein-coding DNA sequences. Mol. Biol. Evol. 1994, 11, 725–736. [Google Scholar] [PubMed]
  37. Mehmood, F.; Ubaid, Z.; Shahzadi, I.; Ahmed, I.; Waheed, M.T.; Poczai, P.; Mirza, B. Plastid genomics of Nicotiana (Solanaceae): Insights into molecular evolution, positive selection and the origin of the maternal genome of Aztec tobacco (Nicotiana rustica). PeerJ 2020, 8, e9552. [Google Scholar] [CrossRef] [PubMed]
  38. Piot, A.; Hackel, J.; Christin, P.-A.; Besnard, G. One-third of the plastid genes evolved under positive selection in PACMAD grasses. Planta 2018, 247, 255–266. [Google Scholar] [CrossRef] [PubMed]
  39. Xie, D.-F.; Yu, Y.; Deng, Y.-Q.; Li, J.; Liu, H.-Y.; Zhou, S.-D.; He, X.-J. Comparative analysis of the chloroplast genomes of the Chinese endemic genus Urophysa and their contribution to chloroplast phylogeny and adaptive evolution. Int. J. Mol. Sci. 2018, 19, 1847. [Google Scholar] [CrossRef] [PubMed]
  40. Yang, Y.; Zhou, T.; Duan, D.; Yang, J.; Feng, L.; Zhao, G. Comparative analysis of the complete chloroplast genomes of five Quercus species. Front. Plant Sci. 2016, 7, 959. [Google Scholar] [CrossRef] [PubMed]
  41. Kimura, M. Preponderance of synonymous changes as evidence for the neutral theory of molecular evolution. Nature 1977, 267, 275–276. [Google Scholar] [CrossRef] [PubMed]
  42. Lawrie, D.S.; Messer, P.W.; Hershberg, R.; Petrov, D.A. Strong purifying selection at synonymous sites in D. melanogaster. PLoS Genet. 2013, 9, e1003527. [Google Scholar] [CrossRef] [PubMed]
  43. Jansen, R.K.; Ruhlman, T.A. Plastid genomes of seed plants. In Genomics of Chloroplasts and Mitochondria; Springer: Berlin/Heidelberg, Germany, 2012; pp. 103–126. [Google Scholar]
  44. Ravi, V.; Khurana, J.; Tyagi, A.; Khurana, P. An update on chloroplast genomes. Plant Syst. Evol. 2008, 271, 101–122. [Google Scholar] [CrossRef]
  45. Dobrogojski, J.; Adamiec, M.; Luciński, R. The chloroplast genome: A review. Acta Physiol. Plant. 2020, 42, 98. [Google Scholar] [CrossRef]
  46. Wolfe, K.H.; Li, W.-H.; Sharp, P.M. Rates of nucleotide substitution vary greatly among plant mitochondrial, chloroplast, and nuclear DNAs. Proc. Natl. Acad. Sci. USA 1987, 84, 9054–9058. [Google Scholar] [CrossRef]
  47. Fedorov, A.; Saxonov, S.; Gilbert, W. Regularities of context-dependent codon bias in eukaryotic genes. Nucleic Acids Res. 2002, 30, 1192–1197. [Google Scholar] [CrossRef]
  48. Morton, B.R. Chloroplast DNA codon use: Evidence for selection at the psbA locus based on tRNA availability. J. Mol. Evol. 1993, 37, 273–280. [Google Scholar] [CrossRef]
  49. Murray, E.E.; Lotzer, J.; Eberle, M. Codon usage in plant genes. Nucleic Acids Res. 1989, 17, 477–498. [Google Scholar] [CrossRef]
  50. Hershberg, R.; Petrov, D.A. Selection on codon bias. Annu. Rev. Genet. 2008, 42, 287–299. [Google Scholar] [CrossRef] [PubMed]
  51. Wang, Z.; Xu, B.; Li, B.; Zhou, Q.; Wang, G.; Jiang, X.; Wang, C.; Xu, Z. Comparative analysis of codon usage patterns in chloroplast genomes of six Euphorbiaceae species. PeerJ 2020, 8, e8251. [Google Scholar] [CrossRef]
  52. Borsch, T.; Quandt, D. Mutational dynamics and phylogenetic utility of noncoding chloroplast DNA. Plant Syst. Evol. 2009, 282, 169–199. [Google Scholar] [CrossRef]
  53. Hancock, J.M. The contribution of slippage-like processes to genome evolution. J. Mol. Evol. 1995, 41, 1038–1047. [Google Scholar] [CrossRef] [PubMed]
  54. Raubeson, L.A.; Peery, R.; Chumley, T.W.; Dziubek, C.; Fourcade, H.M.; Boore, J.L.; Jansen, R.K. Comparative chloroplast genomics: Analyses including new sequences from the angiosperms Nuphar advena and Ranunculus macranthus. BMC Genom. 2007, 8, 174. [Google Scholar] [CrossRef]
  55. Pappalardo, X.G.; Barra, V. Losing DNA methylation at repetitive elements and breaking bad. Epigenet. Chromatin 2021, 14, 25. [Google Scholar] [CrossRef]
  56. Rajput, M.K. Retrotransposons: The intrinsic genomic evolutionist. Genes Genom. 2015, 37, 113–123. [Google Scholar] [CrossRef]
  57. Tóth, G.; Gáspári, Z.; Jurka, J. Microsatellites in different eukaryotic genomes: Survey and analysis. Genome Res. 2000, 10, 967–981. [Google Scholar] [CrossRef] [PubMed]
  58. Viguera, E.; Canceill, D.; Ehrlich, S.D. Replication slippage involves DNA polymerase pausing and dissociation. EMBO J. 2001, 20, 2587–2595. [Google Scholar] [CrossRef] [PubMed]
  59. Emanuelli, F.; Lorenzi, S.; Grzeskowiak, L.; Catalano, V.; Stefanini, M.; Troggio, M.; Myles, S.; Martinez-Zapater, J.M.; Zyprian, E.; Moreira, F.M.; et al. Genetic diversity and population structure assessed by SSR and SNP markers in a large germplasm collection of grape. BMC Plant Biol. 2013, 13, 39. [Google Scholar] [CrossRef] [PubMed]
  60. Kashi, Y.; King, D.G. Simple sequence repeats as advantageous mutators in evolution. TRENDS Genet. 2006, 22, 253–259. [Google Scholar] [CrossRef]
  61. Qin, Z.; Wang, Y.; Wang, Q.; Li, A.; Hou, F.; Zhang, L. Evolution analysis of simple sequence repeats in plant genome. PLoS ONE 2015, 10, e0144108. [Google Scholar] [CrossRef]
  62. Melters, D.P.; Bradnam, K.R.; Young, H.A.; Telis, N.; May, M.R.; Ruby, J.G.; Sebra, R.; Peluso, P.; Eid, J.; Rank, D. Comparative analysis of tandem repeats from hundreds of species reveals unique insights into centromere evolution. Genome Biol. 2013, 14, 1–20. [Google Scholar] [CrossRef] [PubMed]
  63. Hupalo, D.; Kern, A.D. Conservation and functional element discovery in 20 angiosperm plant genomes. Mol. Biol. Evol. 2013, 30, 1729–1744. [Google Scholar] [CrossRef] [PubMed]
  64. Chang, C.-S.; Kim, H.; Chang, K.S. Provisional Checklist of Vascular Plants for the Korea Peninsula Flora (KPF). Des. Paju 2014. [Google Scholar]
  65. Ernst, M.; Saslis-Lagoudakis, C.H.; Grace, O.M.; Nilsson, N.; Simonsen, H.T.; Horn, J.W.; Rønsted, N. Evolutionary prediction of medicinal properties in the genus Euphorbia L. Sci. Rep. 2016, 6, 30531. [Google Scholar] [CrossRef] [PubMed]
  66. Ma, M.; Liu, Y.; Bai, C.; Yong, J.W.H. The significance of chloroplast NAD(P)H dehydrogenase complex and its dependent cyclic electron transport in photosynthesis. Front. Plant Sci. 2021, 12, 661863. [Google Scholar] [CrossRef] [PubMed]
  67. Shikanai, T. Chloroplast NDH: A different enzyme with a structure similar to that of respiratory NADH dehydrogenase. Biochim. Biophys. Acta (BBA)-Bioenerg. 2016, 1857, 1015–1022. [Google Scholar] [CrossRef]
  68. Fu, X.; Dou, C.; Chen, Y.; Chen, X.; Shi, J.; Yu, M.; Xu, J. Subcellular distribution and chemical forms of cadmium in Phytolacca americana L. J. Hazard. Mater. 2011, 186, 103–107. [Google Scholar] [CrossRef]
  69. McDonnell, M.J.; Stiles, E.W.; Cheplick, G.P.; Armesto, J.J. Bird-dispersal of Phytolacca americana L. and the influence of fruit removal on subsequent fruit development. Am. J. Bot. 1984, 71, 895–901. [Google Scholar]
  70. Munné-Bosch, S.; Shikanai, T.; Asada, K. Enhanced ferredoxin-dependent cyclic electron flow around photosystem I and α-tocopherol quinone accumulation in water-stressed ndhB-inactivated tobacco mutants. Planta 2005, 222, 502–511. [Google Scholar] [CrossRef] [PubMed]
  71. Peng, L.; Yamamoto, H.; Shikanai, T. Structure and biogenesis of the chloroplast NAD(P)H dehydrogenase complex. Biochim. Biophys. Acta (BBA)-Bioenerg. 2011, 1807, 945–953. [Google Scholar] [CrossRef] [PubMed]
  72. Wang, P.; Duan, W.; Takabayashi, A.; Endo, T.; Shikanai, T.; Ye, J.-Y.; Mi, H. Chloroplastic NAD(P)H dehydrogenase in tobacco leaves functions in alleviation of oxidative damage caused by temperature stress. Plant Physiol. 2006, 141, 465–474. [Google Scholar] [CrossRef] [PubMed]
  73. Grosjean, N.; Le Jean, M.; Berthelot, C.; Chalot, M.; Gross, E.M.; Blaudez, D. Accumulation and fractionation of rare earth elements are conserved traits in the Phytolacca genus. Sci. Rep. 2019, 9, 18458. [Google Scholar] [CrossRef]
  74. Avise, J.C.; Johns, G.C. Proposal for a standardized temporal scheme of biological classification for extant species. Proc. Natl. Acad. Sci. USA 1999, 96, 7358–7363. [Google Scholar] [CrossRef] [PubMed]
  75. Tamura, K.; Battistuzzi, F.U.; Billing-Ross, P.; Murillo, O.; Filipski, A.; Kumar, S. Estimating divergence times in large molecular phylogenies. Proc. Natl. Acad. Sci. USA 2012, 109, 19333–19338. [Google Scholar] [CrossRef]
  76. Britten, R.J. Rates of DNA sequence evolution differ between taxonomic groups. Science 1986, 231, 1393–1398. [Google Scholar] [CrossRef] [PubMed]
  77. Allen, G.C.; Flores-Vergara, M.; Krasynanski, S.; Kumar, S.; Thompson, W. A modified protocol for rapid DNA isolation from plant tissues using cetyltrimethylammonium bromide. Nat. Protoc. 2006, 1, 2320–2325. [Google Scholar] [CrossRef] [PubMed]
  78. Bolger, A.M.; Lohse, M.; Usadel, B. Trimmomatic: A flexible trimmer for Illumina sequence data. Bioinformatics 2014, 30, 2114–2120. [Google Scholar] [CrossRef] [PubMed]
  79. Jin, J.-J.; Yu, W.-B.; Yang, J.-B.; Song, Y.; DePamphilis, C.W.; Yi, T.-S.; Li, D.-Z. GetOrganelle: A fast and versatile toolkit for accurate de novo assembly of organelle genomes. Genome Biol. 2020, 21, 241. [Google Scholar] [CrossRef] [PubMed]
  80. Luo, R.; Liu, B.; Xie, Y.; Li, Z.; Huang, W.; Yuan, J.; He, G.; Chen, Y.; Pan, Q.; Liu, Y. SOAPdenovo2: An empirically improved memory-efficient short-read de novo assembler. Gigascience 2012, 1, 18. [Google Scholar] [CrossRef]
  81. Tillich, M.; Lehwark, P.; Pellizzer, T.; Ulbricht-Jones, E.S.; Fischer, A.; Bock, R.; Greiner, S. GeSeq–versatile and accurate annotation of organelle genomes. Nucleic Acids Res. 2017, 45, W6–W11. [Google Scholar] [CrossRef]
  82. Carver, T.; Harris, S.R.; Berriman, M.; Parkhill, J.; McQuillan, J.A. Artemis: An integrated platform for visualization and analysis of high-throughput sequence-based experimental data. Bioinformatics 2012, 28, 464–469. [Google Scholar] [CrossRef]
  83. Lowe, T.M.; Chan, P.P. tRNAscan-SE On-line: Integrating search and context for analysis of transfer RNA genes. Nucleic Acids Res. 2016, 44, W54–W57. [Google Scholar] [CrossRef] [PubMed]
  84. Greiner, S.; Lehwark, P.; Bock, R. OrganellarGenomeDRAW (OGDRAW) version 1.3. 1: Expanded toolkit for the graphical visualization of organellar genomes. Nucleic Acids Res. 2019, 47, W59–W64. [Google Scholar] [CrossRef]
  85. Kearse, M.; Moir, R.; Wilson, A.; Stones-Havas, S.; Cheung, M.; Sturrock, S.; Buxton, S.; Cooper, A.; Markowitz, S.; Duran, C. Geneious Basic: An integrated and extendable desktop software platform for the organization and analysis of sequence data. Bioinformatics 2012, 28, 1647–1649. [Google Scholar] [CrossRef]
  86. Tamura, K.; Stecher, G.; Kumar, S. MEGA11: Molecular evolutionary genetics analysis version 11. Mol. Biol. Evol. 2021, 38, 3022–3027. [Google Scholar] [CrossRef]
  87. Babicki, S.; Arndt, D.; Marcu, A.; Liang, Y.; Grant, J.R.; Maciejewski, A.; Wishart, D.S. Heatmapper: Web-enabled heat mapping for all. Nucleic Acids Res. 2016, 44, W147–W153. [Google Scholar] [CrossRef] [PubMed]
  88. Beier, S.; Thiel, T.; Münch, T.; Scholz, U.; Mascher, M. MISA-web: A web server for microsatellite prediction. Bioinformatics 2017, 33, 2583–2585. [Google Scholar] [CrossRef] [PubMed]
  89. Benson, G. Tandem repeats finder: A program to analyze DNA sequences. Nucleic Acids Res. 1999, 27, 573–580. [Google Scholar] [CrossRef]
  90. Kurtz, S.; Choudhuri, J.V.; Ohlebusch, E.; Schleiermacher, C.; Stoye, J.; Giegerich, R. REPuter: The manifold applications of repeat analysis on a genomic scale. Nucleic Acids Res. 2001, 29, 4633–4642. [Google Scholar] [CrossRef]
  91. Frazer, K.A.; Pachter, L.; Poliakov, A.; Rubin, E.M.; Dubchak, I. VISTA: Computational tools for comparative genomics. Nucleic Acids Res. 2004, 32, W273–W279. [Google Scholar] [CrossRef]
  92. Brudno, M.; Malde, S.; Poliakov, A.; Do, C.B.; Couronne, O.; Dubchak, I.; Batzoglou, S. Glocal alignment: Finding rearrangements during alignment. Bioinformatics 2003, 19, i54–i62. [Google Scholar] [CrossRef] [PubMed]
  93. Rozas, J.; Ferrer-Mata, A.; Sánchez-DelBarrio, J.C.; Guirao-Rico, S.; Librado, P.; Ramos-Onsins, S.E.; Sánchez-Gracia, A. DnaSP 6: DNA sequence polymorphism analysis of large data sets. Mol. Biol. Evol. 2017, 34, 3299–3302. [Google Scholar] [CrossRef] [PubMed]
  94. Yang, Z. PAML 4: Phylogenetic analysis by maximum likelihood. Mol. Biol. Evol. 2007, 24, 1586–1591. [Google Scholar] [CrossRef] [PubMed]
  95. Wickham, H.; Chang, W.; Wickham, M.H. Package ‘ggplot2’: Create Elegant Data Visualisations Using the Grammar of Graphics. Version 2016, 2, 1–189. [Google Scholar]
  96. Katoh, K.; Standley, D.M. MAFFT multiple sequence alignment software version 7: Improvements in performance and usability. Mol. Biol. Evol. 2013, 30, 772–780. [Google Scholar] [CrossRef] [PubMed]
  97. Castresana, J. Selection of conserved blocks from multiple alignments for their use in phylogenetic analysis. Mol. Biol. Evol. 2000, 17, 540–552. [Google Scholar] [CrossRef] [PubMed]
  98. Darriba, D.; Taboada, G.L.; Doallo, R.; Posada, D. jModelTest 2: More models, new heuristics and high-performance computing. Nat. Methods 2012, 9, 772. [Google Scholar] [CrossRef]
  99. Huelsenbeck, J.P.; Ronquist, F. MRBAYES: Bayesian inference of phylogenetic trees. Bioinformatics 2001, 17, 754–755. [Google Scholar] [CrossRef]
  100. Drummond, A.J.; Rambaut, A. BEAST: Bayesian evolutionary analysis by sampling trees. BMC Evol. Biol. 2007, 7, 214. [Google Scholar] [CrossRef]
  101. Rambaut, A.; Drummond, A.J.; Xie, D.; Baele, G.; Suchard, M.A. Posterior summarization in Bayesian phylogenetics using Tracer 1.7. Syst. Biol. 2018, 67, 901–904. [Google Scholar] [CrossRef] [PubMed]
  102. Rambaut, A. Figtree; Version 1.4.4; Institute of Evolutionary Biology, University of Edinburgh: Edinburgh, UK, 2018. [Google Scholar]
Figure 1. Habitat and morphology of Phytolacca species in Korean natural population. (AC) Phytolacca acinosa, (DF) P. americana, (A,D) habit, (B,F) inflorescences, and (C,E) infructescence.
Applsci 15 00593 g001
Figure 2. Circular chloroplast genome map of Phytolacca acinosa. Genes inside the circle are transcribed clockwise, while genes outside the circle are transcribed counterclockwise. The small circle around the map indicates the large single-copy (LSC) and small single-copy (SSC) regions, as well as the two inverted repeat (IR) regions. The dark gray graph inside represents the GC content of the chloroplast genome.
Applsci 15 00593 g002
Figure 3. Distribution of repeat sequences in the chloroplast genome of Phytolacca acinosa. (A) Number of SSR repeats by large single-copy (LSC), small single-copy (SSC), and inverted repeat (IR) regions. (B) Number of SSRs distributed across exon, intron, and intergenic spacer (IGS) regions. (C) Frequency of six different SSR types. (D) Distribution of tandem repeats in LSC, SSC, IR, exons, intron regions, and IGSs. (E) Distribution of tandem repeats by length in six Phytolacca species. (F) Frequency of different repeat types in the chloroplast genome.
Applsci 15 00593 g003
Figure 4. Comparison of the complete chloroplast genomes of six Phytolacca species using mVISTA. Sequence variations between genomes are highlighted by white bars, while regions of sequence identity are indicated on a scale from 50% to 100%. Forward and reverse transcription of genes are indicated by gray arrows. Exonic regions are shown by purple bars, conserved non-coding sequences by pink bars, and green markings below the bars indicate the inverted repeat (IR) regions.
Applsci 15 00593 g004
Figure 5. Comparison of nucleotide diversity (Pi) values among six Phytolacca species. The graphs depict the average nucleotide diversity (Pi) values for genes and intergenic spacers (IGS) across the chloroplast genomes of six Phytolacca species. Data points represent regions with Pi values above zero, indicating variability among species. Regions are organized by their genomic location, including the large single-copy (LSC), inverted repeat (IR), and small single-copy (SSC) regions.
Applsci 15 00593 g005
Figure 6. dN/dS ratios for NADH oxidoreductase genes across the six Phytolacca species. Boxplots represent the distribution of dN/dS values for NADH oxidoreductase genes in P. acinosa, P. insularis, P. polyandra, P. japonica, P. latbenia, and P. americana. Black dots represent the individual dN/dS values for specific genes. Comprehensive dN/dS values for all genes, including the NADH oxidoreductase genes, are provided in Table S6.
Applsci 15 00593 g006
Figure 7. Phylogenetic tree of the Phytolacca species based on Maximum Likelihood (ML) bootstrap and Bayesian Inference (BI) posterior probabilities, using Agdestis clematidea as the outgroup. Nodes with ML = 100 and BI = 1 unlabeled.
Applsci 15 00593 g007
Figure 8. Phylogenetic tree with divergence times estimated by the Bayesian model based on 76 protein-coding genes from 14 species of Phytolaccoideae and Agdestidoideae. At all nodes, the poster prior value is 1, and each node displays the average divergence time. The purple bar corresponds to the 95% highest posterior density (HPD).
Applsci 15 00593 g008
Table 1. Characterization of Phytolacca acinosa chloroplast genome.
SpeciesPhytolacca acinosa
Accession numberPQ584746
Total cp genome size (bp)156,433
Large single-copy (LSC) region (bp)86,120
Inverted repeat (IR) region (bp)25,989
Small single-copy (SSC) region (bp)18,335
Total number of genes (unique)113
Protein-coding gene (unique)79
rRNA (unique)4
tRNA (unique)30
GC content (%)36.8
LSC (%)34.6
IR (%)42.6
SSC (%)30.3
Disclaimer/Publisher’s Note: The statements, opinions and data contained in all publications are solely those of the individual author(s) and contributor(s) and not of MDPI and/or the editor(s). MDPI and/or the editor(s) disclaim responsibility for any injury to people or property resulting from any ideas, methods, instructions or products referred to in the content.

