Abstract
Cardiovascular diseases (CVDs) are the leading global cause of death, impacting nations worldwide. Despite medical advancements, managing patients who require temporary pacing (TP) after cardiac surgery remains challenging. TP devices are essential for stabilizing patients with unstable arrhythmias or post-surgical complications but demand manual adjustments and precise clinician management, unlike permanent pacemakers. There is an urgent need for improved TP training and standardisation, hindered by a lack of formal guidelines and adequate protocols. Existing simulators often omit crucial haemodynamic parameters and complex clinical scenarios, limiting their effectiveness. This paper introduces an advanced Temporary Cardiac Pacing Simulator (TCPS) that provides comprehensive physiological signals and complex scenarios for realistic training. It simulates various pacing modes—atrial, ventricular, and dual-chamber—while modeling pacing failures and haemodynamic changes. Sophisticated algorithms replicate clinical responses, offering real-time feedback and dynamic visualizations to enhance learning. Additionally, an innovative feature optimises atrioventricular (AV) delay settings, crucial for improving patient outcomes in both acute and postoperative care.
1. Introduction
Cardiovascular diseases (CVDs) remain a significant global health challenge, accounting for 32% of deaths worldwide, with over 20.5 million fatalities in 2021 and projections indicating a rise to 23 million by 2030 [1]. While advancements in diagnostics, treatment, and public health initiatives have significantly reduced CVD-related mortality in high-income countries like the UK—where deaths have declined by 75% since 1961—CVDs still cause 27% of deaths, with a concerning increase in incidence among younger populations [2].
Temporary cardiac pacing (TP) devices are essential in managing various cardiac conditions, particularly in emergency situations where the heart’s natural pacemaker fails to maintain an adequate rhythm. These devices are critical for initiating myocardial contractions and preserving appropriate cardiac output in patients with haemodynamically unstable arrhythmias or following cardiac surgery, serving either as a therapeutic measure or as a bridge to permanent pacemaker (PPM) implantation. By delivering electrical impulses to the heart via leads connected to the myocardium, TP devices provide crucial support in acute cases such as bradycardia or heart block, preventing serious complications including heart failure, syncope, or sudden cardiac arrest. However, unlike PPM devices, which are fully automated and implanted for long-term use, TP devices require manual adjustments, and their effectiveness is highly dependent on the precise configuration of their settings in relation to the patient’s condition.
Cardiologists and nurses play a critical role in the initial programming and ongoing management of TP devices in the operating theatre and intensive care units (ICUs). Therefore, it is crucial that they have a comprehensive understanding of TP modes, intervals, and the potential complications that can arise following cardiac surgery [3]. Despite the widespread use and significance of TP devices, particularly in the postoperative management of cardiac surgery patients, there is a notable lack of formal guidelines and standardised training programmes for TP setting and patient management, both in the UK and globally [4,5,6].
The absence of automated systems for sensitivity and output threshold checks, coupled with the reliance on manual adjustments, increases the risk of complications associated with TP. Such complications can have severe consequences, including life-threatening arrhythmias [3]. Moreover, the lack of clear, standardised guidelines means that TP procedures are often performed by medical staff from various disciplines with varying levels of experience, leading to inconsistencies in care and potentially suboptimal patient outcomes.
Studies have shown that the use of TP is associated with worse survival rates and higher risks of complications compared to permanent pacing systems [7,8]. British research has revealed that complications and issues arise in approximately one-third to half of all cases involving TP, with operator inexperience being a significant contributing factor [9]. These concerns are echoed globally. For instance, Ayerbe et al. [4] highlight that TP is frequently employed in urgent, high-risk situations, yet training for these procedures remains inconsistent. Other studies from Italy [5,6] further underscore the inconsistencies in the management of TP. Moreover, Timperley et al. [10] point out that current recommendations for TP are largely based on clinical consensus rather than robust trial data.
The inherent instability of TP, especially given the unpredictable haemodynamic status of patients post-cardiac surgery, requires frequent and precise adjustments to the pacing settings. However, the availability of training to equip medical staff with the necessary skills to optimise TP settings is limited. This training gap is reflected in the declining number of TP procedures being performed and the increasing reliance on haemodynamically suboptimal pacing modes [9]. Recent research highlights the need for a more sophisticated approach to TP management. For instance, Ng et al. [8] analysed outcomes from 4838 patients requiring transvenous TP and found a 46% decline in TP use over a 12-year period, indicating that learning opportunities are becoming increasingly scarce. Additionally, patients admitted on weekends had worse outcomes than those admitted on weekdays, likely due to less experienced medical staff managing TP procedures during weekends.
Current training methods, which primarily involve PowerPoint presentations, electrocardiogram (ECG) examples, and observational teaching, are insufficient to prepare clinicians for the complexities of managing TP devices. The lack of access to advanced simulators that can replicate the haemodynamic changes associated with different TP settings further exacerbates this issue, leaving clinicians inadequately prepared to handle real-world scenarios [11,12]. Simulators currently available, such as PacerMan, Pacing Simulator AA-550, and CardiSim, have limitations—they focus on wire placement and basic threshold programming, do not support training in dual-chamber pacing modes, and lack the capability to simulate haemodynamic changes. Although some newer tools, like the Epicardio temporary pacing simulator, offer more features, they still fall short by not including haemodynamic parameters, which are critical for comprehensive training and patient management.
Given these limitations, there is a pressing need for the development of an advanced pacing simulator capable of integrating a comprehensive range of physiological signals. Such a simulator would allow for the accurate simulation of diverse clinical scenarios, including arrhythmias, pacing failures, and haemodynamic changes induced by modifications in TP settings. It should be equipped to trigger alarms, provide real-time feedback, and simulate rare failures and scenarios for which data is typically scarce or unavailable. This would significantly enhance the preparedness of healthcare professionals, enabling them to deliver optimal care in both routine and emergency situations.
Therefore, the aim of this study is to develop a sophisticated TP simulator that can simulate a wide range of clinical scenarios and incorporate all relevant physiological signals. By addressing these gaps in training and standardisation, this research aims to contribute to safer and more effective TP practices across healthcare systems. In this paper, we introduce the temporary cardiac pacing simulator (TCPS) system, an intelligent, complex, and interactive training tool capable of replicating the electrical and haemodynamic impact of TP across a range of clinical scenarios, including critical situations that require clinician intervention. By using this tool, clinical staff will be able to learn and acquire the necessary skills for the management of TP, understand the risks and device complications associated with inappropriate settings, and appreciate the potential haemodynamic improvements that can be achieved with optimal programming.
2. Materials and Methods
This section presents the development of algorithms designed to simulate various TP scenarios, including the effects of different pacing modes and their corresponding failures on the morphology of ECG, arterial line blood pressure (ABP), and central venous pressure (CVP) signals; signals that are analysed during TP therapy. It also introduces the multimodal cardiovascular dataset utilised in this project, which comprises of simultaneous ECG, ABP, and CVP signals from patients undergoing TP therapy. This dataset serves as the cornerstone for the TCPS system, driving advancements in both clinical training and cardiac pacing tools.
2.1. Data Collection
The development of the TCPS system required a unique dataset comprising simultaneous ECG, ABP, and CVP signals from post-cardiac surgery patients connected to a TP device. Data collection for this project was carried out at Harefield Hospital, London.
The dataset included baseline, safety, and hemodynamic data from the most common post-surgical conditions in a total of 29 patients, 25 of whom were connected to a TP device. Among these 25 patients, ages ranged from 26 to 80 years, with a mean age of 64 years. Of the 25 patients, 20 were male and 5 were female. The BMI of the patients ranged from 18.34 to 41.21, with a mean BMI of 28.03. The dataset comprised baseline observational data in digital form—ECG, ABP, and CVP signals, paced safety data during the adjustment of thresholds and sensitivity, and data during the optimisation of the atrioventricular (AV) time delay. Invasive blood pressure was transduced from the right radial artery and the right superior vena cava using Edwards Lifesciences TruWave pressure transducers. ECG signals were taken using a Boston Scientific Labsystem Pro electrophysiology recording system. Digital to analog conversion occurred with a National Instruments DAQ card and LabVIEW NXG 1.0 software (National Instruments, Austin, TX, USA).
Patients over 18 years undergoing open cardiac surgery at Harefield Hospital, with any level of left ventricular function were considered eligible for the trial, provided they were able to give informed consent. All eligible participants were given comprehensive verbal and written information about the study, and written informed consent was obtained prior to enrollment. Ethical approval was obtained from the South West—Cornwall & Plymouth Research Ethics Committee and the Health Research Authority (HRA) under reference 21/SW/0051 (IRAS 292373).
2.2. System Overview
The TCPS system was developed in two distinct phases. The first phase involved constructing all the necessary functions to simulate pacing scenarios and various changes in signal morphology for different TP settings. These functions, which form the back-end of the TCPS system, include methods developed in previous works of our group as well as new ones introduced in this section. The second phase focused on building the front-end interface, which encompasses creating the buttons, dynamic plots, and all possible user scenarios.
The back-end of the TCPS system comprises a set of algorithms designed to process baseline patient signals. These algorithms take inputs such as pacing mode, pacing rate, and failure modes, and synthetically modify the signals to reflect the specified settings. These functions are illustrated in Figure 1, within the “Generate Signal” block.
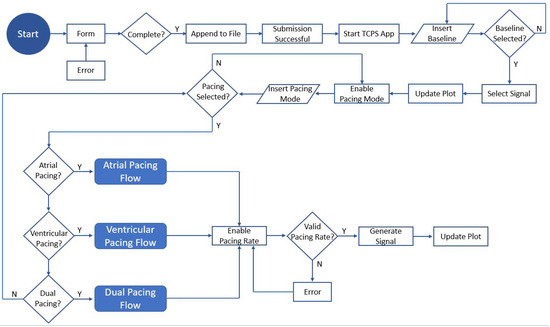
Figure 1.
Flowchart diagram of the TCPS user interface.
The front-end of the TCPS system features a GUI developed using the Tkinter library in Python 3.7. This interactive and user-friendly platform is accessible to users without coding experience, enabling them to learn the necessary skills for configuring TP devices. The GUI allows users to select various parameters, including baseline rhythm, pacing mode, pacing rate, capture threshold, sensitivity, and optimal AV delay. Based on these selections, the program determines which signals to display.
The main steps of the GUI are illustrated in Figure 1, where different shapes represent various elements and actions within a process. An oval or rounded rectangle signifies the start or end of the process. Rectangles denote actions or tasks to be performed. Diamonds represent decision points, indicating a branching based on yes/no or true/false conditions. Parallelograms are used for inputs and outputs, while arrows illustrate the flow direction between these elements. Circles or small connectors often indicate continuation points within the flowchart, especially when connecting separate parts of the diagram.
The simulator starts with a welcome message, introducing the user to the TCPS system, and a “Start” button. When the user clicks the “Start” button, the window updates to display fields where the user must submit their details (Figure 2 and Figure 3). Upon clicking the submit button, a function verifies if all fields have been completed. If completed, a message box confirms the successful submission of the information. Otherwise, an error message prompts the user to complete all fields. Once the submission is successful, the simulation app initialises, displaying a window that shows the real-time selected signals on the left-hand side and the TP parameter settings on the right-hand side, as illustrated in Figure 4.

Figure 2.
The TCPS welcome window.
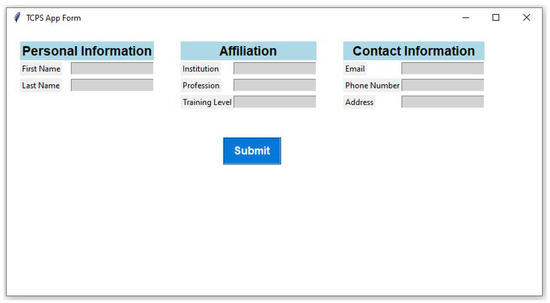
Figure 3.
The TCPS form window, where each user will have to add their details in order to use the TCPS app.
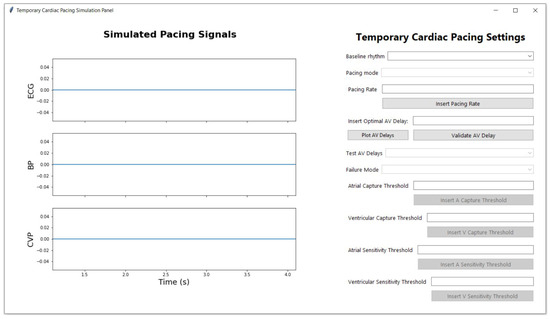
Figure 4.
The main window of the TCPS panel before the user starts the TP settings selection.
Initially, all buttons are disabled except the baseline dropdown button. Once a baseline signal is selected, a function searches through the database for a patient with that baseline condition, updates the dynamic plot, and displays the signal on the left-hand side. The plot updates with new data points at every second, giving the impression that the signal is moving. The pacing mode dropdown button is then enabled, allowing the user to choose from the following pacing modes: ventricular asynchronous pacing (VOO), atrial asynchronous pacing (AOO), ventricular pacing and sensing (VVI), atrial pacing and sensing (AAI), dual asynchronous pacing (DOO), and ual pacing and sensing with inhibited response in one chamber (DDI). Upon selecting a pacing mode, a function modifies the patient’s baseline signal according to the chosen pacing mode. The pacing flow, which differs depending on whether the mode is atrial, ventricular, or dual, determines the next steps. These pacing flows—atrial pacing flow, ventricular pacing flow, and dual pacing flow—each follow specific stages and parameters, which will be explained in detail later in this section. After the pacing mode is adjusted for these flows, the pacing rate button is enabled, allowing the user to input a pacing rate. The pacing signal updates based on the selected pacing mode and the pacing rate provided by the user. If the pacing rate falls outside the valid range (below 40 or above 130), the system displays an error message, prompting the user to enter a valid value. The user can choose to skip introducing a pacing rate value and proceed to set capture and sensitivity thresholds present withing the atrial, ventricular or dual pacing flows. These buttons will be enabled and disabled depending on the type of pacing selected: atrial pacing, ventricular pacing, or dual pacing. Each mode has different functions and buttons for further choices, with corresponding failures and feedback messages for each scenario. All the aforementioned settings, both front-end and back-end functions, are described in detail in the subsequent sections of this paper. A short representation of the TCPS system can also be seen in the video attached in the Supplementary Materials Video S1.
2.3. Generation of Pacing Modes Using Algorithms
This section describes the back-end functions of the TCPS system used to simulate ventricular, atrial, and dual pacing modes.
2.3.1. Ventricular Pacing
Ventricular pacing is used to manage arrhythmias and support cardiac function in patients with impaired ventricular conduction or complete heart block. This subsection describes the back end algorithms used to simulate the following ventricular pacing scenarios: VVI and VOO.
To simulate different ventricular pacing modes, a specialised function was implemented to modify the original ECG, ABP, and CVP signals collected from patients’ baseline rhythms. This function incorporates pacing spikes and adjusts the intervals between heartbeats according to the specified pacing mode and pacing rate introduced by the user, effectively replicating the behaviors of various pacing modes.
The function begins by calculating the interval between heartbeats in terms of data points. This interval is determined based on the user-specified pacing rate and the sampling frequency of the signals. The R peaks and P waves of the ECG signals are then identified using the NeuroKit2 package [13]. Subsequently, the amplitude of the pacing spikes is calculated as one-third of the highest point of the ECG signal to ensure the spikes are proportional to the amplitude of the input signals. In the next stage, the function starts to simulate the selected ventricular pacing mode introduced by the user.
In practice, a TP in VVI mode monitors the heart’s natural rhythm and only delivers a pacing stimulus if it does not detect a heartbeat within a predefined interval. The code simulates this by ensuring pacing spikes are introduced at regular intervals unless intrinsic beats are detected and paced heartbeats are inhibited as needed. To create a realistic VVI scenario, where some pacing spikes are inhibited due to intrinsic conduction, we generate a list of random positions for the inhibited beats, referencing the total number of R peaks in the baseline signal and randomly selecting 20% of the R peak indices as locations for the inhibited beats. The function then iterates through the R peaks and adjusts the intervals between beats by resampling segments to match the pacing interval. When the heartbeats are inhibited, the pacing spikes are not generated and a shorter RR interval can be seen as a result of the intrinsic conduction. The pacing spikes are introduced before each segment using a function that takes the index position of the R peak as input. However, the positions of the inhibited segments do not get a pacing spike introduced and the code simulates intrinsic heartbeats by adding additional segments to lengthen the intrinsic heartbeat and TP wait time. It is important to note that we do not consider the inhibited beats when the pacing rate introduced by the user is lower than 70 bpm, as in patients following cardiac surgery, the intrinsic heart rate is often below 70 bpm.
In VOO mode, the pacing behavior in the code remains the same as in VVI, focusing on introducing pacing spikes at fixed intervals determined by the pacing rate, without considering the intrinsic ECG signal. VOO mode is typically employed when the TP is malfunctioning or in emergency situations where immediate ventricular pacing is necessary, as it can be rapidly deployed without the need for fine-tuning sensing parameters.
2.3.2. Atrial Pacing
Atrial pacing is used to manage arrhythmias and support cardiac function in patients with impaired atrial conduction or atrial fibrillation with slow ventricular response. This subsection describes the algorithms used to simulate the following atrial pacing scenarios: AAIand AOO.
Similar to ventricular pacing, a specialized function was implemented to modify the original ECG, ABP, and CVP signals collected from patients’ baseline rhythms. This function incorporates pacing spikes and adjusts the intervals between heartbeats according to the specified pacing mode and pacing rate introduced by the user, effectively replicating the behaviors of various pacing modes.
The function begins by calculating the interval between heartbeats in terms of data points. This interval is determined based on the user-specified pacing rate and the sampling frequency of the signals. The R peaks and P waves of the ECG signals are then identified using the NeuroKit2 package [13]. Subsequently, the amplitude of the pacing spikes is calculated as one-third of the highest point of the ECG signal to ensure the spikes are proportional to the amplitude of the input signals. In the next stage, the function starts to simulate the selected atrial pacing mode introduced by the user.
In practice, a TP in AAI pacing mode monitors the heart’s natural rhythm and only delivers a pacing stimulus if it does not detect a P wave within a predefined interval. The code simulates this by ensuring pacing spikes are introduced at regular intervals unless intrinsic beats are detected and paced heartbeats are inhibited as needed. To create a realistic AAI scenario, where some pacing spikes are inhibited due to intrinsic conduction, we generate a list of random positions for the inhibited beats, referencing the total number of P peaks in the baseline signal and randomly selecting 20% of the P peak indices as locations for the inhibited beats. The function then iterates through the P peaks and adjusts the intervals between beats by resampling segments to match the pacing interval. When the heartbeats are inhibited, the pacing spikes are not generated and a shorter PP interval can be seen as a result of the intrinsic conduction. The pacing spikes are introduced before each segment using a function that takes the index position of the P peak as input. However, the positions of the inhibited segments do not get a pacing spike introduced and the code simulates intrinsic heartbeats by adding additional segments to lengthen the intrinsic heartbeat and TP wait time. It is important to note that we do not consider the inhibited beats when the pacing rate introduced by the user is lower than 70 bpm, as in patients following cardiac surgery, the intrinsic heart rate is often below 70 bpm.
In AOO mode, the pacing behavior in the code remains the same as in AAI, focusing on introducing pacing spikes at fixed intervals determined by the pacing rate, without considering the intrinsic ECG signal. This mode is typically used in situations where sensing atrial activity is unnecessary or could lead to complications.
2.3.3. Dual Pacing
Dual pacing is used to coordinate atrial and ventricular pacing to ensure proper atrioventricular synchrony and support cardiac function in patients with various types of heart block or other conduction abnormalities. This subsection describes the algorithms used to simulate the following dual pacing scenarios: DOO and DDI.
To simulate dual pacing modes, a specialized function was implemented to modify the original ECG, ABP, and CVP signals collected from patients’ baseline rhythms. This function incorporates pacing spikes and adjusts the intervals between heartbeats according to the specified pacing mode and pacing rate introduced by the user, effectively replicating the behaviors of various pacing modes.
The function begins by calculating the interval between heartbeats in terms of data points. This interval is determined based on the user-specified pacing rate and the sampling frequency of the signals. The R peaks and P waves of the ECG signals are then identified using the NeuroKit2 package [13]. Subsequently, the amplitude of the pacing spikes is calculated as one-third of the highest point of the ECG signal to ensure the spikes are proportional to the amplitude of the input signals. In the next stage, the function starts to simulate the selected dual pacing mode introduced by the user.
In practice, a DDI TP monitors the heart’s natural rhythm and delivers pacing stimuli to both the atrium and ventricle, but it inhibits pacing if intrinsic beats are detected within predefined intervals. The code simulates this by ensuring pacing spikes are introduced at regular intervals unless intrinsic beats are detected and paced heartbeats are inhibited as needed. To create a realistic DDI scenario, where some pacing spikes are inhibited due to intrinsic conduction, we generate a list of random positions for the inhibited beats, referencing the total number of P and R peaks in the baseline signal and randomly selecting 20% of the P and R peak indices as locations for the inhibited beats. The function then iterates through the P and R peaks and adjusts the intervals between beats by resampling segments to match the pacing interval. When the heartbeats are inhibited, the pacing spikes are not generated, and shorter PP and RR intervals can be seen as a result of the intrinsic conduction. The pacing spikes are introduced before each segment using a function that takes the index position of the P and R peaks as input. However, the positions of the inhibited segments do not get a pacing spike introduced, and the code simulates intrinsic heartbeats by adding additional segments to lengthen the intrinsic heartbeat and TP wait time.
In DOO mode, the pacing behavior in the code remains focused on introducing pacing spikes at fixed intervals for both the atrium and ventricle, without considering the intrinsic ECG signals. This mode is typically used when asynchronous pacing is needed, such as during surgeries or in emergency situations where immediate dual-chamber pacing is necessary, and precise sensing is not critical. The code simulates this by ensuring pacing spikes are introduced at regular intervals for both chambers, effectively creating a consistent pacing rhythm that does not respond to intrinsic heartbeats. This allows for a straightforward and reliable pacing setup without the need for sensing adjustments, making it particularly useful in specific clinical scenarios where rapid deployment and stable pacing are required.
The adjusted ECG, ABP, and CVP signals generated by these function provide a realistic simulation of dual pacing scenarios, including the effects of various pacing failures, enabling thorough analysis and testing of TP algorithms and performance.
2.4. Generation of Pacing Failures Using Algorithms
In addition to simulating various pacing modes, the developed TCPS is capable of reproducing four different types of pacing failures: oversensing, undersensing, atrial loss of capture (ALOC), and ventricular loss of capture (VLOC).
TP undersensing occurs when the device fails to accurately detect the intrinsic electrical activity of the heart, leading to inappropriate pacing. This can manifest in different ways depending on the pacing mode. In VVI mode, the TP is designed to sense ventricular activity and inhibit pacing if it detects an intrinsic QRS complex. However, in the case of undersensing, the device fails to recognize the heart’s natural ventricular activity, leading to inappropriate pacing. This can result in pacing stimuli being delivered during periods when the heart’s natural rhythm is adequate, such as during the T-wave, which can be particularly dangerous. The simulation of undersensing in VVI mode involves deliberately introducing pacing spikes at inappropriate moments within the ECG signal, specifically during the T-wave. The T-wave represents the repolarization of the ventricles, and pacing during this phase could potentially lead to arrhythmias or other dangerous outcomes. By inserting pacing spikes during these periods, the TCPS mimics the TP’s failure to recognize the natural rhythm, demonstrating how it might incorrectly deliver pacing stimuli. In AAI mode, the TP is responsible for sensing atrial activity, specifically the P-wave, and inhibiting pacing if it detects an intrinsic P-wave. Undersensing in AAI mode occurs when the TP fails to detect these P-waves, leading to inappropriate pacing. This could result in pacing spikes being delivered during the intrinsic P-wave, when the atrium has already initiated its contraction. The simulation of undersensing in AAI mode involves introducing pacing spikes directly at the P-wave, simulating a failure to recognize atrial activity. Pacing during this period can disrupt the natural atrial contraction and lead to atrioventricular dyssynchrony. In DDI mode, the TP senses both atrial and ventricular activity and inhibits pacing in either chamber depending on the detected signals. Undersensing in DDI mode can lead to inappropriate pacing in the atrium or ventricle, depending on where the undersensing occurs. The TCPS is able to localize the undersensing, either in the atria or the ventricles. If undersensing occurs in the atria, pacing spikes are introduced during the intrinsic P-wave, similar to AAI mode. If undersensing occurs in the ventricles, pacing spikes are introduced during the T-wave, similar to VVI mode. By selectively inserting pacing spikes during these periods, the simulation demonstrates how the TP might fail to detect natural atrial or ventricular activity, leading to inappropriate pacing in the affected chamber. This could disrupt the natural atrioventricular sequence, increasing the risk of arrhythmias and other complications.
Oversensing occurs when the TP mistakenly interprets non-cardiac signals, such as muscle contractions or external electromagnetic interference, as intrinsic heart activity, leading to the inappropriate inhibition of pacing. This can result in pauses or even asystole, as the TP incorrectly withholds necessary pacing impulses. In the simulation, oversensing is handled differently depending on the location and pacing mode. When oversensing is detected in both the atria and ventricles in DDI mode, the simulation stops all pacing activity, reverting the ECG signal to its baseline state without any pacing spikes. This simulates a situation where the TP fails to deliver any pacing due to excessive sensitivity to non-cardiac signals, leading to a significant risk of pauses in the heart’s rhythm. In the case of atrial oversensing, the simulator continues to deliver normal pacing spikes in the ventricles but fails to deliver pacing spikes in the atria due to inappropriate inhibition. This is simulated by generating pacing spikes in the ventricles while atrial pacing is suppressed, leading to a potentially dangerous atrioventricular dissociation. Conversely, when oversensing occurs in the ventricles, the simulation continues to deliver normal pacing spikes in the atria but suppresses ventricular pacing. This is represented by the presence of pacing spikes in the atria without corresponding ventricular pacing, which can result in ineffective cardiac output and hemodynamic instability. These scenarios illustrate how oversensing can disrupt the normal pacing function of a TP, leading to potentially life-threatening pauses or ineffective pacing, depending on which chamber is affected.
Loss of capture in the ventricle and atria behaves differently depending on the pacing mode. Each pacing mode function integrates specific failure mechanisms to adapt to these scenarios. In ventricular pacing (VVI mode), VLOC indicates that the TP’s electrical impulse does not cause the heart to contract, visible as pacing spikes without subsequent QRS complexes on the ECG. The code simulates this by randomly inhibiting certain beats and adding a pacing spike before a segment lacking a corresponding QRS complex. In atrial pacing (AAI mode), ALOC indicates that the TP’s electrical impulse does not cause atrial contraction, visible as pacing spikes without subsequent P waves on the ECG. The code simulates this by randomly inhibiting certain beats and adding a pacing spike before a segment lacking a corresponding P wave. In dual pacing (DDI mode), ALOC is simulated similarly to AAImode, by introducing pacing spikes without subsequent P waves. VLOC in DDI mode is simulated by introducing pacing spikes without subsequent QRS complexes, creating a flat segment where the QRS complex should be.
By integrating these failure mechanisms within the corresponding pacing mode functions, the TCPS can accurately reproduce the behaviors of TP under various failure conditions. This capability is essential for the development and testing of pacing systems, providing a robust platform for simulating and analyzing different TP failure scenarios.
2.5. The Encapsulation of the Simulator on a User Interface
The user interface for the TCPS is developed using the Tkinter library in Python, providing a GUI for users to accommodate with the settings of the real TP device and be able to react quickly in real clinical scenarios. The interface is designed to facilitate the input of various parameters related to cardiac pacing and to display simulated signals accordingly. The following is a detailed description of the contents and actions of this user interface.
2.5.1. Welcome Window Initialization
Upon launching the application, the main window titled “Temporary Cardiac Pacing Simulation App” is initialized to welcome the user to the TCPS application. This window is centred on the screen using a function that calculates the appropriate x and y coordinates based on the screen’s width and height, ensuring that the window appears in the center of any device. This function is called with parameters specifying the window and its desired proportions. The background color is set to white, and the window gains focus upon initialization. A welcome message is displayed at the top, styled with a bold Helvetica font. Below the message, an image is displayed, as showed in Figure 2. If there is an error loading the image, an error message is printed in the console.
A start button is positioned at the bottom of the welcome window, which initiates the start app function when clicked, transitioning the user from the welcome window to the form window. The window is then updated with three main fields: personal information, affiliation, and contact information. To be able to use the TCPS platform, each user has to add their details such as first name, last name, institution, profession, training level, email, phone number and address, as illustrated in Figure 3. In the back end of the form window, a function has been developed for saving all the data into an external Excel file. The function first checks if the file already exists; if not, it writes the header row. Then, it appends the user data to the file. This function ensures that user information is recorded for future reference or analysis. If the user does not record the necessary data but clicks on the “Submit” button, an error message pops up to the screen with the message “Please fill in all fields” and it keeps coming up until the user fills in all the fields. Once all the fields are completed, an information message box comes out on the screen with the text “Your information has been saved”, assuring the user that their details have been saved successfully and activating the TCPS main panel window.
In summary, this section of the user interface is carefully designed to provide a seamless and visually appealing experience for users. It ensures that user data is collected efficiently and accurately, while the transition between the welcome, data form, and simulation panel windows is handled smoothly.
2.5.2. Main Simulation Panel Window Initialization
The main simulation panel window is initialised with a size of 1500 × 800 pixels and a white background, centered in the middle of the screen, similarly with the welcome window. The window is divided into two main sections: the left frame, which displays the simulated pacing signals, and the right frame, which contains the user input fields and controls (Figure 4).
The left frame is dedicated to displaying the ECG, ABP, and CVP signals. Using the matplotlib library [14], three subplots are created within a figure, each representing one of these signals. Initially, the plots display static signals of null values. However, as the user begins to select options from the right frame, the plots become dynamic, simulating real-time data monitoring. This visualization is crucial for understanding the impact of different pacing modes and parameters on cardiac function. The dynamic visualization is achieved through a process known as windowing, where a fixed-length segment of the signal is displayed at any given time. The key steps in this process are as follows:
- Window Definition: At each update, a new segment (or window) of the signal is defined. This window consists of a fixed number of data points, representing a short duration of the signal.
- Index Increment: The starting point of the window is incremented by a predefined number of data points, shifting the window forward along the signal. This incremental shift creates the appearance of a moving signal.
- Plot Clearing and Redrawing: Before plotting the new window, the current plot is cleared to remove the old data. The new segment of the signal is then plotted within the cleared axes.
- Canvas Redrawing: The canvas, which is the plotting area within the Tkinter interface, is redrawn to display the updated plot.
- Periodic Function Call: The program uses a periodic function call mechanism to ensure that the plot updates at regular intervals. This is typically set to one second, aligning with the real-time aspect of the simulation.
The dynamic plot provides real-time visual feedback to the user. As the user adjusts the pacing parameters, the plot responds immediately, updating the signals to reflect the changes. This real-time feedback is essential for understanding the effects of different pacing strategies on cardiac function.
The right frame contains several interactive elements for user inputs, structured in a logical sequence to guide the user through the setup process. These controls for the simulation, including dropdowns, entries, and buttons, are organized within several sub-frames, each holding related UI components for ease of layout and organization. The elements are as follows:
- Title and Styling: The title “Temporary Cardiac Pacing Settings” is displayed at the top of the right frame in bold and centered for emphasis.
- Baseline Rhythm Selection: The user selects the baseline rhythm from a dropdown menu. This input is essential as it influences the available pacing modes and signal baselines. The options include various rhythm types such as ‘A-tach 2:1 block’ (TAH), ‘AF’, ‘SR’, ‘SR with LBBB’, and ‘SR with VEs’.
- Pacing Mode Selection: Depending on the selected baseline rhythm, the user can choose a pacing mode from the dropdown menu, which includes options like ‘VVI’, ‘VOO’, ‘AAI’, ‘AOO’, ‘DDI’, and ‘DOO’. This selection determines the type of pacing to be simulated.
- Pacing Rate Input: A text entry field allows the user to input the desired pacing rate in bpm.
- Pacing Rate Validation: An adjacent button validates the entered rate, ensuring it falls within the acceptable range (bpm).
- Optimal AV Delay Input: Users can input an optimal AV delay value. There are buttons to plot AV delay data and validate the entered AV delay, providing feedback on whether the value is correct based on preloaded data.
- AV Time Delay Selection: A dropdown menu is available for selecting the AV time delay, with options ranging from 40 to 300 milliseconds. This field is enabled only for specific pacing modes that require an AV delay input.
- Failure Mode Selection: Users can select a failure mode from a dropdown menu, which includes options like ALOC, VLOC, undersensing, and oversensing. This selection is used to simulate different pacing failures and the failures are enabled or disabled depending on the selected pacing mode.
- Threshold Inputs: Four additional sections are provided for inputting atrial and ventricular capture and sensitivity thresholds. Each section includes a label, a text entry field, and a button to validate and apply the input. These thresholds help in simulating specific conditions related to the sensitivity and capture capabilities of the TP. similarly to the failure modes, the threshold buttons are enabled or disabled depending on the selected pacing mode.
The listed buttons have complex functions and interact with each other depending on the choices made by the user. Each element will be discussed in detail in the sections that follow.
2.5.3. Baseline Rhythm Dropdown
The baseline rhythm dropdown is a critical component of the TCPS interface. This dropdown allows users to select the underlying cardiac rhythm, which serves as the foundation for further simulation and analysis. The selection of a baseline rhythm initiates a series of processes that configure the simulation environment, ensuring that the visualized signals and pacing responses are accurate and relevant.
The baseline rhythm dropdown provides a list of predefined cardiac rhythms, such as SR, AF, SR with LBBB, and others. These rhythms represent different physiological conditions of the heart, each with distinct electrical activity patterns.
When a user selects a baseline rhythm from the dropdown, the following steps and processes are executed:
- Resetting to Default State: Upon selection, the simulation resets all global variables and user interface components to their default states. The reset includes clearing signal data arrays, resetting indices, and disabling irrelevant input fields that were introduced in earlier phases of the simulation process. This ensures that any previous settings or selections do not interfere with the new baseline rhythm configuration.
- Signal Selection: The program extracts the corresponding signal data for the selected baseline rhythm. This involves retrieving the baseline ECG, ABP, and CVP signals from our dataset. The signal extraction is based on the user-selected rhythm, ensuring that the displayed signals accurately reflect the chosen cardiac condition.
- Updating Pacing Mode Options: Depending on the selected baseline rhythm, the available pacing modes are updated. For instance, if the rhythm is AF, only ventricular pacing modes (such as VVI or VOO) may be relevant and therefore enabled. The dropdown for pacing modes is dynamically populated with the appropriate options, ensuring that the user can only select compatible pacing modes.
- AV Time Delay Options Update: If the selected baseline rhythm requires AV delay optimization, the program updates the AV delay options accordingly. It searches for available AV delay signals for the selected patient or similar patients with the same baseline rhythm. If no AV delay signals are found for the selected patient, the program may look for another patient with the same baseline rhythm to provide relevant AV delay options.
- Plot Initialization and Update: The program initializes the plot area with the extracted baseline signals. The ECG, ABP, and CVP signals are displayed in their respective subplots. The plot is configured to update dynamically, simulating real-time signal monitoring.
- User Feedback and Interaction: Throughout this process, the user receives immediate visual feedback as the plot updates to reflect the selected baseline rhythm. Any invalid selections or inputs trigger warning messages, guiding the user to make appropriate choices. This interactive feedback mechanism ensures a smooth and intuitive user experience, facilitating effective learning and analysis.
The baseline rhythm dropdown selection triggers a comprehensive series of actions that configure the simulation environment, ensuring accurate and relevant signal visualization.
2.5.4. Pacing Mode Dropdown
The pacing mode selection dropdown allows users to select different pacing modes, which dictate how the TCPS interacts with the heart to regulate its rhythm. The choice of pacing mode initiates a series of processes that configure the simulation environment, ensuring that the pacing signals, parameters, and visualizations are appropriately updated.
The pacing mode dropdown provides a list of available pacing modes, such as VVI, VOO, AAI, AOO, DDI, and DOO. Each pacing mode represents a specific strategy for pacing the heart, with distinct rules for sensing and pacing atrial and ventricular activity.
When a user selects a pacing mode from the dropdown, the following steps and processes are executed:
- Validation of Baseline Rhythm: The program first checks whether a baseline rhythm has been selected. If no baseline rhythm is chosen, the user is prompted to select one before proceeding with pacing mode selection. This ensures that pacing parameters are applied within the context of a defined cardiac condition.
- Updating Pacing Mode Options: Based on the selected baseline rhythm, the pacing mode dropdown is populated with relevant options. For example, certain pacing modes may be disabled if they are incompatible with the chosen baseline rhythm.
- Enabling/Disabling Input Fields: The selection of a pacing mode dynamically enables or disables various input fields and dropdowns related to pacing parameters. For instance, dual-chamber pacing modes (such as DDI or DOO) enable the AV delay dropdown, as these modes require synchronization between atrial and ventricular pacing. Input fields for pacing rate, capture thresholds, and sensitivity thresholds are also enabled or disabled based on the selected pacing mode. This ensures that users can only interact with relevant controls, minimizing the risk of invalid configurations.
- Interaction with AV delay dropdown: For dual-chamber pacing modes, the AV delay dropdown is set to ‘readonly’ to allow users to select an appropriate delay. This dropdown remains disabled for single-chamber pacing modes where AV delay is not applicable.
- Updating Failure Mode Options: The available failure modes are updated based on the selected pacing mode. Failure modes such as undersensing, oversensing, atrial loss of capture, and ventricular loss of capture are dynamically populated in the failure mode dropdown. This allows users to simulate and analyze specific pacing failures relevant to the chosen mode.
- Real-Time Feedback and Visualization: Upon selecting a pacing mode, the program retrieves the corresponding paced signals for ECG, ABP, and CVP from the predefined datasets. These signals are then plotted within the graphical interface, providing immediate visual feedback to the user.The plot area is updated dynamically, simulating real-time signal monitoring. This visualization helps users understand the impact of the selected pacing mode on cardiac function.
- Plot Update and Redrawing: The selected pacing mode influences the window of data displayed on the plot. The program ensures that the appropriate signals are plotted, clearing the previous data and updating the plot with the new signals. This process provides a clear and accurate representation of the pacing effects.
- User Guidance and Warnings: Throughout the process, the user receives real-time guidance and warnings. For instance, if an invalid pacing mode is selected, or if a required parameter is not set, the program displays warning messages, prompting the user to correct the input. This interactive feedback mechanism ensures a smooth and intuitive user experience, facilitating effective learning and analysis.
2.5.5. Pacing Flows and TP Thresholds Settings
In the sections above, we detailed the main steps and processes executed when a baseline rhythm and a pacing mode are selected. This section delves into the possible scenarios based on the selected pacing mode: atrial, ventricular, or dual pacing.
The pacing mode parameter is crucial in determining the subsequent steps and choices available to the user during the simulation. As shown in Figure 1, each pacing mode triggers different user paths within the simulator.
When the user selects AOO or AAI pacing modes, the user interface enables the atrial pacing flow path, illustrated in Figure 5. In AAI mode, all atrial elements of the interface are enabled. These elements include atrial sensitivity threshold failures such as undersensing and oversensing, atrial capture threshold failures such as ALOC, and the atrial capture and sensitivity flows. Users can directly select sensitivity and capture threshold failures to observe their real-time impact on ECG, ABP, and CVP signals. In AOO mode, only the atrial capture threshold failures and the atrial capture threshold flow are enabled. This is due to the specific relevance of these functions to AOO pacing mode.
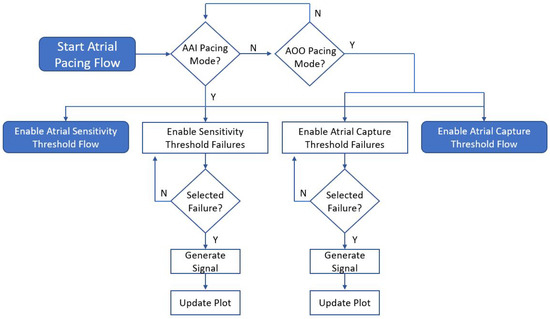
Figure 5.
The Atrial Pacing Flow—This flowchart illustrates the sequence of steps and choices a user can make when selecting an atrial pacing mode. In AAI mode, all elements are enabled, whereas in AOO mode, only the atrial capture threshold failures and atrial capture threshold flow are enabled.
When the user selects VOO or VVI pacing modes, the interface enables the ventricular pacing flow path as illustrated in Figure 6. In VVI mode, all ventricular elements of the interface are enabled. These elements include ventricular sensitivity threshold failures such as undersensing and oversensing, ventricular capture threshold failures such as VLOC, and the ventricular capture and sensitivity flows. Users can directly select sensitivity and capture threshold failures to see their effects on ECG, ABP, and CVP signals in real-time. In VOO mode, only the ventricular capture threshold failures and the ventricular capture threshold flow are enabled, as these are the functions pertinent to VOO pacing mode.
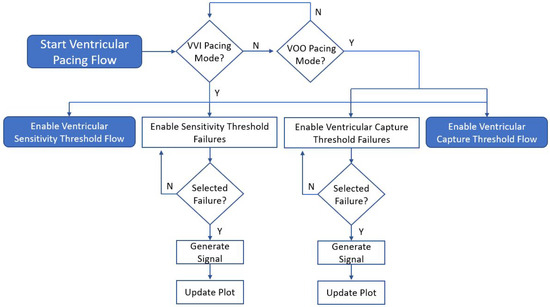
Figure 6.
The Ventricular Pacing Flow—This flowchart illustrates the sequence of steps and choices a user can make when selecting a ventricular pacing mode.
When the user selects DDI or DOO pacing modes, the interface enables the dual pacing flow path, illustrated in Figure 7. In DDI mode, all elements of the interface are enabled. These elements include sensitivity and capture threshold failures for both atrial and ventricular pacing, all capture and sensitivity flows for comprehensive simulation, and the AV delay flow, which incorporates settings to simulate the synchronization between pacing the atria and the ventricles. In DOO mode, only the capture threshold failures, and atrial and ventricular pacing flows are enabled. This is due to the specific requirements of the DOO pacing mode.
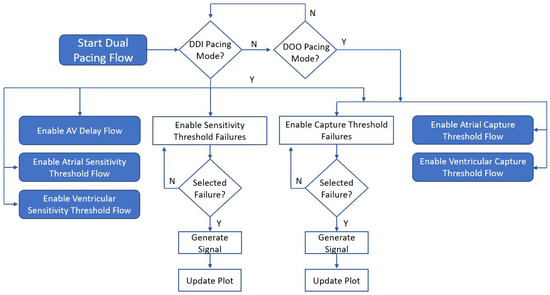
Figure 7.
The Dual Pacing Flow—This flowchart illustrates the sequence of steps and choices a user can make when selecting a dual pacing mode.
The sensitivity, capture, and AV delay flows are explained in detail in the sections below. This comprehensive approach ensures that users can explore the full range of pacing scenarios and their implications, enhancing their understanding and training in temporary cardiac pacing.
2.5.6. Capture Thresholds
In this section, we describe the implementation of capture thresholds and failure mode handling in the cardiac pacing simulation panel. These features are crucial for simulating realistic TP behavior, as they ensure that the system can dynamically respond to varying capture thresholds and failure scenarios.
When the user selects the capture thresholds for the cardiac pacing simulation, the system dynamically generates minimal capture thresholds to ensure realistic TP behavior, following the steps illustrated in Figure 8. These thresholds represent the minimum amount of electrical energy required to consistently depolarize the myocardium and produce a paced heartbeat. We generated minimal capture thresholds for both atrial and ventricular pacing using random values within a specified range. Specifically, for atrial capture, the minimal threshold is set as a random value between 0.5 and 1.5 volts (V). The same approach is used to generate the minimal capture threshold for ventricular capture. This randomness ensures that each simulation run presents a unique and realistic scenario, thereby enhancing the robustness of the simulation.
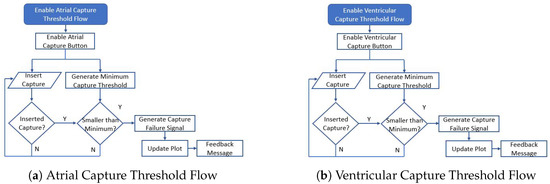
Figure 8.
The Capture Threshold Flows- This flowchart illustrates the sequence of steps and choices a user can make when testing the capture threshols for both atria and ventricles.
If the user inputs a value smaller than the minimal atrial capture threshold, the system identifies this as capture failure, in this case ALOC, and updates the pacing mode dropdown accordingly. Similarly, if the user inputs a value smaller than the minimal ventricular capture threshold, it is recognized as VLOC, and the pacing mode dropdown is adjusted to reflect this failure mode. In both scenarios, a warning message is displayed to inform the user of the issue. If the values are not smaller than the capture thresholds, then the user can keep inserting values and the plot will not be updated, as the atria or ventricles will keep being captured with that voltage. This validation and feedback mechanism ensures that the simulation accurately represents potential clinical conditions, enhancing the educational and practical value of the TCPS system.
2.5.7. Sensitivity Thresholds
When the user selects the sensitivity thresholds for the cardiac pacing simulation, the system dynamically generates minimal and maximal sensitivity thresholds to reflect the variability encountered in clinical practice, as illustrated in Figure 9. For atrial sensitivity, the minimal threshold is randomly set between 0.5 and 2 millivolts (mV), while the maximal threshold ranges from 1.5 to 3 mV. Similarly, for ventricular sensitivity, the minimal threshold is set between 0.5 and 2 mV, and the maximal threshold between 1.5 and 3 mV. This randomness ensures that each simulation run presents a unique and realistic scenario, thereby enhancing the robustness of the simulation.
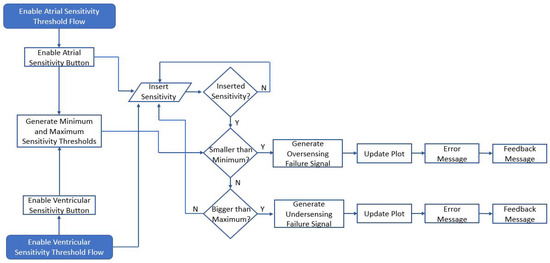
Figure 9.
Sensitivity Threshold Flowchart: This diagram illustrates the sensitivity flows for both atrial and ventricular responses. Each flow triggers the activation of its respective sensitivity buttons—atrial or ventricular.
If the user inputs a value smaller than the minimal atrial sensitivity threshold, the system recognizes this as “oversensing” and updates the pacing mode dropdown to indicate this failure mode. Similarly, if the user inputs a value smaller than the minimal ventricular sensitivity threshold, it is recognized as oversensing, and the pacing mode dropdown is adjusted to reflect this failure mode. Conversely, if the user inputs a value larger than the maximal atrial sensitivity threshold, the system considers it as undersensing, and updates the pacing mode dropdown accordingly. The same logic applies to the ventricular sensitivity threshold. In both oversensing and undersensing scenarios, a warning message is displayed to inform the user of the issue.
This dynamic validation and feedback mechanism ensures that the simulation accurately represents potential clinical conditions, enhancing both the educational and practical value of the TCPS system. By dynamically adjusting sensitivity thresholds and providing immediate feedback through failure modes and warnings, the simulation more accurately reflects clinical scenarios. This approach improves user understanding, enhances training by allowing medical professionals to practice identifying and correcting oversensing and undersensing conditions in a controlled environment, and promotes safe practices by emphasizing the importance of correct sensitivity settings to ensure better patient outcomes.
In summary, the implementation of sensitivity thresholds significantly enhances the realism and educational value of the cardiac pacing simulation panel, making it a valuable tool for both education and clinical training.
2.5.8. Managing AV Delay in Dual-Chamber Pacing Modes
When a user selects the DDI or DOO pacing modes, specific steps are executed to manage the AV delay (Figure 10), which is crucial for simulating temporary TP behavior and atrioventricular synchronization.
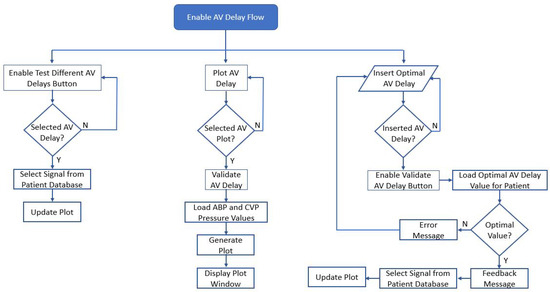
Figure 10.
AV Delay Flowchart—This diagram illustrates the AV delay functions and buttons that are enabled when the user chooses a DDI pacing mode.
Once DDI or DOO is chosen, the user is provided with the option to select or input an AV delay. This step ensures that the user can proceed with configuring the AV delay. The TCPS then searches for available AV delay signals for the selected patient. If such signals are found, they are listed as options in the AV delay dropdown. If no AV delay signals are available for the selected patient, the system attempts to find another patient with the same baseline rhythm to retrieve the necessary AV delay signals.
When an AV delay is selected from the dropdown, the system updates the ECG, ABP, and CVP signals according to the chosen AV delay. Once the AV delay signals are set, the pacing mode dropdown is disabled, preventing the user from changing the pacing mode without resetting the system. The system periodically updates the display of ECG, ABP, and CVP signals, ensuring that the signals are coherently displayed on the plot. When an AV delay is set, the updated paced signals are used instead of the baseline signals. This maintains alignment and accuracy in the display. For DDI and DOO modes, the system ensures that both atrial and ventricular pacing are coordinated according to the selected AV delay. This synchronization is critical for maintaining effective cardiac output and mimicking real TP behavior.
The proper AV delay is essential in dual-chamber pacing (DDI and DOO) to coordinate the timing between atrial and ventricular contractions, optimizing cardiac efficiency and output. The ability to choose and simulate different AV delays allows the system to realistically mimic clinical scenarios, helping users understand the impact of AV delay adjustments on hemodynamic parameters. The system’s design to disable certain controls once AV delay is set prevents conflicting inputs, guiding the user through a logical sequence of steps and ensuring the pacing mode configuration is coherent and clinically relevant. This simulation teaches users about the importance of AV delay in pacing therapy and how different pacing modes interact with intrinsic cardiac activity, providing hands-on experience in a controlled environment.
Overall, these steps contribute to a robust and educational simulation of temporary TP behavior, highlighting the critical role of AV delay in dual-chamber pacing modes.
3. Experimental Results
This section comprehensively describes the different pacing and failure scenarios simulated by the TCPS system, illustrating the impact of various settings on ECG, ABP, and CVP signals. Each subsection includes images of the simulated signals under different conditions, along with detailed explanations of how these conditions affect signal morphology. This section emphasizes the system’s ability to accurately replicate real clinical scenarios and provide insights into the behavior of temporary pacing devices.
3.1. Pacing Modes Scenarios
In this subsection, we present a detailed analysis of the various pacing modes simulated by the TCPS. Understanding the behavior of different pacing modes is crucial for clinicians as it helps them manage TP patients effectively. Each pacing mode influences cardiac signals differently depending on their baseline rhythm, and the TCPS provides a realistic and interactive platform to visualize these effects.
Figure 11 illustrates a snapshot of the user interface when the user selects a baseline rhythm, specifically the SR rhythm. As described in the previous sections, upon selecting the baseline signal, the interface searches the patient database for a patient with the chosen baseline rhythm and displays it on the screen. The dynamic plot of the interface simulates real-time physiological signal monitoring, continuously updating to reflect changes in pacing parameters and conditions. The snapshot in Figure 11 captures the signal in the interval from 2 to 5.5 s, but this display starts showing the signal from zero to the end duration of the signal.
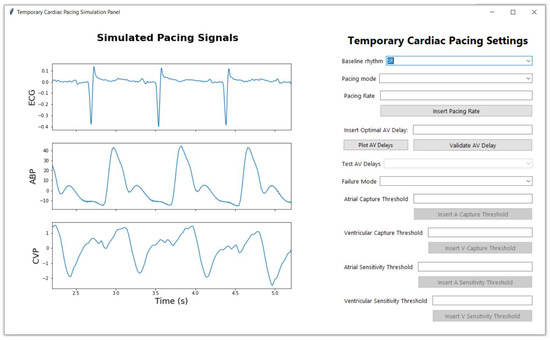
Figure 11.
Example of signal displayed when the user chooses the baseline signals, in this case SR rhtyhm.
Figure 12 illustrates the same signal shown in Figure 11 when the user chooses to pace it in VVI mode. As described in Section 2.3.1, the baseline signal undergoes synthetic changes to accommodate the new setting added by the user. In VVI mode, the signal is paced in the ventricle; therefore, pacing spikes can be seen before each QRS complex of the ECG signal. The ABP and CVP signals adapt in synchrony with the ECG signal, as expected. By default, the pacing rate is set to 80 bpm. However, if a pacing rate lower than 70 bpm is set, the signal interface simulates the inhibition of VVI by suppressing the pacing spikes and displaying a longer RR interval, which simulates a real scenario. Figure 13 shows a case of generated VVI with inhibited heartbeats where the first heartbeat is paced, but the rest of the signal represents the intrinsic heartbeat. The first RR interval is short, meaning the TP simulator sensed ventricular activity and inhibited pacing when the synthetically generated ventricular beat was detected within the programmed interval. However, the second RR interval is longer, indicating that the TP is prolonging the RR interval to ensure it does not interfere with the intrinsic rhythm, allowing the patient’s heart to recover. The long ABP waveform during this prolonged RR interval reflects the heart’s compensatory mechanism to maintain blood pressure despite the slower heart rate. The baroreceptors in the arterial system help regulate vascular tone to maintain adequate perfusion during periods of slower heart rates.
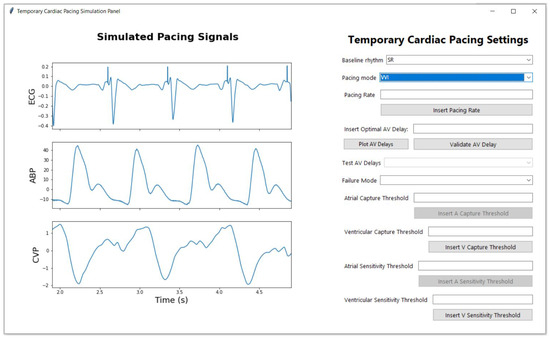
Figure 12.
Example of the signal displayed when the user selects the baseline signal, in this case, SR, and chooses the VVI pacing mode.
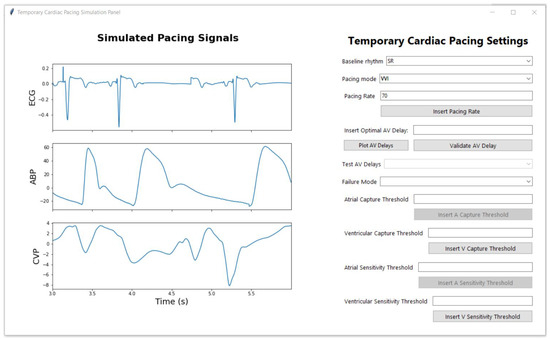
Figure 13.
Example of the signal displayed when the user selects the baseline signal, in this case, SR, and chooses the VVI pacing mode with a pacing rate under 70 bpm, causing the intrinsic conduction to show on the signals and the inhibition of the pacing spikes in the ventricle, where intrinsic conduction occurs.
Similar to the VVI pacing mode, in the AAI pacing mode, the TP is set to sense atrial activity and inhibit pacing if a natural atrial beat is detected within the programmed interval. The pacing spikes are not visible in Figure 14, indicating that the TP is in the inhibited mode due to the detection of natural atrial activity, which is in fact synthetically generated using the developed algorithms. The ECG signal shows natural P-waves followed by QRS complexes, indicating that the heart’s natural atrial activity is being detected and no pacing spikes are required. The ABP signal exhibits regular pressure peaks corresponding to each heartbeat, suggesting effective ventricular contractions resulting from naturally conducted atrial impulses. The CVP signal also appears regular and stable, indicating proper atrial contraction and efficient blood return to the heart.
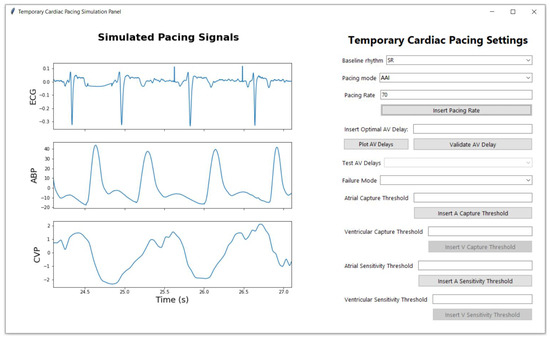
Figure 14.
Example of the signal displayed when the user selects the baseline signal, in this case, SR, and chooses the AAI pacing mode.
In the DDI pacing mode, the generated signals show pacing capture in both the atria and the ventricles, as illustrated in Figure 15. Pacing spikes are present before each atrial capture, indicated by the P waves, and before each ventricular capture, indicated by the QRS complexes. In this scenario, the pacing rate was set to 100 bpm, which results in more beats being displayed within the same time frame compared to previous plots. Similar to the VVI and AAI pacing modes, when a pacing rate smaller than 70 bpm is introduced by the user, we can see the atrial and ventricular pacing spikes being inhibited and a longer RR interval following the inhibited heartbeat, as shown in Figure 16.
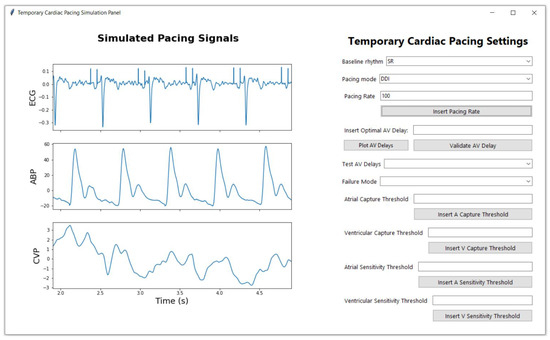
Figure 15.
Example of the signal displayed when the user selects the baseline signal, in this case, SR, and chooses the DDI pacing mode.
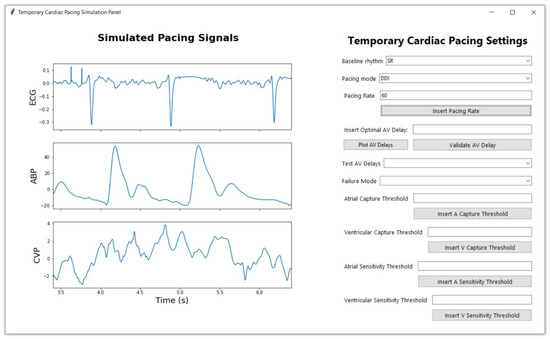
Figure 16.
Example of the signal displayed when the user selects the baseline signal, in this case, SR, and chooses the DDI pacing mode with a pacing rate under 70 bpm, causing the intrinsic conduction to show on the signals and the inhibition of the pacing spikes in both the atria and the ventricles, where intrinsic conduction occurs.
The same baseline signals can also be paced in asynchronous pacing modes such as VOO, AOO, and DOO. These modes are similar to VVI, AAI, and DDI pacing modes, with the exception that in asynchronous modes, the simulator does not inhibit any pacing spikes and no intrinsic conduction is simulated. Snapshots of these generated asynchronous modes can be seen in the Appendix A in Figure A1, Figure A2 and Figure A3. Additional examples of pacing modes under different baseline rhythms such as AF (Figure A4 and Figure A5), LBBB (Figure A7, Figure A8 and Figure A9), TAH (Figure A6) and SR with VEs (Figure A10 and Figure A11) can also be found in the Appendix A.
3.2. Pacing Failure Scenarios
This subsection details the analysis of various pacing failure modes simulated by the TCPS. Understanding the behavior of different pacing modes is crucial for clinicians, but it is equally important to understand pacing failure modes. Clinicians must be able to detect different types of pacing failures, comprehend their causes, and respond quickly by adjusting settings to correct them. Each pacing failure mode impacts the signals differently, and detection is not always straightforward. The TCPS simulates four major types of pacing failures: ALOC, VLOC, undersensing, and oversensing, all of which will be described in this section.
Figure 17 illustrates a simulated scenario of intermittent VLOC in DOO pacing mode at a rate of 80 bpm. In this failure mode, the TCPS delivers pacing spikes that successfully capture the atria, but the ventricular spikes fail to generate a ventricular contraction. This is most evident in the ECG signal, where pacing spikes are visible without the subsequent QRS complexes, indicating that the electrical impulse from the TP is not depolarizing the ventricles. As a result, VLOC leads to decreased cardiac output, which is reflected in the ABP and CVP signals.
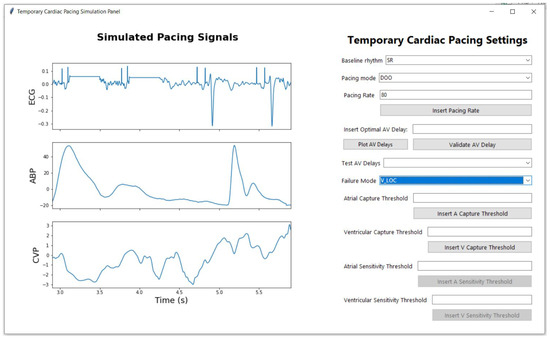
Figure 17.
Example of the signal displayed when the user selects the SR baseline rhythm and chooses the DOO pacing mode with a pacing rate of 80 bpm, while also selecting VLOC from the failure mode dropdown menu.
Similarly, the TCPS-simulated ALOC manifests in a comparable way, but in this case, the loss of capture occurs in the atria. Figure 18 presents an ALOC scenario in DOO mode with a pacing rate of 75 bpm. In this scenario, pacing spikes are visible on the ECG signal before the first three R peaks, followed by a flat line indicating the lack of atrial conduction. However, unlike VLOC, ALOC does not significantly affect the blood pressure signals, as the loss of atrial capture has a less pronounced impact on overall cardiac output compared to the loss of ventricular capture.
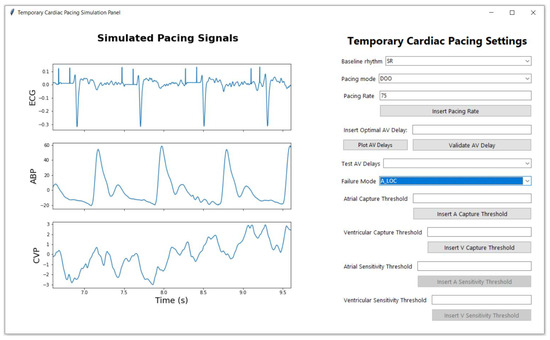
Figure 18.
Example of the signal displayed when the user selects the SR baseline rhythm and chooses the DOO pacing mode with a pacing rate of 80 bpm, while also selecting ALOC from the failure mode dropdown menu.
Sensing failure modes manifest differently compared to capture failure modes. In the case of undersensing, as shown in Figure 19, the TP fails to detect intrinsic cardiac events appropriately. While the ECG signal maintains its typical waveform, with clearly identifiable P waves, QRS complexes, and T waves, pacing spikes are observed at inappropriate times. In the scenario of atrial undersensing, depicted in Figure 20, pacing spikes are erroneously superimposed on the P-waves. These spikes occur during the atrial depolarization phase—a time when the atria are naturally contracting. Normally, the pacemaker should inhibit pacing upon detecting an intrinsic P-wave, but the failure to sense this atrial activity results in unnecessary pacing stimuli. This disruption in atrial sensing can lead to asynchronous atrioventricular contractions, potentially causing hemodynamic inefficiency. In the case of ventricular undersensing, shown in Figure 21, pacing spikes are incorrectly placed on the T-waves, which follow the QRS complexes. These sharp, narrow deflections during the ventricular repolarization phase indicate the TP’s failure to detect intrinsic ventricular activity. Pacing during this phase is particularly dangerous, as it can lead to arrhythmias by interfering with the heart’s recovery phase. Normally, pacing spikes should precede the QRS complex when pacing the ventricles, but this failure to properly sense ventricular activity results in pacing during an inappropriate phase of the cardiac cycle. In DDI pacing mode, undersensing can occur in both the atria and ventricles simultaneously. The TCPS simulates both scenarios simultaneously, as shown in Figure 22.
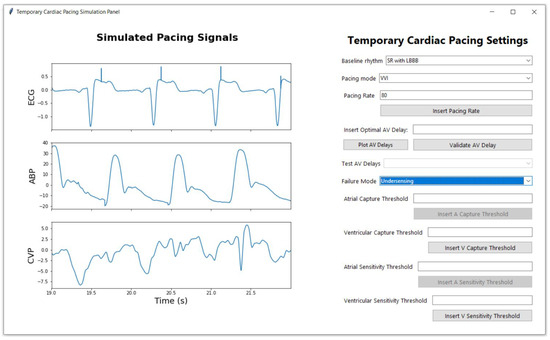
Figure 19.
Example of the signal displayed when the user selects the SR with LBBB baseline rhythm and chooses the VVI pacing mode with a pacing rate of 80 bpm, while also selecting “undersensing” from the failure mode dropdown menu. In undersensing failure mode, the TCPS shows pacing spikes erroneously superimposed on the T-waves. These inappropriate spikes occur due to the TP’s failure to correctly sense the heart’s intrinsic activity, leading to the delivery of pacing stimuli during the repolarization phase.
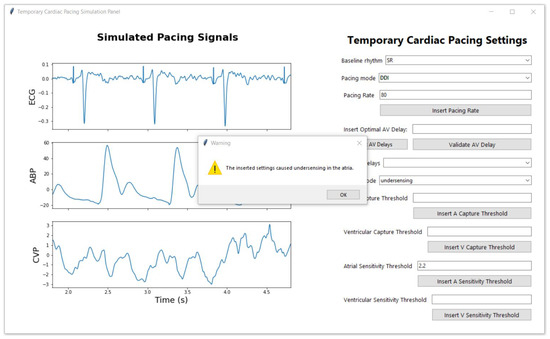
Figure 20.
DDI Pacing with Atrial Undersensing: This figure depicts the signal output when the user selects a sinus rhythm (SR) baseline and sets the pacing mode to DDI at a rate of 80 bpm. The user inputs a value for the atrial sensitivity threshold and clicks the “Insert A Sensitivity Threshold” button. The TCPS compares this input against a generated maximal atrial sensitivity threshold. In this scenario, the system fails to detect atrial activity, causing the failure mode to switch to undersensing. A warning message is displayed, notifying the user of atrial undersensing due to the inputted threshold.
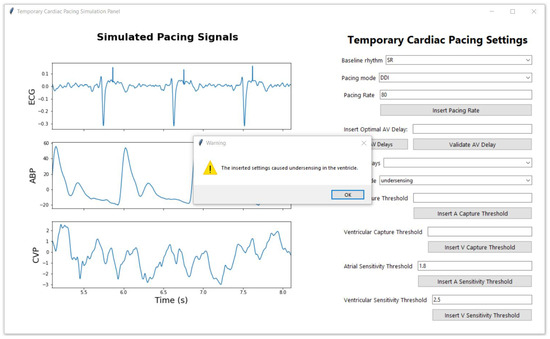
Figure 21.
DDI Pacing with Ventricular Undersensing: This figure illustrates the signal output when the user selects a sinus rhythm (SR) baseline and sets the pacing mode to DDI at a rate of 80 bpm. The user inputs a value for the ventricular sensitivity threshold and clicks the “Insert V Sensitivity Threshold” button. The TCPS compares this input to a generated maximal ventricular sensitivity threshold. In this scenario, the system fails to detect ventricular activity, triggering the failure mode to switch to undersensing. A warning message is displayed, notifying the user of ventricular undersensing due to the inputted threshold.
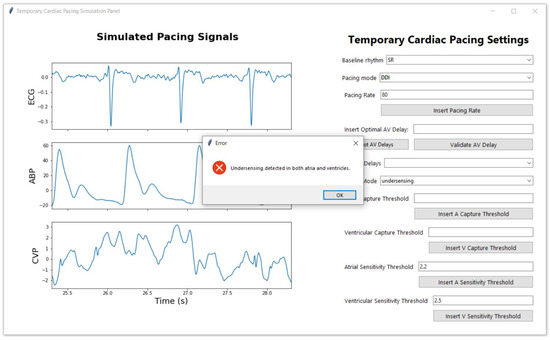
Figure 22.
DDI Pacing with Atrial and Ventricular Undersensing: This figure shows the signal output when the user selects a sinus rhythm (SR) baseline and sets the pacing mode to DDI at a rate of 80 bpm. The user inputs values for both atrial and ventricular sensitivity thresholds, then clicks either the “Insert V Sensitivity Threshold” or the “Insert A Sensitivity Threshold” button. The TCPS compares these values against generated maximal atrial and ventricular sensitivity thresholds. Here, both the atrial and ventricular activity go undetected, causing the failure mode to switch to undersensing. The issues a warning, informing the user of undersensing in both chambers due to the specified thresholds.
In oversensing, the pacemaker incorrectly detects electrical signals (noise or other non-cardiac signals) as heartbeats, leading to inappropriate inhibition of pacing, which can cause the heart to miss needed beats. Figure 23 illustrates a scenario of ventricular oversensing generated by the TCPS. Despite the TCPS being set to pace in VVI mode at a rate of 90 bpm, if the failure mode dropdown menu is set to oversensing, the TCPS disregards all other settings and reverts to displaying the patient’s baseline signals—in this case, SR with VEs. As a result, the ECG signal shows no pacing spikes and exhibits irregular RR intervals, reflecting the underlying arrhythmia that the TP fails to correct due to the oversensing error. Similarly, the TCPS can generate atrial oversensing which inhibits the pacing spikes to the atria as shown in Figure 24. However, oversensing can also be localized in both atria and ventricles, leading to distinct challenges in each chamber. In the DDI pacing mode, both atrial and ventricular oversensing can occur simultaneously, leading to a scenario where both chambers are affected by inappropriate inhibition of pacing. This scenario is simulated by the TCPS as shown in Figure 25. When oversensing is present in both chambers pacing spikes are not delivered to any of the chambers and the TCPS reverts the signal to its baseline rhythm.
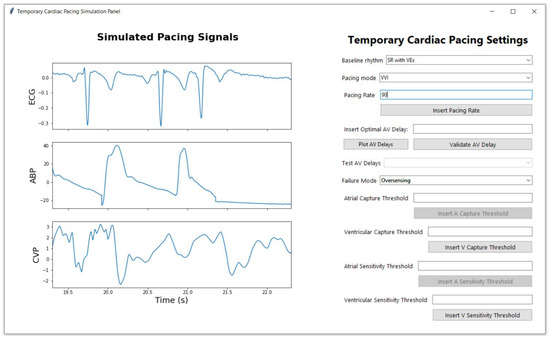
Figure 23.
Example of the signal displayed when the user selects the “SR with VEs” baseline rhythm and chooses the VVI pacing mode with a pacing rate of 90 bpm, while also selecting “oversensing” from the failure mode dropdown menu. In oversensing failure mode, the TCPS reverts to the patient’s baseline rhythm, ignoring any pacing settings configured by the user. As a result, the ECG signal shows no pacing spikes and exhibits irregular RR intervals.
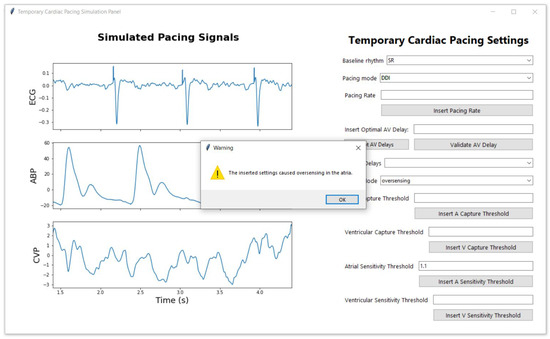
Figure 24.
DDI Pacing with Atrial Oversensing: This figure illustrates the signal output when the sinus rhythm (SR) baseline is selected. The user inputs a value for the atrial sensitivity threshold and activates it by clicking the “Insert A Sensitivity Threshold” button. The TCPS compares this input against a generated minimal atrial sensitivity threshold. In this scenario, the TCPS detects oversensing in the atria, triggering the failure mode to switch to oversensing. A warning message alerts the user to the issue, indicating that the inputted threshold has caused atrial oversensing.
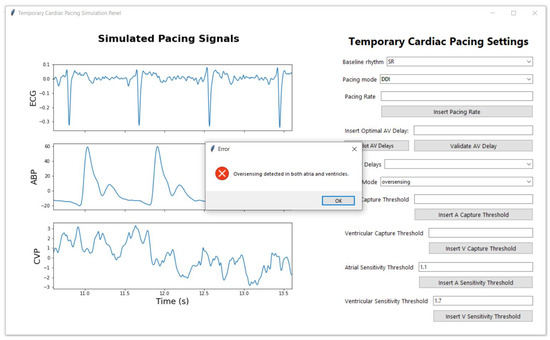
Figure 25.
DDI Pacing with Atrial and Ventricular Oversensing: This figure shows the signal output when the user selects a sinus rhythm (SR) baseline and sets the pacing mode to DDI. The user inputs values for both atrial and ventricular sensitivity thresholds, then clicks on the “Insert V Sensitivity Threshold” and on the “Insert A Sensitivity Threshold” buttons. The TCPS compares these values against generated minimal atrial and ventricular sensitivity thresholds. Here, both the atrial and ventricular activity are oversensed, causing the failure mode to switch to oversensing in both chambers. The issues a warning, informing the user of oversensing in both chambers due to the specified thresholds.
Both oversensing and undersensing errors, whether in the atria, ventricles, or both (as in the case of DDI pacing mode), underscore the critical need for precise sensing mechanisms in TP devices to ensure effective heart rhythm management.
3.3. Capture and Sensitivity Thresholds
Capture thresholds are critical parameters in TP function, determining the minimum amount of electrical energy required to depolarise the myocardium and produce a paced heartbeat. Through multiple simulation runs, it was observed that when the user-input capture threshold was equal to or above the minimal threshold, the TCPS consistently achieved successful atrial and ventricular capture. An example of ventricular capture is illustrated in Figure 26. When the user inputs a value in the “Ventricular Capture Threshold” field and clicks the “Insert V Capture Threshold” button, the TCPS system compares the entered value to the randomly generated minimal ventricular capture threshold and verifies whether this threshold continues to successfully capture the ventricles. In this instance, the introduced threshold successfully captures the ventricles, and the following informational feedback message is generated on the screen: “The capture threshold is the minimum amount of electrical energy required to consistently depolarise the myocardium and produce a paced heartbeat. Typically, the capture threshold is set between 0.5 to 2.0 milliamps (mA). It is essential to set the threshold to the lowest value that reliably produces a capture to minimise battery usage and avoid unnecessary high-energy delivery”. This message informs the user about the capture threshold and encourages them to use the minimal amount necessary to achieve capture, thus optimising both battery life and pacing efficiency. In contrast, input values below the minimal thresholds triggered corresponding failure modes (ALOC and VLOC), effectively simulating clinical scenarios where the TP fails to capture the myocardium. Figure 27 illustrates a VLOC scenario resulting from an inadequate capture threshold value entered by the user. The TCPS simulates this by automatically switching the failure mode dropdown menu to VLOC when the user’s input is smaller than the randomly generated minimum capture threshold. Simultaneously with updating the signals to reflect the VLOC failure mode, the TCPS also generates a warning message on the screen, informing the user that the entered value caused VLOC.
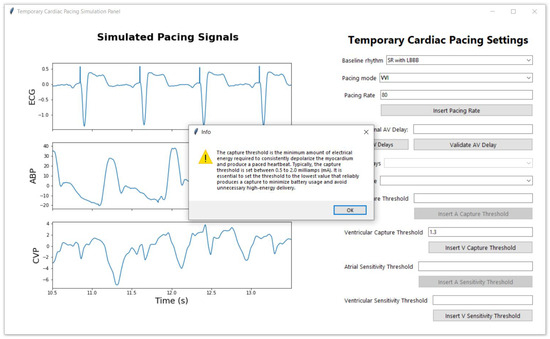
Figure 26.
Ventricular Capture Threshold Test: This figure illustrates the signal generated when the user selects SR with LBBB as the baseline rhythm, and sets the pacemaker to VVI mode at a rate of 80 bpm. After inputting a value for the ventricular capture threshold and clicking the “Insert V Capture Threshold” button, the TCPS system compares the input against a predefined minimal ventricular capture threshold. In this scenario, the entered threshold successfully captures the ventricles, and the system confirms this by displaying an informational message on the screen.
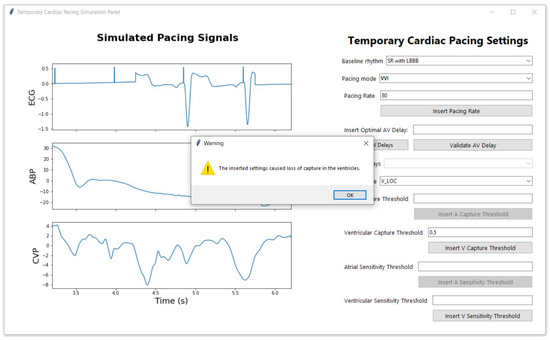
Figure 27.
Ventricular Capture Threshold Test: This figure shows the signal output when the user selects SR with LBBB as the baseline rhythm, and chooses the VVI pacing mode with a rate of 80 bpm. After entering a value for the ventricular capture threshold and clicking the “Insert V Capture Threshold” button, the TCPS system evaluates the input against the randomly generated minimal ventricular capture threshold. In this case, the entered threshold fails to capture the ventricles, prompting the TCPS to automatically switch the failure mode to VLOC. A warning message is then displayed, informing the user that the selected threshold has caused VLOC.
Sensitivity thresholds are equally crucial in the function of a temporary pacemaker (TP), determining the minimum intracardiac signal voltage that the TP must detect to recognise intrinsic cardiac activity. Clinicians must carefully set the sensitivity high enough to avoid sensing muscle noise and external interference, which can lead to oversensing, but low enough to prevent unnecessary inhibition of pacing, which can cause undersensing. Therefore, simulating these scenarios within the TTCPS is essential.
To achieve this, the TCPS randomly generates minimal and maximal sensitivity thresholds for both the atria and ventricles. As shown in Figure 28, when the user inputs a value into the “Atrial Sensitivity Threshold” field and clicks the “Insert A Sensitivity Threshold” button, the TCPS system compares the entered value to the randomly generated minimal and maximal atrial sensitivity thresholds and verifies whether these thresholds continue to successfully sense the atria. In this instance, the introduced threshold successfully senses the atria, and the following informational feedback message is generated on the screen: “The sensitivity threshold is the minimum intracardiac signal voltage that the pacemaker must detect to recognise intrinsic cardiac activity. The sensitivity threshold is usually set between 0.5 to 2.5 millivolts (mV). This setting ensures the pacemaker accurately detects the heart’s intrinsic electrical activity and avoids inappropriate pacing due to oversensing or undersensing”.
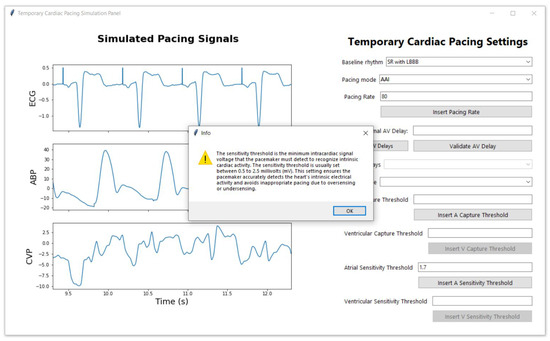
Figure 28.
Atrial Sensitivity Threshold Test: This figure depicts the signal output when the user selects LBBB as baseline rhythm and sets the pacing mode to AAI at a rate of 80 bpm. The user inputs a value for the atrial sensitivity threshold and clicks the “Insert A Sensitivity Threshold” button. The TCPS system compares this input against a predefined maximal atrial sensitivity threshold. In this scenario, the entered threshold successfully senses the atria, and the system confirms this by displaying an informational message on the screen.
In contrast, when the user inputs values above the maximum sensitivity thresholds, the TCPS triggers corresponding failure modes (atrial or ventricular undersensing, or both), effectively simulating clinical scenarios where the TP fails to sense intrinsic cardiac activity. Figure 29 illustrates an example of an undersensing scenario resulting from an inadequate atrial sensing threshold value entered by the user, where the introduced value is higher than the generated maximal sensitivity threshold for that patient. The TCPS simulates this by automatically switching the failure mode dropdown menu to undersensing when the user’s input exceeds the randomly generated maximum sensitivity threshold. Simultaneously, the TCPS updates the signals to reflect the undersensing failure mode and generates a warning message on the screen, informing the user that the entered value caused atrial undersensing. An inadequate ventricular sensing threshold value, where the introduced value is higher than the generated maximal ventricular sensitivity threshold for that patient, triggers a similar response from the TCPS. An example of this scenario is shown in Figure 21. Additionally, if the user inputs values for both the atria and the ventricles that exceed the maximum generated sensitivity thresholds, this will trigger undersensing in both the atria and the ventricles, as demonstrated in Figure 22.
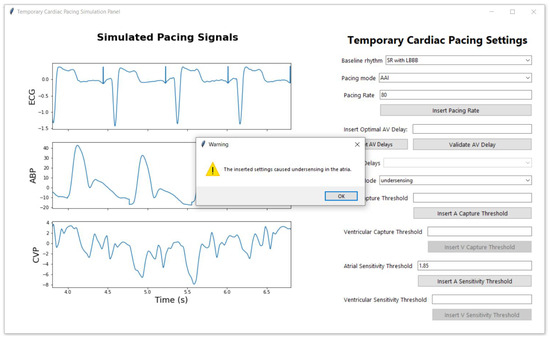
Figure 29.
Atrial Sensitivity Threshold Test: This figure depicts the signal output when the user selects LBBB as baseline rhythm and sets the pacing mode to AAI at a rate of 80 bpm. The user inputs a value for the atrial sensitivity threshold and clicks the “Insert A Sensitivity Threshold” button. The TCPS system compares this input against a predefined maximal atrial sensitivity threshold. In this case, the entered threshold fails to capture the atria, prompting the TCPS to automatically switch the failure mode to undersensing. A warning message is then displayed, informing the user that the selected threshold has caused undersensing in the atria.
Similarly, when the user inputs values below the minimum sensitivity thresholds, the TCPS triggers corresponding failure modes (atrial or ventricular oversensing, or both), effectively simulating clinical scenarios where the TP fails to properly sense intrinsic cardiac activity. Figure 30 illustrates an example of an oversensing scenario resulting from an inadequate ventricular sensing threshold value entered by the user, where the introduced value is higher than the generated minimal sensitivity threshold for that patient. The TCPS simulates this by automatically switching the failure mode dropdown menu to oversensing when the user’s input is lower than the randomly generated minimum sensitivity threshold. Simultaneously, the TCPS updates the signals to reflect the oversensing failure mode and generates a warning message on the screen, informing the user that the entered value caused ventricular oversensing. An inadequate atrial sensing threshold value, where the introduced value is lower than the generated minimal atrial sensitivity threshold for that patient, triggers a similar response from the TCPS and can be seen in Figure 24. Additionally, if the user selects DDI pacing mode and inputs values for both the atria and the ventricles that are below the minimum generated sensitivity thresholds, this will trigger oversensing in both the atria and the ventricles, as demonstrated in Figure 25.
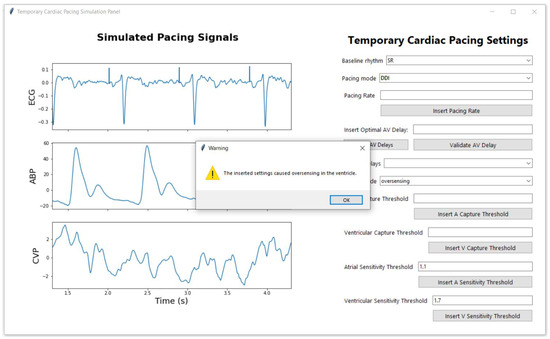
Figure 30.
Ventricular Sensitivity Threshold Test: This figure depicts the signal output when the user selects SR as baseline rhythm and sets the pacing mode to DDI. The user inputs a value for the ventricular sensitivity threshold and clicks the “Insert V Sensitivity Threshold” button. The TCPS system compares this input against a predefined minima ventricular sensitivity threshold. In this case, the entered threshold oversenses the ventricles and inappropriately inhibits pacing, prompting the TCPS to automatically switch the failure mode to oversensing. A warning message is then displayed, informing the user that the selected threshold has caused oversensing in the ventricle.
3.4. AV Delay in Dual-Chamber Pacing Modes
The AV delay is a crucial parameter in dual pacing modes, significantly impacting the patient’s ability to achieve optimal blood hemodynamics. Figure 31 shows how the user can test and visualise different AV delays for a patient in SR with VEs baseline rhythm for a DOO pacing mode. In this instance the patient has data collected for AV delays of 40, 80, 160, and 200 ms. This TCPS function provides a way to visually analyse the different changes that occur in the patient’s haemodynamic status under different AV delay settings. The TCPS also provides buttons for testing the AV delay optimal value. As shown in Figure 32, the user can insert an optimal AV delay value in the “Insert Optimal AV Delay” field and validate it by clicking on te “Validate AV Delay” button. Once clicked, the validation button runs a function in the background that compares the introduced value with the optimal value we found using the protocol our group proposed and detailed in [15], and displays a feedback message on the screen. In the case presented in Figure 32, the introduced value is correct and the TCPS display the following message on the screen as feedback: “Correct: The introduced atrioventricular time delay is the optimal value for this patient!”. In contrast, if the inserted value is not the optimal one, the TCPS will display the following error message: “Incorrect: The introduced atrioventricular time delay is not the optimal value for this patient. Please inspect the AV delay signals and introduce try again!”, as shown in Figure 33.
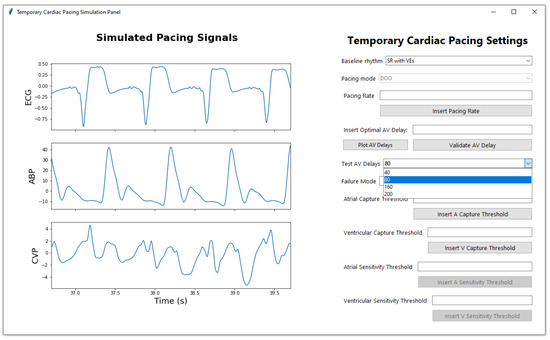
Figure 31.
AV Delay Test: An example of how the user can test different AV delay for a chosen baseline, when the selected pacing mode is set in dual pacing mode.
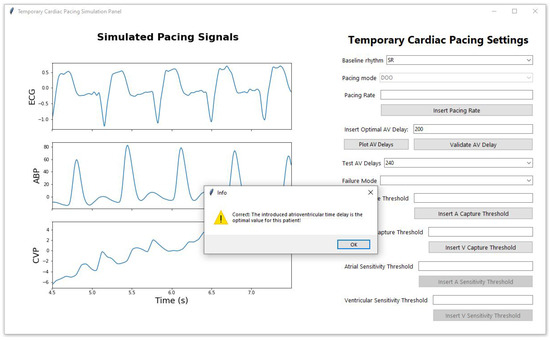
Figure 32.
AV Delay Test: An example of how the user inserts a value for optimal AV delay and clicks the “Validate AV Delay” button for a chosen baseline, when the selected pacing mode is set in dual pacing mode. In this scenario, the introduced value is optimal, and the TCPS confirms that by displaying a feedback message on the screen.
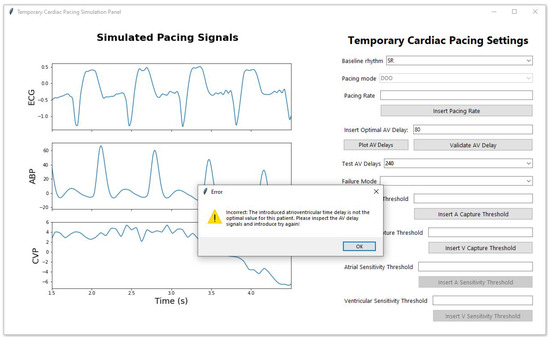
Figure 33.
AV Delay Test: An example of how the user inserts a value for optimal AV delay and clicks the “Validate AV Delay” button for a chosen baseline, when the selected pacing mode is set in dual pacing mode. In this scenario, the introduced value is not optimal, and the TCPS confirms that by displaying an error message on the screen which asks the user to analyse the signals and try again.
The TCPS system, in addition to the features described above, offers a platform for clinicians to analyze the effects of different AV delay settings by providing a visual representation of how blood pressure varies with different AV delay values, using 120 ms as a reference point for the optimal window length of one respiratory cycle for ABP and two respiratory cycles for CVP. A detailed analysis of these methods is provided in [15], but an example of the plot generated by the developed TCPS can be seen in Figure 34.
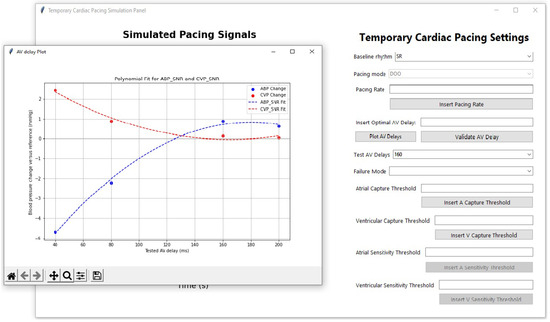
Figure 34.
AV Delay Test: An example of how the user can visualise the effects of different AV delays by clicking on the “Plot AV Delay” button. The plot generates a visual representation of how blood pressure varies with different AV delay values, using 120 ms as a reference point for the optimal window length of one respiratory cycle for ABP and two respiratory cycles for CVP.
4. Discussion
The development and implementation of the TCPS represent a significant advancement in the training and education of clinicians managing TP devices. The simulator effectively integrates complex algorithms and a user-friendly interface to replicate the behavior of TP devices in various clinical scenarios. This tool is not only beneficial for educational purposes but also for enhancing clinicians’ ability to handle real-life situations involving TP devices.
The TCPS was designed with two main phases: the back-end algorithms and the front-end user interface. The back-end encompasses algorithms that modify baseline patient signals to simulate different pacing modes, rates, and failures. These algorithms were meticulously developed to replicate the electrical and hemodynamic responses observed in clinical practice, ensuring that the simulator provides an accurate representation of real-world scenarios. The front-end, developed using the Tkinter library, is simple and intuitive, allowing users to interact with the simulator without needing extensive coding knowledge. The design of the GUI, with its organized layout and real-time feedback, facilitates a seamless learning experience. The inclusion of dynamic plots that update in real-time as the user modifies settings is particularly effective in visualizing the impact of different pacing modes and parameters.
The TCPS successfully simulates a wide range of pacing modes, including atrial, ventricular, and dual-chamber pacing. The ability to visualize how different pacing modes affect ECG, ABP, and CVP signals is invaluable for clinicians. For instance, the simulator demonstrates the effects of inhibited heartbeats in VVI and AAI modes, as well as the synchronization challenges in dual-chamber pacing modes like DDI. These simulations help clinicians understand the intricacies of pacing and the importance of selecting the appropriate mode based on the patient’s baseline rhythm. Moreover, the TCPS is capable of simulating various pacing failures, such as loss of capture, undersensing, and oversensing in both atria and ventricles. These simulations are critical for training clinicians to recognize and respond to pacing malfunctions, which can have serious consequences if not addressed promptly. The detailed visualization of these failures provides a comprehensive understanding of their impact on cardiac signals and patient outcomes. The implementation of capture and sensitivity thresholds within the TCPS adds another layer of realism to the simulator. By randomly generating minimal and maximal thresholds for both atrial and ventricular pacing, the simulator challenges users to set appropriate values that ensure effective pacing while avoiding unnecessary energy expenditure. The feedback provided by the TCPS when thresholds are set incorrectly reinforces the learning process, helping users develop a deeper understanding of the critical balance between capturing the myocardium and avoiding oversensing or undersensing.
The inclusion of AV delay testing in dual-chamber pacing modes further enhances the TCPS’s educational value. AV delay is a crucial parameter in ensuring synchronized atrial and ventricular contractions, which is vital for optimizing cardiac output. The simulator allows users to test and visualize the effects of different AV delay settings, providing an opportunity to learn how to fine-tune this parameter for individual patients. The visual representation of blood pressure variations with different AV delays is particularly useful for understanding the hemodynamic implications of these adjustments.
The development of the TCPS addresses many of the limitations highlighted in the existing literature on TP training. As previously discussed, current training methods in the UK for TP are inadequate, with a lack of established guidelines and comprehensive training protocols. Existing simulators, such as PacerMan and CardiSim, are limited in scope, focusing primarily on basic wire placement and single-chamber pacing without integrating haemodynamic feedback. This shortfall has been linked to higher complication rates and lower survival outcomes in TP procedures. The TCPS, however, represents a significant advancement by incorporating a wide range of physiological signals and complex clinical scenarios, including dual-chamber pacing and the ability to simulate haemodynamic changes. Unlike other simulators that neglect critical parameters such as blood pressure and AV delay, the TCPS offers real-time feedback on these aspects, providing a more comprehensive and realistic training experience. This ensures that clinicians are better prepared to manage the complexities of TP in real-world settings, thereby enhancing patient outcomes and addressing the critical gaps identified in the literature.
While this paper makes significant contributions to the field, it is important to acknowledge certain limitations that may have constrained the scope and impact of the work. These limitations highlight areas where further refinement and exploration could enhance the study’s outcomes and suggest promising directions for future research. The TCPS, while comprehensive, has its limitations. Firstly, the simulator does not yet incorporate the synthetic data that could be generated using the MC-WGAN model proposed in [16]. The inclusion of synthetic data could enhance the realism and variability of the simulated scenarios, providing a more robust training environment. Secondly, the TCPS has not been widely tested by clinicians to validate its efficacy as a training tool. While the algorithms and user interface have been rigorously developed, real-world feedback from medical professionals is necessary to refine the system and ensure its practicality in clinical training.
5. Conclusions
The TCPS is a comprehensive tool that effectively bridges the gap between theoretical knowledge and practical application in the management of TP devices. Its detailed simulation capabilities, user-friendly interface, and real-time feedback make it an invaluable resource for training and education. By allowing clinicians to experiment with different pacing modes, failure scenarios, and parameter settings in a controlled environment, the TCPS enhances their ability to manage complex clinical situations confidently and effectively. This simulator not only improves the understanding of TP devices but also contributes to better patient outcomes by preparing clinicians to respond promptly and accurately to pacing challenges.
Supplementary Materials
The following supporting information can be downloaded at: https://www.mdpi.com/article/10.3390/app15020573/s1, Video S1: Demonstration video of the temporary cardiac pacing simulator interface.
Author Contributions
I.C.: Conceptualization, Writing, Review Editing, Visualization, Validation, Software, Resources, Project administration, Methodology, Investigation, Formal analysis, Data curation. A.T.: Data collection, Visualization, Validation, Methodology, Investigation, Formal analysis, Conceptualization. M.A.: Supervision, Funding acquisition. W.B.: Supervision, Funding acquisition. A.W.K.: Supervision, Funding acquisition. H.M.: Review, Editing, Supervision, Resources, Project administration, Funding acquisition, Formal analysis, Conceptualization. All authors have read and agreed to the published version of the manuscript.
Funding
This research was funded by British Heart Foundation grant number FS/19/73/34690.
Institutional Review Board Statement
The study was conducted in accordance with the Declaration of Helsinki, and approved by the South West—Cornwall & Plymouth Research Ethics Committee and the Health Research Authority (HRA) under reference 21/SW/0051 (IRAS 292373).
Informed Consent Statement
Informed consent was obtained from all subjects involved in the study.
Data Availability Statement
https://www.isrctn.com/ISRCTN15383573 (accessed on 1 December 2024).
Acknowledgments
We would like to thank British Heart Foundation for founding this research.
Conflicts of Interest
The authors declare no conflicts of interest.
Abbreviations
The following abbreviations are used in this manuscript:
| AAI | Atrial pacing and sensing |
| ABP | Arterial line blood pressure |
| AF | Atrial fibrillation |
| ALOC | Atrial loss of capture |
| AOO | Atrial asynchronous pacing |
| AV | Atrioventricular |
| AV delay | Atrioventricular delay |
| CVP | Central venous pressure |
| CVDs | Cardiovascular diseases |
| DAQ | Data acquisition |
| DDI | Dual pacing and sensing with inhibited response in one chamber |
| DOO | Dual asynchronous pacing |
| ECG | Electrocardiogram |
| GUI | Graphical User Interface |
| HRA | Health Research Authority |
| ICU | Intensive care unit |
| IRAS | Integrated Research Application System |
| LBBB | Left bundle branch block |
| NHS | National Health Service |
| PPM | Permanent pacemaker |
| RR interval | Interval between R peaks on an ECG |
| SR | Sinus rhythm |
| TAH | Tachycardia |
| TCPS | Temporary Cardiac Pacing Simulator |
| TP | Temporary pacing |
| VEs | Ventricular ectopics |
| VLOC | Ventricular loss of capture |
| VOO | Ventricular asynchronous pacing |
| VVI | Ventricular pacing and sensing |
Appendix A
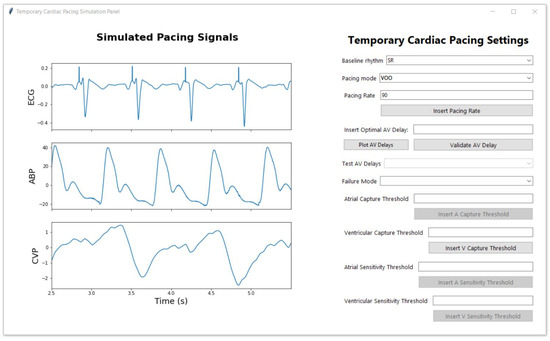
Figure A1.
Example of the signal displayed when the user selects the baseline signal, in this case, sinus rhythm (SR), and chooses the VOO pacing mode with a pacing rate of 90 bpm.
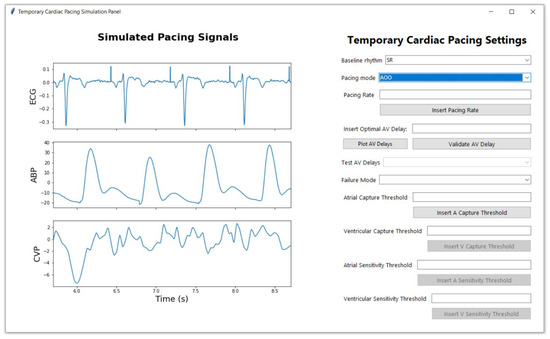
Figure A2.
Example of the signal displayed when the user selects the baseline signal, in this case, sinus rhythm (SR), and chooses the AOO pacing mode with the default pacing rate of 80 bpm.
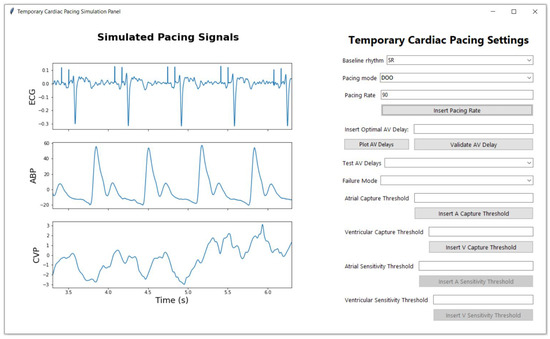
Figure A3.
Example of the signal displayed when the user selects the baseline signal, in this case, sinus rhythm (SR), and chooses the DOO pacing mode with the default pacing rate of 80 bpm.
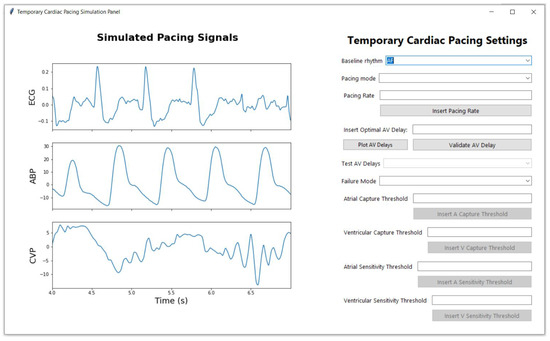
Figure A4.
Example of the signal displayed when the user selects the baseline signal, in this case, atrial fibrillation (AF).
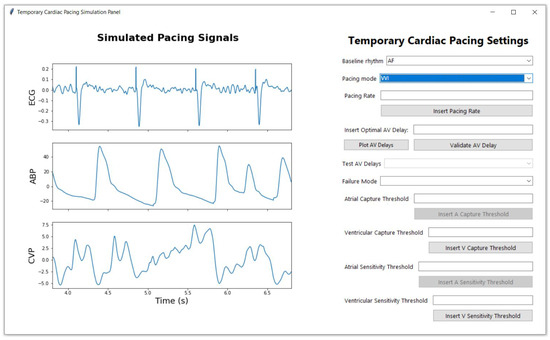
Figure A5.
Example of the signal displayed when the user selects the baseline signal, in this case, atrial fibrillation (AF), and chooses the VVI pacing mode with the default pacing rate of 80 bpm.
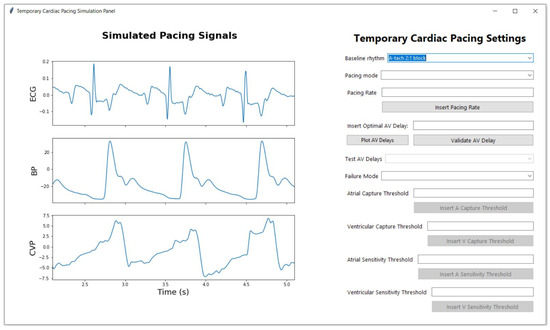
Figure A6.
Example of the signal displayed when the user selects the baseline signal, in this case, tachycardia (T).
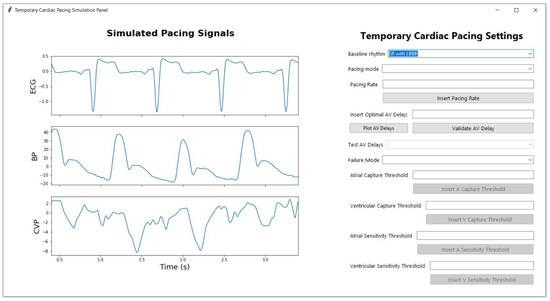
Figure A7.
Example of the signal displayed when the user selects the baseline signal, in this case, LBBB.
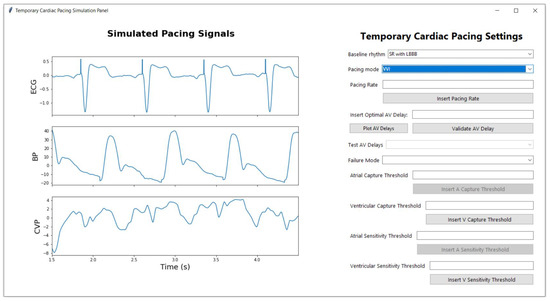
Figure A8.
Example of the signal displayed when the user selects the baseline signal, in this case, LBBB, and chooses the VVI pacing mode with the default pacing rate of 80 bpm.
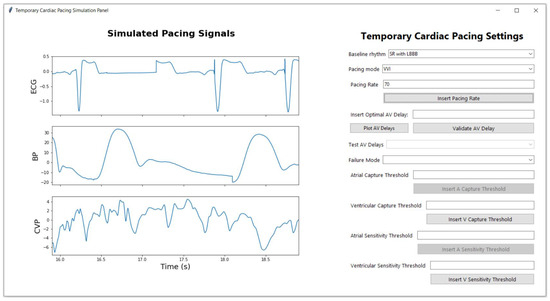
Figure A9.
Example of the signal displayed when the user selects the baseline signal, in this case, LBBB, and chooses the VVI pacing mode with a pacing rate under 70 bpm, causing the intrinsic conduction to show on the signals and the inhibition of the pacing spikes in the ventricle, where intrinsic conduction occurs.
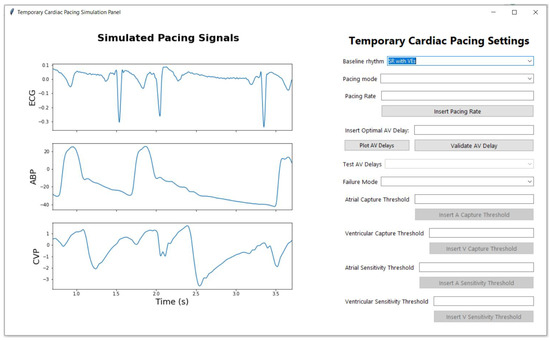
Figure A10.
Example of the signal displayed when the user selects the baseline signal, in this case, SR with VEs.
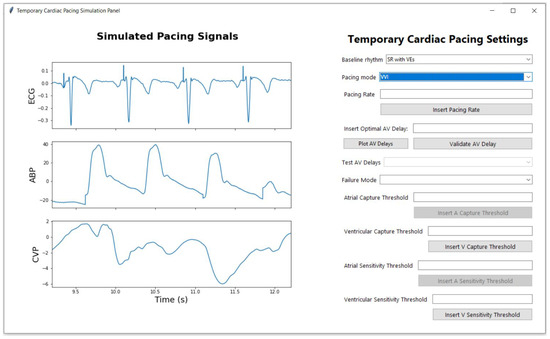
Figure A11.
Example of the signal displayed when the user selects the baseline signal, in this case, SR wit VEs, and chooses the VVI pacing mode with the default pacing rate of 80 bpm.
References
- Laslett, L.J.; Alagona, P.; Clark, B.A.; Drozda, J.P.; Saldivar, F.; Wilson, S.R.; Poe, C.; Hart, M. The worldwide environment of cardiovascular disease: Prevalence, diagnosis, therapy, and policy issues: A report from the American College of Cardiology. J. Am. Coll. Cardiol. 2012, 60, S1–S49. [Google Scholar] [CrossRef] [PubMed]
- Ulster University. CVD Statistics: Cardiovascular Disease Is the Current Leading Cause of Death Worldwide. 2019. Available online: https://www.ulster.ac.uk/cardiovascular/cvd-prevalence (accessed on 18 July 2024).
- Cronin, B.; Dalia, A.; Goh, R.; Essandoh, M.; Orestes O’Brien, E. Temporary Epicardial Pacing After Cardiac Surgery. J. Cardiothorac. Vasc. Anesth. 2022, 36, 4427–4439. [Google Scholar] [CrossRef] [PubMed]
- Ayerbe, J.L.; Sabaté, R.V.; García, C.G.; Leor, O.R.; Pérez, M.G.; Abadal, A.C.; Flores, J.S.; Larrousse, E.; Valle, V. Temporary pacemakers: Current use and complications. Rev. Esp. Cardiol. 2004, 57, 1045–1052. [Google Scholar]
- Calvanese, R.; Conti, M.A.; Kol, A.; Pignalberi, C.; a cura dell’Area Aritmie ANMCO. Temporary cardiac pacing: 50 years old and still young. G. Ital. Cardiol. 2023, 24, 810–817. [Google Scholar]
- Diemberger, I.; Massaro, G.; Rossillo, A.; Chieffo, E.; Dugo, D.; Guarracini, F.; Pellegrino, P.L.; Perna, F.; Landolina, M.; De Ponti, R.; et al. Temporary transvenous cardiac pacing: A survey on current practice. J. Cardiovasc. Med. 2020, 21, 420–427. [Google Scholar] [CrossRef] [PubMed]
- Overbay, D.; Criddle, L.M. Mastering temporary invasive cardiac pacing. Crit. Care Nurse 2004, 24, 25–32. [Google Scholar] [CrossRef] [PubMed]
- Ng, A.C.C.; Lau, J.K.; Chow, V.; Adikari, D.; Brieger, D.; Kritharides, L. Outcomes of 4838 patients requiring temporary transvenous cardiac pacing: A statewide cohort study. Int. J. Cardiol. 2018, 271, 98–104. [Google Scholar] [CrossRef] [PubMed]
- Murphy, J. Problems with temporary cardiac pacing: Expecting trainees in medicine to perform transvenous pacing is no longer acceptable. BMJ 2001, 323, 527. [Google Scholar] [CrossRef] [PubMed]
- Timperley, J.; Leeson, P.; Mitchell, A.R.J.; Betts, T. (Eds.) Temporary cardiac pacing. In Pacemakers and ICDs, 2nd ed.; Oxford Specialist Handbooks in Cardiology; Oxford University Press: Oxford, UK, 2018. [Google Scholar]
- Sullivan, B.L.; Bartels, K.; Hamilton, N. Insertion and management of temporary pacemakers. Semin. Cardiothorac. Vasc. Anesth. 2016, 20, 52–62. [Google Scholar] [CrossRef] [PubMed]
- Crowe, M.E.; Hayes, C.T.; Hassan, Z.U. Using software-based simulation for resident physician training in the management of temporary pacemakers. Simul. Healthc. 2013, 8, 109–113. [Google Scholar] [CrossRef] [PubMed]
- Makowski, D.; Pham, T.; Lau, Z.J.; Brammer, J.C.; Lespinasse, F.; Pham, H.; Schölzel, C.; Chen, S.H.A. NeuroKit2: A Python toolbox for neurophysiological signal processing. Behav. Res. Methods 2021, 53, 1689–1696. [Google Scholar] [CrossRef] [PubMed]
- Hunter, J.D. Matplotlib: A 2D graphics environment. Comput. Sci. Eng. 2007, 9, 90–95. [Google Scholar] [CrossRef]
- Cretu, I.; Tindale, A.; Abbod, M.; Balachandran, W.; Khir, A.W.; Meng, H. A comparison of different methods to maximise signal extraction when using central venous pressure to optimise atrioventricular delay after cardiac surgery. IJC Heart Vasc. 2024, 51, 101382. [Google Scholar] [CrossRef]
- Cretu, I.; Tindale, A.; Balachandran, W.; Abbod, M.; Khir, A.W.; Meng, H. Synthesis of Multimodal Cardiological Signals using a Conditional Wasserstein Generative Adversarial Network. IEEE Access 2024, 12, 133994–134007. [Google Scholar] [CrossRef]
Disclaimer/Publisher’s Note: The statements, opinions and data contained in all publications are solely those of the individual author(s) and contributor(s) and not of MDPI and/or the editor(s). MDPI and/or the editor(s) disclaim responsibility for any injury to people or property resulting from any ideas, methods, instructions or products referred to in the content. |
© 2025 by the authors. Licensee MDPI, Basel, Switzerland. This article is an open access article distributed under the terms and conditions of the Creative Commons Attribution (CC BY) license (https://creativecommons.org/licenses/by/4.0/).