1. Introduction
The dynamic performance of railway vehicles can be defined according to RQ, RC, safety, and track fatigue. The evaluation of these performances requires the use of specific methods and evaluation criteria that consider a number of aspects, such as the type and characteristics of the vehicle, the operating conditions, the speed regime, or the quality of the track. For example, for the railway administrations affiliated with the International Union of Railways (UIC), UIC 518 [
1] includes the reference conditions for carrying out tests and analyzing the results in order to approve railway vehicles from the point of view of RQ, safety, and track fatigue. In Europe, specifications for the homologation tests of railway vehicles in terms of dynamic behavior are included in the railway application standard EN 14363 [
2].
For the evaluation of RC, no universally valid method can be applied at the international level, because, from one country to another, the vibration characteristics of railway vehicles may vary due to the condition of the vehicles and the lines or the operating conditions [
3]. Also, the methods for RC evaluation must be adapted to the specifics of the traffic, namely urban, suburban, or long-distance. For example, in Japan and Korea, where trains in urban areas are very crowded, it is a common practice that the permissible limits of vibration to which passengers are exposed are not established for the seated position but for the least comfortable position [
4,
5]. This explains why there are several methods for evaluating RC that have appeared over time, independently, in different countries [
6].
Out of the practical need to assess the state of comfort that passengers feel during the train journey, several standards, guidelines, and procedures have been developed. The AS 2670 standard [
7,
8], the BS 6841 standard [
9], the UIC 513R [
10], the ISO 10056 standard [
11], and the railway applications standard EN 12299 [
12] are based on different versions of the ISO 2631 standard developed by the International Organization for Standardization [
13,
14,
15]. A reference method for evaluating RQ and RC of the railway vehicles is the method known as the Sperling index method or Wz index method [
16,
17]. This method introduces, for the first time, the notions of the RC index and the RQ index, the latter also being referred to asthe Wz index.
In the context of the considerations presented above, several researchers have come to the conclusion that, in the absence of a generally applicable RC evaluation method, it would be useful to establish a relationship between comfort indices obtained by different methods, which would allow the immediate transformation of one index into another, or, at least, to identify the advantages and limitations of one RC evaluation method in relation to another. However, this task is also a very difficult one because each RC evaluation method has different expressions, and the comfort indices depend on the way in which the railway vehicle vibrations are measured and processed. Thus, a research area was established, in which several reference papers can be found. One of these is that of Kim et al. [
5], in which the relationships between several methods for the evaluation of the RC of the railway vehicles was analyzed. These methods are the Sperling index method, the mean comfort method according to the UIC 513 and the EN 12299, and the method based on RMS acceleration (root mean square of the acceleration) in accordance with ISO 2631. Dumitriu and Leu [
18], as well as Dumitriu and Stănică [
19], made a correlation between RC indices for vertical vibrations calculated according to EN 12299 and the Sperling index method based on the similarity between the sensation of comfort and the values of the indices corresponding to the two methods. Munawir et al. [
20] evaluated the RC for two positions of the passenger—the seated position and the standing position by the method corresponding to EN 12299—and the results obtained were validated based on the Sperling method. Jiang et al. [
21] examined the advantages and limitations of the mean comfort index method and the Wz index method using experimental data. To identify an optimal method for evaluating RC in trams, Haladin et al. [
22] compared three methods of RC evaluation, namely the equivalent vibration level method according to ISO 2631, the Wz index method, and the mean comfort method. Starting from the premise that each RC evaluation method has certain advantages and disadvantages that depend on the running conditions of the railway vehicle, Alehashem and co-authors [
23] used two methods in parallel—the Sperling index method and the mean comfort method according to UIC 513—to test the effectiveness of a new magneto–rheological damper installed in the secondary lateral suspension system of a high-speed vehicle. Novillo et al. [
24] applied the RMS acceleration method, according to ISO 2631 and the mean comfort method according to EN 12299, to evaluate RC in a tram in the city of Cuenca, Ecuador. The results obtained with both methods showed that the tram is pleasant and that oscillations are barely perceived by the passengers.
Sun et al. [
25] noticed that the issue of carbody hunting instability has rarely been considered in RC evaluation. In addressing this issue, different RC evaluation methods, namely the Sperling index method, the mean comfort method, and the continuous comfort method, are compared. In this context, using experimental results, the advantages and limits of these methods are analyzed and the most suitable method for evaluating the carbody hunting instability is determined.
Recently, a team of researchers from Spain raised the issue of improving the current methods for evaluating RC, both in terms of methodology and interpretations [
26]. Reference was made to the Sperling index method and the mean comfort method on the EN 12299 standard, which, in the current context of increasing speeds and the use of light structures, seem to be outdated. The research on the Sperling index method developed by Deng and co-authors [
27] is also in the same line. They investigated the dependence of the Sperling index on the calculation algorithms used and showed that the results obtained based on the analysis in the time domain and based on the analysis in the frequency domain can be inconsistent in some situations.
In a recent paper, Silva et al. [
6] published a review paper in which they conducted a systematic analysis on RC assessment. In this paper, they dedicated a large section to RC analysis. In the first part of this section, the most well-known RC assessment methods are presented, namely the ISO 2631 method, the mean comfort method, and the Sperling index method. In the second part of the section, dedicated to RC analysis, some of the papers mentioned above [
5,
19,
20,
21] are presented, in which the RC assessment methods are analyzed. Finally, they conclude that although all three RC assessment methods have some advantages and limitations, the ISO 2631 standard is widely used.
A review of the most recent methods for evaluating and improving RC of the railway vehicles is also found in reference [
28]. In this context, it is shown that the Sperling index method does not reflect the effect of the duration of exposure to vibrations, but that this index offers advantages to designers, giving the possibility to improve the damping of the lateral and vertical suspension of the vehicle by assuming that the vertical and lateral motions are decoupled. It is also summarized that the comfort indices corresponding to various assessment approaches vary due to different reasons, including the acceleration measurement, index calculation, and evaluation thresholds. All comfort indices have advantages and disadvantages, so using several comparison and reference methods in the evaluation of vibration comfort is recommended.
The present paper is part of the area of research described above, focusing on the investigation of RC evaluation methods, but with a completely different approach. In the paper, the effect of frequency weighting, corresponding to the Sperling index method, is analyzed both for the evaluation of RQ and for the evaluation of RC, on the dynamic response of the railway vehicle carbody to vertical vibrations. These aspects help outline how the frequency weighting functions influence the RC and RQ assessments according to the Sperling index method.
The numerical simulation applications were developed based on an original 15 degrees of freedom model of the vehicle–track system, which includes the rigid and flexible modes of the vehicle, as well as an equivalent model for the track. This model considers important factors for vehicle vibration, namely the carbody’s structural flexibility, the system through which the longitudinal forces are transferred between the bogies and the carbody, and the elasticity of the wheel–rail contact. The carbody vibration is calculated in an original manner, represented as the form of the PSD of the acceleration for three different analysis cases: unweighted PSD of the acceleration, and frequency-weighted PSD of the acceleration with the corresponding weighting functions for RQ and RC evaluation. These analyses lead to important conclusions regarding the effect of the two weighting functions on the dominant vibration modes of the carbody, which are then correlated with the results for the Wz indices used in the evaluation of RQ and RC.
2. The Mechanical Model of the Railway Vehicle–Track System
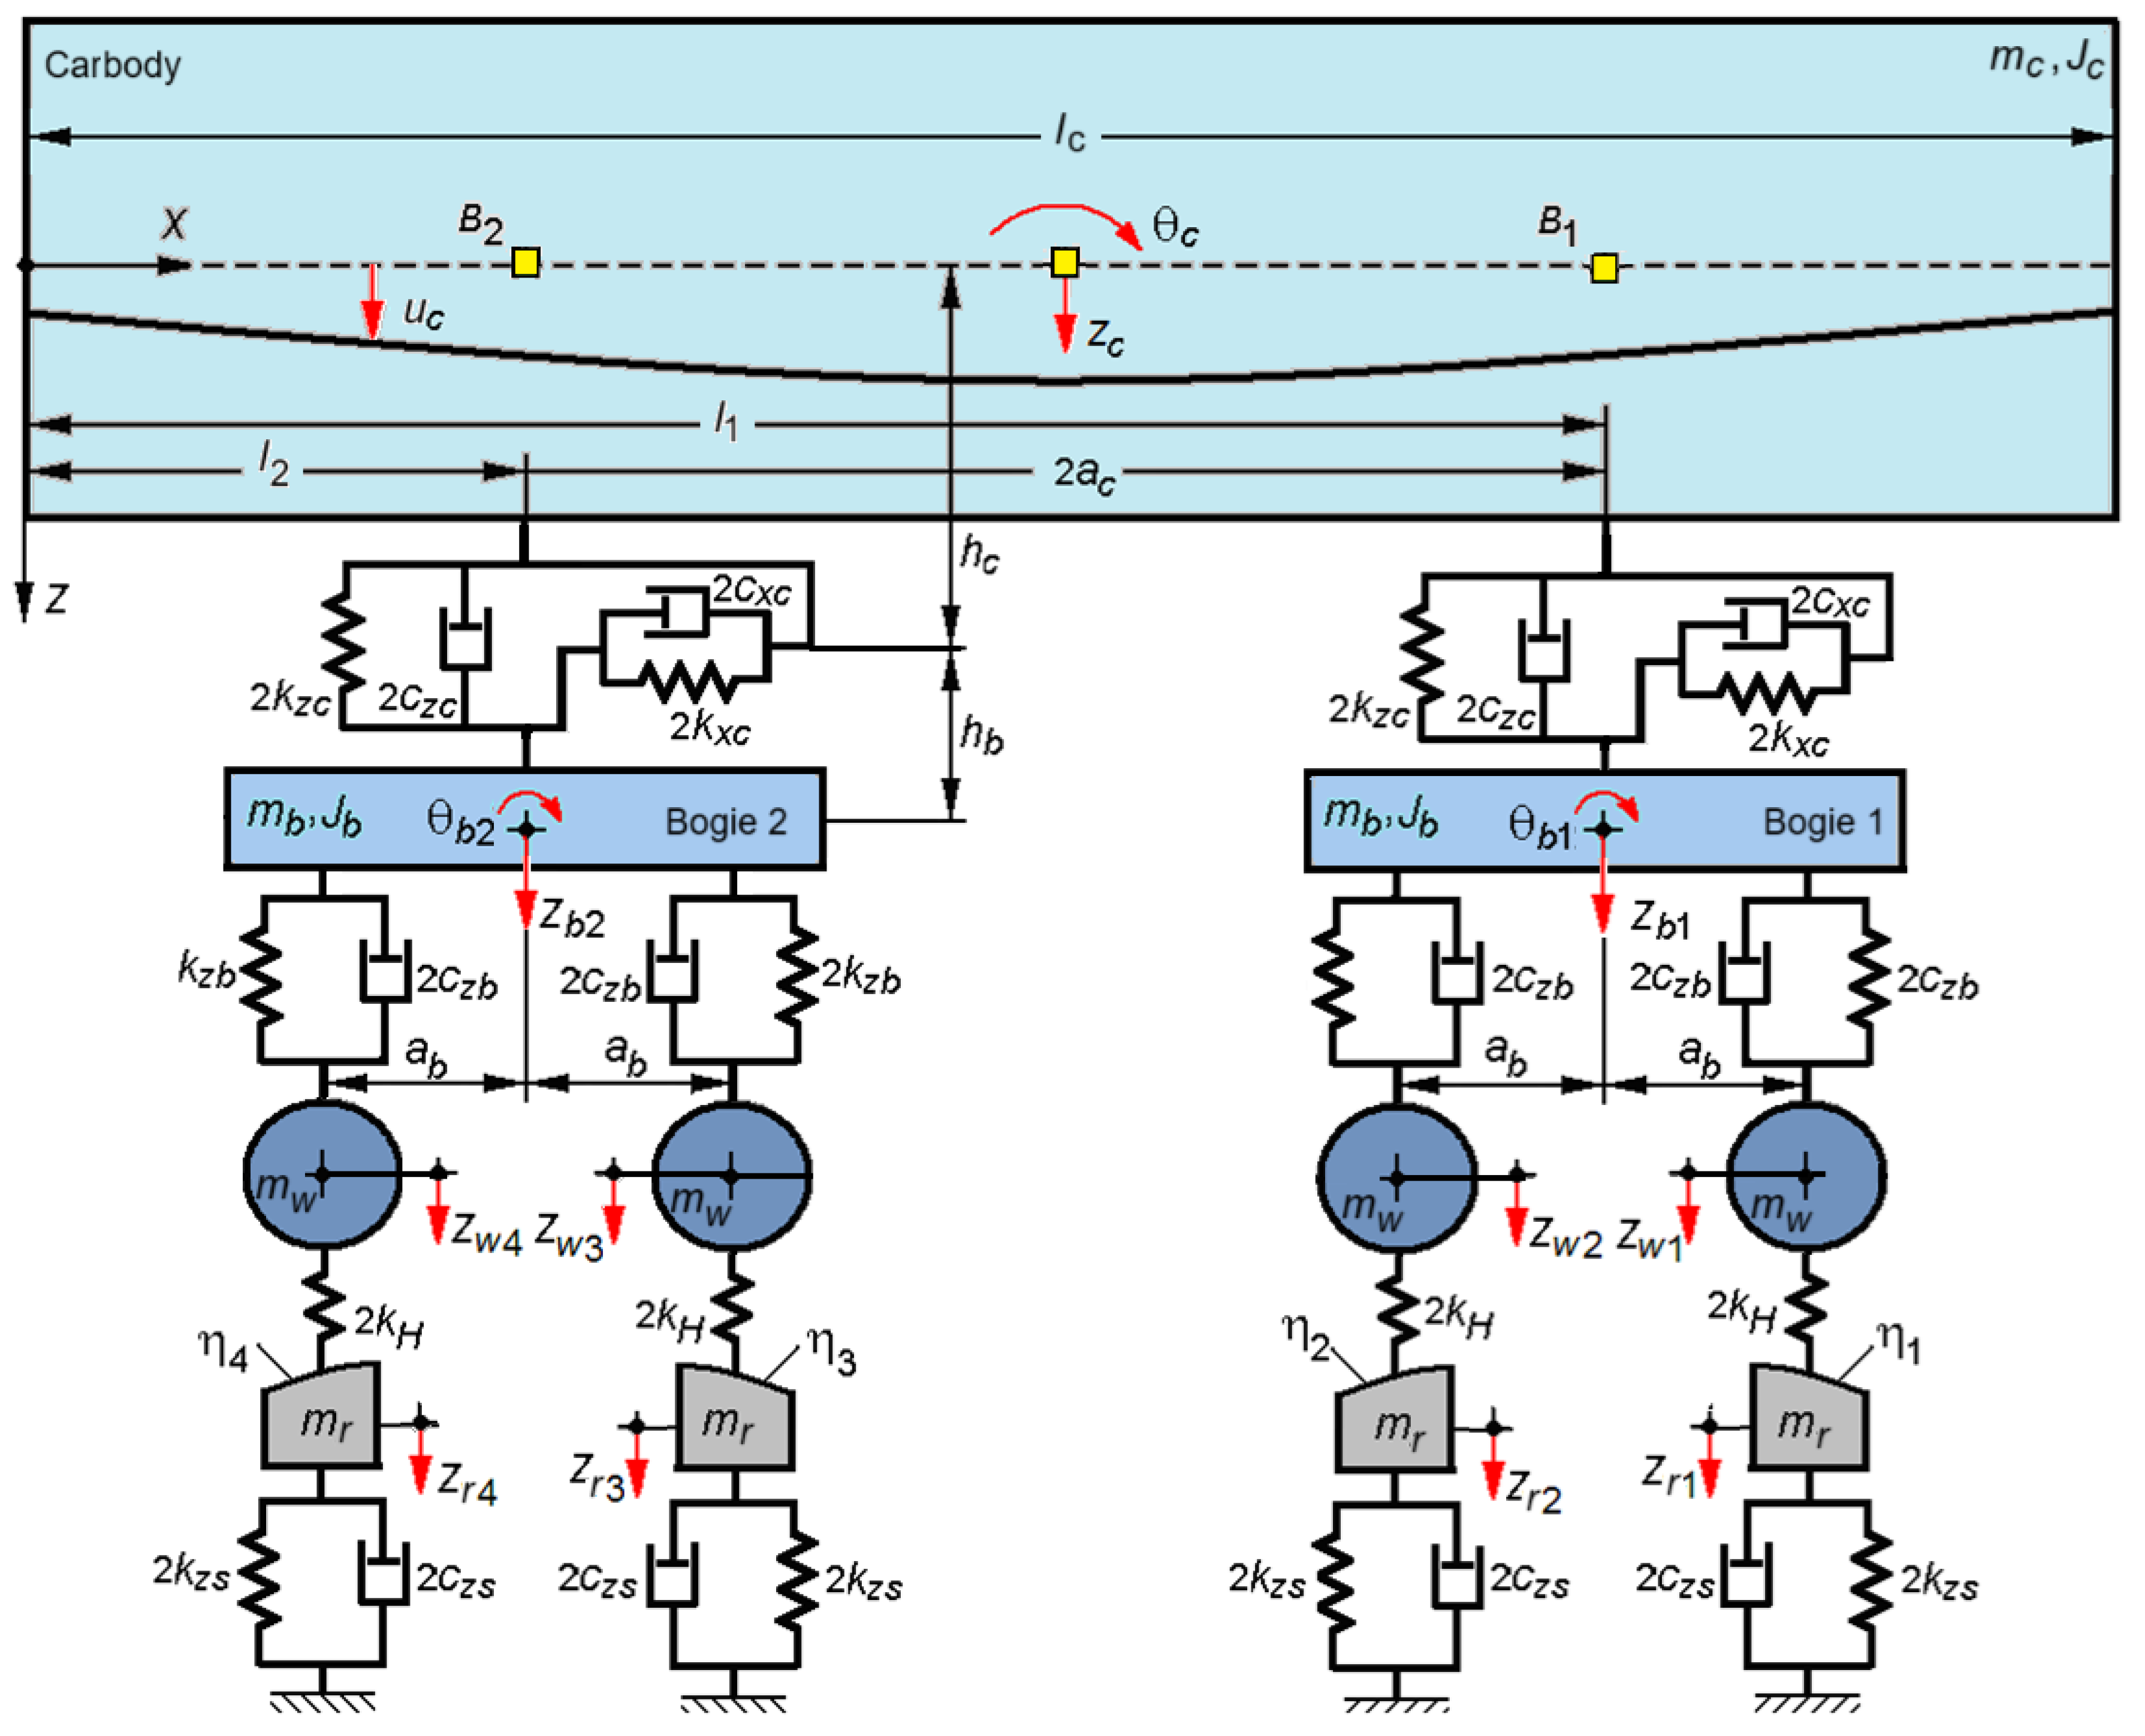
Figure 1 displays the mechanical model of a passenger railway vehicle running at constant velocity on a straight track affected by random vertical irregularities. The mechanical model of the vehicle comprises an equivalent beam for the carbody, two rigid bodies for the chassis of the bogies, and four rigid bodies for the vehicle wheelsets. These bodies are coupled to each other by Kelvin–Voigt systems, through which the secondary suspension and the primary suspension of the vehicle are represented.
The carbody model exhibits three vibration modes: bounce, pitch, and the first vertical bending mode. The carbody inertia in relation to the bounce and pitch modes is represented by the mass mc and the moment of inertia Jc.
In
Figure 1, the displacements and the rotation of the carbody in the vertical plane are highlighted. The bounce motion is denoted as
zc, and the rotation angle of the pitch motion is denoted as θ
c. The displacement of a section of the carbody, denoted as
uc, results from the superposition of the three vibration modes mentioned above.
At a given instant of time
t, the vertical displacement of the carbody at section
x is given by the following relation:
where
Tc is the time coordinate of the first vertical bending mode,
Yc is the eigenfunction of the vertical bending, and
lc represents the length of the carbody.
The
Yc eigenfunction is calculated with the following relationship:
where
is the solution to the equation
ω
c is the natural angular frequency of the carbody vertical bending; ρ
c =
mc/
lc is the carbody mass per unit length;
EcIc represents the bending stiffness of the carbody; with
Ec represents Young’s modulus; and
Ic represents the second moment of aria of the cross section of the carbody.
For bogies, two degrees of freedom are considered: the bounce denoted as zb1,2 and the pitch denoted as θb1,2. mb denotes the bogie chassis mass, and Jb denotes the moment of inertia.
The wheelsets, with mass mw, have vertical motion denoted by zw1…4.
Above each wheelset, the track model is an oscillator with one degree of freedom, having mass
mr, stiffness 2
kzr, and damping constant 2
czr. This is justified because the coupling between the wheels via the rail bending waves can be neglected at low frequencies. Oscillator displacement is denoted by
zr1…4. The vertical irregularities of the track in front of each wheel are denoted with η
1…4. When the track irregularity is a harmonic function, the vertical irregularities η
1…4 can be calculated as follows:
where
x =
Vt gives the position of the carbody center (
V represents the velocity of the vehicle), and ω = 2π
V/Λ is the angular frequency induced by the track irregularity of the amplitude η
0 and wavelength Λ.
To model the wheel–rail contact, a linear elastic element of stiffness 2kH is inserted in each wheel–rail pair.
The primary suspension model consists of a single Kelvin–Voigt system for each wheelset with the stiffness of 2kzb and the damping constant 2czb. The model of the secondary suspension has two Kelvin–Voigt systems per bogie, one for the vertical displacement and other one for the longitudinal displacement. The vertical stiffness and damping constant are denoted by 2kzc and 2czc, respectively, and the longitudinal stiffness and damping constant are denoted by 2kxc and 2cxc, respectively. The longitudinal Kelvin–Voigt system is positioned at the distance hc in relation to the neutral axis of the carbody and at the distance hb from the bogie center.
On the model in
Figure 1, three relevant points are labeled: point
M, positioned at the carbody middle, and points
B1 and
B2, located above to the two bogies.
To derive the equations of motion for the vibration modes of the carbody, the following equation is used as the starting point:
where δ(.) is Dirac’s delta function, μ represents the damping coefficient, the distances
l1,2 fix the position of the carbody support points on the secondary suspension, and the forces
Fzc1,2 and
Fxc1,2 are applied by the components of the secondary suspension.
The distances
l1,2 are calculated according to the carbody length
lc and its semi-wheelbase, denoted with
ac and, respectively,
For the forces, due to the secondary suspension, the relations are given as follows:
The equations of motion for the vibration modes of the carbody are obtained via the following modal analysis technique:
where
mmc,
cmc, and
kmc are the modal mass, modal damping, and modal stiffness of the carbody, and are calculated with the following relations:
In the equations of motion of the carbody (11)–(13), the expressions of the forces
Fzc1,2 and
Fxc1,2 are substituted, according to relations (9) and (10). Also, the next notations are introduced as follows:
The equations of motion of the carbody become the following:
The equations that describe the motion of the bogies are as follows:
in which
Fzbj are the forces applied by components of the primary suspension:
where
ab represents the semi-wheelbase of the bogie.
After processing, Equations (20)–(23) become the following:
On each wheelset, the vertical force from the primary suspension,
Fzbj (see Equations (24) and (25)), and the vertical dynamic force,
Fj, with
j = 1…4, act as follows:
The equations of motion of the four wheelsets have the following general form:
After replacing the expressions of the forces
Fj and
Fzbj, the equations of motion (31) can be rewritten as follows:
On each rail, the vertical dynamic force,
Fj (Equation (30)), and the vertical force,
Fzrj, are given by the following relation:
The equations of motion of the rails corresponding to the wheelset
j are of the form
which are brought to the following form:
The 15 equations of motion of the mechanical model of the passenger vehicle can be organized into a matrix equation:
where
p is the vector of the displacements and
η is the vector of the inhomogeneous terms. The matrices
M,
C, and
K are the inertia, damping, and stiffness matrices of the system.
3. Sperling Index Method
The Sperling index method, also known as the Wz index method [
17,
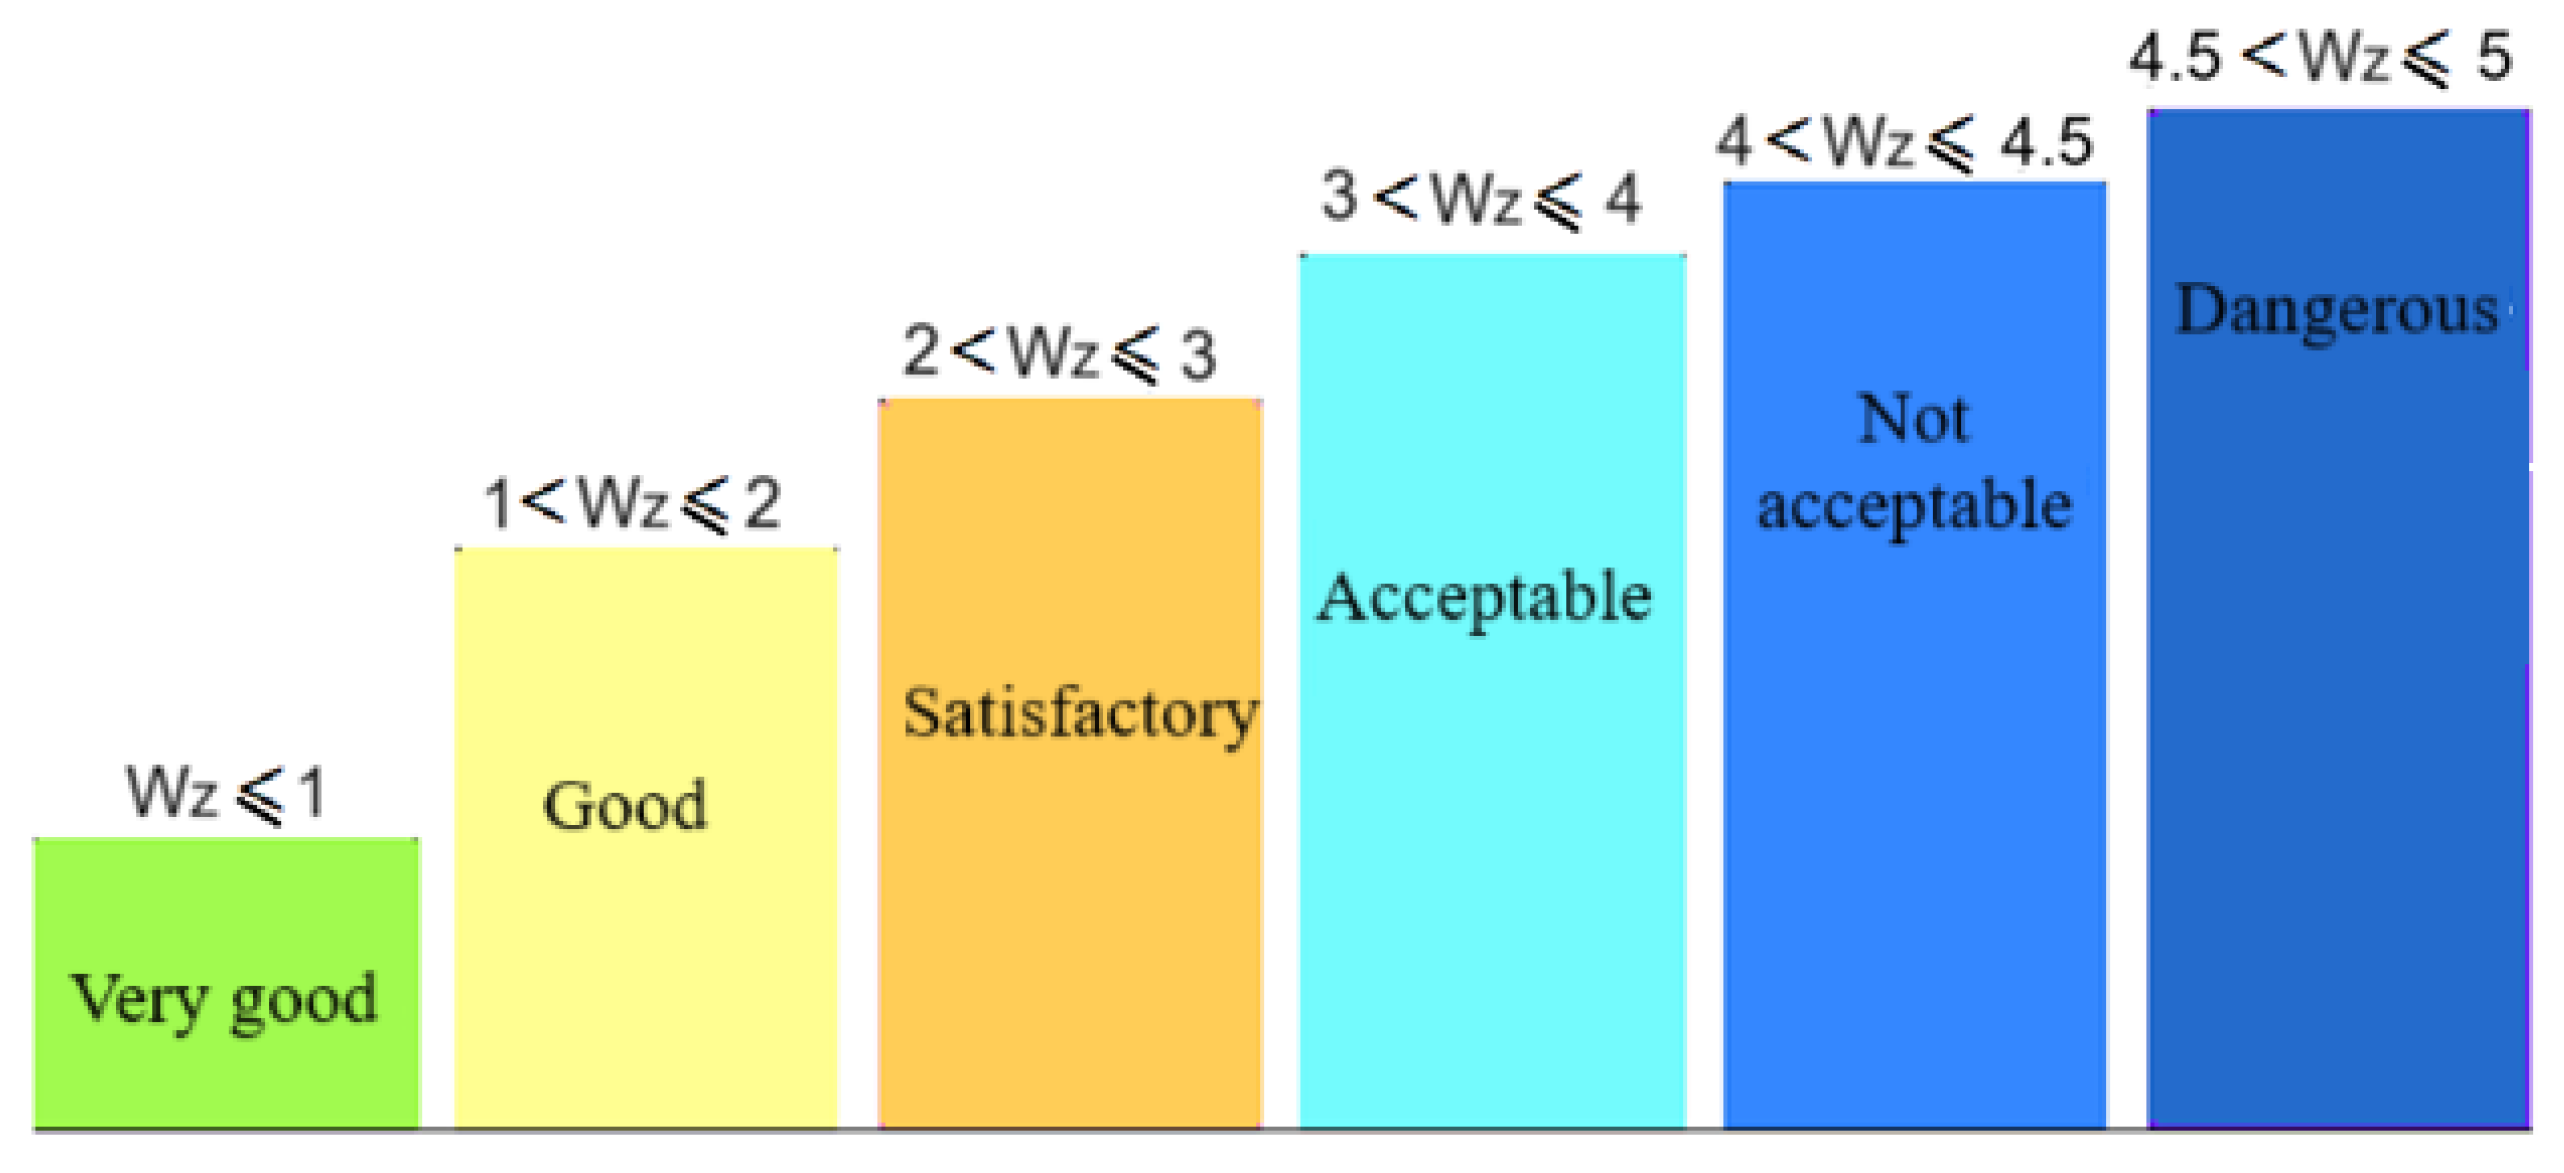
18], is used both for the evaluation of RQ and RC in the carbody. By applying this method, the Wz index is obtained, which has a precise meaning, based on which the performance of the railway vehicle, in terms of RQ and RC, can be evaluated. The scale of values and significance of the Wz indices for RQ is presented in
Figure 2, and
Figure 3 displays the scale of values of the Wz indices indicating passengers’ perception of railway vehicle vibrations.
The calculation relation of the comfort index W
z is of the form
where
a stands for the vertical acceleration of the carbody, expressed in cm/s
2,
B stands for the frequency weighting function, and
f is the frequency (
f = ω/2π).
Relation (39) is valid on the assumption that the acceleration spectrum is a continuous function of frequency between 0.5 and 30 Hz.
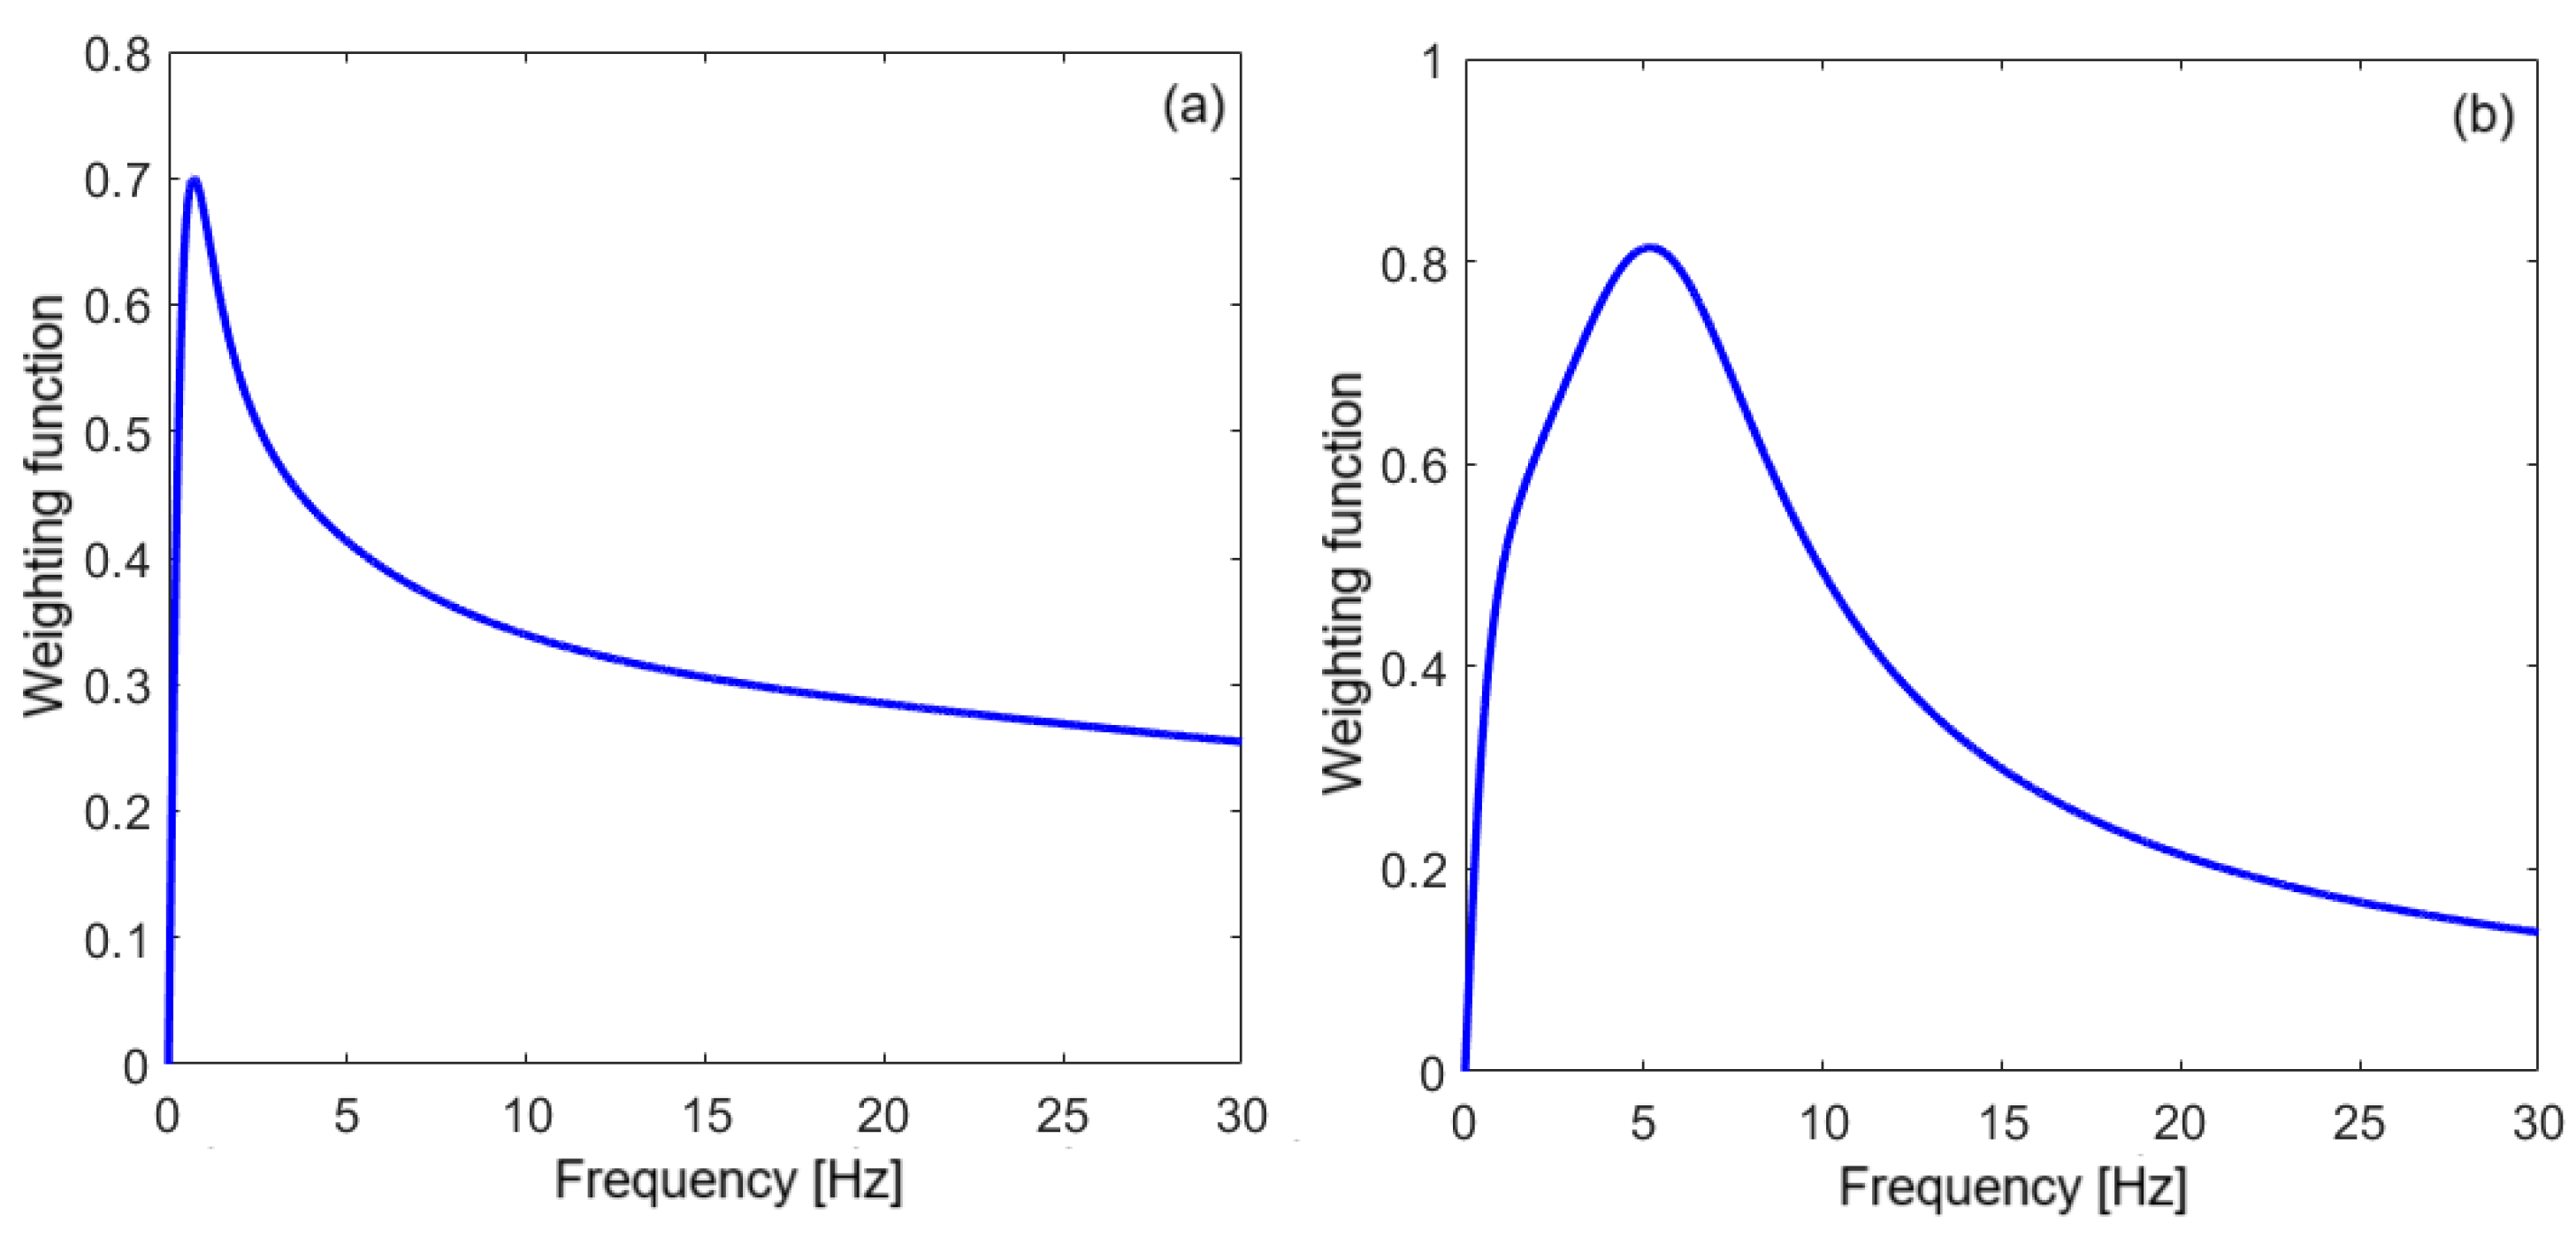
The weighting function
B is computed differently for the evaluation of the RQ and the RC (see
Figure 4), respectively, according to the relations below.
- -
for the evaluation the RQ we use the following relation:
- -
for evaluation the RC to vertical vibrations, we use the following one:
where
q0 = 1.14,
q1 = 0.056,
q2 = 0.645,
q3 = 3.55,
q4 = 0.252,
q5 = 1.547,
q6 = 0.00444,
q7 = 3.55, and
c0 = 0.588,
c1 = 1.911,
c2 = 0.25,
c3 = 0.277,
c4 = 1.563 and
c5 = 0.0368.
The RMS acceleration of the carbody is computed in the three relevant points of the vibration behavior of the carbody, respectively, points
M,
B1, and
B2 (see
Figure 1), based on the PSD of the following acceleration:
- -
the RMS of the acceleration at the middle of the carbody (point
M),
- -
and the RMS of the acceleration above the two bogies (points
B1 and
B2),
where
and
represents the PSD of the acceleration at the carbody relevant points, which are calculated as a function of the PSD of the vertical irregularities of the track G(ω) and the frequency response functions of the carbody acceleration,
and
.
The theoretical curve of the PSD of the track irregularities can be described by relation [
29]:
where Ω
c = 0.8246 rad/m, Ω
r = 0.0206 rad/m, and the constant
A depends on the quality of the track. For a track of good quality, it is considered that
A = 2119 × 10
−7 radm, and in the case of a track with low quality, the constant
A is assigned a value of 6.124 × 10
−7 radm.
The frequency response functions of the acceleration in the relevant points of the carbody are calculated based on the functions of the frequency response functions corresponding to the vibration modes of the carbody and the partial response functions for bounce , pitch , and vertical bending .
At the relevant point located at the carbody center, the frequency response function of the acceleration of the carbody is given by the following relationship:
At the relevant points
B1 and
B2 of the carbody, located above the bogies, the frequency response functions of the acceleration are calculated according to the following relationship:
Starting from relation (39), in which the RMS of the acceleration corresponding to relations (42) and (43), expressed in cm/s
2, and the weighting function
B according to relations (40) or (41) for
f = ω/2π, the following relations are derived for the calculation of the Wz index at the relevant points of the carbody:
4. Dynamic Response of the Carbody to Vertical Vibrations
The effect of frequency weighting according to the Sperling index method on the dynamic response of the carbody to vertical vibrations is calculated based on the mechanical model previously presented and analyzed. The vehicle’s dimensions are specific to the type X coach equipped with 250 km/h bogie, in accordance with [
30].
The dynamic response of the vehicle carbody is analyzed by considering the PSD of the acceleration, both unweighted and frequency-weighted, using the two weighting functions (Brq and Brc) corresponding to RQ and RC, respectively. The results obtained are correlated with the results of the Wz indices for the RQ evaluation and the RC evaluation.
Table 1 contains the values of the mechanical model parameters. The vehicle is running on a low-quality track.
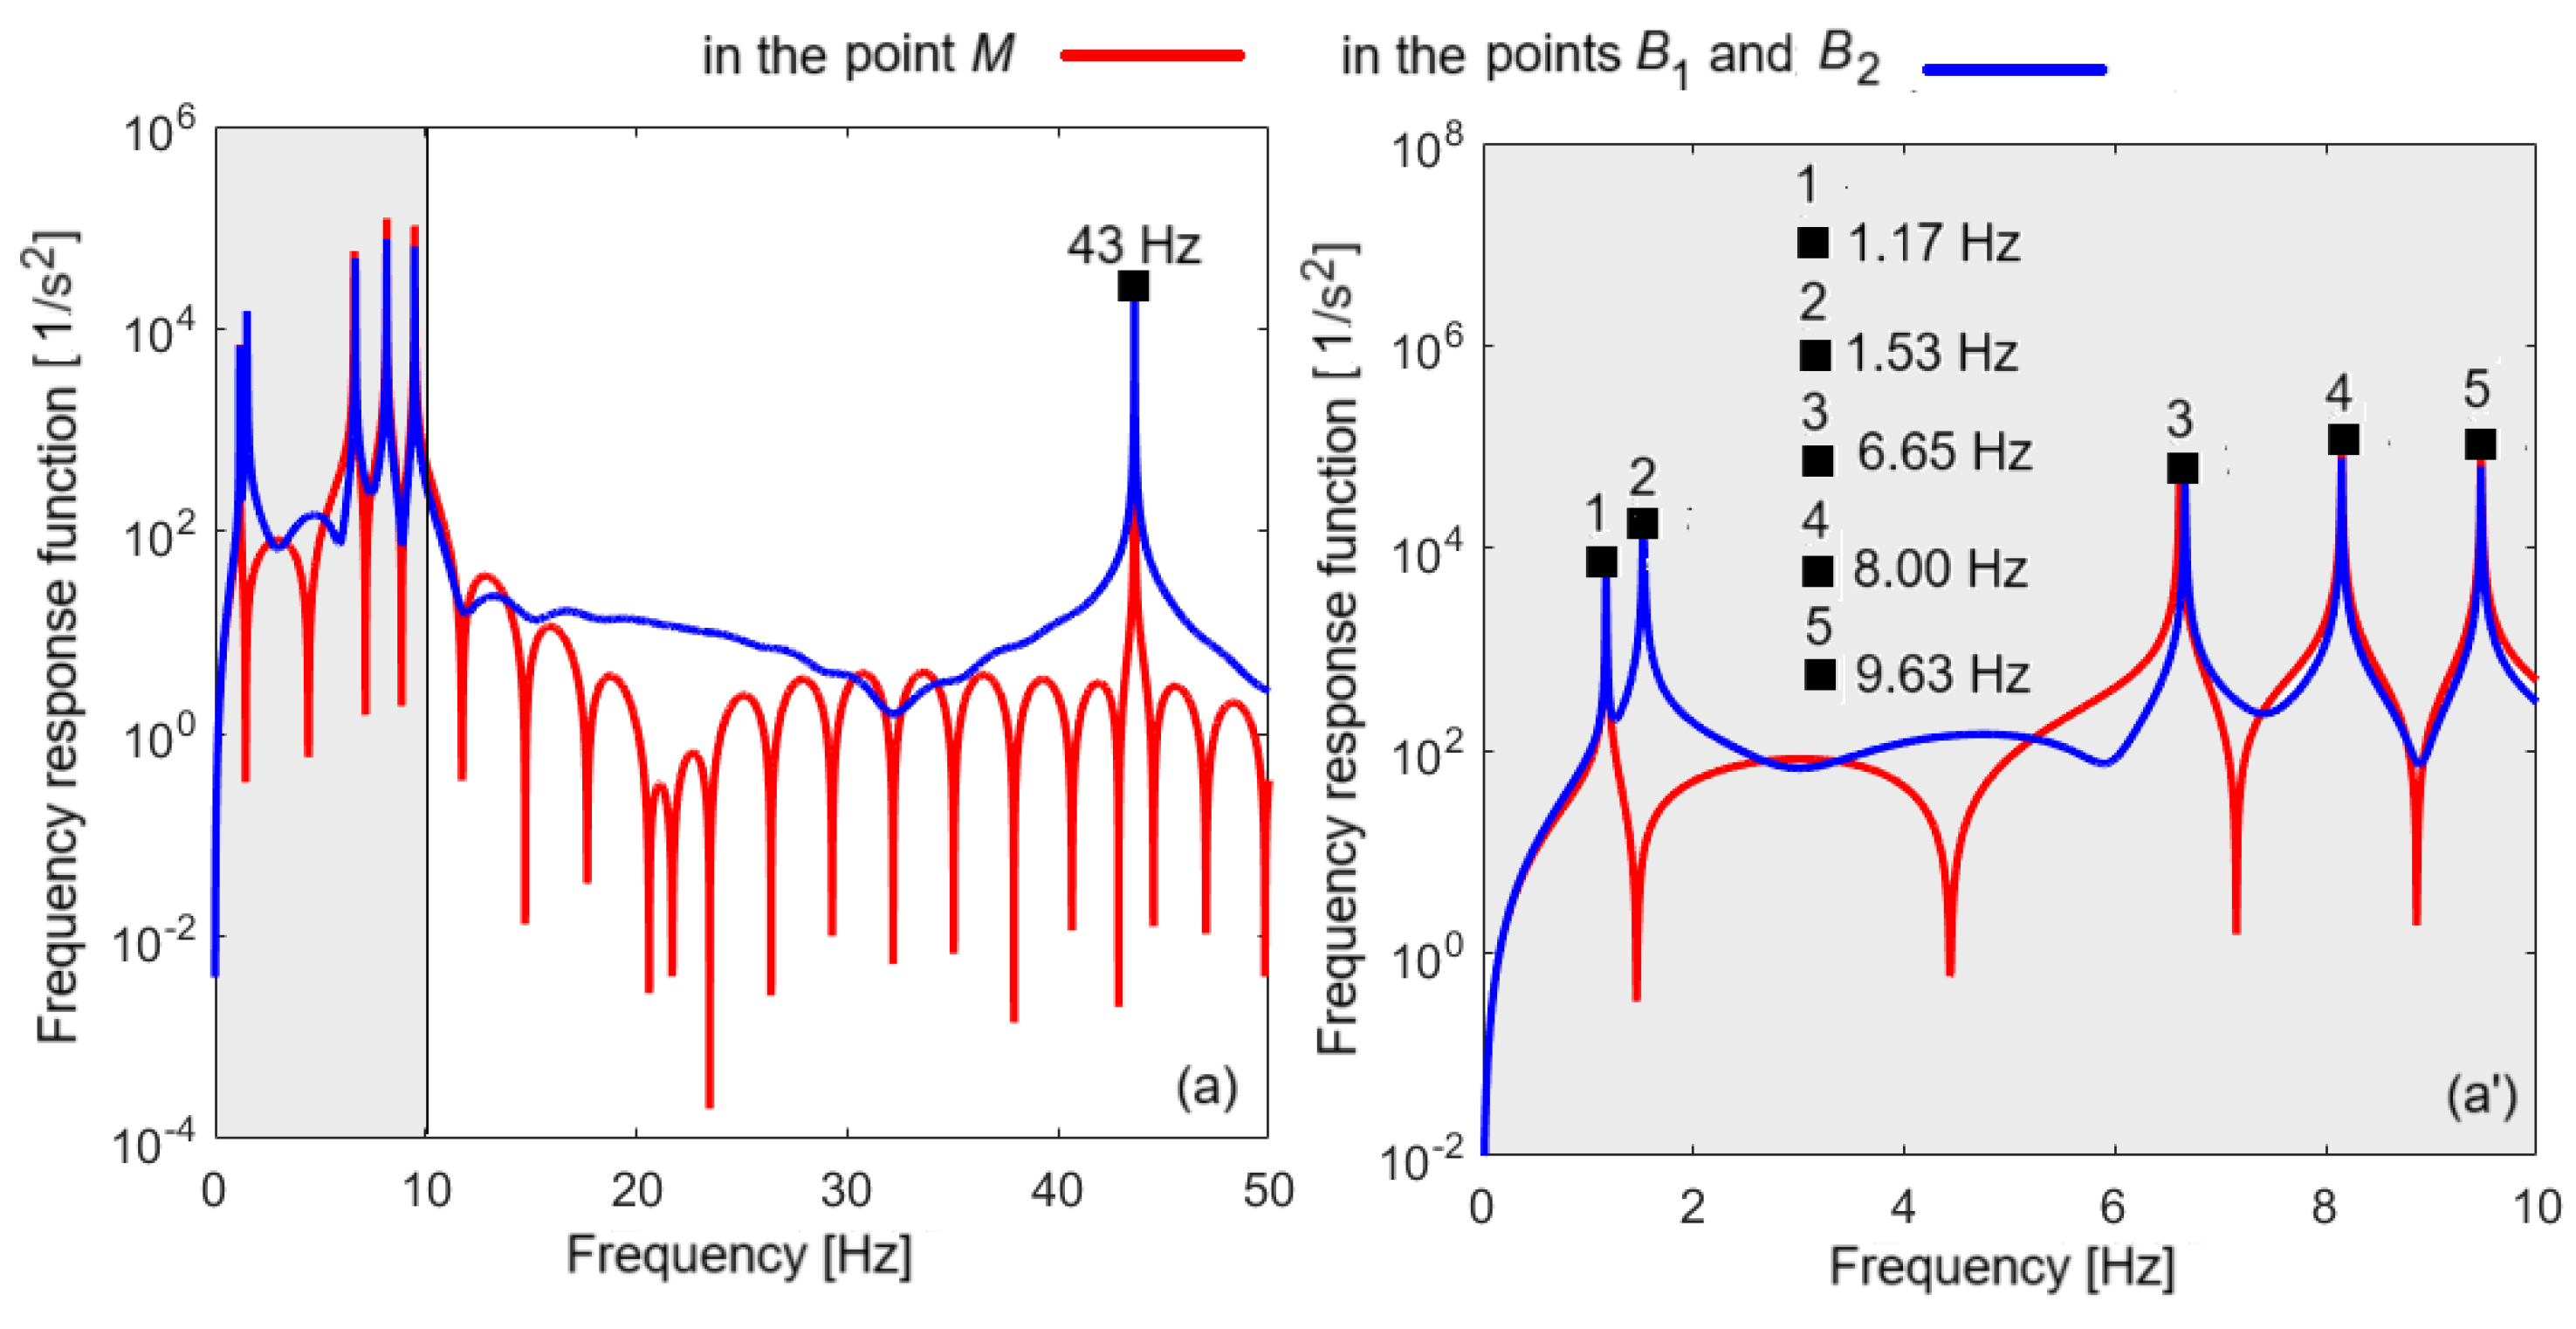
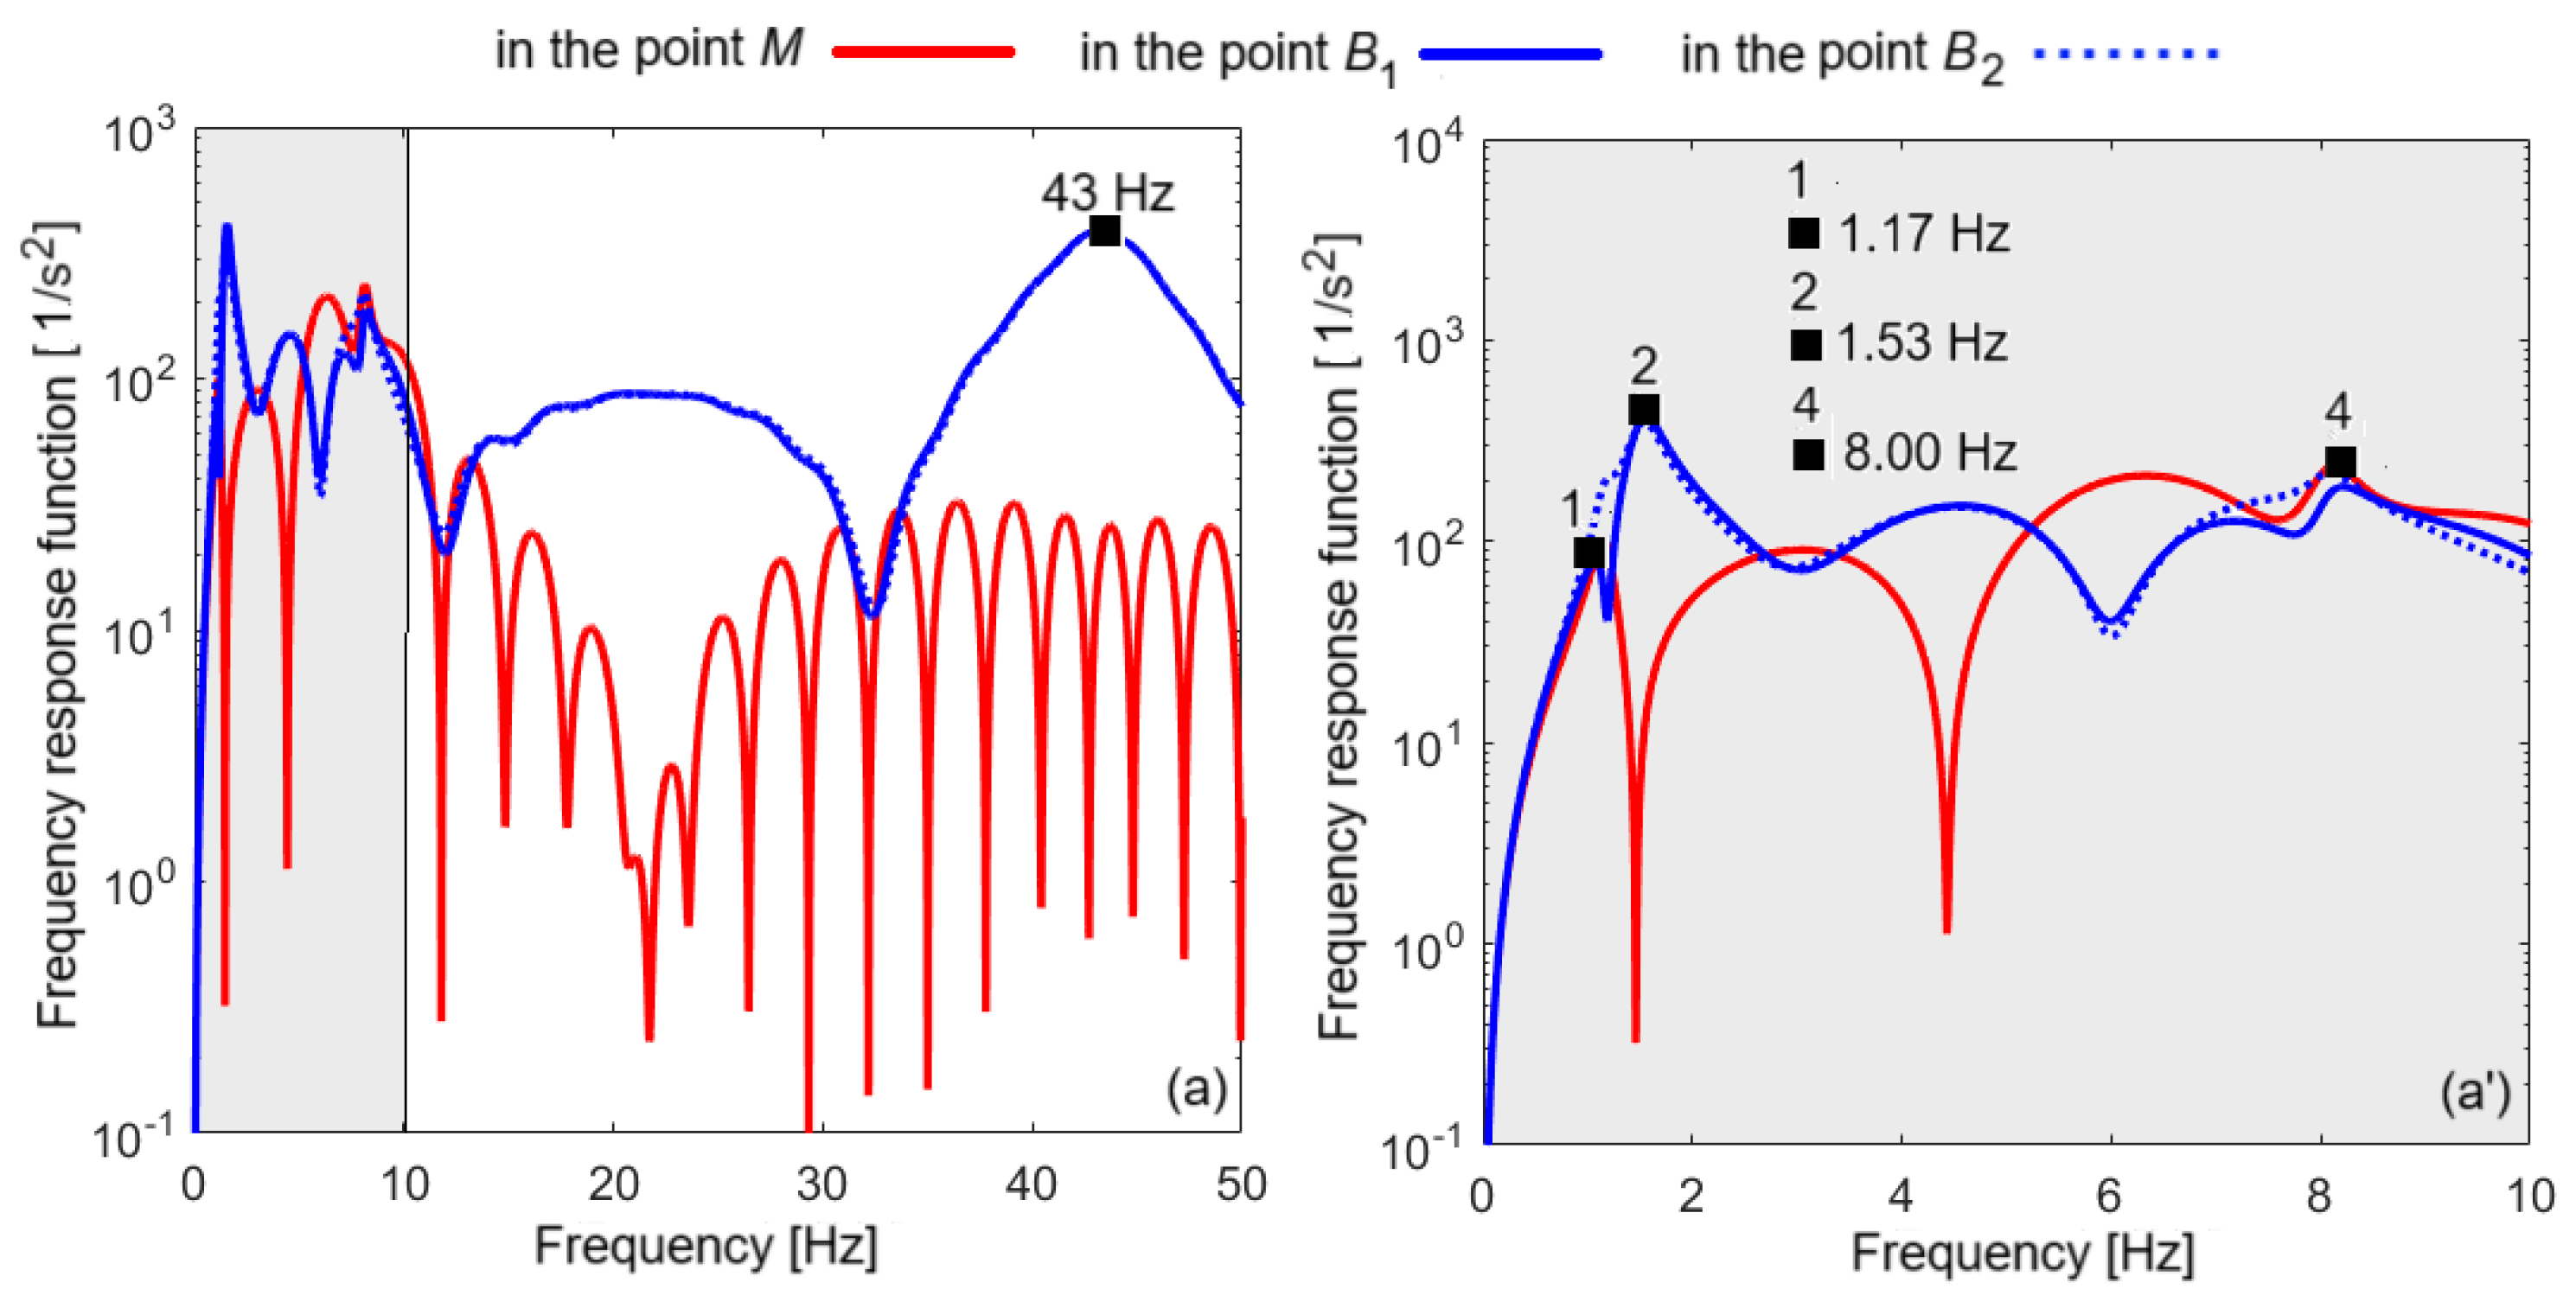
Figure 5 presents the frequency response functions of the acceleration at the relevant points of the carbody—points
M,
B1, and
B2, obtained for the undamped case and for
czc = 0,
cxc = 0,
czb = 0,
cm = 0, and
czs = 0, respectively. The response function curves show several peaks corresponding to the resonance frequencies of the vehicle and several minima corresponding to the antiresonance frequencies. On diagram (a), the peak of the response functions at the resonance frequency of the wheelset is marked at 43 Hz. The frequency range, in which the peaks of the resonance frequencies of the vibration modes of the carbody and bogies are found, is selected on diagram (a) and marked in gray; these are highlighted in diagram (a’). The following eigenfrequencies are marked on diagram (a’): 1.17 Hz—resonance frequency of the carbody bounce; 1.56 Hz—resonance frequency of the carbody pitch; 6.65 Hz—resonance frequency of the bogie bounce; 8.00 Hz—resonance frequency of the carbody vertical bending; 9.63 Hz—resonance frequency of the bogie pitch.
Figure 6 displays the frequency response functions of the carbody acceleration at the relevant points of the carbody, considering the damping constants from
Table 1. In diagram (a), the frequency range 0–50 Hz was considered, in which the resonance frequency of the vertical vibrations of the wheelset is found, at 43 Hz, and in diagram (a’), only the frequency range 0–10 Hz was selected, which includes all the resonance frequencies of the carbody. In the detail in diagram (a’), the peaks of the response functions corresponding to the resonance frequencies of the vibration modes of the carbody are marked; the peaks of the frequency response functions corresponding to the resonance frequencies of the vibration modes of the bogies are faded due to the damping of the system.
The antiresonance frequencies, which are identified in
Figure 5 and
Figure 6 on the frequency response curves of the carbody in the form of minima, are due to the geometric filtering effect. This effect represents a distinctive feature of the vertical vibration of railway vehicles, which has been analyzed in several studies [
31,
32,
33,
34]. The minima of the PSD of the acceleration correspond to the frequencies of geometric filtering. If the frequencies of geometric filtering equal the resonance frequency of one of the vibration modes of the vehicle carbody, then its impact is greatly reduced. The geometric filtering effect manifests itself more intensely at the carbody center, where the geometric filtering effects given by the bogie wheelbase and the carbody wheelbase are cumulated. Above the bogies and the support points of the carbody on the secondary suspension, the geometric filtering effect has smaller impact because the geometric filtering effect, given by the carbody wheelbase, is missing.
A final observation, highlighted in
Figure 5 and
Figure 6, refers to the vibration behavior of the carbody above the two bogies. It is observed that for the undamped system, the vibration behavior of the carbody at points
B1 and
B2 is symmetrical (
Figure 5), and when damping is taken into account, the response of the carbody at the same points is different (
Figure 6).
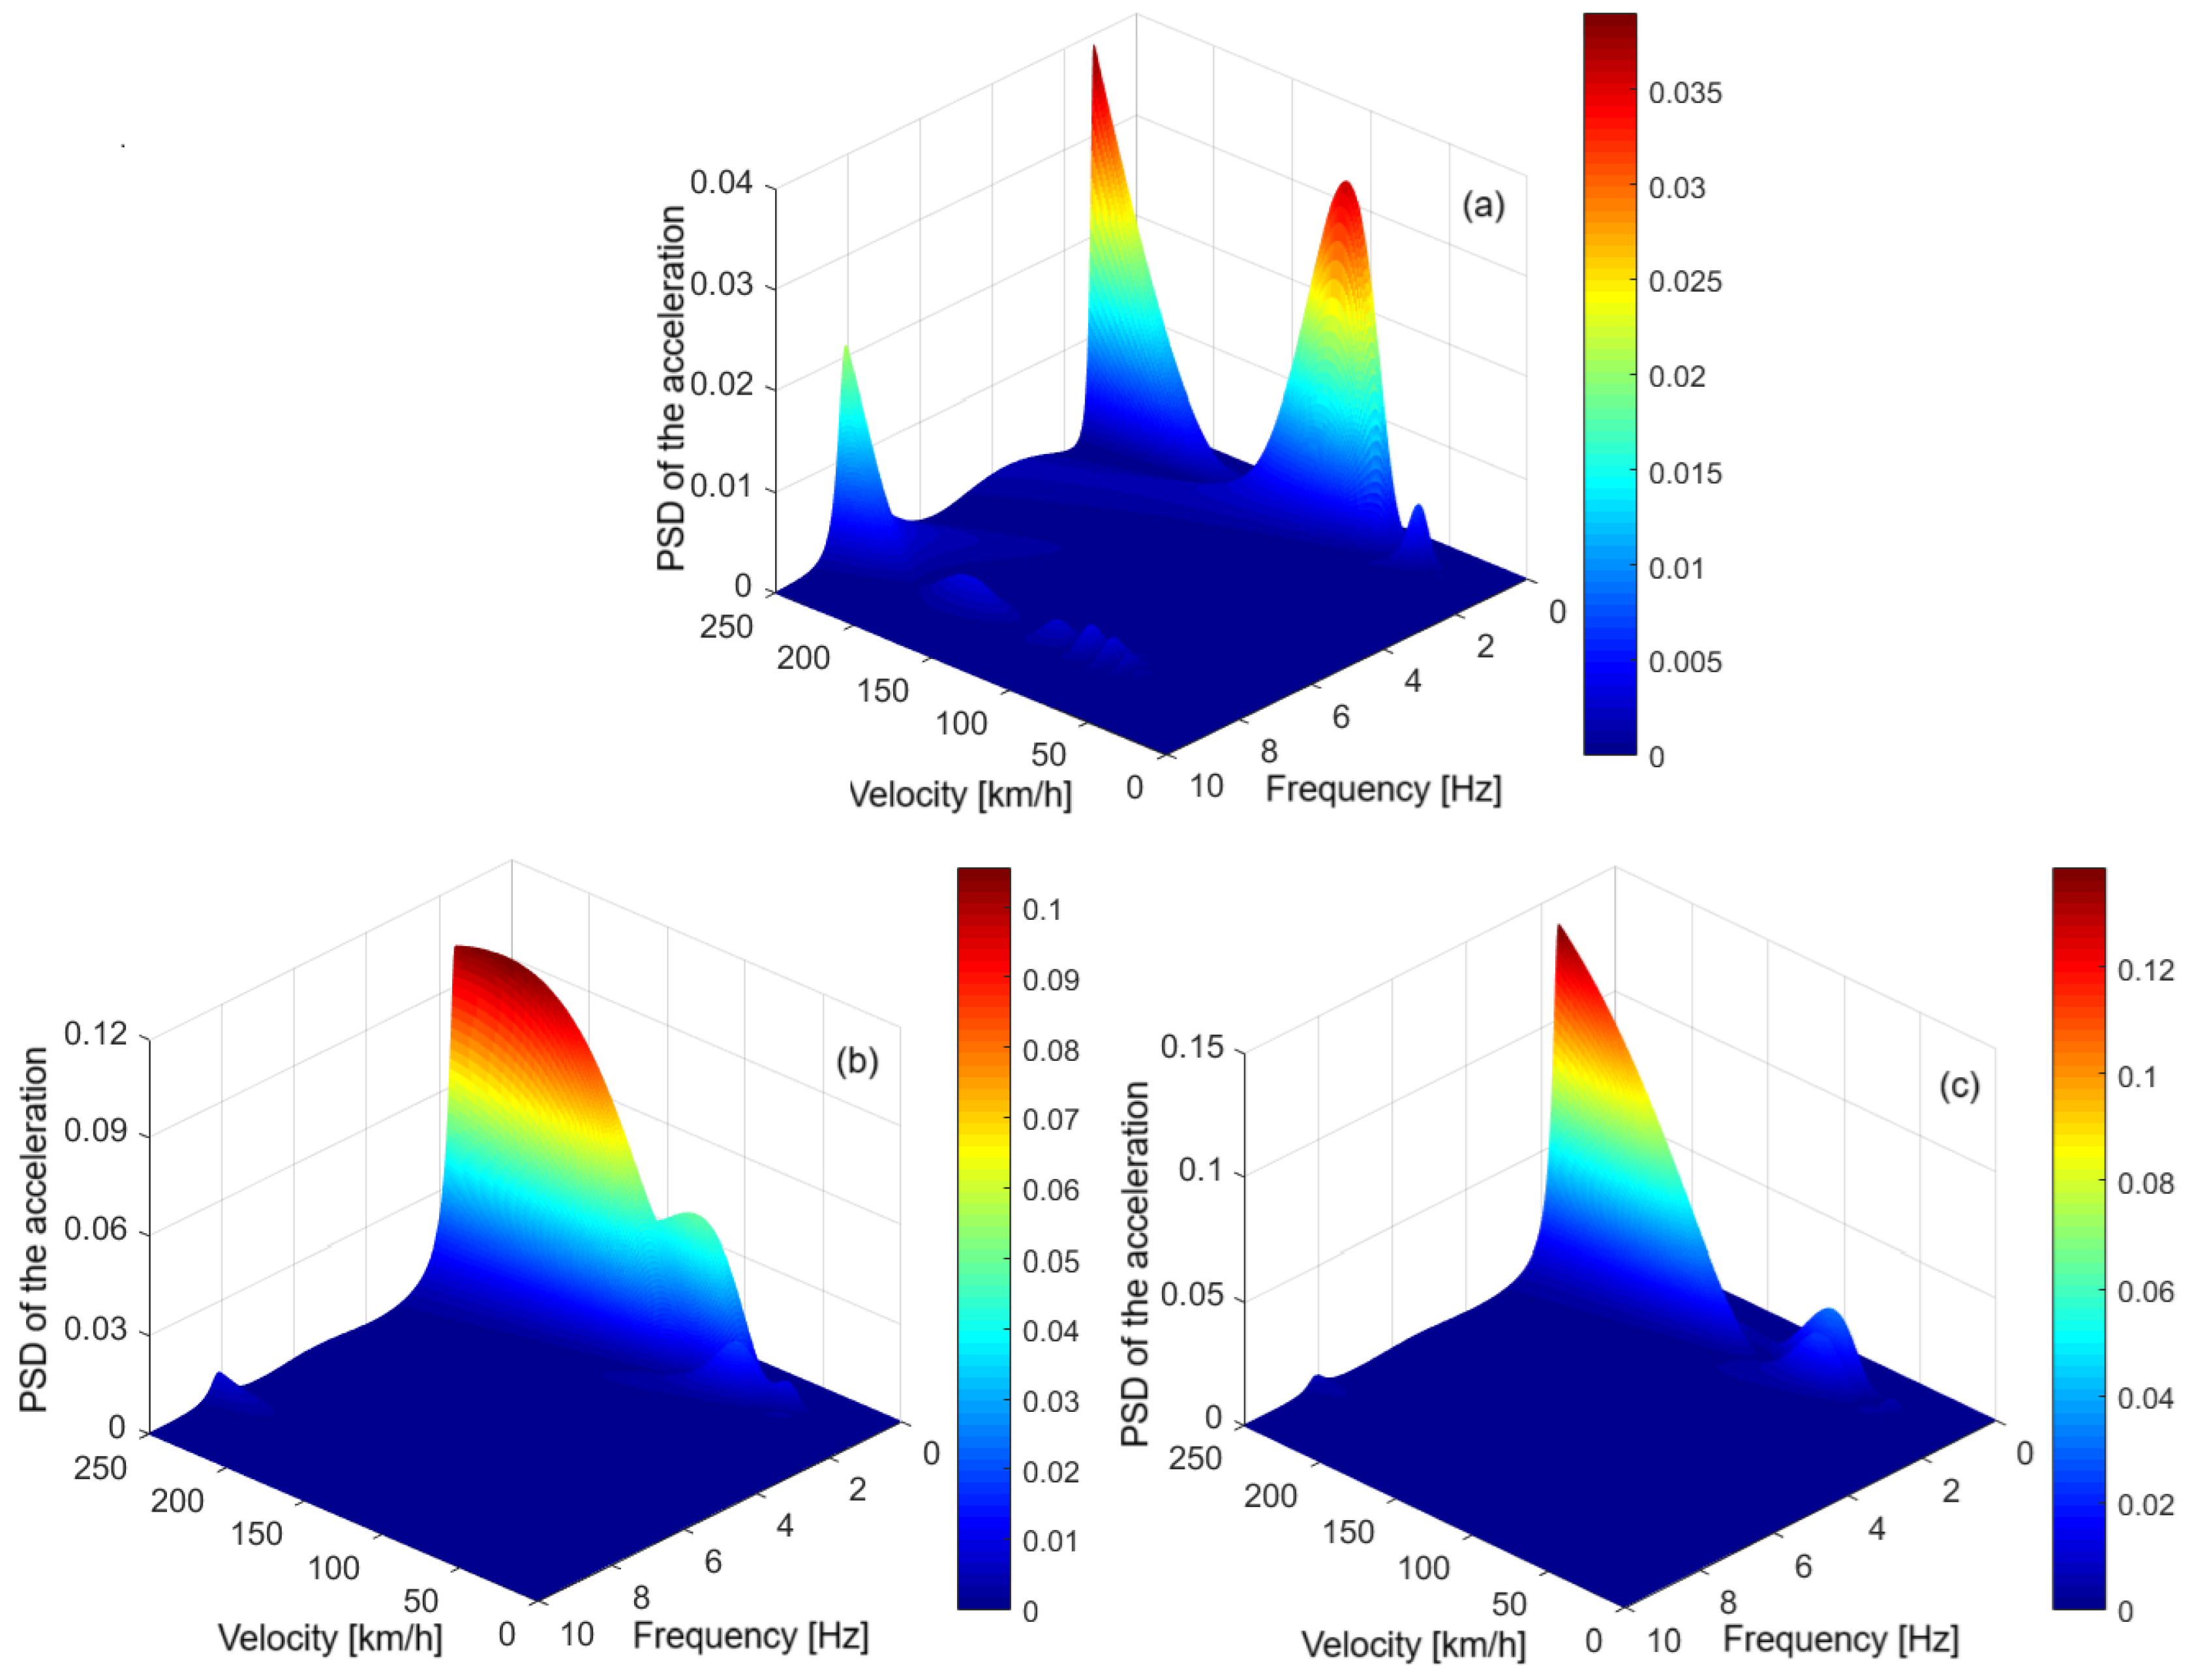
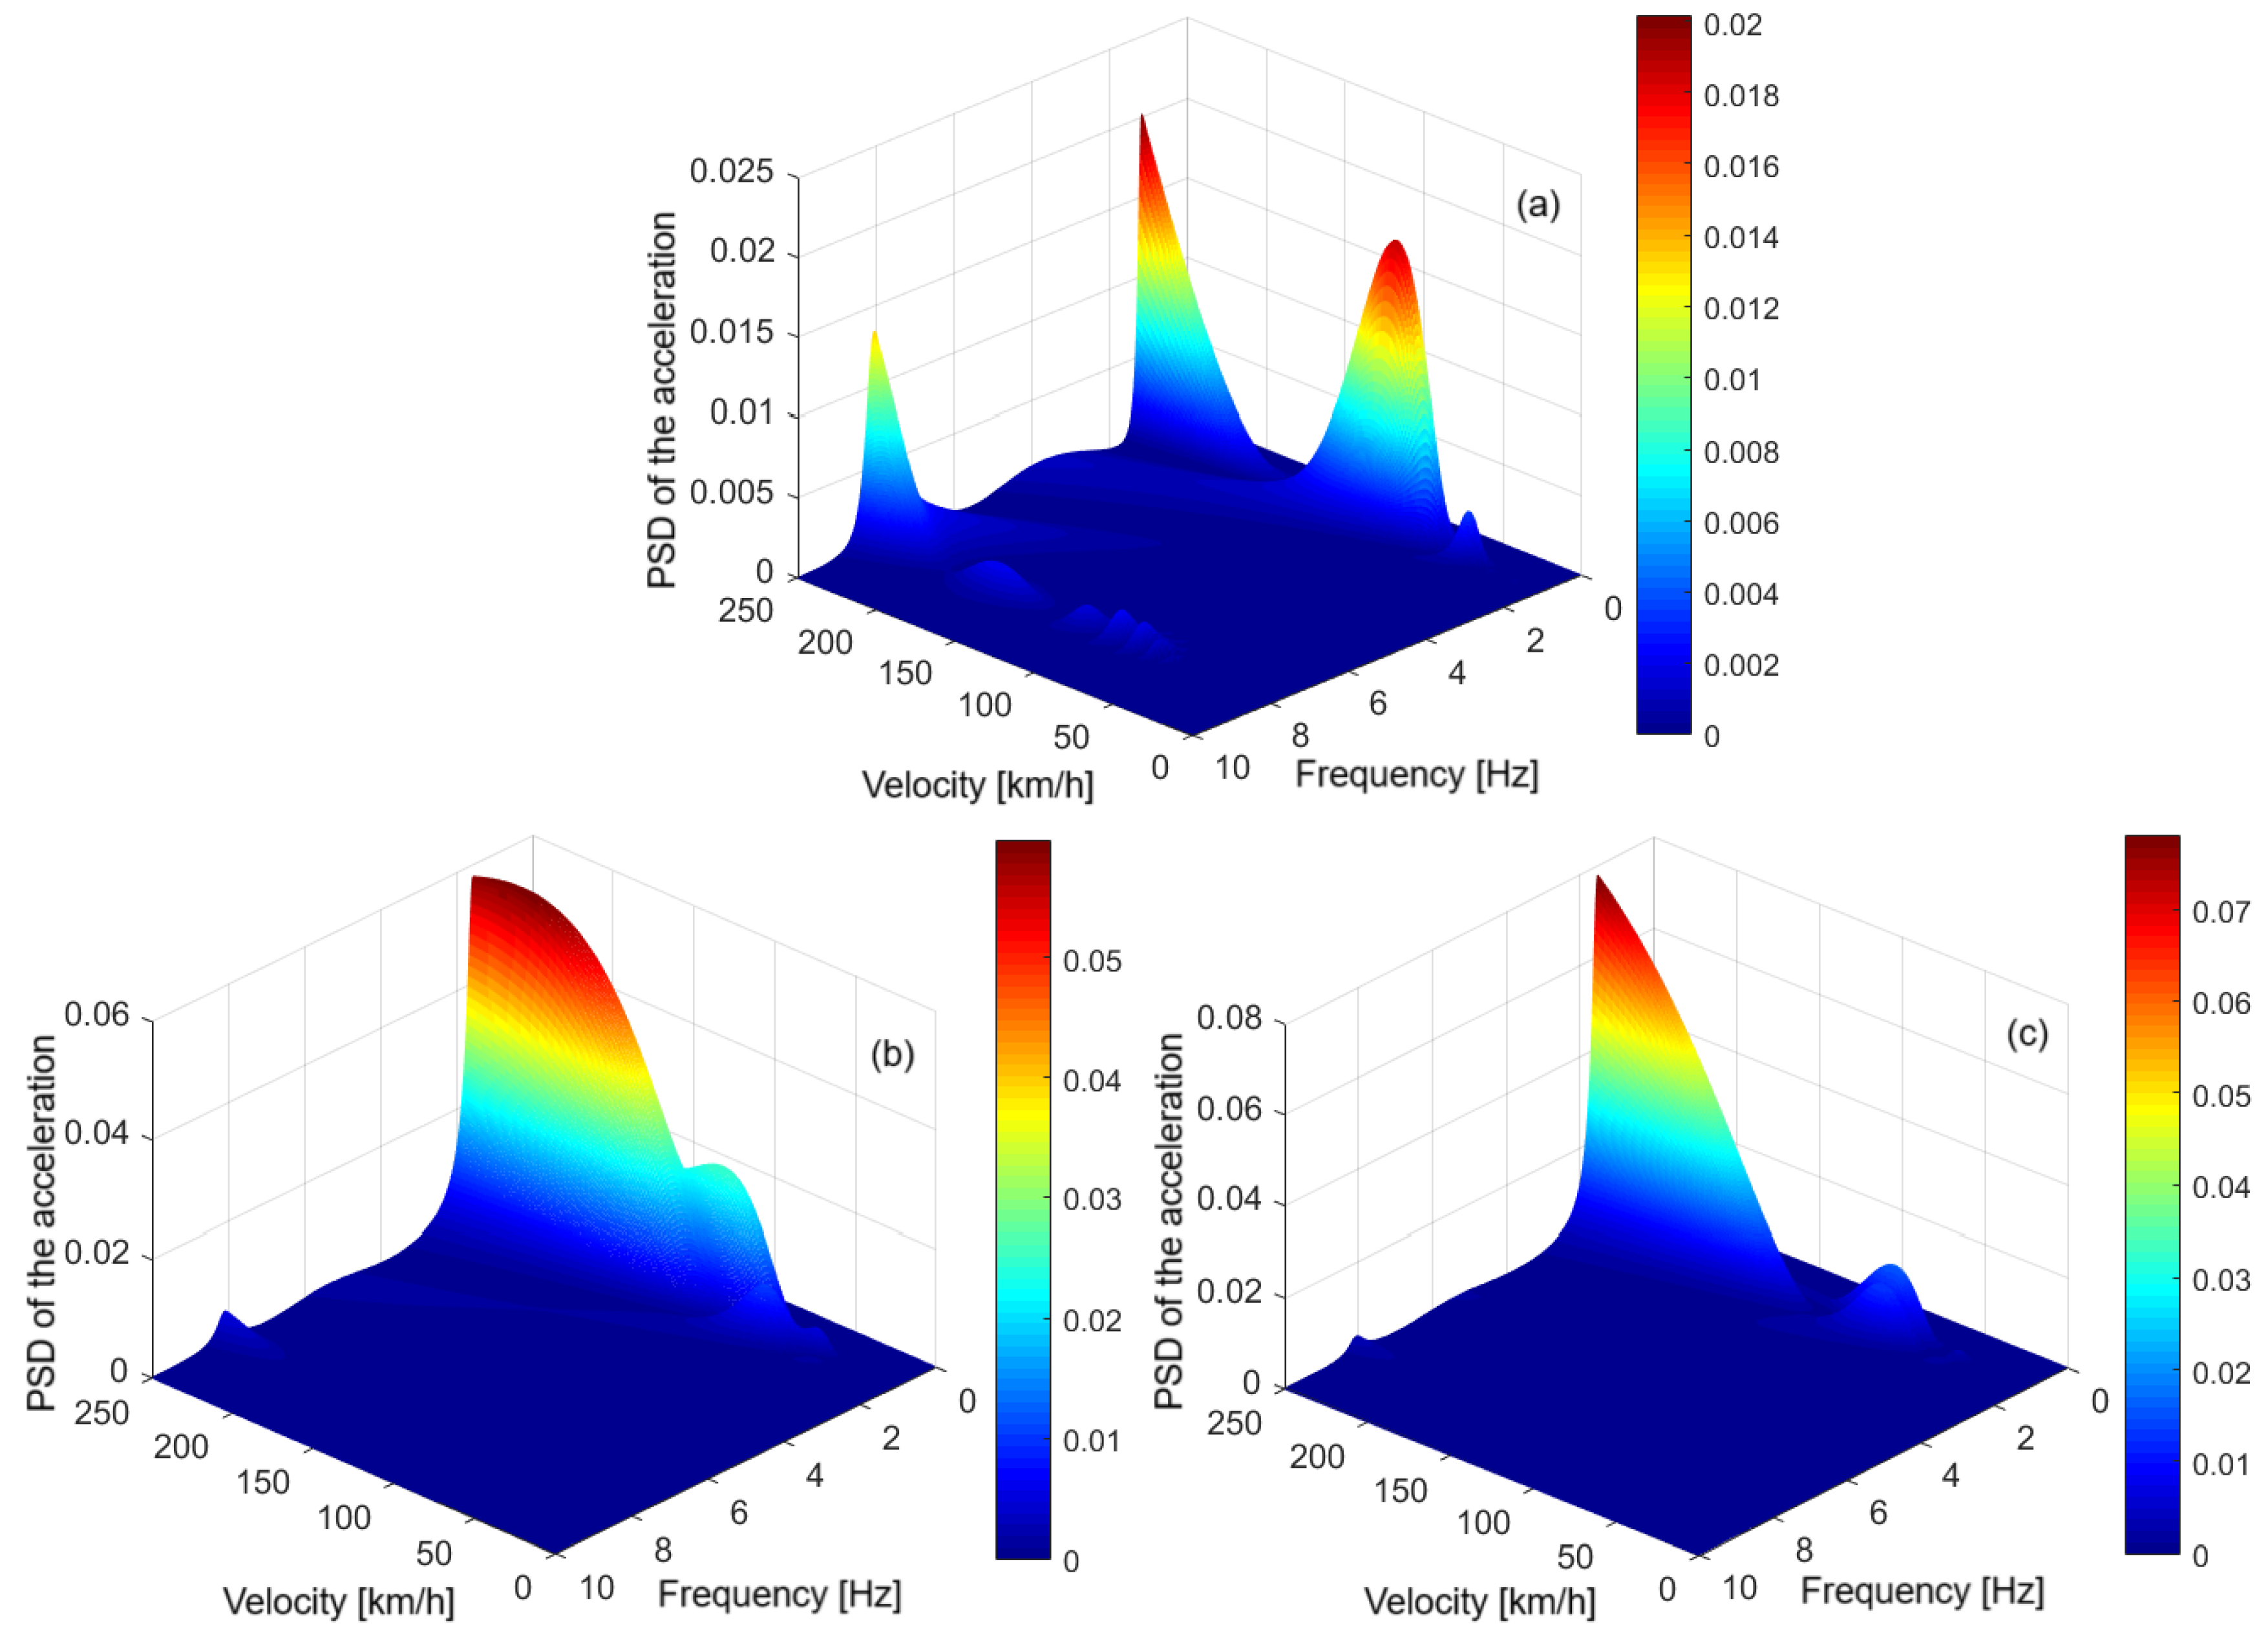
Figure 7 shows the dynamic response at the relevant points of the carbody, expressed as the unweighted PSD acceleration, for the damped mechanical model. These diagrams highlight several important properties of the vibration behavior of the carbody.
First, the peaks corresponding to the resonance frequencies of the vibration modes of the carbody are noted: at 1.17 Hz for the bounce vibrations; at 1.53 Hz for pitch vibrations; and at 8 Hz for vertical bending vibrations. At the carbody center (diagram a), the PSD of the acceleration is dominated by bounce vibrations, but at speeds higher than 200 km/h the weight of vertical bending vibrations also becomes important. Above the bogies (diagrams b and c), the dominant mode of vibration is the pitch, but bounce also has an important contribution. Then, it is observed that, regardless of the velocity, the carbody vibration level is higher above the bogies than in the middle of the carbody, and that the vibration level above the two bogies is asymmetric. It is also noted that at all relevant points of the carbody, the vibration level increases with velocity, but not monotonous. The PSD has several minima, which appear in the form of anti-resonance frequencies, and which are due to the geometric filtering effect. It is observed that the geometric filtering effect is more efficient at the resonance frequency of the vertical bending of the carbody.
The results presented above, which highlight the most important features of the carbody vibration, are in agreement with the theoretical or experimental results presented in the scientific literature [
35,
36,
37].
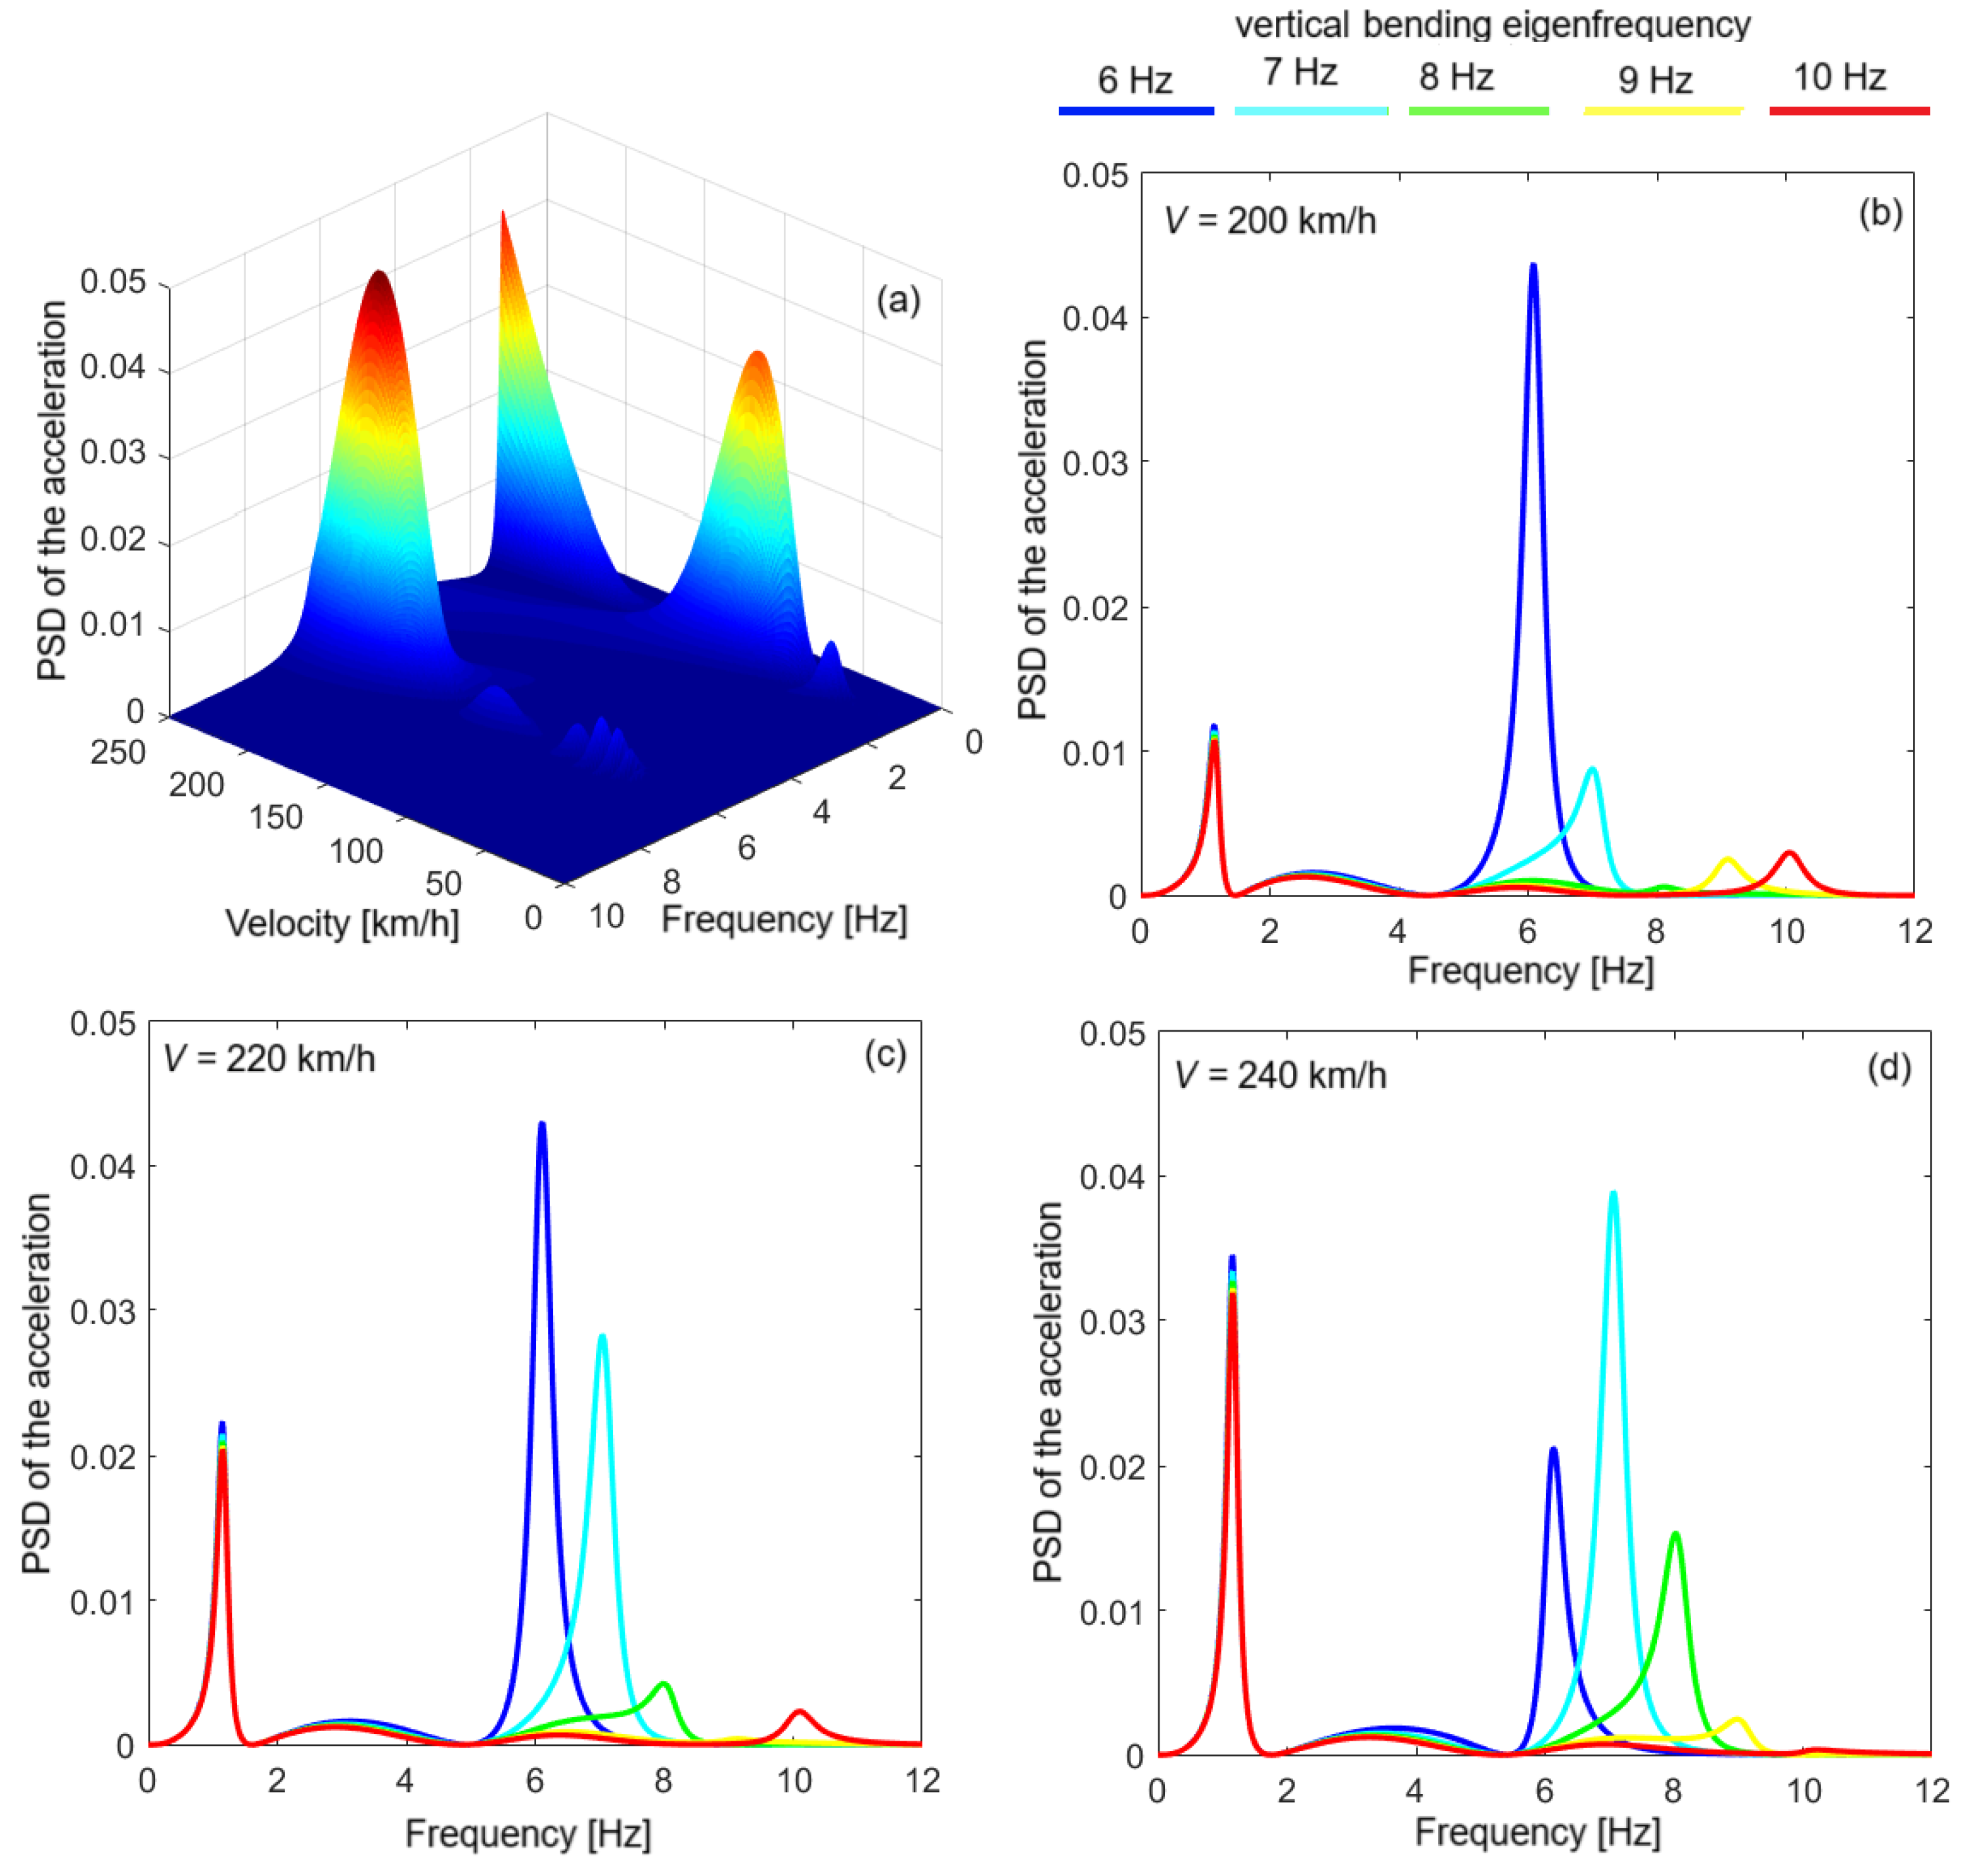
At the carbody center, at velocities greater than 200 km/h, vertical bending can become the dominant vibration mode for flexible carbodies, and this is evident in the diagrams in
Figure 8. Diagram (a) shows the unweighted PSD of the acceleration for the carbody bending frequency of 6 Hz. It is observed that at velocities above 200 km/h, the frequency peak of the vertical bending dominates the PSD.
Diagrams (b), (c), and (d) show the unweighted PSD of the acceleration at the middle of the carbody for five values of bending frequency at velocities of 200 km/h, 220 km/h, and 240 km/h.
Table 2 shows the values of the bending stiffness of the carbody corresponding to the eigenfrequencies of the vertical bending analyzed in
Figure 8.
According to diagram (b), at the velocity of 200 km/h, for the resonance frequency of 6 Hz, vertical bending is the dominant mode of vibration. At the velocity of 220 km/h, the vertical bending with the eigenfrequencies of 6 Hz and 7 Hz, respectively, dominates the PSD of the acceleration. At 240 km/h, vertical bending with an eigenfrequency of 7 Hz is the dominant mode of vibration at the middle of the carbody.
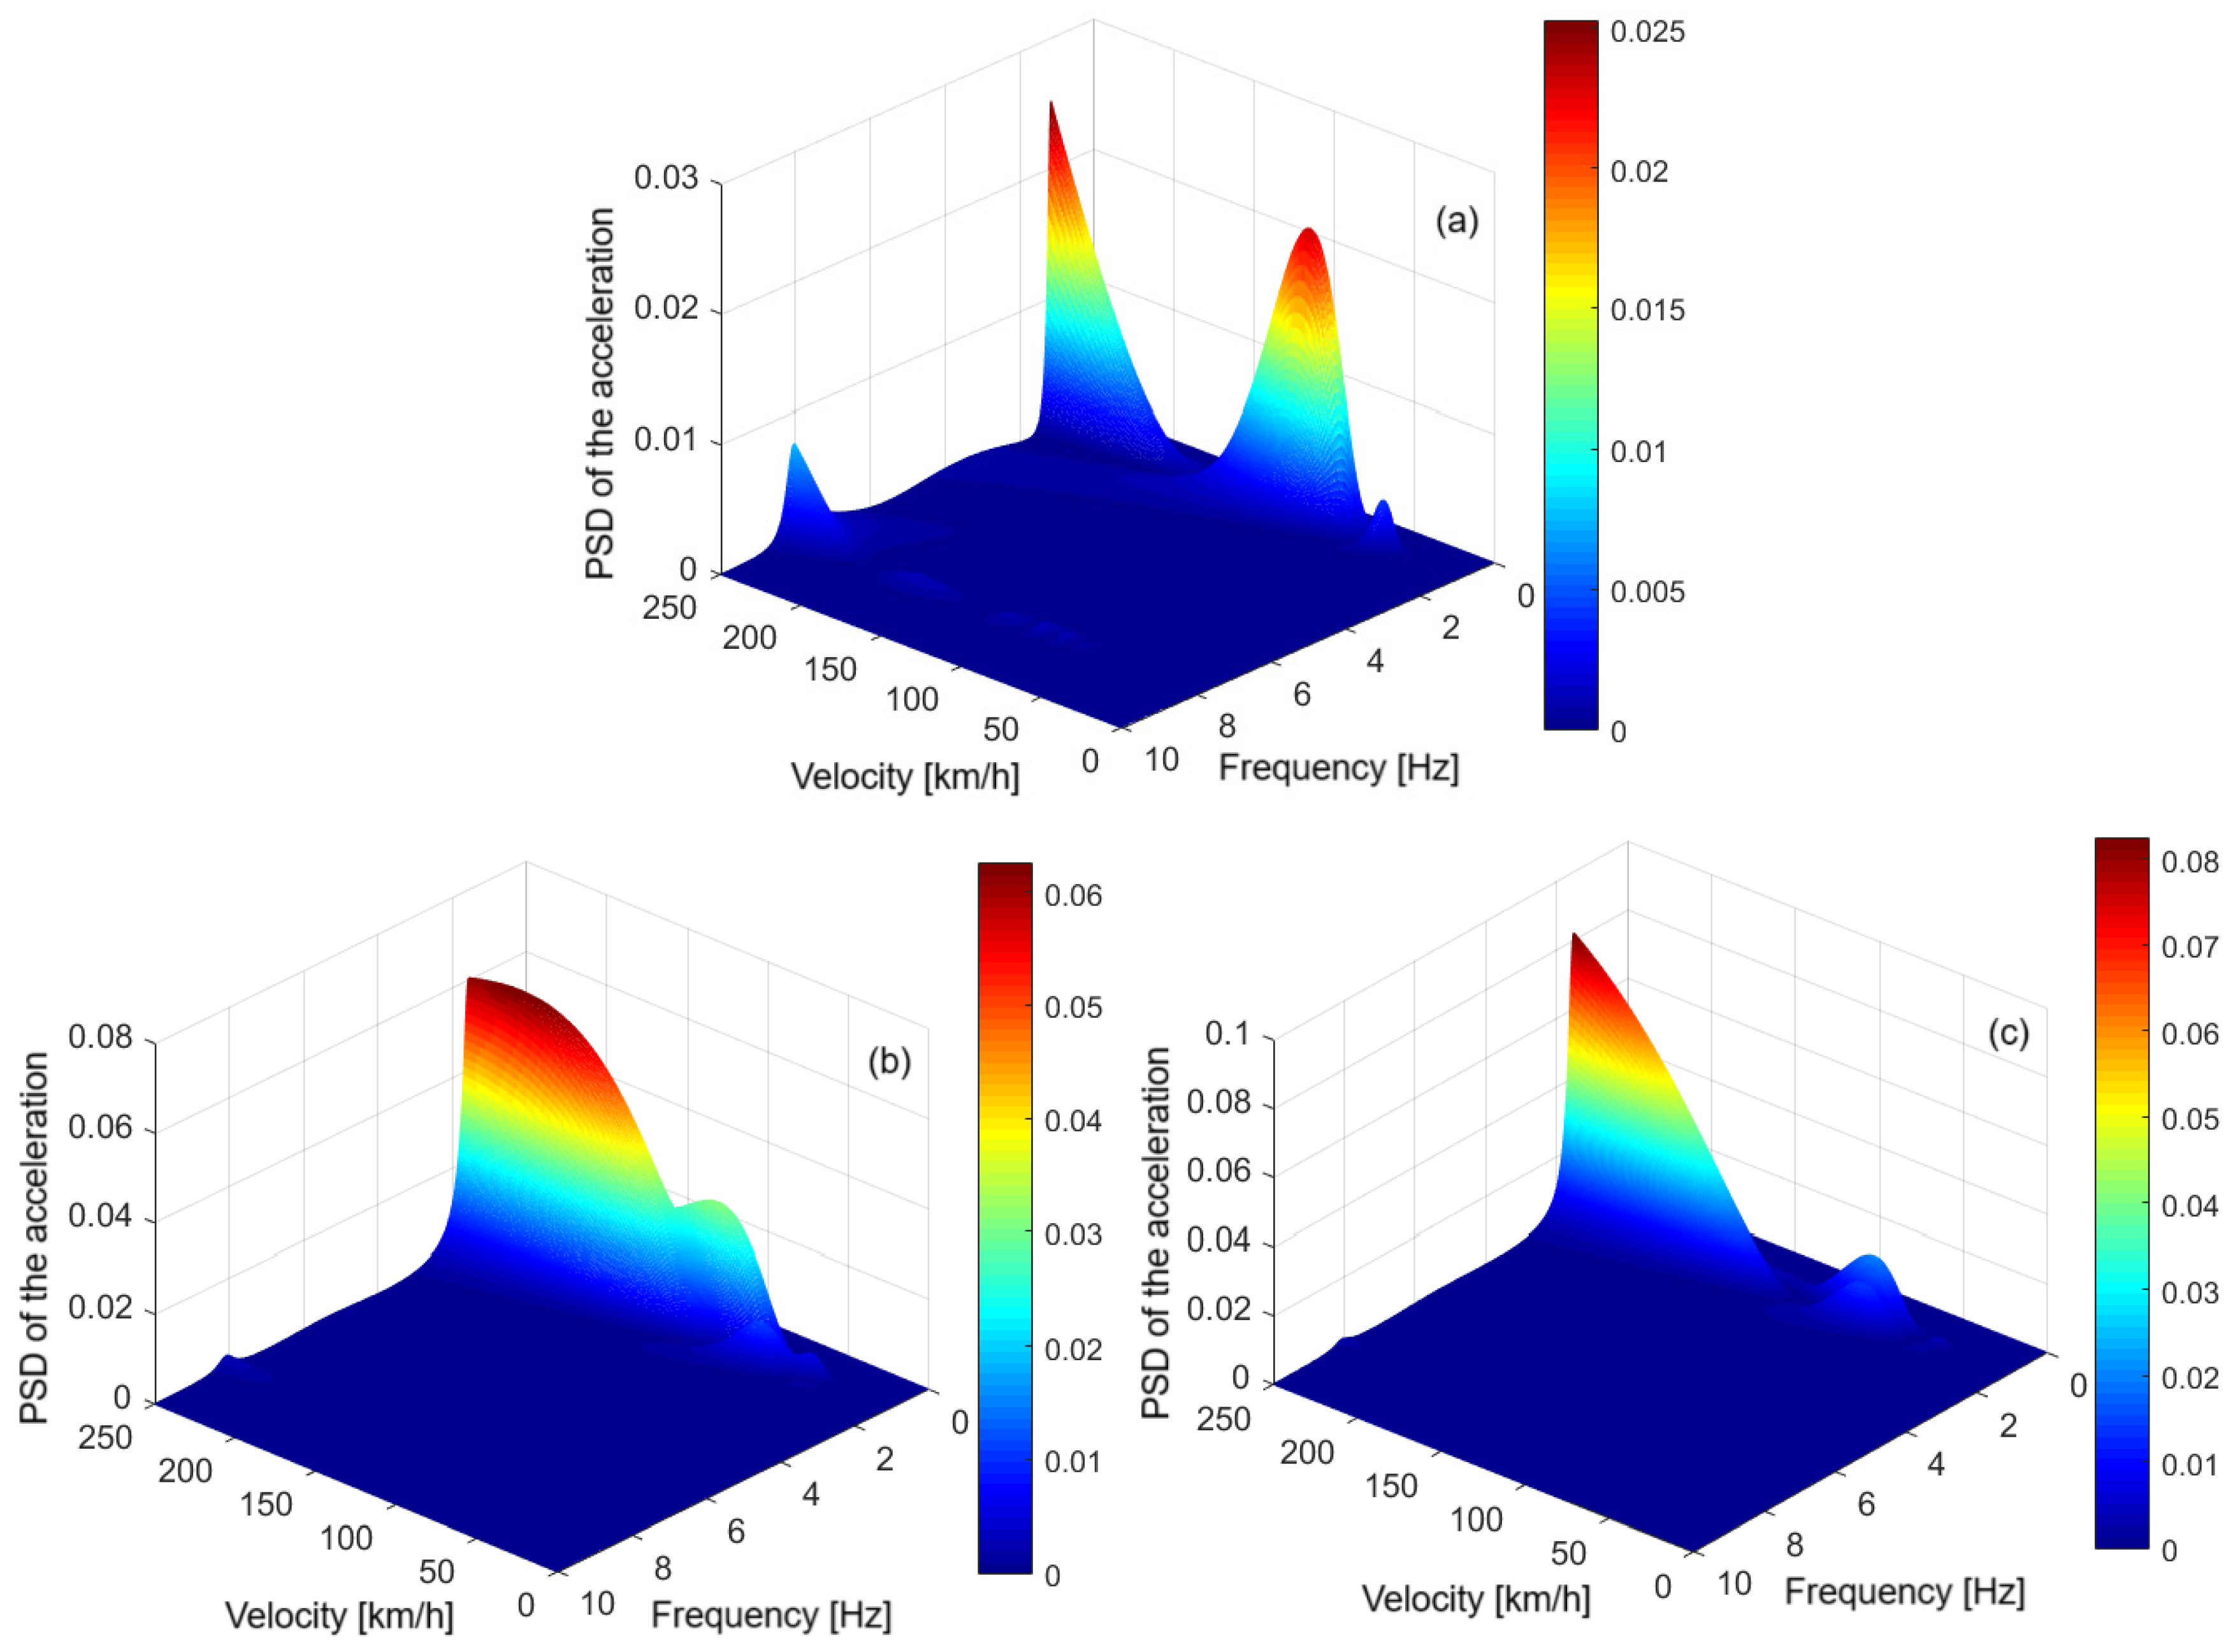
Figure 9 and
Figure 10 show the dynamic response of the carbody, expressed in the form of the unweighted PSD of the acceleration, weighted with the weighting function
Brq for the RQ evaluation and the weighting function
Brc for the RC evaluation, respectively, calculated under the same conditions as in the case of
Figure 7. The diagrams in these figures highlight the same characteristics of the carbody vibration behavior at its relevant points. An important point to note is that the weighting functions do not change the dominant modes of the carbody vibration.
Next, the effect of frequency weighting on the PSD of the acceleration at the resonance frequencies of the dominant modes of vibration at the relevant points of the carbody is analyzed.
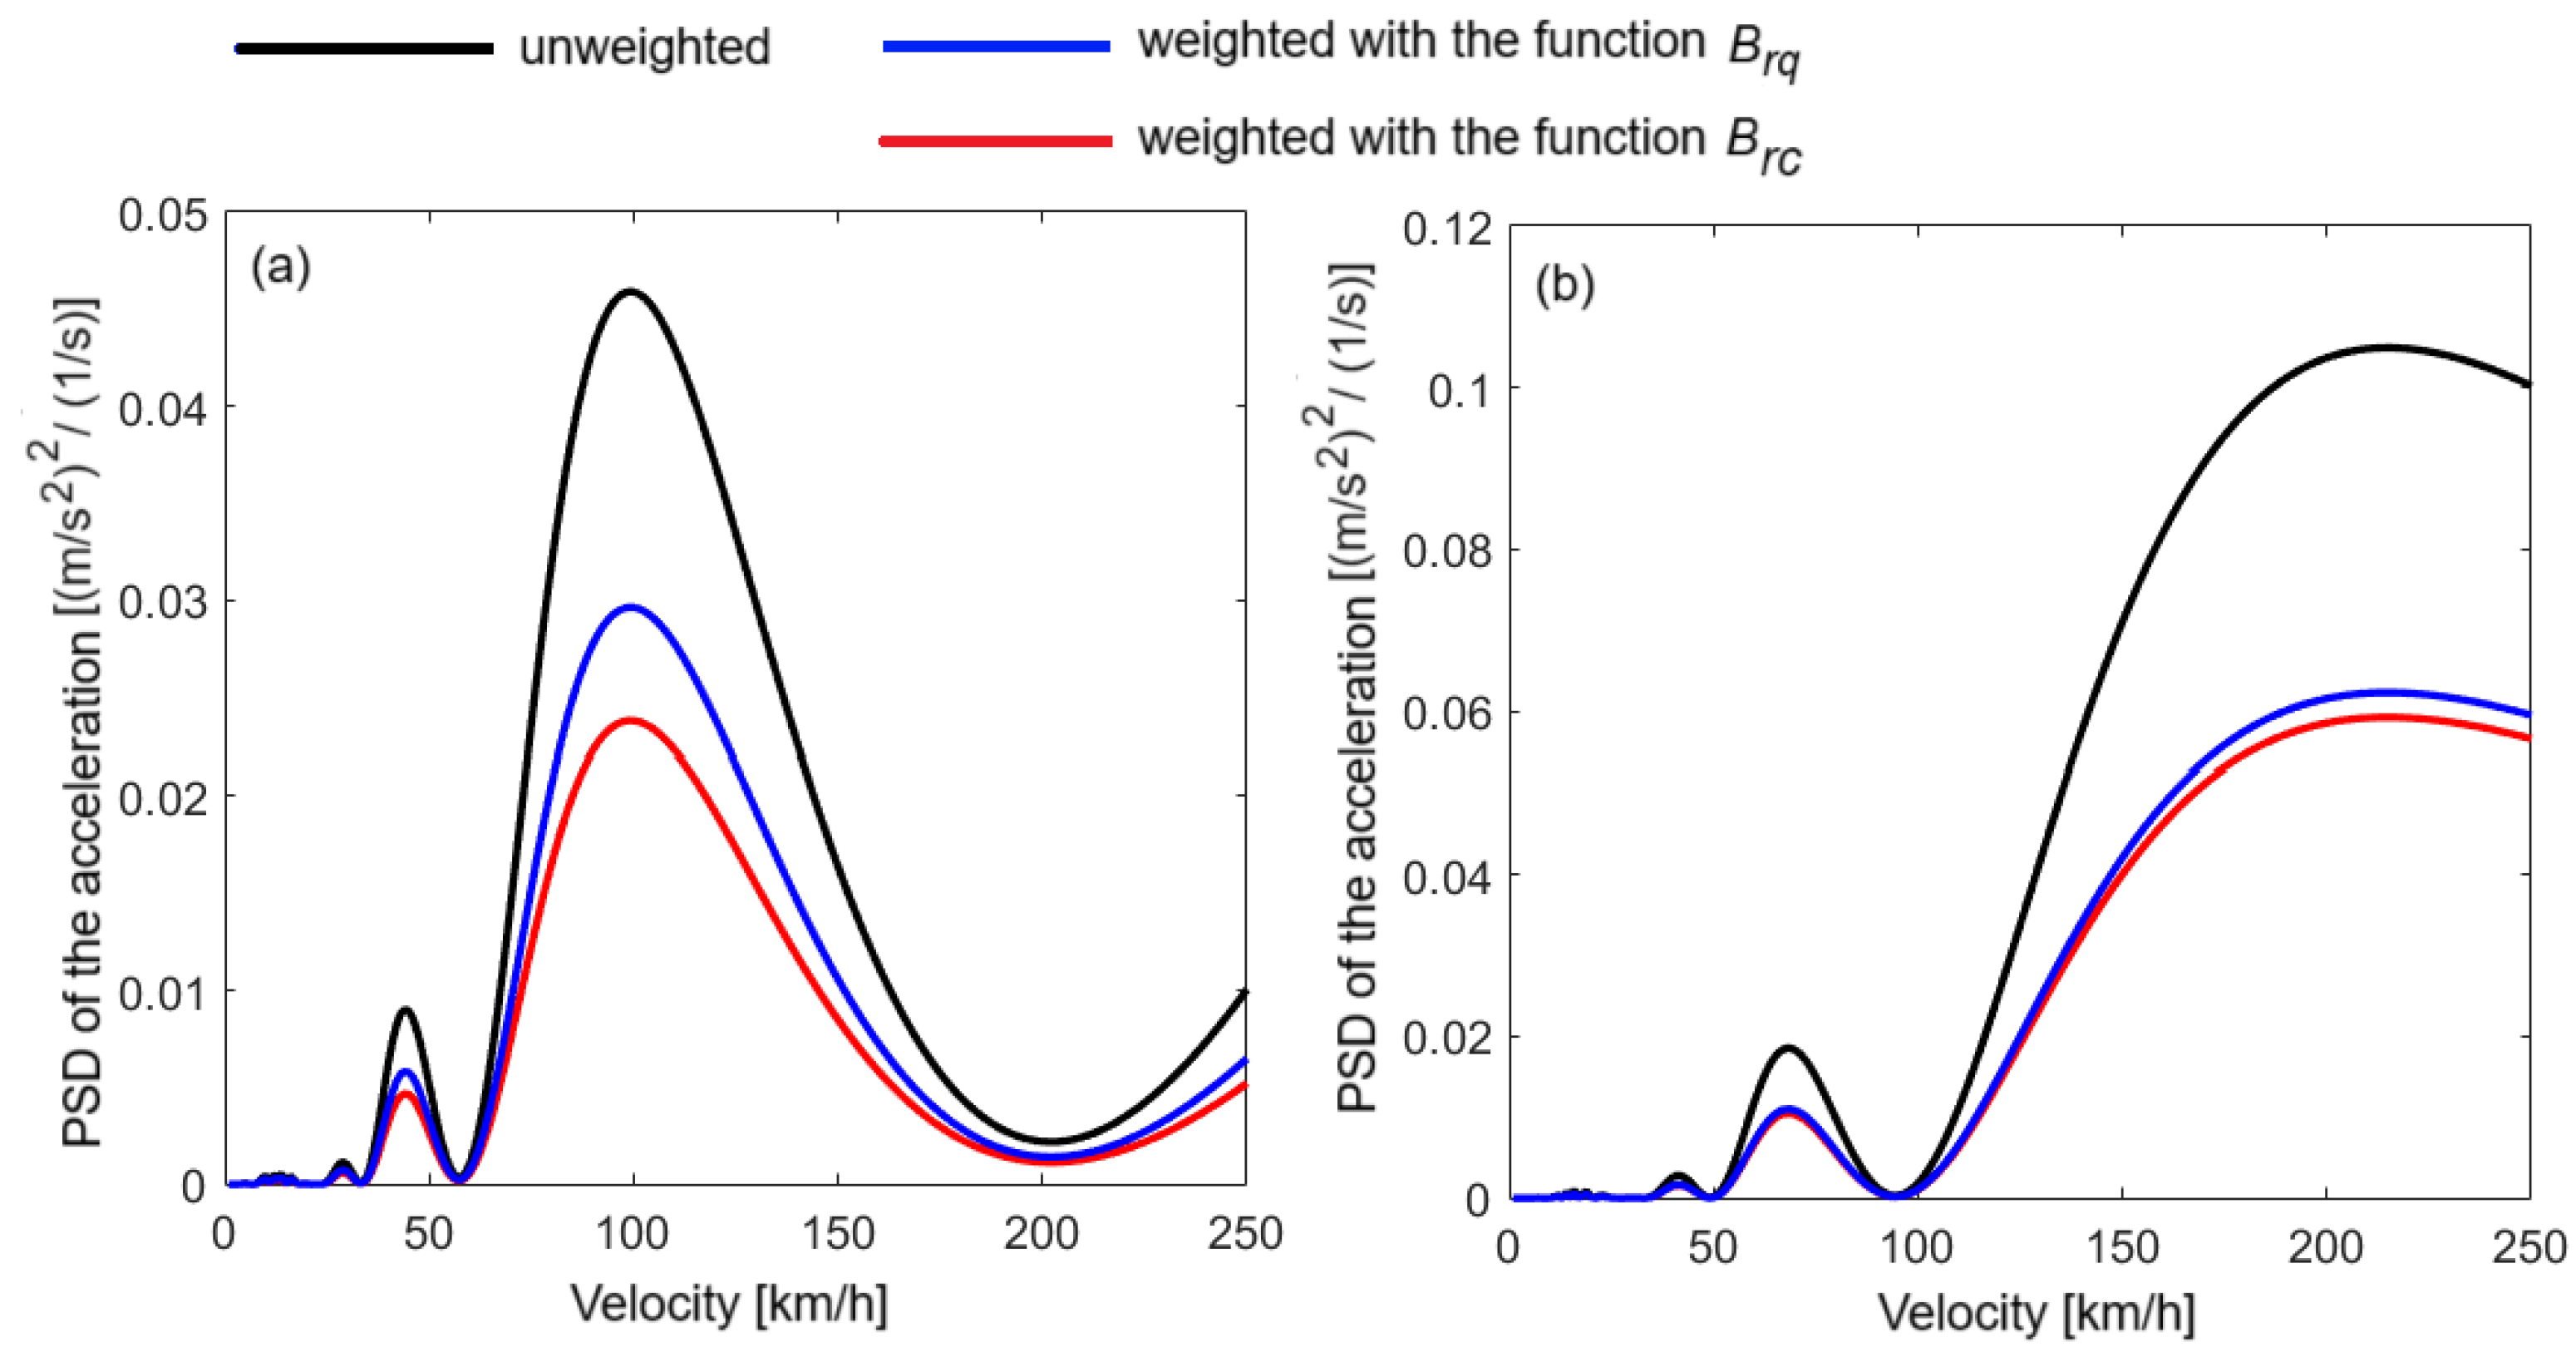
Figure 11 shows the PSD of the acceleration at the middle of the carbody, unweighted and weighted with the weighting functions (
Brq and
Brc) corresponding to the Sperling index method, at the resonance frequencies of the vertical bounce and vertical bending. In both cases, the two weighting functions reduce the carbody dynamic response. However, the influence of bounce mode on the carbody dynamic response is reduced more in the case of applying the weighting function corresponding RC, while the reduction in the influence of bending vibrations is more effective after applying the weighting function corresponding RQ. Another observation relates to the geometric filtering effect that is better highlighted in these diagrams. Here, it is clearly seen that geometric filtering is more efficient at the resonance frequency of the vertical bending of the carbody than at the bounce frequency. It is also highlighted that geometric filtering is more efficient in the speed velocity of up to 100 km/h.
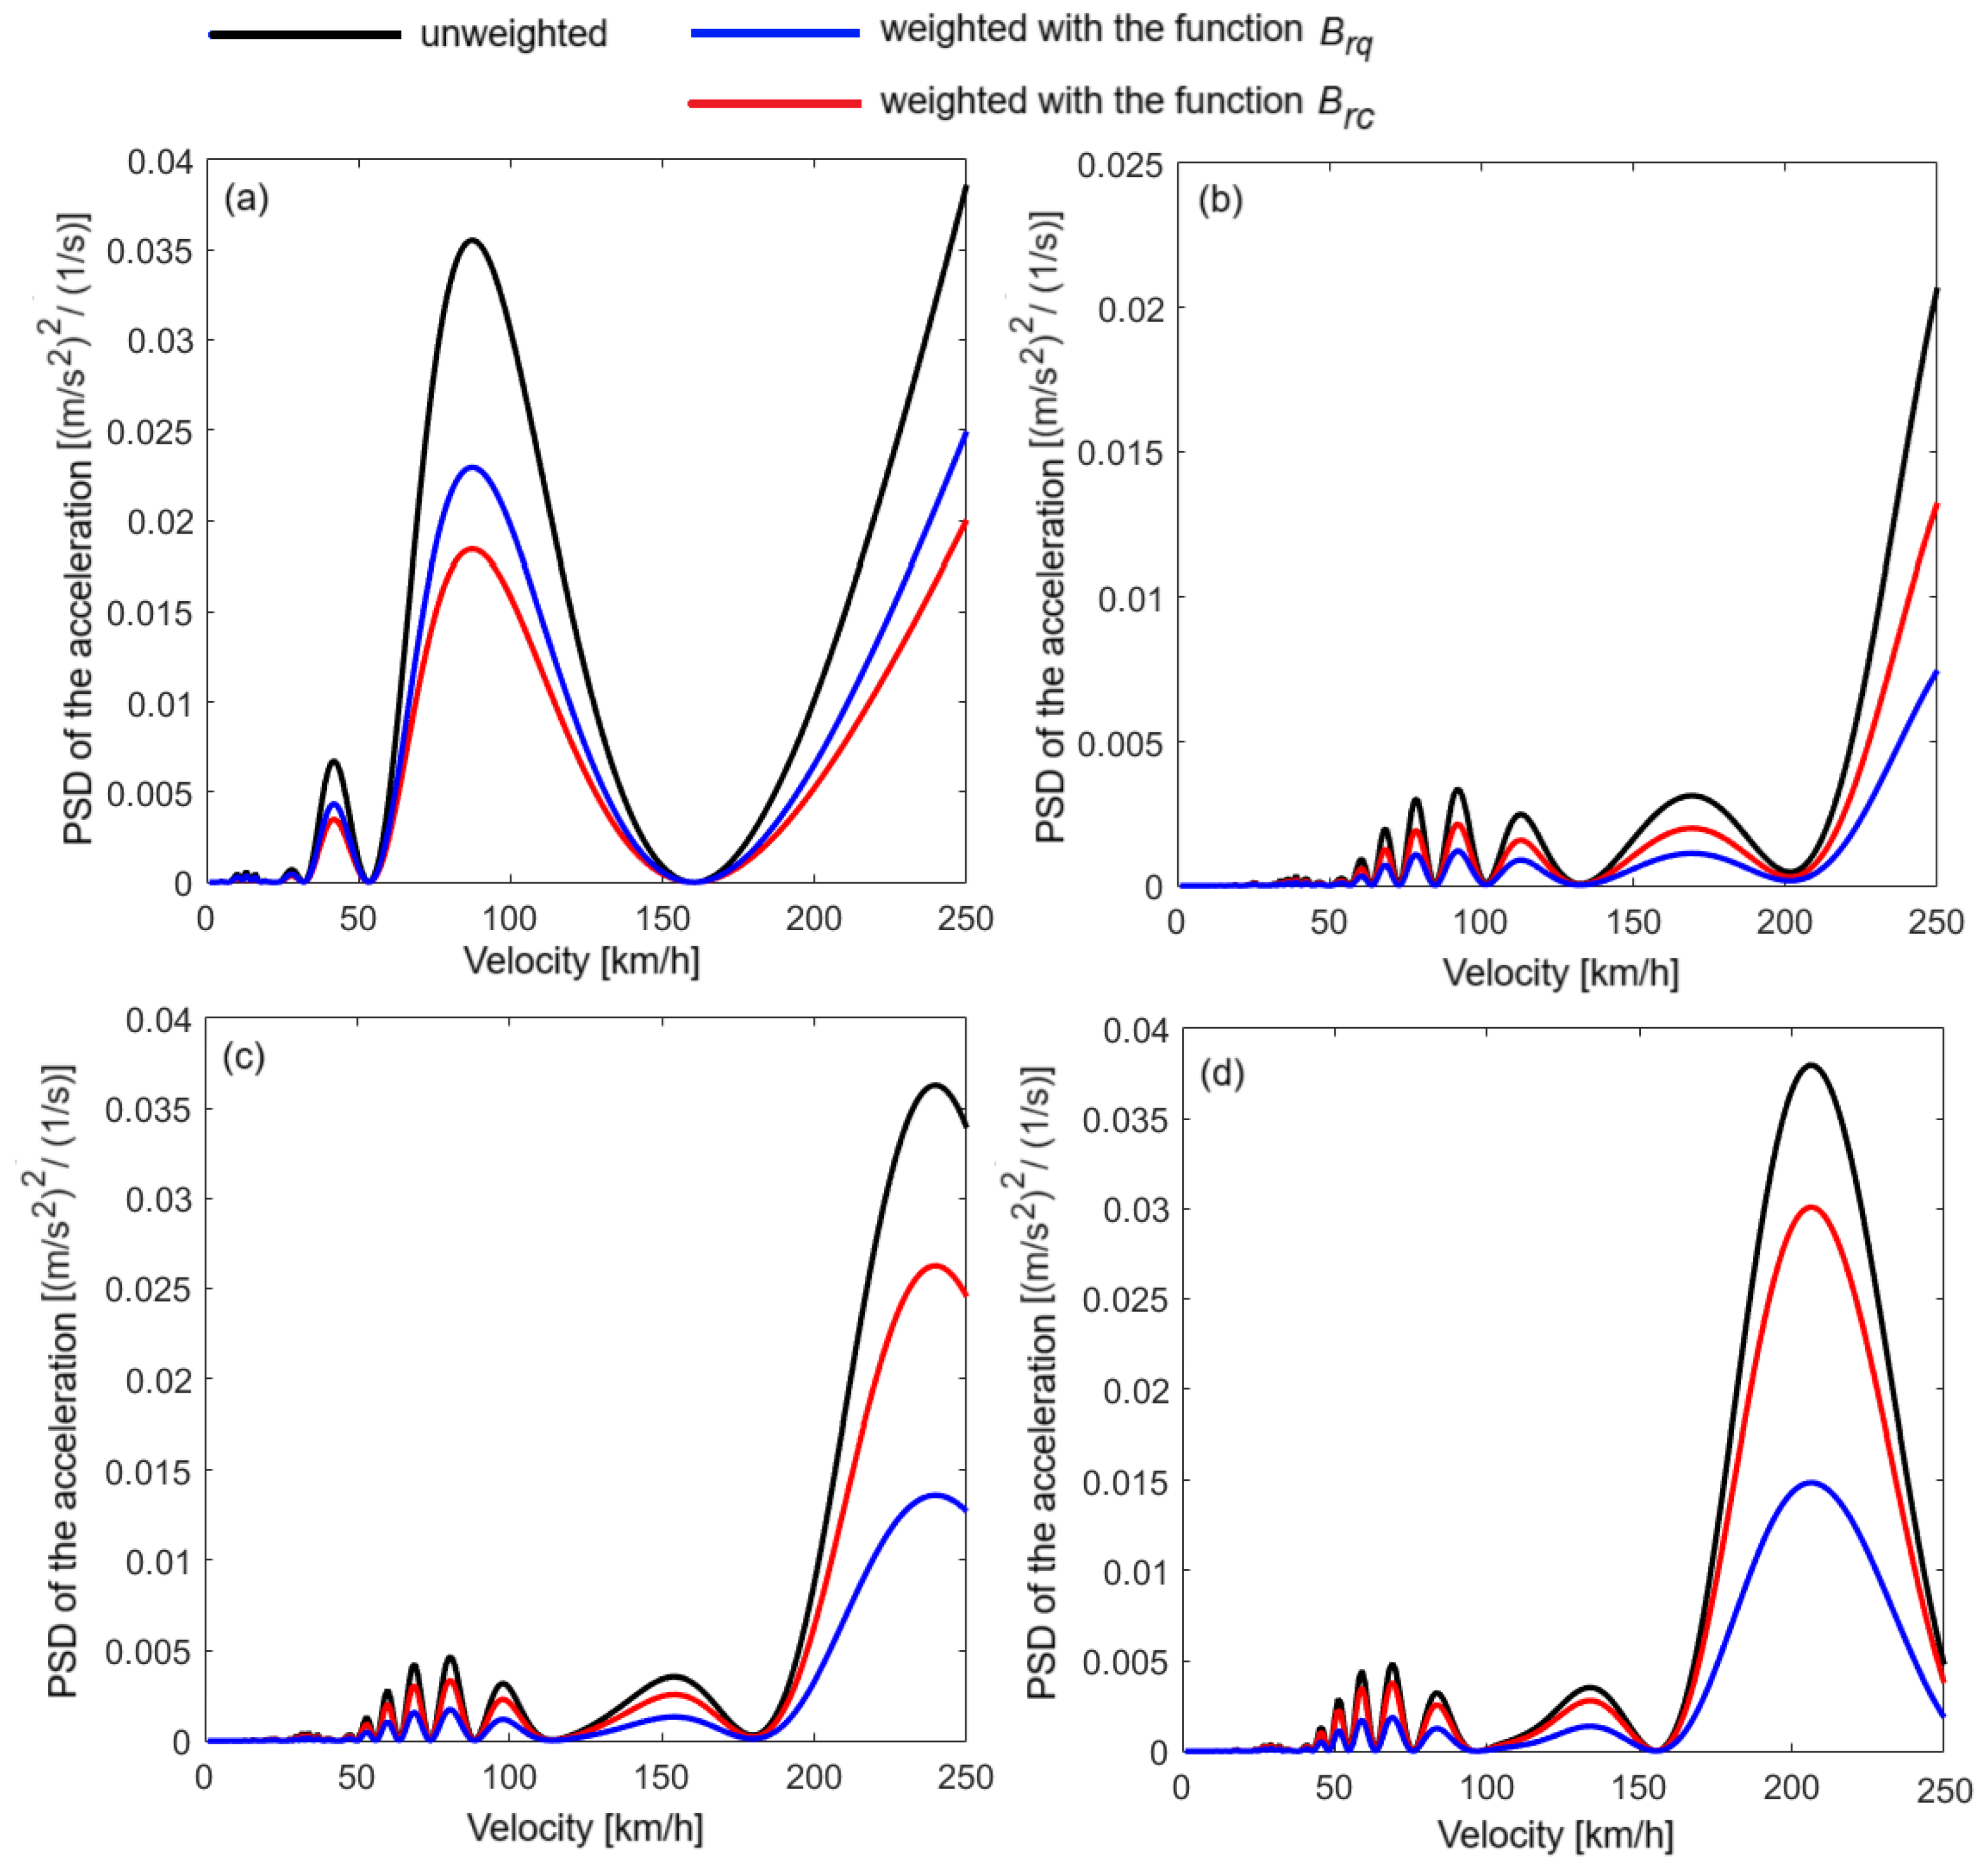
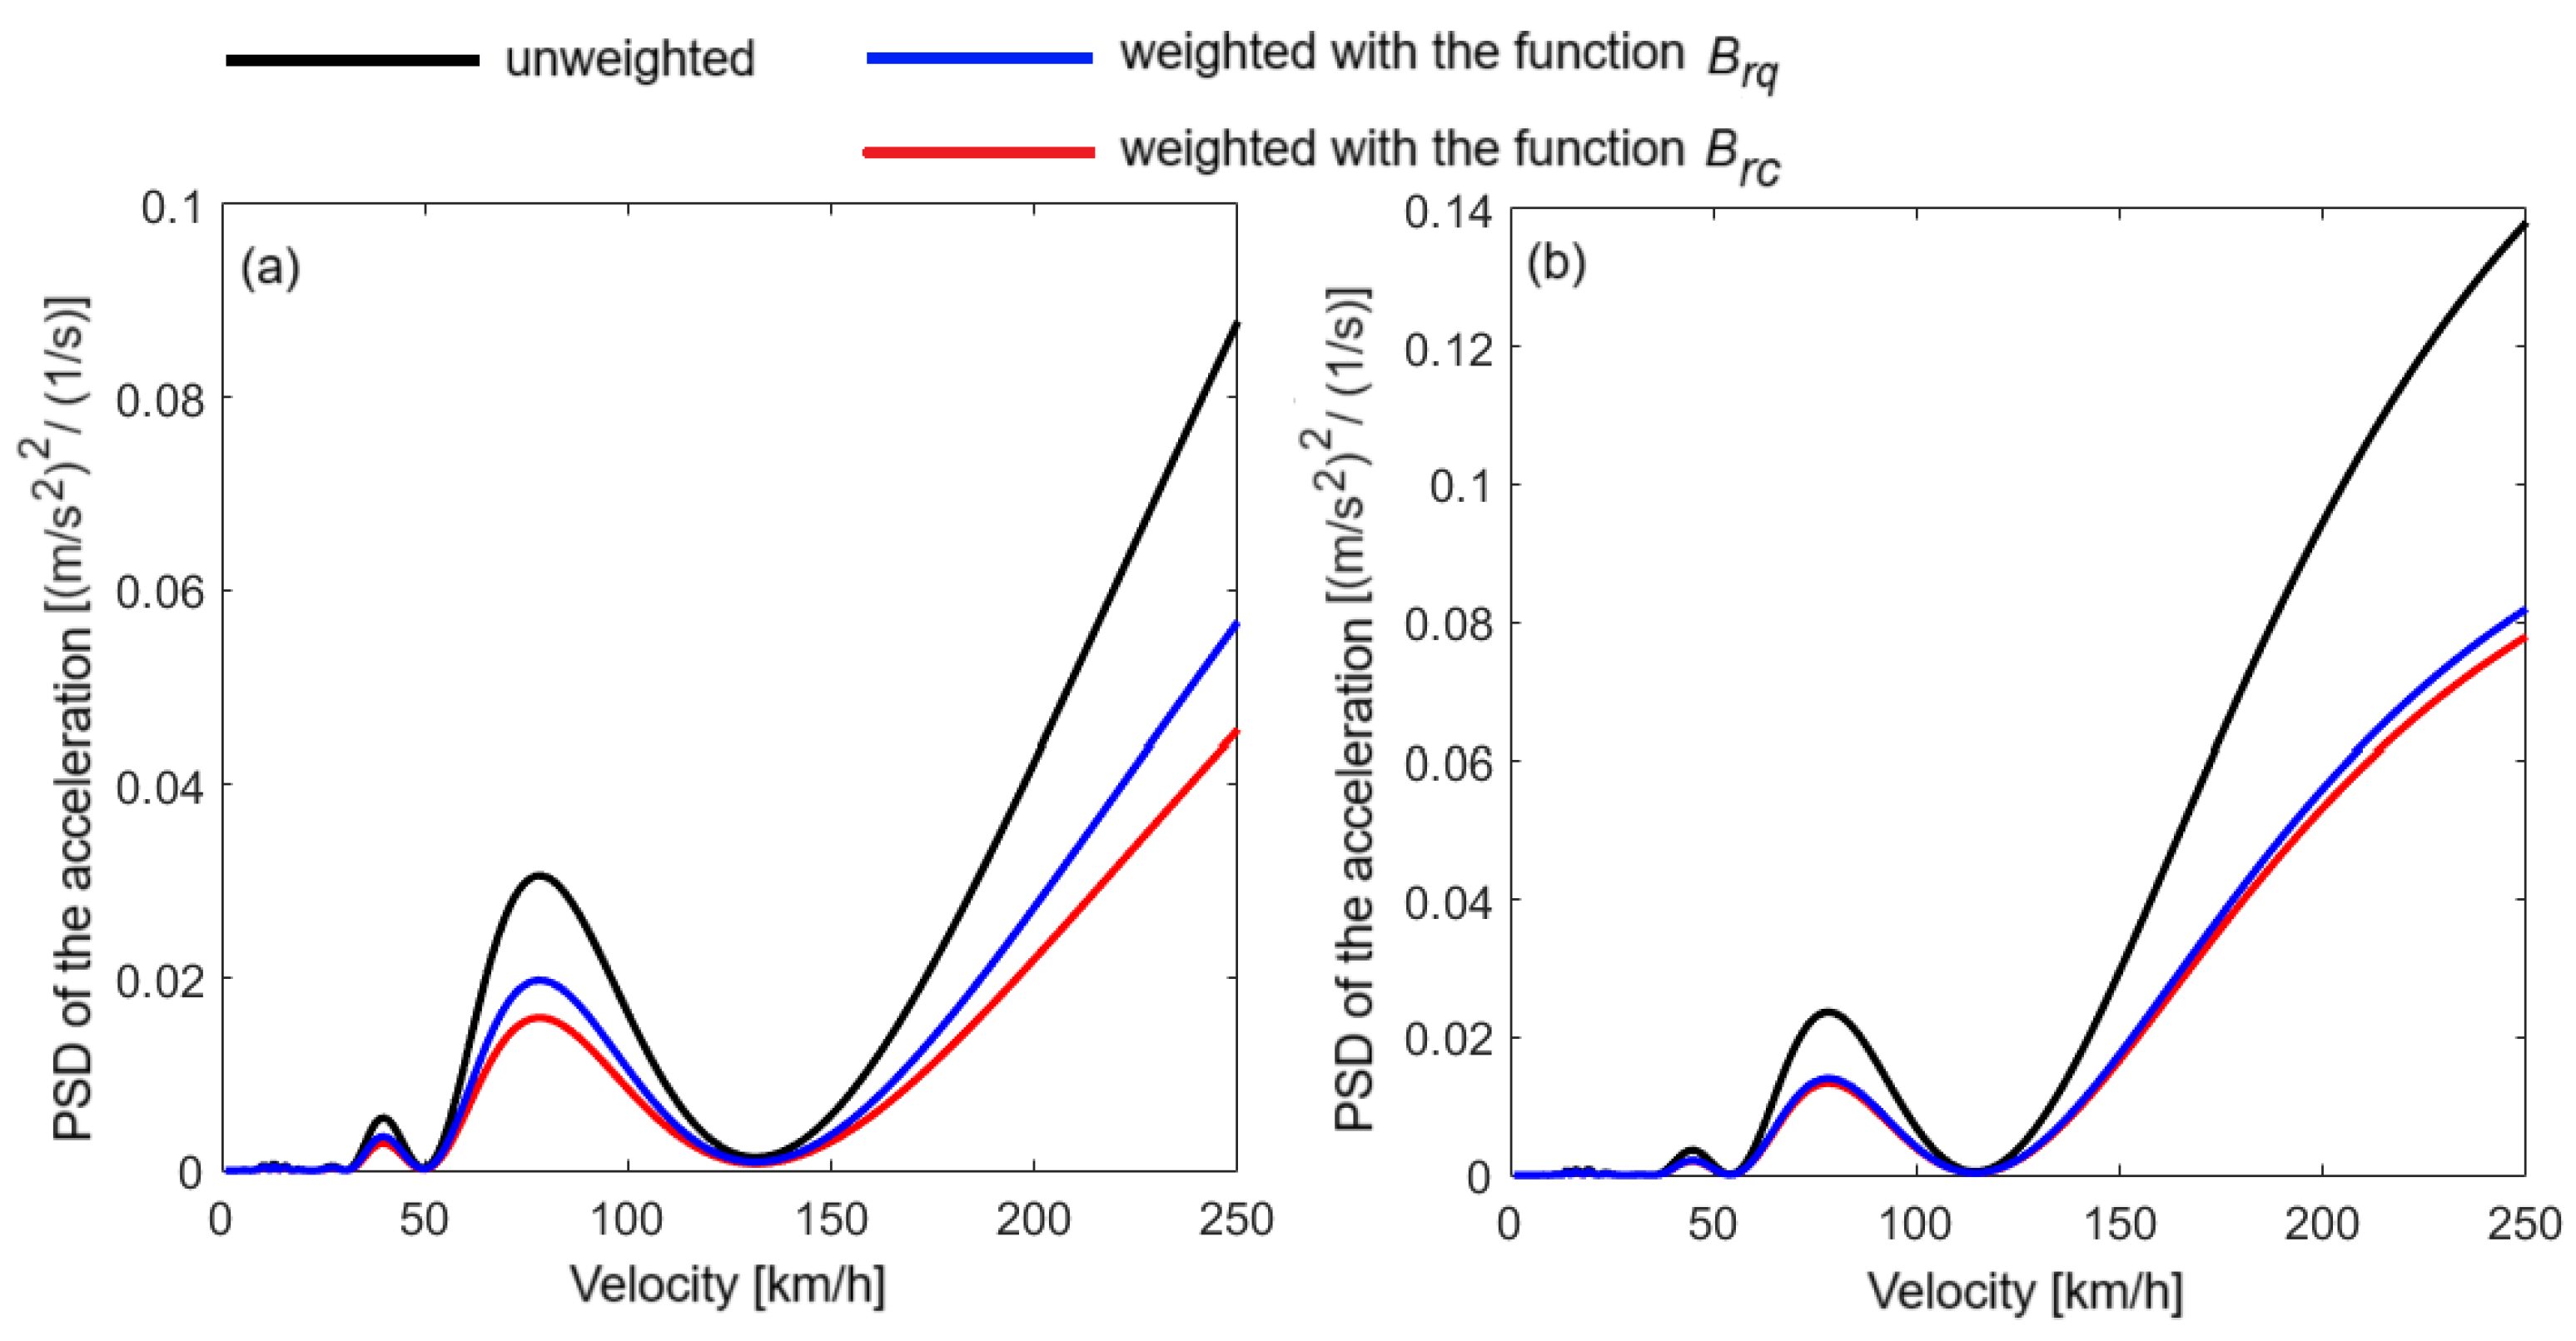
Figure 12 and
Figure 13 show the unweighted/weighted PSD of the acceleration calculated above the bogies, at the resonance frequencies of the bounce and pitch. At the resonance frequency of the bounce (1.17 Hz), the observation presented in
Figure 11 is maintained: frequency weighting with the
Brc function reduces the influence of the bounce mode on the carbody’s dynamic response more than weighting with the
Brq function. At the eigenfrequency of the pitch, the differences between the PSD of the acceleration weighted with the
Brq function and the PSD of the acceleration weighted with the
Brc function are not significant.
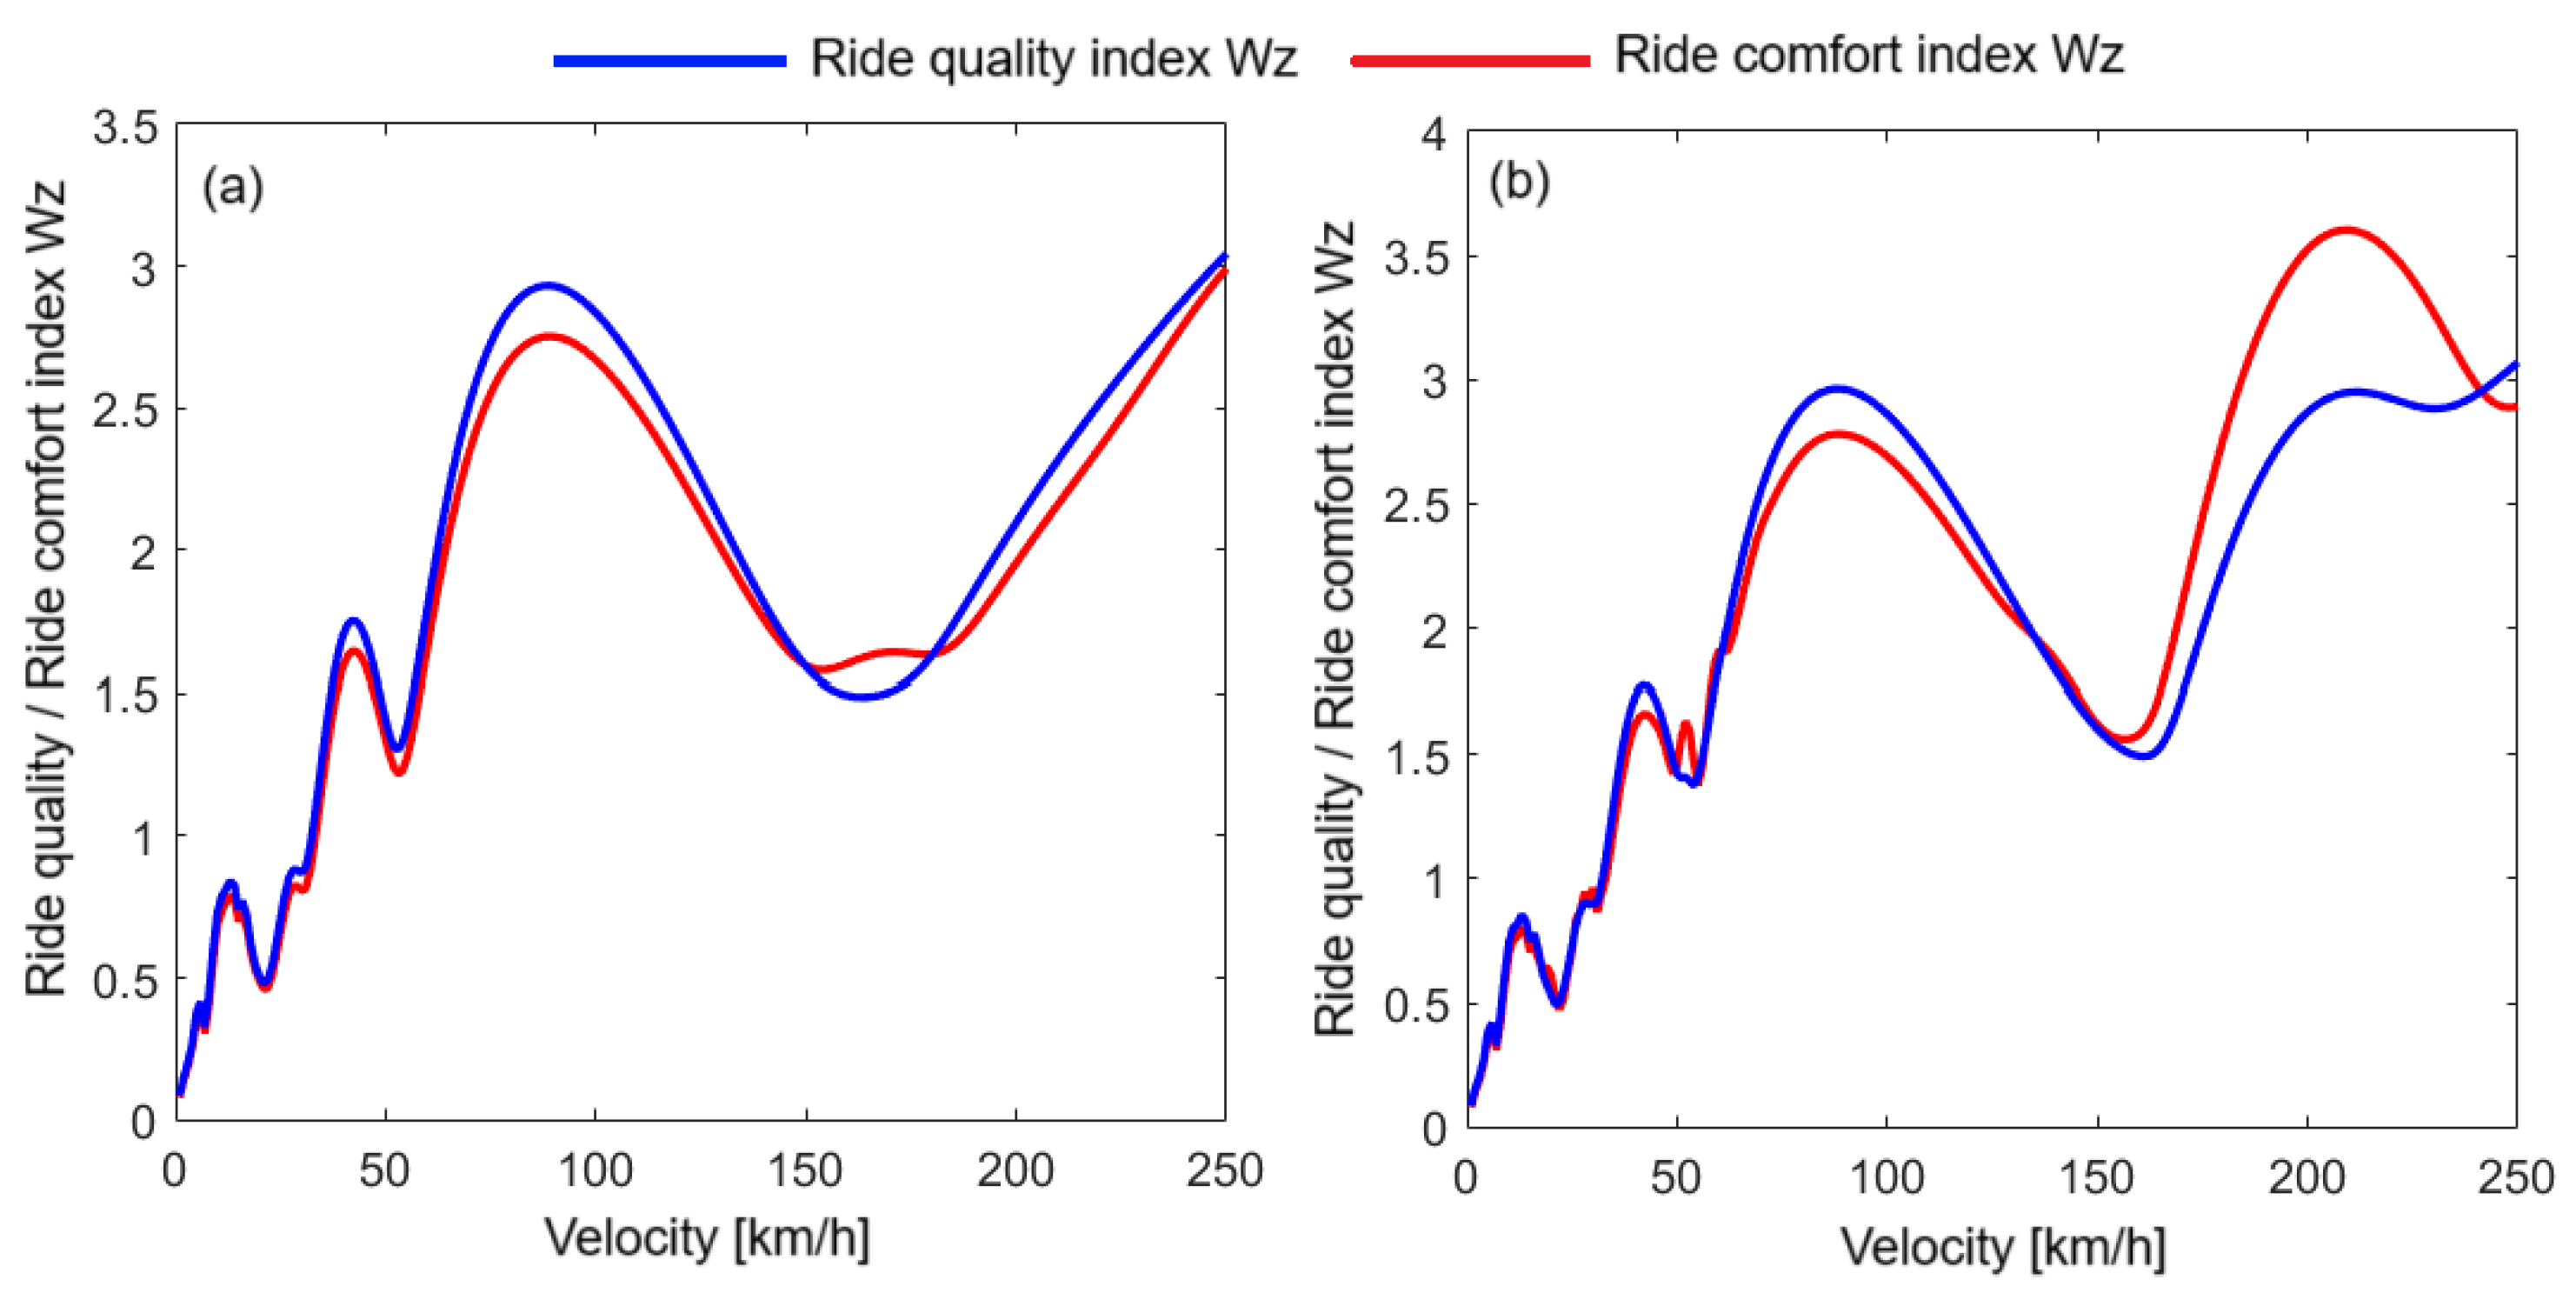
Figure 14 shows the Wz indices for RQ and RC, calculated at the carbody center, for two values of the bending frequency of the carbody from those analyzed above: 8 Hz (diagram a) and 6 Hz (diagram b). According to diagram (a), the Wz index for RQ is higher than the Wz index for RC, but the differences are insignificant. These results are in agreement with those shown in diagram (b) of
Figure 11, where it was shown that for the bending frequency of 8 Hz, the dominant mode of vibration is bounce and that its influence is diminished more in the case of weighting with the function corresponding to the RC. In diagram (b), it can be seen that for velocities between 150 km/h and 240 km/h, the RC index is higher than the RQ index, with significant differences at speeds above 200 km/h. To explain these results, it is recalled that, as shown in
Figure 8, in the case of flexible carbody (with a vertical bending resonance frequency of 6 Hz), vertical bending is the dominant mode of vibration at the carbody center at velocities greater than 200 km/h. Next, the results presented in diagrams (b) to (d) of
Figure 11 must be considered, which show that the reduction in bending vibrations is more efficient by weighting with the function corresponding to the RQ.
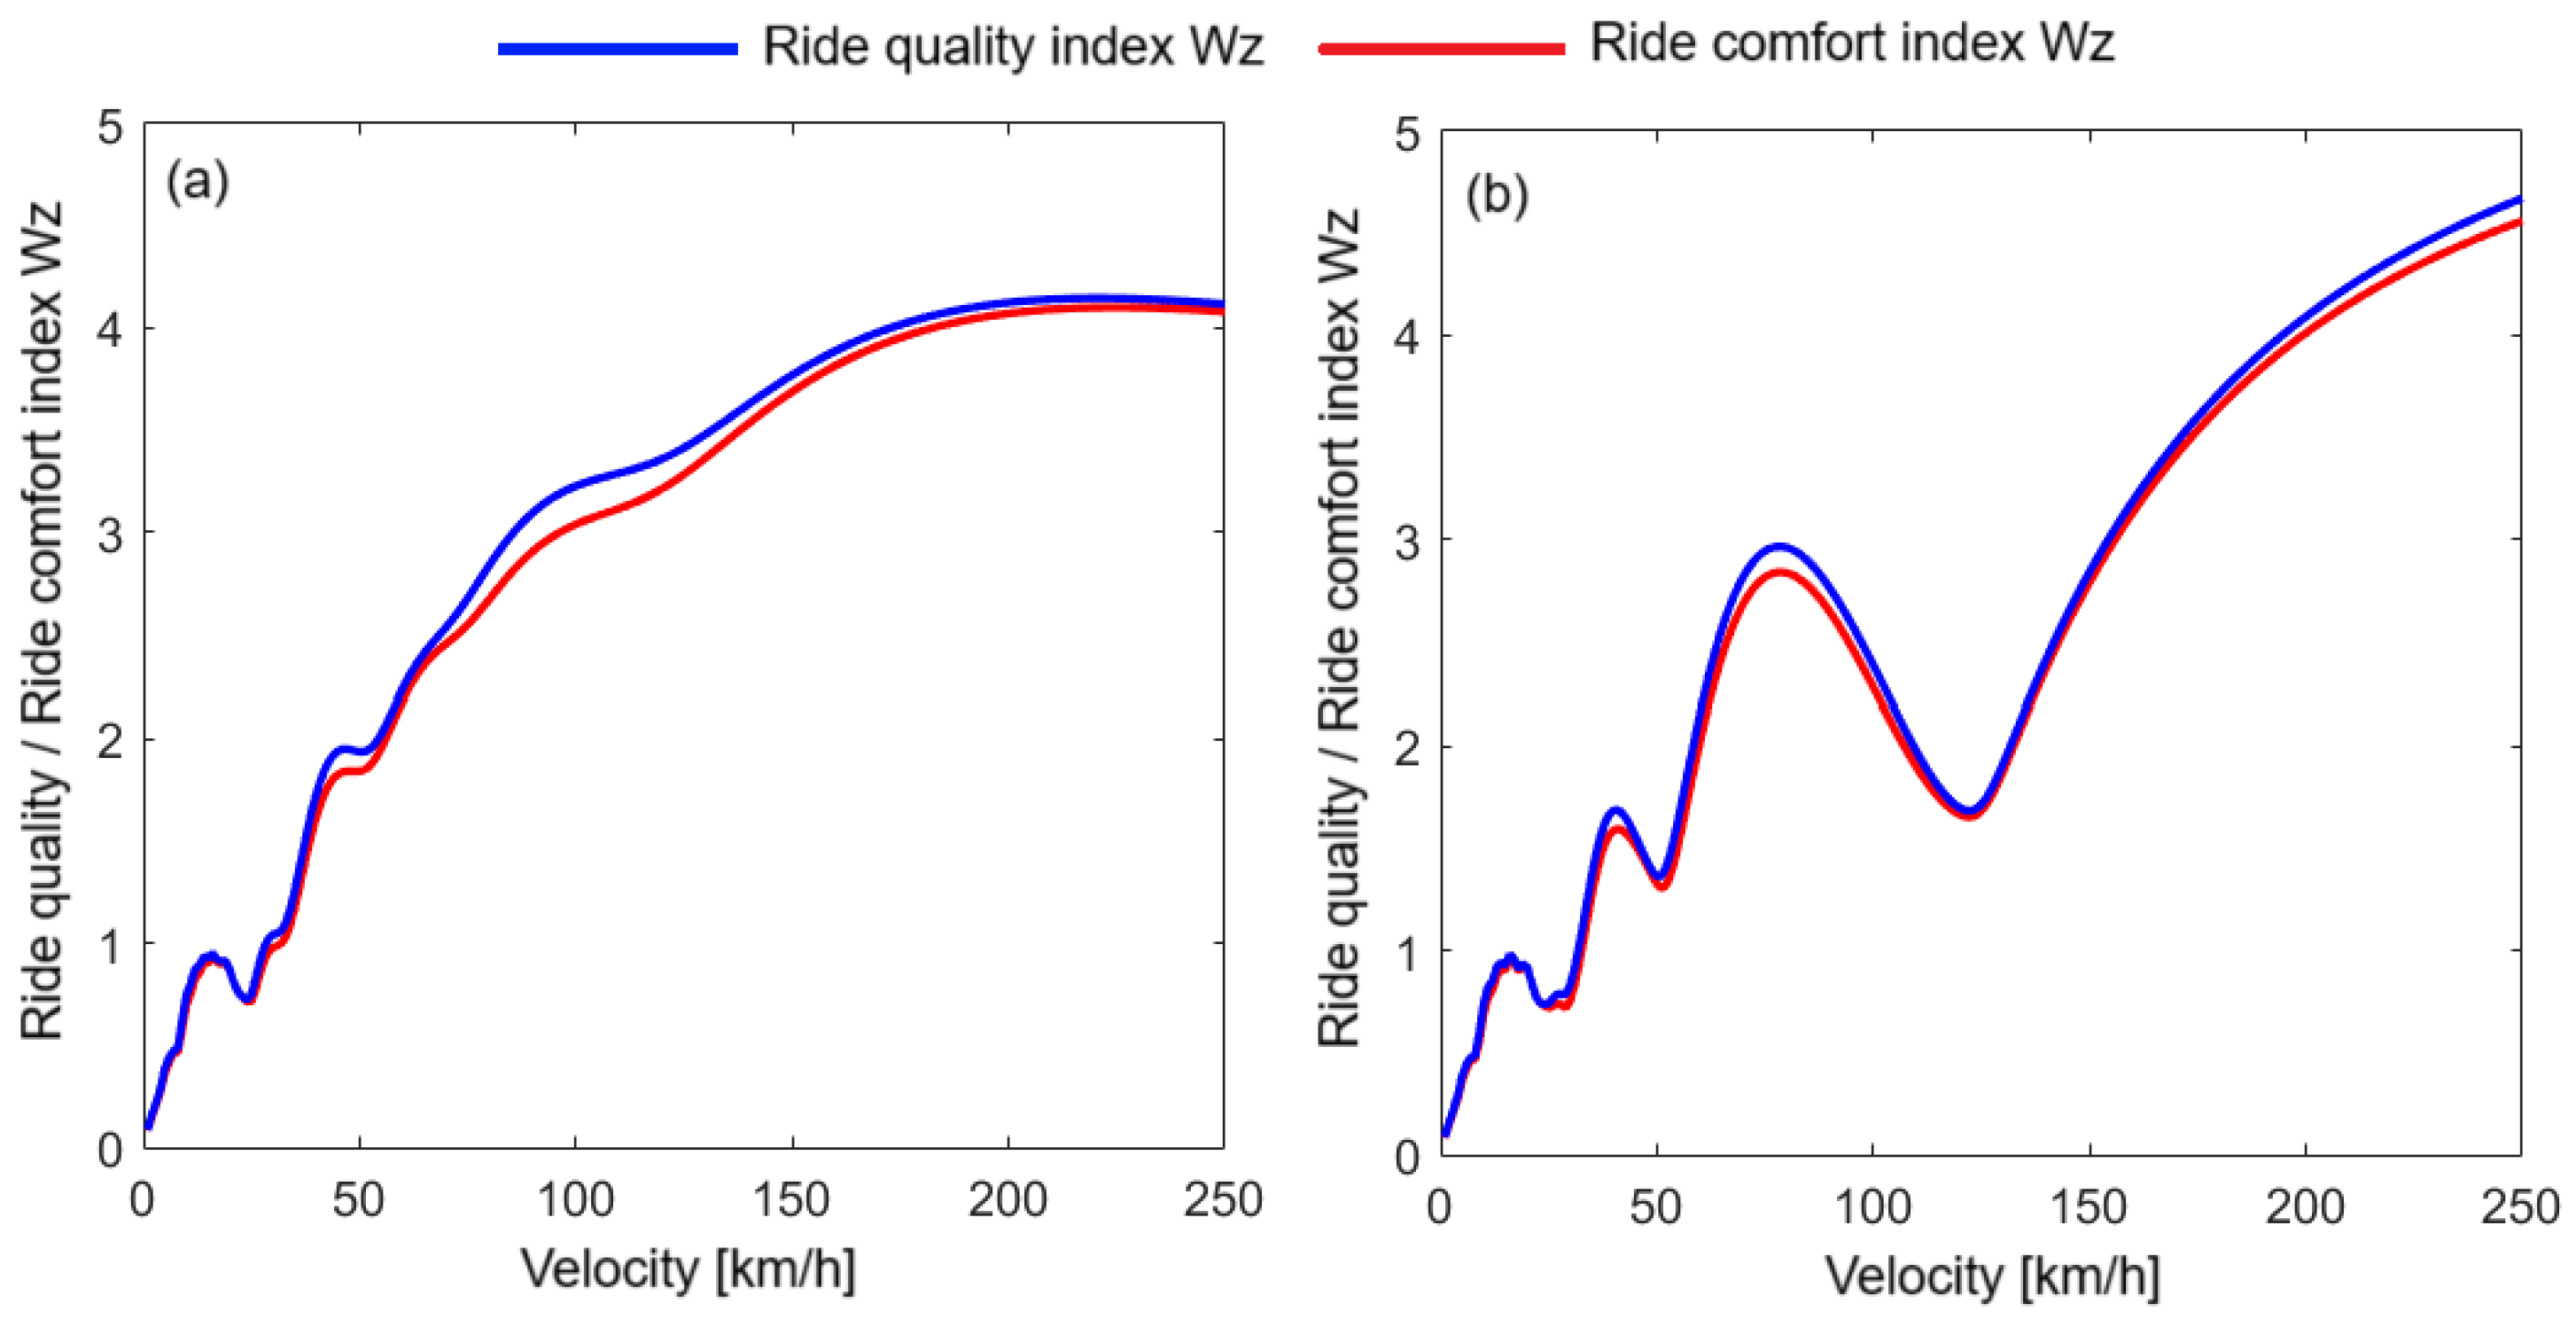
Figure 15 shows the Wz indices for RQ and RC calculated above the bogies. Here, it can be seen that the values of the two Wz indices are very close throughout the analyzed speed range. These results correlate perfectly with those highlighted above, in diagrams (b) of
Figure 12 and
Figure 13, where it was shown that, at the resonance frequency of the pitch, which is the dominant mode of vibration above the bogies, the differences between the PSD of the acceleration weighted with the weighting function for RQ and the PSD of the acceleration weighted with the weighting function for RC are not significant.
5. Conclusions
In this paper, the impact of frequency-weighting on the dynamic response of the railway vehicle carbody were analyzed at three relevant points of the vertical vibration behavior, positioned at the carbody center and above the two bogies. The dynamic response of the carbody is expressed in terms of the PSD of the acceleration. In the analysis, the numerical results are used for three cases: the unweighted PSD of the acceleration; the frequency-weighted PSD of the acceleration with the two weighting functions corresponding to the Sperling index method, namely the frequency-weighting function for RQ; and the frequency-weighting function for RC.
Based on the results regarding the PSD of the acceleration, several important characteristics of the vertical vibration behavior of the vehicle carbody were identified, such as the following: the vibration level of the carbody is higher above the bogies than at its middle; and the asymmetry of the carbody vibration above the two bogies. Another important feature is the geometric filtering effect induced by the vehicle’s wheelbases, due to which the vertical vibration of the carbody does not continuously intensify whit increasing velocity. It was highlighted that the geometric filtering effect becomes more intense at the carbody center and that it exhibits a selective character basing on vehicle speed and frequency, namely that the geometric filtering effect is more intense at low speeds, in the frequency range specific to the carbody bending vibrations. The dominant modes of vibration at the relevant points of the carbody were also identified. At the carbody center, the bounce is the dominant mode of vibration, but in the case of flexible carbodies, at velocities greater than 200 km/h, vertical bending becomes the dominant mode of vibration. Pitch is the dominant mode of vibration above the bogies.
Based on the analysis of the effect of frequency weighting on the dynamic response of the railway vehicle carbody, the following important conclusions are summarized:
- -
The dominant modes of vibration of the carbody are not changed by the frequency weighting;
- -
Both weighting functions corresponding to the Sperling index method reduce the carbody vibration level, with the following observations: the reduction in bounce vibrations is more effective in the case of weighting with the function for the RC function; the reduction in vertical bending vibrations is more effective in the case of weighting with the function for RQ; the reduction in pitch vibrations is not significantly different in the case of weighting with the function for RQ compared to the case of weighting with function for the RC.
Based on the conclusions about the dominant modes of vibration of the carbody and those that emphasized the effect of frequency weighting with the two weighting functions on the carbody vibrations, the results on the Wz indices for RQ and RC were explained.
The results presented in the paper and the conclusions synthesized based on them bring more knowledge in a field of research that has been insufficiently explored so far, in which the objectives of the studies are to identify the advantages and limitations of the RQ and RC evaluation methods, the correlation of the comfort indices obtained by different methods, and even the improvement of these methods from the point of view of applied methodology or interpretations. The paper outcomes contribute to a better understanding on the effect of the weighting functions corresponding to the Sperling index method upon the assessment of the RC and RQ using this method. It should be noted, however, that these results are obtained for a two-dimensional analytical model of the vehicle–track system, which takes into account important factors that can influence the vertical vibration behavior of the carbody, but which is based on several simplifying assumptions. For example, the vertical irregularities of the track are equal on both rails, meaning they are symmetrical with respect to the track axis, so rolling vibrations are not excited. On the other hand, a series of nonlinearities of the system are neglected, such as the nonlinearity of the damping characteristic of the vertical suspension and the wheel-rail contact nonlinearity. All these aspects limit the accuracy of the present study. To obtain numerical results that are more accurate, the research can be further developed based on more complex three-dimensional models obtained by the finite element method.


