Article

YOLO-Based Object and Keypoint Detection for Autonomous Traffic Cone Placement and Retrieval for Industrial Robots

Vehicle Industry Research Center, Széchenyi István University, Egyetem Square 1, 9026 Győr, Hungary
Appl. Sci. 2025, 15(19), 10845; https://doi.org/10.3390/app151910845 (registering DOI)
Submission received: 15 September 2025 / Revised: 3 October 2025 / Accepted: 7 October 2025 / Published: 9 October 2025
(This article belongs to the Special Issue Sustainable Mobility and Transportation (SMTS 2025))

Abstract

The accurate and efficient placement of traffic cones is a critical safety and logistical requirement in diverse industrial environments. This study introduces a novel dataset specifically designed for the near-overhead detection of traffic cones, containing both bounding box annotations and apex keypoints. Leveraging this dataset, we systematically evaluated whether classical object detection methods or keypoint-based detection methods are more effective for the task of cone apex localization. Several state-of-the-art YOLO-based architectures (YOLOv8, YOLOv11, YOLOv12) were trained and tested under identical conditions. The comparative experiments showed that both approaches can achieve high accuracy, but they differ in their trade-offs between robustness, computational cost, and suitability for real-time embedded deployment. These findings highlight the importance of dataset design for specialized viewpoints and confirm that lightweight YOLO models are particularly well-suited for resource-constrained robotic platforms. The key contributions of this work are the introduction of a new annotated dataset for overhead cone detection and a systematic comparison of object detection and keypoint detection paradigms for apex localization in real-world robotic applications.

1. Introduction

Autonomous mobile robot platforms have become increasingly prevalent in industrial environments, where they are used to automate repetitive and safety-critical tasks with high efficiency and reliability. Such systems are especially beneficial in logistics [1,2,3], warehouse automation [4,5,6], construction sites [7,8,9], and road infrastructure maintenance [10,11,12]. These platforms typically integrate advanced sensing, localization, and robotic manipulation capabilities to perform context-specific tasks with high levels of autonomy and precision.
For related industrial efforts, several systems have coupled real-time detection with precise manipulation under field constraints: Dhall et al. recover 3D cone positions from monocular images by detecting cone-specific keypoints and exploiting projective invariants, enabling on-board deployment on embedded hardware for autonomous driving tasks [13]. Beyond perception alone, a prototype “full-automatic” traffic-cone placement and retrieval system integrates a smart manipulator with vision for end-to-end handling in roadwork scenarios [14]. More recently, Wang et al. demonstrated an embedded, improved-YOLOv5 pipeline in an automatic cone-retractor platform, reporting robust retrieval across lighting and occlusion conditions [15]. In broader industrial mobile manipulation, Štibinger et al. presented an outdoor, self-contained UGV–arm (Unmanned Ground Vehicle) system that autonomously localizes, grasps, transports, and deploys construction materials in semi-structured environments—highlighting the importance of view-invariant perception and precise placement for field robots [16]. Complementary advances in factory automation show end-to-end autonomy for object picking: Park et al. combined human demonstration with YOLO-based vision to build a fully autonomous bin-picking platform, underscoring the maturity of integrated perception–manipulation stacks for high-throughput industrial tasks [17].
To address the specific challenges of traffic cone deployment and collection, our research team at Széchenyi István University has developed a purpose-built autonomous mobile robot platform tailored for industrial-scale field deployment tasks, as illustrated in Figure 1 [18]. The primary goal of this platform is to provide a modular, high-precision, and multipurpose robotic system capable of performing hazardous and repetitive roadside activities autonomously. The robot platform is constructed on a heavy-duty, four-wheel-drive skid-steer base with air-inflated rubber tires. This configuration ensures high load capacity and maneuverability even in uneven outdoor environments. The platform is capable of transporting up to 30 standard traffic cones, representing a payload of approximately 150 kg. In addition to mobility, the system houses a full sensor and control stack for perception, localization, and manipulation. For high-accuracy positioning, the robot is equipped with a GNSS-RTK (Global Navigation Satellite System—Real-Time Kinematic) module, allowing centimeter-level spatial accuracy in outdoor scenarios. A collaborative robotic arm with a custom electric gripper is integrated onto the platform. The choice of a collaborative manipulator stems from two considerations: (i) the potential for future multipurpose use cases that require fine manipulation, and (ii) the need for safe human–robot interaction in mixed environments. From a control architecture perspective, the robot’s onboard computing system is organized into six main subsystems: power management, propulsion, robotic manipulation, machine vision, low-level control, and high-level task planning. The high-level layer is powered by two embedded computers running ROS 2 (Robot Operating System 2) [19]. One computer is dedicated to perception tasks, particularly AI-based visual processing, while the other handles real-time control, path planning, and system integration. The entire system is operated through a web-based user interface, allowing human operators to define placement positions directly on a digital map. The robot then autonomously executes the deployment sequence using its integrated localization and manipulation subsystems. Similarly, the robot can locate and collect cones based on the same spatial references, augmented with visual detection. This integrated architecture enables our robot platform to perform fully autonomous cone deployment and retrieval missions with a high degree of reliability and precision. While the current application is specific to traffic management, the underlying platform is extensible and can be adapted to a broad range of industrial service tasks involving precise object handling in outdoor environments.
Central to the robot’s autonomous behavior is a custom-developed artificial intelligence-based machine vision module. This module fuses data from multiple camera inputs and lidar sensors to support environmental understanding, object detection, and spatial reasoning. Of particular interest is the visual detection and localization of traffic cones during the retrieval process. To support this task, a top-mounted Stereolabs ZED 2i stereo camera (Stereolabs, San Francisco, CA, USA) provides RGB (Red-Green-Blue) and depth streams at 1280 × 720 resolution with 30 FPS (Frame Per Second), ensuring a near-overhead view of the cones. The onboard computation is provided by the Connect Tech Rudi-AGX industrial computer (Connect Tech, Guelph, ON, Canada), which integrates an NVIDIA Jetson AGX Xavier system-on-module (NVIDIA, Santa Clara, CA, USA) with a 512-core Volta GPU, 64 Tensor Cores, and 32 GB LPDDR4x RAM, enabling compatibility with real-time embedded processing in the final robotic application.
This paper presents the design and experimental evaluation of a neural network for cone-apex detection, trained offline on a custom-labeled dataset on the Paperspace cloud environment; on-board integration on the Connect Tech Rudi-AGX platform has not yet been performed on this stage. While the current training and evaluation experiments were carried out in a high-performance cloud environment, the perception stack has been designed for deployment on a Connect Tech Rudi-AGX industrial computer. Since no publicly available dataset exists for overhead views of cones under realistic outdoor conditions, we developed a dedicated dataset containing images of cones captured in diverse lighting and environmental contexts. These images were annotated manually to include bounding boxes and apex coordinates, forming the foundation for the deep learning-based keypoint detection presented in this paper.

2. Related Work

Pose estimation initially catered to articulated biological subjects, such as humans, where keypoint-based models like OpenPose (using Part Affinity Fields) [20] and HRNet (maintaining high-resolution features) [21] demonstrated real-time performance and localization precision for multi-person scenes. These techniques laid the foundation for keypoint-driven perception pipelines capable of operating in cluttered environments.
This concept was soon adapted to rigid objects. Tekin et al. proposed a single-shot 6D pose estimator that regresses 2D projections of 3D box corners and uses PnP to recover pose efficiently [22]. PoseCNN [23] refined this in cluttered settings by combining dense estimation with pose refinement, and EPOS [24] addressed symmetrical objects—a frequent challenge with industrial components.
Expanding to category-level manipulation, kPAM introduced semantic 3D keypoints as task-relevant affordances, enabling robots to generalize manipulation actions across object instances [25]. To reduce reliance on annotated data, Augmented Auto-encoders [26] and Self6D [27] leverage domain randomization and synthetic training to transfer pose estimation pipelines from simulation to reality, while SD-Pose [28] introduces semantic decomposition to improve cross-domain generalization, effectively reducing the gap between synthetic and real data in industrial contexts. From another perspective, MFMDepth [29] proposed a MetaFormer-based monocular metric depth estimation framework for port environments, where traffic cones were employed as reference objects to validate metric accuracy, demonstrating their usefulness as standardized items in depth estimation even outside traditional road scenarios.
YOLO-style networks later unified detection and keypoint estimation in single-shot frameworks. YOLO-Pose [30] outputs bounding boxes and keypoints together, and KAPAO [31] models poses as objects, simplifying inference pipelines while retaining accuracy.
In domains closely related to our work the following studies are noteworthy. Liu et al. introduced the RSCS6D framework, which employs semantic segmentation followed by the extraction of compact and informative 3D keypoint clouds for 6D pose estimation from RGB-D images, enabling efficient and interpretable solutions for industrial robotic grasping tasks [32]. Zhang et al. proposed a point cloud-based 6D pose estimator for industrial parts, combining instance segmentation and edge-aware geometric matching to support robotic grasping [33]. Alterani et al. compared deep learning versus hybrid models in robotic fruit-picking, showing hybrid (learning + geometric refinement) pipelines outperform pure learning approaches in accuracy [34]. Govi et al. detailed a collaborative robot picking multiple industrial objects, highlighting perception robustness in real-world pick-and-place tasks [35]. Lu et al. tackled marker-less keypoint optimization for robot manipulators via sim-to-real transfer, improving visual localization without manual markers [36]. Lastly, Höfer et al. focused on object detection and autoencoder-based pose estimation for bin-picking in highly cluttered piles, using RGB input and pose filtering strategies suitable for real-time operation [37].
Collectively, these works illustrate how keypoint-based perception—once centered around biological pose—has matured into robust, real-time and simulation-assisted systems for industrial object detection and pose estimation. This trend strongly motivates our approach of applying YOLO-based keypoint detection to traffic cone apex localization for autonomous deployment and retrieval.

3. Materials and Methods

3.1. YOLO-Based Models

In this study, the YOLO (You Only Look Once) family of models was selected due to its wide adoption, proven efficiency, and versatility across a broad spectrum of computer vision tasks [38,39,40,41,42]. YOLO architectures have become a de facto standard in real-time object detection, and more recently in pose estimation, offering an excellent balance between accuracy, inference speed, and computational requirements. Their adaptability to multiple application domains, including autonomous driving, industrial inspection, and human pose estimation, made them a natural choice for our evaluation of cone apex detection. We used the official Ultralytics implementations to ensure reproducibility, up-to-date architectures, and consistency with widely adopted benchmarks, avoiding discrepancies from unofficial forks [43,44,45].
We conducted our experiments using three YOLO families—YOLOv8, YOLOv11, and YOLOv12—each tested in both object detection and pose estimation modes, all of which are official releases maintained by Ultralytics (Ultralytics, Frederick, MD, USA) [43,44,45]. The object detection approach was adapted to our problem by centering the bounding box on the cone apex and including a predefined local region around it. In contrast, the pose estimation approach directly predicted a bounding box that enclosed the entire cone, together with a single keypoint denoting its apex. By evaluating both methods, we were able to assess the trade-offs between explicit keypoint regression and context-based bounding box localization.
YOLOv8 represented a significant milestone as the first Ultralytics-only release, moving to an anchor-free detection head and employing decoupled regression and classification branches. The pose variant extended this design to support keypoint regression, allowing simultaneous detection of bounding boxes and cone apex coordinates. In terms of computational scale, YOLOv8 ranged from the nano configuration, with approximately 3.2 million parameters and 8.7 GFLOPs, to the extra-large version with roughly 68 million parameters and 257 GFLOPs. This wide range made it suitable for both lightweight deployment scenarios and high-accuracy, resource-intensive experiments [43].
YOLOv11 further refined the architectural design by improving multi-scale feature aggregation, enhancing backbone connections, and introducing optimized training strategies, including more robust data augmentation pipelines. These refinements contributed to improved stability during training and superior generalization, especially in cluttered or partially occluded environments. The pose variant of YOLOv11 was particularly effective in maintaining high localization accuracy under challenging conditions, while the detection variant offered a balanced trade-off between precision and inference speed. Parameter counts for YOLOv11 followed a similar scaling strategy as YOLOv8, starting from lightweight versions optimized for edge deployment at around 4 million parameters, and scaling up to more than 70 million parameters in the extra-large models [44].
YOLOv12, the most recent member of the family, introduced receptive field enhancements, improved feature pyramid structures, and specialized pose-aware detection heads. These innovations significantly increased the accuracy of small-object localization and improved robustness against environmental disturbances such as partial occlusions or varying illumination. The detection variant also benefited from context-aware aggregation modules and optimized backbone representation, which translated into superior bounding box regression performance. With parameter counts ranging from approximately 3.5 million in the nano configuration to over 75 million in the extra-large models, YOLOv12 maintained the versatility of its predecessors while providing measurable improvements in accuracy and robustness [45].
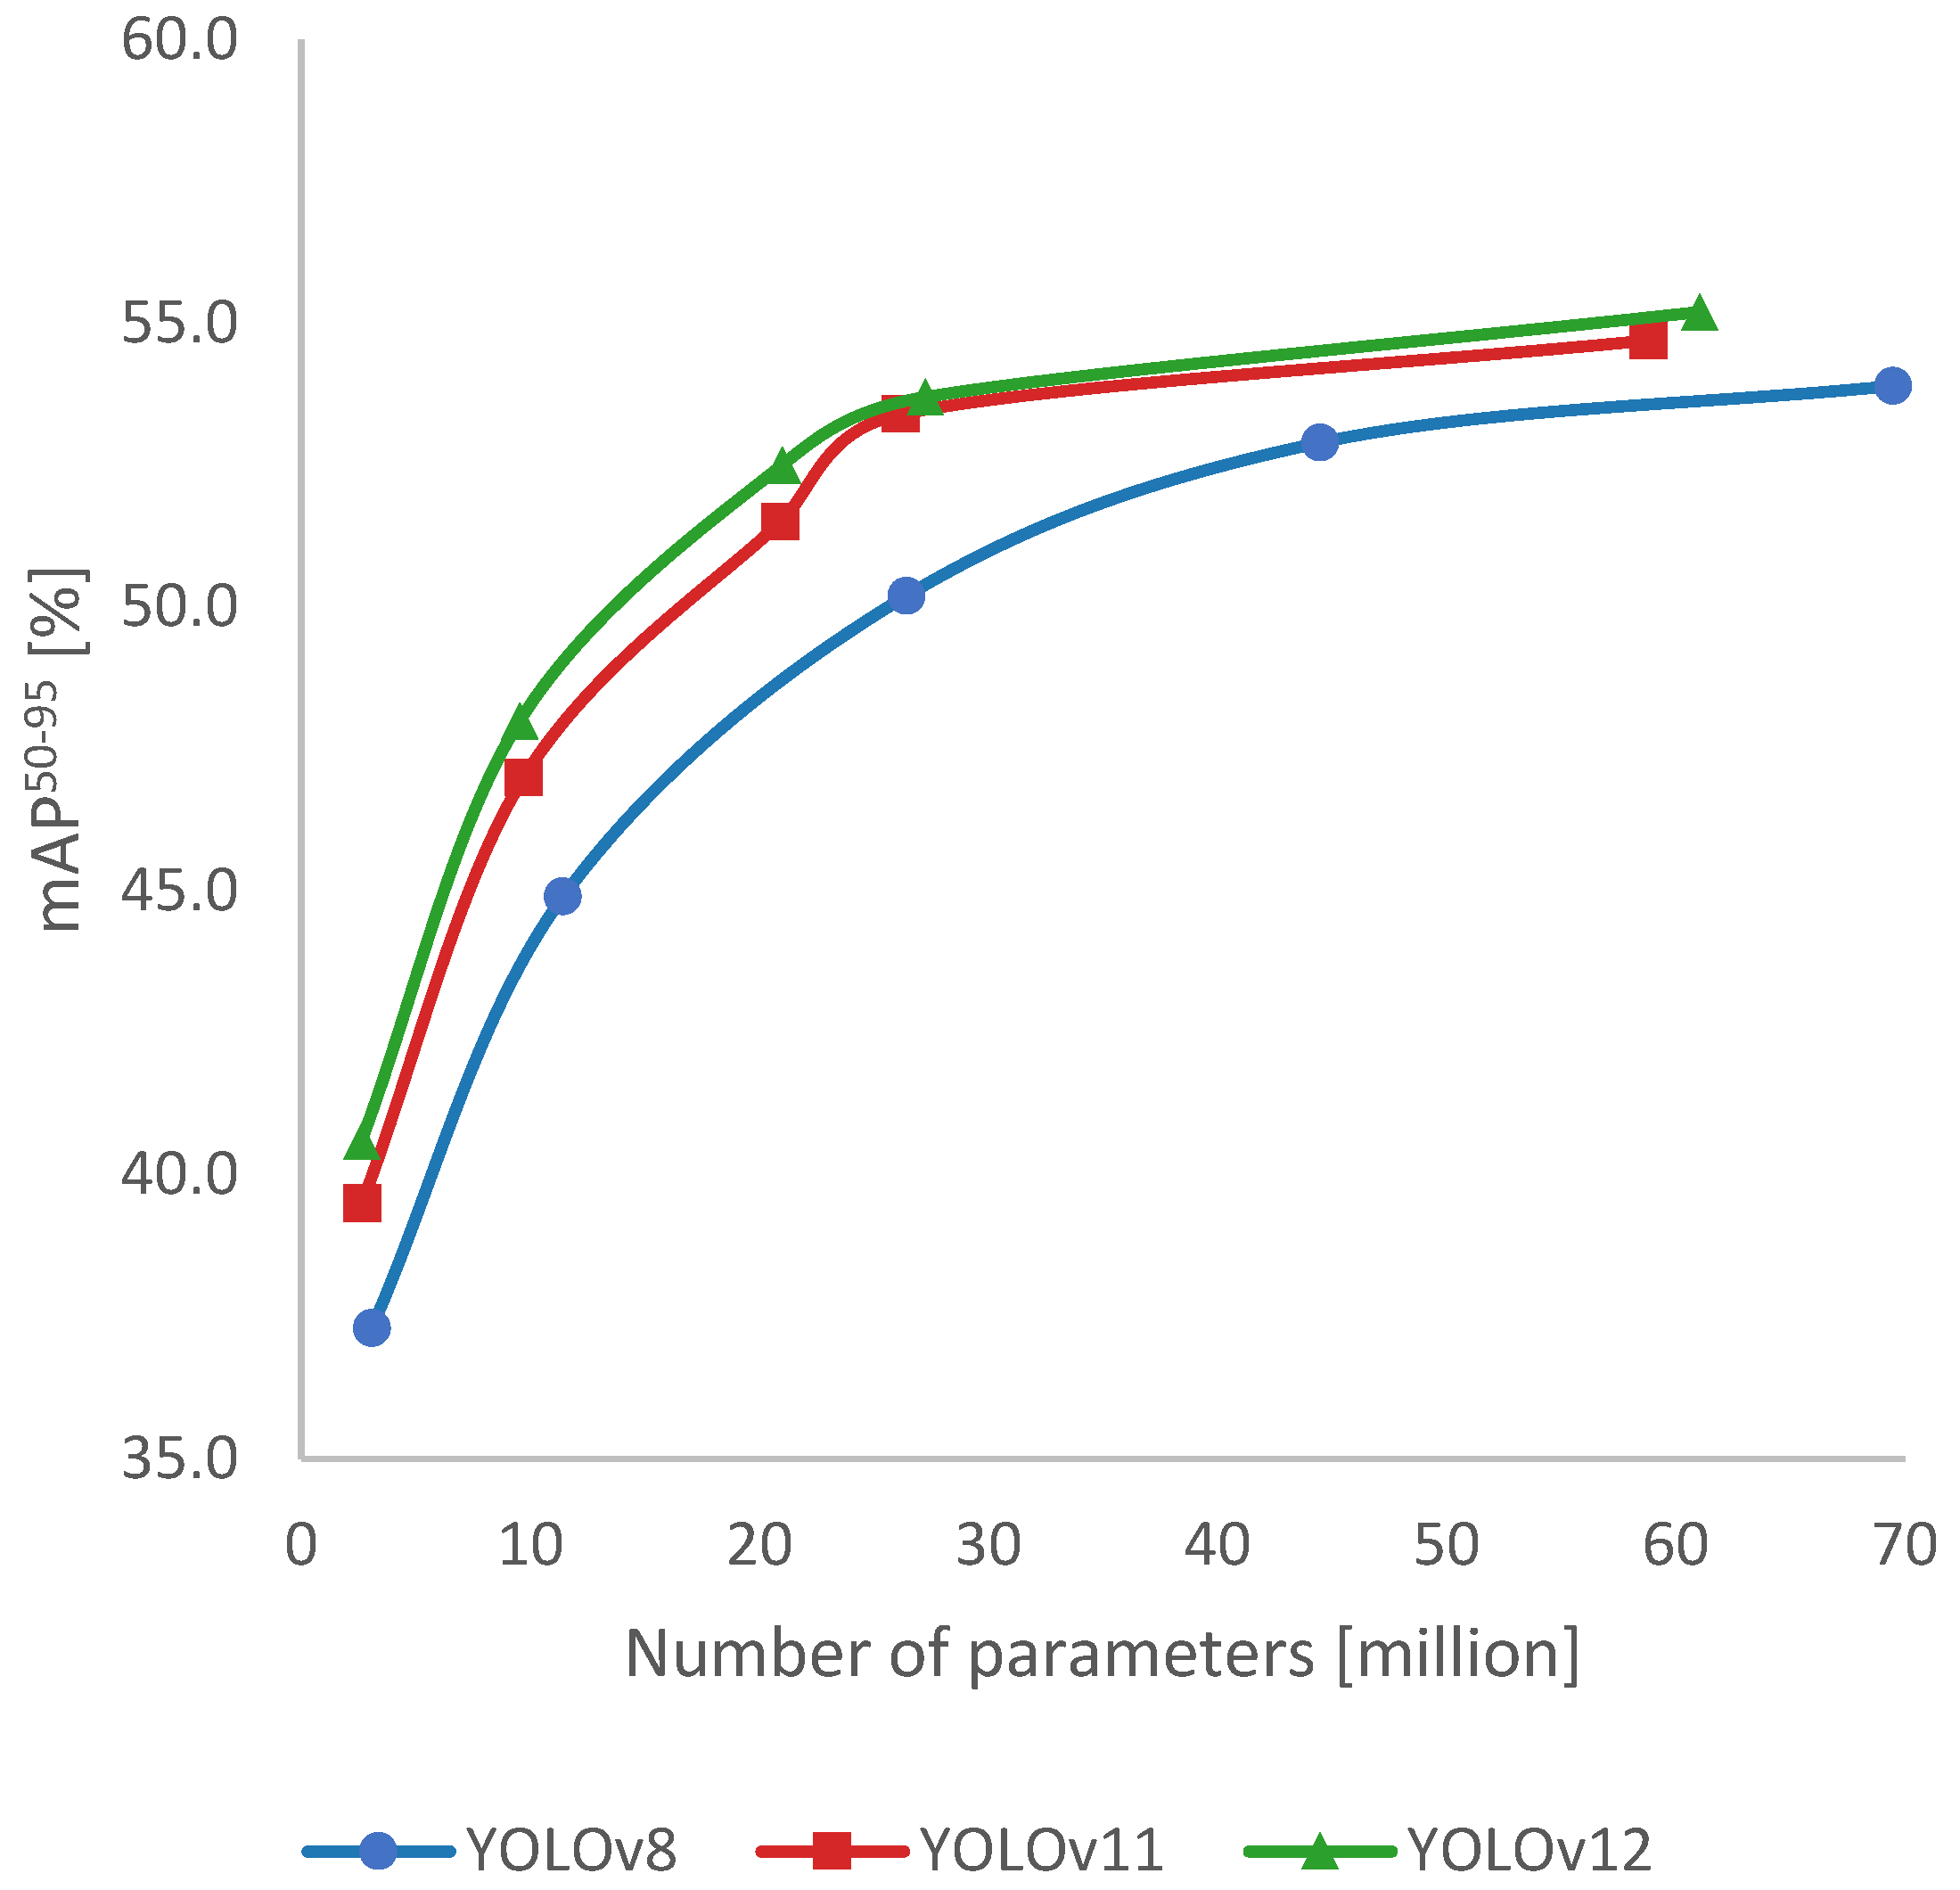
When evaluating these models on the COCO benchmark dataset [46], a clear and consistent trend can be observed. As illustrated in Figure 2, larger architectures with higher parameter counts consistently achieve better results in terms of mAP (mean Average Precision). Furthermore, the progression across model families also shows steady improvement: YOLOv12 outperforms YOLOv11, which in turn surpasses YOLOv8. In this sense, the situation appears rather ideal—greater model capacity and newer generations reliably translate into higher accuracy. However, this naturally raises an important question: can we assume that this trend will hold across all tasks and datasets? Is YOLOv8n inevitably the weakest choice, and YOLOv12x always the strongest, regardless of the problem domain? These considerations highlight the necessity of further investigations on more specialized tasks, such as the detection of traffic cones from near top-view perspectives and the precise localization of their apex keypoints, where the relationship between model complexity and task-specific performance may not follow the same idealized pattern observed on COCO.

3.2. Dataset Collection and Annotation

Since no publicly available dataset was found that specifically focuses on the detection of traffic cones from a near top-down perspective, a custom dataset was constructed to support both training and evaluation of the proposed models. General-purpose object detection benchmark datasets such as COCO [46], KITTI [47] and BDD100K [48] do not provide a sufficient number of cone samples, particularly under the specific perspectives and environmental variations required for this research. Therefore, a dedicated dataset was collected and annotated.
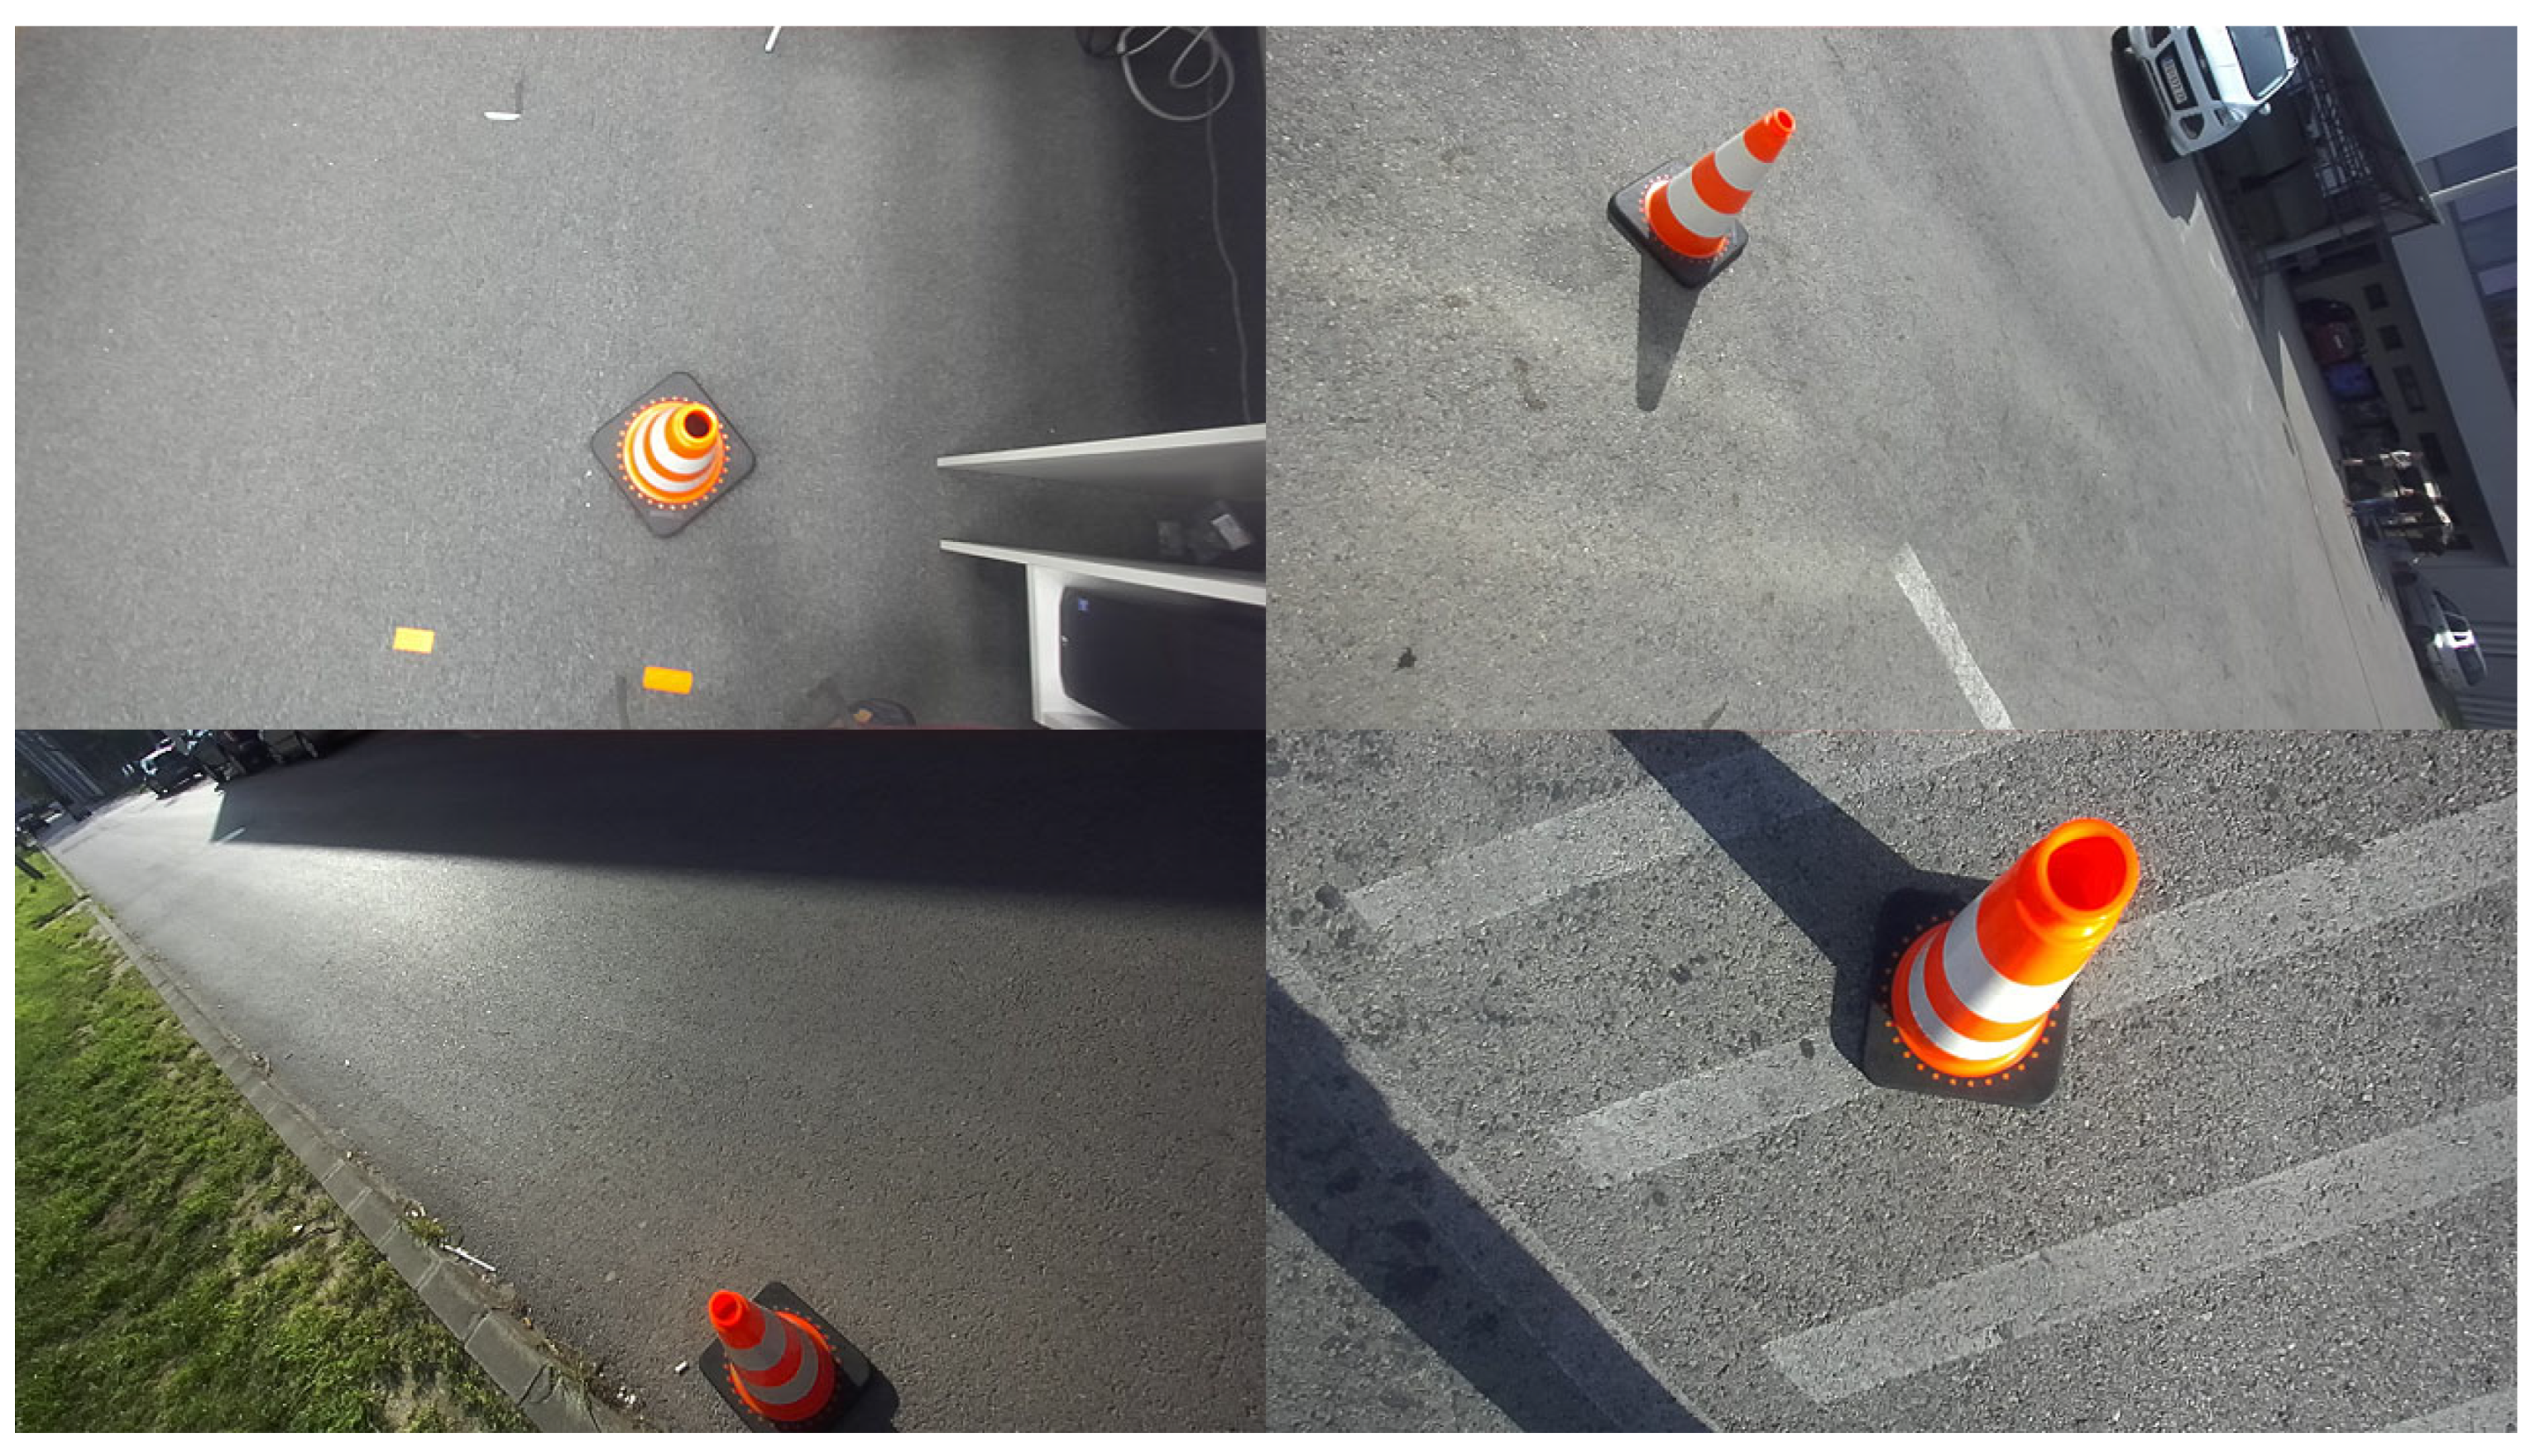
Image acquisition was performed using the onboard Stereolabs ZED 2i stereo camera mounted on the developed robotic platform. Recordings were made in both indoor and outdoor environments under diverse illumination conditions (direct sunlight, shadows, artificial light, and rainy weather) and across various background textures (asphalt, grass, road markings, and curbs). The dataset primarily depicts cones from top-down and near top-down perspectives, which are particularly relevant for robotic manipulation tasks. Some representative samples from the dataset are shown in Figure 3.
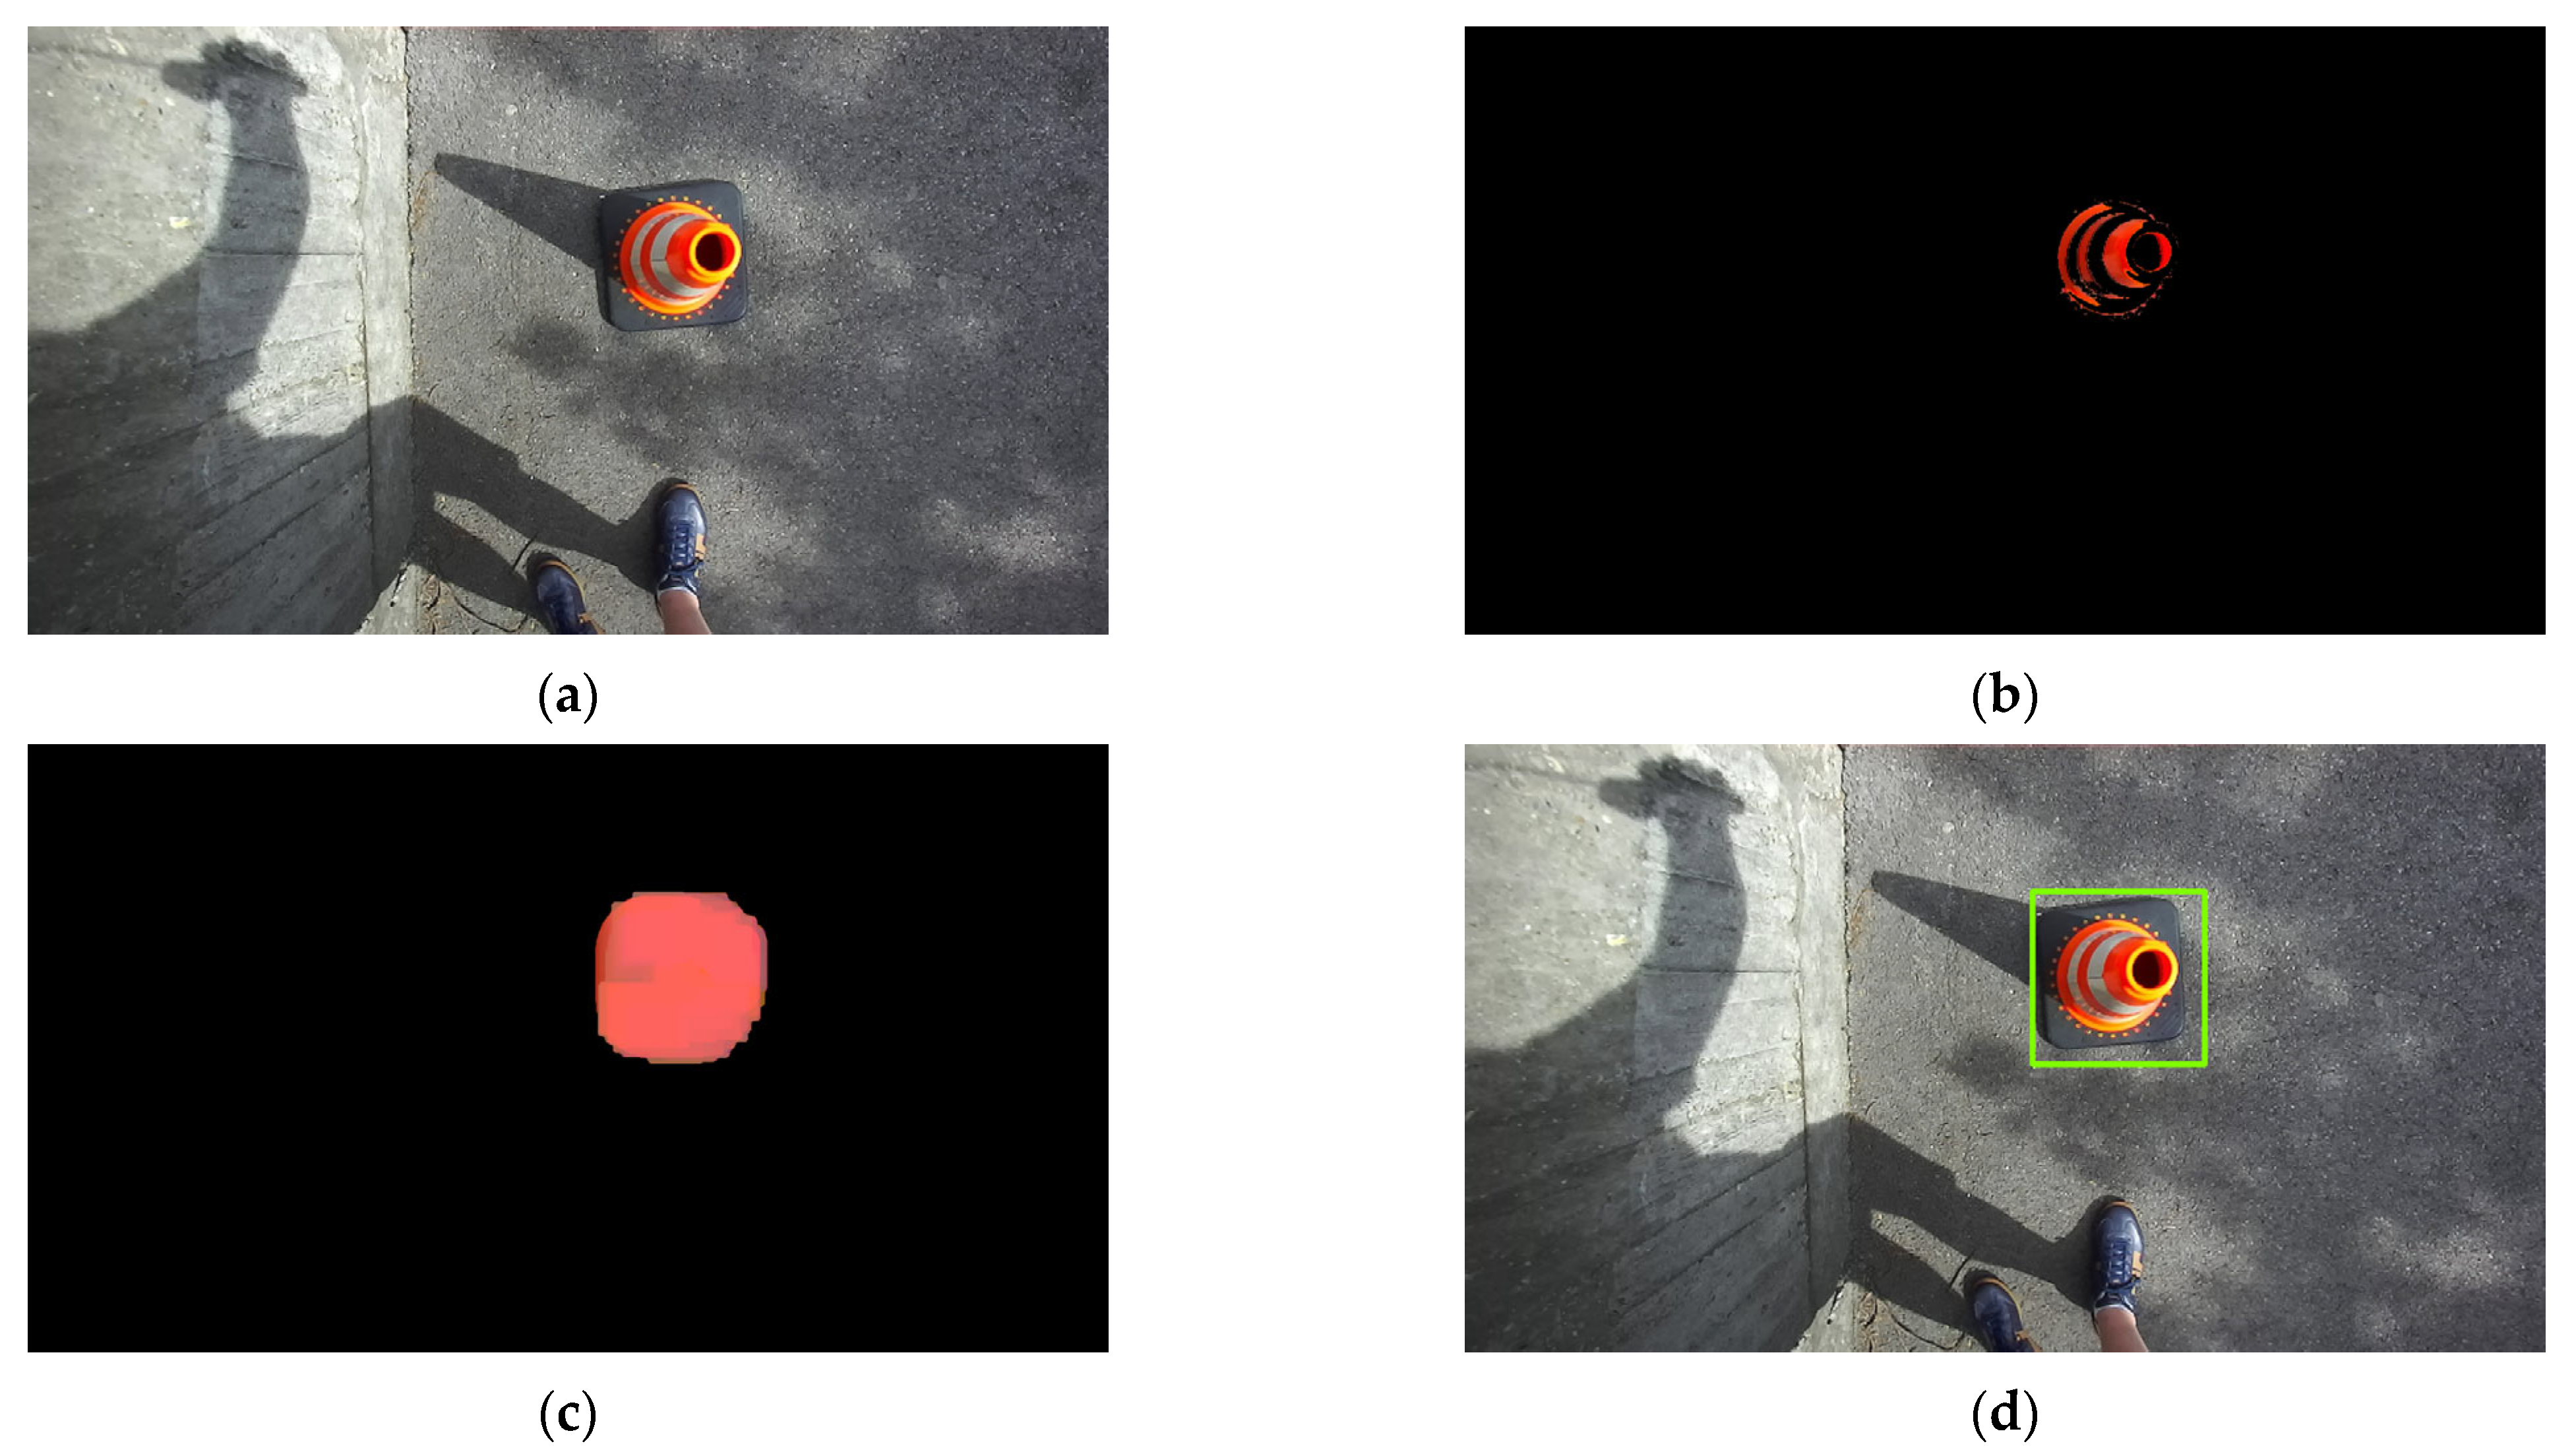
To ensure accurate annotations, a semi-automatic pipeline was applied. First, color filtering in the HSV (Hue–Saturation–Value) color space was performed to highlight the red surface of the cones. The filtering thresholds were determined empirically for each recording, resulting in a binary mask in which only the red regions were visible. Next, morphological dilation [49] was applied to these red areas so that fragmented parts merged into a single connected blob. Based on these blobs, contours were extracted [50], and the bounding rectangle of each contour was defined as the bounding box of the corresponding cone. These steps are illustrated in Figure 4 through a representative example.
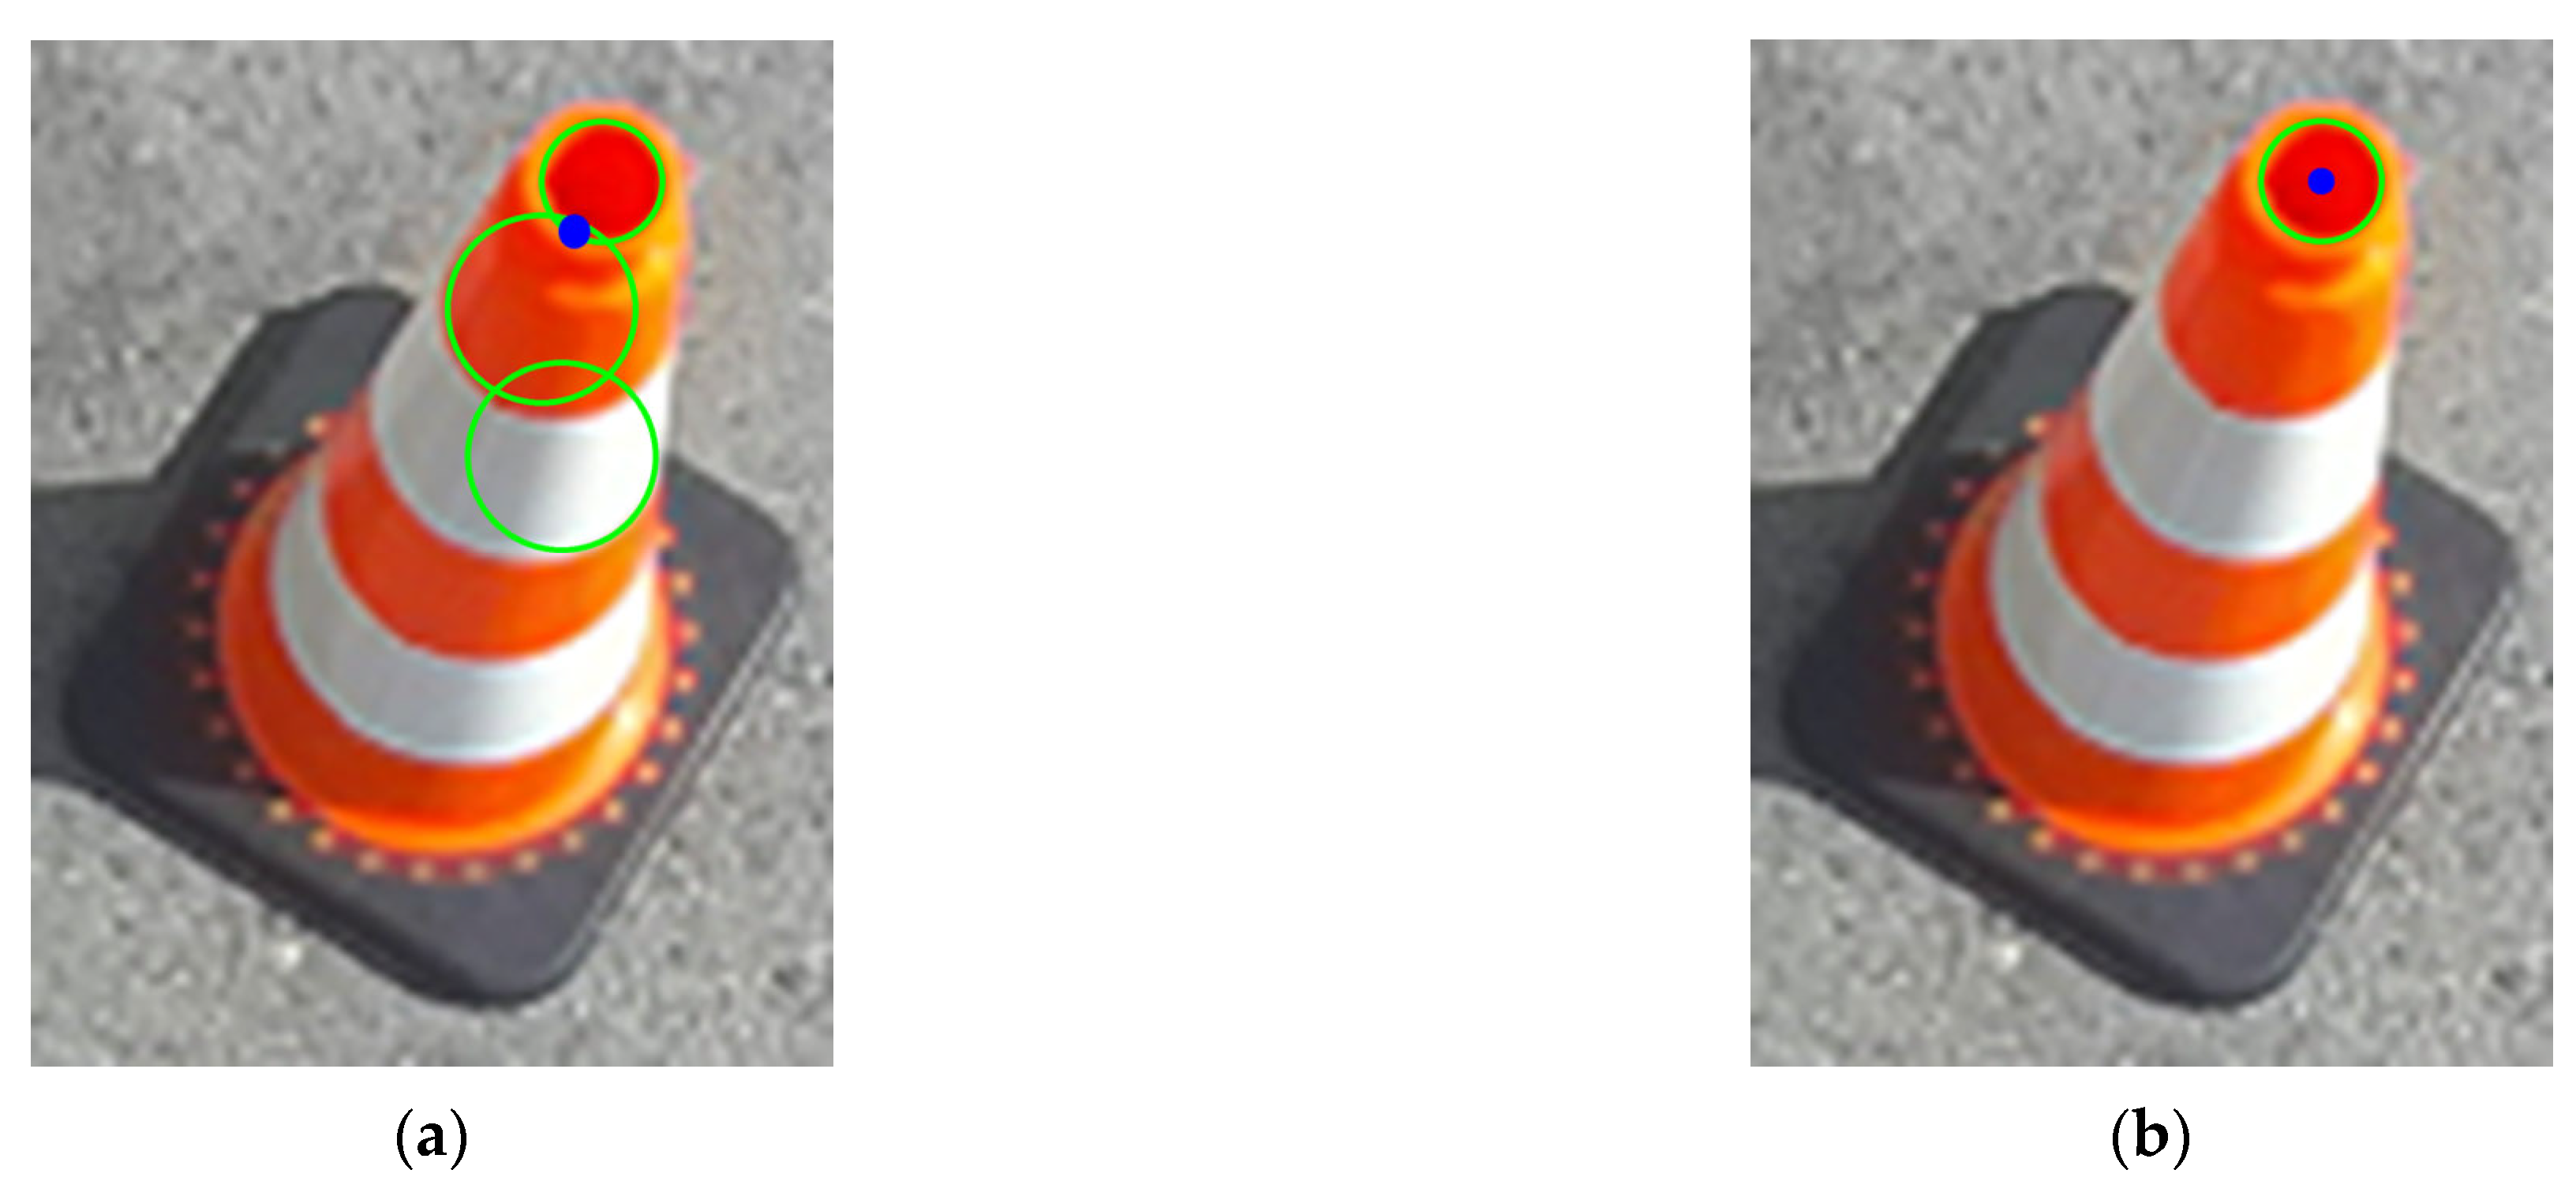
Within the area of each bounding box, disparity maps from the stereo camera were then used to identify the highest point of the cone. However, this point typically corresponded to the rim rather than the true apex. To address this limitation, circles were detected in the candidate region using the Hough transform [51]. Finally, the center of the circle closest to the disparity-based point was taken as the corrected apex location, yielding reliable keypoint annotations. This refinement process is demonstrated in Figure 5.
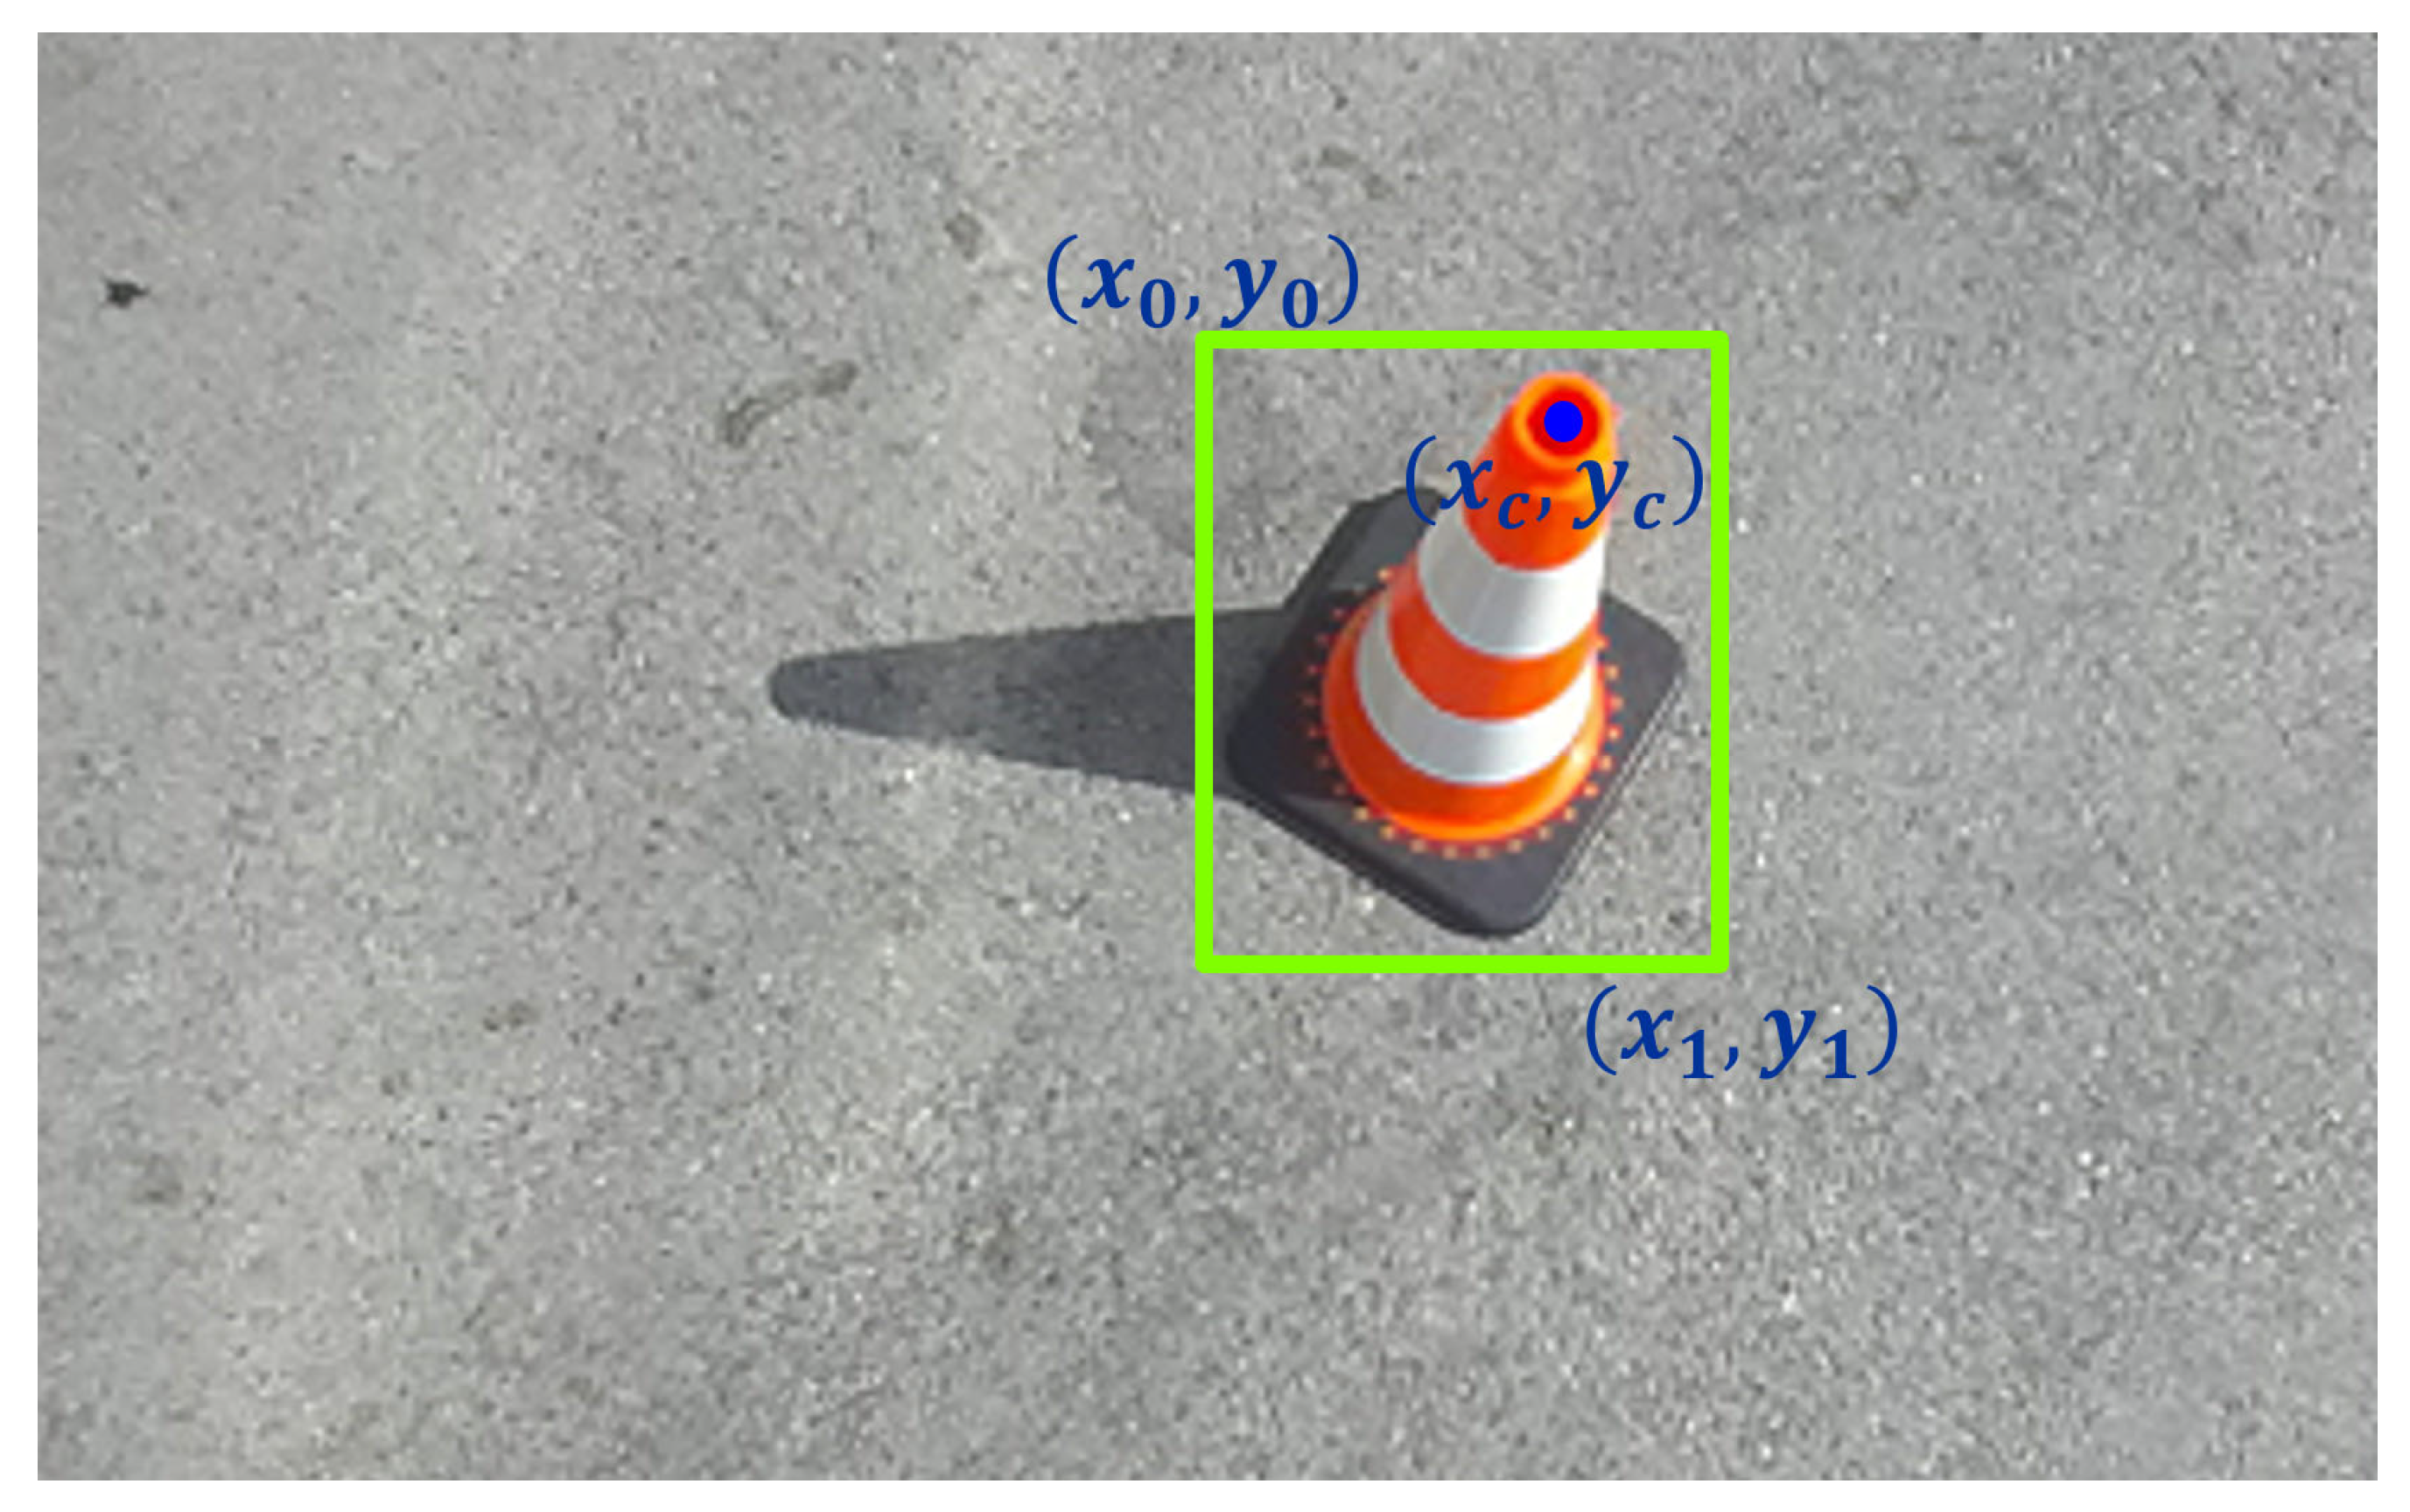
As a result of this procedure, a dataset of 1522 samples was created. Each sample contains a color image together with six numerical values describing the annotation: the top-left x 0 ,   y 0 and bottom-right x 1 ,   y 1 coordinates of the bounding box, as well as the x c ,   y c coordinates of the apex keypoint. Figure 6 illustrates an example of a labeled image. The resulting dataset provides a unique resource for keypoint-aware traffic cone detection and enables the evaluation of state-of-the-art object detection and keypoint detection networks in scenarios that require both bounding box representation and precise keypoint localization.

4. Results

In order to provide a comprehensive evaluation, four distinct experimental setups were considered for each model family. In the first case, full bounding boxes together with a single apex keypoint were detected using pose detector-based networks. In the remaining three cases, conventional object detection was applied, where the bounding box was centered on the cone apex, and its size was varied to represent different levels of contextual information: 30 × 30, 50 × 50, and 70 × 70 pixels. In these latter three cases, the detected keypoint was defined as the center of the bounding box. This design allowed us to assess not only the raw detection accuracy but also the influence of surrounding visual context on the effectiveness of keypoint localization.
All YOLO variants were trained under identical experimental settings to ensure a fair comparison. Each model was trained for 100 epochs with an input resolution of 640 × 640 pixels, batch size of 16 , and a fixed random seed of 0 . The training set contained 1217 images, while 305 images were used for validation. A cosine learning rate scheduler was applied, decaying from an initial learning rate of 0.01 to a final value of 0.0001 . For object detection experiments, the optimizer was SGD [52] with momentum of 0.937 and weight decay of 0.0005 . For keypoint detection experiments, AdamW [53] was used with beta parameters of 0.9 and 0.999 and weight decay of 0.0005 . In both cases the loss function was defined as the L2 distance between predicted and ground-truth apex coordinates. Data augmentation was limited to random cropping and mosaic augmentation, and no early stopping was applied to ensure identical iteration counts across all models.
The evaluation of the YOLOv8, YOLOv11, and YOLOv12 model families demonstrated that all networks achieved consistently high performance on the cone detection task. The difference between the best- and worst-performing architectures in terms of mAP50–95 was only 0.14376 , indicating that although measurable differences exist, each model family provides reliable results. Nevertheless, the analysis of inference times, parameter counts, and detection accuracy revealed meaningful trends that highlight the relative strengths and weaknesses of the examined networks.
It is important to note that all training and evaluation experiments reported in this paper were conducted on the Paperspace cloud platform rather than on the final embedded hardware. The environment was based on Ubuntu 22.04.3 LTS, equipped with an Intel Xeon Gold 5315Y CPU (Intel, Santa Clara, CA, USA) (Central Processing Unit) (3.20 GHz), 45 GB RAM (Random Access Memory), and an NVIDIA RTX A4000 GPU (Graphics Processing Unit) with 16 GB VRAM (Video Random Access Memory). The NVIDIA driver version was 550.144.03, with CUDA 12.4 and cuDNN 8.0. The models were implemented and trained in PyTorch 2.1.1. This high-performance workstation setup enabled large-scale training and benchmarking, while the ultimate deployment target of the perception stack will be a Connect Tech Rudi-AGX computer integrated into the robot platform.
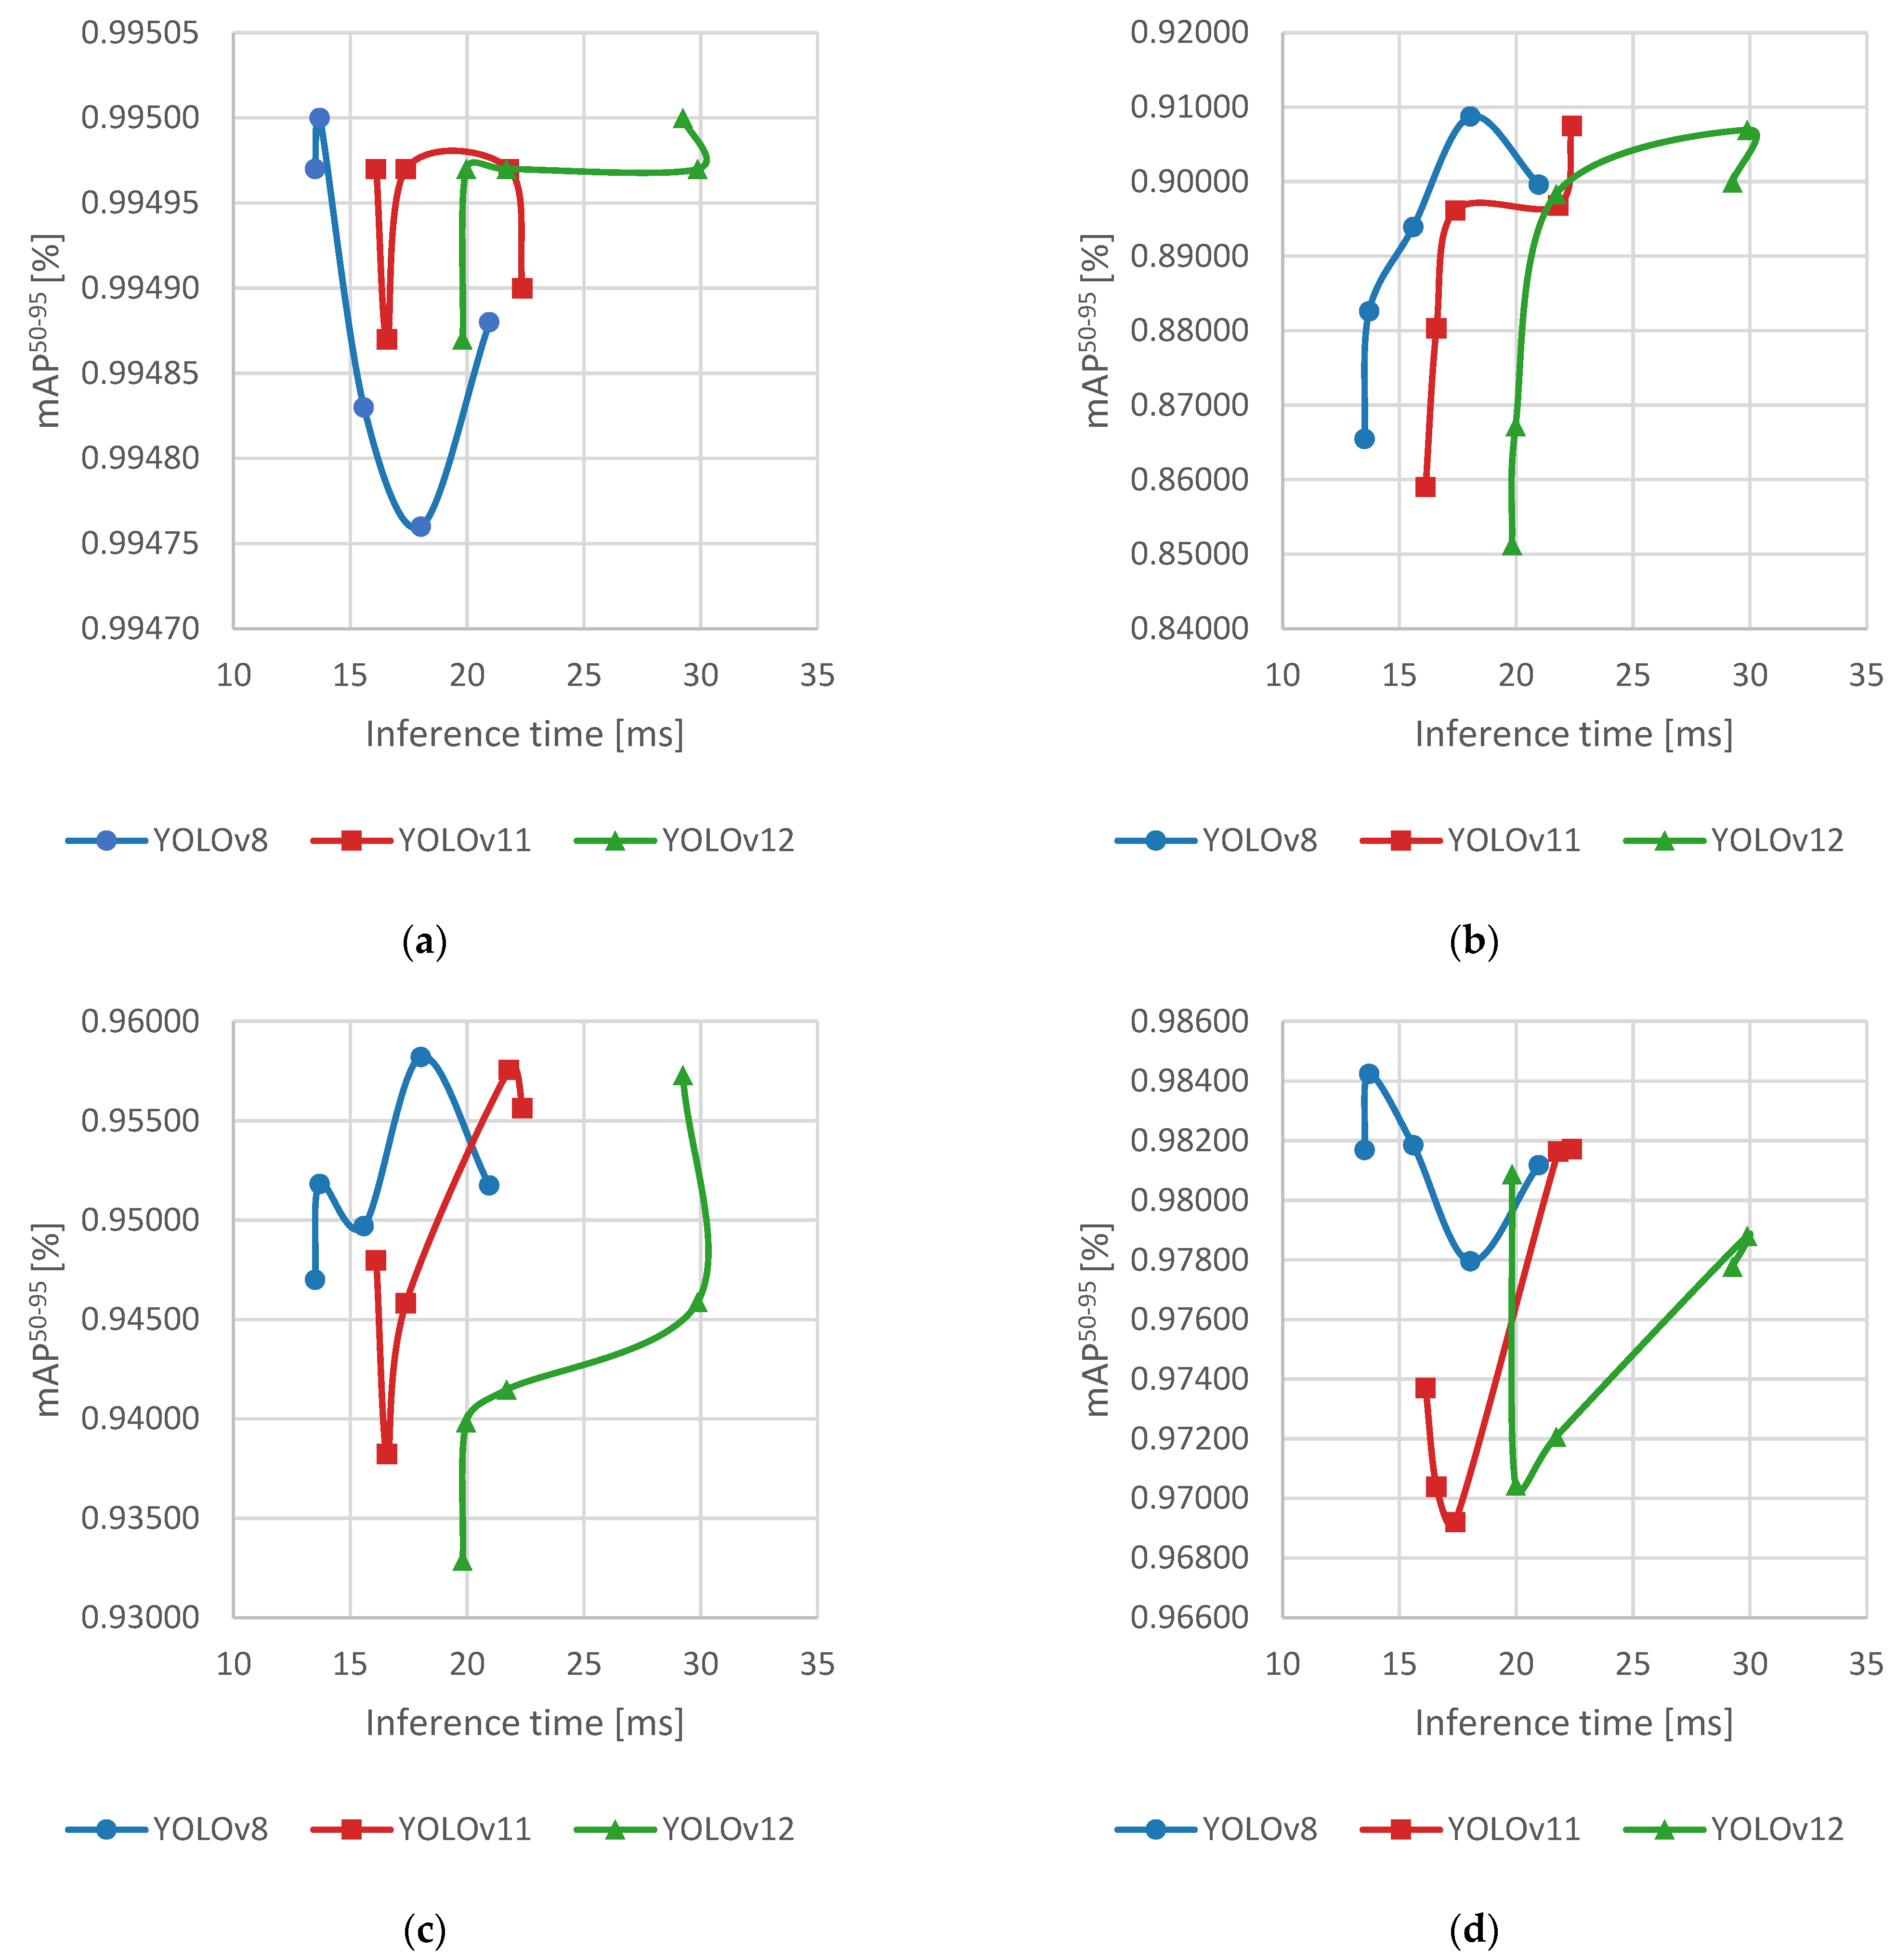
For the baseline configuration using the full bounding box together with the apex keypoint, all three model families produced nearly identical mAP50–95 values, with the highest results approaching 0.995 (Figure 7a). Within this setting, the YOLOv8s model proved particularly effective, combining the second-lowest inference time ( 13.7 ms) with the best detection accuracy ( 0.995 ). The YOLOv8n was marginally faster ( 13.5 ms) but slightly less accurate. By contrast, the larger models within each family, particularly the l and x variants, showed diminishing returns: their increased computational cost did not consistently yield higher accuracy. A notable exception occurred in YOLOv12, where the x variant slightly outperformed the l model in runtime efficiency despite its larger size.
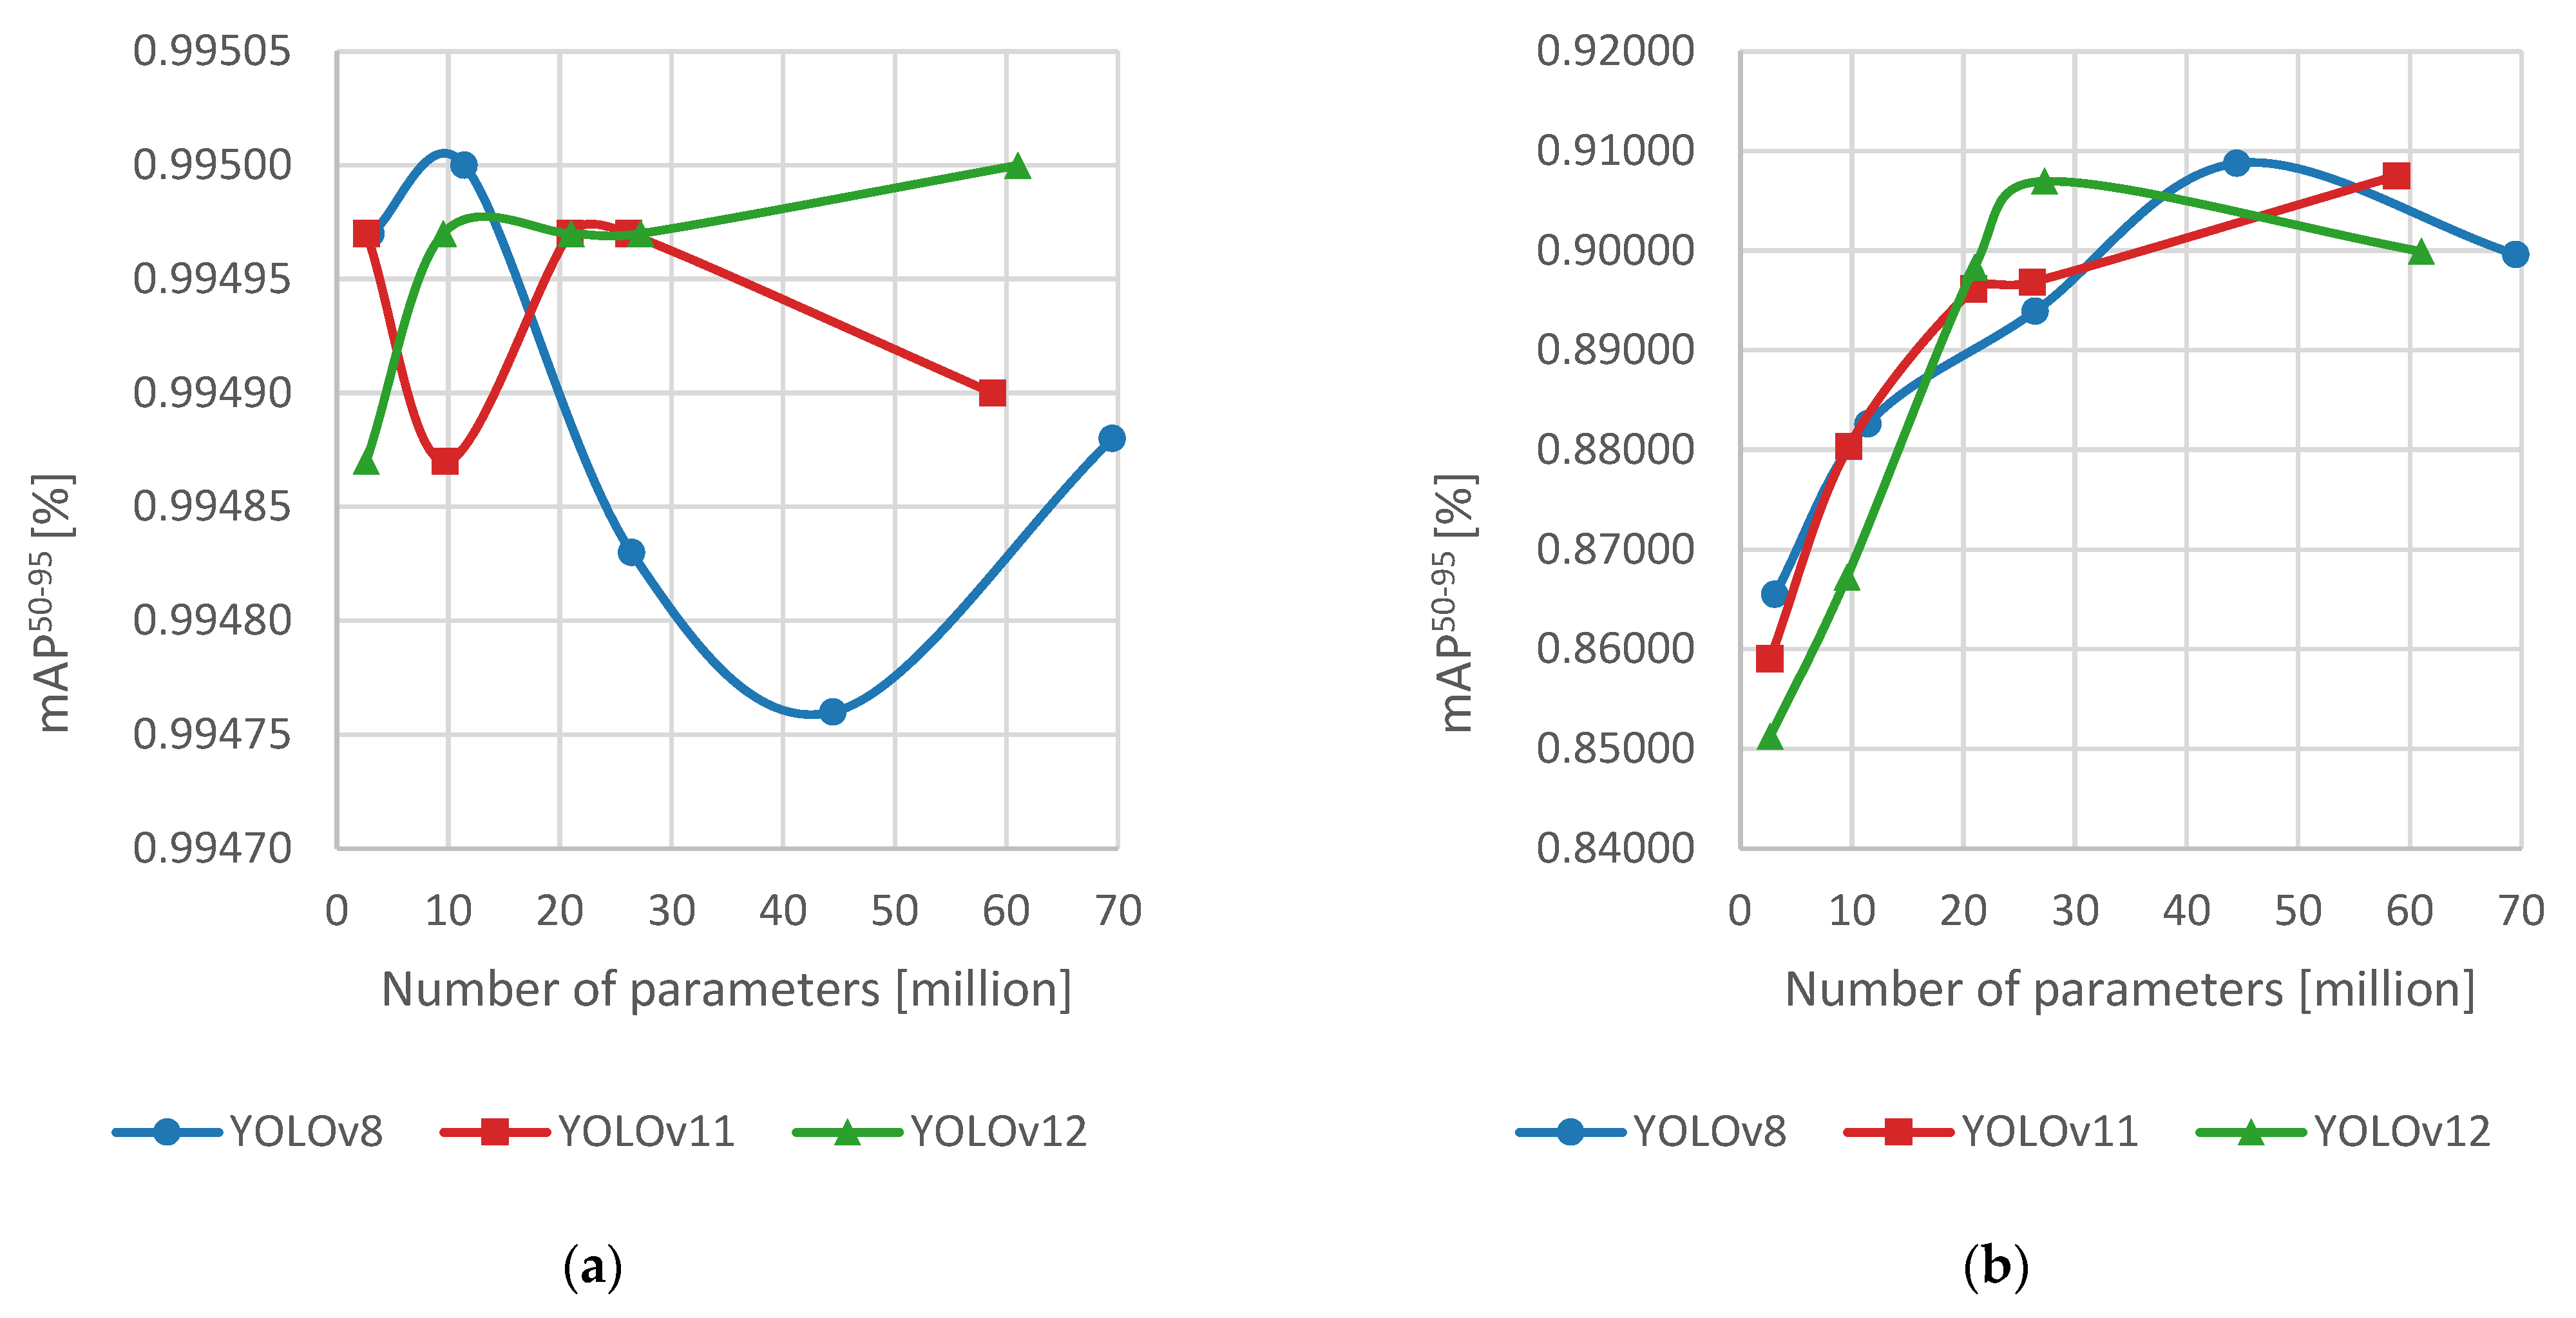
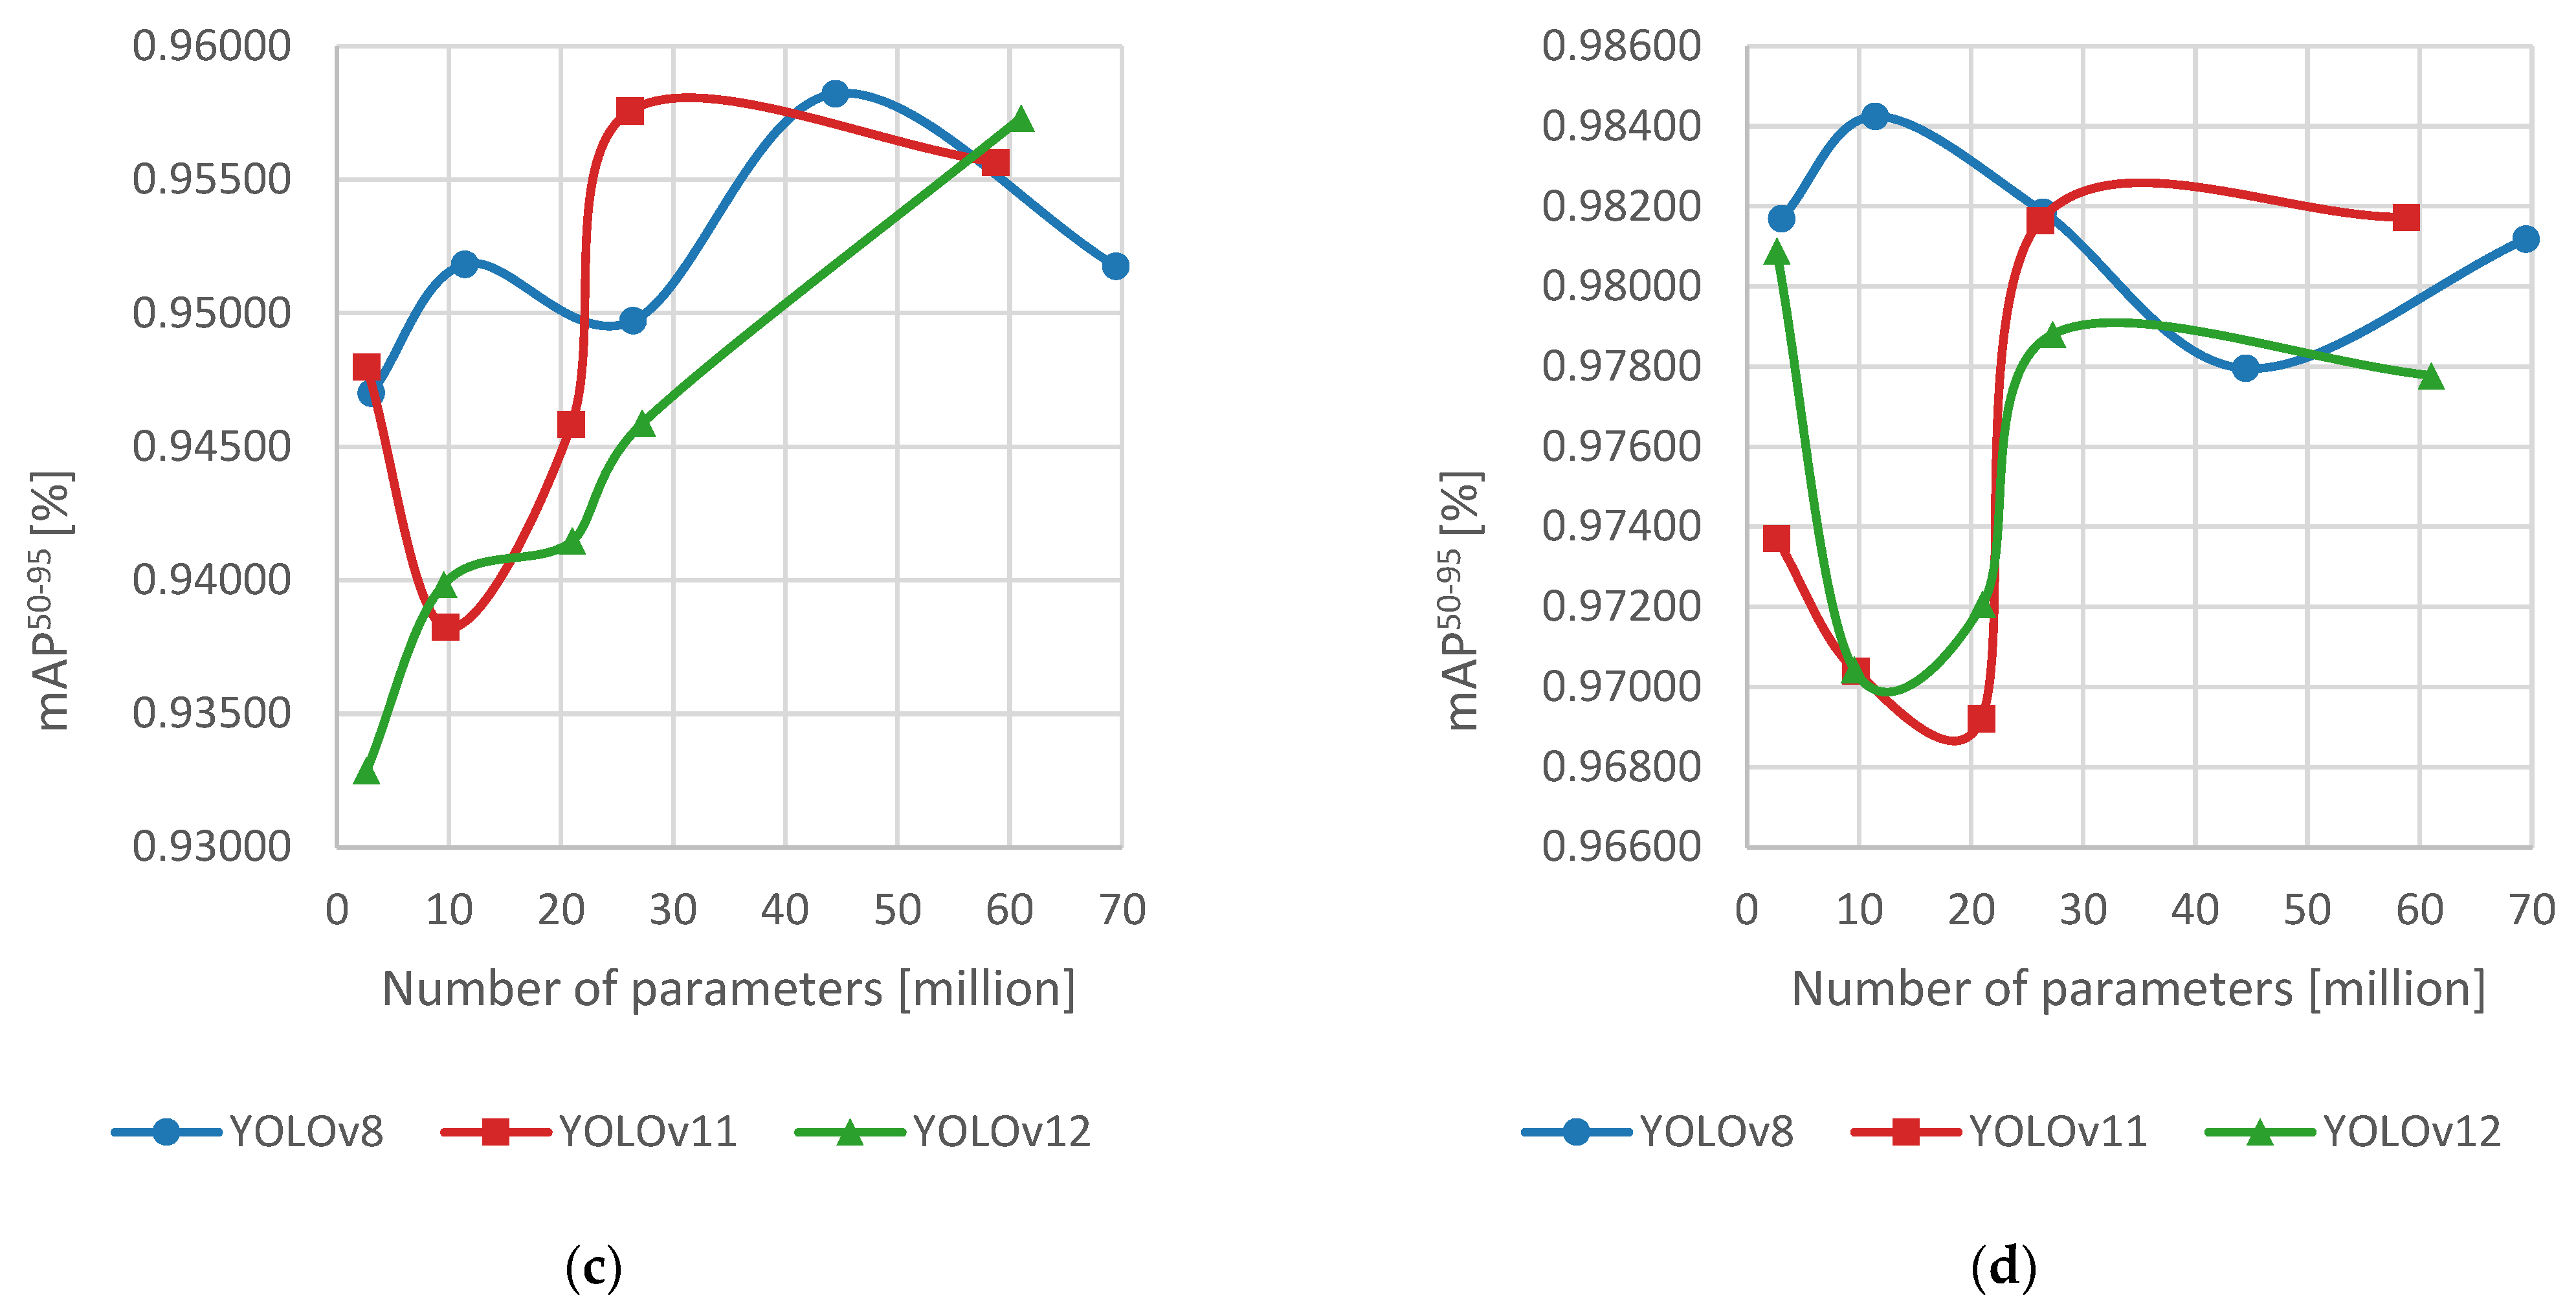
When the analysis was restricted to localized windows centered on the cone apex, three window sizes ( 30 × 30 , 50 × 50 , 70 × 70 pixels) were evaluated. A clear pattern emerged: enlarging the window consistently increased mAP50–95 scores and reduced the gap between the best and worst performers (Figure 7b–d). At the smallest 30 × 30 window, YOLOv8l achieved the best performance ( ~ 0.909 ), closely followed by YOLOv11x ( ~ 0.908 ) and YOLOv12l ( ~ 0.907 ). However, the parameter requirements varied substantially: while YOLOv11x required 58.8 M parameters, YOLOv12l reached nearly the same accuracy with only 27.2 M. At the 50 × 50 window, YOLOv8l ( 44.5 M parameters) reached the highest accuracy ( 0.958 ), though YOLOv11l was almost identical ( 0.9576 ) with nearly half as many parameters ( 26.2 M). The 70 × 70 window highlighted the efficiency of small models: YOLOv8s achieved 0.984 with only 11.4 M parameters, outperforming much larger networks in both accuracy and runtime. These results underline that larger parameter counts do not necessarily imply better performance, as compact architectures can achieve state-of-the-art results with substantially fewer resources.
The trade-off between inference time and accuracy was consistently favorable for YOLOv8 across window sizes (Figure 7). At 30 × 30 , YOLOv8l combined the best accuracy ( 0.909 ) with a reasonable inference time ( 18.0 ms), outperforming the slower YOLOv11x and YOLOv12l. At 50 × 50 , YOLOv8l again led with the best balance, while at 70 × 70 , YOLOv8s provided the strongest overall trade-off, achieving the highest accuracy ( 0.984 ) while remaining among the fastest networks. YOLOv11 typically maintained stable accuracy across sizes, but at the expense of steadily increasing inference time, while YOLOv12 required considerably longer runtimes to reach comparable performance.
Examining mAP50–95 relative to the number of parameters further emphasized these trade-offs (Figure 8). For YOLOv8, the best results often came from intermediate sizes, with the s or l models outperforming the larger x variant. YOLOv11 showed a non-monotonic trend: after an initial drop, accuracy improved in the m and l models, but declined again for the x variant. YOLOv12, by contrast, exhibited smoother scaling, with gradual improvements as parameter counts increased, although even its largest model did not surpass the most efficient YOLOv8s. The comparison highlighted that YOLOv11l was the most parameter-efficient at the 50 × 50 window, while YOLOv8s demonstrated the best overall efficiency at 70 × 70 , where it surpassed all larger networks with a fraction of the parameters.
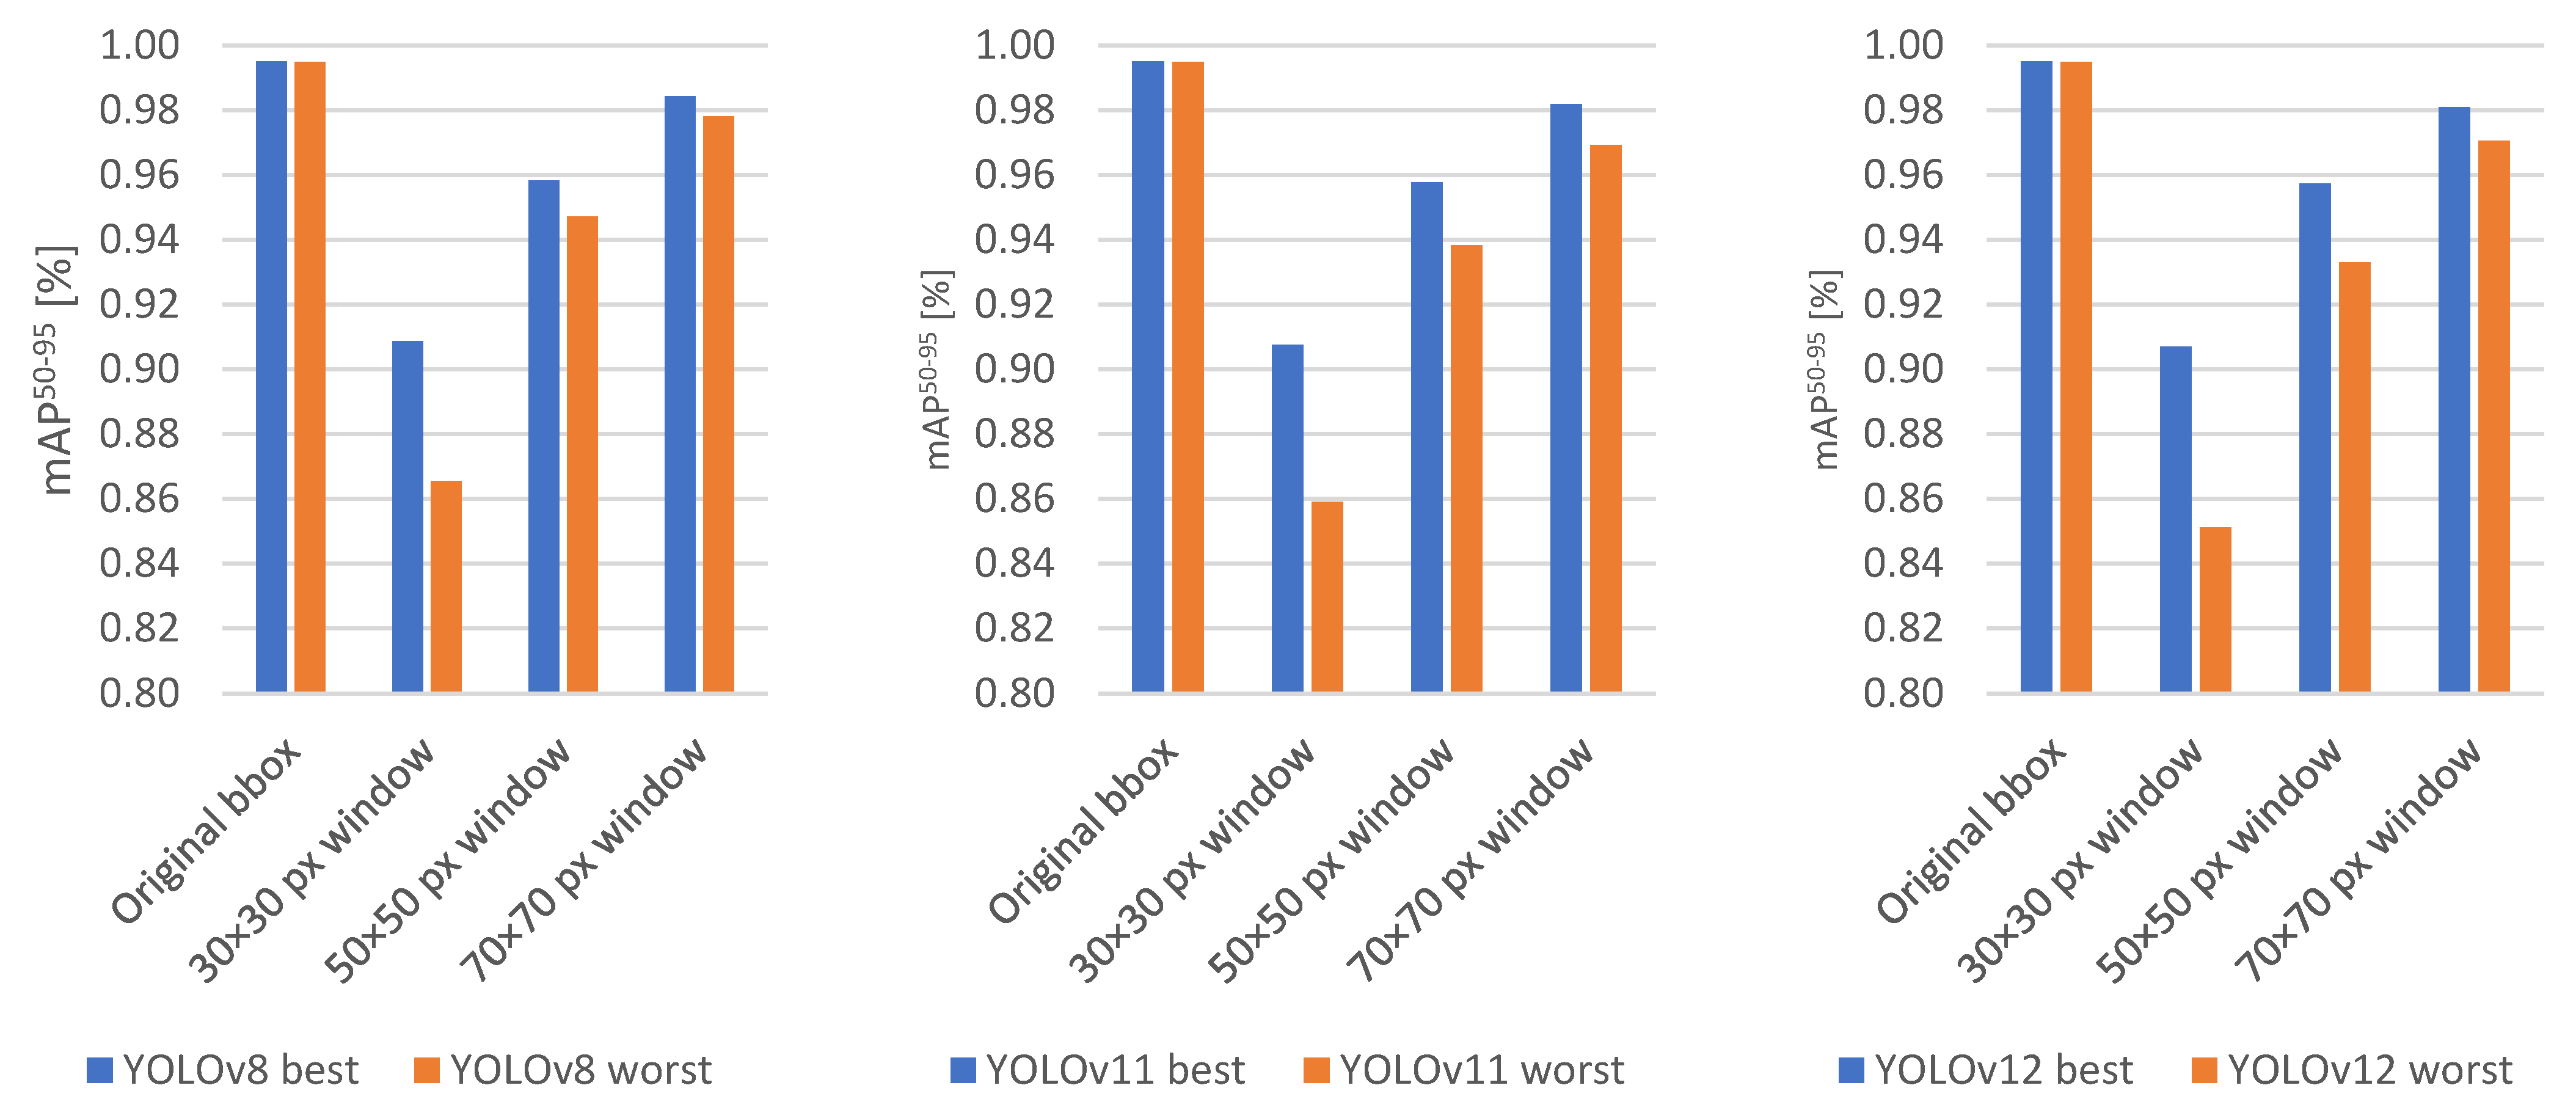
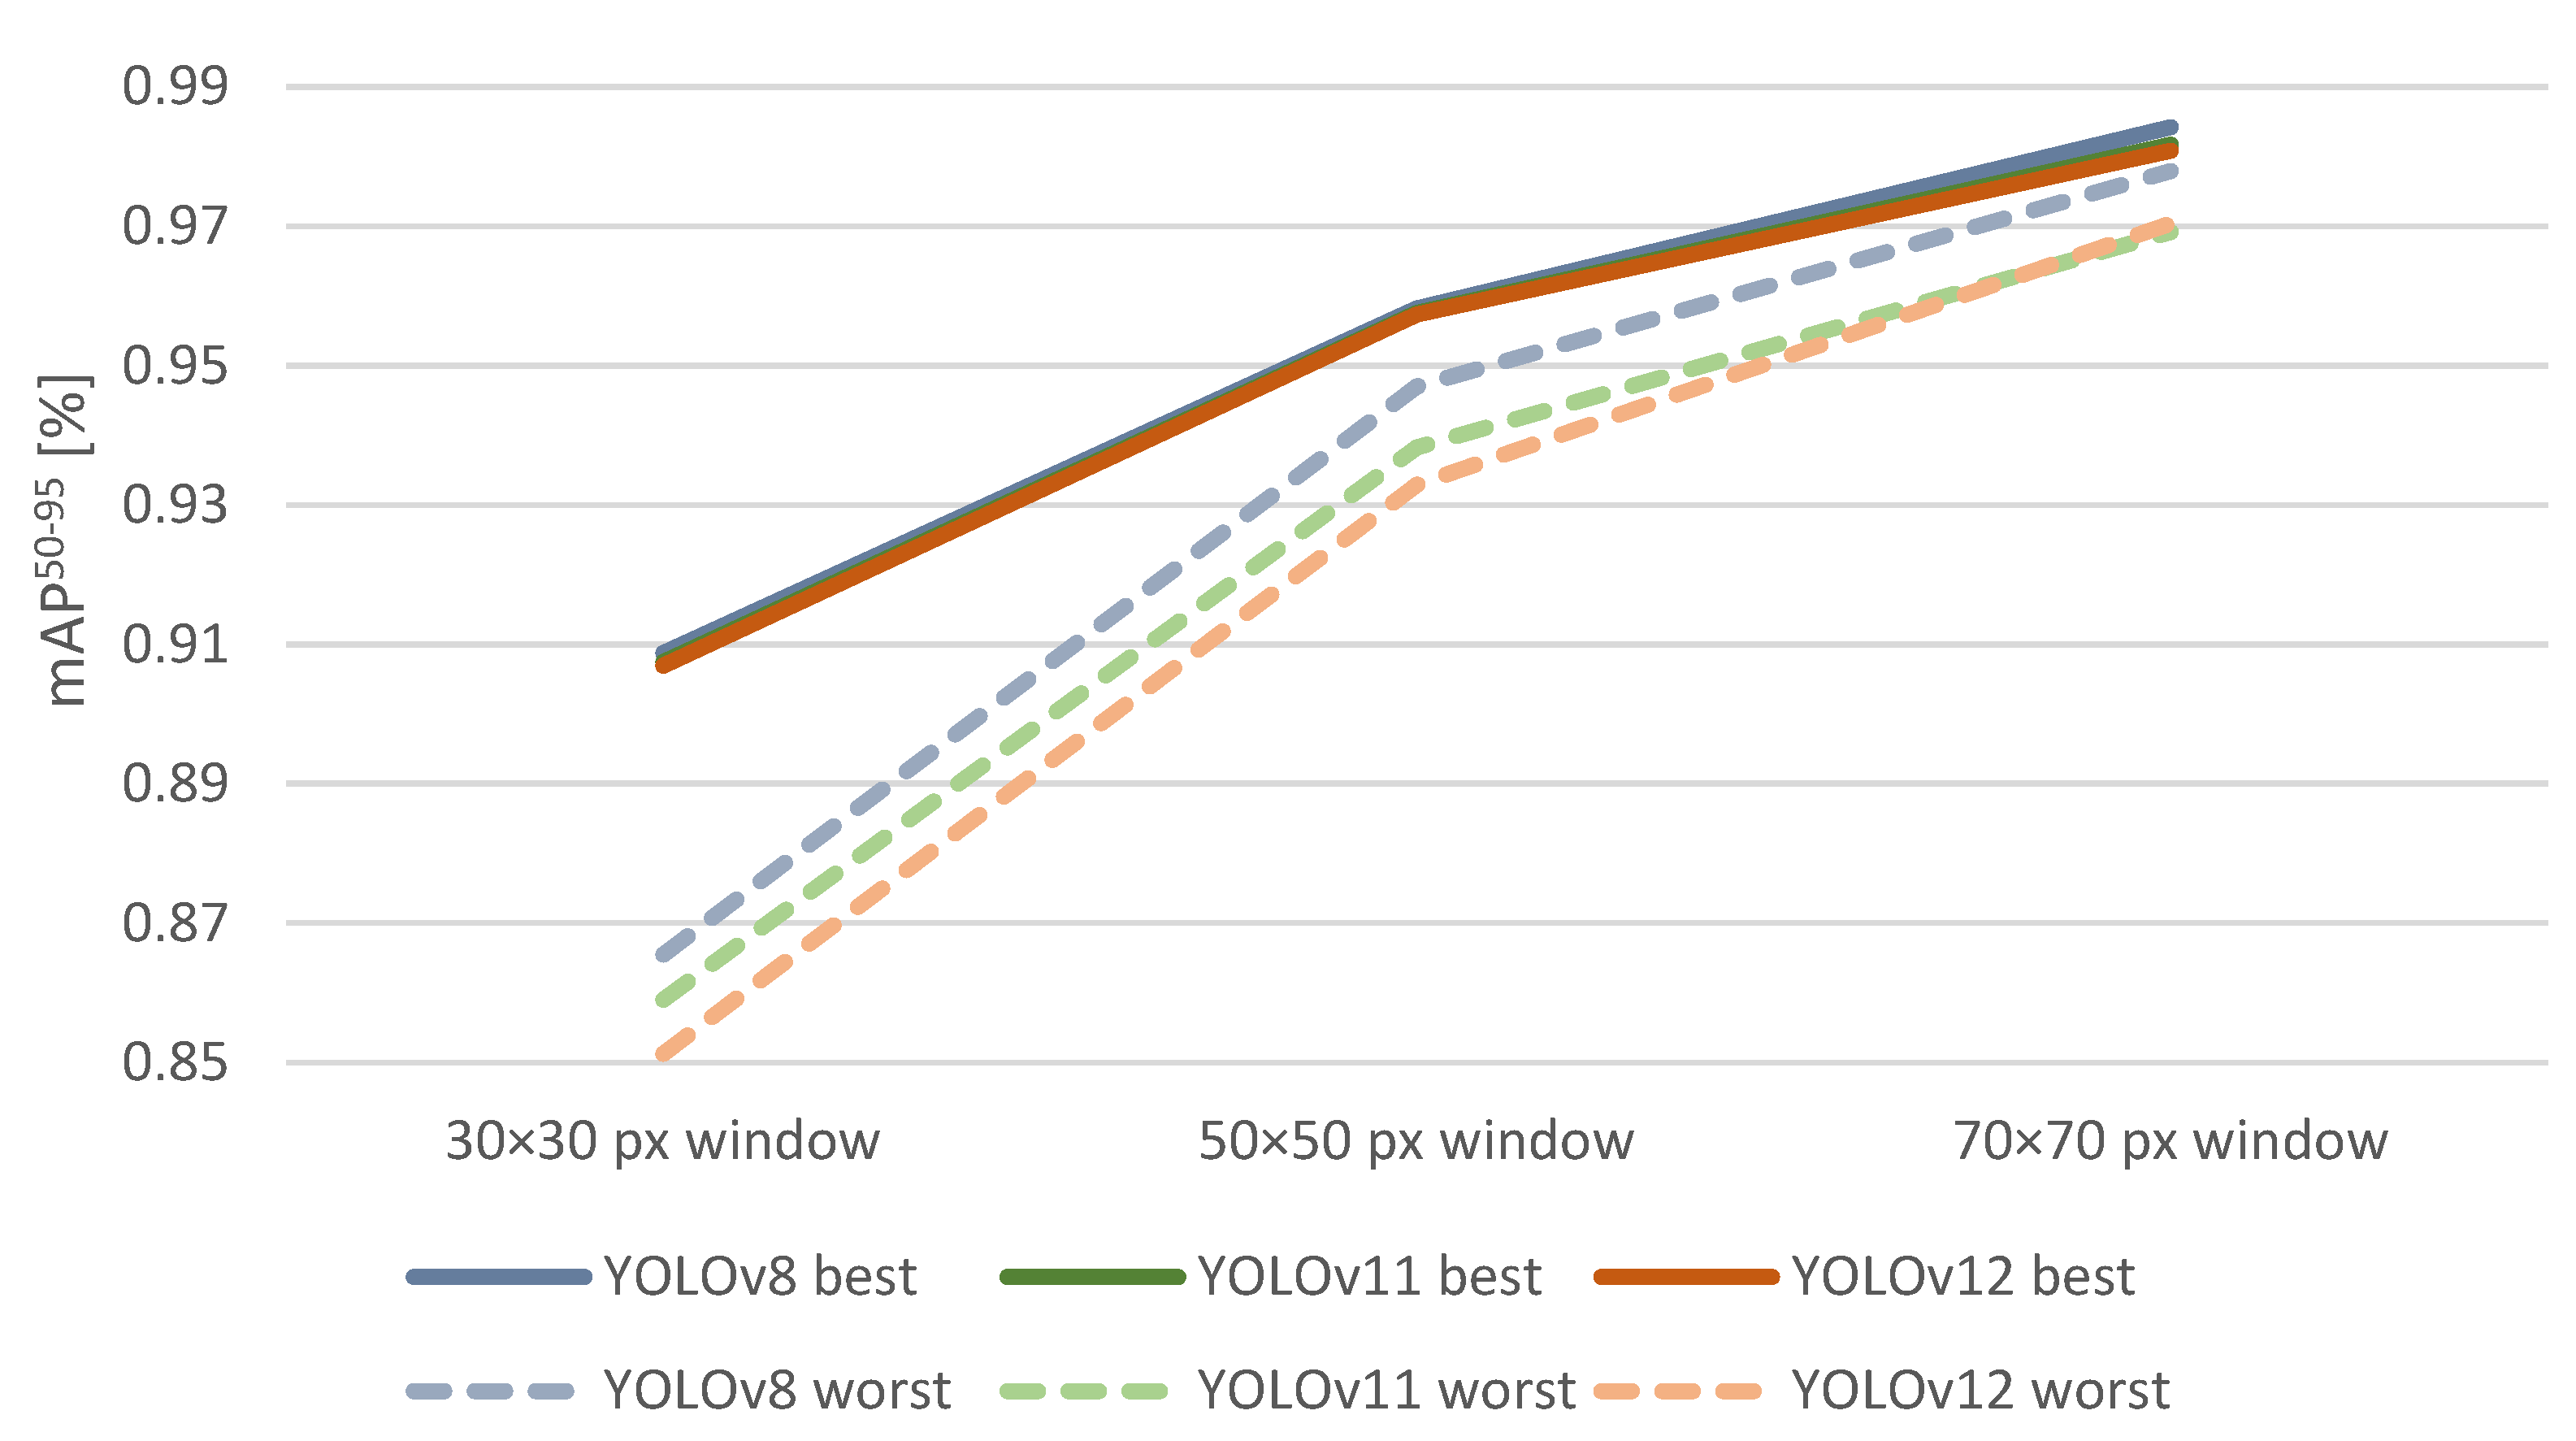
To further quantify robustness within each family, the best and worst results were compared for each configuration (Figure 9). In all three families, the full bounding box scenario yielded minimal differences between the top and bottom models, with all variants performing near 0.995 . At 30 × 30 windows, however, the performance gap widened significantly, reaching 5 6 percentage points. This gap narrowed again at 50 × 50 and 70 × 70 , where the worst models improved substantially, and the differences diminished to less than 2 percentage points. The aggregated comparison across all families (Figure 10) confirmed this effect: as window size increased, not only did accuracy rise, but the variability between the best and worst models decreased, with all architectures converging toward similar performance levels above 0.97 .
Figure 11 shows the median 3D keypoint errors in cm of YOLO models for four detection settings. The bars represent the median Euclidean distance between the predicted and ground-truth 3D coordinates of cone apex obtained from the ZED2i stereo pointcloud. Subfigures show results for (a) full bounding box + keypoint (pose), (b) 30 × 30 window, (c) 50 × 50 window, and (d) 70 × 70 window. In each case, 15 models are displayed in ascending order of their median error. The best performance was achieved by the YOLOv8l model in the full bounding box configuration, with a median error below 0.1 cm. In the window-based approaches, the lowest errors were observed for YOLOv8m ( 30 × 30 ), YOLOv12m ( 50 × 50 ), and YOLOv12l ( 70 × 70 ). Overall, the full bounding box configuration yielded the most accurate results, while windowed methods tended to produce higher median errors in the 0.15 ,   0.22 cm range.
Overall, the experiments demonstrated that while all YOLO families delivered high accuracy, the smaller YOLOv8 models consistently provided the best balance between accuracy, parameter efficiency, and inference time. Increasing window size further stabilized performance and reduced inter-model variability, indicating that access to larger visual context benefits robustness across all architectures.

5. Conclusions and Future Work

In this study, three YOLO model families (YOLOv8, YOLOv11, YOLOv12) were investigated, and within each family five architectures of increasing complexity (n, s, m, l, x) were evaluated. Four complementary approaches were considered for the task of traffic cone apex detection. First, the pose detector solutions of the YOLO models was applied, where the full bounding box and a single keypoint were used. In the remaining three cases, conventional object detection was employed, where the bounding box was centered on the cone apex, and three different window sizes ( 30 × 30 , 50 × 50 , and 70 × 70 pixels) were evaluated to study the role of surrounding context in improving detection accuracy. All of these investigations are practically required for the implementation of an industrial autonomous robot platform. At the same time, by addressing this highly specific task, we also aimed to highlight how effectively YOLO-based solutions can perform in such specialized detection scenarios.
The results demonstrated that all YOLO-based models achieved consistently high performance, with the difference between the best- and worst-performing networks being only 0.14376 in terms of mAP50–95. In the baseline configuration with full bounding boxes and a single keypoint, the YOLOv8s variant delivered the highest accuracy ( 0.995 ) with one of the lowest inference times ( 13.7 ms), highlighting its efficiency. For window-based configurations, increasing the bounding box size improved performance and reduced inter-model variability: at 30 × 30 windows, the best-performing model (YOLOv8l) reached ~ 0.909 mAP50–95, while at 70 × 70 , YOLOv8s achieved 0.984 with only 11.4 M parameters, outperforming significantly larger networks. These findings confirm that compact models can provide state-of-the-art accuracy while maintaining low computational cost, which is crucial for deployment on resource-constrained robotic platforms. In addition to conventional detection metrics, we also evaluated the apex localization error in centimeters using 3D stereo pointcloud data. These results confirmed that the full bounding box configuration yielded the most accurate apex estimates, while window-based approaches showed slightly higher errors. This highlights that the proposed method can achieve precise, centimeter-level localization, which is crucial for reliable robotic cone grasping and manipulation in future deployment.
Future work will focus on several directions to further enhance robustness and practical usability. First, we plan to expand the dataset with additional recordings under varied environmental conditions, thereby increasing model generalization. Second, new architectures will be investigated, both within the YOLO family and beyond, to assess whether recent advancements can provide further gains. Third, the methodology will be extended to detect multiple keypoints on each traffic cone, providing richer geometric information for downstream tasks. From a robotics perspective, implementing and evaluating cone tracking over time is an essential next step toward reliable deployment. In addition, future work will focus on deploying and optimizing the models on the Connect Tech Rudi-AGX platform. This will include model conversion (PyTorch → ONNX (Open Neural Network Exchange) → TensorRT), reduced-precision inference (FP16 (Floating Point 16-bit)/INT8 (Integer 8-bit)), and runtime measurements under real-world operating conditions. The goal is to ensure that the proposed method not only achieves high accuracy but also meets strict latency and energy-efficiency requirements in edge deployment scenarios.

Funding

This research was funded by the European Union within the framework of the National Laboratory for Artificial Intelligence (RRF-2.3.1-21-2022-00004).

Institutional Review Board Statement

Not applicable.

Informed Consent Statement

Not applicable.

Data Availability Statement

The data presented in this study are available on request from the corresponding author.

Conflicts of Interest

The author declares no conflicts of interest.

References

  1. Alverhed, E.A.; Hellgren, S.; Isaksson, H.; Olsson, L.; Palmqvist, H.; Flodén, J. Autonomous Last-Mile Delivery Robots: A Literature Review. Eur. Transp. Res. Rev. 2024, 16, 4. [Google Scholar] [CrossRef]
  2. Shamout, M.; Ben-Abdallah, R.; Alshurideh, M.; Alzoubi, H.; Kurdi, B.A.; Hamadneh, S. A Conceptual Model for the Adoption of Autonomous Robots in Supply Chain and Logistics Industry. Uncertain Supply Chain. Manag. 2022, 10, 577–592. [Google Scholar] [CrossRef]
  3. Benčo, D.; Kubasáková, I.; Kubáňová, J.; Kalašová, A. Automated Robots in Logistics. Transp. Res. Procedia 2025, 87, 103–111. [Google Scholar] [CrossRef]
  4. Lackner, T.; Hermann, J.; Kuhn, C.; Palm, D. Review of Autonomous Mobile Robots in Intralogistics: State-of-the-Art, Limitations and Research Gaps. Procedia CIRP 2024, 130, 930–935. [Google Scholar] [CrossRef]
  5. Sodiya, E.O.; Umoga, U.J.; Amoo, O.O.; Atadoga, A. AI-Driven Warehouse Automation: A Comprehensive Review of Systems. GSC Adv. Res. Rev. 2024, 18, 272–282. [Google Scholar] [CrossRef]
  6. Choudhary, T. Autonomous Robots and AI in Warehousing: Improving Efficiency and Safety. Int. J. Inf. Technol. Manag. Inf. Syst. 2025, 16, 216–229. [Google Scholar] [CrossRef]
  7. Zeng, L.; Guo, S.; Wu, J.; Markert, B. Autonomous Mobile Construction Robots in Built Environment: A Comprehensive Review. Dev. Built Environ. 2024, 19, 100484. [Google Scholar] [CrossRef]
  8. Külz, J.; Terzer, M.; Magri, M.; Giusti, A.; Althoff, M. Holistic Construction Automation with Modular Robots: From High-Level Task Specification to Execution. IEEE Trans. Autom. Sci. Eng. 2025, 22, 16716–16727. [Google Scholar] [CrossRef]
  9. Jud, D.; Kerscher, S.; Wermelinger, M.; Jelavic, E.; Egli, P.; Leemann, P.; Hottiger, G.; Hutter, M. HEAP—The Autonomous Walking Excavator. Autom. Constr. 2021, 129, 103783. [Google Scholar] [CrossRef]
  10. Katsamenis, I.; Bimpas, M.; Protopapadakis, E.; Zafeiropoulos, C.; Kalogeras, D.; Doulamis, A.; Doulamis, N.; Martín-Portugués Montoliu, C.; Handanos, Y.; Schmidt, F.; et al. Robotic Maintenance of Road Infrastructures: The HERON Project. In Proceedings of the 15th International Conference on PErvasive Technologies Related to Assistive Environments, Corfu, Greece, 29 June–1 July 2022; ACM: New York, NY, USA, 2022; pp. 628–635. [Google Scholar]
  11. Bhardwaj, H.; Shaukat, N.; Barber, A.; Blight, A.; Jackson-Mills, G.; Pickering, A.; Yang, M.; Mohd Sharif, M.A.; Han, L.; Xin, S.; et al. Autonomous, Collaborative, and Confined Infrastructure Assessment with Purpose-Built Mega-Joey Robots. Robotics 2025, 14, 80. [Google Scholar] [CrossRef]
  12. Xu, Y.; Bao, R.; Zhang, L.; Wang, J.; Wang, S. Embodied Intelligence in RO/RO Logistic Terminal: Autonomous Intelligent Transportation Robot Architecture. Sci. China Inf. Sci. 2025, 68, 150210. [Google Scholar] [CrossRef]
  13. Dhall, A.; Dai, D.; Van Gool, L. Real-Time 3D Traffic Cone Detection for Autonomous Driving. In Proceedings of the 2019 IEEE Intelligent Vehicles Symposium (IV), Paris, France, 9–12 June 2019; IEEE: New York, NY, USA, 2019; pp. 494–501. [Google Scholar]
  14. Wang, F.; Dong, W.; Gao, Y.; Yan, X.; You, Z. The Full-Automatic Traffic Cone Placement and Retrieval System Based on Smart Manipulator. In Proceedings of the CICTP 2019, Nanjing, China, 2 July 2019; American Society of Civil Engineers: Nanjing, China, 2019; pp. 3442–3453. [Google Scholar]
  15. Wang, M.; Qu, D.; Wu, Z.; Li, A.; Wang, N.; Zhang, X. Application of Traffic Cone Target Detection Algorithm Based on Improved YOLOv5. Sensors 2024, 24, 7190. [Google Scholar] [CrossRef]
  16. Štibinger, P.; Broughton, G.; Majer, F.; Rozsypálek, Z.; Wang, A.; Jindal, K.; Zhou, A.; Thakur, D.; Loianno, G.; Krajník, T.; et al. Mobile Manipulator for Autonomous Localization, Grasping and Precise Placement of Construction Material in a Semi-Structured Environment. IEEE Robot. Autom. Lett. 2021, 6, 2595–2602. [Google Scholar] [CrossRef]
  17. Park, J.; Han, C.; Jun, M.B.G.; Yun, H. Autonomous Robotic Bin Picking Platform Generated From Human Demonstration and YOLOv5. J. Manuf. Sci. Eng. 2023, 145, 121006. [Google Scholar] [CrossRef]
  18. Hollósi, J.; Krecht, R.; Ballagi, Á. Development of Advanced Intelligent Robot Platform for Industrial Applications. ERCIM News 2025, 141, 40–41. [Google Scholar]
  19. Macenski, S.; Foote, T.; Gerkey, B.; Lalancette, C.; Woodall, W. Robot Operating System 2: Design, Architecture, and Uses in the Wild. Sci. Robot. 2022, 7. [Google Scholar] [CrossRef]
  20. Cao, Z.; Hidalgo, G.; Simon, T.; Wei, S.-E.; Sheikh, Y. OpenPose: Realtime Multi-Person 2D Pose Estimation Using Part Affinity Fields. IEEE Trans. Pattern Anal. Mach. Intell. 2021, 43, 172–186. [Google Scholar] [CrossRef]
  21. Sun, K.; Xiao, B.; Liu, D.; Wang, J. Deep High-Resolution Representation Learning for Human Pose Estimation. In Proceedings of the 2019 IEEE/CVF Conference on Computer Vision and Pattern Recognition (CVPR), Long Beach, CA, USA, 15–20 June 2019; pp. 5686–5696. [Google Scholar]
  22. Tekin, B.; Sinha, S.N.; Fua, P. Real-Time Seamless Single Shot 6D Object Pose Prediction. In Proceedings of the 2018 IEEE/CVF Conference on Computer Vision and Pattern Recognition, Salt Lake City, UT, USA, 18–23 June 2018; IEEE: New York, NY, USA, 2018; pp. 292–301. [Google Scholar]
  23. Xiang, Y.; Schmidt, T.; Narayanan, V.; Fox, D. PoseCNN: A Convolutional Neural Network for 6D Object Pose Estimation in Cluttered Scenes. In Proceedings of the Robotics: Science and Systems XIV, Pittsburgh, PA, USA, 26 June 2018; Robotics: Science and Systems Foundation: Sydney, Australia, 2018. [Google Scholar]
  24. Hodan, T.; Barath, D.; Matas, J. EPOS: Estimating 6D Pose of Objects With Symmetries. In Proceedings of the 2020 IEEE/CVF Conference on Computer Vision and Pattern Recognition (CVPR), Seattle, WA, USA, 13–19 June 2020; IEEE: New York, NY, USA, 2020; pp. 11700–11709. [Google Scholar]
  25. Manuelli, L.; Gao, W.; Florence, P.; Tedrake, R. KPAM: KeyPoint Affordances for Category-Level Robotic Manipulation. In Robotics Research; Asfour, T., Yoshida, E., Park, J., Christensen, H., Khatib, O., Eds.; Springer International Publishing: Cham, Switzerland, 2022; Volume 20, pp. 132–157. [Google Scholar]
  26. Sundermeyer, M.; Marton, Z.-C.; Durner, M.; Triebel, R. Augmented Autoencoders: Implicit 3D Orientation Learning for 6D Object Detection. Int. J. Comput. Vis. 2020, 128, 714–729. [Google Scholar] [CrossRef]
  27. Wang, G.; Manhardt, F.; Shao, J.; Ji, X.; Navab, N.; Tombari, F. Self6D: Self-Supervised Monocular 6D Object Pose Estimation. In Computer Vision—ECCV 2020; Vedaldi, A., Bischof, H., Brox, T., Frahm, J.-M., Eds.; Springer International Publishing: Cham, Switzerland, 2020; Volume 12346, pp. 108–125. [Google Scholar]
  28. Li, Z.; Hu, Y.; Salzmann, M.; Ji, X. SD-Pose: Semantic Decomposition for Cross-Domain 6D Object Pose Estimation. AAAI Conf. Artif. Intell. 2021, 35, 2020–2028. [Google Scholar] [CrossRef]
  29. Chen, X.; Ma, F.; Wu, Y.; Han, B.; Luo, L.; Biancardo, S.A. MFMDepth: MetaFormer-Based Monocular Metric Depth Estimation for Distance Measurement in Ports. Comput. Ind. Eng. 2025, 207, 111325. [Google Scholar] [CrossRef]
  30. Maji, D.; Nagori, S.; Mathew, M.; Poddar, D. YOLO-Pose: Enhancing YOLO for Multi Person Pose Estimation Using Object Keypoint Similarity Loss. In Proceedings of the 2022 IEEE/CVF Conference on Computer Vision and Pattern Recognition Workshops (CVPRW), New Orleans, LA, USA, 19–20 June 2022; IEEE: New York, NY, USA, 2022; pp. 2636–2645. [Google Scholar]
  31. McNally, W.; Vats, K.; Wong, A.; McPhee, J. Rethinking Keypoint Representations: Modeling Keypoints and Poses as Objects for Multi-Person Human Pose Estimation. In Computer Vision—ECCV 2022; Avidan, S., Brostow, G., Cissé, M., Farinella, G.M., Hassner, T., Eds.; Springer Nature Switzerland: Cham, Switzerland, 2022; Volume 13666, pp. 37–54. [Google Scholar]
  32. Liu, W.; Di, N. RSCS6D: Keypoint Extraction-Based 6D Pose Estimation. Appl. Sci. 2025, 15, 6729. [Google Scholar] [CrossRef]
  33. Zhang, Q.; Xue, C.; Qin, J.; Duan, J.; Zhou, Y. 6D Pose Estimation of Industrial Parts Based on Point Cloud Geometric Information Prediction for Robotic Grasping. Entropy 2024, 26, 1022. [Google Scholar] [CrossRef]
  34. Alterani, A.B.; Costanzo, M.; De Simone, M.; Federico, S.; Natale, C. Experimental Comparison of Two 6D Pose Estimation Algorithms in Robotic Fruit-Picking Tasks. Robotics 2024, 13, 127. [Google Scholar] [CrossRef]
  35. Govi, E.; Sapienza, D.; Toscani, S.; Cotti, I.; Franchini, G.; Bertogna, M. Addressing Challenges in Industrial Pick and Place: A Deep Learning-Based 6 Degrees-of-Freedom Pose Estimation Solution. Comput. Ind. 2024, 161, 104130. [Google Scholar] [CrossRef]
  36. Lu, J.; Richter, F.; Yip, M.C. Pose Estimation for Robot Manipulators via Keypoint Optimization and Sim-to-Real Transfer. IEEE Robot. Autom. Lett. 2022, 7, 4622–4629. [Google Scholar] [CrossRef]
  37. Höfer, T.; Shamsafar, F.; Benbarka, N.; Zell, A. Object Detection And Autoencoder-Based 6d Pose Estimation For Highly Cluttered Bin Picking. In Proceedings of the 2021 IEEE International Conference on Image Processing (ICIP), Anchorage, AK, USA, 19 September 2021; IEEE: New York, NY, USA, 2021; pp. 704–708. [Google Scholar]
  38. Ali, M.L.; Zhang, Z. The YOLO Framework: A Comprehensive Review of Evolution, Applications, and Benchmarks in Object Detection. Computers 2024, 13, 336. [Google Scholar] [CrossRef]
  39. Murat, A.A.; Kiran, M.S. A Comprehensive Review on YOLO Versions for Object Detection. Eng. Sci. Technol. Int. J. 2025, 70, 102161. [Google Scholar] [CrossRef]
  40. Vijayakumar, A.; Vairavasundaram, S. YOLO-Based Object Detection Models: A Review and Its Applications. Multimed. Tools Appl. 2024, 83, 83535–83574. [Google Scholar] [CrossRef]
  41. Terven, J.; Córdova-Esparza, D.-M.; Romero-González, J.-A. A Comprehensive Review of YOLO Architectures in Computer Vision: From YOLOv1 to YOLOv8 and YOLO-NAS. Mach. Learn. Knowl. Extr. 2023, 5, 1680–1716. [Google Scholar] [CrossRef]
  42. Cong, X.; Li, S.; Chen, F.; Liu, C.; Meng, Y. A Review of YOLO Object Detection Algorithms Based on Deep Learning. Front. Comput. Intell. Syst. 2023, 4, 17–20. [Google Scholar] [CrossRef]
  43. Jocher, G.; Chaurasia, A.; Qiu, J. Ultralytics YOLOv8. 2023. Available online: https://github.com/topics/yolov8 (accessed on 6 October 2025).
  44. Jocher, G.; Qiu, J. Ultralytics YOLO11. 2024. Available online: https://github.com/topics/yolo11 (accessed on 6 October 2025).
  45. Tian, Y.; Ye, Q.; Doermann, D. YOLOv12: Attention-Centric Real-Time Object Detectors. arXiv 2025, arXiv:2502.12524. [Google Scholar]
  46. Lin, T.-Y.; Maire, M.; Belongie, S.; Hays, J.; Perona, P.; Ramanan, D.; Dollár, P.; Zitnick, C.L. Microsoft COCO: Common Objects in Context. In Computer Vision—ECCV 2014; Fleet, D., Pajdla, T., Schiele, B., Tuytelaars, T., Eds.; Springer International Publishing: Cham, Switzerland, 2014; Volume 8693, pp. 740–755. ISBN 9783319106014/9783319106021. [Google Scholar]
  47. Geiger, A.; Lenz, P.; Stiller, C.; Urtasun, R. Vision Meets Robotics: The KITTI Dataset. Int. J. Robot. Res. 2013, 32, 1231–1237. [Google Scholar] [CrossRef]
  48. Yu, F.; Chen, H.; Wang, X.; Xian, W.; Chen, Y.; Liu, F.; Madhavan, V.; Darrell, T. BDD100K: A Diverse Driving Dataset for Heterogeneous Multitask Learning. In Proceedings of the 2020 IEEE/CVF Conference on Computer Vision and Pattern Recognition (CVPR), Seattle, WA, USA, 13–19 June 2020; IEEE: New York, NY, USA, 2020; pp. 2633–2642. [Google Scholar]
  49. Soille, P. Morphological Image Analysis; Springer: Berlin/Heidelberg, Germany, 2004; ISBN 9783642076961. [Google Scholar]
  50. Suzuki, S.; Be, K. Topological Structural Analysis of Digitized Binary Images by Border Following. Comput. Vis. Graph. Image Process. 1985, 30, 32–46. [Google Scholar] [CrossRef]
  51. Duda, R.O.; Hart, P.E. Use of the Hough Transformation to Detect Lines and Curves in Pictures. Commun. ACM 1972, 15, 11–15. [Google Scholar] [CrossRef]
  52. Bottou, L. Large-Scale Machine Learning with Stochastic Gradient Descent. In Proceedings of the COMPSTAT’2010; Lechevallier, Y., Saporta, G., Eds.; Physica-Verlag HD: Heidelberg, Germany, 2010; pp. 177–186. [Google Scholar]
  53. Loshchilov, I.; Hutter, F. Decoupled Weight Decay Regularization. In Proceedings of the International Conference on Learning Representations (ICLR), New Orleans, LA, USA, 6–9 May 2019. [Google Scholar]
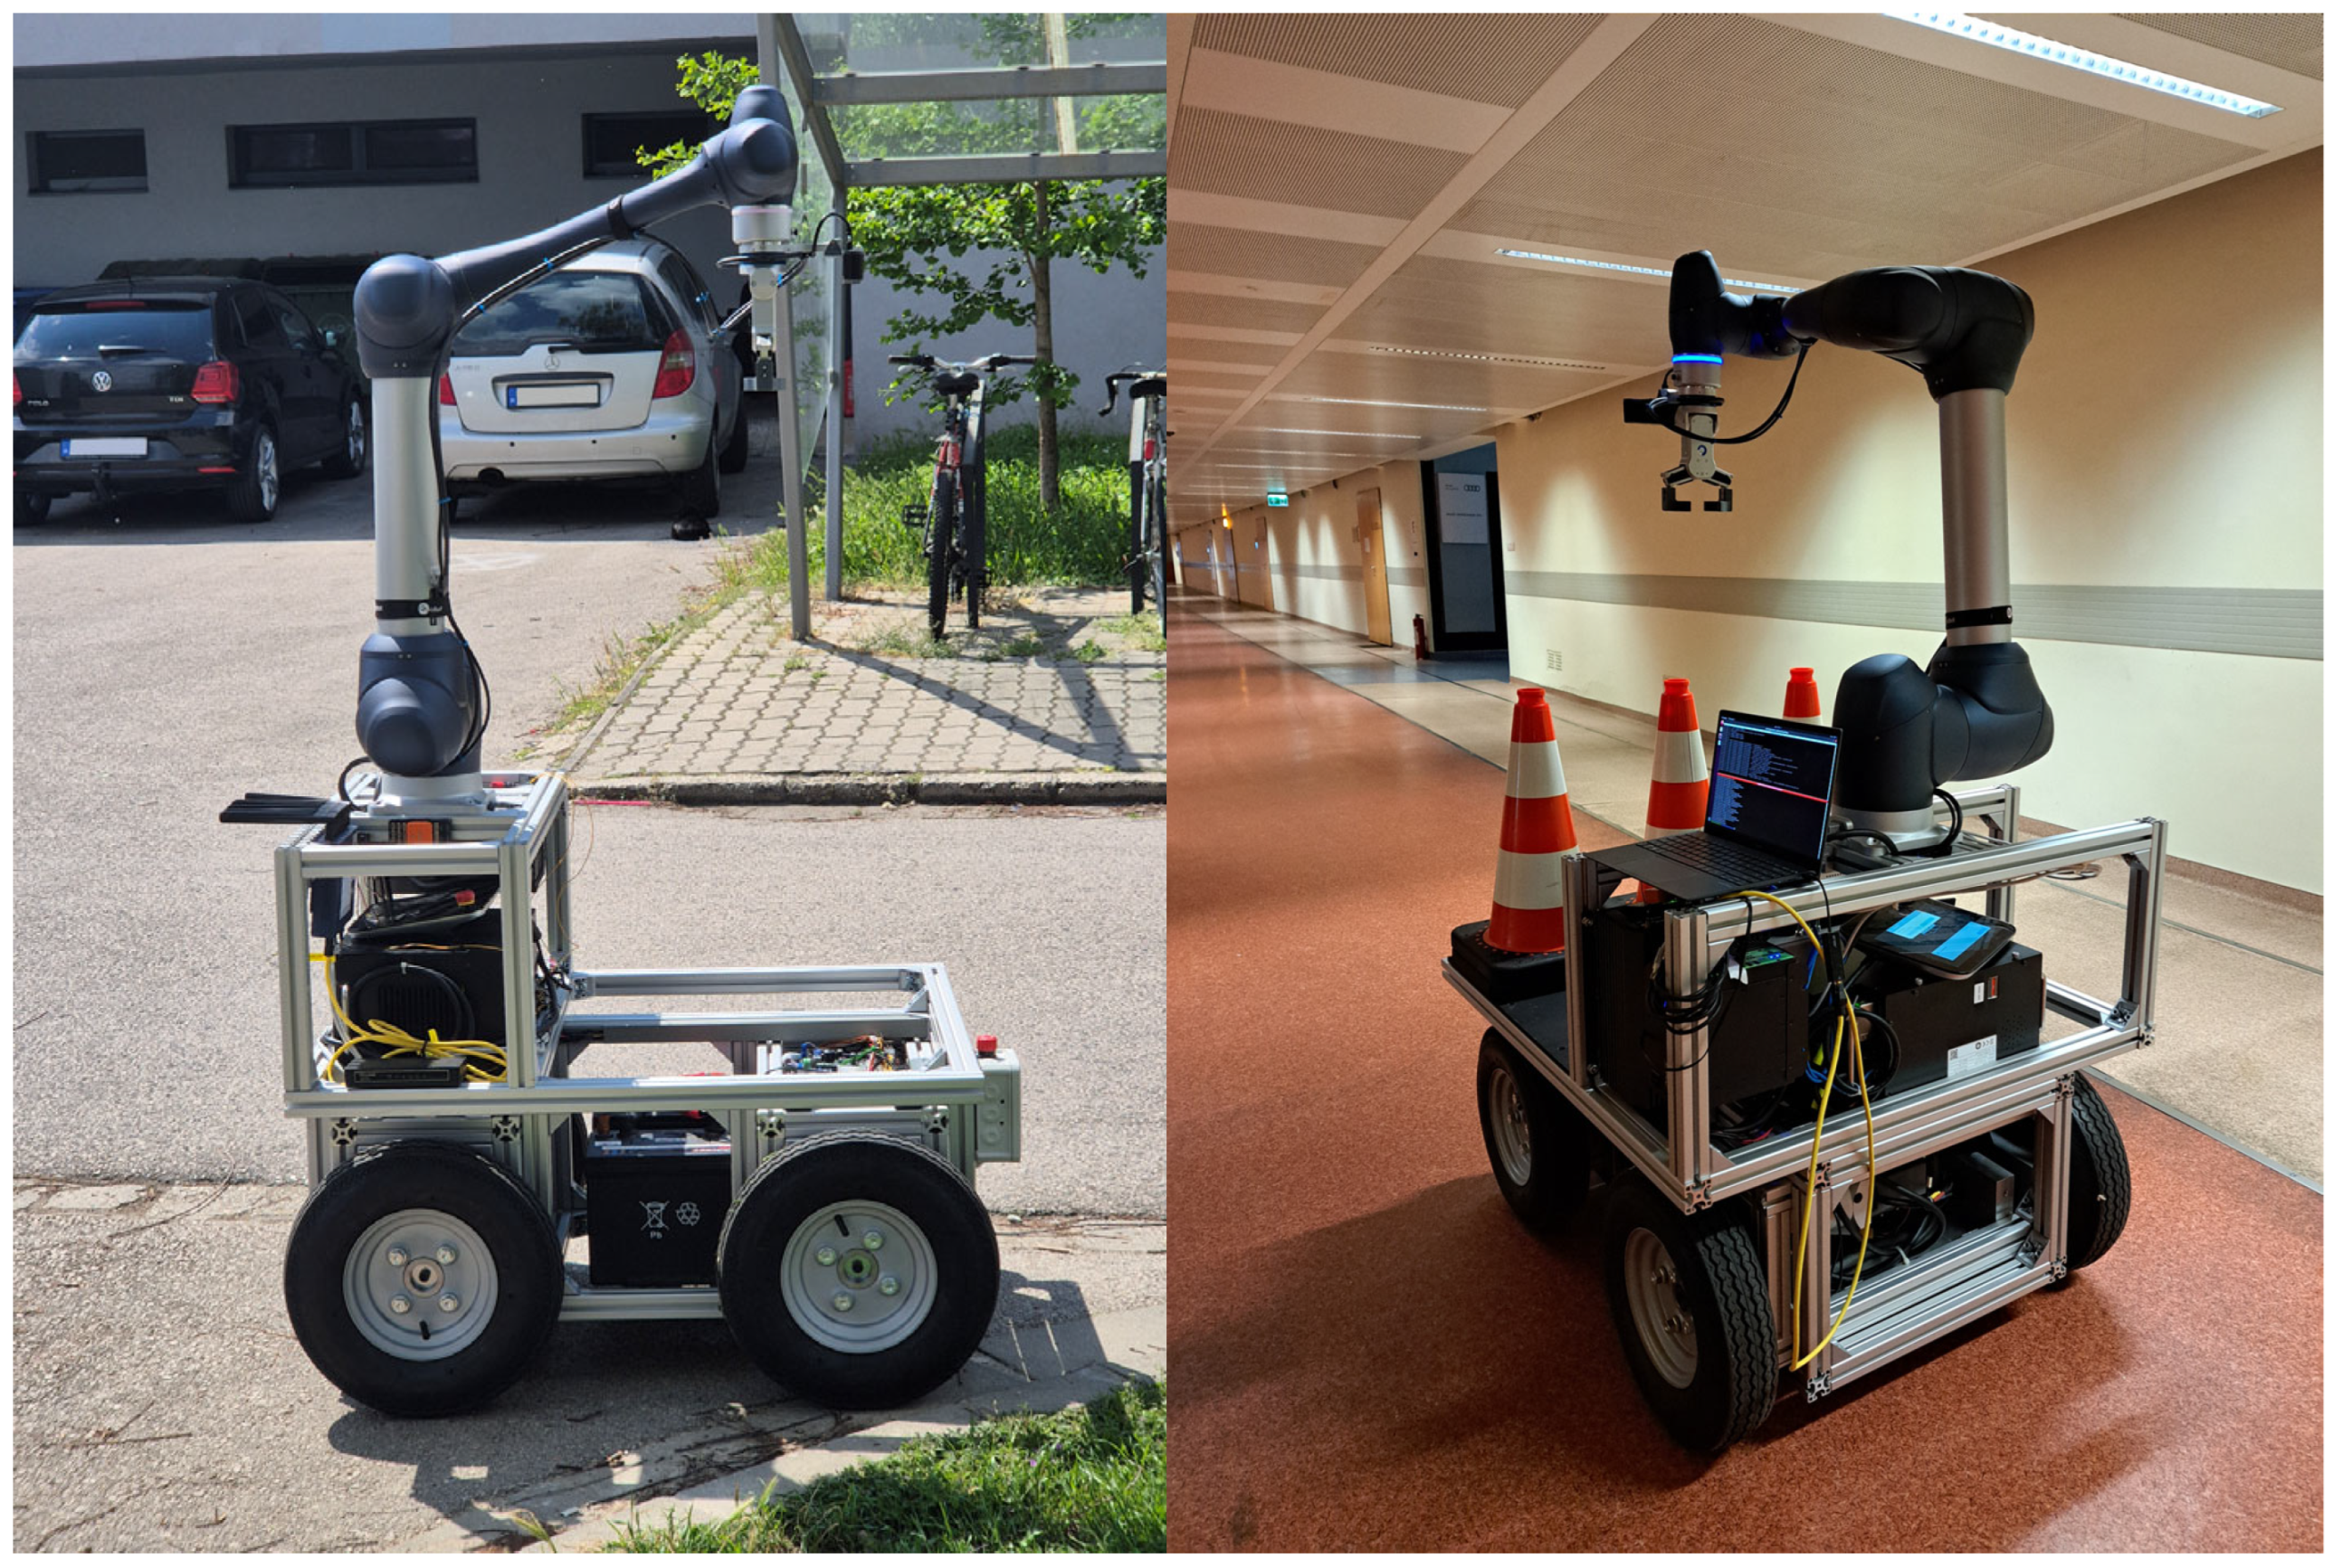
Figure 1. Proposed autonomous mobile manipulator for traffic cone placement and retrieval at Széchenyi István University.
Applsci 15 10845 g001
Figure 2. Performance of YOLOv8, YOLOv11, and YOLOv12 models on COCO dataset.
Applsci 15 10845 g002
Figure 3. Representative samples from the custom traffic cone dataset.
Applsci 15 10845 g003
Figure 4. Initial steps of the annotation pipeline: (a) input image; (b) result of HSV-based color filtering; (c) result of morphological dilation; (d) visualization of the bounding rectangle assigned to the detected contour on the original image.
Applsci 15 10845 g004
Figure 5. Cone apex localization refinement: (a) disparity map–based apex estimation with detected circles from the Hough transform; (b) the selected closest circle and its center representing the refined apex.
Applsci 15 10845 g005
Figure 6. Example of a labeled dataset sample, showing the bounding box of the traffic cone and the annotated apex keypoint.
Applsci 15 10845 g006
Figure 7. Relationship between inference time and mAP50–95 for YOLOv8, YOLOv11, and YOLOv12 models. (a) Full bounding box, (b) 30 × 30 window, (c) 50 × 50 window, (d) 70 × 70 window.
Applsci 15 10845 g007
Figure 8. Relationship between the number of parameters and mAP50–95 for YOLOv8, YOLOv11, and YOLOv12 models. (a) Full bounding box, (b) 30 × 30 window, (c) 50 × 50 window, (d) 70 × 70 window.
Applsci 15 10845 g008aApplsci 15 10845 g008b
Figure 9. Best and worst mAP50–95 values within each model family.
Applsci 15 10845 g009
Figure 10. Best and worst mAP50–95 values across window sizes (30 × 30, 50 × 50, 70 × 70) for all model families.
Applsci 15 10845 g010
Figure 11. Median 3D Euclidean error of YOLO models, in 4 cases. (a) Full bounding box, (b) 30 × 30 window, (c) 50 × 50 window, (d) 70 × 70 window.
Applsci 15 10845 g011aApplsci 15 10845 g011b
Disclaimer/Publisher’s Note: The statements, opinions and data contained in all publications are solely those of the individual author(s) and contributor(s) and not of MDPI and/or the editor(s). MDPI and/or the editor(s) disclaim responsibility for any injury to people or property resulting from any ideas, methods, instructions or products referred to in the content.