Author Contributions
Conceptualization, E.L. and Z.G.; methodology, X.L.; software, X.L.; validation, Z.G., X.L.; formal analysis, E.L.; investigation, R.L.; resources, R.L.; data curation, X.L.; writing—original draft preparation, Z.G.; writing—review and editing, E.L.; visualization, Z.G.; supervision, D.Z.; project administration, D.Z.; funding acquisition, D.Z. and R.L. All authors have read and agreed to the published version of the manuscript.
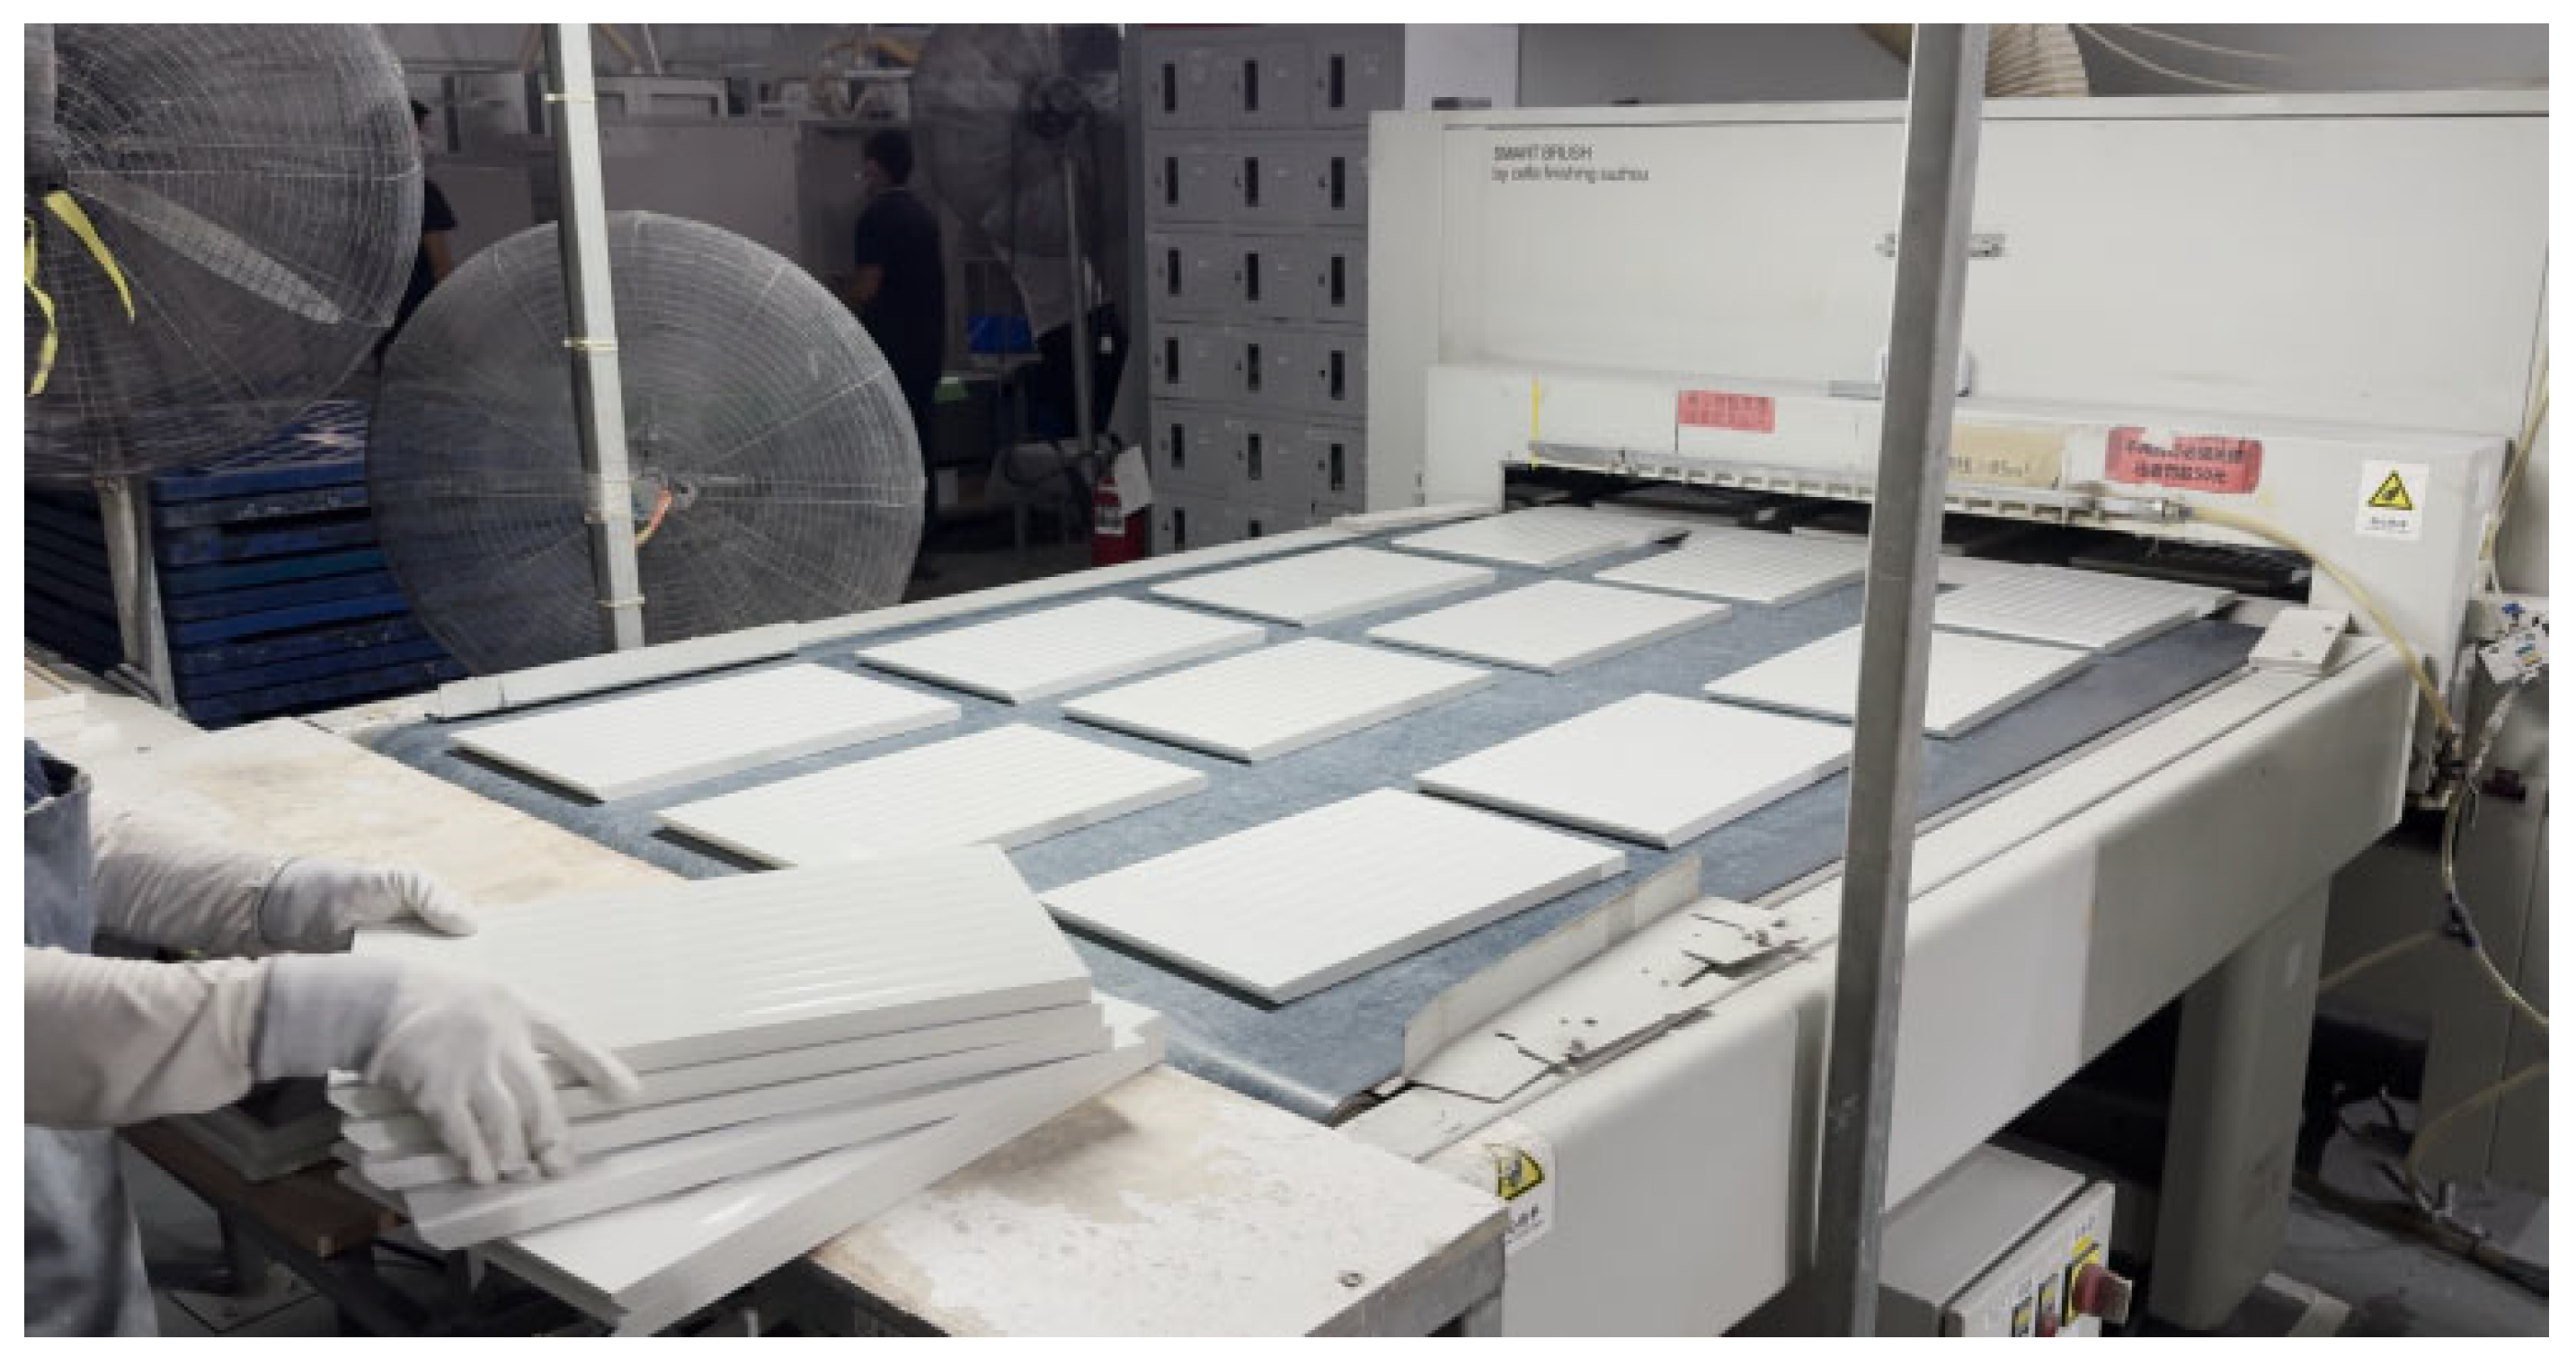
Figure 1.
The schematic diagram of the JOMOO panel production line sorting site.
Figure 1.
The schematic diagram of the JOMOO panel production line sorting site.
Figure 2.
Principle of Visual Measurement System.
Figure 2.
Principle of Visual Measurement System.
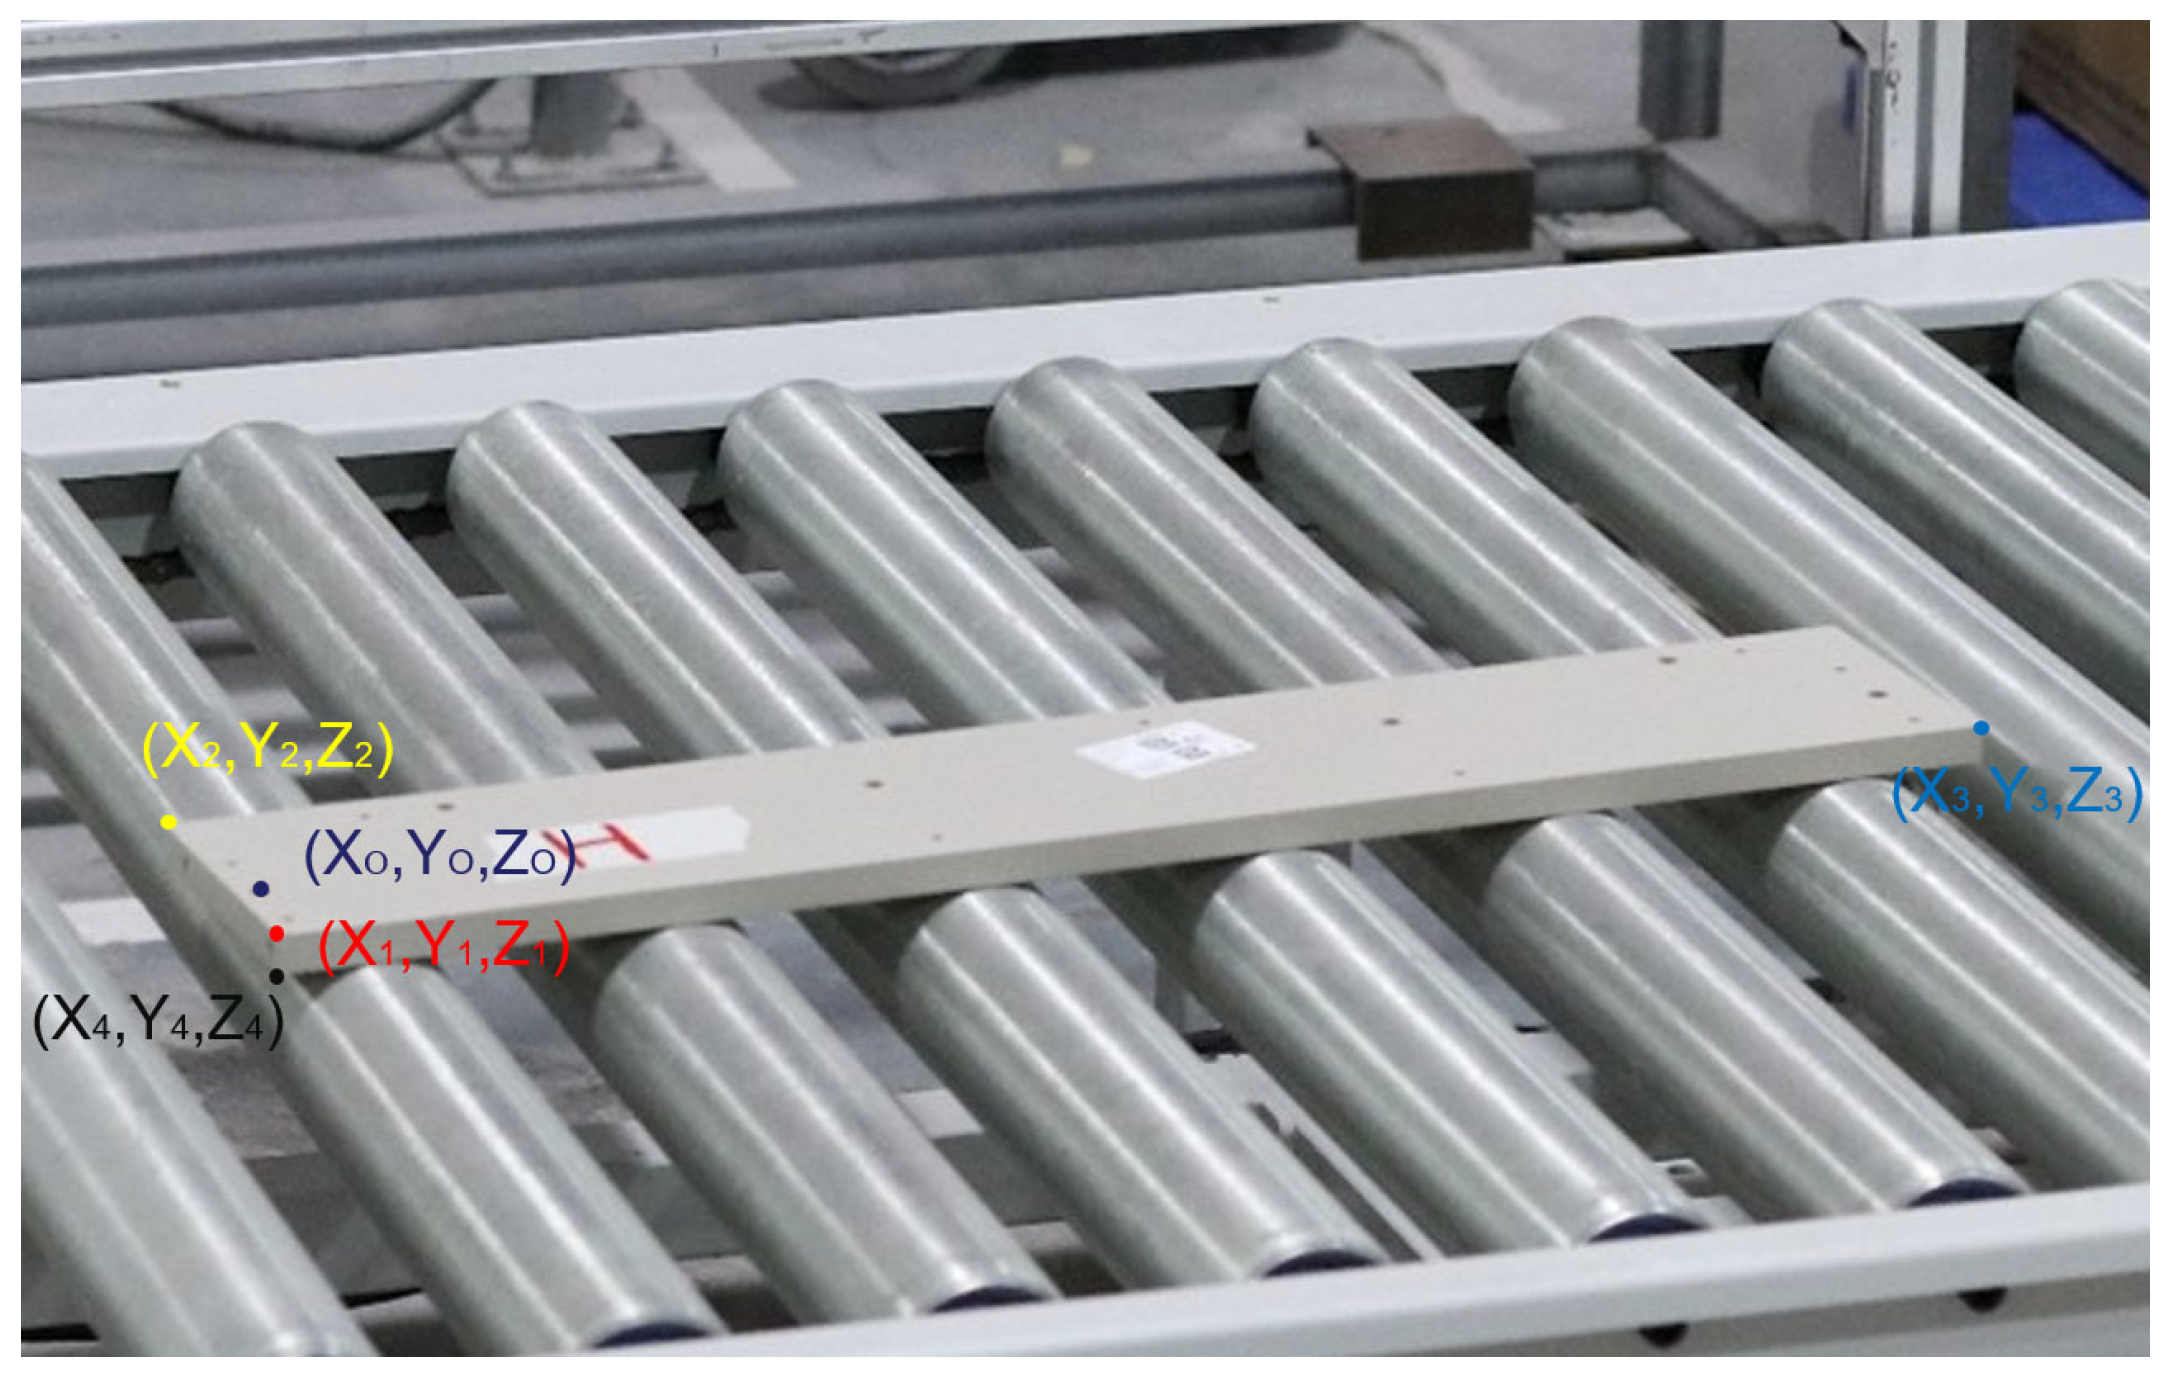
Figure 3.
Key point diagram of the panel.
Figure 3.
Key point diagram of the panel.
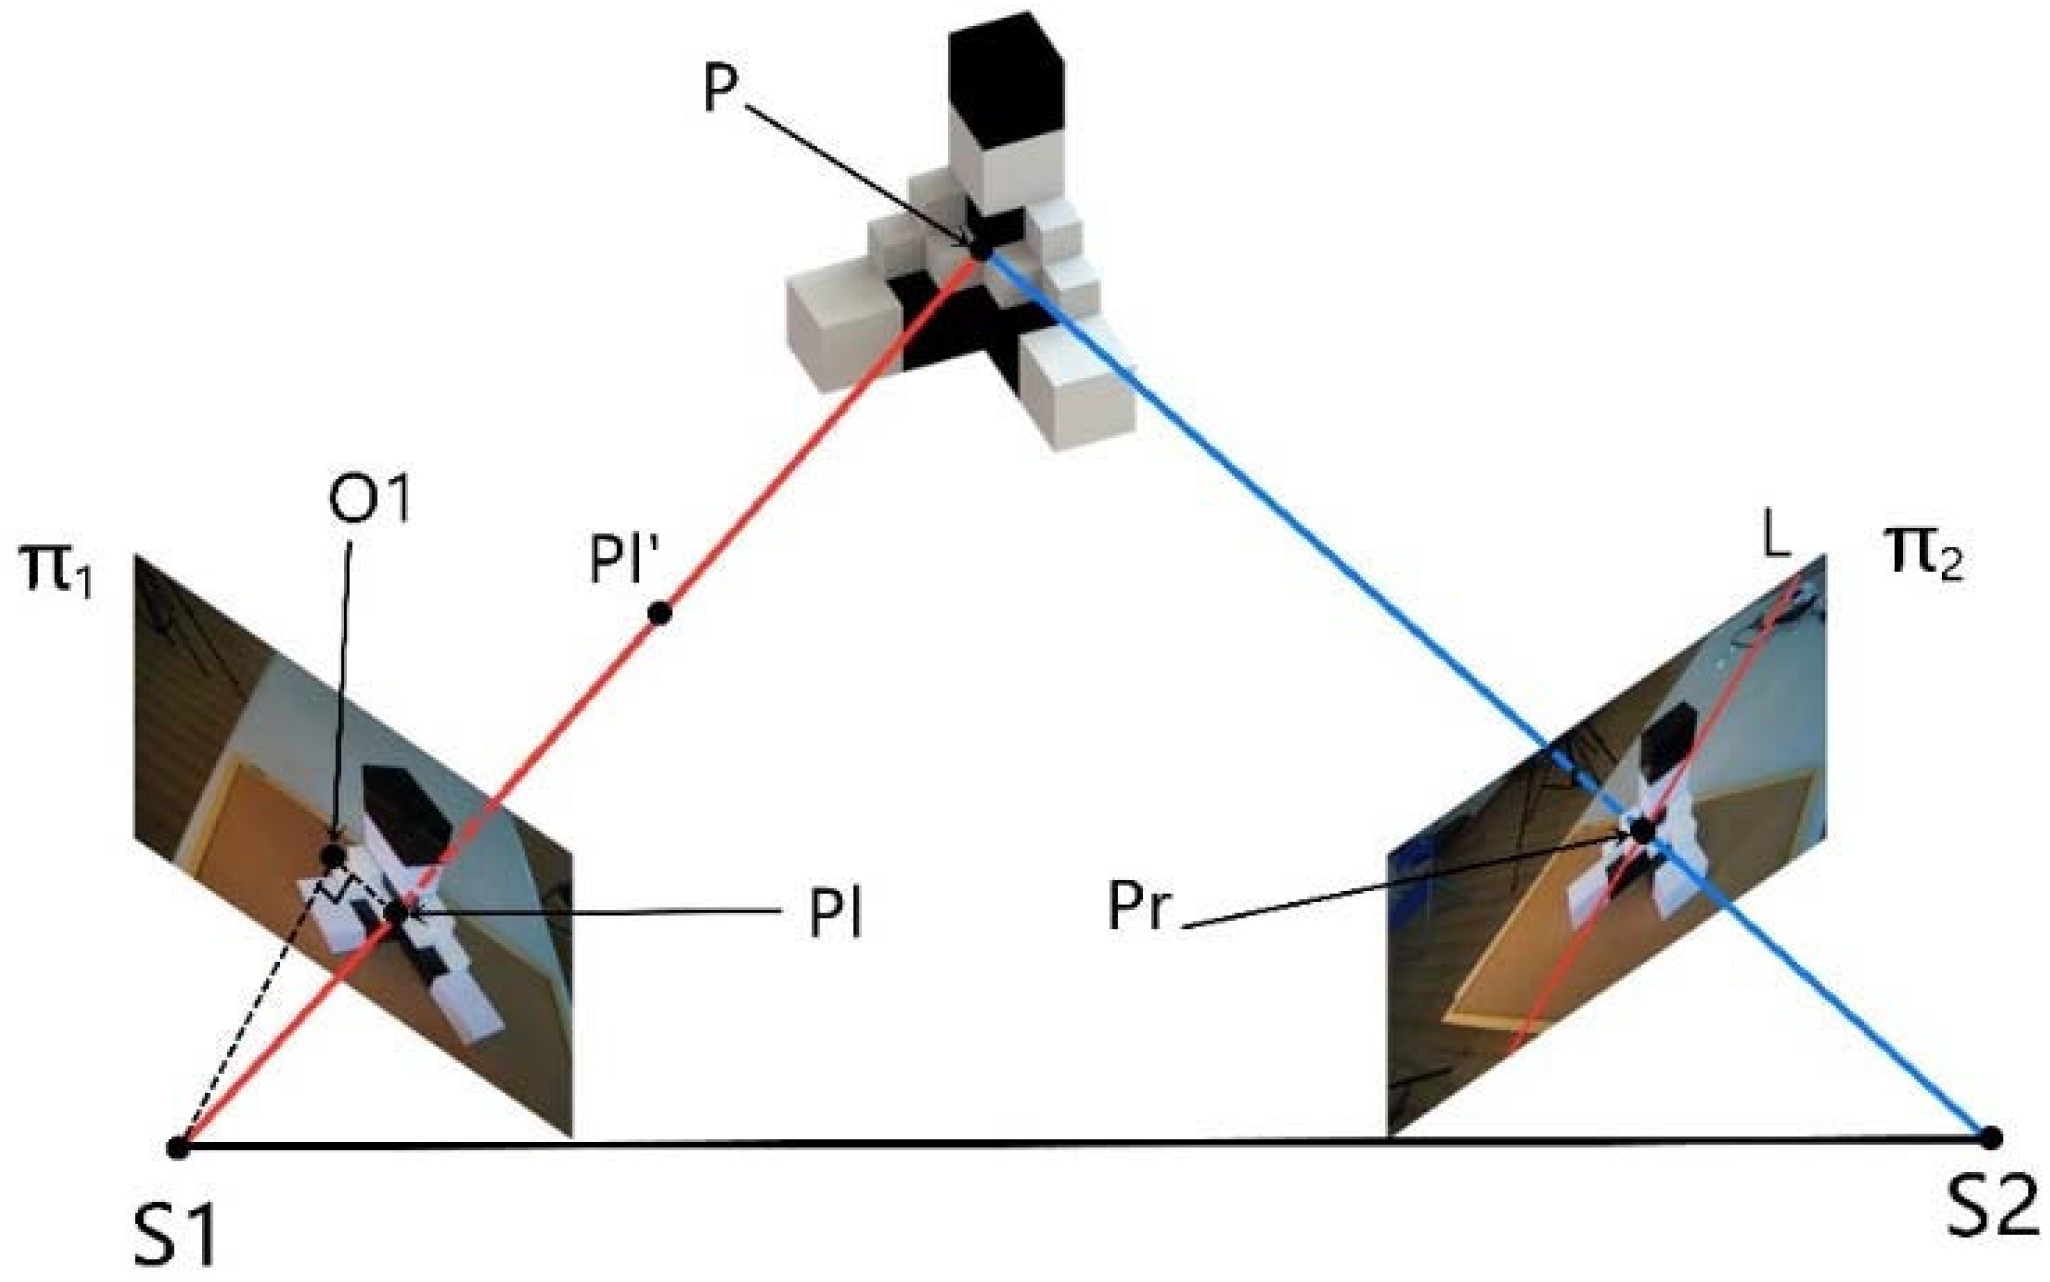
Figure 4.
Schematic diagram of photogrammetry calculation principle.
Figure 4.
Schematic diagram of photogrammetry calculation principle.
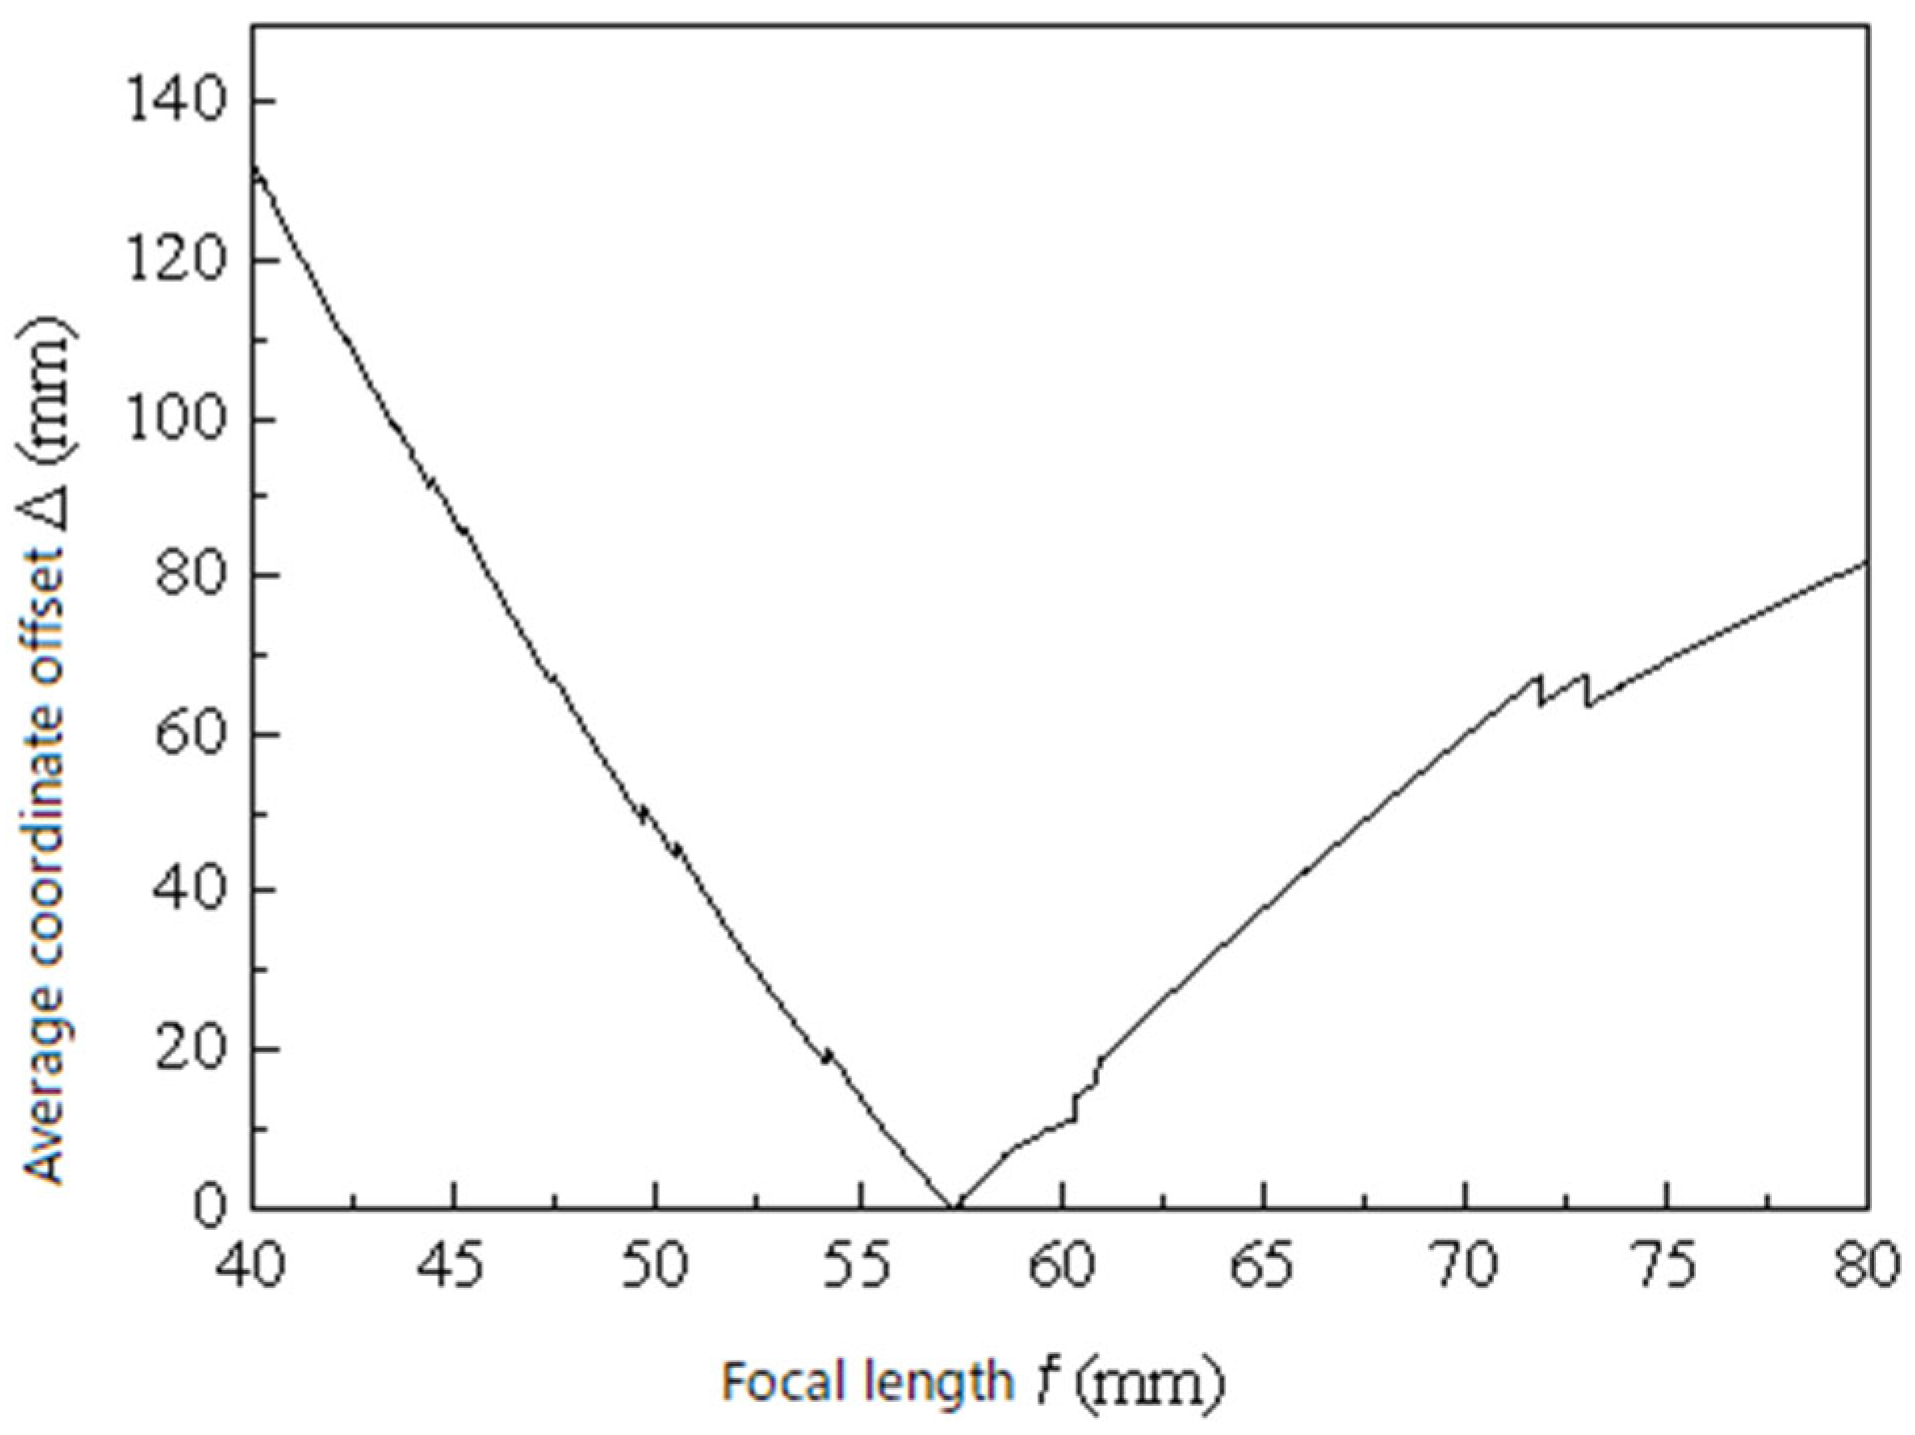
Figure 5.
f-Δ relationship diagram.
Figure 5.
f-Δ relationship diagram.
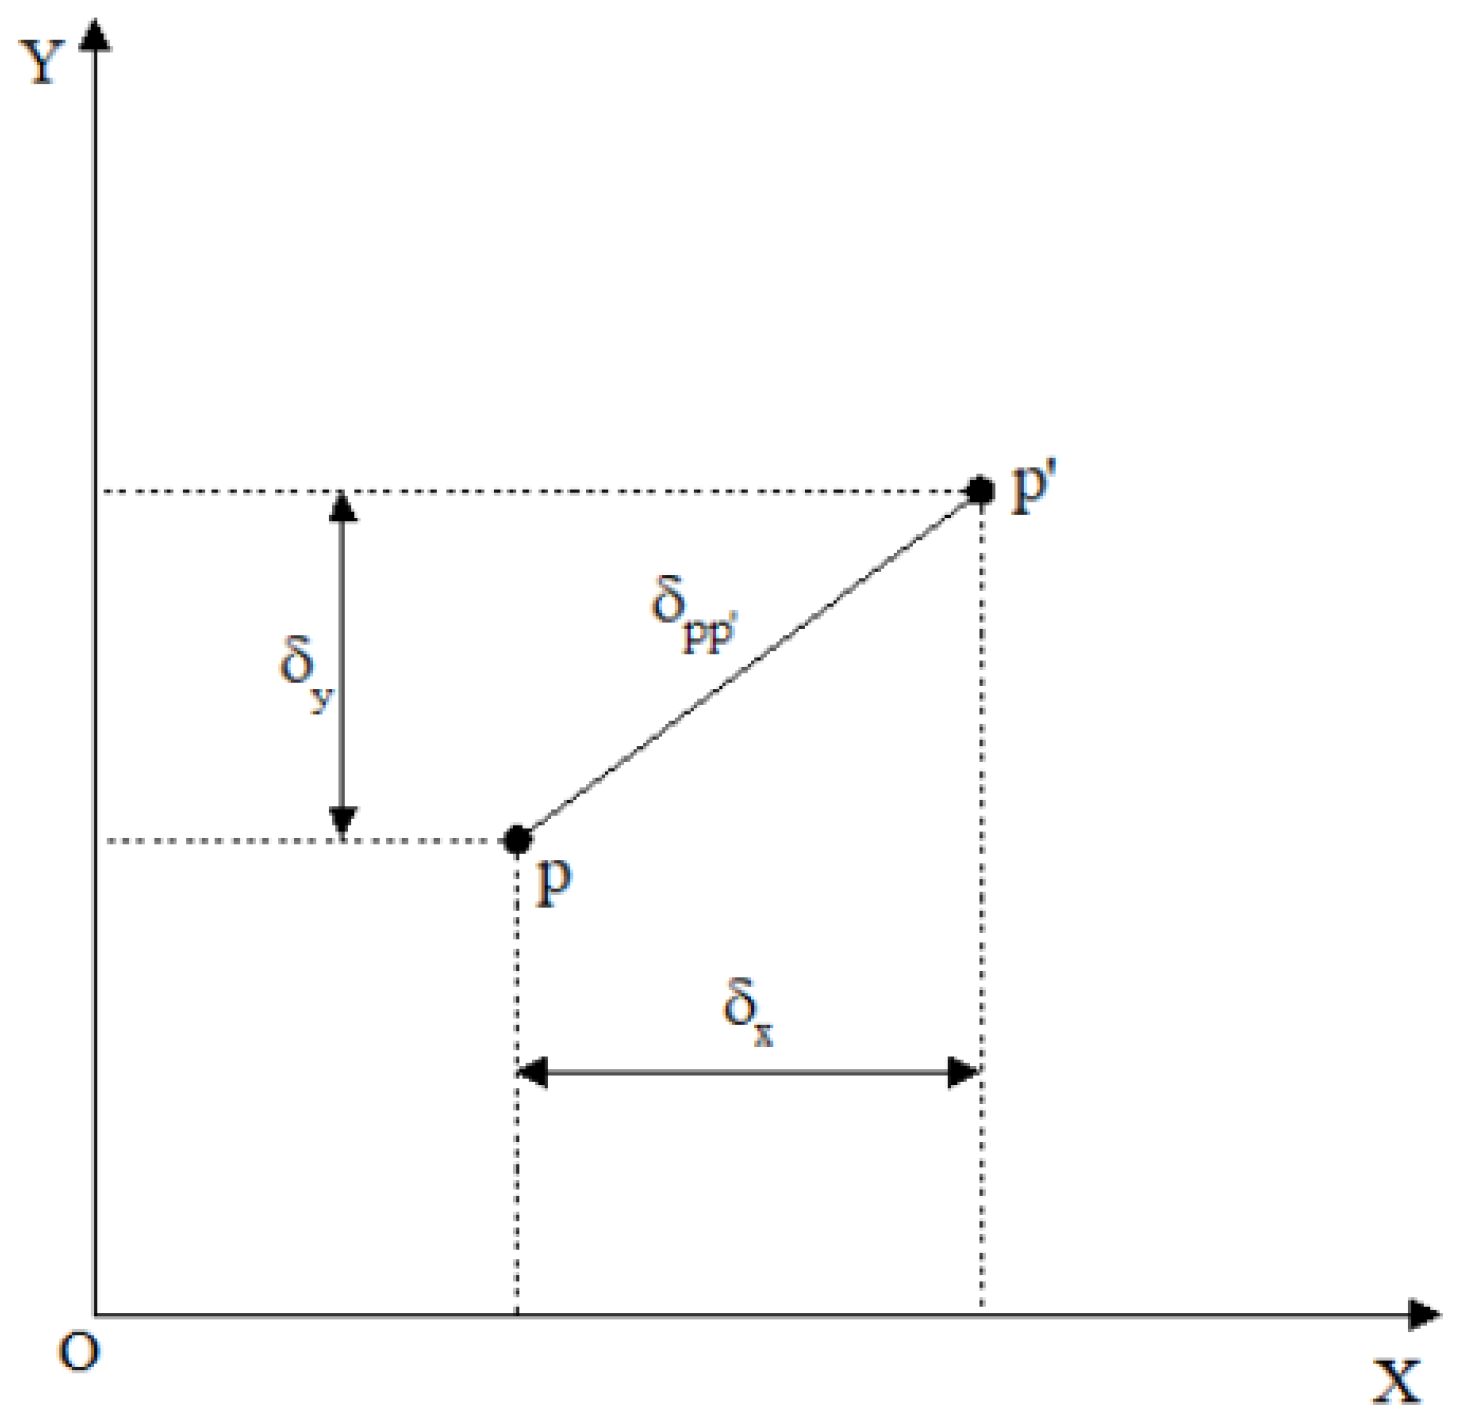
Figure 6.
The spatial relationship of the image plane coordinate system.
Figure 6.
The spatial relationship of the image plane coordinate system.
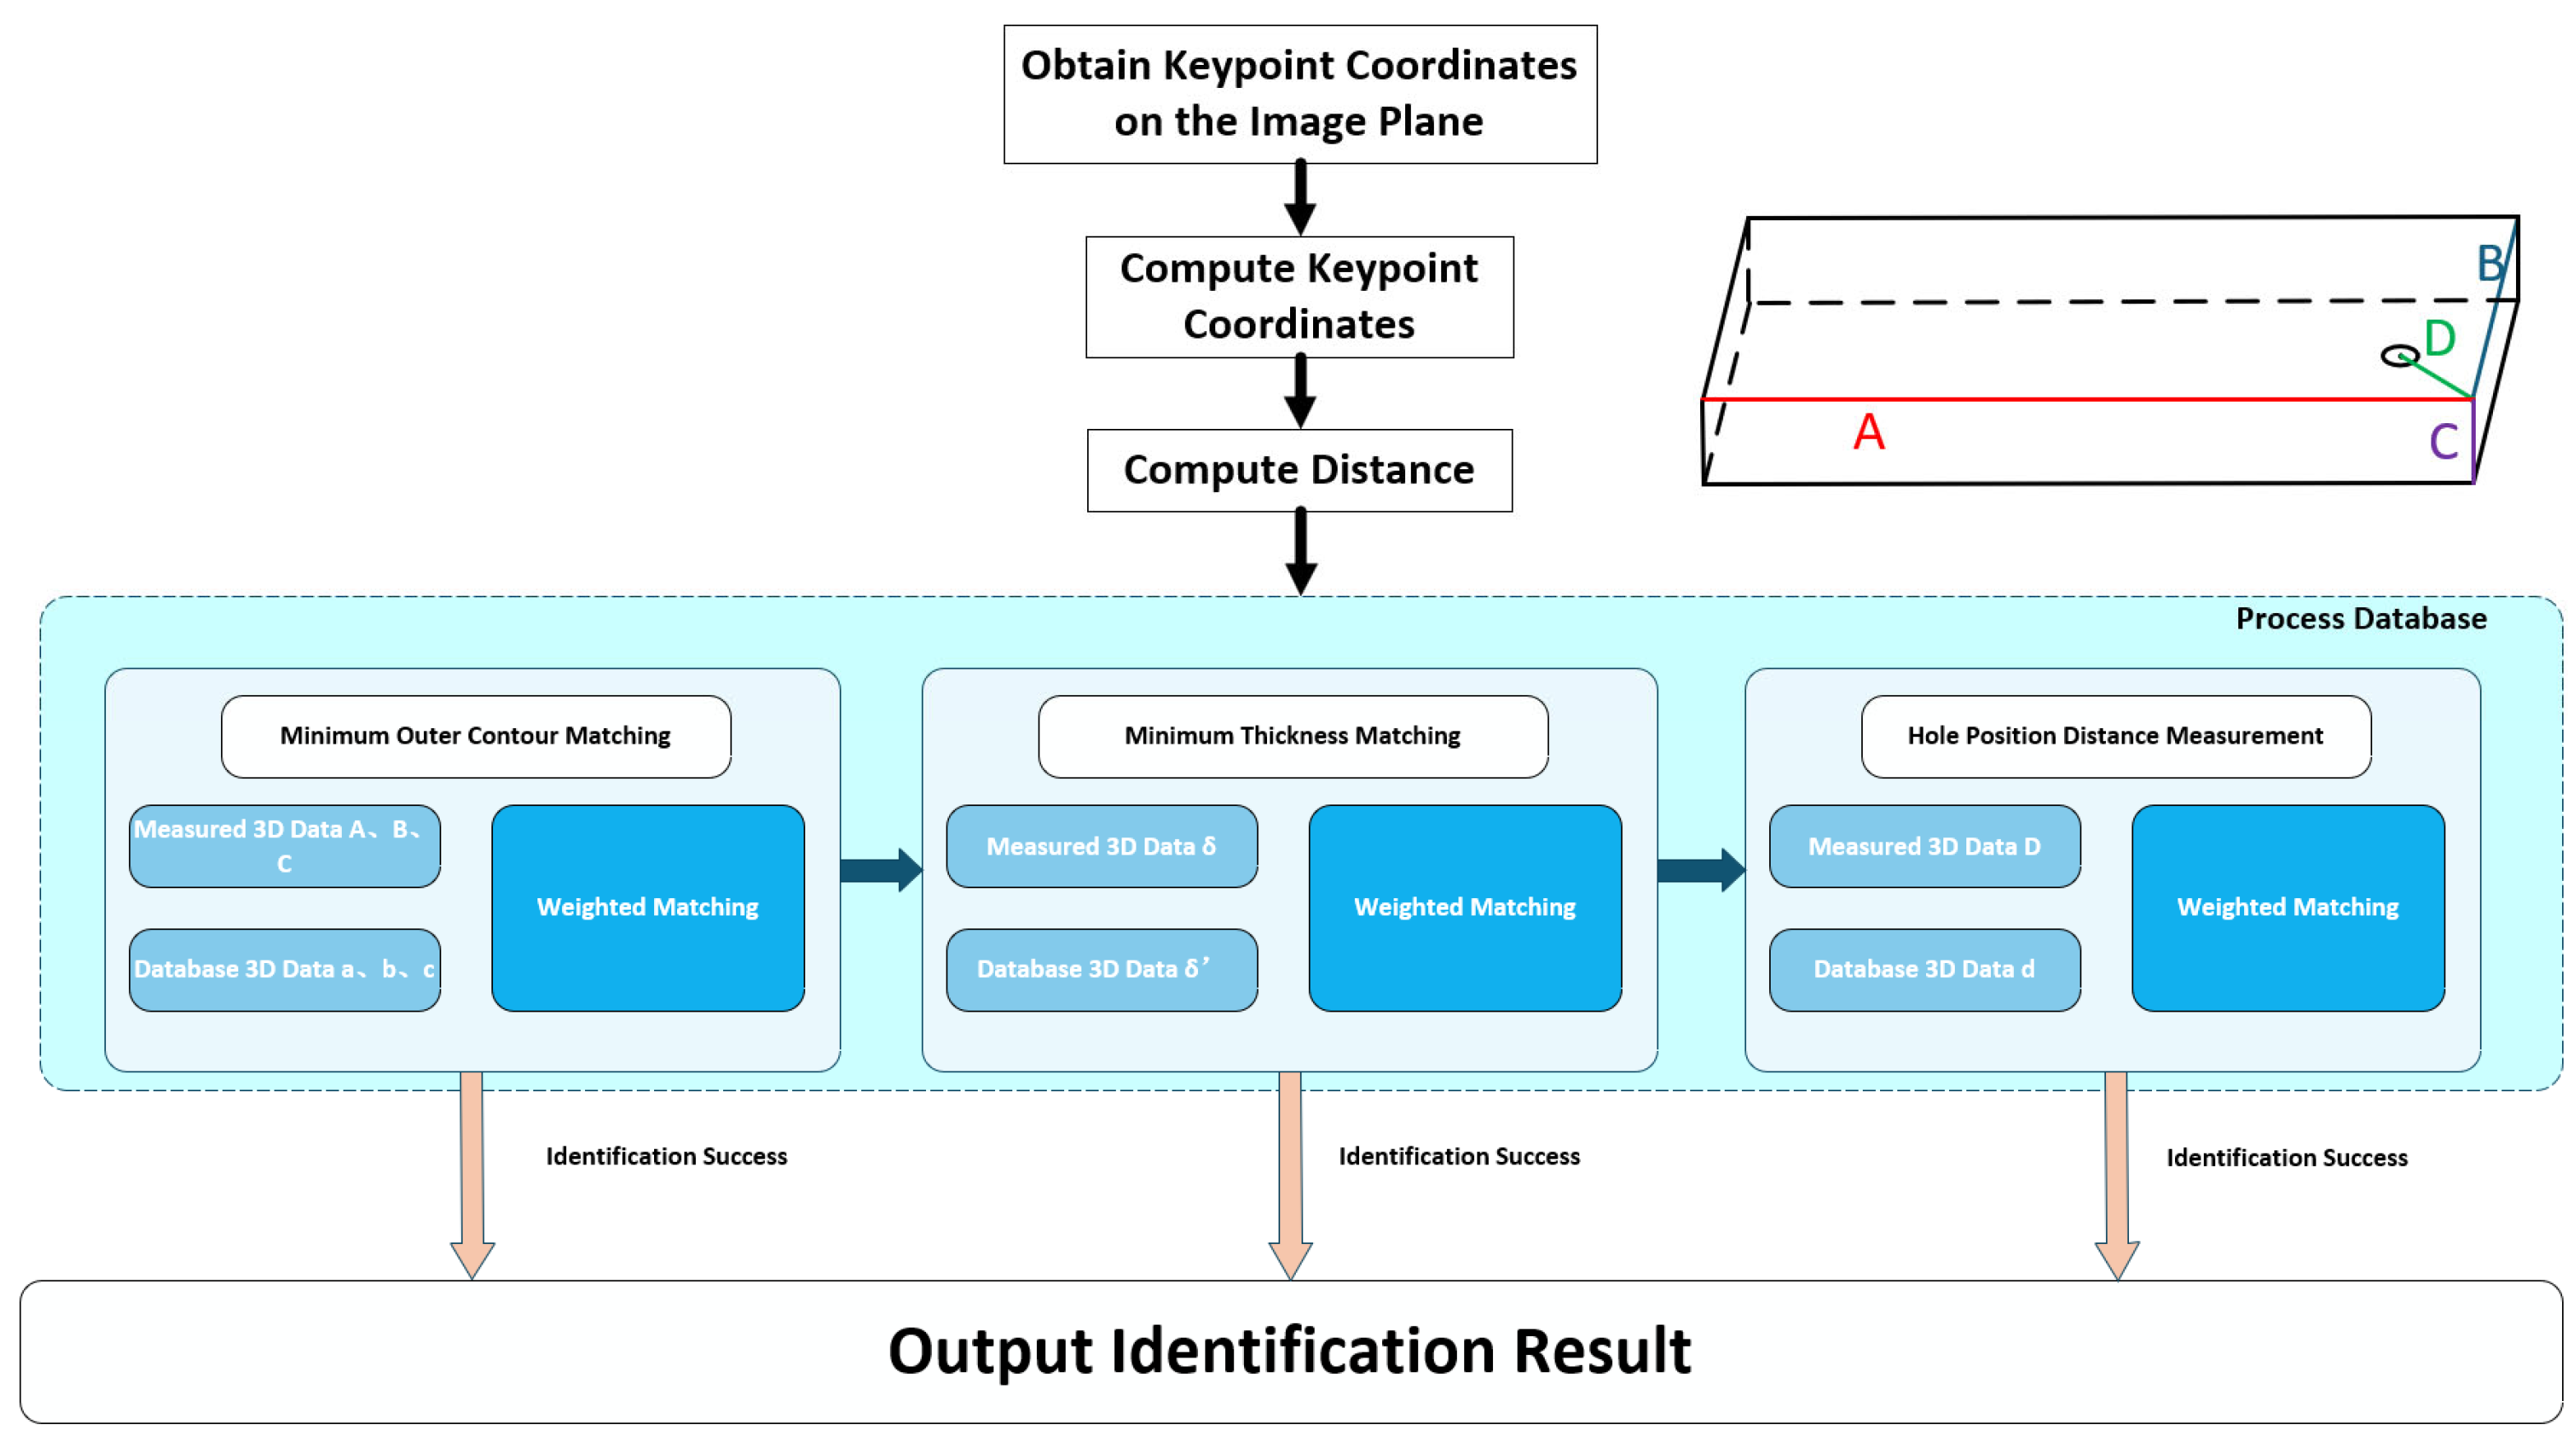
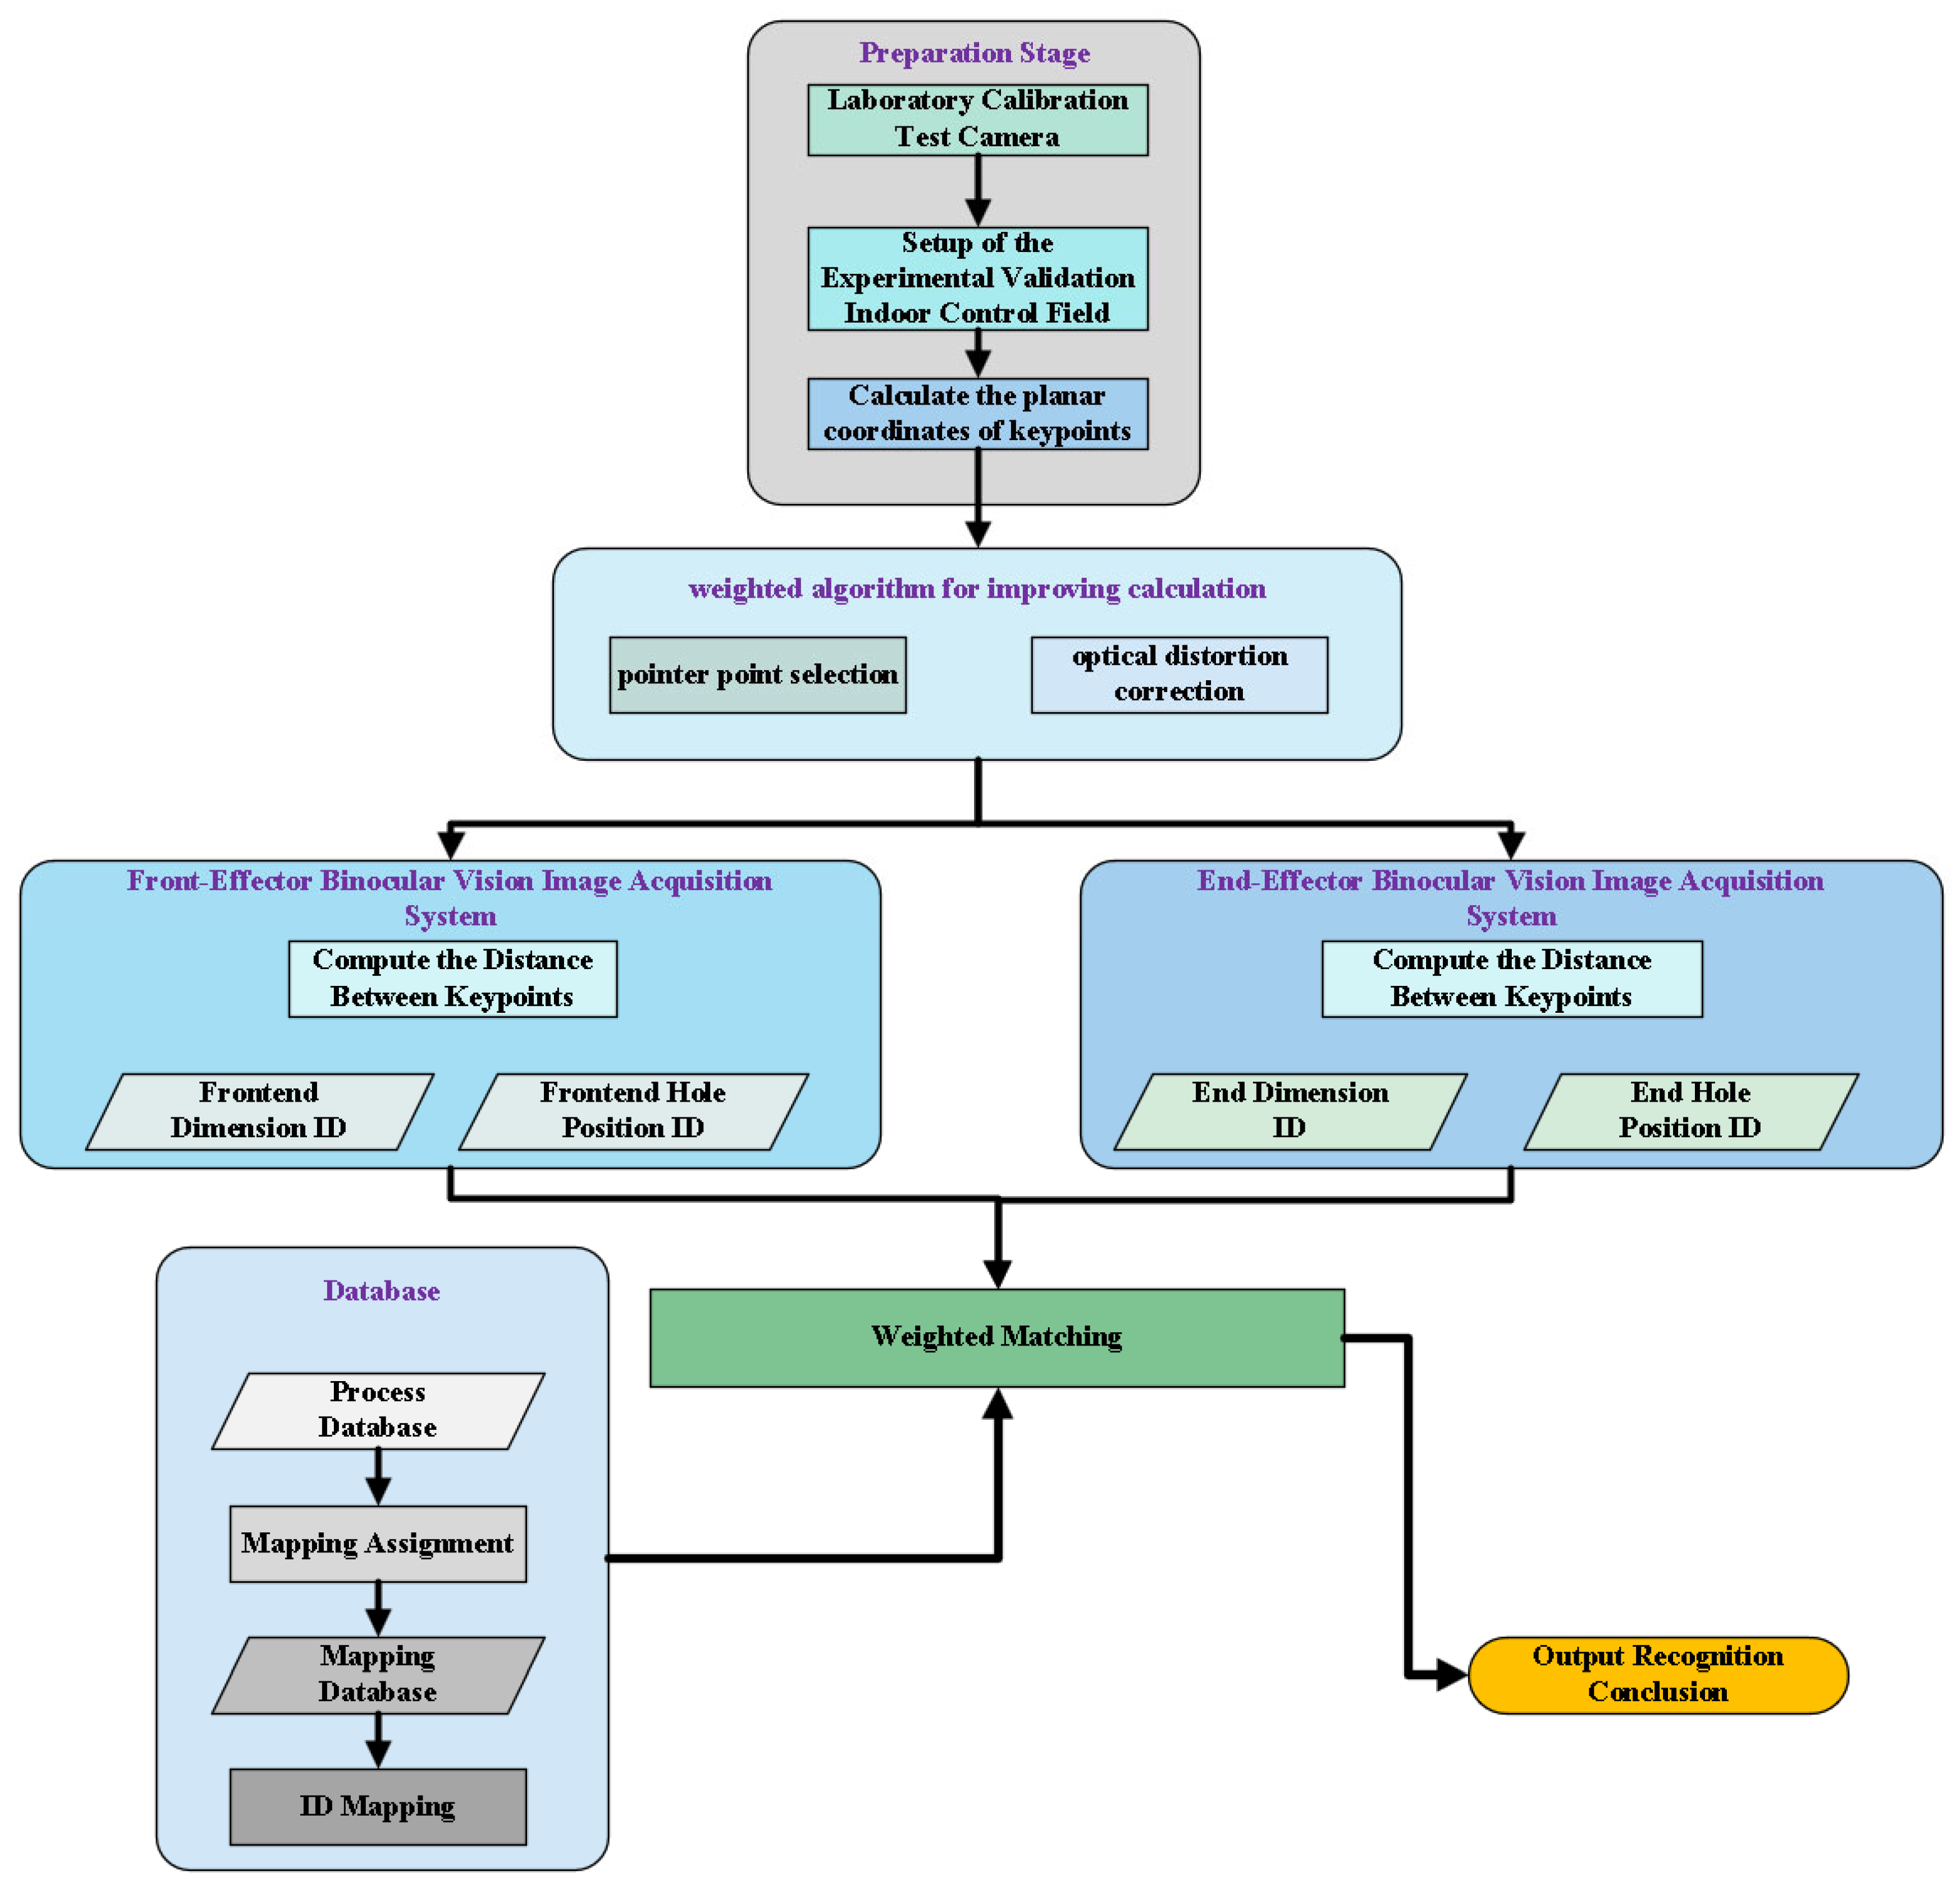
Figure 7.
Experiment procedure diagram.
Figure 7.
Experiment procedure diagram.
Figure 8.
Indoor Control Field Diagram.
Figure 8.
Indoor Control Field Diagram.
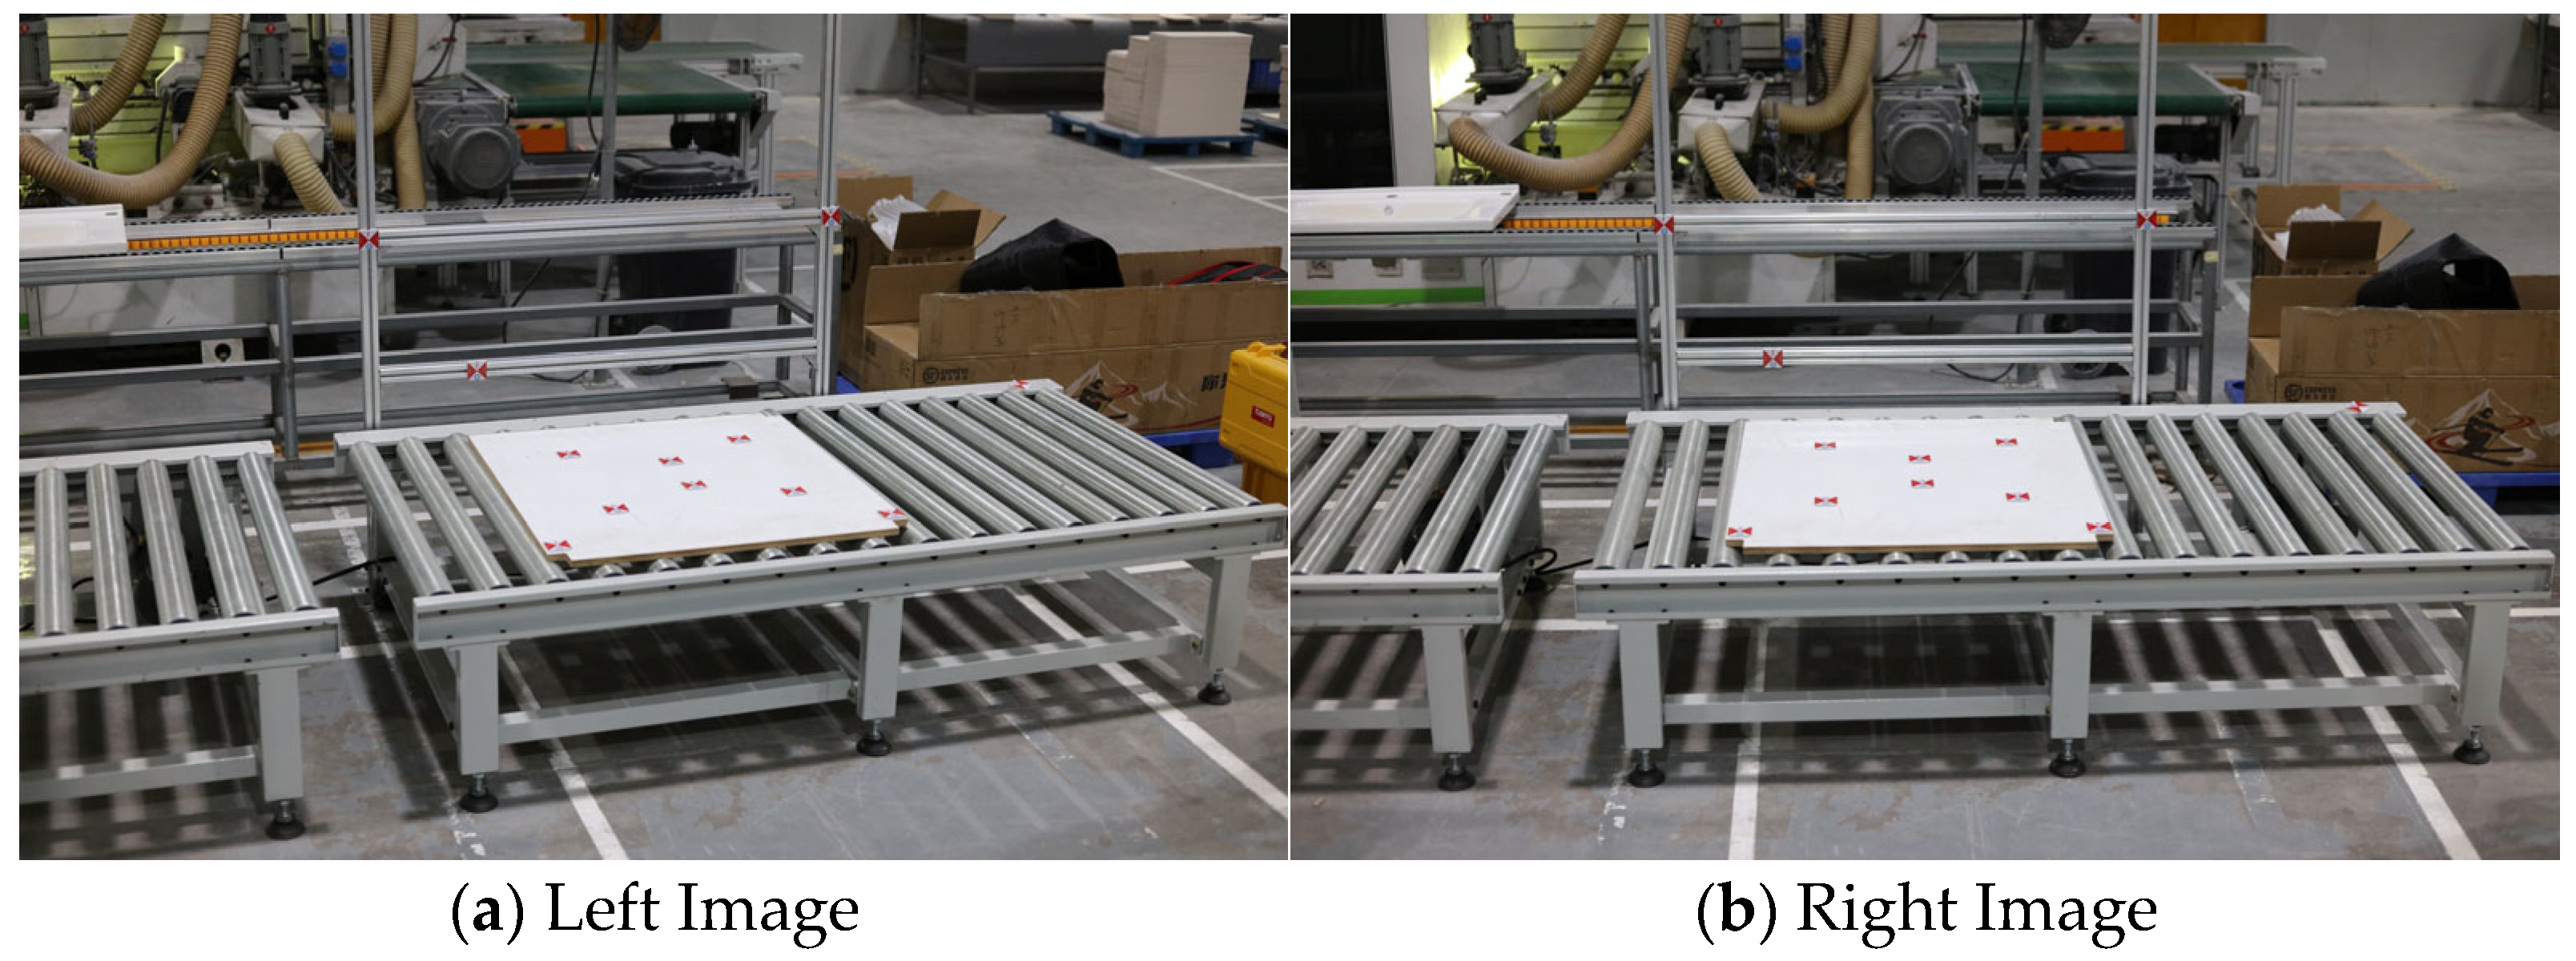
Figure 9.
Simulation verification image.
Figure 9.
Simulation verification image.
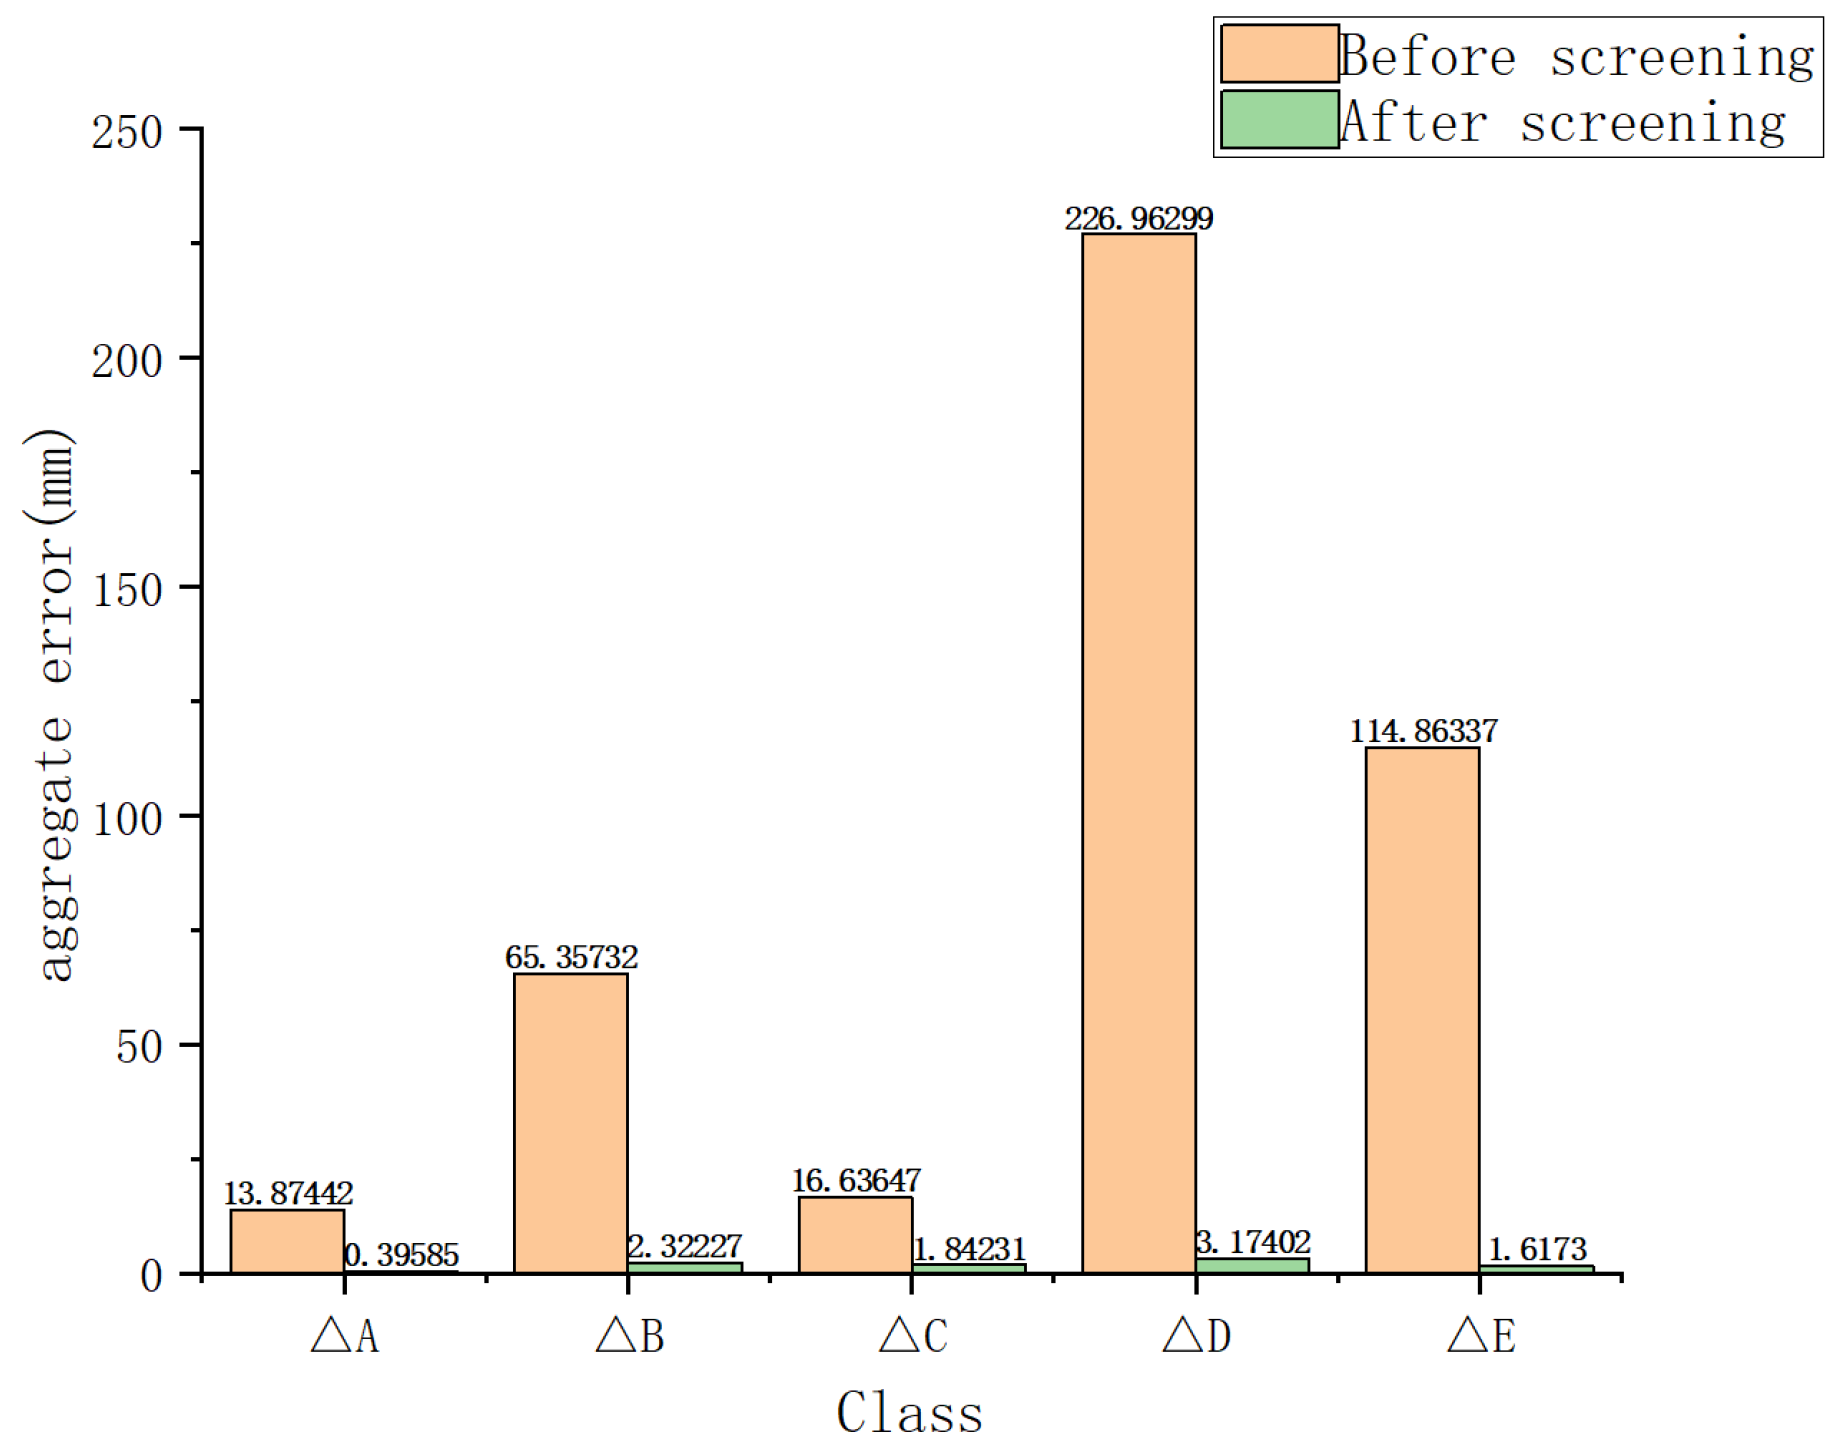
Figure 10.
Comparison of Distance Measurement Errors.
Figure 10.
Comparison of Distance Measurement Errors.
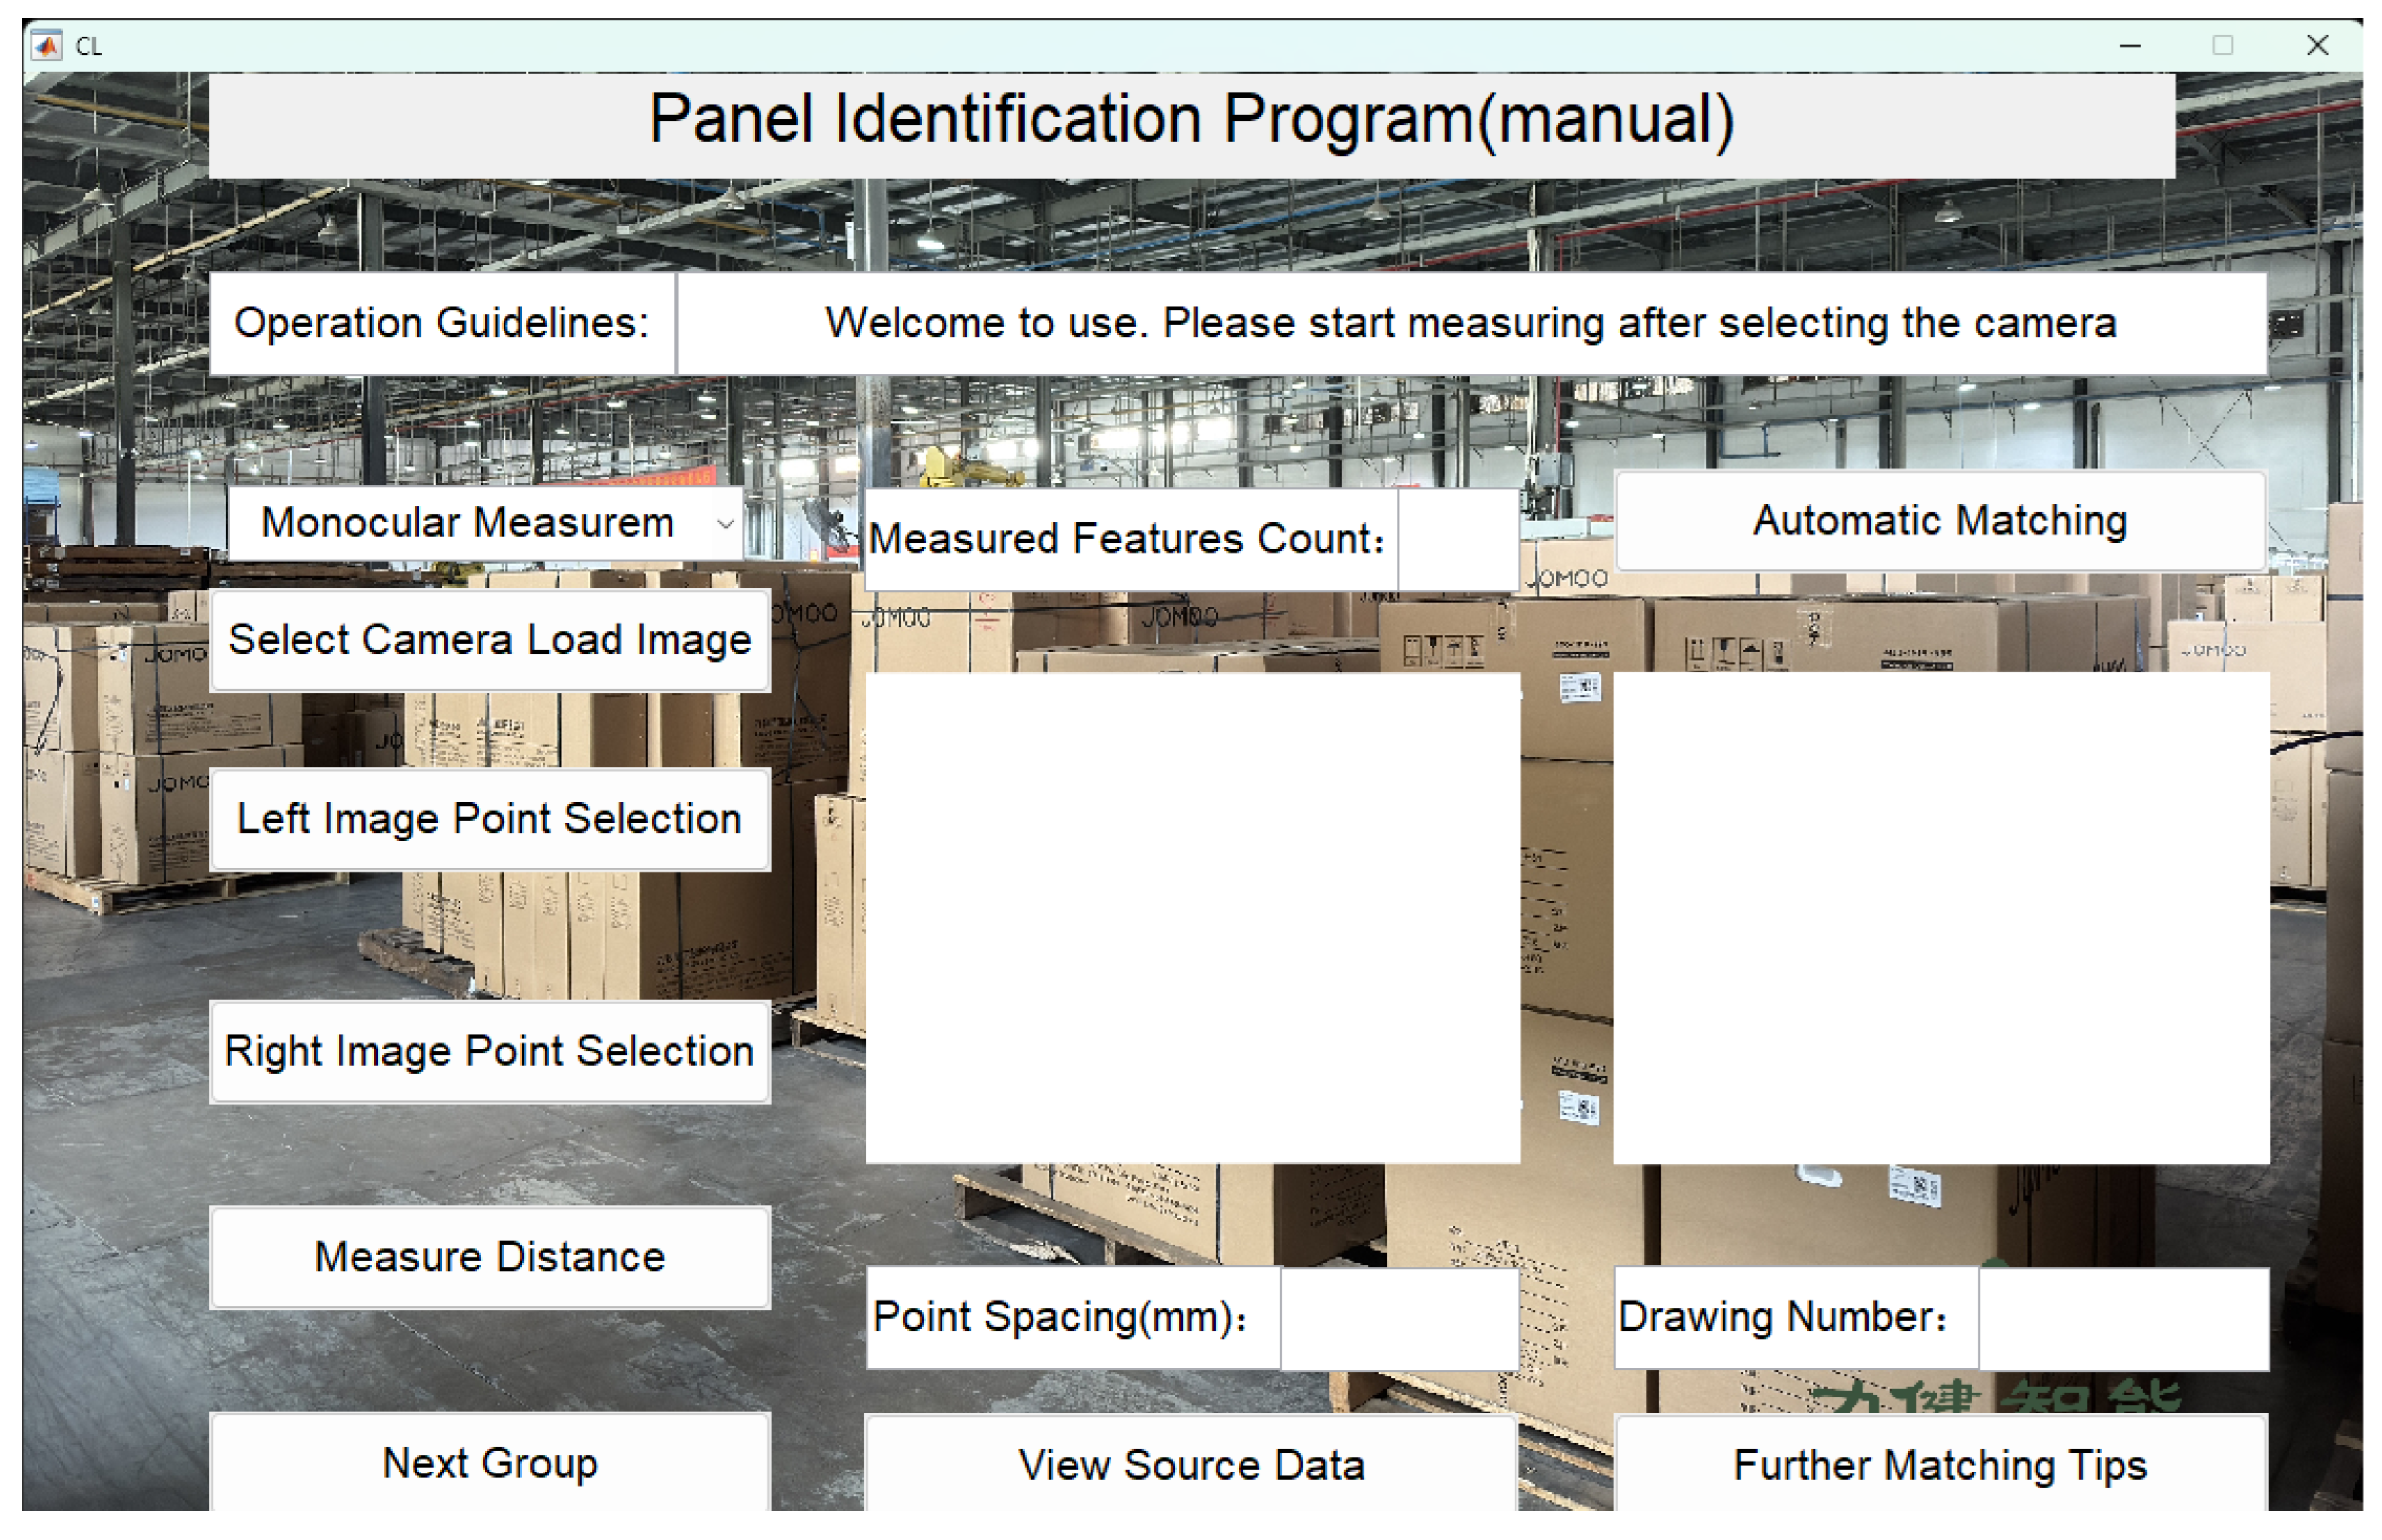
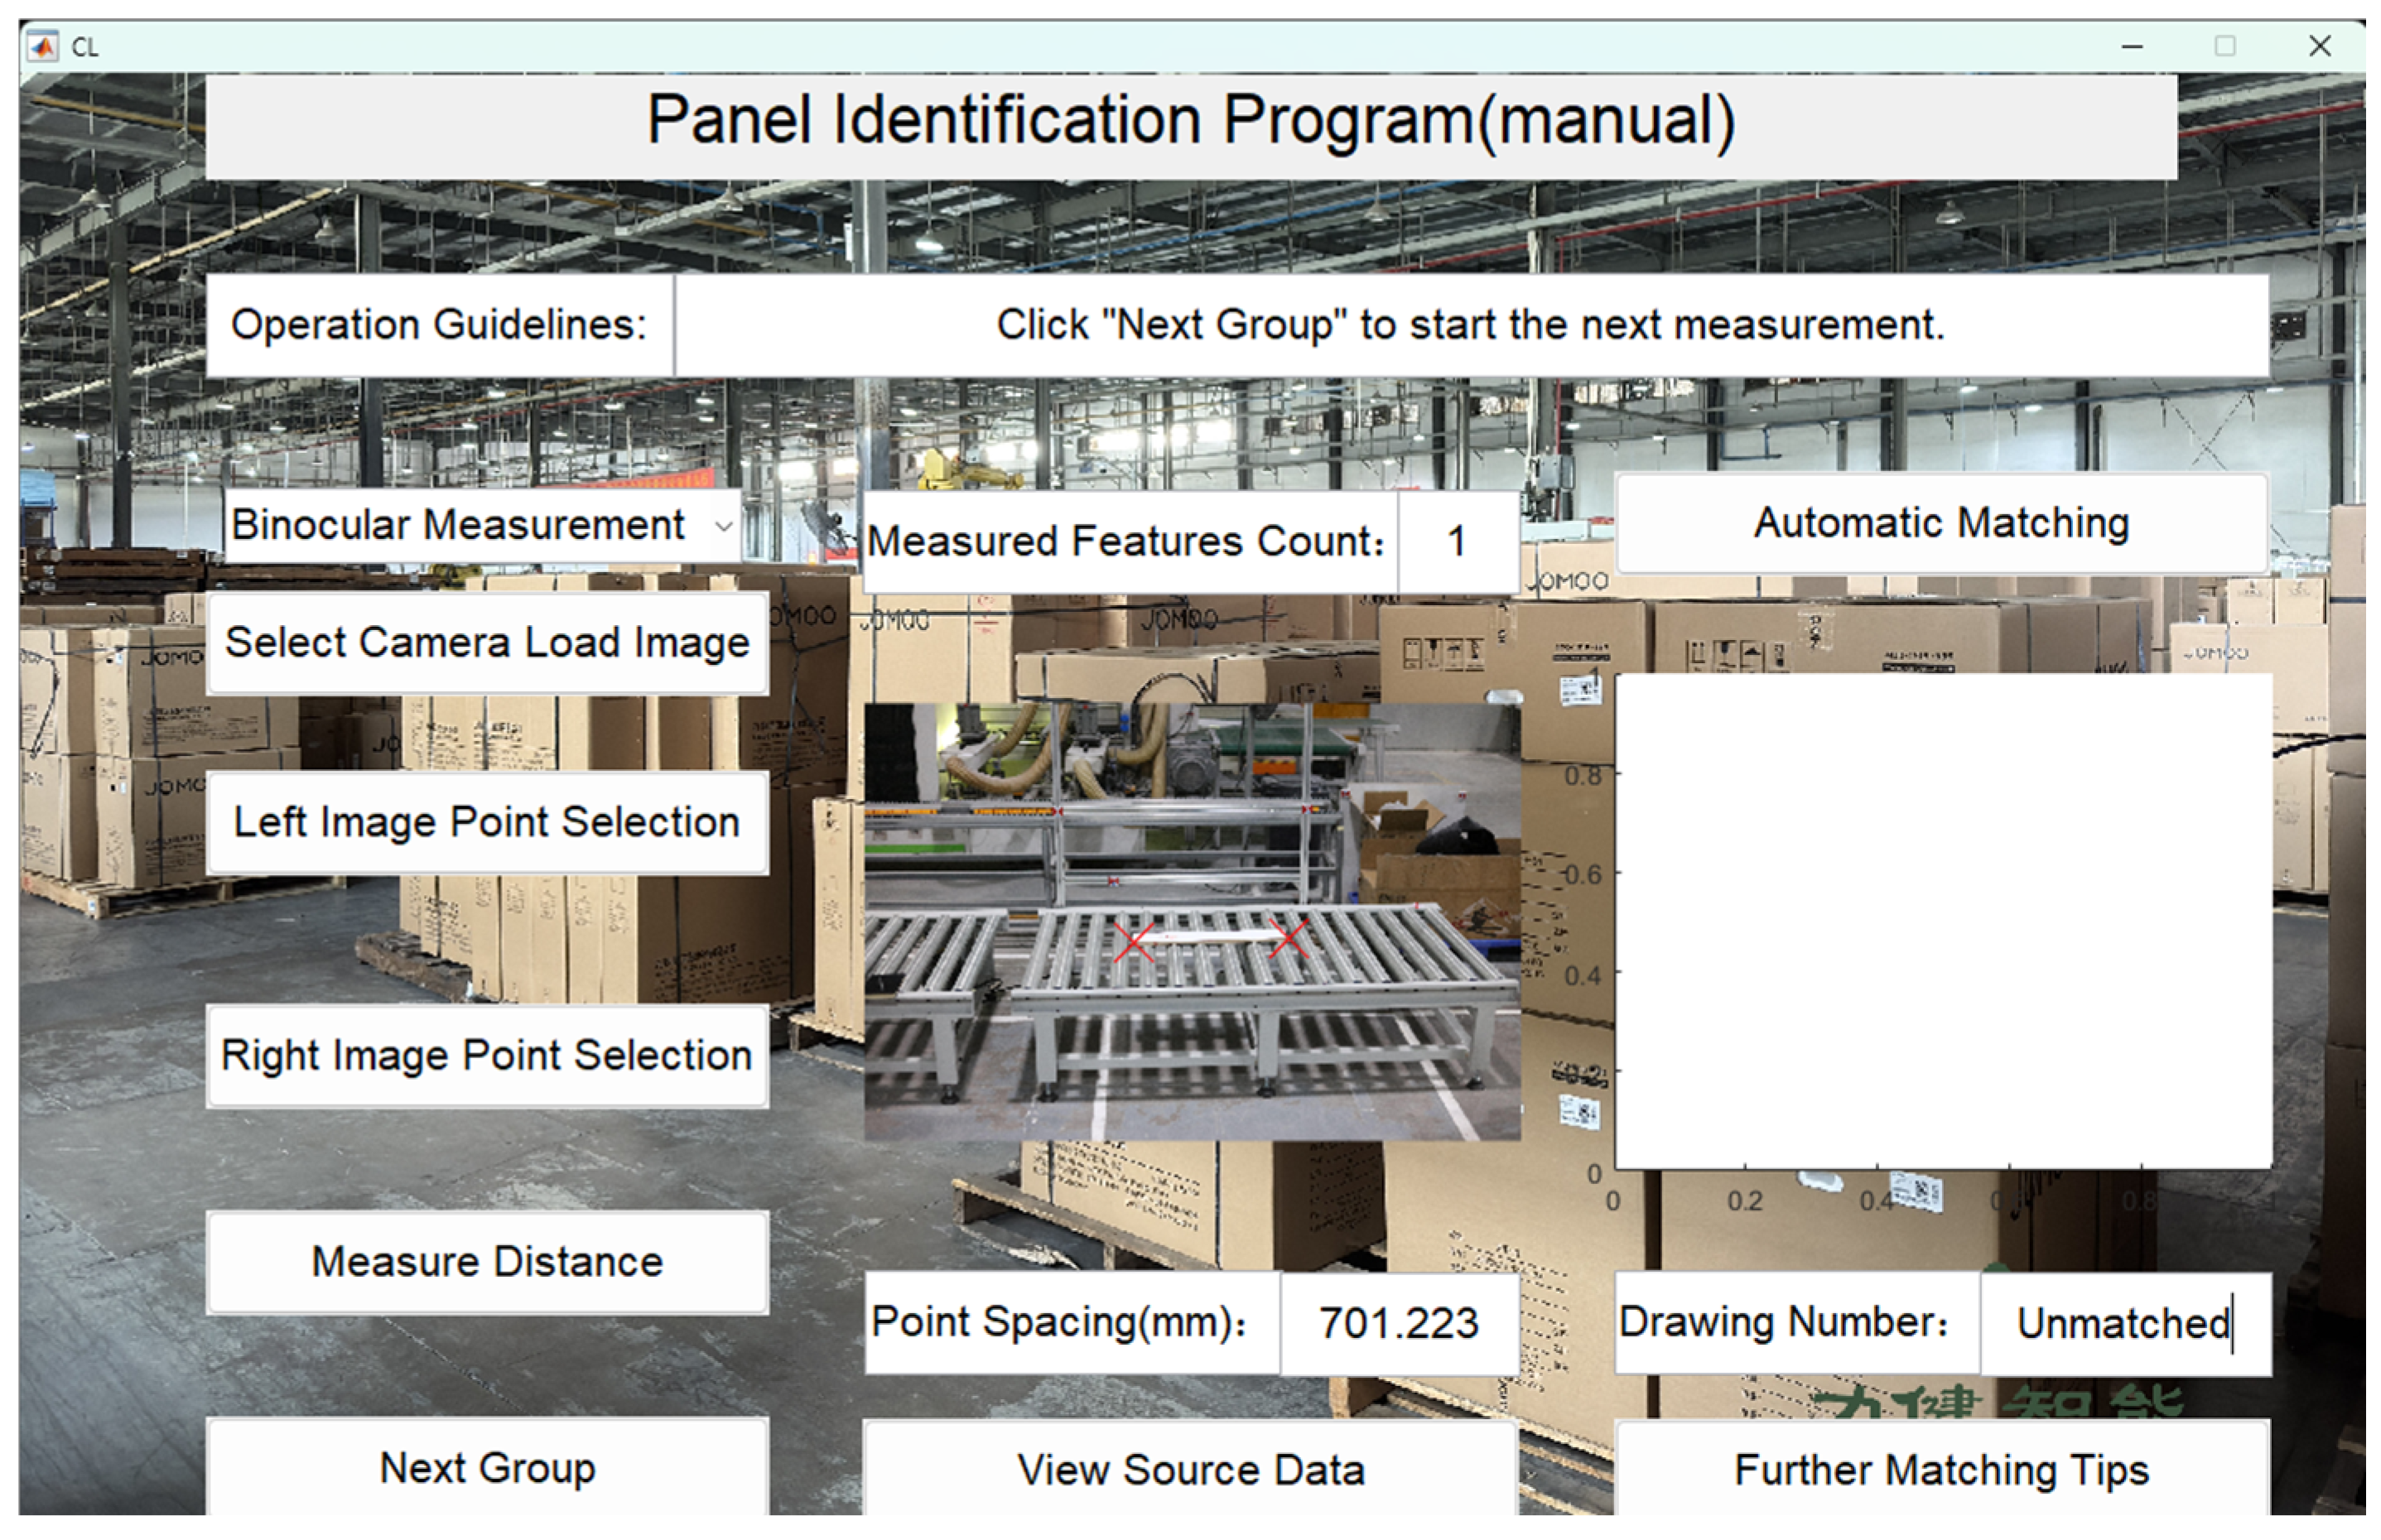
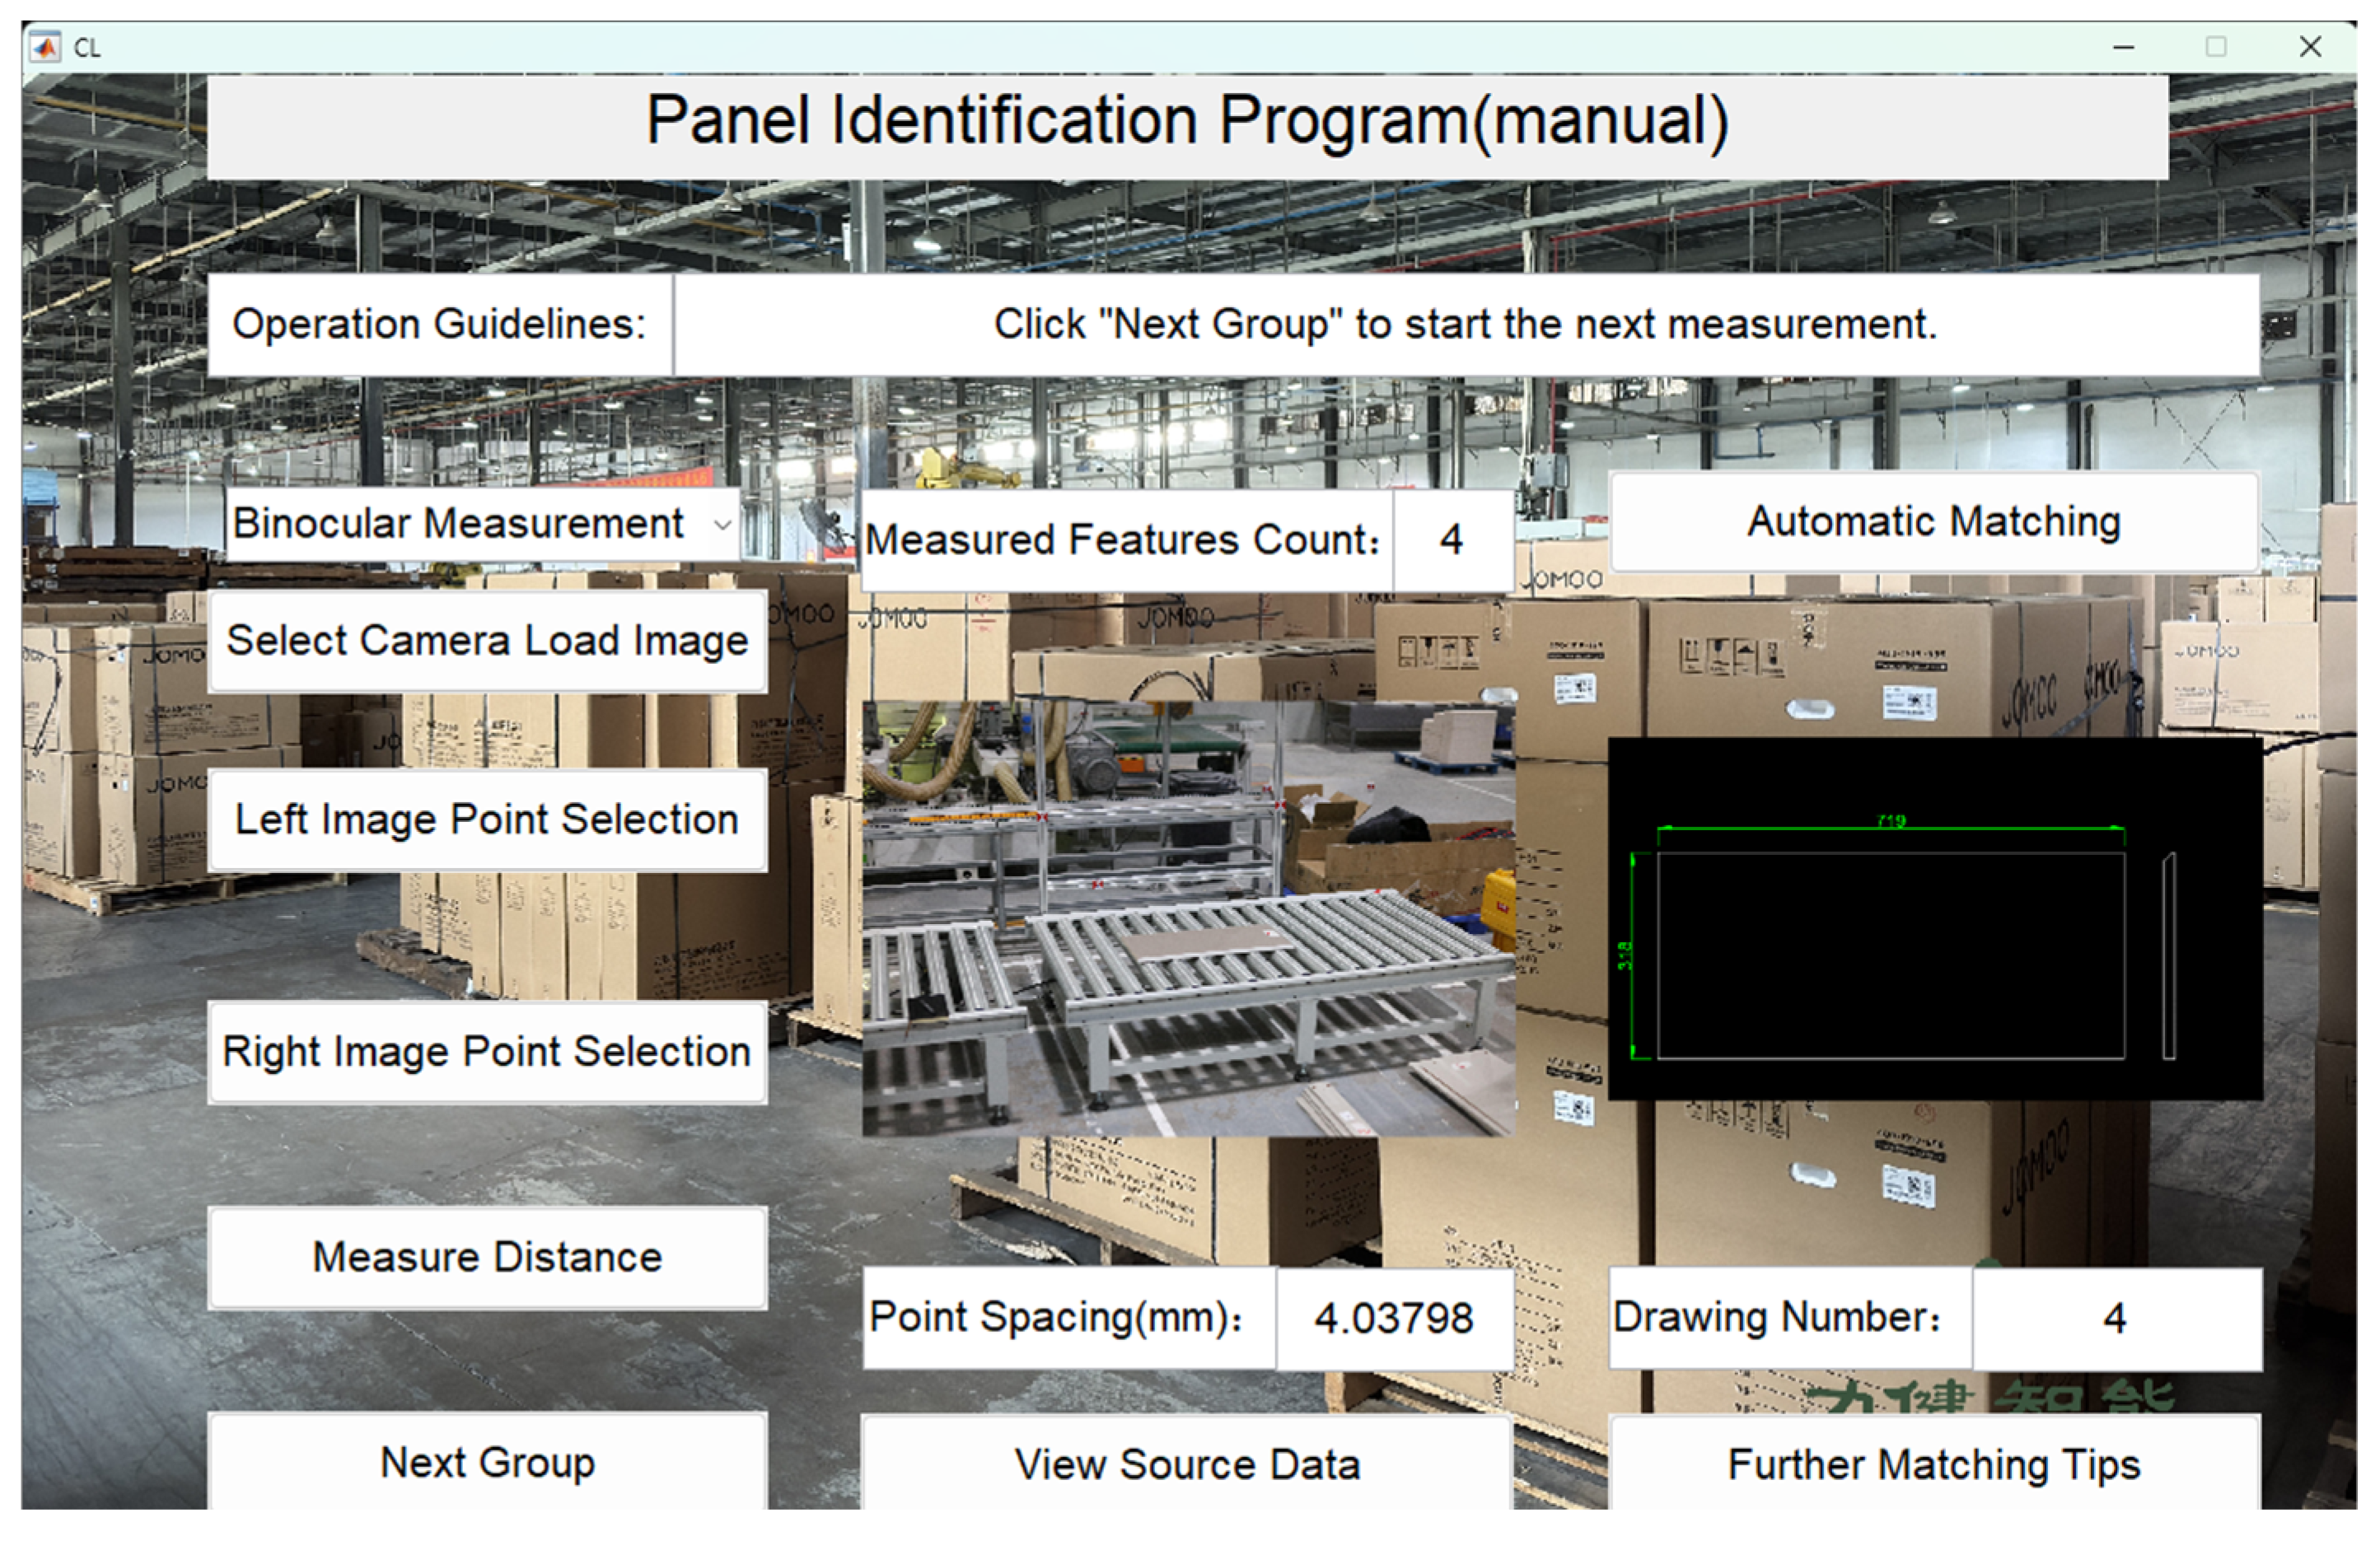
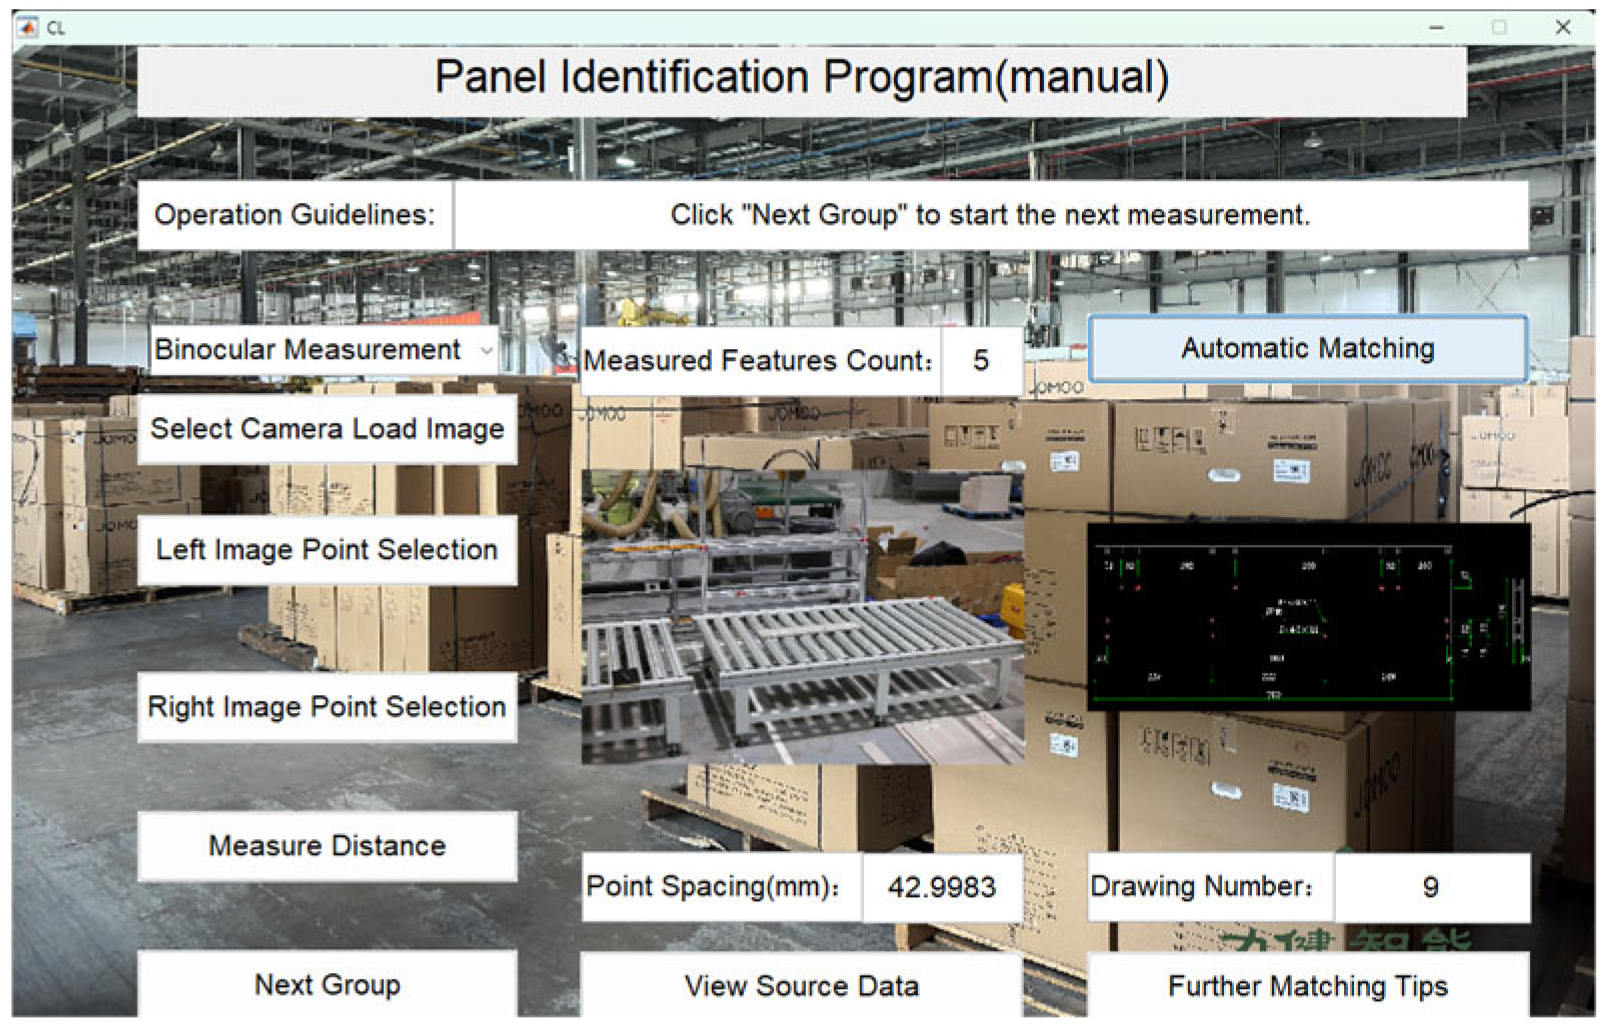
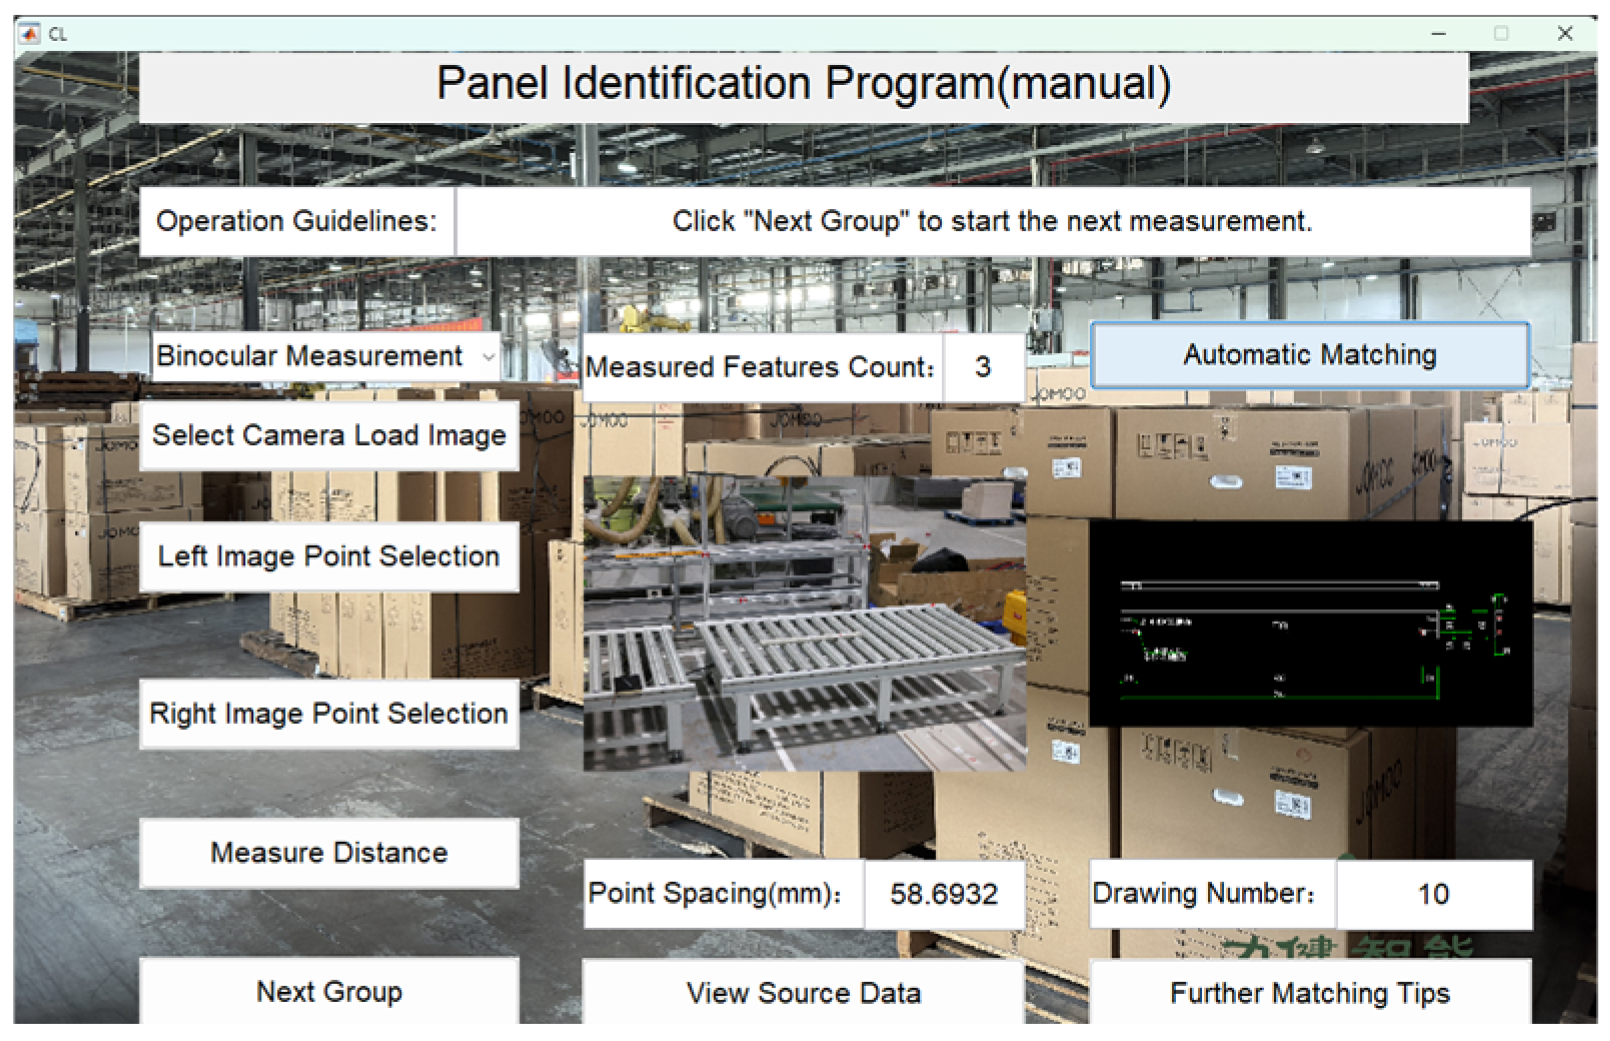
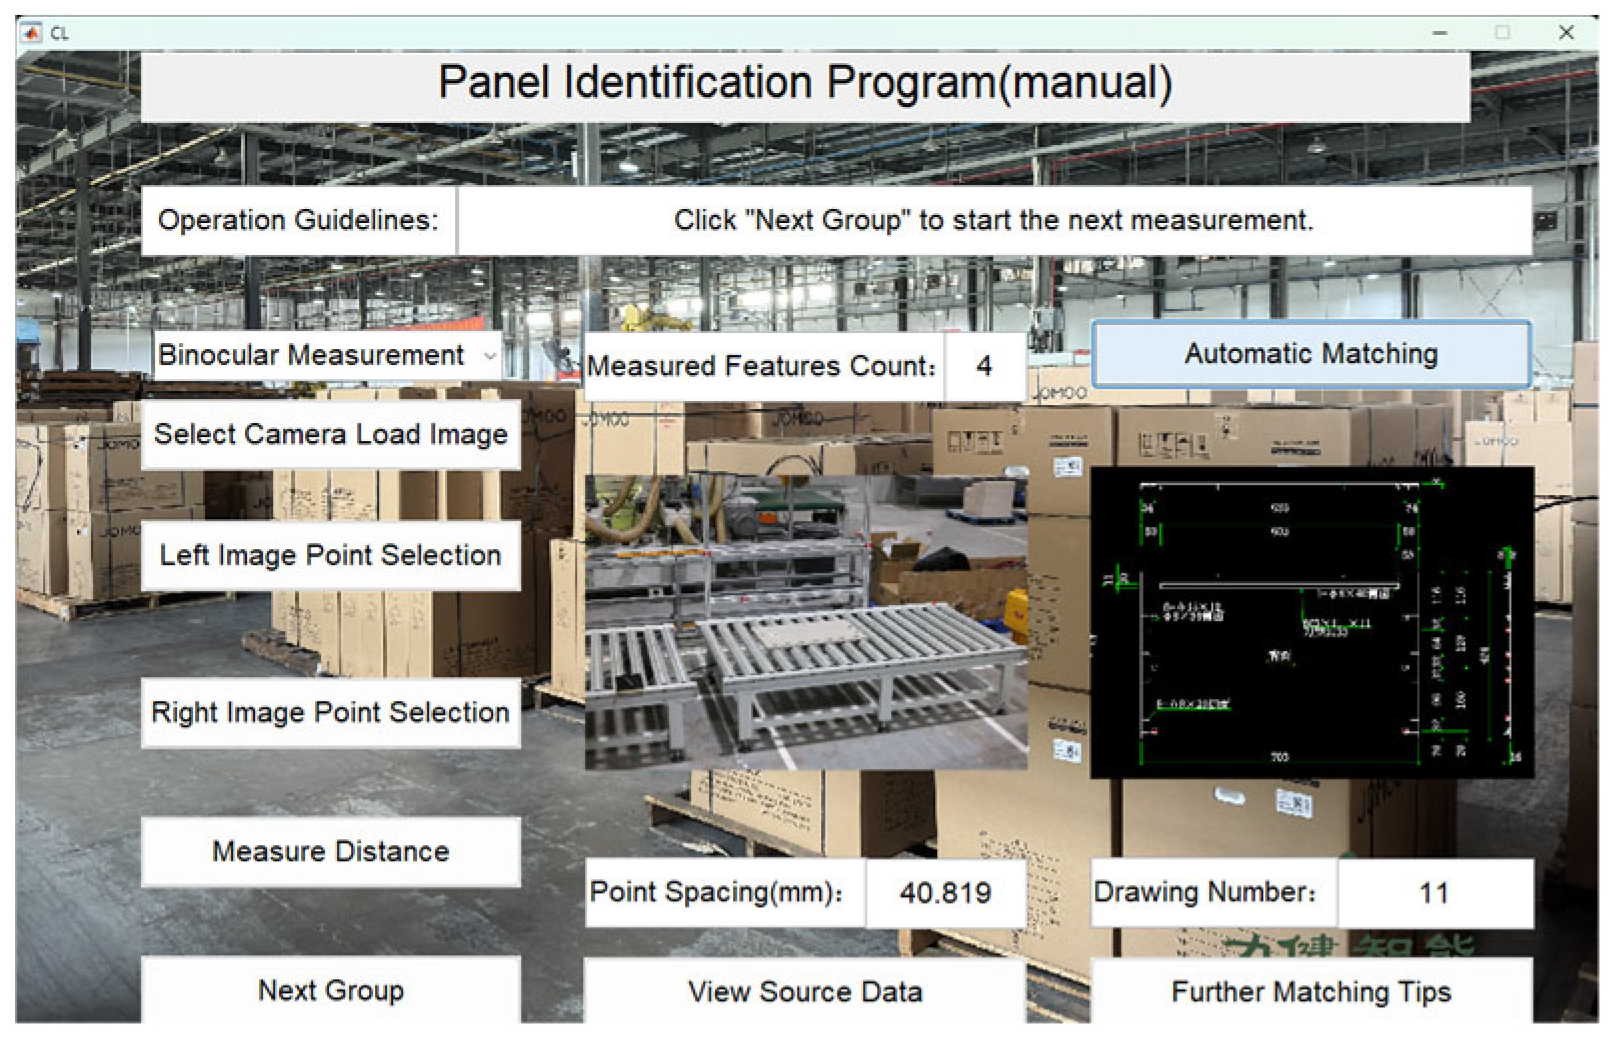
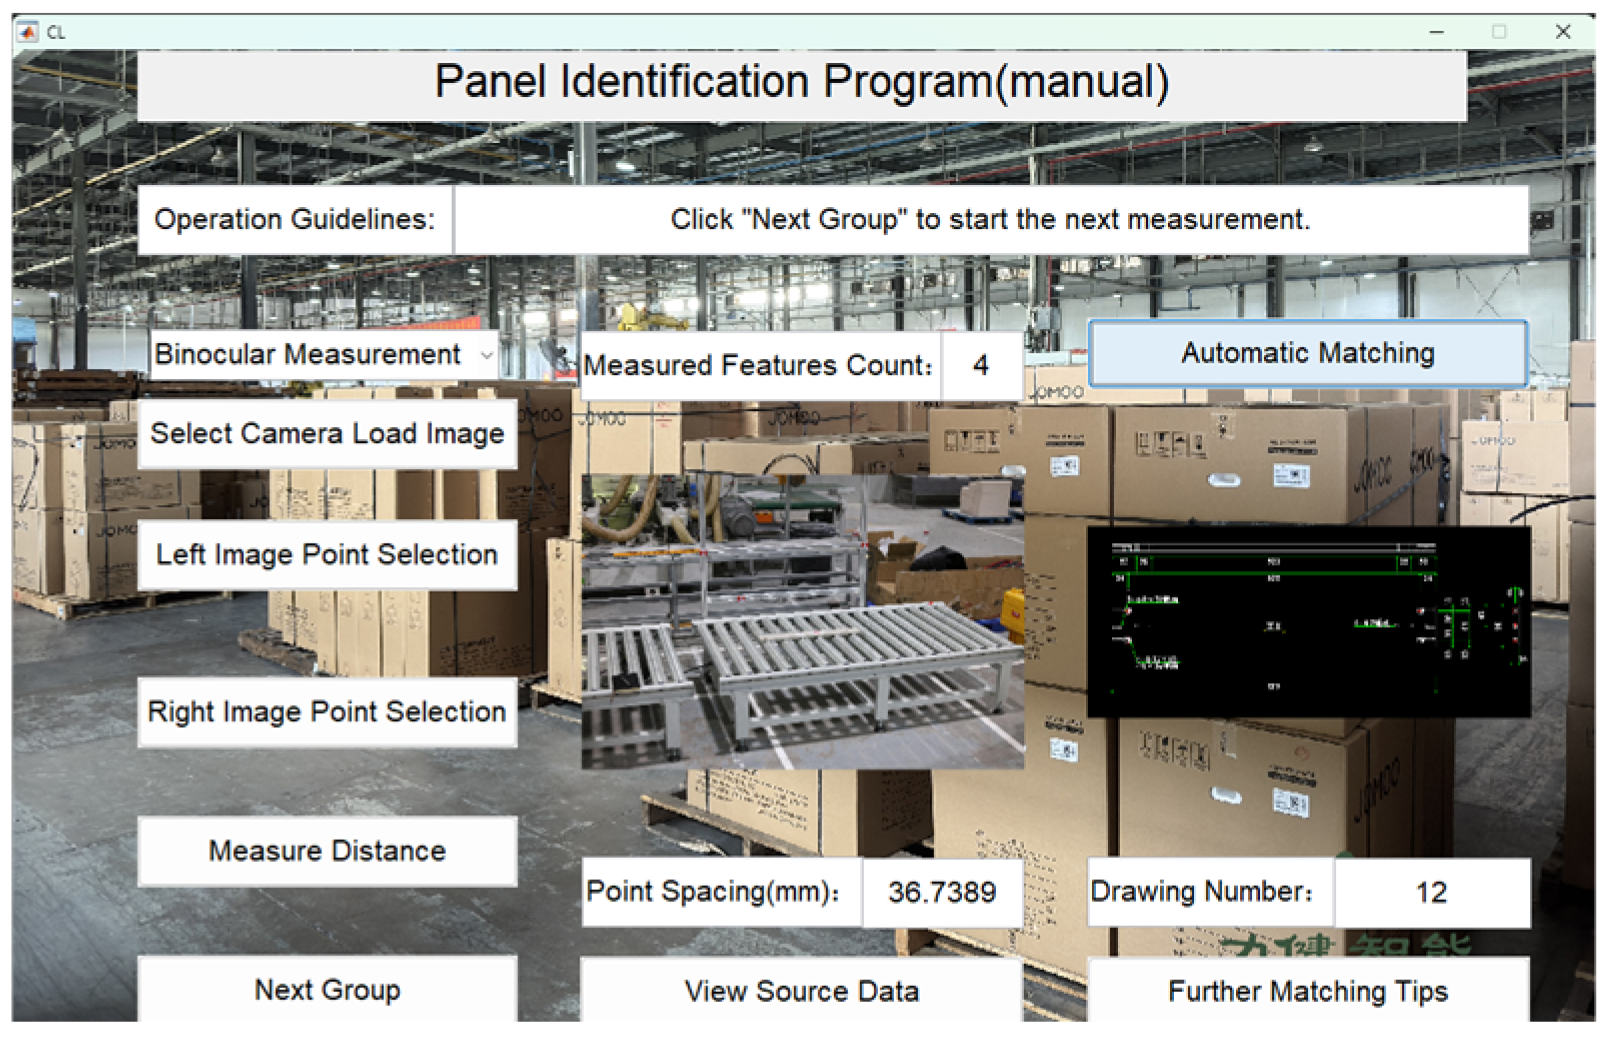
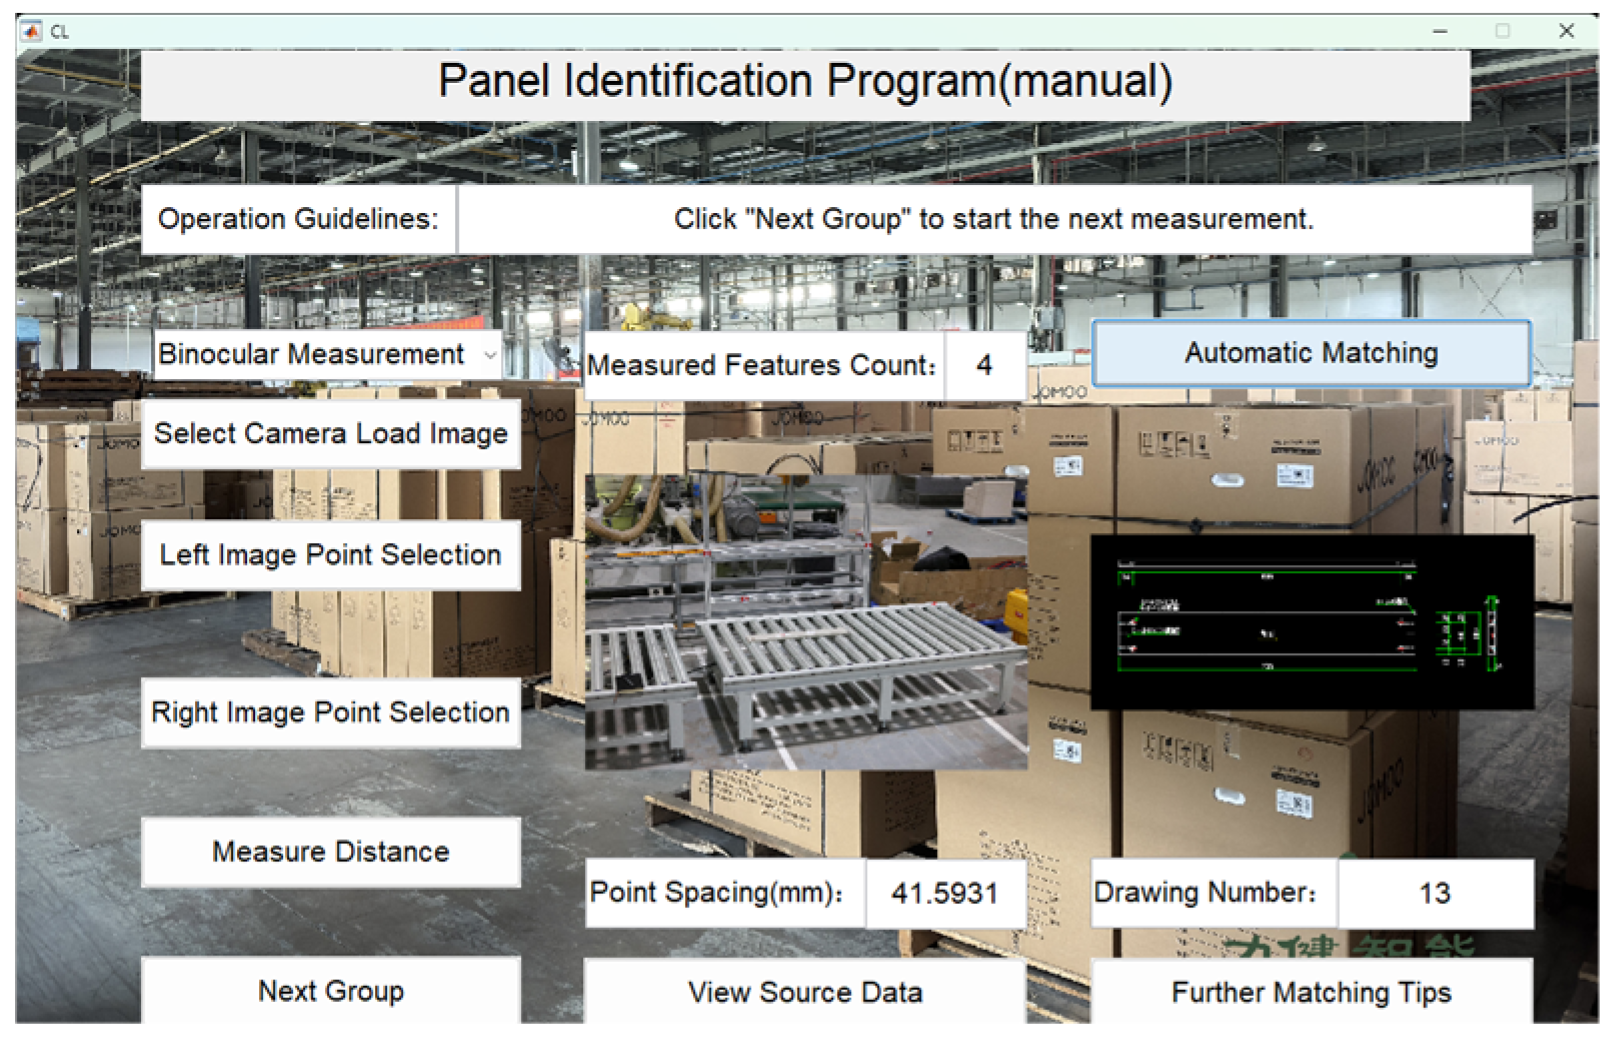
Figure 11.
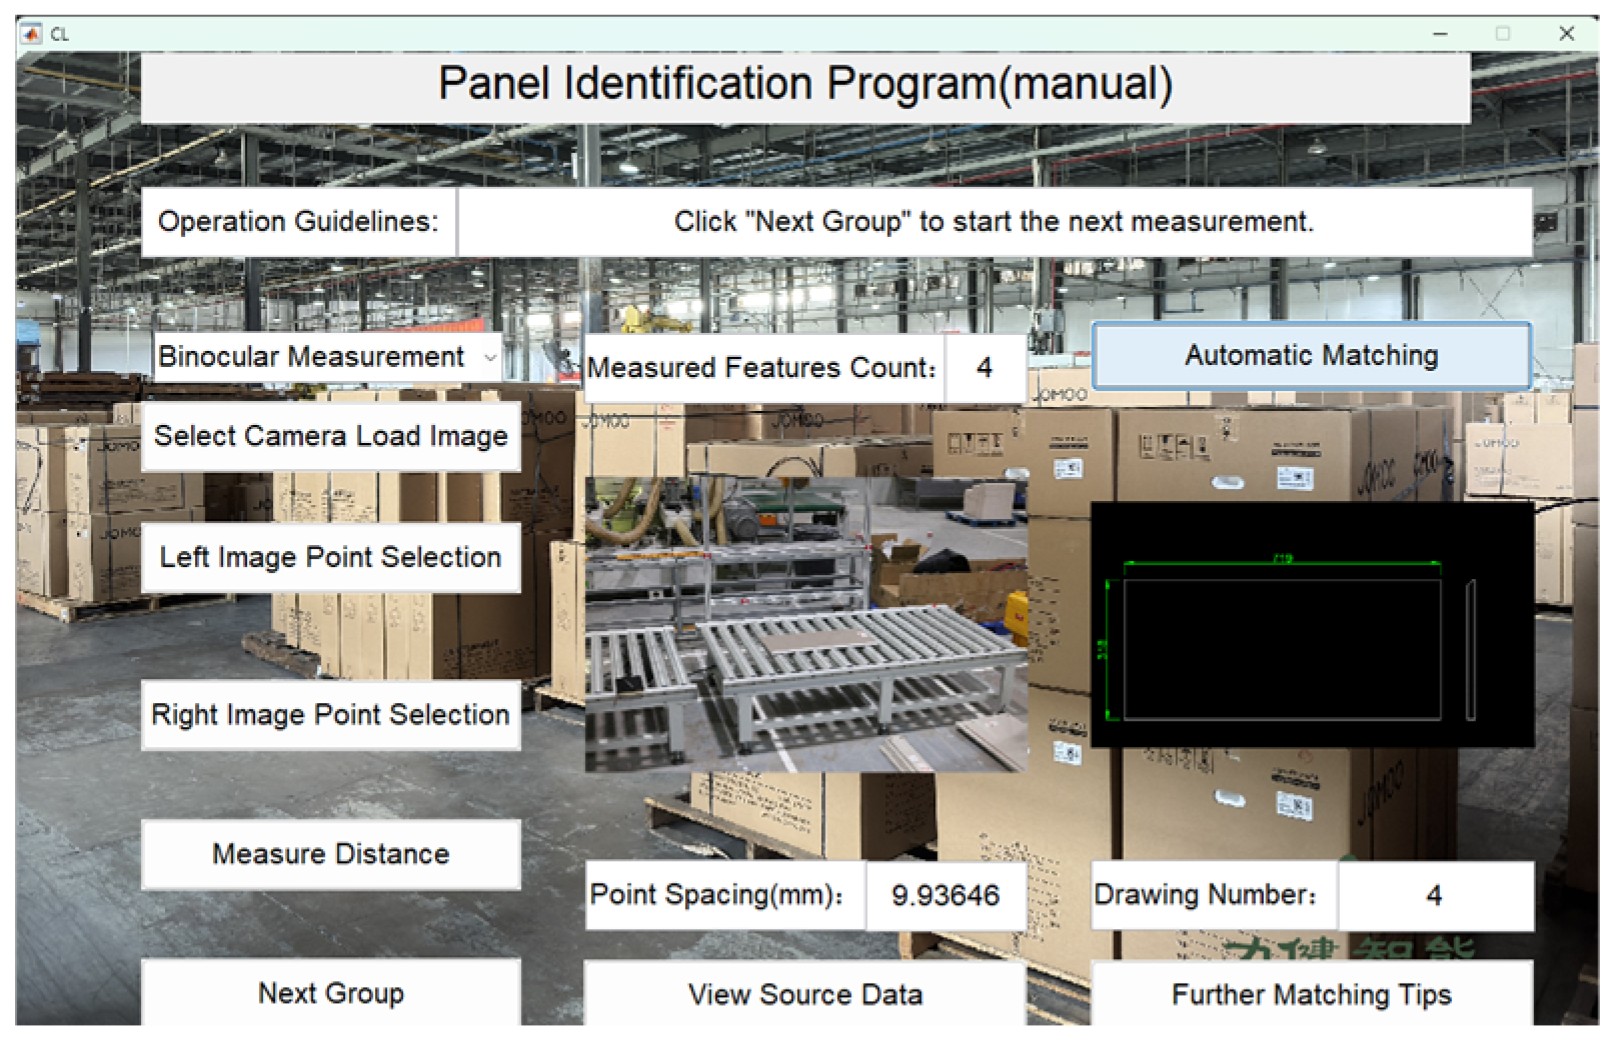
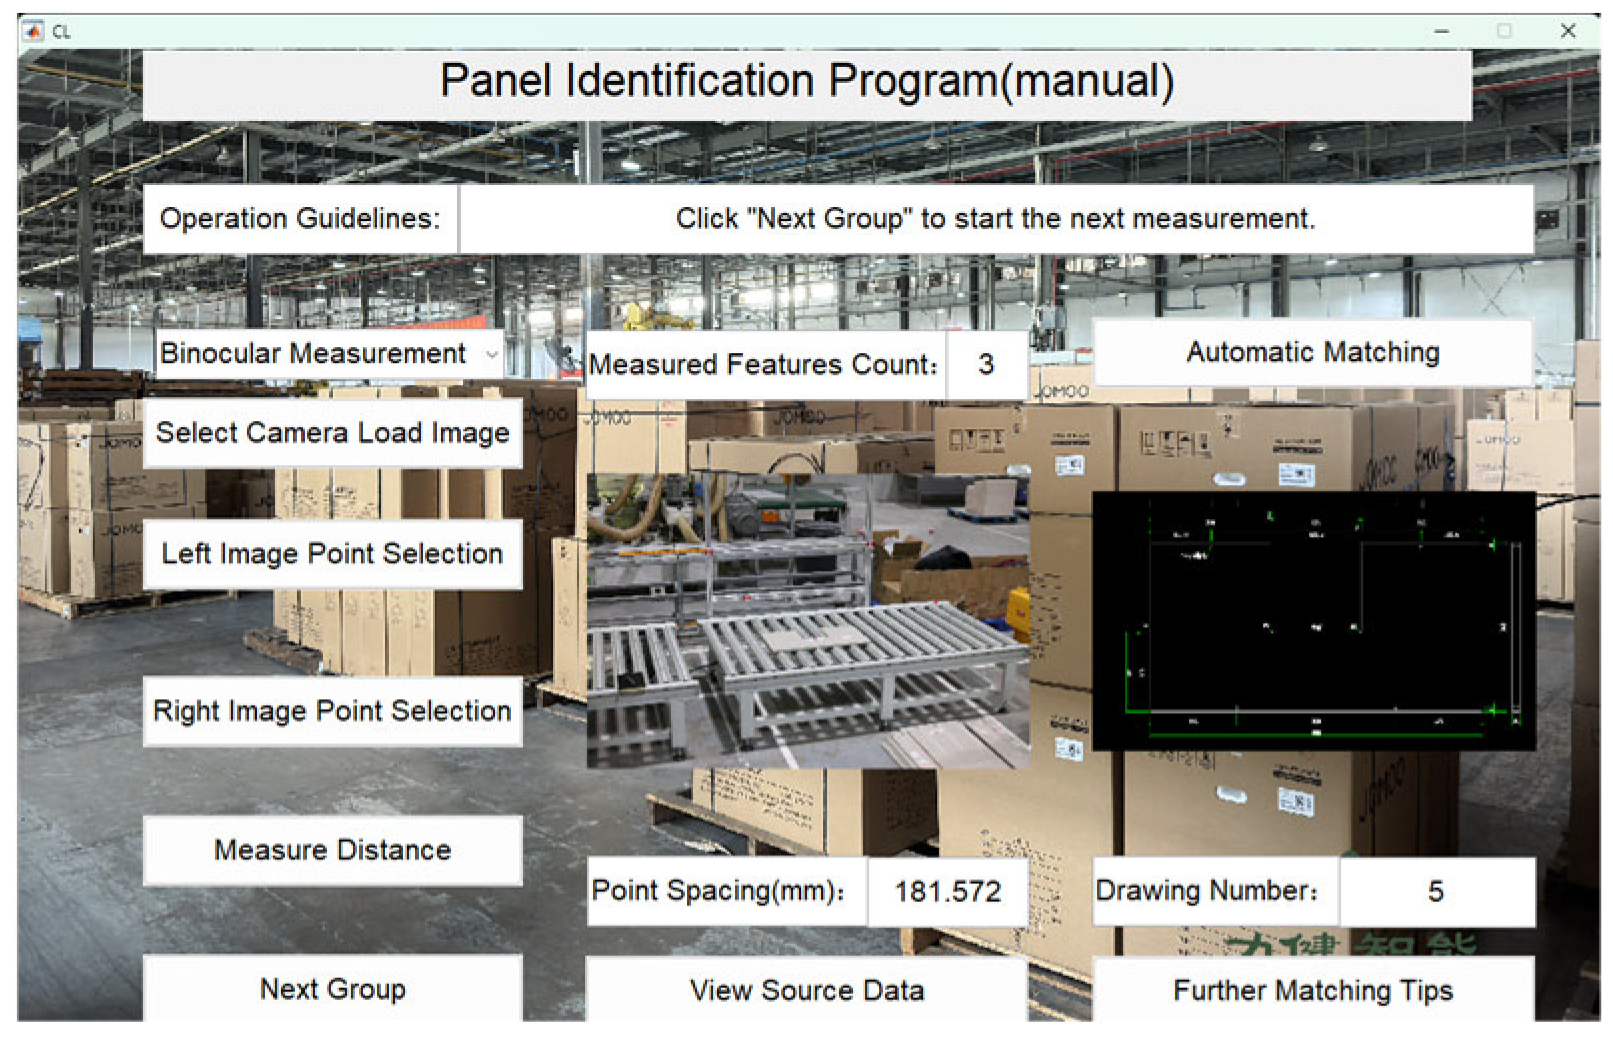
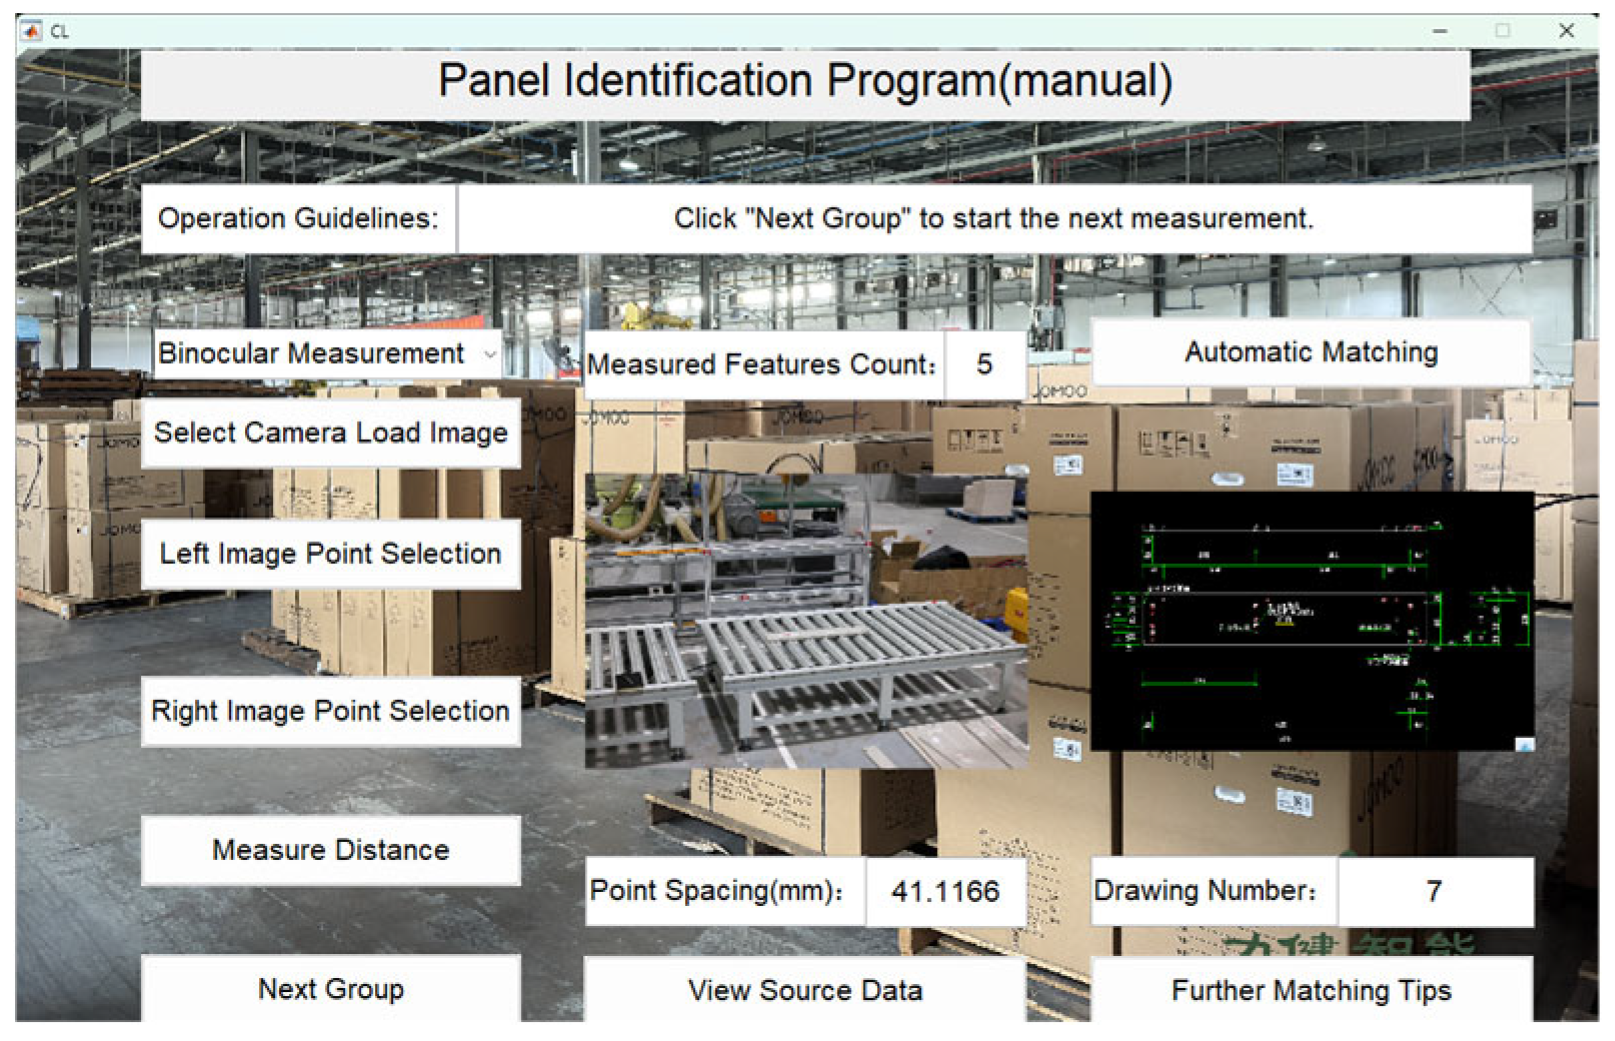
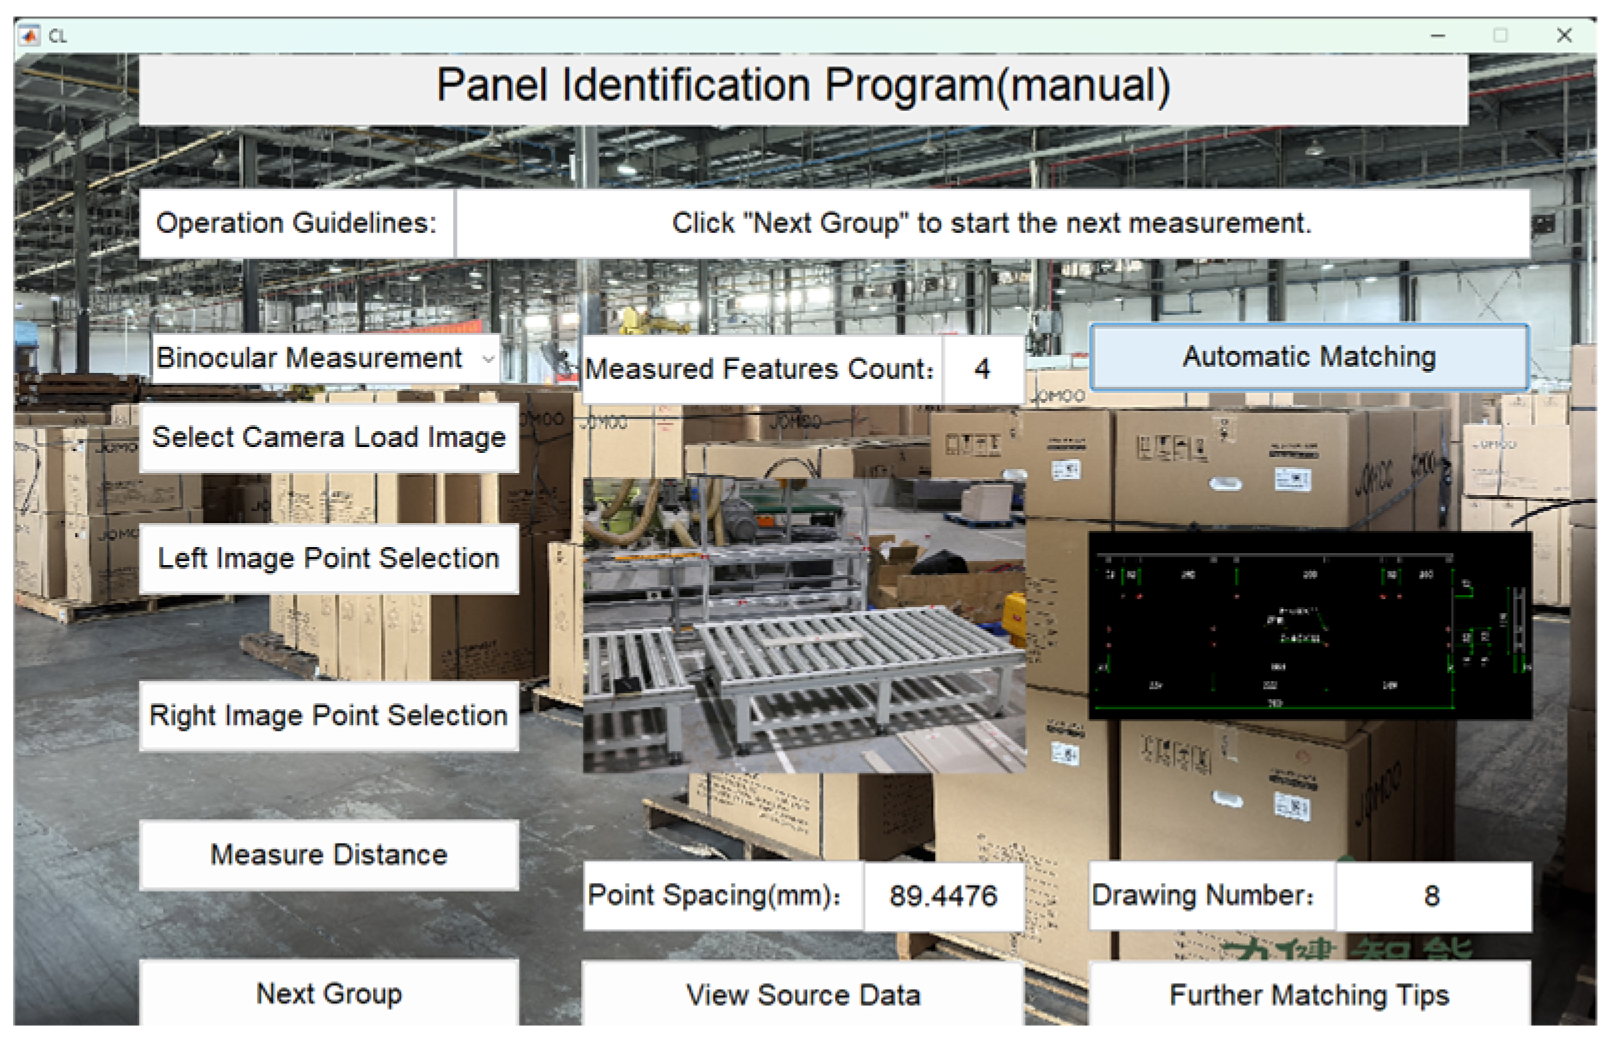
System User interface.
Figure 11.
System User interface.
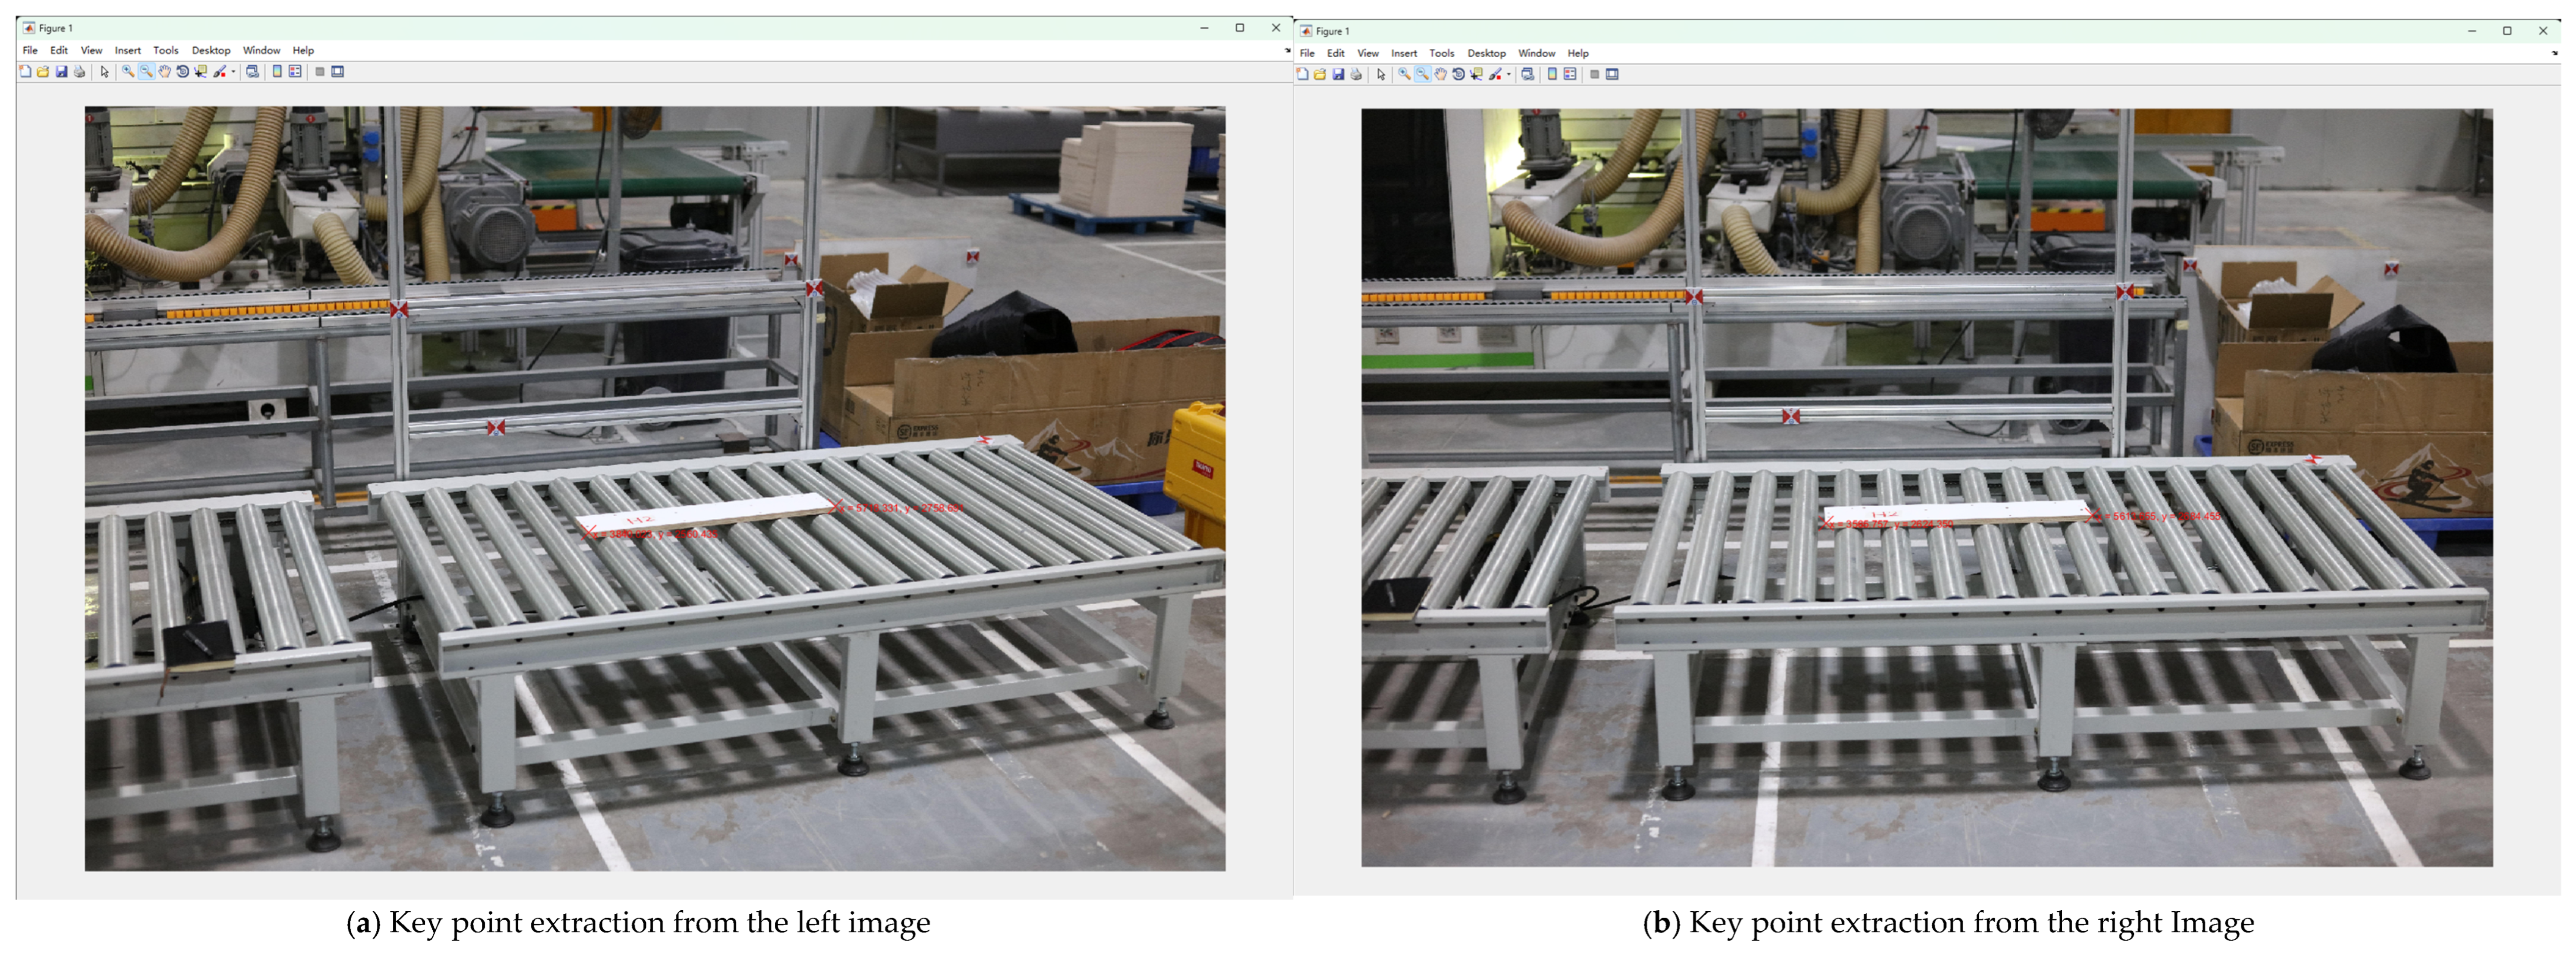
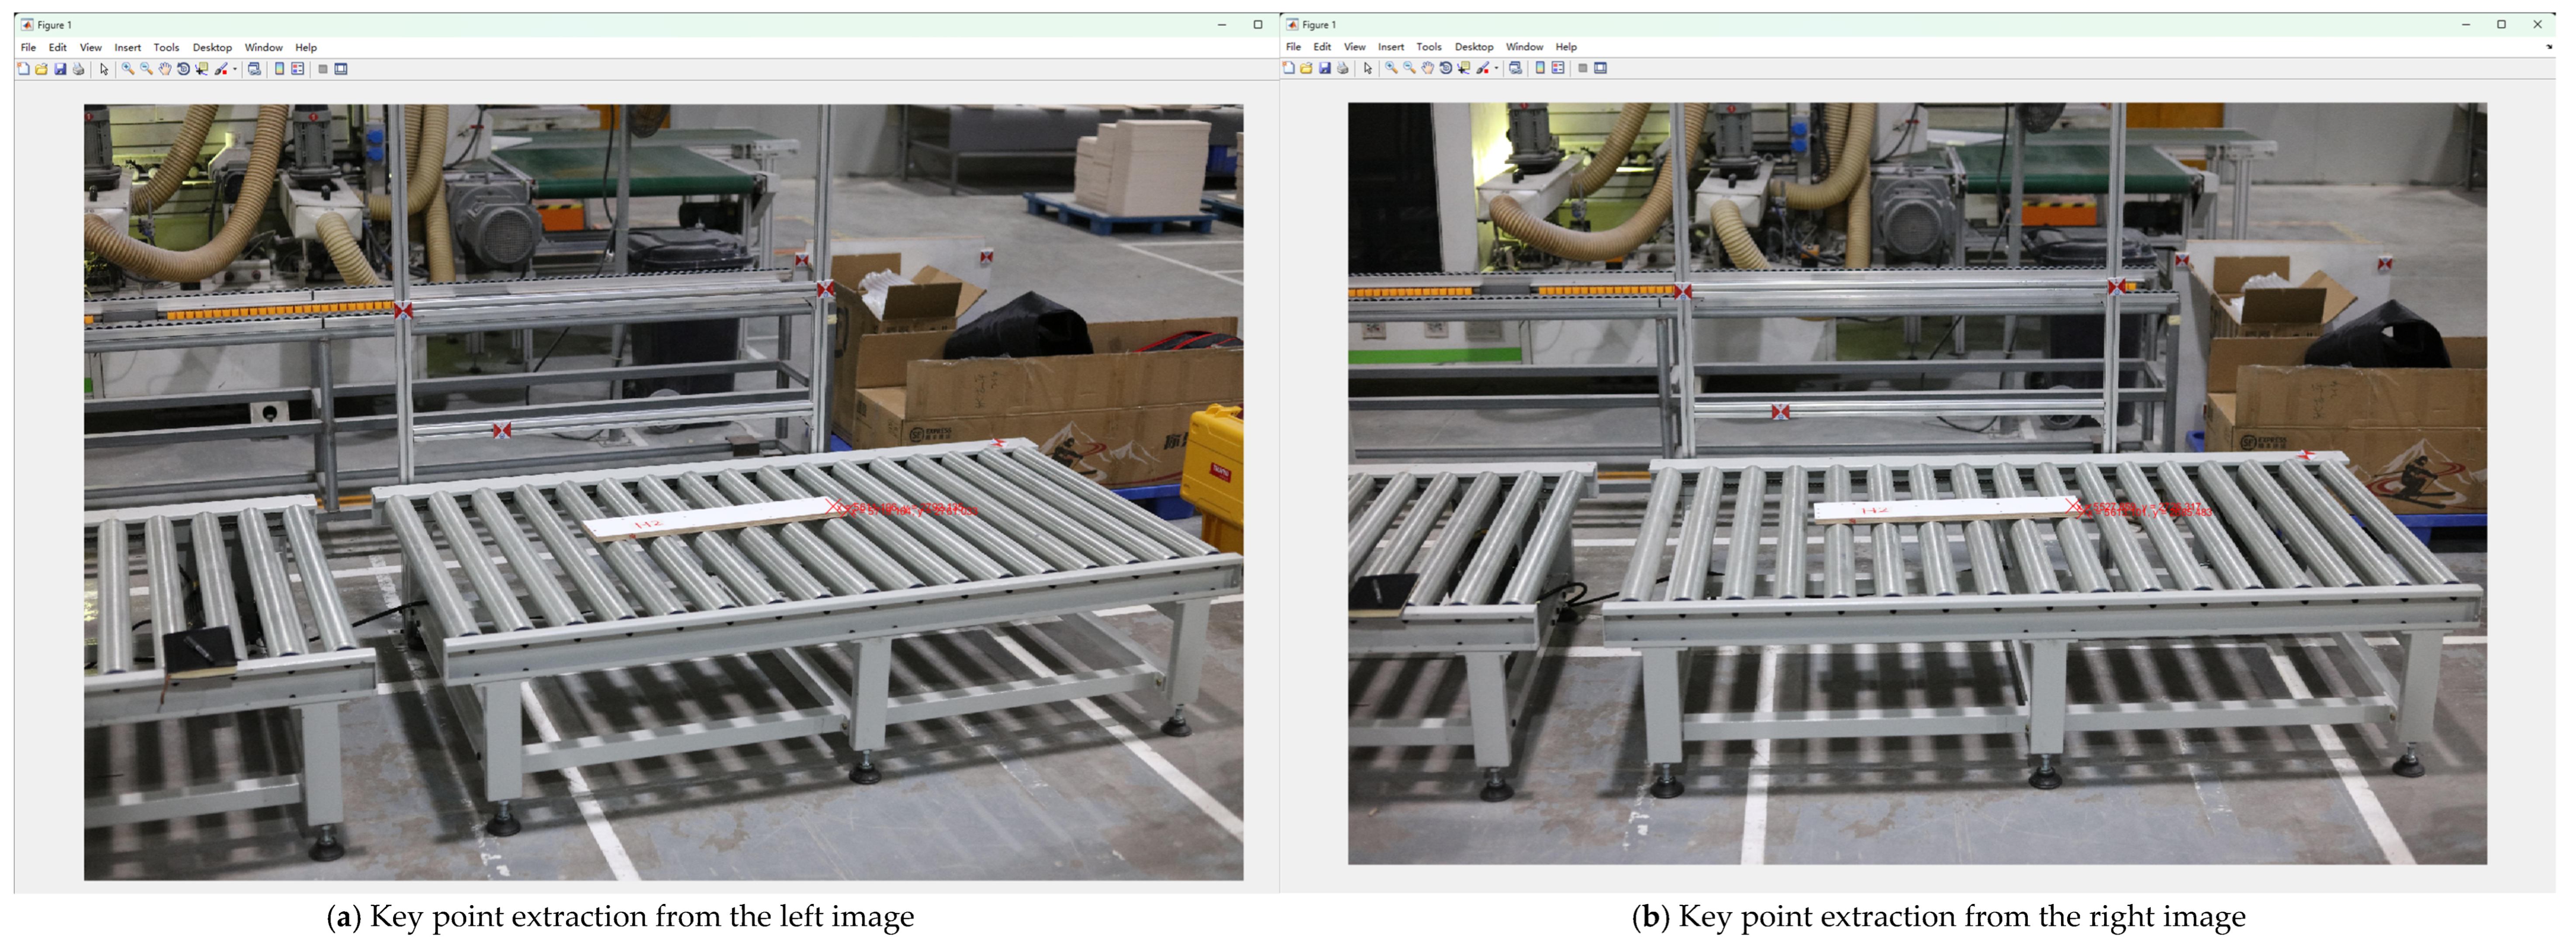
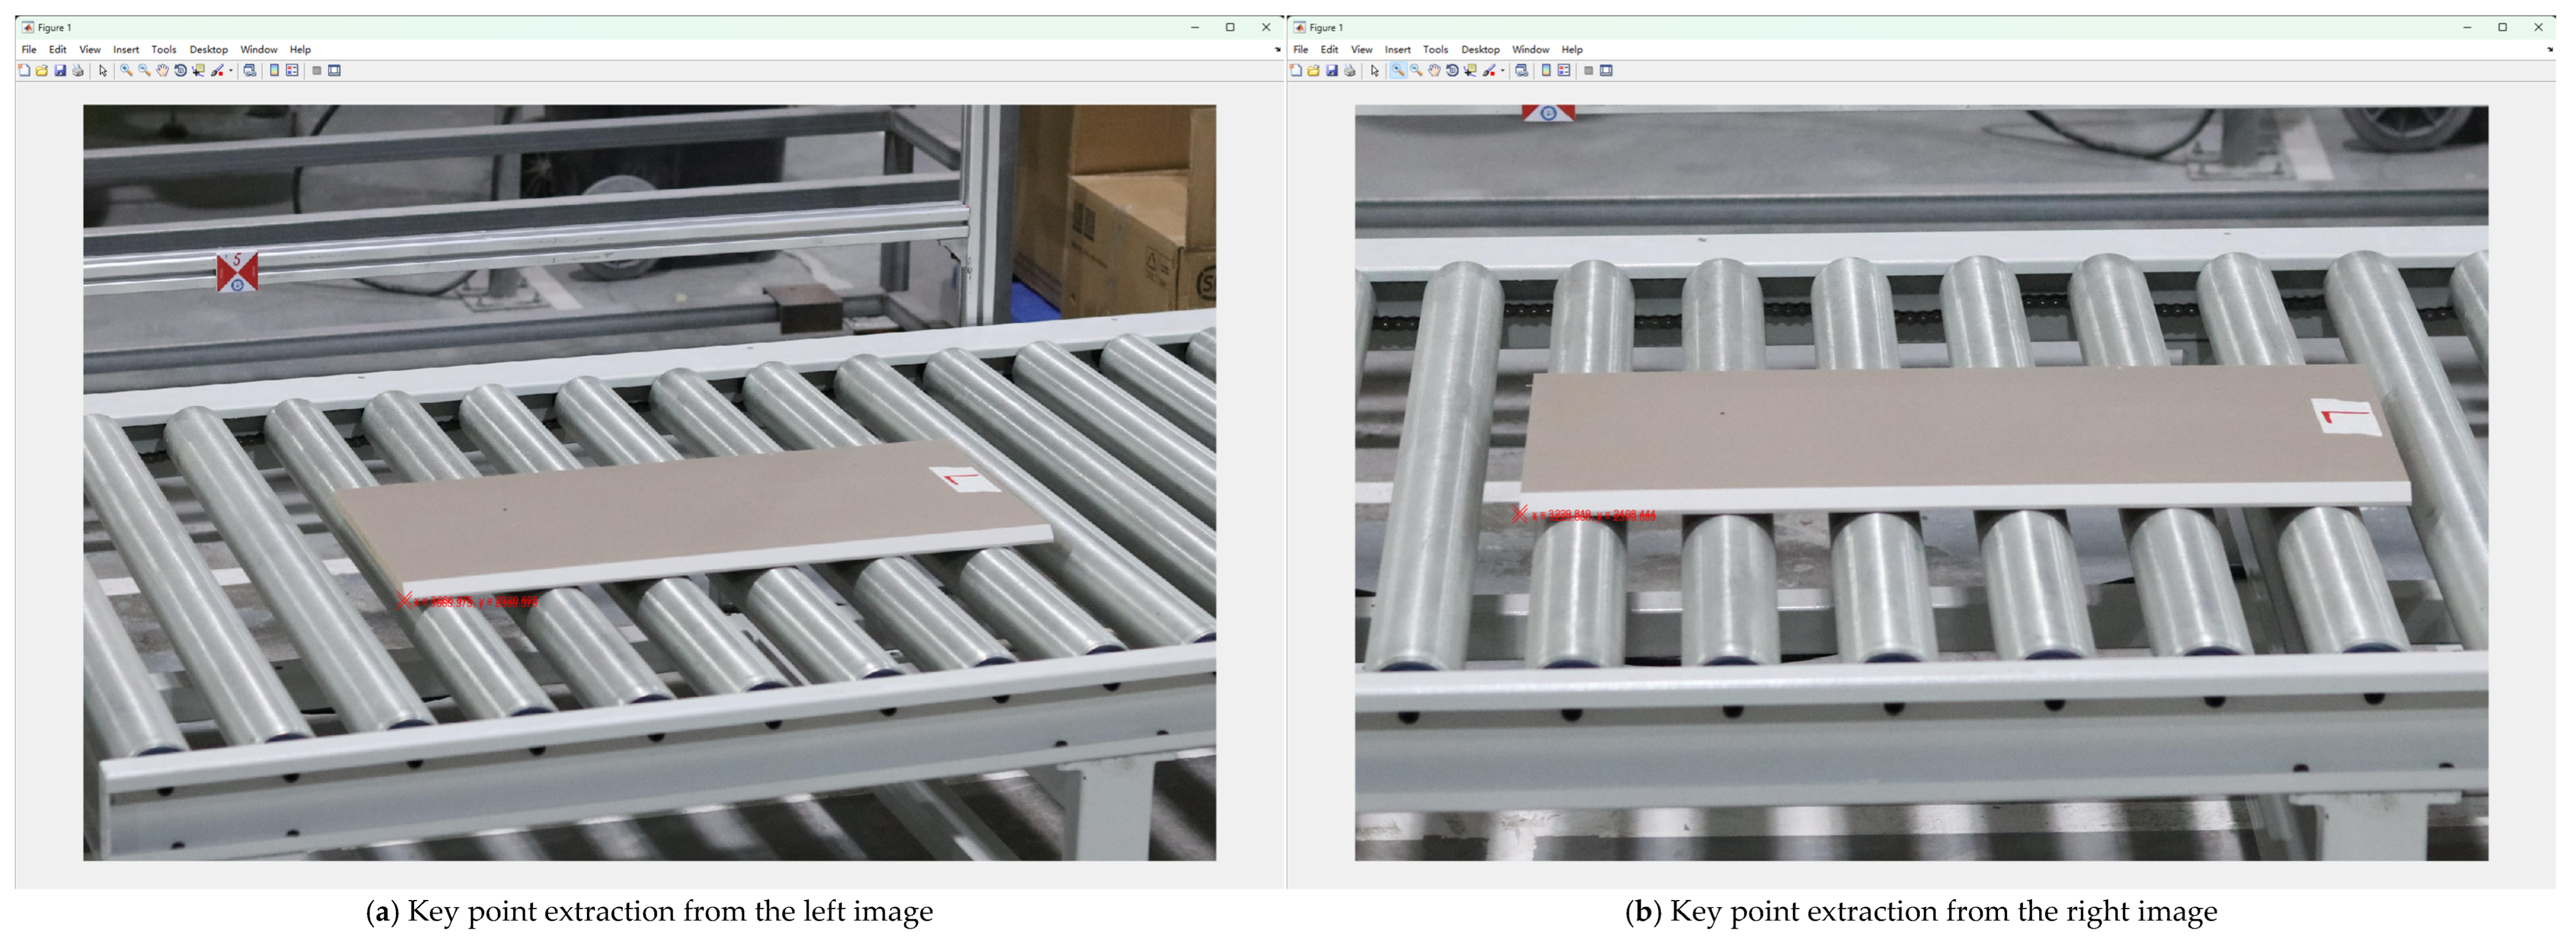
Figure 12.
Selection of the left image for the panel.
Figure 12.
Selection of the left image for the panel.
Figure 13.
Selection of the right image for the panel.
Figure 13.
Selection of the right image for the panel.
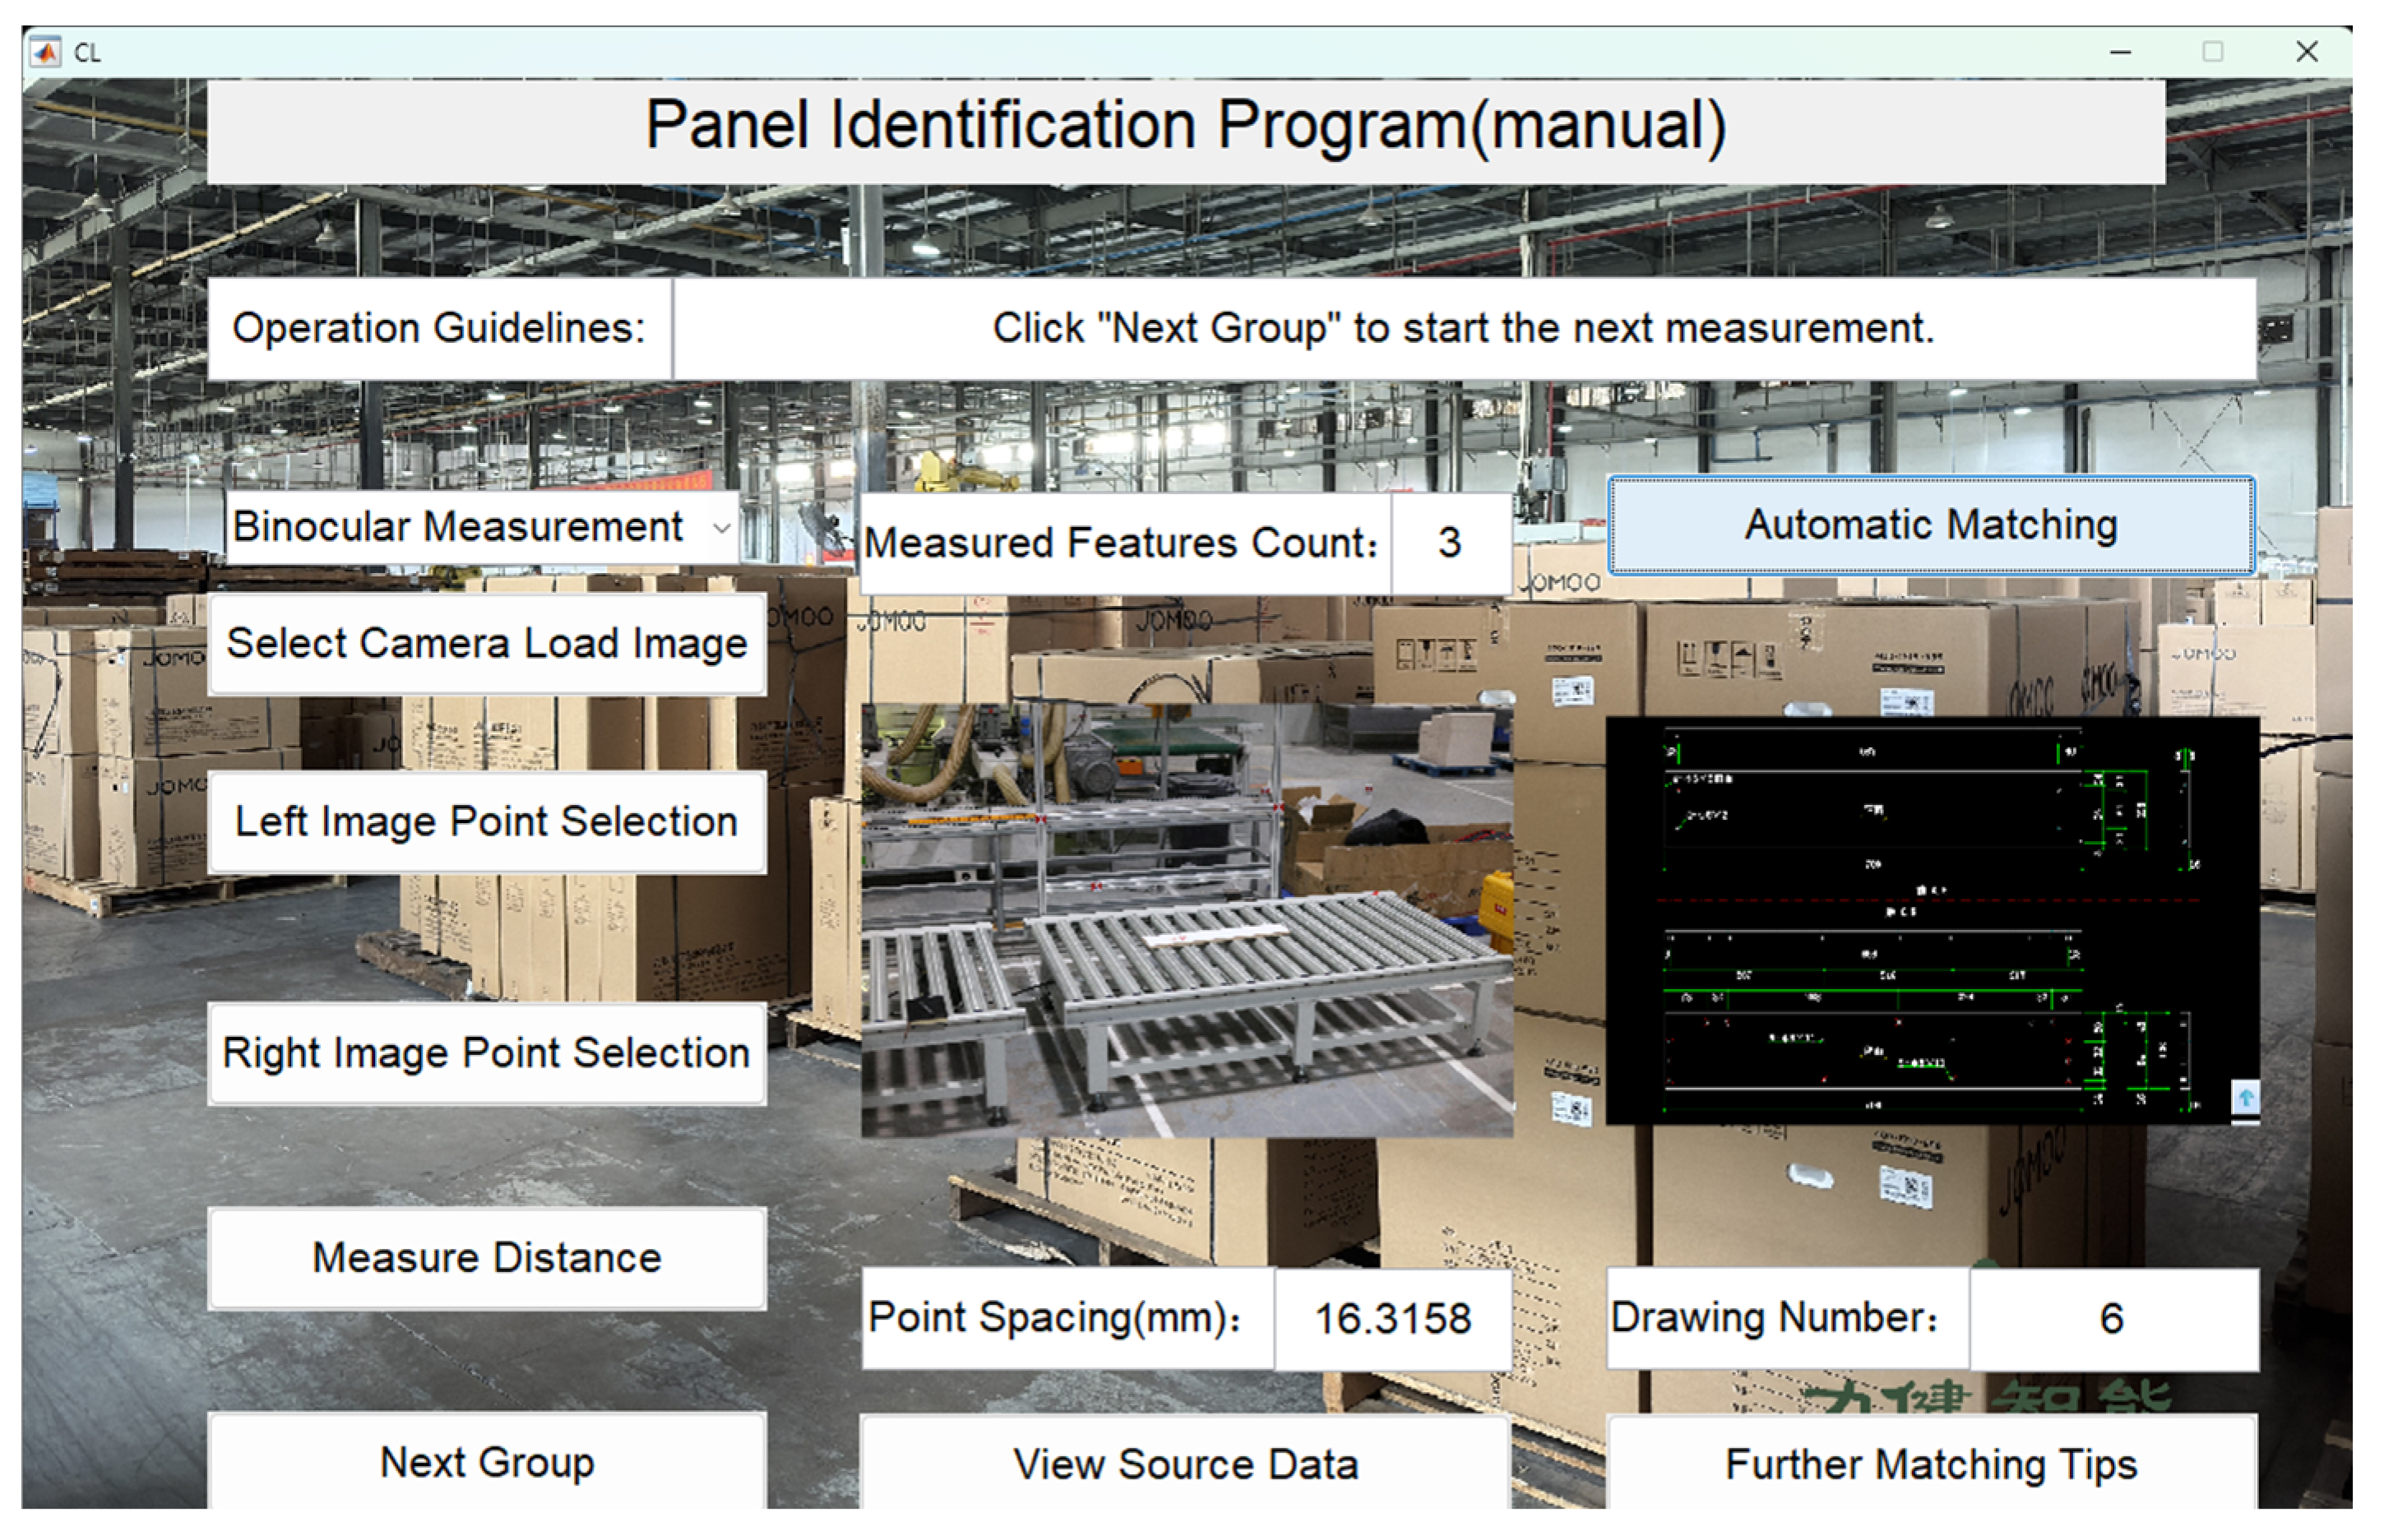
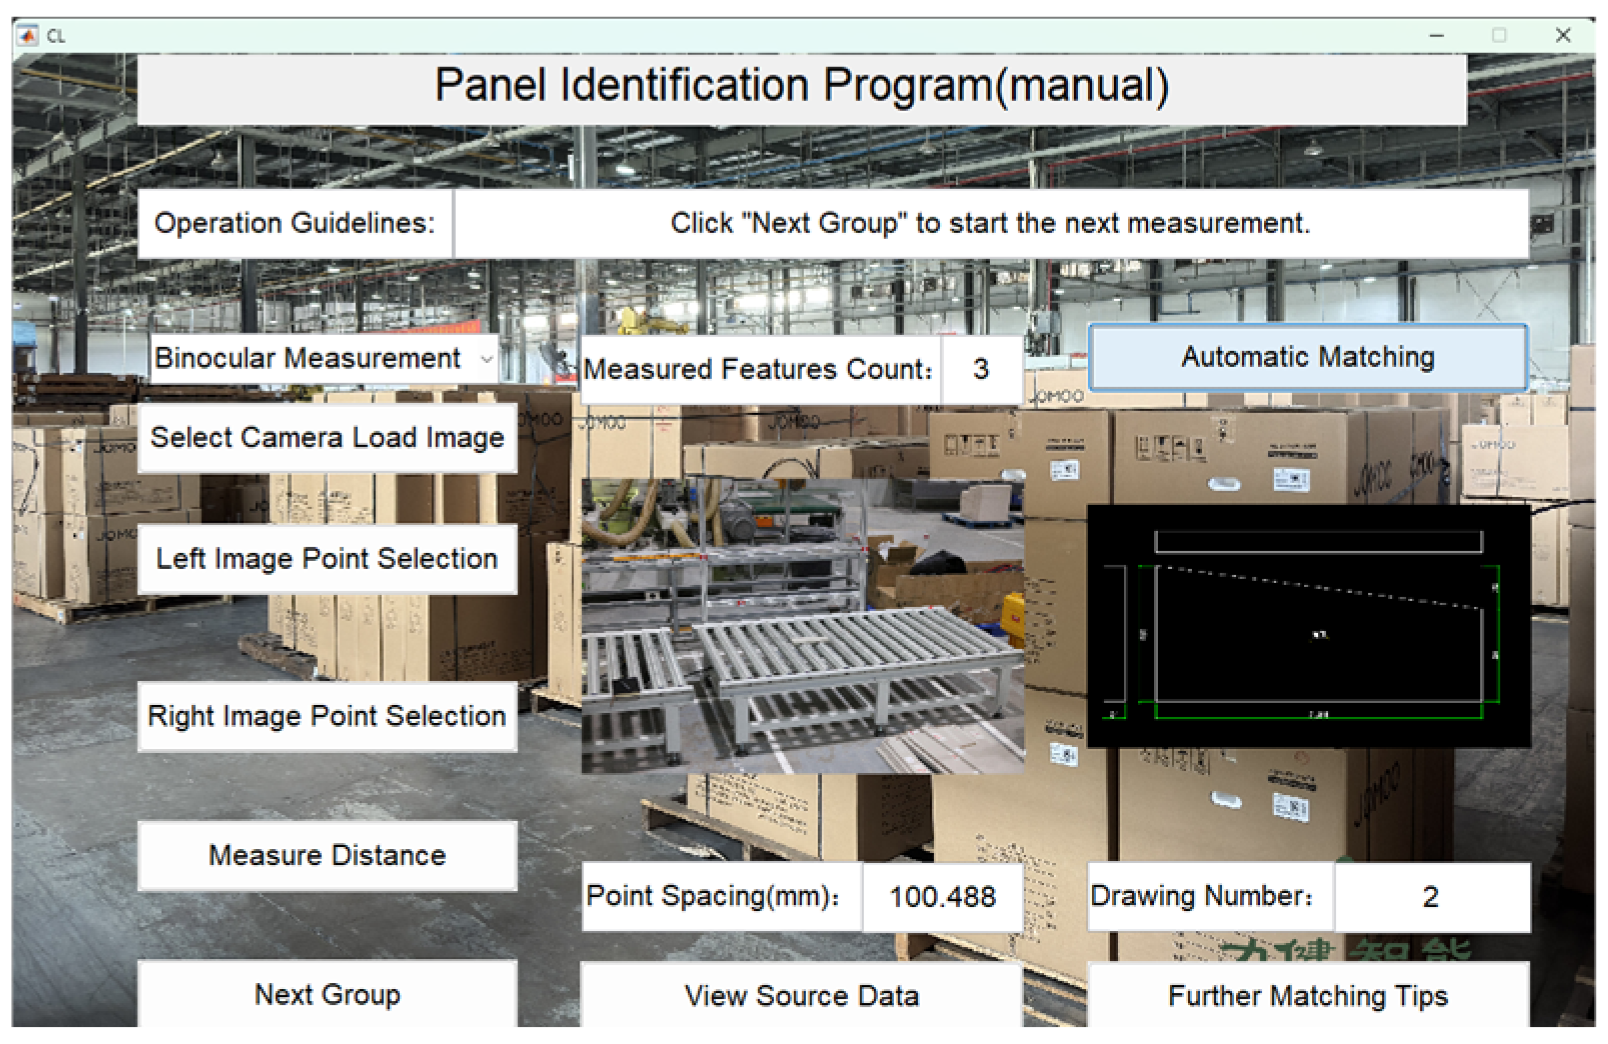
Figure 14.
Automatic Selection of Key Points for three-dimensional dimensions.
Figure 14.
Automatic Selection of Key Points for three-dimensional dimensions.
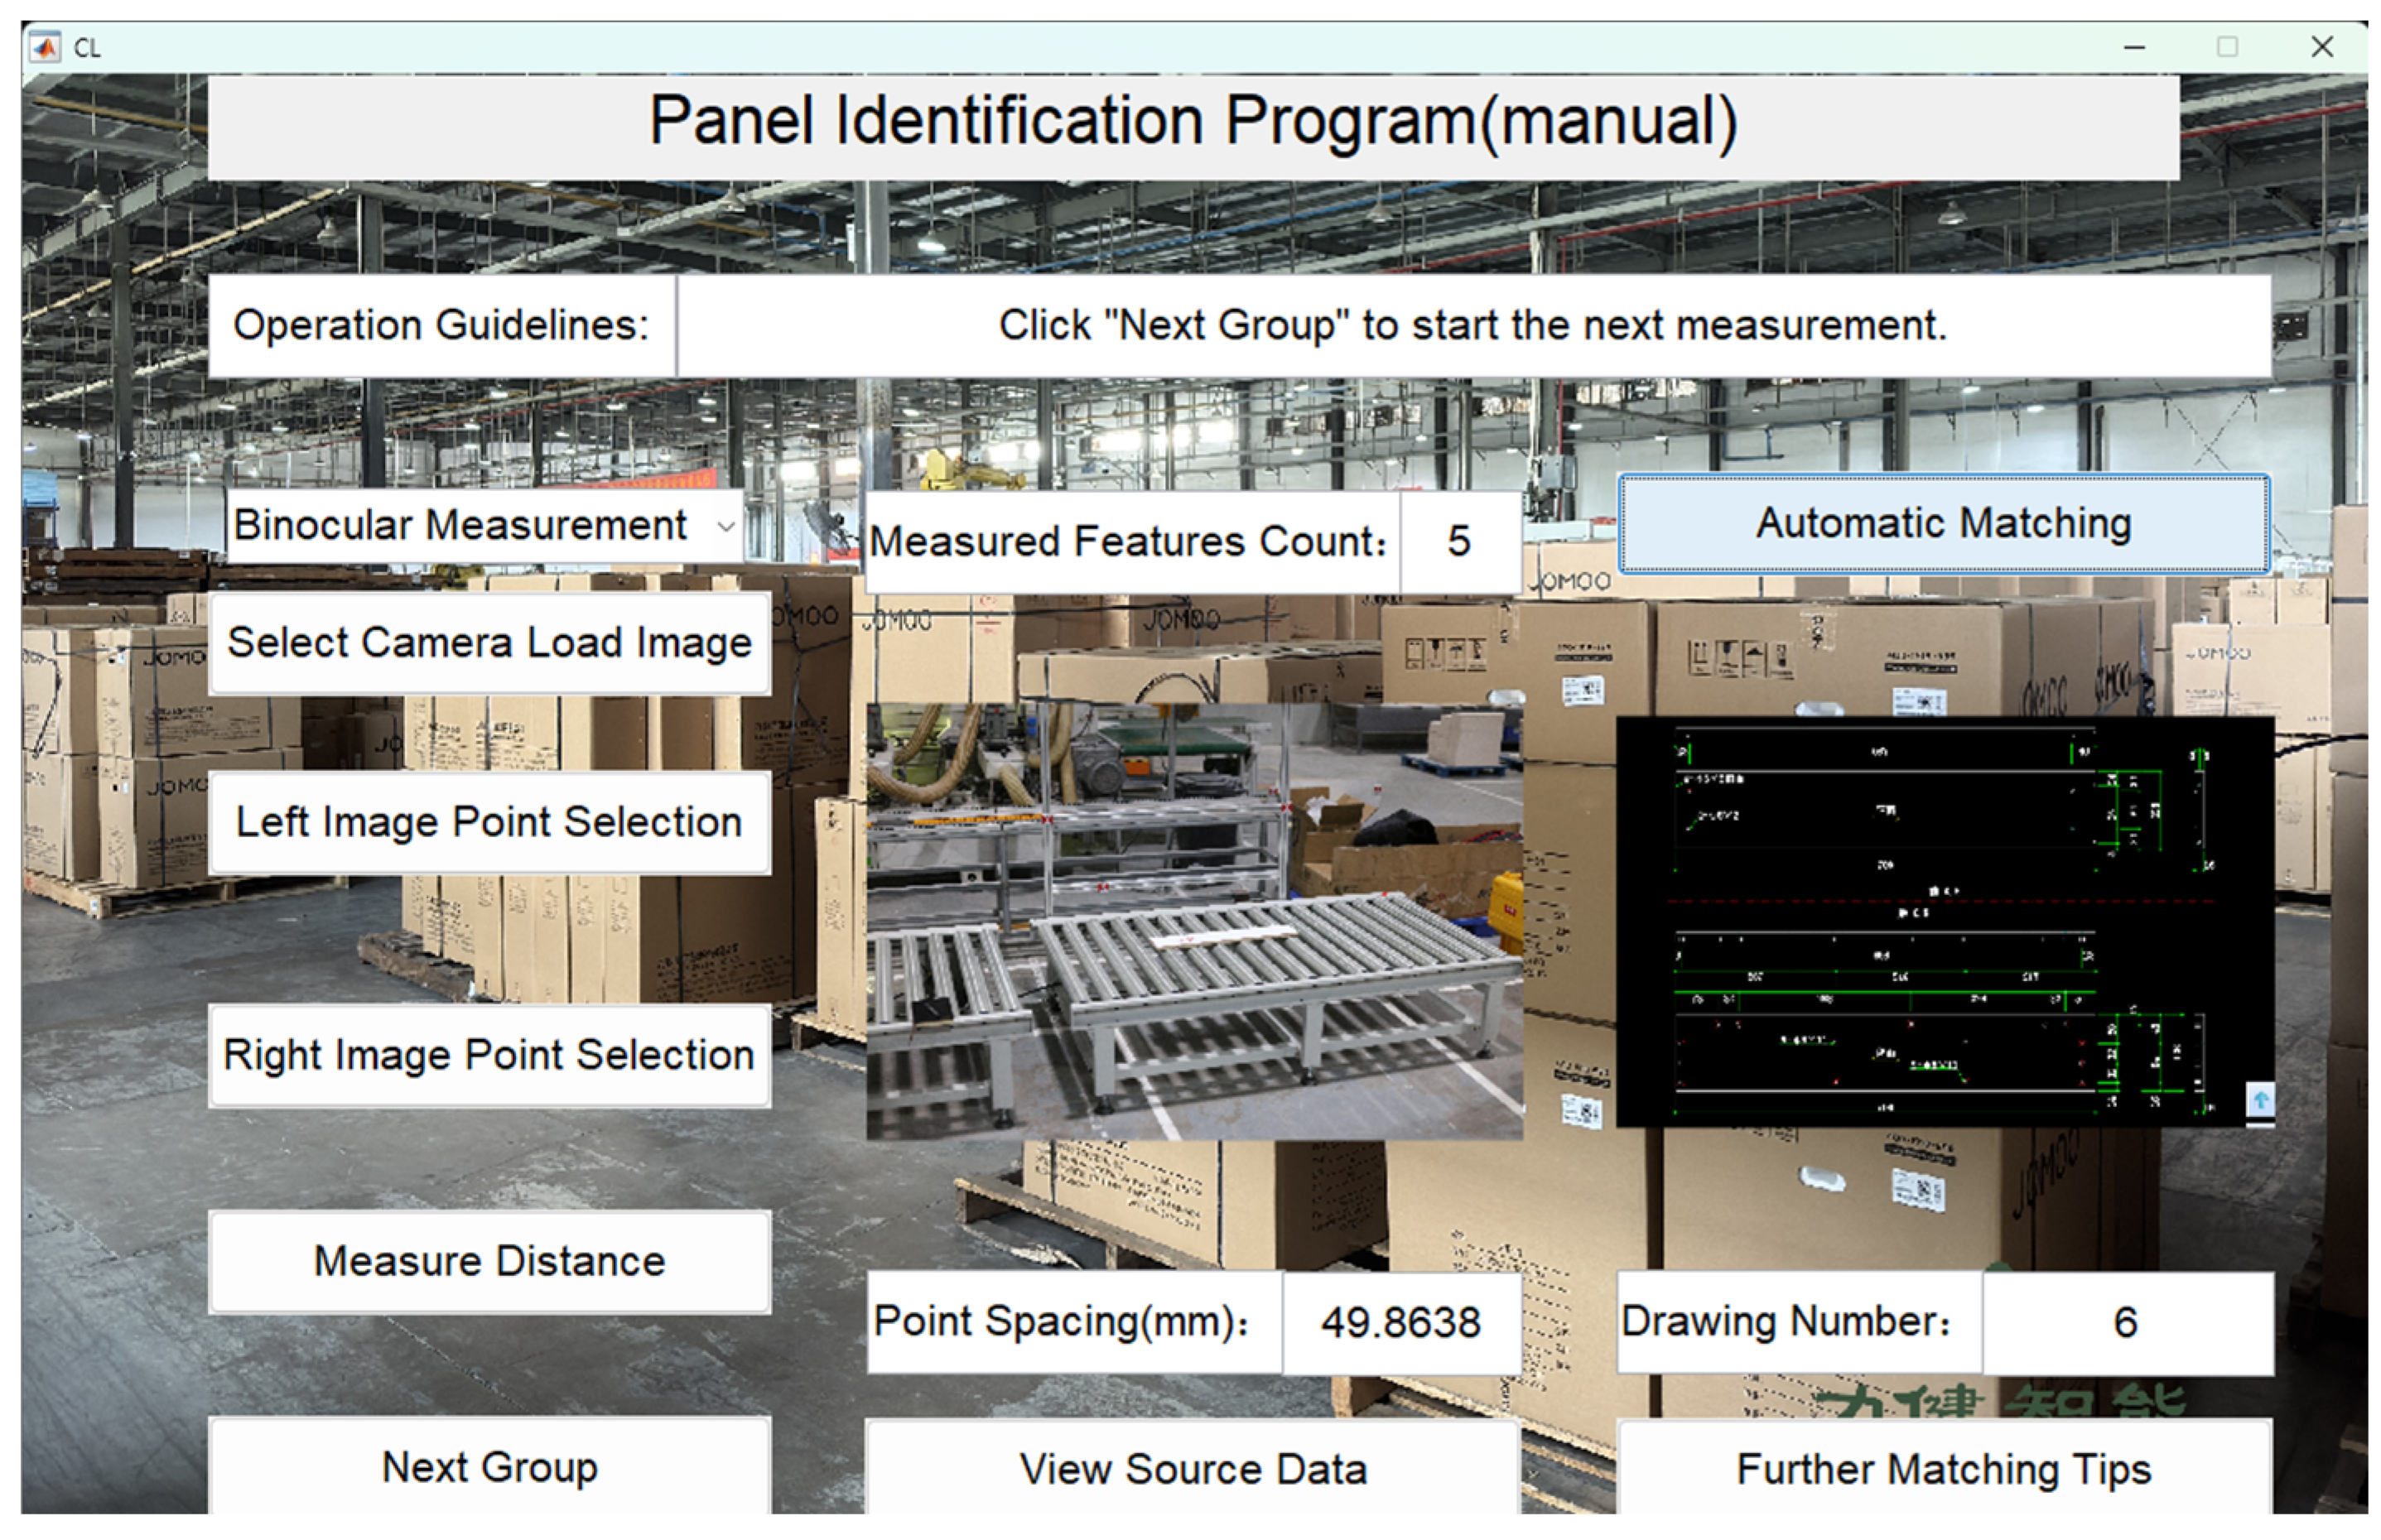
Figure 15.
Measurement results of three-dimensional data A.
Figure 15.
Measurement results of three-dimensional data A.
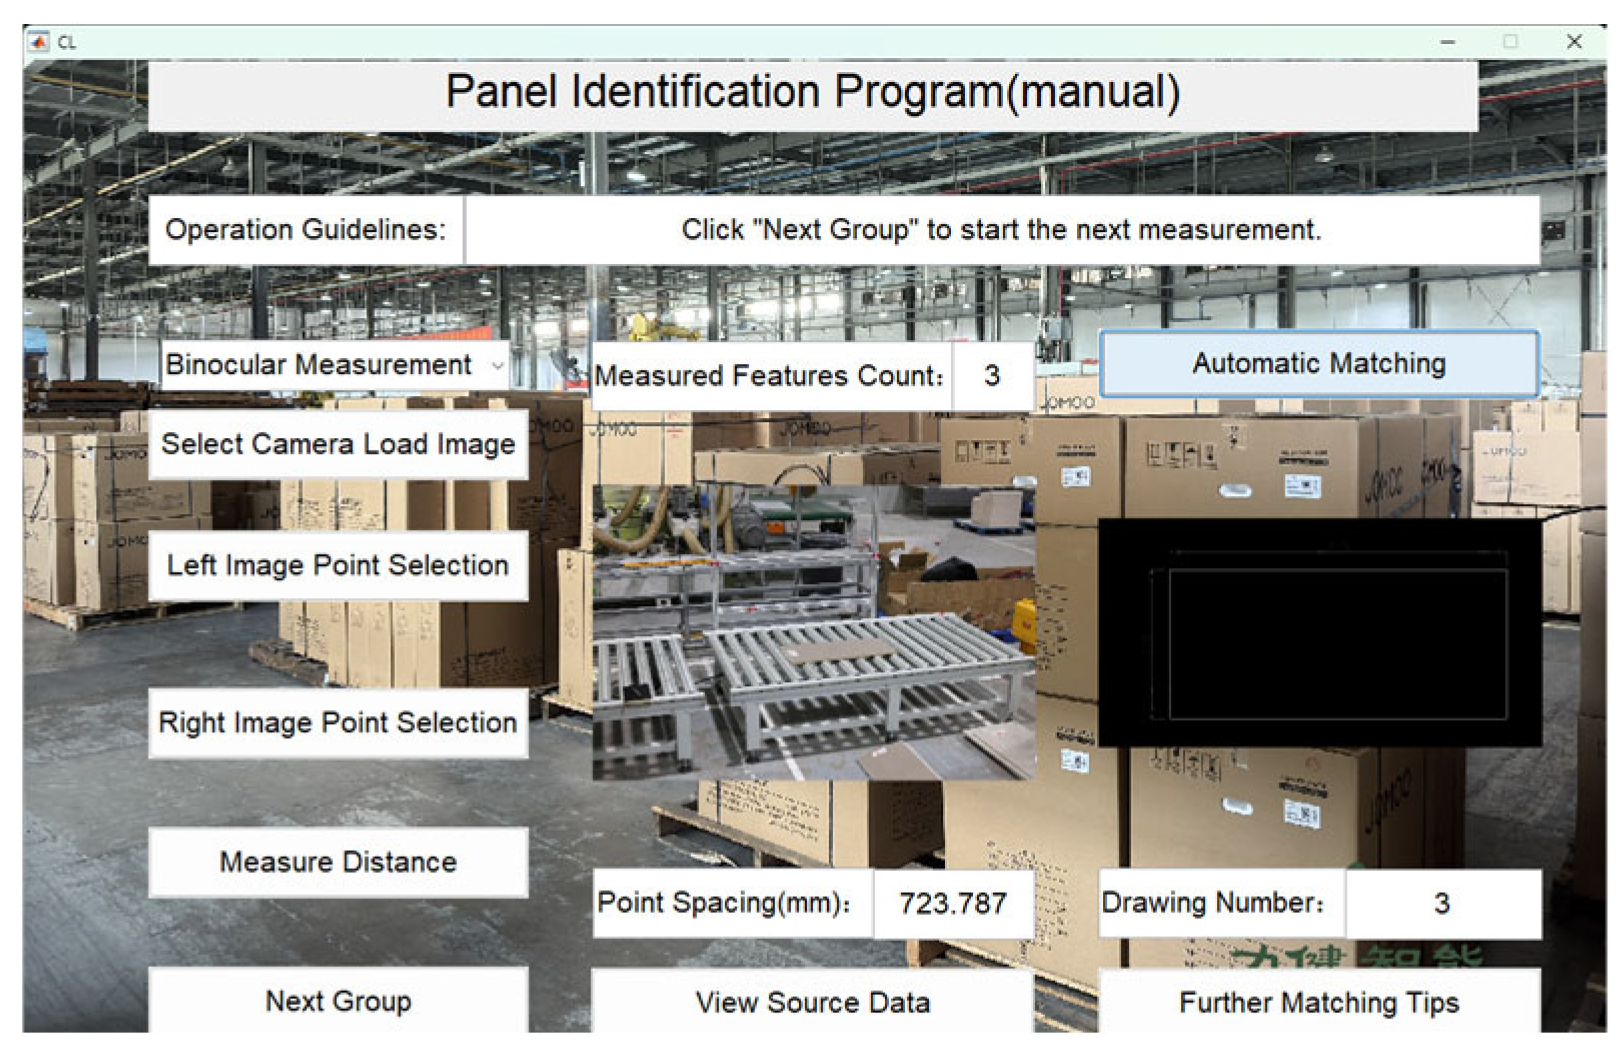
Figure 16.
Three-dimensional dimension matching result.
Figure 16.
Three-dimensional dimension matching result.
Figure 17.
Automatic selection key points for circle center.
Figure 17.
Automatic selection key points for circle center.
Figure 18.
Hole ID matching result.
Figure 18.
Hole ID matching result.
Figure 19.
Automatic selection of key points for minimum thickness.
Figure 19.
Automatic selection of key points for minimum thickness.
Figure 20.
Panel Minimum thickness matching result.
Figure 20.
Panel Minimum thickness matching result.
Figure 21.
Panel 1 recognition results.
Figure 21.
Panel 1 recognition results.
Figure 22.
Panel 2 recognition results.
Figure 22.
Panel 2 recognition results.
Figure 23.
Panel 3 recognition results.
Figure 23.
Panel 3 recognition results.
Figure 24.
Panel 4 recognition results.
Figure 24.
Panel 4 recognition results.
Figure 25.
Panel 5 recognition results.
Figure 25.
Panel 5 recognition results.
Figure 26.
Panel 6 recognition results.
Figure 26.
Panel 6 recognition results.
Figure 27.
Panel 7 recognition results.
Figure 27.
Panel 7 recognition results.
Figure 28.
Panel 8 recognition results.
Figure 28.
Panel 8 recognition results.
Figure 29.
Panel 9 recognition results.
Figure 29.
Panel 9 recognition results.
Figure 30.
Panel 10 recognition results.
Figure 30.
Panel 10 recognition results.
Figure 31.
Panel 11 recognition results.
Figure 31.
Panel 11 recognition results.
Figure 32.
Panel 12 recognition results.
Figure 32.
Panel 12 recognition results.
Figure 33.
Panel 13 recognition results.
Figure 33.
Panel 13 recognition results.
Table 1.
ID parameter table.
Table 1.
ID parameter table.
| Parameter Name | Symbol |
|---|
| Panel Length | |
| Panel Width | |
| Panel Height | |
| Panel Thickness 1 | |
| Panel Thickness 2 | |
| Vertical Distance Length | |
Table 2.
Experimental camera parameters.
Table 2.
Experimental camera parameters.
| Parameter Name | Parameter Value | Unit |
|---|
| CCD Resolution | 8688 × 5792 | (Pixel) |
| Pixel Size | 4.14 | (μm) |
Table 3.
First total station measurement of accurate object coordinates for each point.
Table 3.
First total station measurement of accurate object coordinates for each point.
| ID Number | x (mm) | y (mm) | z (mm) |
|---|
| 1-01 | 2823 | −880 | −495 |
| 2-06 | 2008 | 55 | −493 |
| 3-04 | 1930 | −1367 | −953 |
| 4-05 | 1418 | −798 | −954 |
| 5-15 | 2651 | −680 | −855 |
| 6-02 | 2017 | −753 | −955 |
| a-14 | 1883 | −871 | −956 |
| b-13 | 2250 | −850 | −957 |
| c-11 | 1962 | −511 | −958 |
| d-12 | 1947 | −1110 | −955 |
| e-09 | 1670 | −782 | −956 |
Table 4.
Second total station measurement of accurate object coordinates for each point.
Table 4.
Second total station measurement of accurate object coordinates for each point.
| ID Number | x (mm) | y (mm) | z (mm) |
|---|
| 1-01 | 2824 | −881 | −495 |
| 2-06 | 2008 | 54 | −493 |
| 3-04 | 1928 | −1366 | −955 |
| 4-05 | 1417 | −798 | −954 |
| 5-15 | 2650 | −681 | −854 |
| 6-02 | 2016 | −753 | −956 |
| a-14 | 1883 | −872 | −956 |
| b-13 | 2249 | −849 | −957 |
| c-11 | 1963 | −512 | −957 |
| d-12 | 1947 | −1109 | −956 |
| e-09 | 1671 | −782 | −956 |
Table 5.
The corrected precise coordinates of each point.
Table 5.
The corrected precise coordinates of each point.
| ID Number | x (mm) | y (mm) | z (mm) |
|---|
| 1-01 | 2824 | −881 | −495 |
| 2-06 | 2008 | 54 | −493 |
| 3-05 | 1417 | −798 | −954 |
| 4-15 | 2650 | −681 | −854 |
| 5-02 | 2016 | −753 | −956 |
| a-14 | 1883 | −872 | −956 |
| b-13 | 2249 | −849 | −957 |
| c-11 | 1963 | −512 | −957 |
| d-12 | 1947 | −1109 | −956 |
| e-09 | 1671 | −782 | −956 |
Table 6.
Selection criteria for experiment thresholds.
Table 6.
Selection criteria for experiment thresholds.
| Parameter | Numerical Value |
|---|
| 0.000001 (mm) |
Table 7.
Focal length calibration results.
Table 7.
Focal length calibration results.
| Parameter | Numerical Value |
|---|
| 52.05 (mm) |
| 52.55 (mm) |
Table 8.
Image plane coordinates of each point in the photo simulation experiment.
Table 8.
Image plane coordinates of each point in the photo simulation experiment.
| ID | x-Left (mm) | y-Left (mm) | x-Right (mm) | y-Right (mm) |
|---|
| 1 | −5.600044238 | −8.082202539 | −6.031084531 | −7.410901687 |
| 2 | −6.265159987 | 5.034409585 | −6.184379244 | 6.300438813 |
| 3 | 3.032502834 | −2.727999793 | 2.636656228 | −5.260747147 |
| 4 | 2.132742539 | 6.756623872 | 2.50582557 | 4.935417982 |
| 5 | −1.901831743 | −5.009733793 | −2.243794569 | −4.319802751 |
| 6 | 0.635977511 | 0.491189187 | 0.573916815 | −0.155416181 |
| a | 1.318525367 | 1.141089283 | 1.280665946 | −0.074186157 |
| b | 0.448717146 | −2.411705894 | 0.198737139 | −2.844603216 |
| c | 0.014052652 | 2.422319188 | 0.097439226 | 2.3018819 |
| d | 2.000953415 | −1.069373758 | 1.774036504 | −2.817556493 |
| e | 1.492247395 | 3.971440441 | 1.659020541 | 2.624855111 |
Table 9.
Exterior orientation calculation results before pointer point selection.
Table 9.
Exterior orientation calculation results before pointer point selection.
| | Left Image | Right Image |
|---|
| −113.2183781 (mm) | 5422.321852 (mm) |
| −4350.275181 (mm) | 2284.67467 (mm) |
| 464.5855051 (mm) | −2597.886577 (mm) |
| 1.008455515 (rad) | −2.041190247 (rad) |
| −2.192243897 (rad) | −0.669667345 (rad) |
| 5.8244535 (rad) | 5.95582746 (rad) |
Table 10.
Exterior orientation calculation results after pointer point selection.
Table 10.
Exterior orientation calculation results after pointer point selection.
| | Left Image | Right Image |
| −134.1307857 (mm) | −1091.192156 (mm) |
| −4385.110676 (mm) | −3726.495034 (mm) |
| 477.4295171 (mm) | 486.3528129 (mm) |
| 1.00864094 (rad) | −1.992814393 (rad) |
| 4.091006245 (rad) | −0.720549556 (rad) |
| −25.59134622 (rad) | 2.853545074 (rad) |
Table 11.
Calculation Results Before Pointer Point Selection.
Table 11.
Calculation Results Before Pointer Point Selection.
| ID | x (mm) | y (mm) | z (mm) |
|---|
| a-14 | 1883.723941 | −872.3709574 | −942.1494467 |
| b-13 | 2221.826751 | −895.5116436 | −919.9883636 |
| c-11 | 1966.100273 | −511.8556124 | −940.6555923 |
| d-12 | 1832.980087 | −1285.936546 | −871.1170312 |
| e-09 | 1720.486347 | −682.0503035 | −983.47279 |
Table 12.
Calculation Results after Pointer Point Selection.
Table 12.
Calculation Results after Pointer Point Selection.
| ID | x (mm) | y (mm) | z (mm) |
|---|
| a-14 | 1883.351041 | −871.8709791 | −956.1296849 |
| b-13 | 2247.756108 | −850.1421361 | −955.4058891 |
| c-11 | 1962.365837 | −512.9988934 | −955.5878568 |
| d-12 | 1944.93905 | −1110.983765 | −954.6246552 |
| e-09 | 1670.749299 | −780.4272152 | −956.2813281 |
Table 13.
Calculation errors before pointer point selection.
Table 13.
Calculation errors before pointer point selection.
| ID | Δx | Δy | Δz |
|---|
| a | 0.723941117 | −0.370957424 | 13.85055327 |
| b | −27.17324947 | −46.51164364 | 37.01163643 |
| c | 3.100272985 | 0.144387595 | 16.34440765 |
| d | −114.0199127 | −176.9365457 | 84.88296882 |
| e | 49.48634731 | 99.94969647 | −27.47278999 |
Table 14.
Calculation errors after pointer point selection.
Table 14.
Calculation errors after pointer point selection.
| ID | Δx | Δy | Δz |
|---|
| a’ | 0.351041225 | 0.129020886 | −0.129684892 |
| b’ | −1.243892013 | −1.142136077 | 1.594110865 |
| c’ | −0.634163095 | −0.998893417 | 1.41214319 |
| d’ | −2.06095043 | −1.983765081 | 1.375344774 |
| e’ | −0.250701209 | 1.572784754 | −0.281328089 |
Table 15.
Verification results before pointer point selection.
Table 15.
Verification results before pointer point selection.
| ID | Error (mm) | Comprehensive Error (mm) |
|---|
| 13.87441985 | 87.53891631 |
| 65.35732332 |
| 16.63647204 |
| 226.9629928 |
| 114.8633736 |
Table 16.
Verification results after pointer point selection.
Table 16.
Verification results after pointer point selection.
| ID | Error (mm) | Comprehensive Error (mm) |
|---|
| ’ | 0.395846564 | 1.870348341 |
| ’ | 2.322268634 |
| ’ | 1.842308139 |
| 3.174021711 |
| 1.617296656 |
