Article

Optimizing Reinforcement Bar Fabrication in Construction Projects via Multi-Dimensional Applications in Building Information Modeling

1
School of Civil and Hydraulic Engineering, Chongqing University of Science and Technology, Chongqing 401331, China
2
Chongqing Vocational College of Applied Technology, Chongqing 401520, China
3
School of Architecture, Building and Design, Taylor University, Selangor 47500, Malaysia
4
School of Engineering Audit, Nanjing Audit University, Nanjing 211825, China
5
School of Management, Chongqing University of Science and Technology, Chongqing 401331, China
*
Authors to whom correspondence should be addressed.
These authors contributed equally to this work.
Appl. Sci. 2025, 15(19), 10807; https://doi.org/10.3390/app151910807
Submission received: 3 September 2025 / Revised: 4 October 2025 / Accepted: 5 October 2025 / Published: 8 October 2025

Abstract

Steel reinforcement is one of the most important materials used in the construction industry. This research optimizes reinforcement bar fabrication by integrating Building Information Modeling (BIM) with visual programming in Dynamo. On-site rebar cutting and bending generate significant material waste, increasing costs and environmental impact. To address this, an intelligent Dynamo script was developed to extract detailed 3D rebar and 4D scheduling data from BIM models. The script optimizes material usage by specifying cut-off lengths to improve reuse and minimize waste. Validation through two real-world case studies demonstrated the method’s significant potential. Effectiveness was assessed using benchmarks comparing the number of bars saved, waste reduced, and overall cost savings. The study confirms that optimized fabrication significantly cuts waste and cost. Its effectiveness, however, varies with rebar type and structural component, with the most significant gains observed in medium-length bars and pile caps. By offering a novel tool for sustainable construction, this research advances BIM-enabled reinforcement design and material optimization.

1. Introduction

The current Architecture, Engineering, Construction and Operations (AECO) industry offers a wide range of approaches from traditional practices to modern technologies to meet the challenges of project execution, but there are still many problems with construction and demolition waste management, especially recycling of residential construction waste, and rebar is one of the main causes of high project costs [1].
Furthermore, the tons of rebar wastage result in the waste of millions of dollars [2]. This excessive wastage is also harmful to the environment as well due to increased carbon emissions during its production. It was found that steel procurement can account for up to 15% of the total project cost [3]. In addition, the wastage of rebar in a cost-overrun situation may cause up to 5% of total project cost, which can be very detrimental [4].
Building life-cycle analyses reveal that steel reinforcement bars can account for up to 60% of total project costs, while the processes of procuring steel rebars and managing their waste contribute 98.6–99.2% of associated carbon dioxide emissions, primarily from transportation [5]. Consequently, substantial research efforts have focused on reducing rebar waste, with numerous promising solutions emerging for design-phase optimization. Recent studies in steel reinforcement have particularly examined structural aspects of construction projects through BIM-based clash detection technologies, including algorithms for clash prediction [6] and resolution [7], structural safety assessments [8], Industry Foundation Class (IFC)-based automated reinforcement prefabrication [9], reinforcement placement and retrieval methods [10], precast component reinforcement design [11], augmented reality applications for bar drawing interpretation [12], and optimized algorithms for generating bar bending schedules [13].
While these studies have predominantly utilized conventional BIM tools, the current research implements Dynamo—a visual programming platform integrated with Revit—to facilitate real-time parametric optimization during on-site cutting operations. Dynamo offers three key advantages for this application: (1) creation of customizable algorithms for automated rebar length matching without manual modeling, (2) dynamic adjustment of cutting plans based on actual stock inventory through data-driven workflows, and (3) seamless integration between design automation and field operations via Revit interoperability. However, existing research has not thoroughly examined the practical implementation of such optimization during on-site cutting processes. Furthermore, previous studies have insufficiently investigated how digital integration impacts the optimization process, particularly regarding workflow sequencing and its effects on overall project performance.
Therefore, this research aims to develop an automated Dynamo script for rebar optimization using Building Information Modeling (BIM) via extracting third-dimension (3D) rebar data and fourth-dimension (4D) scheduling data for improved project performance. Two case studies were conducted to examine the performance of Dynamo scripts for rebar optimization through two research questions, i.e., (a) how the rebar fabrication process can be optimized to reduce the amount of material used, and (b) how effective this optimization is.
This study makes three primary contributions: (1) developing a novel Dynamo-based framework for real-time rebar optimization during construction execution, (2) quantifying the material and carbon footprint reductions achieved through digital integration, and (3) establishing best practices for implementing parametric optimization in field operations. The paper is organized as follows: Section 2 reviews the relevant literature on BIM-based rebar optimization; Section 3 details the proposed Dynamo methodology; Section 4 presents the validation of the case studies; and Section 5 discusses implementation challenges and performance outcomes.

2. Literature Review

Building Information Modeling (BIM) is an emerging technology that has observed gradual shifts in policies, processes, and technologies in the Architecture, Engineering, Construction, and Operations (AECO) industry since its introduction in its landmark paper in 1975. One of the main reasons for the technology’s boom in the field is its ability to integrate a wide range of digitized information that can help improve building operations, construction requirements, and functional characteristics for digital transformation and sustainable development in the construction industry. A researcher has developed a BIM-based value engineering (VE) plug-in that significantly improves the sustainability of construction projects by integrating cost, energy, and implied carbon assessment functions to optimize material selection and construction solutions [14]. Shi et al. systematically examined Dynamo’s pivotal role in 5D Building Information Modeling, demonstrating that it overcomes the accuracy limitations of traditional quantity-take-off tools when dealing with fine-grained components such as multi-layer composite walls or 3D-printed elements [15]. Through two case studies, the authors showed the following: (1). A single Dynamo script can extract the exact area of every construction layer within the same wall (outer cladding, waterproof membrane, insulation, gypsum board, etc.), eliminating the underestimation caused by conventional software’s LOD constraints and layer-to-layer joint offsets. (2) Dynamo, coupled with Fusion 360, supports a fully parametric workflow for 3D-printed components—modeling, slicing, G-code export and material-quantity calculation—thereby integrating “design–print–take-off” and providing a cost basis for rapid, customized construction. Sala et al. addressed the frequent defects in Revit’s automatically generated analytical model (misaligned nodes, disconnected members, etc.) by proposing a rule-based correction framework implemented through Dynamo’s visual programming environment [16]. Alzara et al. point out that the traditional ISO 19650 workflow places environmental analysis after the scheme is finalized, causing a disconnect between carbon-emission targets and building form and leading to costly rework. Guided by the SE2050 “net-zero embodied carbon” commitment, the authors develop a real-time carbon-calculation script embedded in Revit-Dynamo [17]. Recent studies have also highlighted that BIM adoption in construction not only improves efficiency but also contributes to environmental sustainability, safety management, and life-cycle cost reduction. Particularly, steel reinforcement is one of the costly and important materials that should be digitalized and managed properly to reduce its wastage [12]. Researchers have demonstrated that BIM-based steel reinforcement management provides advantages in terms of minimizing errors, reducing waste, and enhancing construction quality by supporting accurate quantity take-off and clash detection [18,19]. Various types of rebars need to be cut and bent into the required shape and assembled into their final forms in construction projects.
Zheng and Lu identified rebar cutting as a classic one-dimensional cutting stock problem (CSP), where the primary objective is to minimize material waste by determining optimal cutting patterns from available stock lengths [20]. In practice, project managers use material management software to calculate required rebar quantities and generate cutting plans that maximize utilization, as steel reinforcement can account for up to 60% of project costs. Advanced methods employ mixed-integer programming and cost analysis to optimize both cutting patterns (reducing cut-off) and bending processes, yielding detailed bar schedules with multi-objective outputs (waste percentages, cost savings). However, while these computational solutions are mathematically robust, they lack integration with 3D BIM visualization of rebar layouts, creating implementation gaps between optimized plans and field execution—particularly in reconciling theoretical efficiency with design tolerances and construction tolerances. In fact, several works have integrated BIM with intelligent optimization models such as genetic algorithms, heuristic methods, and mixed-integer programming to achieve more efficient reinforcement detailing and scheduling [21,22,23]. An improved optimizing framework for reinforcement steel bars has been developed to clarify its process flow as shown in Figure 1.
Mangal et al. [24] proposed a new methodology with BIM assistance that allows spatial models (3D) to be leveraged for supporting various types of analyses in structural engineering design. In addition, this methodology uses a hybrid genetic algorithm (HGA) to automate the optimization of steel reinforcements by addressing buildability constraints, and a framework was developed based on the optimization technique. Firstly, the model calculates required steel reinforcement, bar diameter, and spacing between reinforcement bars, which involved an arduous data extraction process for five different modules. The process involved creating structural, architectural, and MEP BIM models based on original CAD drawings, followed by data extraction from these BIM models for analysis. Secondly, structural analysis is performed from the imported models whereby the bending moments and shear forces were computed. In this process, the allocation for safety factors was considered as well. Thirdly, the beam–column joint analysis was executed at each level of the RC frame to extract joint types. Finally, the rebar diameters for the RC frames were assigned. As such, they corroborate the regional design code (software like Autodesk Revit allows the option for assigning region codes). To address the rebar number optimization problem, the steel rebar range for each RC member of the frame was calculated. These findings align with earlier research where BIM-enabled reinforcement optimization frameworks were shown to improve constructability and reduce both labor and material costs [25,26].
Cheng and Li [27] studied BIM-based rebar design optimization and automating fabrication methodology using an inner genetic algorithm. The study was conducted due to new construction policies in Hong Kong that address off-site prefabrication to improve productivity and cost-effectiveness. This project’s scope allowed researchers to produce a clash-free design through optimal design formulation, rebar design optimization, and a solver for clash avoidance. The automated rebar fabrication in this research involves detailed rebar drawing through BIM software (Version 2019) and export schedules. For the automatic drawing generation, an Application Programming Interface (API) was used. Just as any BIM-based project is executed, a clear framework was developed with the aspects mentioned above to consider, and a numerical data structure was developed, known as BundesVereinigung der Bausoftware (BVBS). The BVBS strings allocate themselves according to segmented data that defines rebar allocation. This data includes hook angle, index of rebar with hook, and hook lengths. The key parameters from the 4D schedules were called for into the API where the BVBS structure was integrated, and the program was allowed to run, which automatically rendered out bar drawing and bending schedules. This approach reflects broader industry trends where prefabrication and digital fabrication are increasingly integrated with BIM to enhance construction automation and precision [28].
In recent studies, some researchers have been able to model and simulate the behavior of steel reinforcement, allowing for earlier identification and resolution of clashes using BIM. For example, Liu et al. [29] conducted research to provide an intelligent rebar layout using an artificial potential field, which uses a robot tool to detect collisions or obstacles. The intelligent rebar layout works in an intriguing way, whereby the longitudinal column rebars are established, and the robot tool lowers portion beam longitudinal rebars in the X-direction. Liu et al. [9] developed an IFC-based automatic steel reinforcement prefabrication method. This method utilized the IFC standard to automate the prefabrication process of steel reinforcement. By utilizing this method, the researchers were able to reduce errors and improve efficiency in the prefabrication process, ultimately leading to a reduction in clashes during construction. Lien and Dolgorsuren [10] focused on the construction and placement of steel reinforcement. They developed a method that utilized BIM technology to model and simulate the placement of steel reinforcement for clash detection and resolution. This method not only reduced clashes but also improved construction efficiency and accuracy. Liu et al. [11] looked at reinforcement design in precast components. Khant et al. [13] introduced a BIM-based 3D model and API-integrated algorithm for accurate, efficient rebar quantity estimation, with great saving of rebar and reduced preparation time. They developed a method that allowed for the automated design of reinforcement in precast components using BIM technology. This method considered both the structural requirements and the manufacturing process of the precast components, leading to more efficient and accurate reinforcement design. Other recent works further confirm that BIM-integrated prefabrication and clash detection contribute substantially to project quality, time reduction, and cost savings in reinforced concrete construction [30].
In sum, past studies have provided some solutions to rebar optimization in the design phase, but little is known regarding the direct implementation of optimization during the on-site cutting process and the impact of 4D integration from the sequence of works on the project performance. This study integrates BIM with Dynamo visual programming: an intelligent script automatically extracts 3D bar data and 4D schedule information from the model, algorithmically optimizes cut lengths and reuses off-cuts, digitizing and fine-tuning on-site cutting and bending. The workflow delivers a reusable methodology and tool-chain for BIM-driven material optimization and sustainable construction.

3. Methodology and Module Development

The research methodology employed in this study was a four-module approach to optimize the fabrication of reinforcement bars through BIM technology coupled with a Dynamo API. The modules were closely intertwined to extract multi-dimensional details from the BIM model for reducing waste and enhancing overall cost-effectiveness. Subsequently, we selected real project case studies to validate the effectiveness of our optimization scripts.

3.1. Module 1: Defining Requirement Parameters

The first module focused on defining parameters in the development of an intelligent Dynamo script, which was to determine the necessary inputs, process nodes, and outputs so that any parameters which did not already exist in Revit could be created. All the required parameters are shown in Table 1, as well their type, format, etc.
In order for these parameters to be reusable in other projects, this can be achieved by adding shared parameters, which can be performed in conjunction with Microsoft Excel with the Parameter. Create a SharedParameter node in the dynamo script, which can be quickly viewed as the creation of shared parameters.
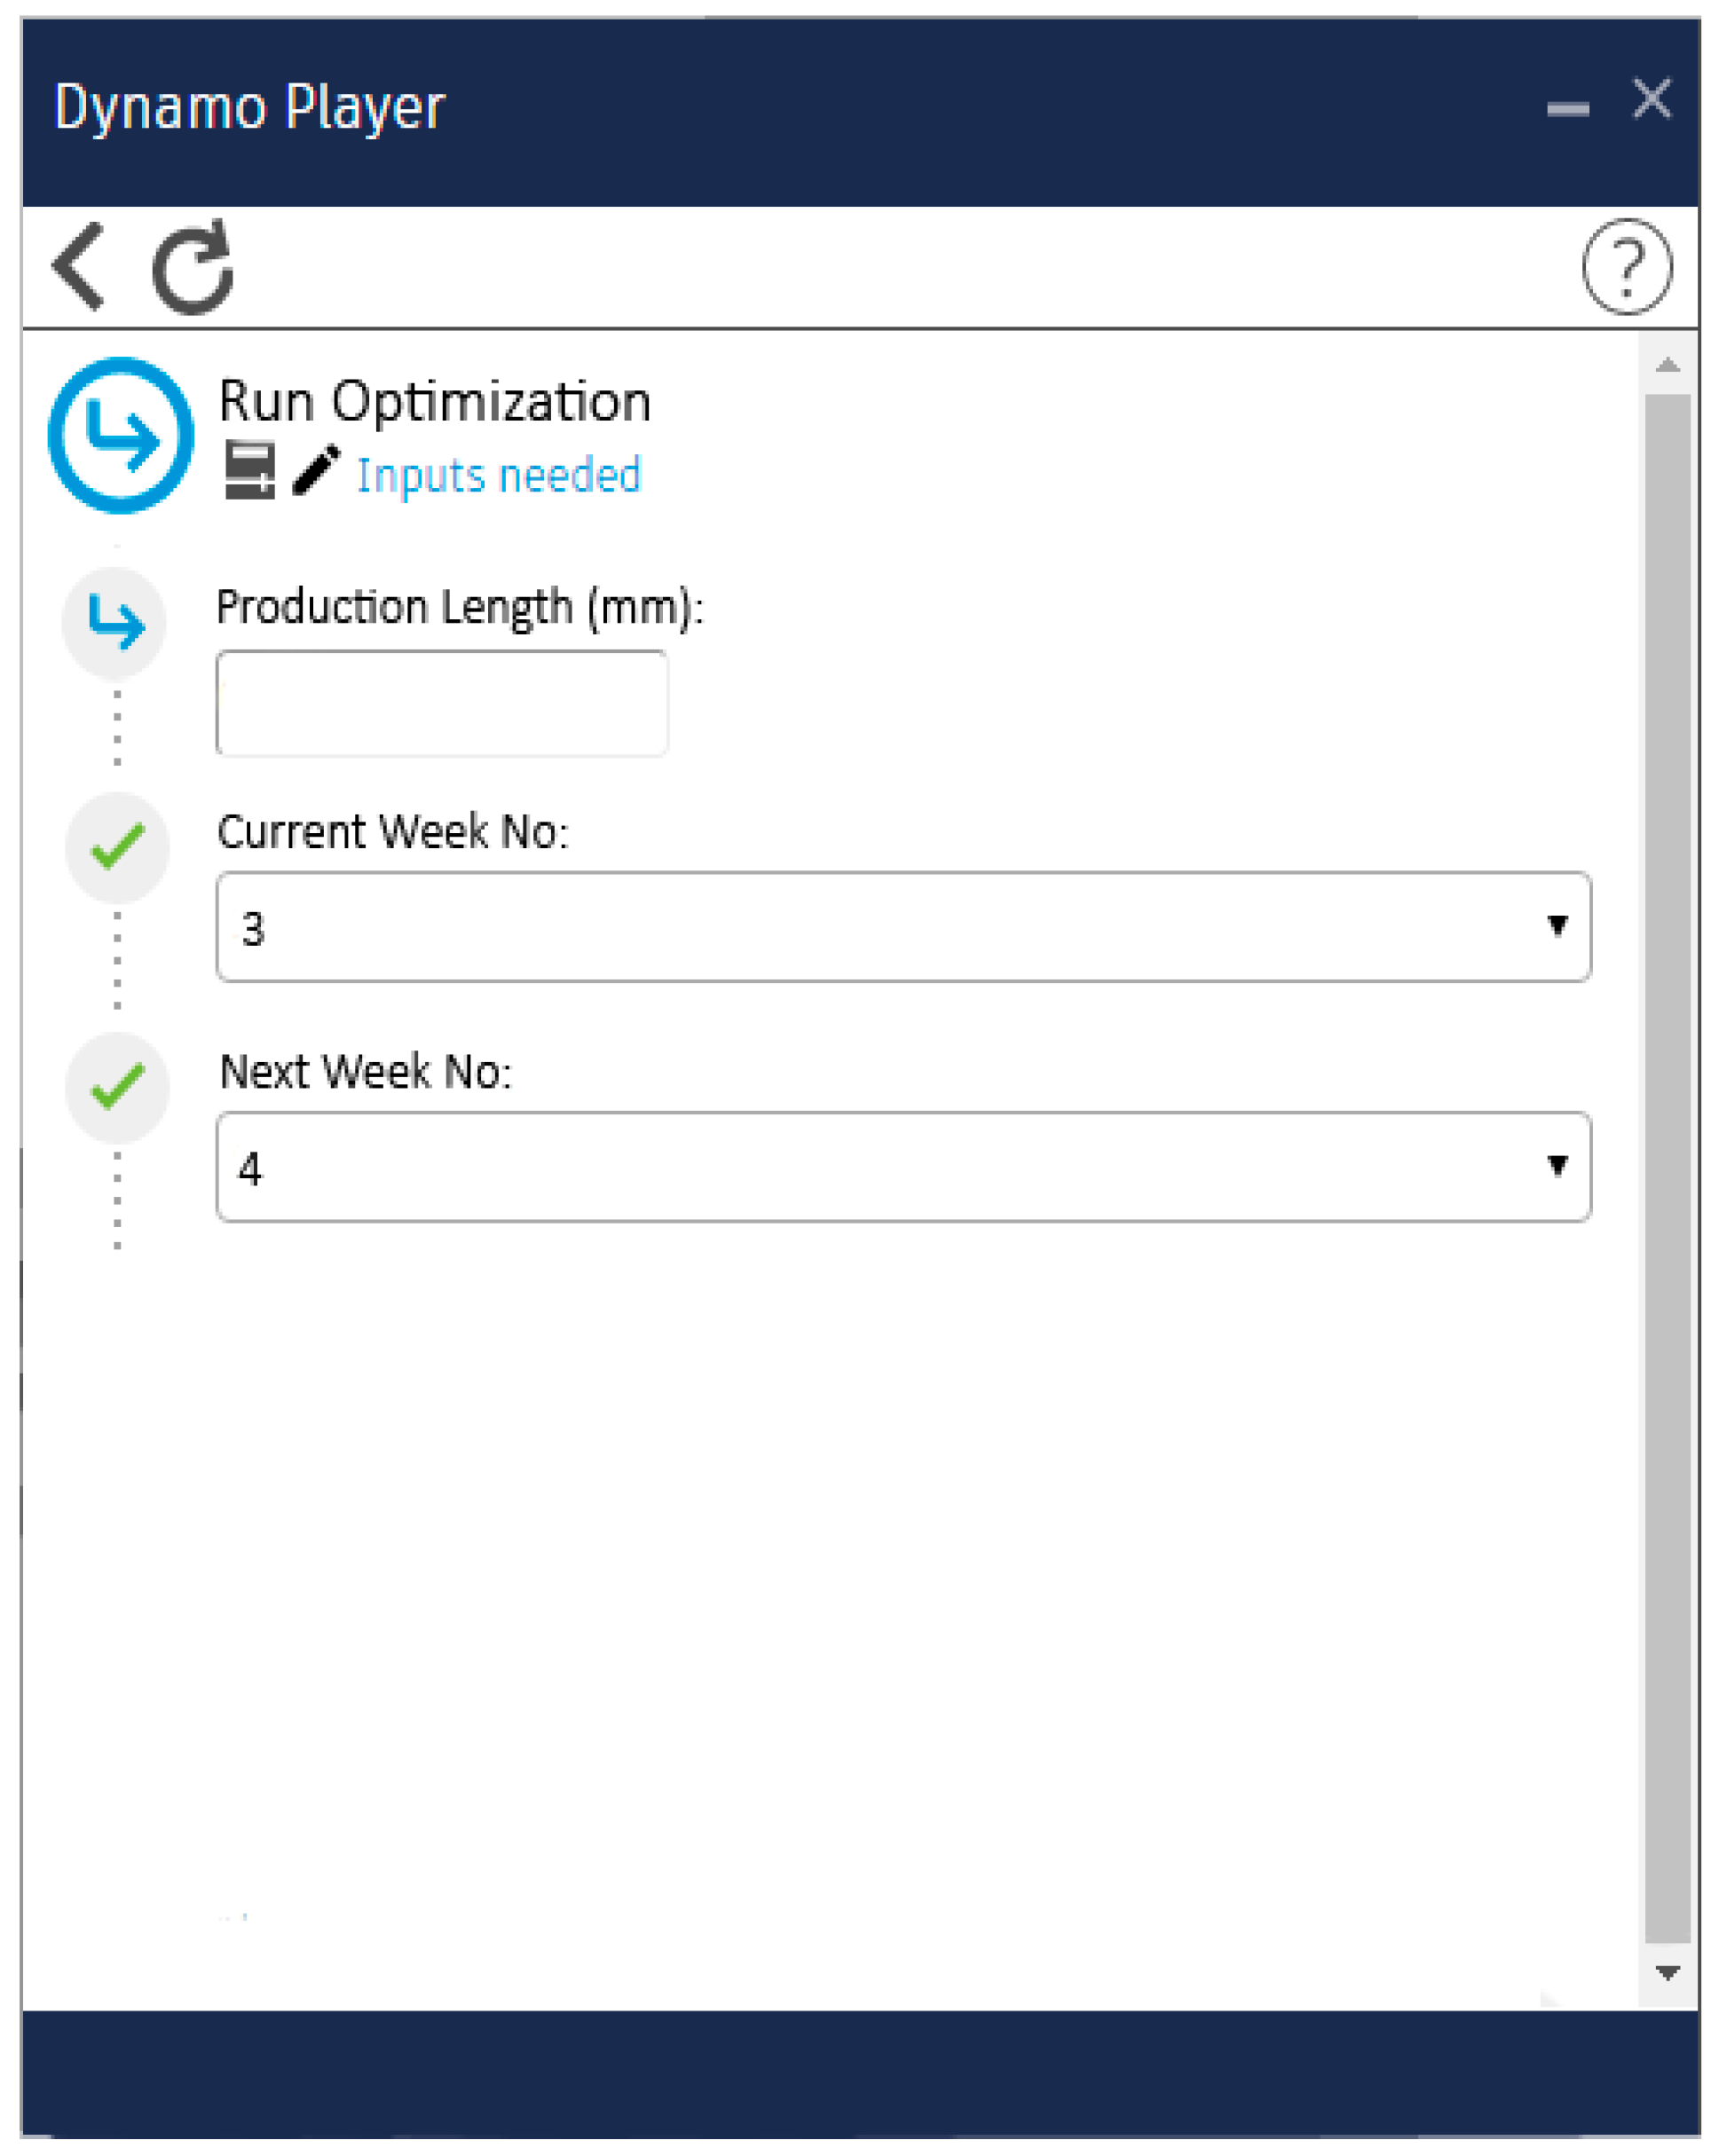
There were two types of input data needed for the optimization; the user-defined inputs were manually keyed in, and the 3D and 4D inputs were automatically extracted from the rebar model as needed. For the user inputs, the interface shown in Figure 2 prompted the user to enter the production lengths in mm and to define the current and the next week numbers. The required outputs also needed to be defined so that they could be scheduled and exported later for the on-site fabrication. These were known within Revit as calculated parameters, for instance, Cut-Off Length (Production Length–Bar Length) and Min Length by Type.

3.2. Module 2: Developing a Process-Flow Framework for the Optimization Script

Once all the required parameters were defined, the process-flow framework was developed to visualize the flow of information. When the required bar lengths in the current week were cut-off from production lengths, the script searched for bar lengths in the future weeks where the cut-off length could be used. When matches were found, the fabrication schedule warned workers that the cut-off length should be put aside for later use; otherwise, the cut-off length could be discarded as waste.
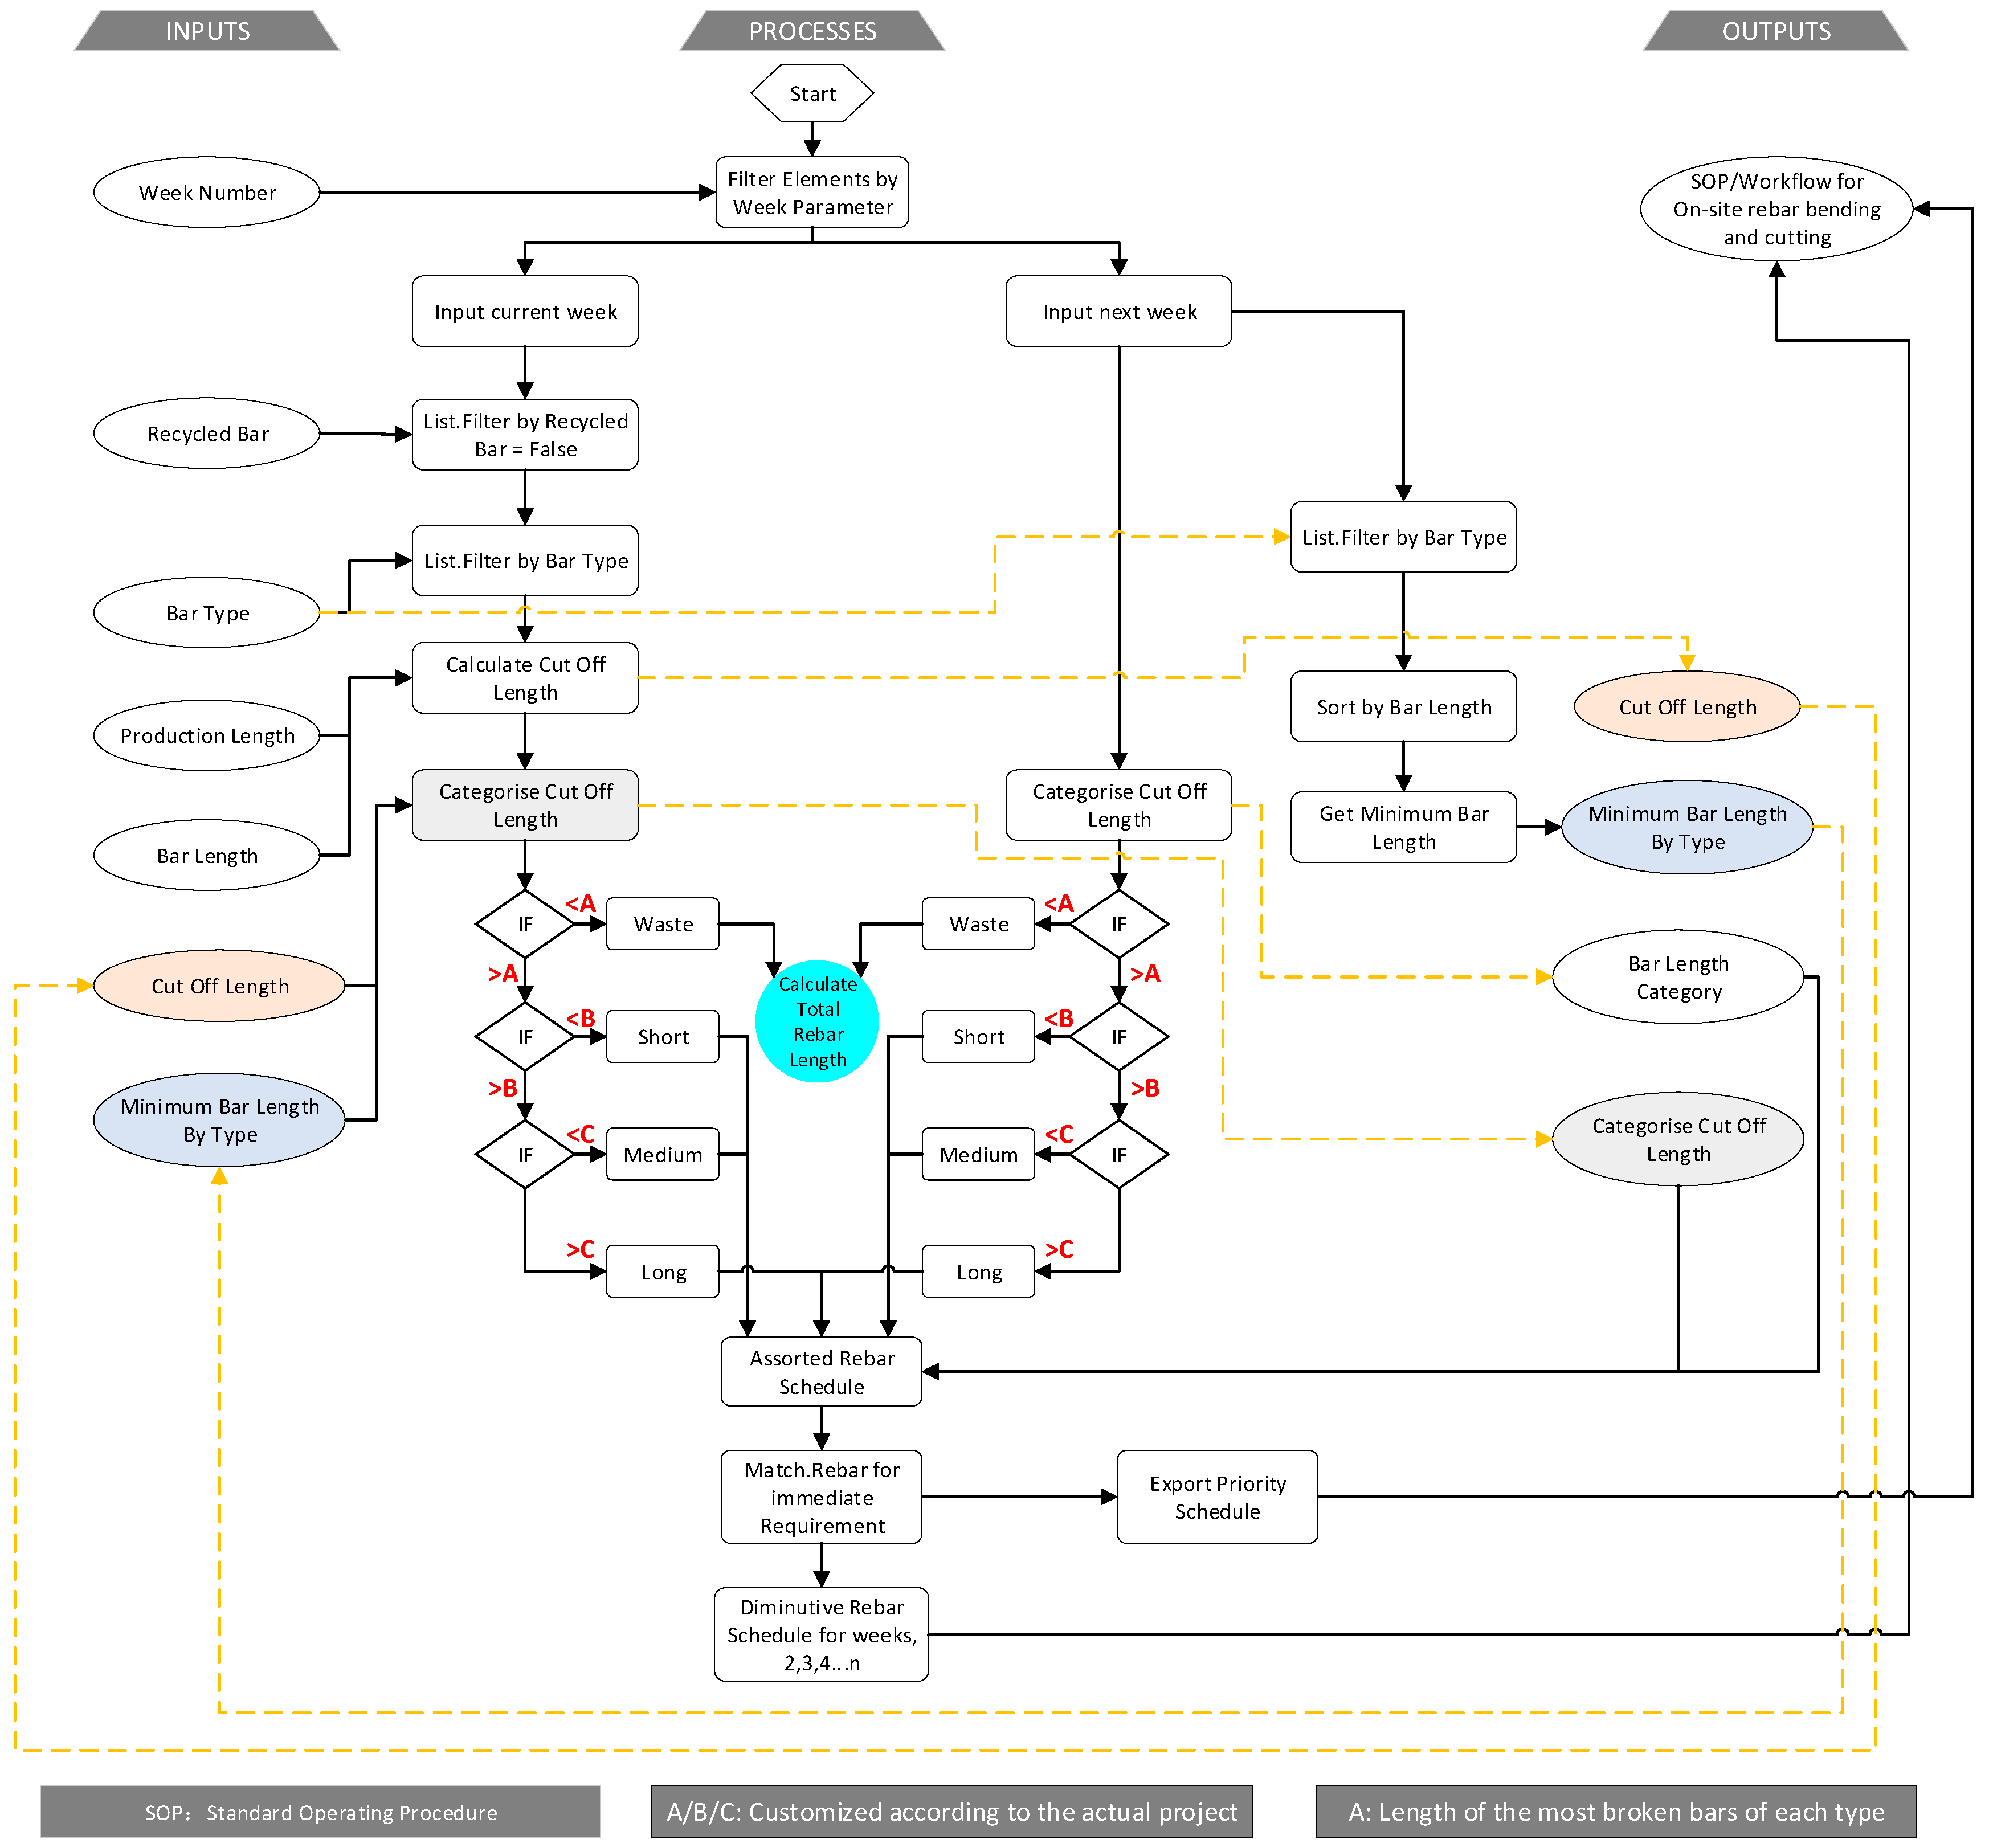
Figure 3 illustrates a simplified software architecture for the script and its interfaces between Dynamo API inputs and the exported schedule [31]. For a more detailed process flow of the proposed script, Figure 4 illustrates a comprehensive framework for the parameter data flow between processes to create the desired outputs.
Brief Description: For the three values A/B/C in Figure 4: Steel bars shorter than 1000 mm are defined as waste. Those exceeding 1000 mm but less than 4000 mm are defined as short. Those exceeding 4000 mm but less than 8000 mm are defined as medium. Those exceeding 8000 mm are defined as long, i.e., A = 1000 mm, B = 4000 mm, C = 8000 mm. To ensure the reproducibility of this study, A/B/C are used in Figure 4 instead of specific values. Specific values may be defined independently for different projects.

3.3. Module 3: Creating the Script in Dynamo

After executing the script, the first step involved selecting all components (slabs, beams, foundations, etc.) within the model that had the relevant week value. The components for the current week were separated from those for the next week using a filter, and the rebar within each thread was extracted for processing.
For the current week, bars that had already been optimized—those made from the previous week’s cut-off lengths—were filtered out using List.FilterByBooleanMask, excluding any bar marked as Recycled Bar = True. In the “next week” thread, the lists of bars were sorted by length to identify the shortest required lengths for each type, such as 900 mm for T10 and 4100 mm for T12. This data was recorded in six calculated parameters, one for each bar type.
Next, the cut-off lengths for the current week were calculated by subtracting the extracted bar lengths from the user-defined production lengths. These cut-off lengths were categorized before matching them with potential bar lengths for the next week. For example, if a 4000 mm bar was cut from a 12,000 mm production length, the resulting 8000 mm cut-off could potentially produce multiple bars in the next week if the lengths were short enough. However, optimizing rebar fabrication to this degree would require a much more complex script, which was not feasible given time constraints and programming experience.
Thus, the script was limited to a simpler “one pass” optimization each week, where each production length could yield only two finished bars—one for the current week and another for the next, with any leftover length treated as waste. This approach risked generating unnecessary waste, prompting the development of a workaround. The cut-off lengths were grouped into four categories based on waste lengths: waste (1 to X mm), short (X + 1 to 4000 mm), medium (4001 to 8000 mm), and long (8001 mm or longer). In contrast, the next week’s bar lengths were classified into three categories: short (1 to 4000 mm), medium (4001 to 8000 mm), and long (8001 mm and above).
During the matching process, cut-off lengths from the current week were paired exclusively with bar lengths belonging to the same category in the following week. To illustrate, when a 12,000 mm production length was used to produce a 3000 mm bar, the resulting 9000 mm cut-off was classified as long. According to the rule, this cut-off could only be matched with bars also categorized as long in the subsequent week. The example underscores that such a cut-off was prevented from being paired with shorter bars, thereby demonstrating how the same-category matching rule functioned to minimize perceived waste.
Once categorized, the pairing process commenced. The script could create up to 42 lists of bars based on the variety to be fabricated that fortnight. Using Match.List and List.Index nodes, the script compared the current week’s lists with the next week’s. Matched bars had three parameters edited: the Recycled Bar parameter was set to true for next week’s bars to indicate they would be made from cut-offs; the Rebar Mark parameter linked the original and new bars; and the Waste Length parameter calculated the leftover length after matching.
If a cut-off length exceeded the minimum length but did not match a corresponding bar, it was marked for a pool of spare bars, noting that although these lengths would not be used immediately, they could be valuable in the future. If a next-week bar could not find a match from the current week, it remained available for future production.

3.4. Module 4: Exporting to Revit Schedule

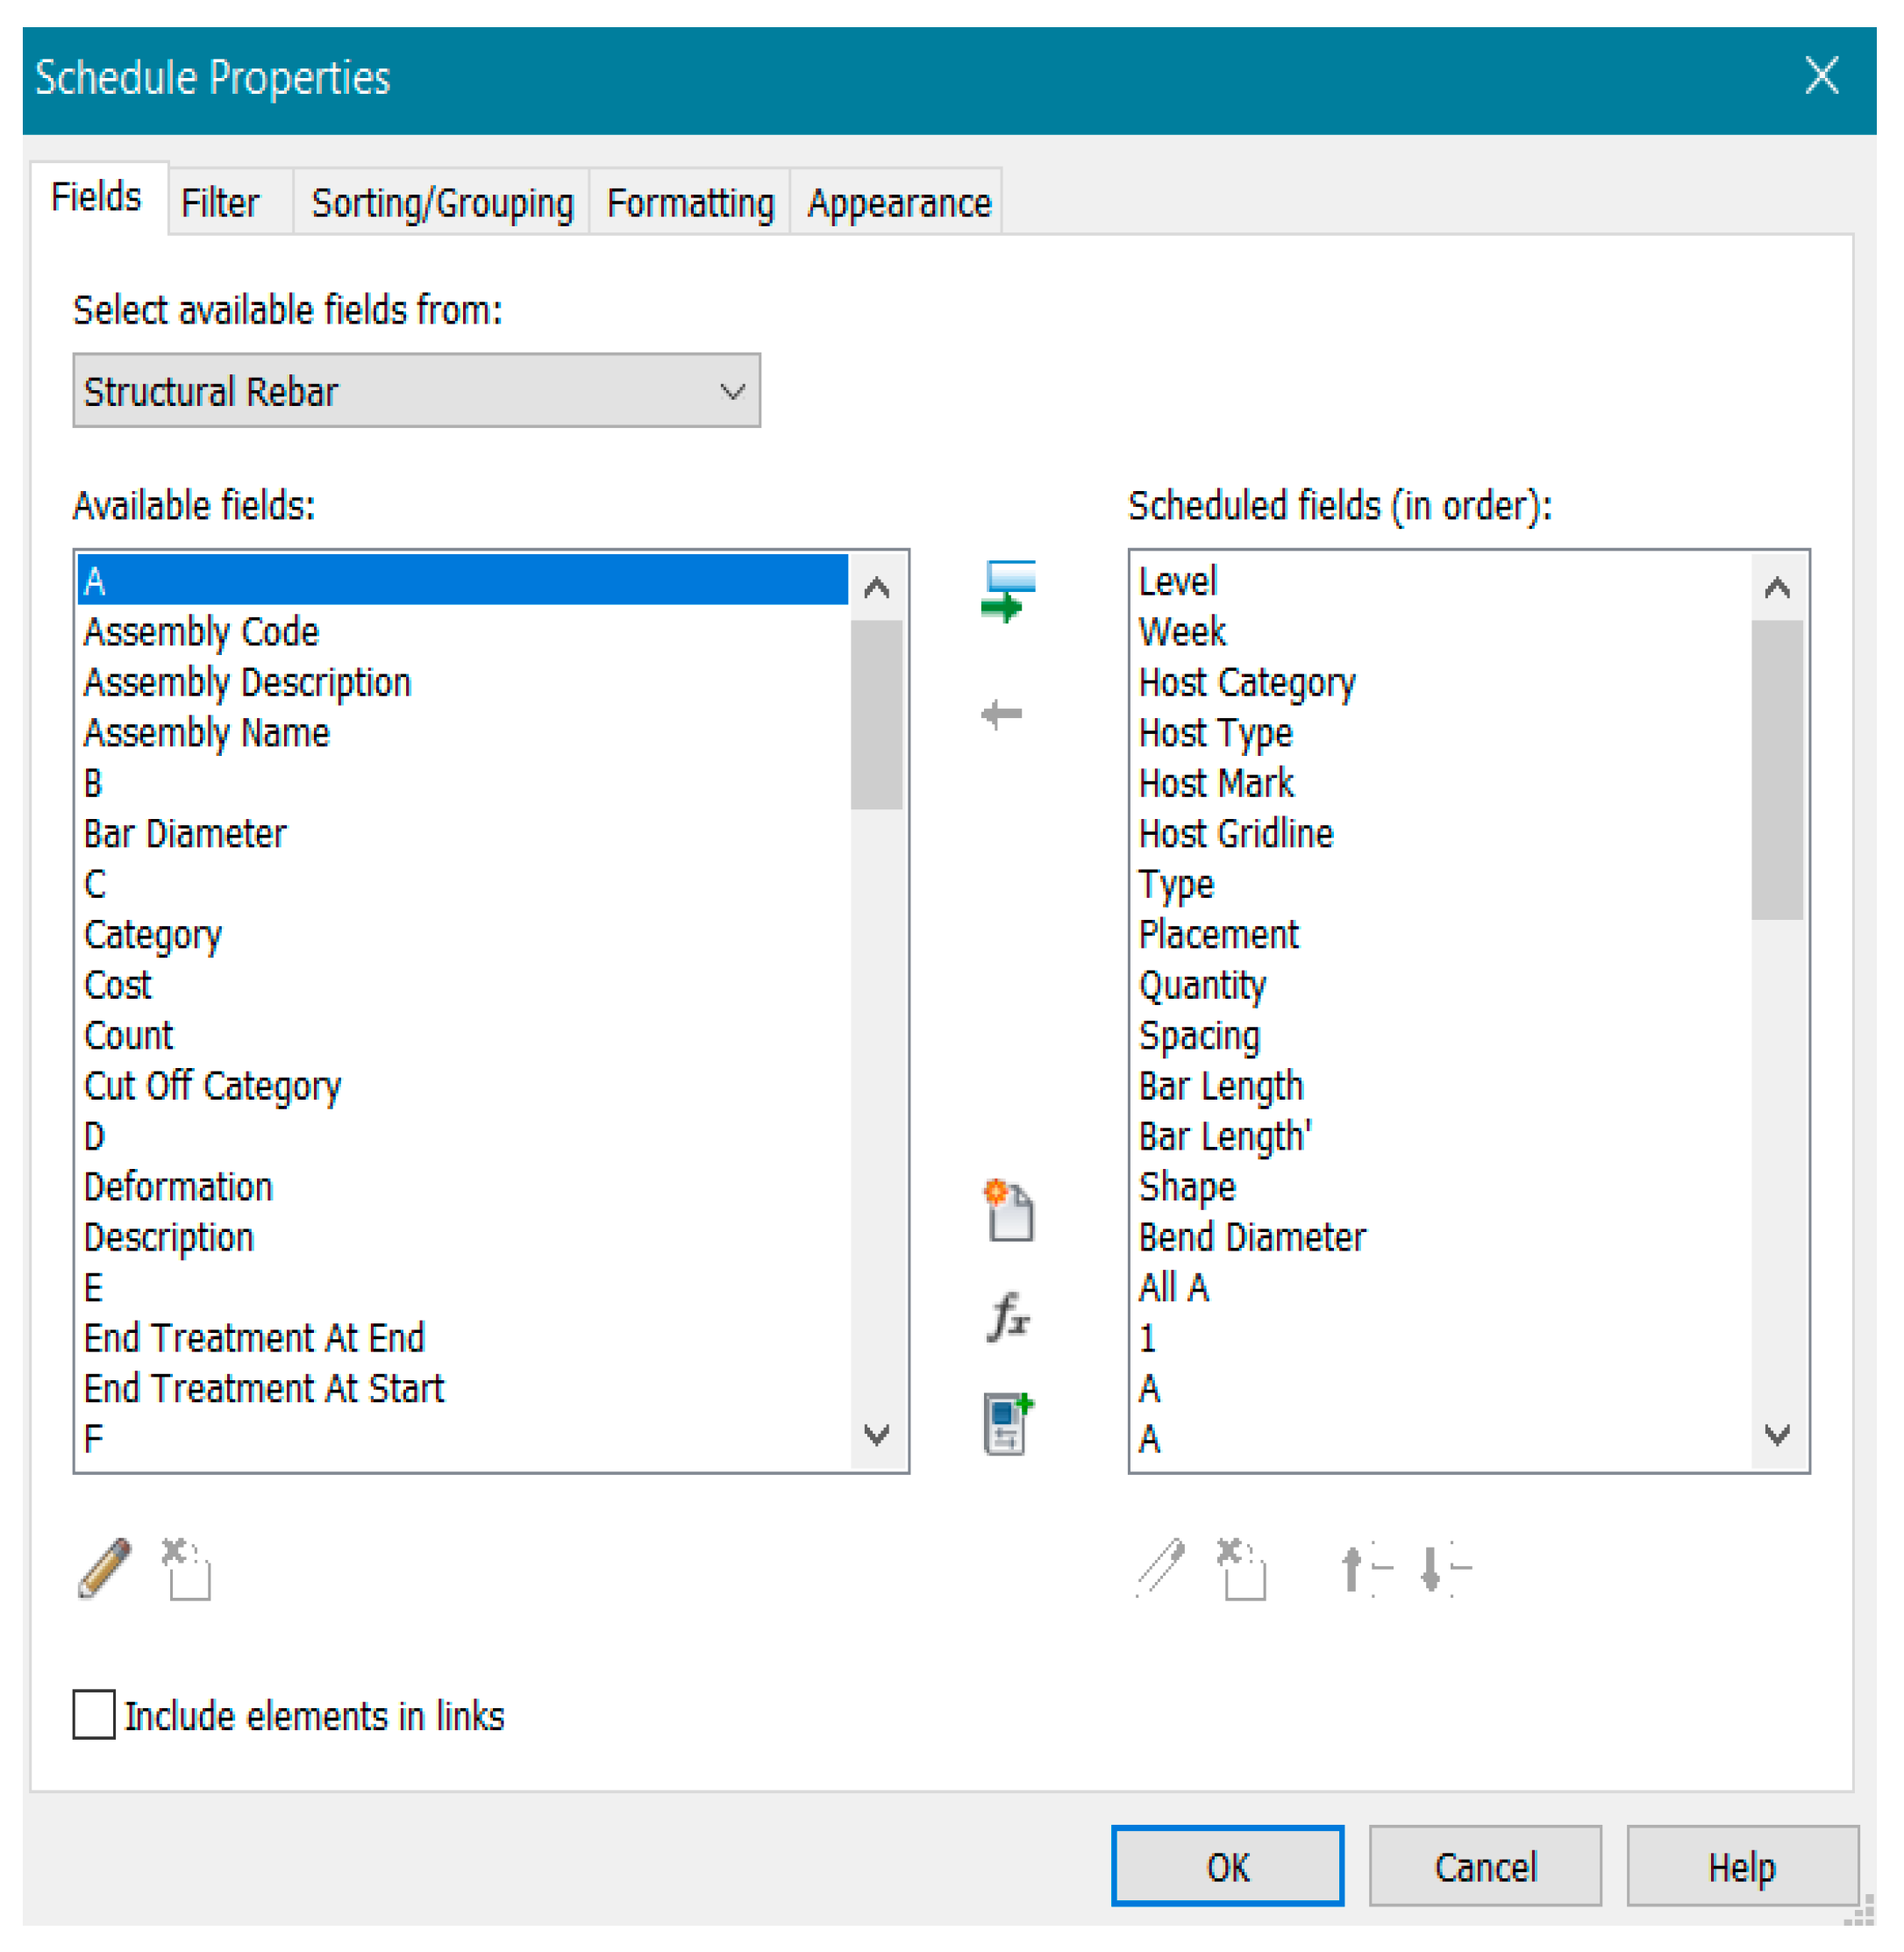
After the script performed its optimization, the relevant fabrication data was exported into a set of spreadsheets each week which included the following: a material schedule for the quantity of materials needed, a fabrication schedule that detailed how the rebar should be cut, bent, and placed on-site, and finally an optimization schedule which specified where the cut-off from the current week would be used in the next week. Scheduling in Revit was a relatively simple procedure, but due to the large amount of data presented at once, only the most relevant parameters must be selected, filtered, grouped, sorted, formatted, and organized to be understood (Figure 5).
The first exported schedule was the purchasing schedule. This was used to quantify the materials needed for that week. Since it included various categories of components (slabs, beams, foundations, etc.) and involved multiple materials (e.g., grades of concrete, lengths of rebar, etc.), a multi-category take-off was used. For concrete elements, the relevant parameters included material name and material volume. This included rebar type, total length, and the number of production bars needed for rebar elements. It was essential to exclude the bars that would be created from the previous week’s cut-off. Therefore, a filter was added to only include rebar where Recycled Bar = False.
The next schedule to be exported is the bar bending schedule and bar cutting list (Figure 6) used to cut, bend, and place the rebar. This schedule showed a considerable amount of data; therefore, it would have to be divided into four distinct sections: Identity Data, Fabrication Data, Placement Data, and Optimization Data.
The Identity Data referred to the data identifying the location of the rebar within the project. This might include level (e.g., Lower Ground), Host Category (e.g., Structural Column), Host Type (e.g., 500 × 500), Host Mark (e.g., C23), and Gridline (e.g., B/2). The identity data included in each fabrication schedules differ based on the work completed on that week, so if the planned work only consisted of Level 1 Slabs, then the Level and Host Category could be hidden or omitted to simplify the schedule.
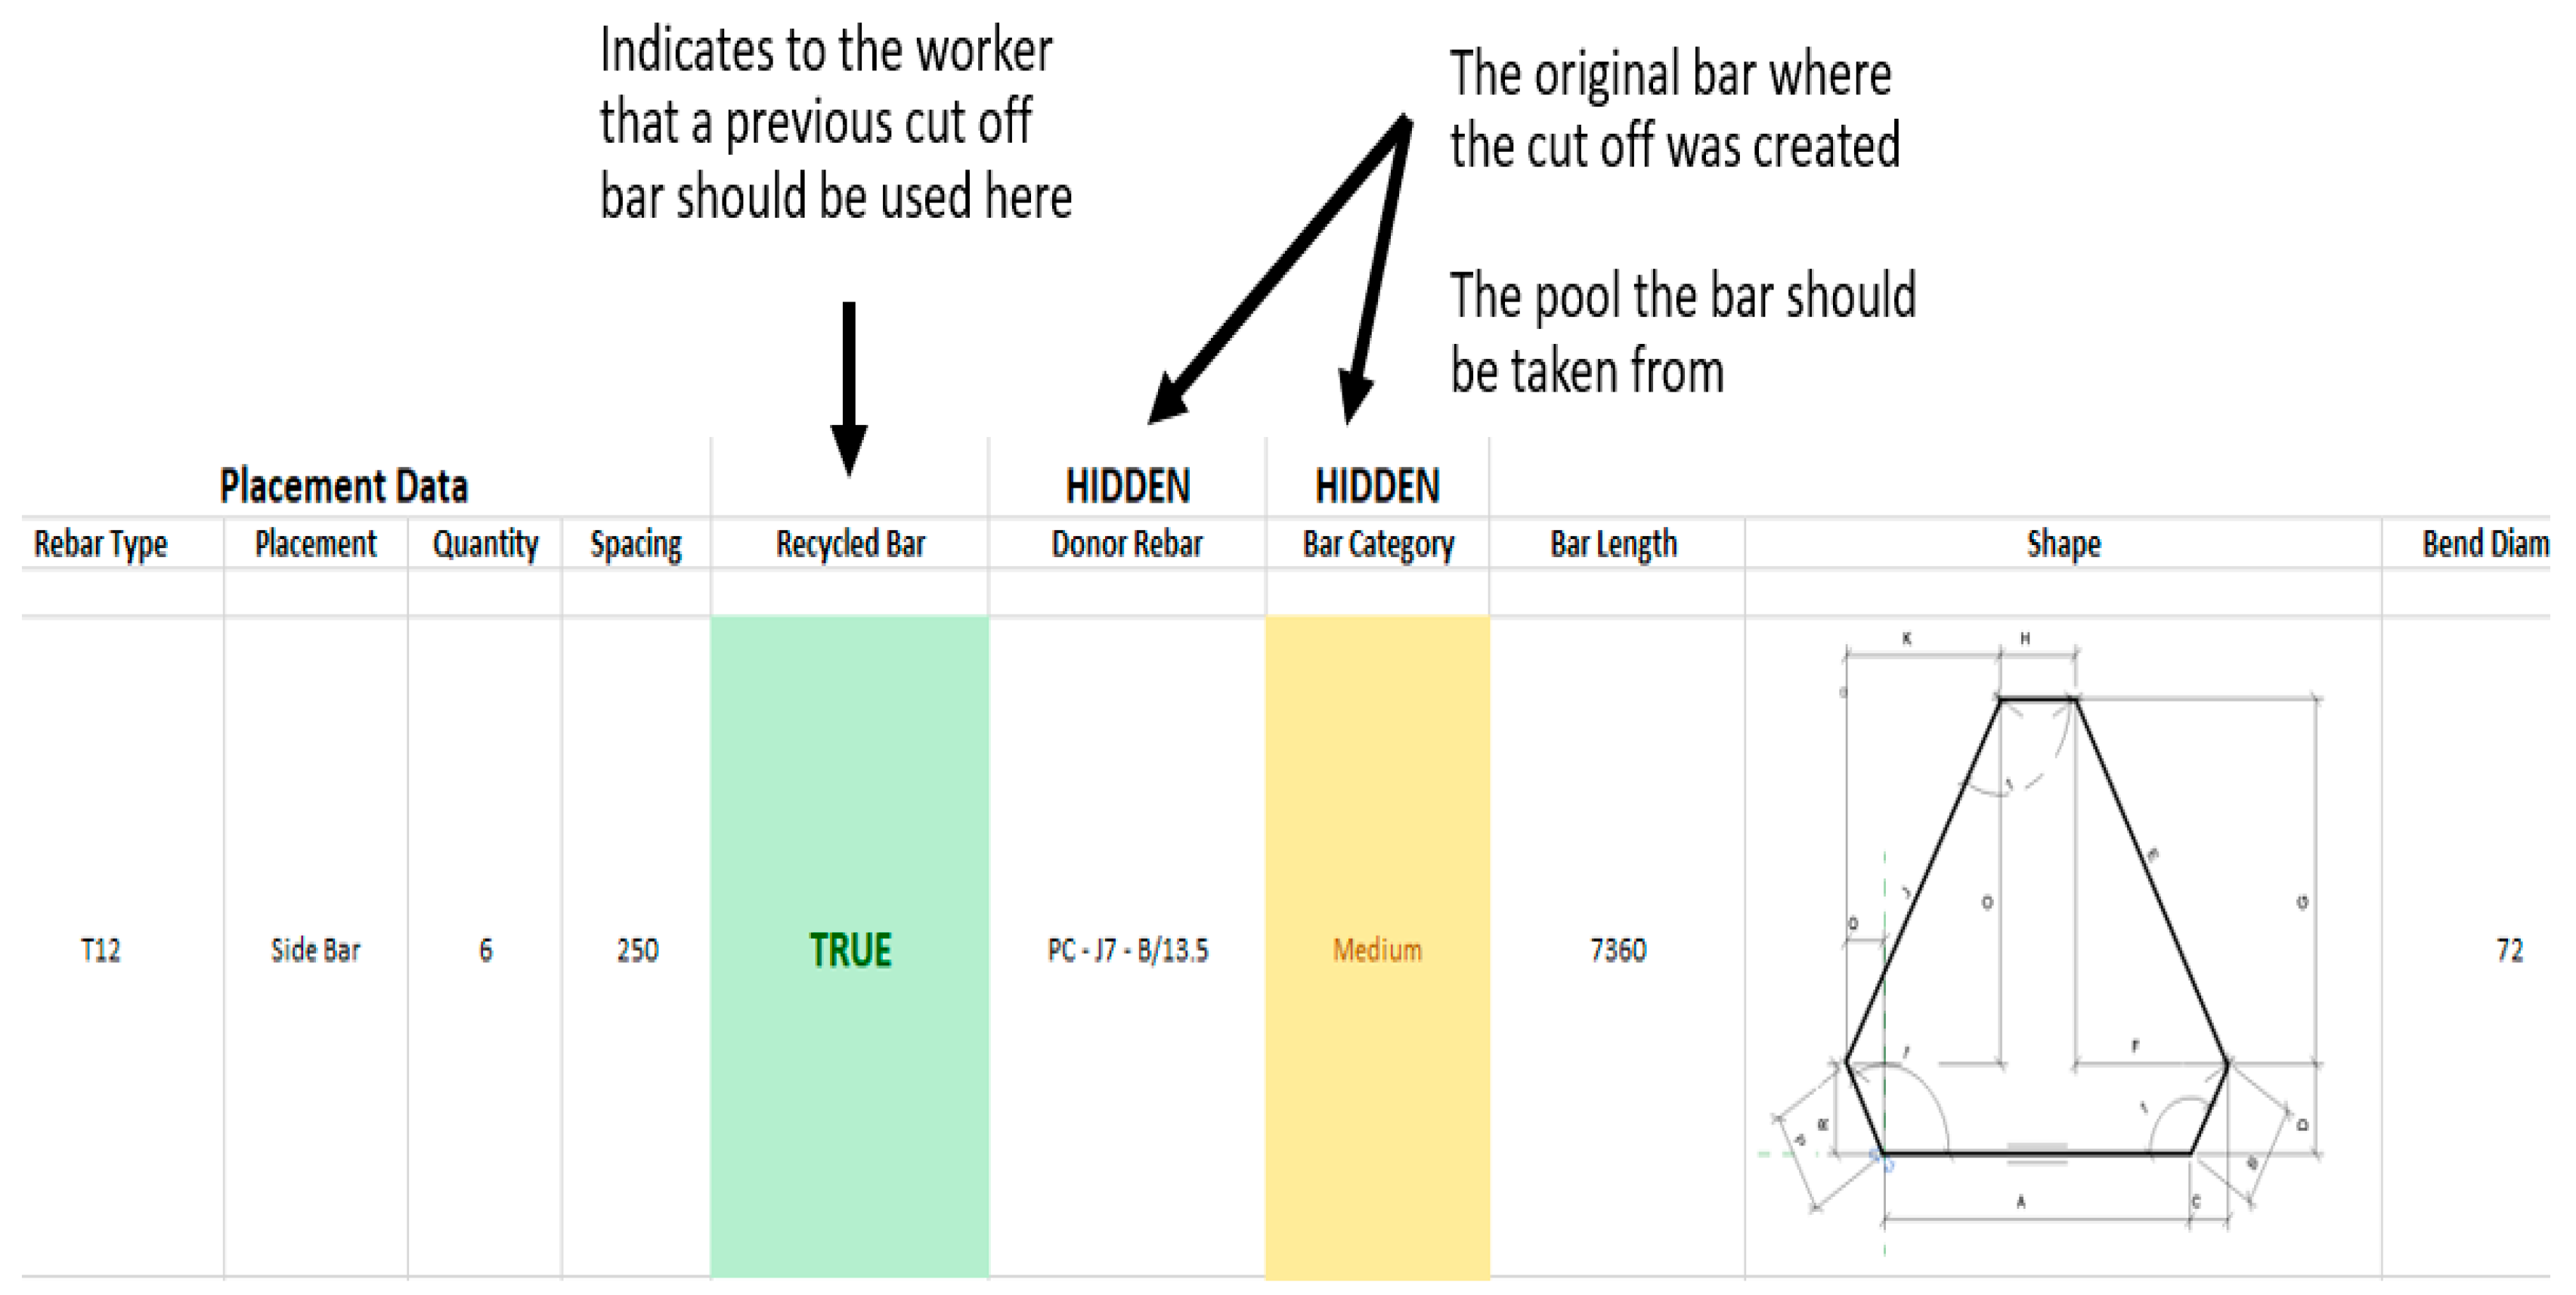
The Fabrication Data referred to the process of cutting and bending each bar into various shapes. The first and foremost was the Recycled Bar column; see Figure 7. This dictated whether a fresh production length or a previous cut-off length should be used for this bar (as determined by the optimization script). If true (shown with a tick), the workers should take a bar from the recycled pool; if false, then fabricators should grab a fresh bar from that pool. The next column was the bar type, which specified the type of bar to pick up from that pool (T10, T12, T16, etc.). The schedule first provided the length of the bar (from which to cut out of the production length). The second column was the Bend Diameter, which explained the type of bending pin size that should be loaded into the steel bending machine for the appropriate bend diameter. Once the bar was prepped for bending, the overall shape was defined with an image and relevant diameters. Lengths were labeled A, B, C, D, etc., while angles were labeled as 1, 2, 3, and 4. The final step involved the Quantity in Set, which was simply the number of times the process needed to be repeated to create the entire rebar set.
The Placement Data referred to the data identifying the location of the rebar set within the component itself. The placement parameters were all Booleans, meaning the value was binary. For instance, each rebar set in a slab could be placed either longways or shortways and at the top or bottom. In a column case, a rebar set could be oriented vertically or horizontally. Secondly, the spacing of the rebar in each set was defined (e.g., bars were laid 250 mm apart) [32].
Finally, the Optimization Data section detailed the script’s handling of cut-off lengths post-cutting. It featured a column indicating whether each length was waste or suitable for reuse in specific pools. Additionally, the Next Component column informed workers of potential components where these cut-off lengths could be utilized, based on collected data and a prepared framework for presentation.

4. Validation of the Optimization Script

4.1. Case Study 1

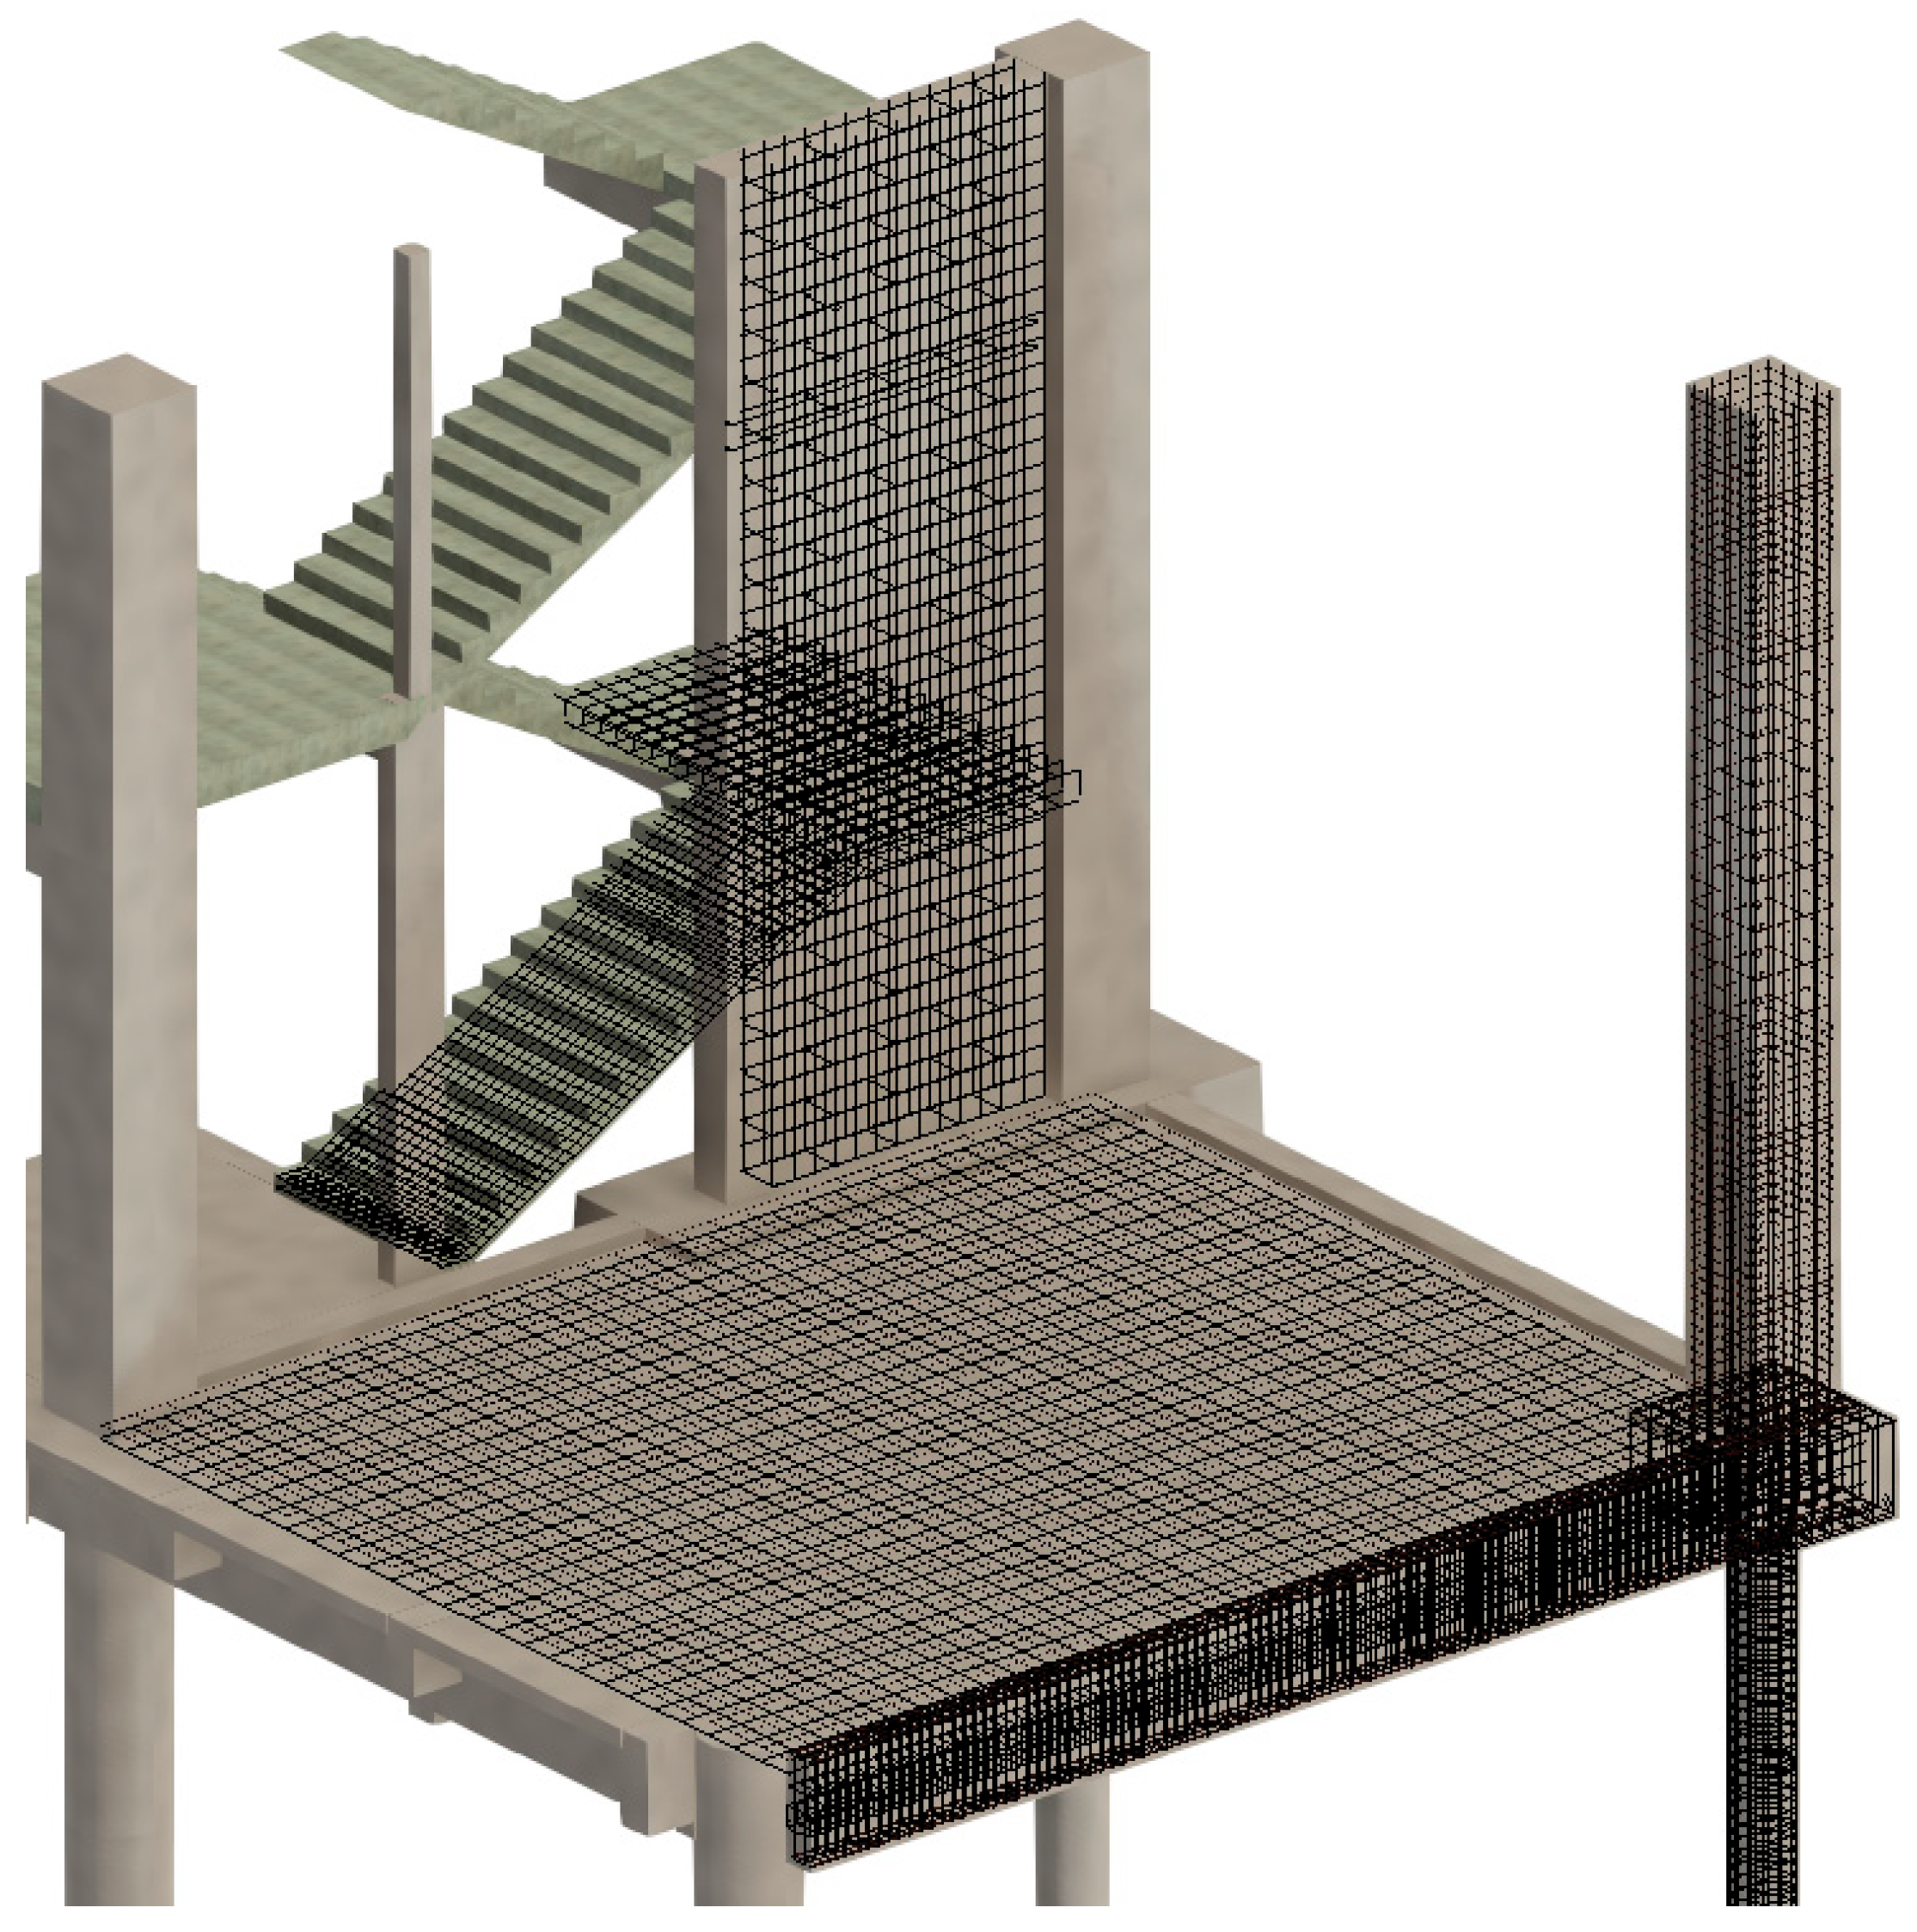
In order to validate the applicability and usefulness of Dynamo scripts in real project cycles, a specific public building project (Figure 8) was chosen as a case study. In this project, reinforcement bars are arranged for each different member type and parameters are set for the construction cycle of each member. For example, the foundation was set to be constructed in the first week, the floor beams and footings were scheduled to be constructed in the second week, the structural columns and walls were planned to be constructed in the third week, and so on for subsequent scheduling.
This scheduling approach allowed effective evaluation of the Dynamo script across different construction phases, improving coordination and supporting planned progress. The method contributed to resource optimization and workflow efficiency, enhancing overall project management.
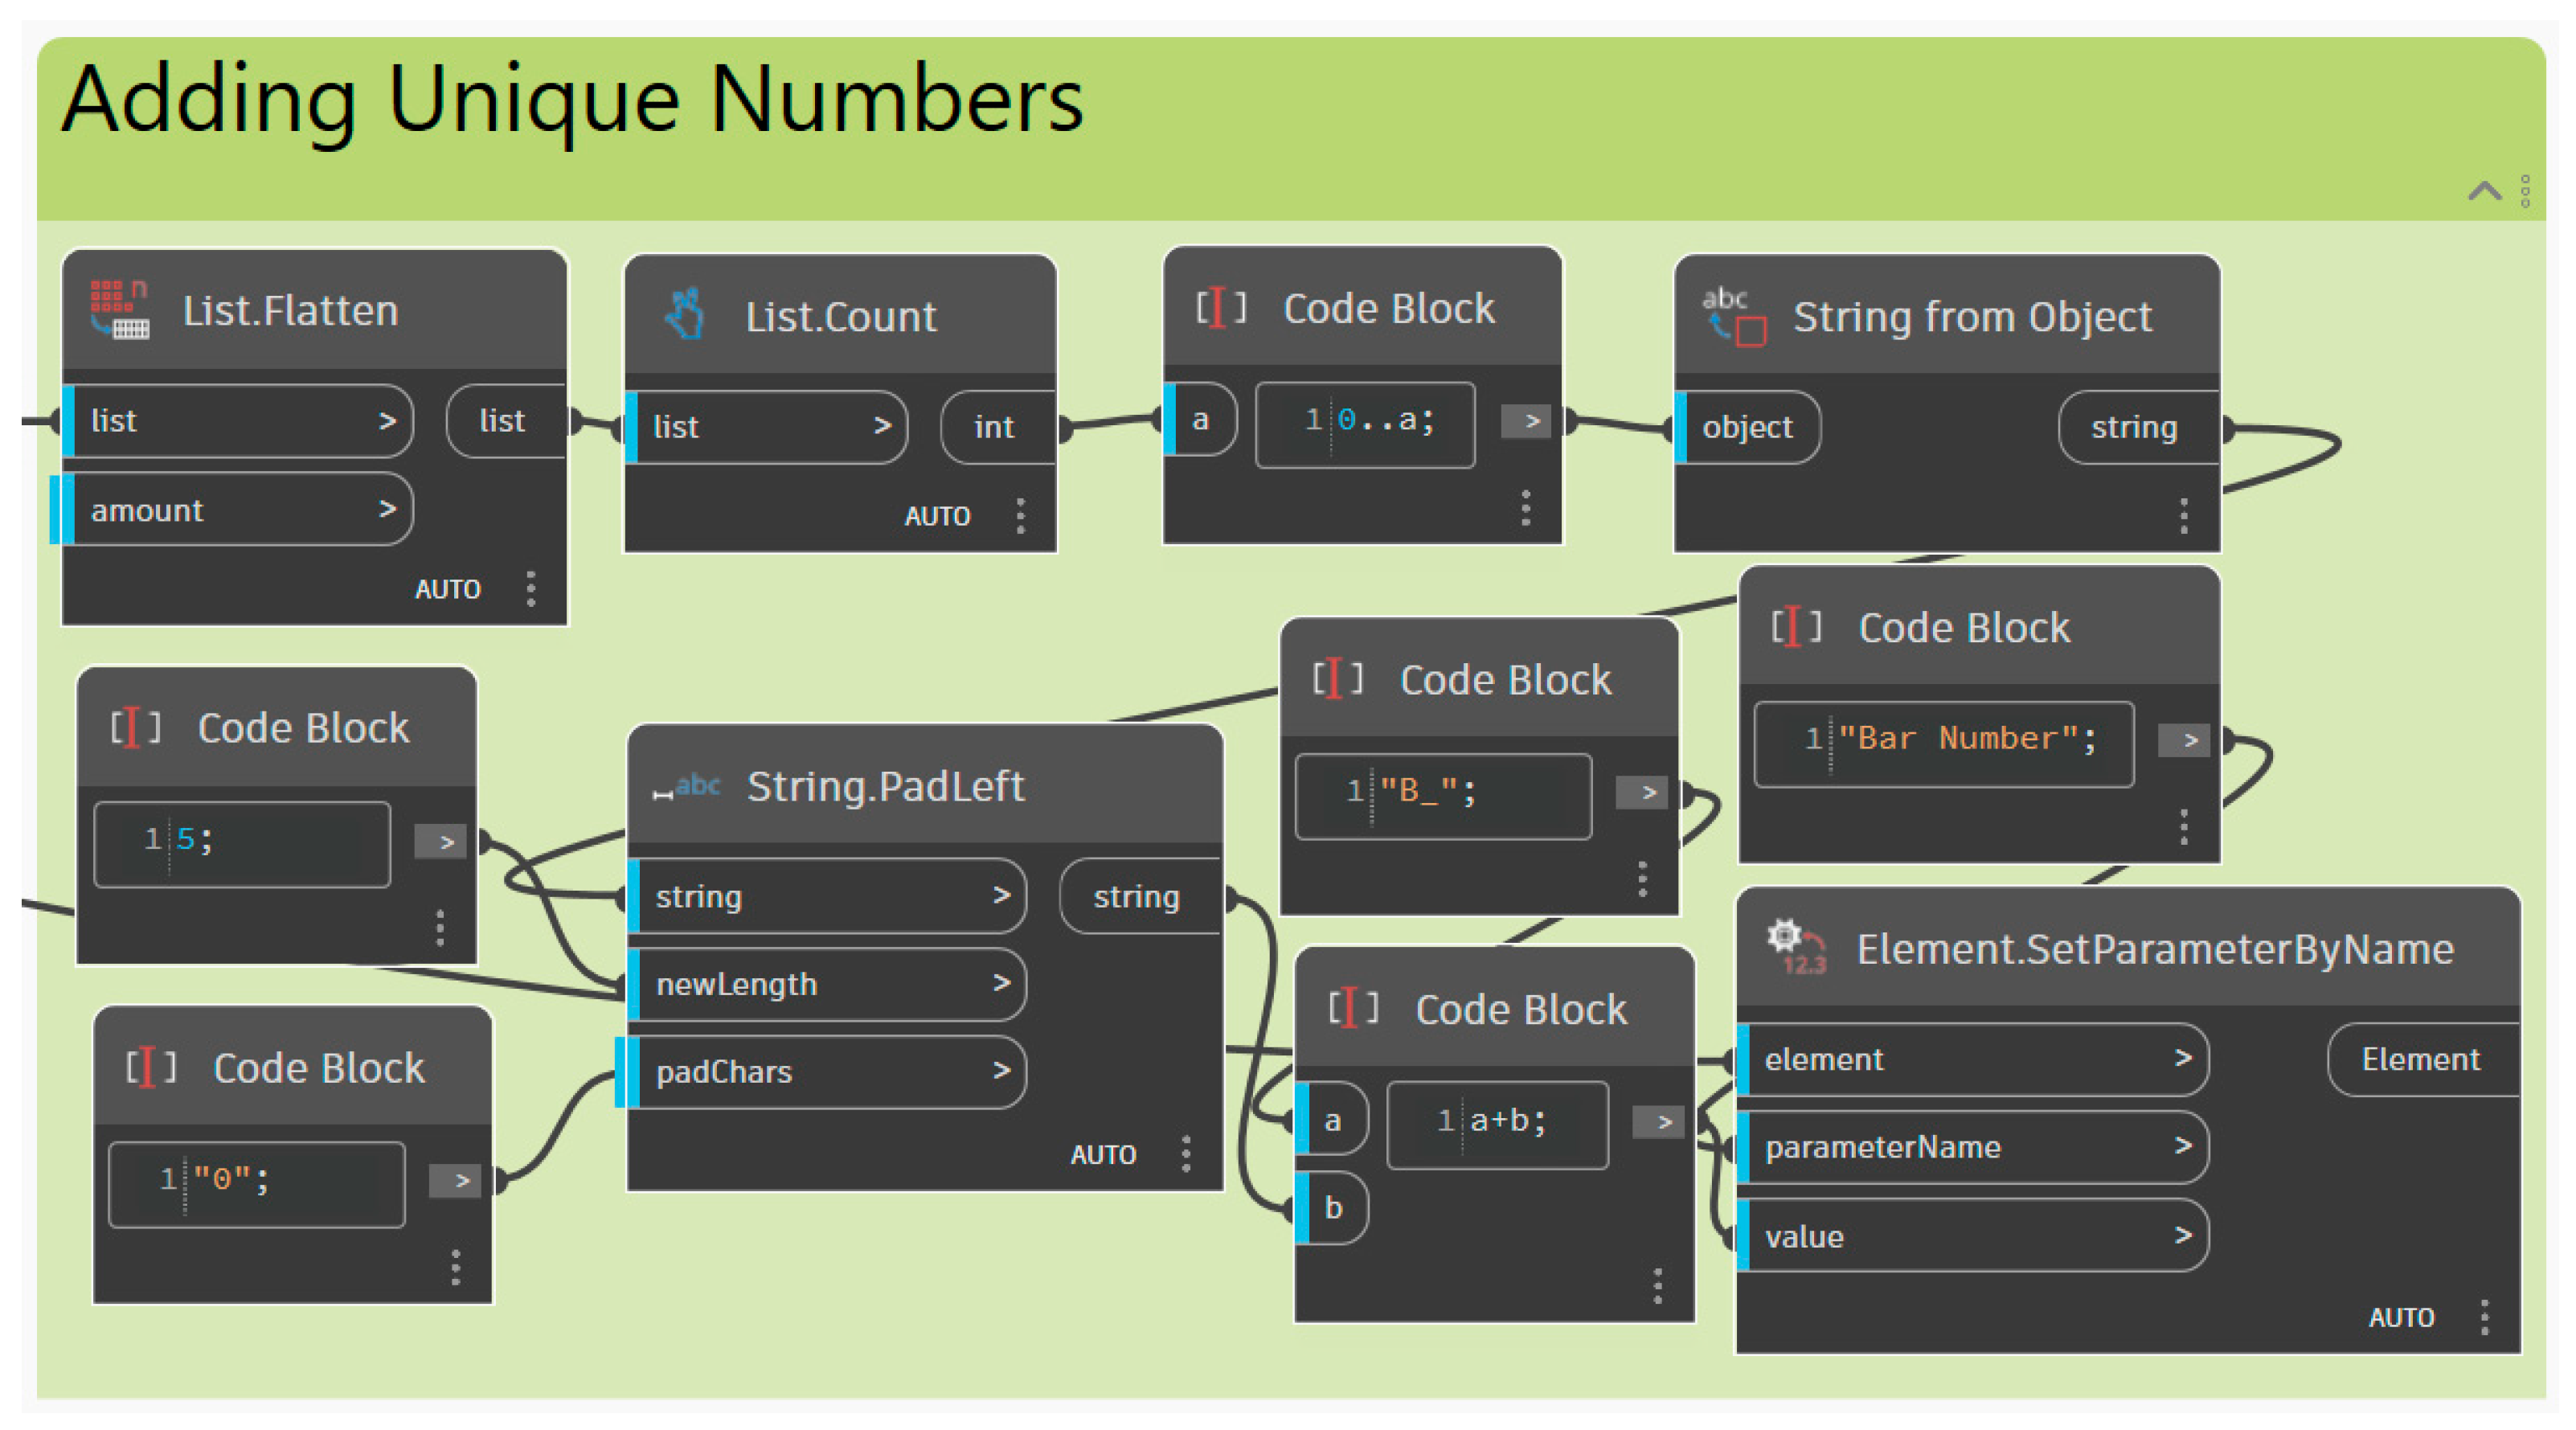
Prior to rebar cutting, each rebar group was assigned a unique identifier in the 3D model using Dynamo (Figure 9). This numbering system supported accurate positioning and clear association with corresponding structural elements, facilitating rebar allocation and providing a basis for optimizing subsequent cutting processes. As a result, site transportation and installation were streamlined, improving both efficiency and construction accuracy.
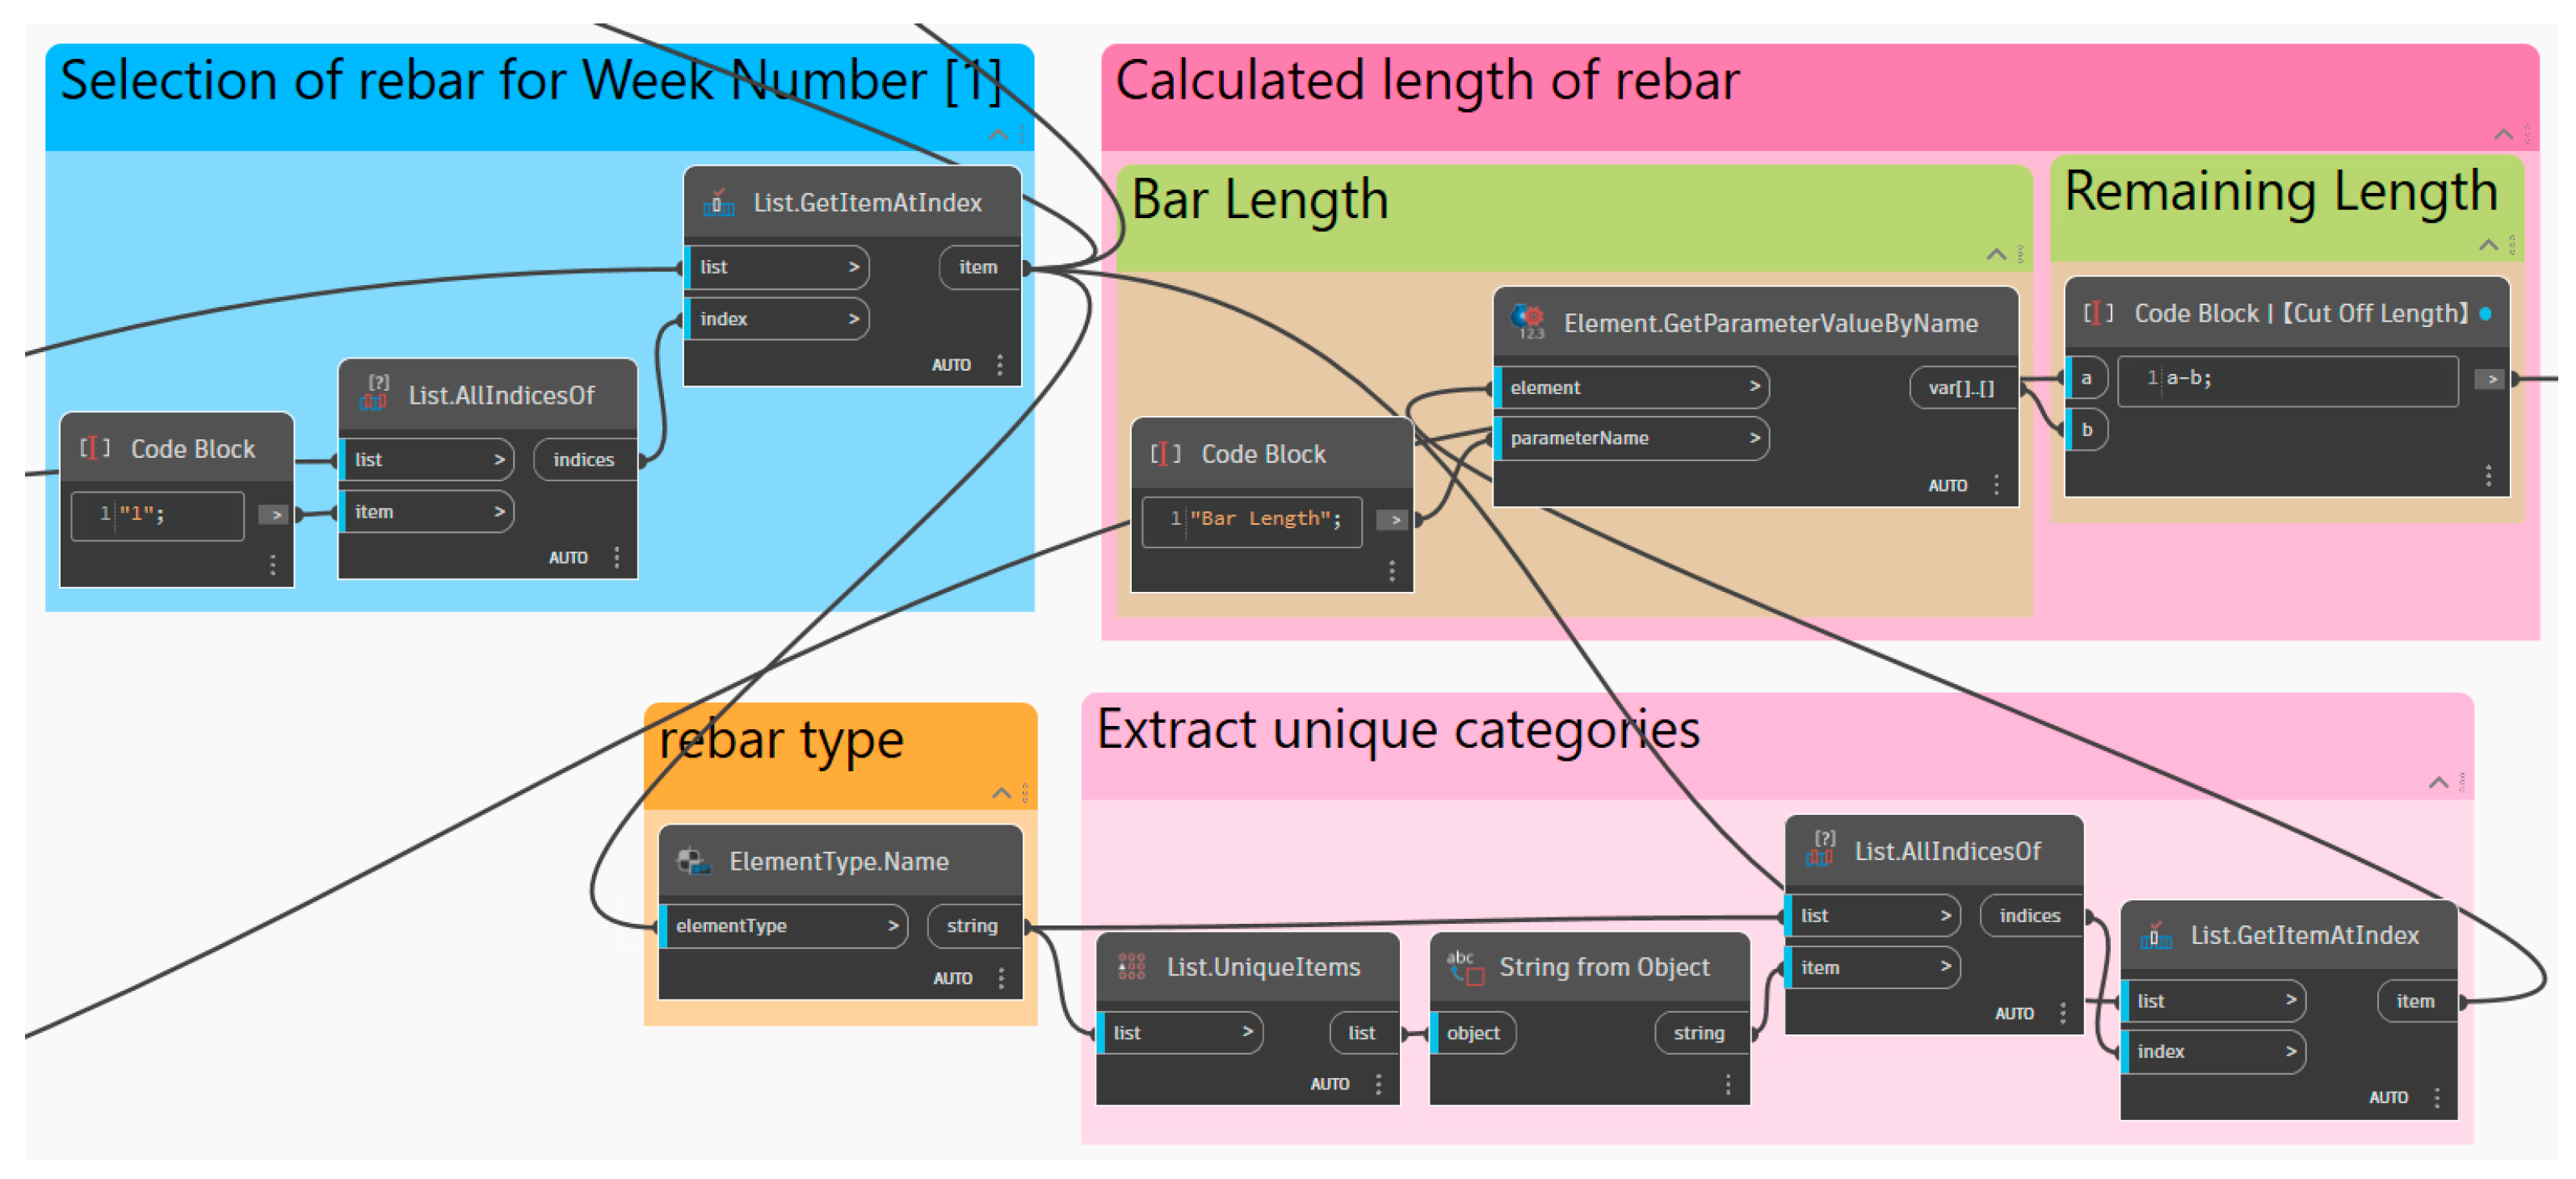
Required rebar types for each week were filtered from the model (Figure 10), and cutting was performed based on specified dimensions. Similar rebar types were grouped and documented, with data stored for future reference.
The same method was applied to rebar requirements in subsequent weeks. By comparing new demand with remaining stock lengths, reuse was prioritized where possible to minimize waste. Unusable materials were temporarily stored or discarded, while new rebar was sourced when no suitable stock was available. This optimization process supported waste reduction and cost control while maintaining operational efficiency.
This point was found to be of research value during the closing phase of the case. Therefore, in order to verify the feasibility of this research point, preliminary tests were conducted by creating reinforcement bars only for different categories of individual members on an existing BIM 3D model. By calculating the optimized length and cost of rebar for single members of the same category and using the breakdown table to count the number of members of the same type, and secondly, by calculating the information related to the rebar of the same type, in order to derive the optimized length and cost of rebar for the whole case; the specific data are shown in Table 2.
In this case, by calculating the types and lengths of reinforcing bars for different components, a total of 351 reinforcing bars were required. However, after optimization using the script, at least 54 reinforcing bars could be optimized, reducing the quantity by 15.38% and saving approximately USD 220 in costs. As shown in Table 2, the greatest cost savings are achieved for structural column components, while the least savings are achieved for stair components. This aligns with the basic composition characteristics of the project’s components.
As shown in Table 3, by calculating the costs of individual components of different types, it is possible to roughly estimate the cost savings for components of the same type. However, since the project is already in its final stages, we can only compare the existing costs paid at each stage with the rough costs after optimizing the script. This comparison shows that if the optimization is applied to the structural columns of the entire project, approximately USD 11,495.22 can be saved. When applied throughout the entire project, this approach can save USD 29,117.09, representing approximately a 17% cost reduction for the entire project, indicating that the application of the script is relatively successful.
As shown in Table 2, for reinforcing bars of the same type, although the commonly used diameters are 8 mm and 10 mm, the wasted length of reinforcing bars is also the highest. Therefore, in response to this phenomenon, it is currently believed that the script can be further optimized. There are primarily two solutions. The first solution involves purchasing reinforcing bars of different specifications in standard lengths, with common standard lengths typically being 6 m, 9 m, and 12 m. If the script can determine the optimal standard length of reinforcing bars to purchase based on the calculated reinforcing bar length and the required reinforcing bars for each component, this can minimize the amount of wasted reinforcing bars and select the optimal solution. For example, if purchasing 10 m steel bars results in the least amount of wasted steel bars, they can be custom-made in advance at the factory. The second solution involves combining different types of steel bars based on existing lengths to minimize wasted steel bars, thereby further reducing steel bar waste. Both solutions require strong mathematical logic and familiarity with relevant algorithms, and are currently being addressed to facilitate further refinement in the future.

4.2. Case Study 2

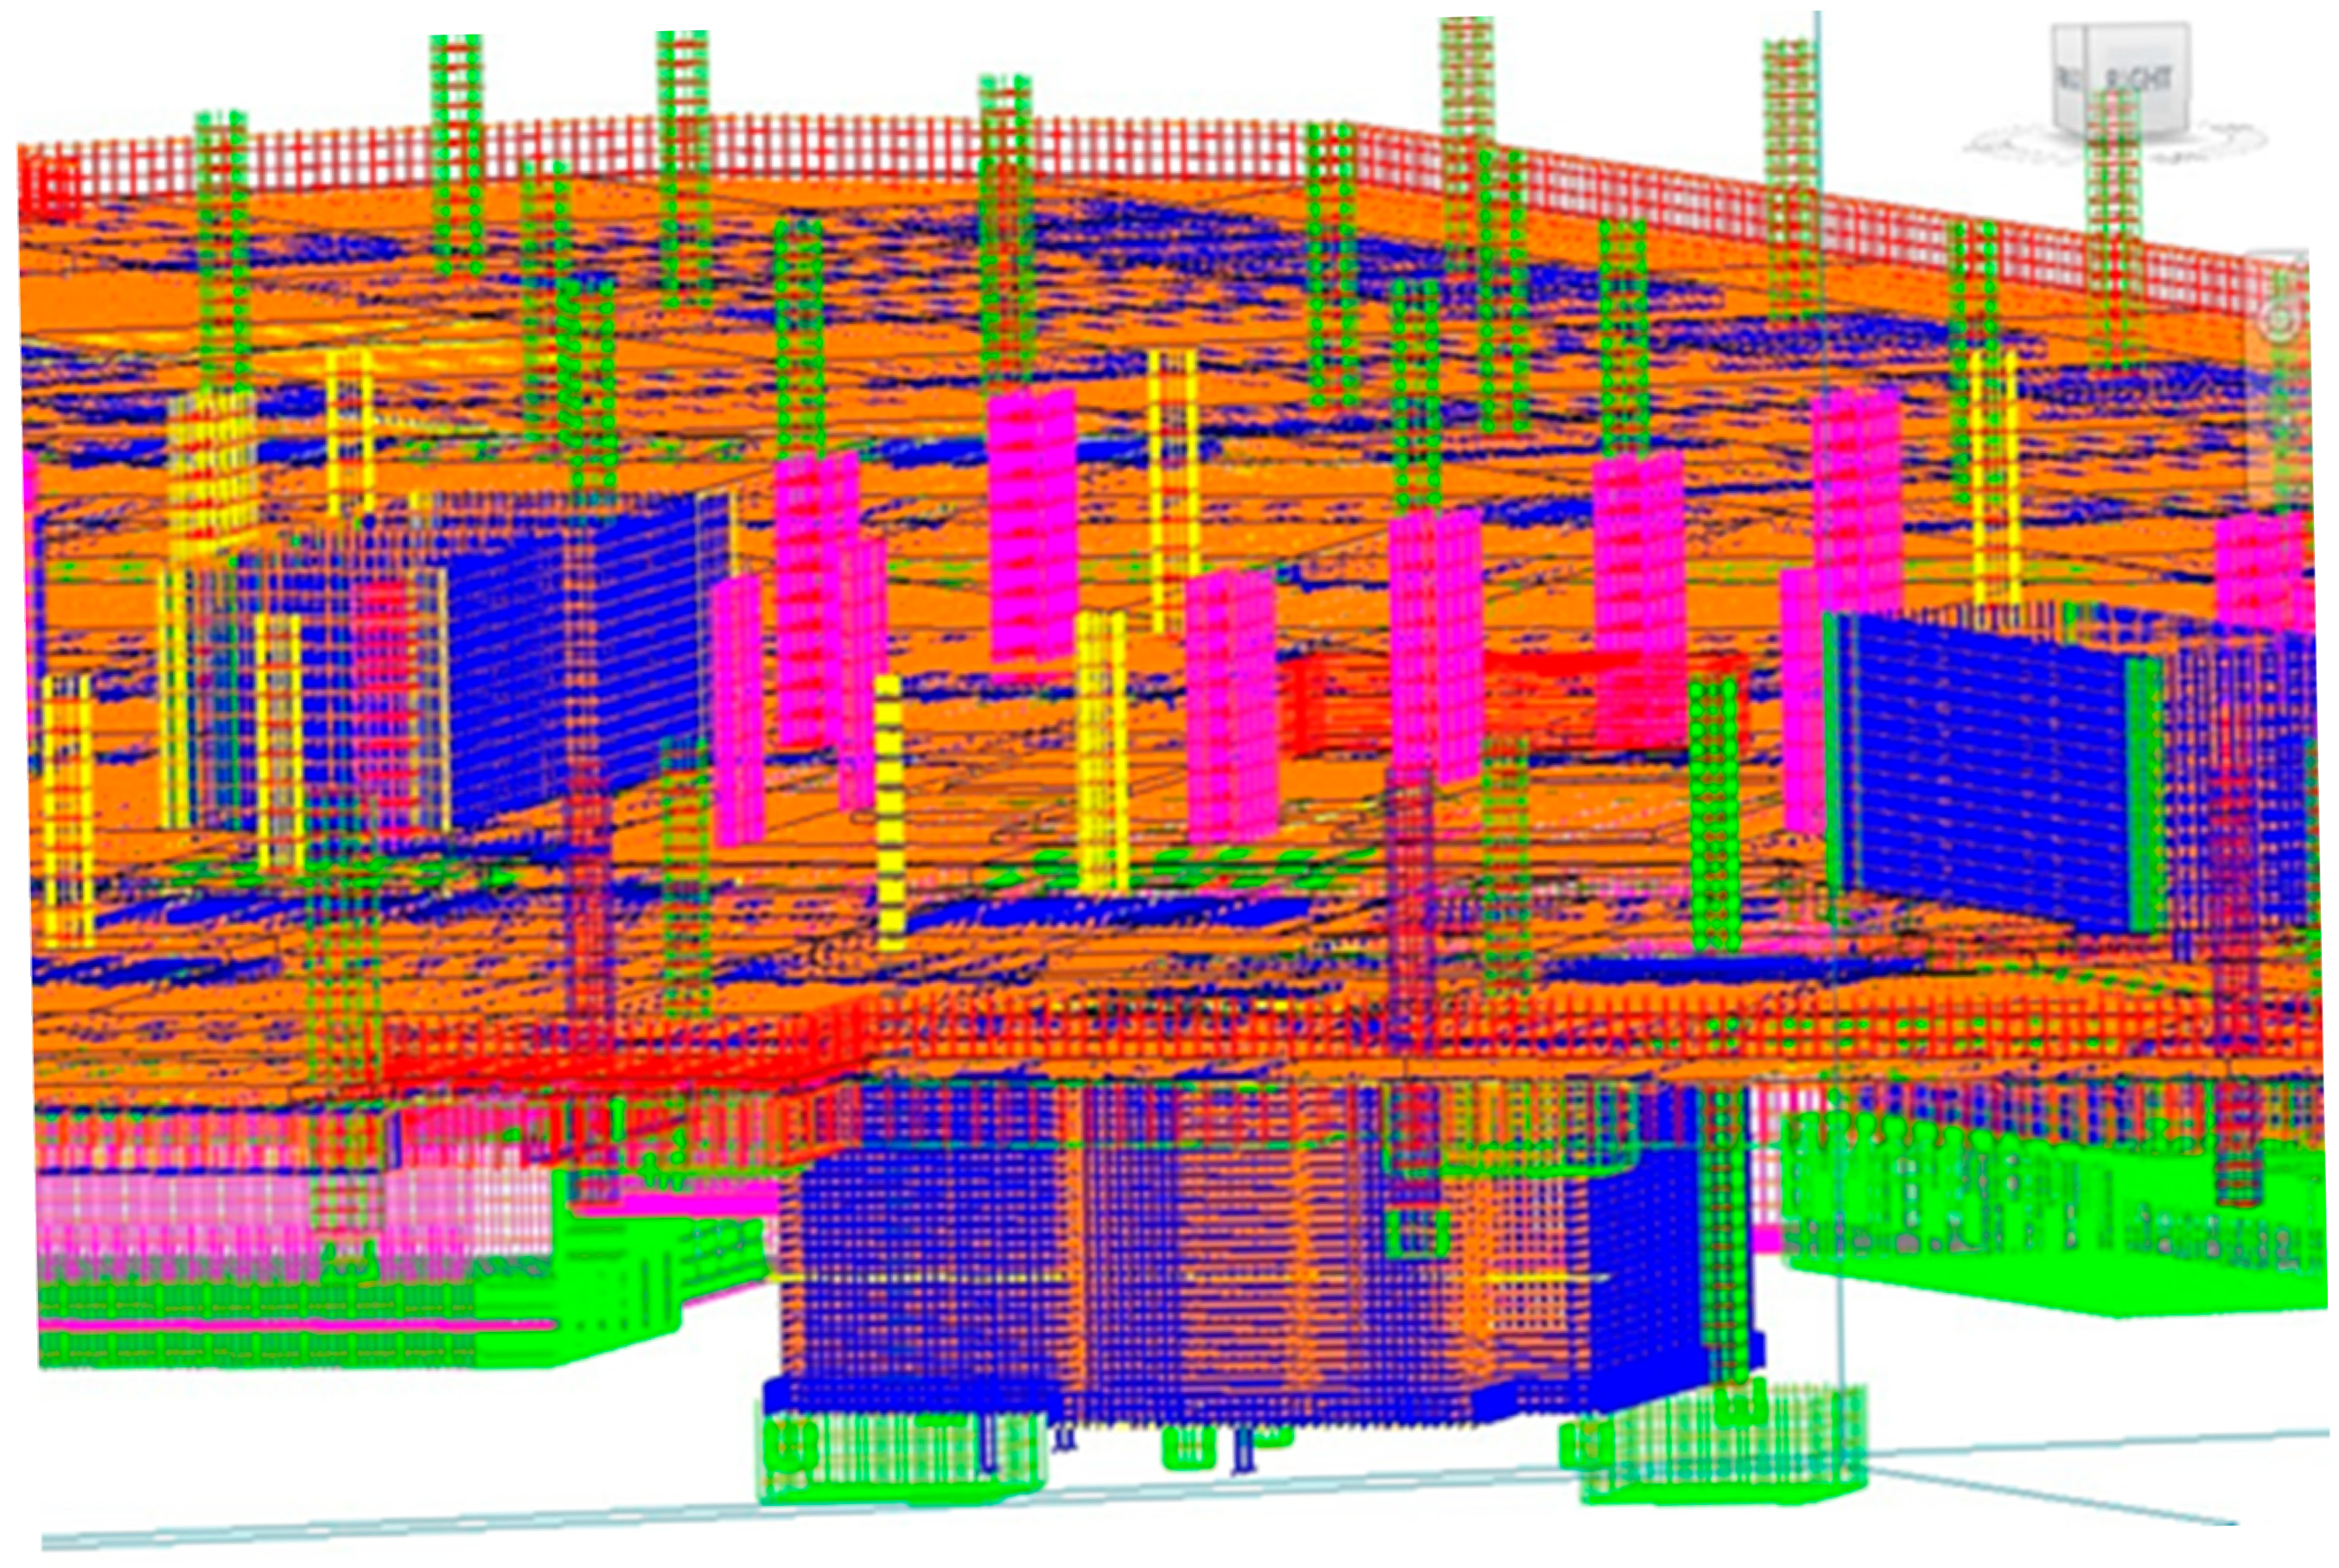
The second project was a 15-storey commercial building located in Sarawak, Malaysia, specifically chosen for its reinforcement in the BIM model as illustrated in Figure 11.
The first validation test was conducted with two groups of pile caps. The first group consists of 19 pile caps of four different types, totaling roughly 59 m3 in volume. The second group consists of 23 pile caps of three different types, totaling roughly 88 m3. These areas were chosen to validate the script’s effectiveness when dealing with components of varying size and shape and yet use the same three types of bars. This type of test is typical when used for a location-based optimization technique, which can be used for resource optimization [33]. The second test was conducted with two groups of ground beams. Both groups consist of five 300 mm × 750 mm ground beams measuring 42 m in length. These areas were chosen to test the script’s effectiveness when dealing with highly repetitive work involving the same lengths and types of rebar week after week. The third test was conducted on two groups of slabs; both consisted of five slabs of a single type (S1). These areas were chosen because of the irregular shape of the slabs, which necessitated the use of varying rebar sets. These are rebar sets in which every bar is of a varying length, which would likely produce different results. In the final test, the underground sewage treatment plant (STP) slabs were selected for the first week, followed by the STP columns and walls placed directly on top of it to form the various chambers. The reason for choosing this area is to test the script’s effectiveness when work is transitioning from one category of a component to another; in this case, from concrete slabs to concrete columns and walls.
To assess the effectiveness of the script, three performance metrics were chosen for measurement, namely (a) the number of production bars used, (b) the total quantity of waste generated (in tons), and (c) the overall cost savings. The script’s effectiveness must be compared to benchmarks, using the Best-Case Scenario and the Worst-Case Scenario, to understand its relative performance in these metrics. The Best-Case Scenario is a hypothetical one wherein almost every millimeter of production bar ordered is used to create finished bars. This results in a near-perfect optimization that generates 0% waste. To calculate the number of bars used here, the Total Bar Length for the week is simply divided by the Production Length. In contrast, the Worst-Case Scenario is a hypothetical one wherein each required bar length is created with its own production length, the remaining cut-off length being discarded. Since no attempt at optimization is even being attempted, this purposely maximizes waste to 100%. The number of production bars used in this scenario is simply equal to the total number of bars required that week. Calculating the quantity of waste generated is also straightforward since this is just the sum of cut-off lengths. Finally, there is the Actual Scenario where each of the previous metrics is calculated in post-optimization. The relative efficiency can then be evaluated by determining where the actual optimization results place on a scale between the Best- and Worst-Case Scenarios. For example, if the actual optimization results show that only half the material waste was produced as in the Worst-Case Scenario (no optimization) results, it can be said that the script achieved a 100% waste reduction. The material savings can then be translated into cost savings to determine the real-world value of the optimization.
Table 4 presents data across three performance metrics for each scenario. This table aggregates all rebar types to provide an overview of the results for each test. However, it is crucial to analyze the performance by rebar type due to their differing masses, which significantly affect the amount of waste generated and, consequently, potential cost savings. For instance, consider a pile cap using T12, T20, and T25 bars. If the script optimizes T12 bar fabrication effectively, it could substantially reduce the number of production bars required. In contrast, the T20 and T25 bars, being nearly twice as heavy, contribute minimally to waste reduction and cost savings. Since rebar is purchased by weight, the savings from waste for these heavier bars are negligible. Therefore, examining performance by rebar type is essential for a comprehensive understanding of the overall results.

4.2.1. Analysis of the First Component—Pile Caps

In this analysis, the script successfully reduced the total number of production bars by 16.5%, amounting to 186 bars, and decreased waste by 23%, totaling 6.2 tons, which led to a substantial cost reduction of USD 3611. When categorized by rebar type, the script demonstrated remarkable efficacy with T20 bars, accounting for 140 of the 186 saved bars and contributing USD 2111 to the overall savings, which exceeds half of the total reduction. Conversely, the T12 bars exhibited subpar performance, with only six bars salvaged, yielding a minimal cost saving of USD 29.
Upon reviewing the rebar schedules for the two-week period, it was ascertained that the T20 bars predominantly consisted of medium-length bars within the range of 4000–7000 mm, facilitating the script’s matching process. In contrast, the T12 and T25 bars were predominantly short in length (less than 4 m) during both weeks, resulting in a surplus of long cut-off lengths. Regrettably, none of the four pile caps tested required long rebar lengths, leading to a significant amount of waste, particularly with the heavier T25 bars.
From these initial findings, two key observations were made: First, medium-length bars are generally more readily matched due to their higher prevalence in pile caps. Second, if short or long cut-off lengths are produced in one week, the subsequent week should incorporate the complementary category lengths to facilitate utilization. This essentially suggests that the work schedule should be adjusted to alternate between smaller- and larger-sized pile caps each week, thereby substantially reducing rebar waste.
Despite this limitation, the overall cost saving of USD 3611 in this instance is notably substantial, especially considering that it was achieved by optimizing only 23 pile caps, which total approximately 88 m3. If this level of performance is extrapolated to the entire 306 pile caps, which approximate 2845 m3, it could potentially result in savings of up to USD 50,000.

4.2.2. Analysis of the Second Component—Ground Beams

In this instance, the script facilitated the preservation of a total of 22 production bars, representing a 22% reduction, and 0.47 tons of waste, which corresponds to a 48% reduction. This has culminated in an overall cost saving of USD 261. When categorized by rebar type, the script demonstrated exceptional performance with specific bars (T12 and T25), achieving near-perfect optimization. This is attributed to the fact that these bars were predominantly composed of medium-length segments ranging from 4000 to 7000 mm, which facilitated the script’s matching process. This indicates that, despite the relatively modest number of bars saved, a significant impact on waste reduction was achieved, particularly due to the well-optimized T25 bars constituting the majority of the weight saved.
Conversely, the T10 bars exhibited poor performance in optimization, although this had a minimal effect on cost savings. This is due to the light weight and lower cost of T10 bars. Upon examination of the rebar schedules for both weeks, it was observed that T10 bars are utilized in the creation of ties along the beams. This necessitates a large quantity of short bars, consequently generating numerous long-length cut-offs. While beams do indeed require many long-length bars, they are not of the T10 type, rendering these bars unusable.
This second set of findings corroborates the initial test’s revelations that medium-length bars are more readily matched, irrespective of the component or area of application. The test also highlighted that repetitive tasks performed over an extended period are likely to yield suboptimal results, as any unused length categories will tend to accumulate. With short-length cut-offs, this may be tolerable, particularly if they consist of the more economical T10 bars. However, should this accumulation occur with long-length cut-off of a heavier type, it could result in a substantial waste of rebar. The sole solution to this issue is to subject these long-length cut-offs to multiple optimization cycles, thereby enabling them to be repurposed into numerous new short bars.

4.2.3. Analysis of the Third Component—Slabs

Upon application, the optimization script demonstrated significant material and cost efficiencies, conserving 6943 production bars—a reduction of 38.3%—and reducing waste by 8.80 tons, equivalent to a 41% decrease. This yielded a total cost saving of USD 9302. Analysis of the fabrication schedules revealed that the initial week produced a substantial volume of both short- and long-category bars in nearly balanced proportions. In the following week, despite increased variability in rebar sets, the ratio of short to long bars remained consistent. The exclusive use of T10 bars in this slab type helped mitigate potential variability in material properties. Under these aligned conditions, the script established an optimal matching environment, which contributed significantly to the observed reduction in waste.
This case study revealed that optimization efforts in components, such as slabs that employ a single type of rebar, are considerably more efficient. This is because it maximizes the script’s capacity to identify matches. Due to the configuration of slab reinforcements, cut-offs from the creation of long bars can frequently be repurposed to produce short bars, and vice versa, particularly in rectangular slabs. In contrast, square slabs, which incorporate uniform rebar lengths in their design, tend to perform poorly, generating substantial waste, with the exception of 12 m × 12 m slabs that yield zero waste. This observation presents an opportunity for further investigation and experimentation to ascertain the most efficient slab geometry for such optimization endeavors. Should the performance level demonstrated in this trial be extrapolated to all slabs across the 15 levels of the building, it is projected that an exceptional cost saving could be realized.

4.2.4. Analysis of the Fourth Component—Sewage Treatment Plant (STP)

In this instance, the script exhibited considerable inconsistency in its optimization process. Despite this, it was successful in reducing the number of bars by 944 units, which corresponds to a 17.8% decrease, and in saving 12 tons of waste, representing a 23% reduction. However, none of the T25 cut-offs from the preceding week were utilizable for the subsequent task, leading to a cost saving of merely USD 4775. This figure could have been higher, as USD 2494 worth of T25 was rendered wasteful. The potential causes for this wastage are as follows:
Firstly, the STP slab contained approximately 700 m of T25, whereas the subsequent STP walls contained none. This implies that none of the cut-off lengths could be repurposed for future use. Secondly, there was a discrepancy between the volume of the STP and that of the aforementioned cases. In the aforementioned cases, only half the quantity of rebar was present, while in this instance, there were insufficient cut-off lengths to facilitate future production. These findings underscore the unpredictability of the script’s management of one category of components to the next, particularly when these categories necessitate different types of rebar and are characterized by significantly different volumes.
In many instances, such outcomes are inevitable. Nevertheless, further testing is warranted to ascertain whether a more efficient workflow can be established. For instance, it is conceivable that if the STP slabs were succeeded by a series of columns incorporating T25, rather than the STP walls which contained none, a substantially more favorable outcome might have been achieved.

5. Discussions and Conclusions

5.1. Summary and Interpretation of Results

This study developed a BIM-based rebar fabrication optimization method utilizing multi-dimensional model data and visual programming, which was validated through two case studies with substantial savings of USD 29,117 and USD 20,653, respectively, as shown in Table 5. Extrapolating these outcomes to the full project scope suggests the potential for significantly multiplied cost benefits. The integration of 3D BIM geometry with 4D scheduling information via an intelligent algorithm proved effective in guiding on-site rebar cutting and reuse, leading to a noticeable reduction in material waste.

5.2. Research Contributions

This study makes several key contributions within the BIM environment, advancing the field beyond traditional, isolated optimization methods. The specific contributions are threefold:
  • Development of a Novel Computational Framework for Proactive Waste Minimization. This research introduces an intelligent Dynamo script embedded in BIM that moves beyond reactive cutting stock solutions. By automatically determining optimal rebar cut-off lengths based on construction schedules and integrating manufacturing constraints upfront, the method proactively minimizes material waste at the source. This provides a practical digital tool for implementing circular economy strategies in steel construction, generating structurally efficient designs that are inherently material-efficient.
  • Empirical Validation through Real-World Implementation and Performance Benchmarking. The proposed framework was implemented and evaluated in a commercial construction project, demonstrating measurable savings in both time and materials. This practical performance evaluation in an authentic setting underscores the method’s immediate applicability and commercial viability, providing robust evidence to support its potential for industry-wide adoption.
  • A Paradigm Shift in Optimization through Seamless Digital Integration. The work bridges the gap between structural design, fabrication, and supply chain logistics. By producing a digital inventory of components directly from the design model, the framework enables seamless integration with prefabrication and supply chain logistics. This facilitates accurate material ordering, off-site production, and streamlined project management, establishing a cohesive workflow that paves the way for enhanced resource efficiency and digitalization in construction.

5.3. Limitations and Future Research Directions

Despite its promising results, this study has several limitations that provide valuable avenues for future research:
  • Optimization Algorithm Constraints: The current method employs a “one-pass” optimization with a list-based sorting mechanism, which does not guarantee a globally optimal solution and may potentially underestimate the maximum achievable savings. Future work should explore more advanced techniques, such as heuristic algorithms or multi-criteria decision analysis, to narrow the gap between the achieved results and a theoretical optimum.
  • Applicability and Model Dependency: The method’s effectiveness is primarily demonstrated on standard rebar types and regular geometries. Its applicability to structures with highly irregular shapes or projects with a wide variety of non-standard bar types requires further validation. Furthermore, the optimization is highly sensitive to the accuracy and detail of the underlying BIM model. Inaccurate rebar geometry or incomplete information can compromise performance, underscoring the critical need for high Levels of Information Need (LOIN) and Development (LOD).
  • Scalability and Robustness in Practical Scenarios: The case study validation, while positive, highlights the need to investigate the method’s scalability to very large-scale projects or its integration into high-volume prefabrication facilities. Additionally, the current framework does not account for dynamic external factors such as weather, labor skill variability, and on-site logistical changes, which can influence material usage and schedule on active construction sites. Integrating these variables would significantly improve the method’s robustness and real-world adaptability.

5.4. Conclusions

In conclusion, this research developed a BIM-based optimization method that leverages multi-dimensional model details and visual programming to enhance rebar fabrication efficiency and reduce material waste. First, the study introduced an intelligent Dynamo script integrated with BIM, which utilizes 4D scheduling information to determine optimal cut-off lengths and improve material reuse. Second, the method was empirically validated in two case studies, where it achieved significant cost savings and demonstrated practical applicability. Third, the research highlights the essential role of integrating 3D and 4D BIM data in supporting sustainable construction practices through computational optimization. Finally, while the current method shows promising results, it establishes a foundational framework ready for algorithmic enhancement. Future work will focus on integrating more advanced optimization techniques, such as multi-pass optimization, genetic algorithms, or machine learning, to pursue global optima and further elevate the performance and intelligence of the system. This work contributes to the emerging body of knowledge on BIM-enabled rebar optimization and offers a replicable framework for further innovation in this area.

Author Contributions

Conceptualization, X.L., C.C., and H.-Y.C.; methodology, Y.L. (Yu Luo) and Y.L. (Yiminxuan Liu); software, Y.L. (Yu Luo).; validation, Y.L. (Yu Luo), Y.H., and Z.Z.; formal analysis, Y.L. (Yu Luo).; investigation, Y.L. (Yu Luo).; resources, X.L.; data curation, X.L.; writing—original draft preparation, Y.L. (Yu Luo) and C.C.; writing—review and editing, X.L. and H.-Y.C.; visualization, X.L.; supervision, H.-Y.C.; project administration, H.-Y.C., funding acquisition, X.L. All authors have read and agreed to the published version of the manuscript.

Funding

The research was funded by the Ministry of Higher Education Malaysia, Fundamental Research Grant Scheme (FRGS), grant reference FRGS/1/2018/SS03/UM/02/3, as well as Chongqing University of Science and Technology (CQUST) under the Graduate Student Innovation Program projects, with the KIC numbers of YKJCX2420602, YKJCX2420601, and YKJCX2420604.

Institutional Review Board Statement

Not applicable.

Data Availability Statement

The original contributions presented in this study are included in the article. Further inquiries can be directed to the corresponding author(s).

Conflicts of Interest

The authors declare no conflicts of interest.

Abbreviations

The following abbreviations are used in this manuscript:
APIApplication Programming Interface
BIMBuilding Information Modeling
AECOArchitecture, Engineering, Construction, and Operations
VEValue Engineering
3DThird Dimension
4DFourth Dimension
HGAHybrid Genetic Algorithm
CSPCutting Stock Problem
IFCIndustry Foundation Class

References

  1. Umar, U.A.; Shafiq, N.; Ahmad, F.A. A case study on the effective implementation of the reuse and recycling of construction & demolition waste management practices in Malaysia. Ain Shams Eng. J. 2021, 12, 283–291. [Google Scholar] [CrossRef]
  2. Morsi, D.M.A.; Ismaeel, W.S.E.; Ehab, A.; Othman, A.A.E. BIM-based life cycle assessment for different structural system scenarios of a residential building. Ain Shams Eng. J. 2022, 13, 101802. [Google Scholar] [CrossRef]
  3. Nicał, A. Optimization of reinforcement steel supply to precast concrete plants. Arab. J. Geosci. 2019, 12, 207. [Google Scholar] [CrossRef]
  4. Nigussie, T.; Chandrasekar, M.K. Influence of rebar practice in the total cost of building construction projects: The case of hawassa city, ethiopia. Int. J. Eng. Sci. Tech. 2020, 12, 54–65. [Google Scholar] [CrossRef]
  5. Cho, S.; Na, S. The Reduction of CO2 Emissions by Application of High-Strength Reinforcing Bars to Three Different Structural Systems in South Korea. Sustainability 2017, 9, 1652. [Google Scholar] [CrossRef]
  6. Hu, Y.; Castro-Lacouture, D. Clash relevance prediction based on machine learning. J. Comput. Civ. Eng. 2019, 33, 04018060. [Google Scholar] [CrossRef]
  7. Liu, J.; Liu, P.; Feng, L.; Wu, W.; Li, D.; Chen, Y.F. Automated clash resolution for reinforcement steel design in concrete frames via Q-learning and building information modeling. Autom. Constr. 2020, 112, 103062. [Google Scholar] [CrossRef]
  8. Zhang, J.P.; Hu, Z.Z. BIM- and 4D-based integrated solution of analysis and management for conflicts and structural safety problems during construction: 1. Principles and methodologies. Autom. Constr. 2011, 20, 155–166. [Google Scholar] [CrossRef]
  9. Liu, Y.; Li, M.; Wong, B.C.L.; Chan, C.M.; Cheng, J.C.P.; Gan, V.J.L. BIM-BVBS integration with openBIM standards for automatic prefabrication of steel reinforcement. Autom. Constr. 2021, 125, 103654. [Google Scholar] [CrossRef]
  10. Lien, L.-C.; Dolgorsuren, U. BIM-based steel reinforcing bar detail construction design and picking optimization. Structures 2023, 49, 520–536. [Google Scholar] [CrossRef]
  11. Liu, P.; Qi, H.; Liu, J.; Feng, L.; Li, D.; Guo, J. Automated clash resolution for reinforcement steel design in precast concrete wall panels via generative adversarial network and reinforcement learning. Adv. Eng. Inform. 2023, 58, 102131. [Google Scholar] [CrossRef]
  12. Tan, Y.; Xu, W.; Chen, K.; Deng, C.; Wang, P. An interactive and collaborative augmented reality environment for civil engineering education: Steel reinforcement bars teaching as an example. ECAM 2024, 31, 1100–1122. [Google Scholar] [CrossRef]
  13. Khant, L.P.; Widjaja, D.D.; Kwon, K.; Kim, S. A BIM-based bar bending schedule generation algorithm with enhanced accuracy. Buildings 2024, 14, 1207. [Google Scholar] [CrossRef]
  14. Khan, A.M.; Alaloul, W.S.; Musarat, M.A.; Fayyaz, A.M. Optimizing sustainable alternatives in value engineering Decision-Making through BIM-Integrated plugin automation for buildings. Ain Shams Eng. J. 2025, 16, 103373. [Google Scholar] [CrossRef]
  15. Shi, A.; Shirowzhan, S.; Sepasgozar, S.M.; Kaboli, A. 5D BIM applications in quantity surveying: Dynamo and 3D printing technologies. In Smart Cities and Construction Technologies; InTech Open: London, UK, 2020; Volume 139. [Google Scholar]
  16. Salamak, M.; Jasinski, M.; Plaszczyk, T.; Zarski, M. Analytical modelling in Dynamo. Sect. Build. Struct. Struct. Mech. 2018, 18, 36–43. [Google Scholar] [CrossRef]
  17. Alzara, M.; Yosri, A.M.; Alruwaili, A.; Cuce, E.; Eldin, S.M.; Ehab, A. Dynamo script and a BIM-based process for measuring embodied carbon in buildings during the design phase. Int. J. Low-Carbon Technol. 2023, 18, 943–955. [Google Scholar] [CrossRef]
  18. Wong, J.K.W.; Zhou, J. Enhancing environmental sustainability over building life cycles through green BIM: A review. Autom. Constr. 2015, 57, 156–165. [Google Scholar] [CrossRef]
  19. Sacks, R.; Eastman, C.M.; Lee, G.; Teicholz, P. BIM Handbook: A Guide to Building Information Modeling for Owners, Managers, Designers, Engineers, and Contractors; John Wiley & Sons: Hoboken, NJ, USA, 2018. [Google Scholar]
  20. Zheng, C.; Lu, M. Optimized reinforcement detailing design for sustainable construction: Slab case study. Procedia Eng. 2016, 145, 1478–1485. [Google Scholar] [CrossRef]
  21. Monteiro, A.; Martins, J.P. A survey on modeling guidelines for quantity takeoff-oriented BIM-based design. Autom. Constr. 2013, 35, 238–253. [Google Scholar] [CrossRef]
  22. Marzouk, M.; Hisham, M. Implementing multi-objective genetic algorithms for scheduling optimization of construction projects. Autom. Constr. 2012, 22, 434–445. [Google Scholar] [CrossRef]
  23. Kim, H.; Anderson, K.; Lee, S.; Hildreth, J. Generating construction schedules through automatic data extraction using open BIM (building information modeling) technology. Autom. Constr. 2013, 35, 285–295. [Google Scholar] [CrossRef]
  24. Mangal, M.; Wang, Q.; Cheng, J.C.P. Automated clash resolution of steel rebar in RC beam- column joints using BIM and GA. In Proceedings of the 2017 34rd ISARC, Taipei, Taiwan, 28 June–1 July 2017. [Google Scholar] [CrossRef]
  25. Ma, Z.; Wei, Z.; Zhang, X. Semi-automatic and specification-compliant cost estimation for prefabricated buildings based on BIM and ontologies. Autom. Constr. 2013, 35, 405–413. [Google Scholar] [CrossRef]
  26. Ding, L.; Zhou, Y.; Akinci, B. Building Information Modeling (BIM) application framework: The process of expanding from 3D to computable nD. Autom. Constr. 2014, 46, 82–93. [Google Scholar] [CrossRef]
  27. Cheng, J.C.P.; Li, K.C.T. Developing a BIM-Assisted 3D Access Point Placement Optimization Algorithm for Enhancing Wi-Fi Fingerprint-Based Indoor Positioning. In Computing in Civil Engineering 2019, Atlanta, Georgia; American Society of Civil Engineers: Reston, VA, USA, 2019; pp. 232–240. [Google Scholar] [CrossRef]
  28. Eastman, C.; Sacks, R.; Lee, G. Development and implementation of advanced manufacturing technologies in construction: Computer-integrated construction beyond BIM. Automation in Construction 2020, 113, 103120. [Google Scholar] [CrossRef]
  29. Liu, J.; Xu, C.; Wu, Z.; Chen, Y.F. Intelligent rebar layout in RC building frames using artificial potential field. Autom. Constr. 2020, 114, 103172. [Google Scholar] [CrossRef]
  30. Li, H.; Chan, G.; Huang, T.; Skitmore, M. A review of studies on prefabrication in construction project management. Autom. Constr. 2014, 39, 113–125. [Google Scholar] [CrossRef]
  31. Tran, T.B.; Dinh, T.P.; Nguyen, T.D.H.N.; Ly, D.H.; Kim, B.; Ahn, Y. An Integrated BIM-Based Application for Automating the Conceptual Design for Vietnamese Vernacular Architecture: Using Revit and Dynamo. Appl. Sci. 2025, 15, 6776. [Google Scholar] [CrossRef]
  32. Nguyen, T.D.H.N.; Ahn, Y.; Kim, B. Integrated Digital-Twin-Based Decision Support System for Relocatable Module Allocation Plan: Case Study of Relocatable Modular School System. Appl. Sci. 2025, 15, 2211. [Google Scholar] [CrossRef]
  33. Elghaish, F.; Abrishami, S. Developing a framework to revolutionise the 4D BIM process: IPD-based solution. CI 2020, 20, 401–420. [Google Scholar] [CrossRef]
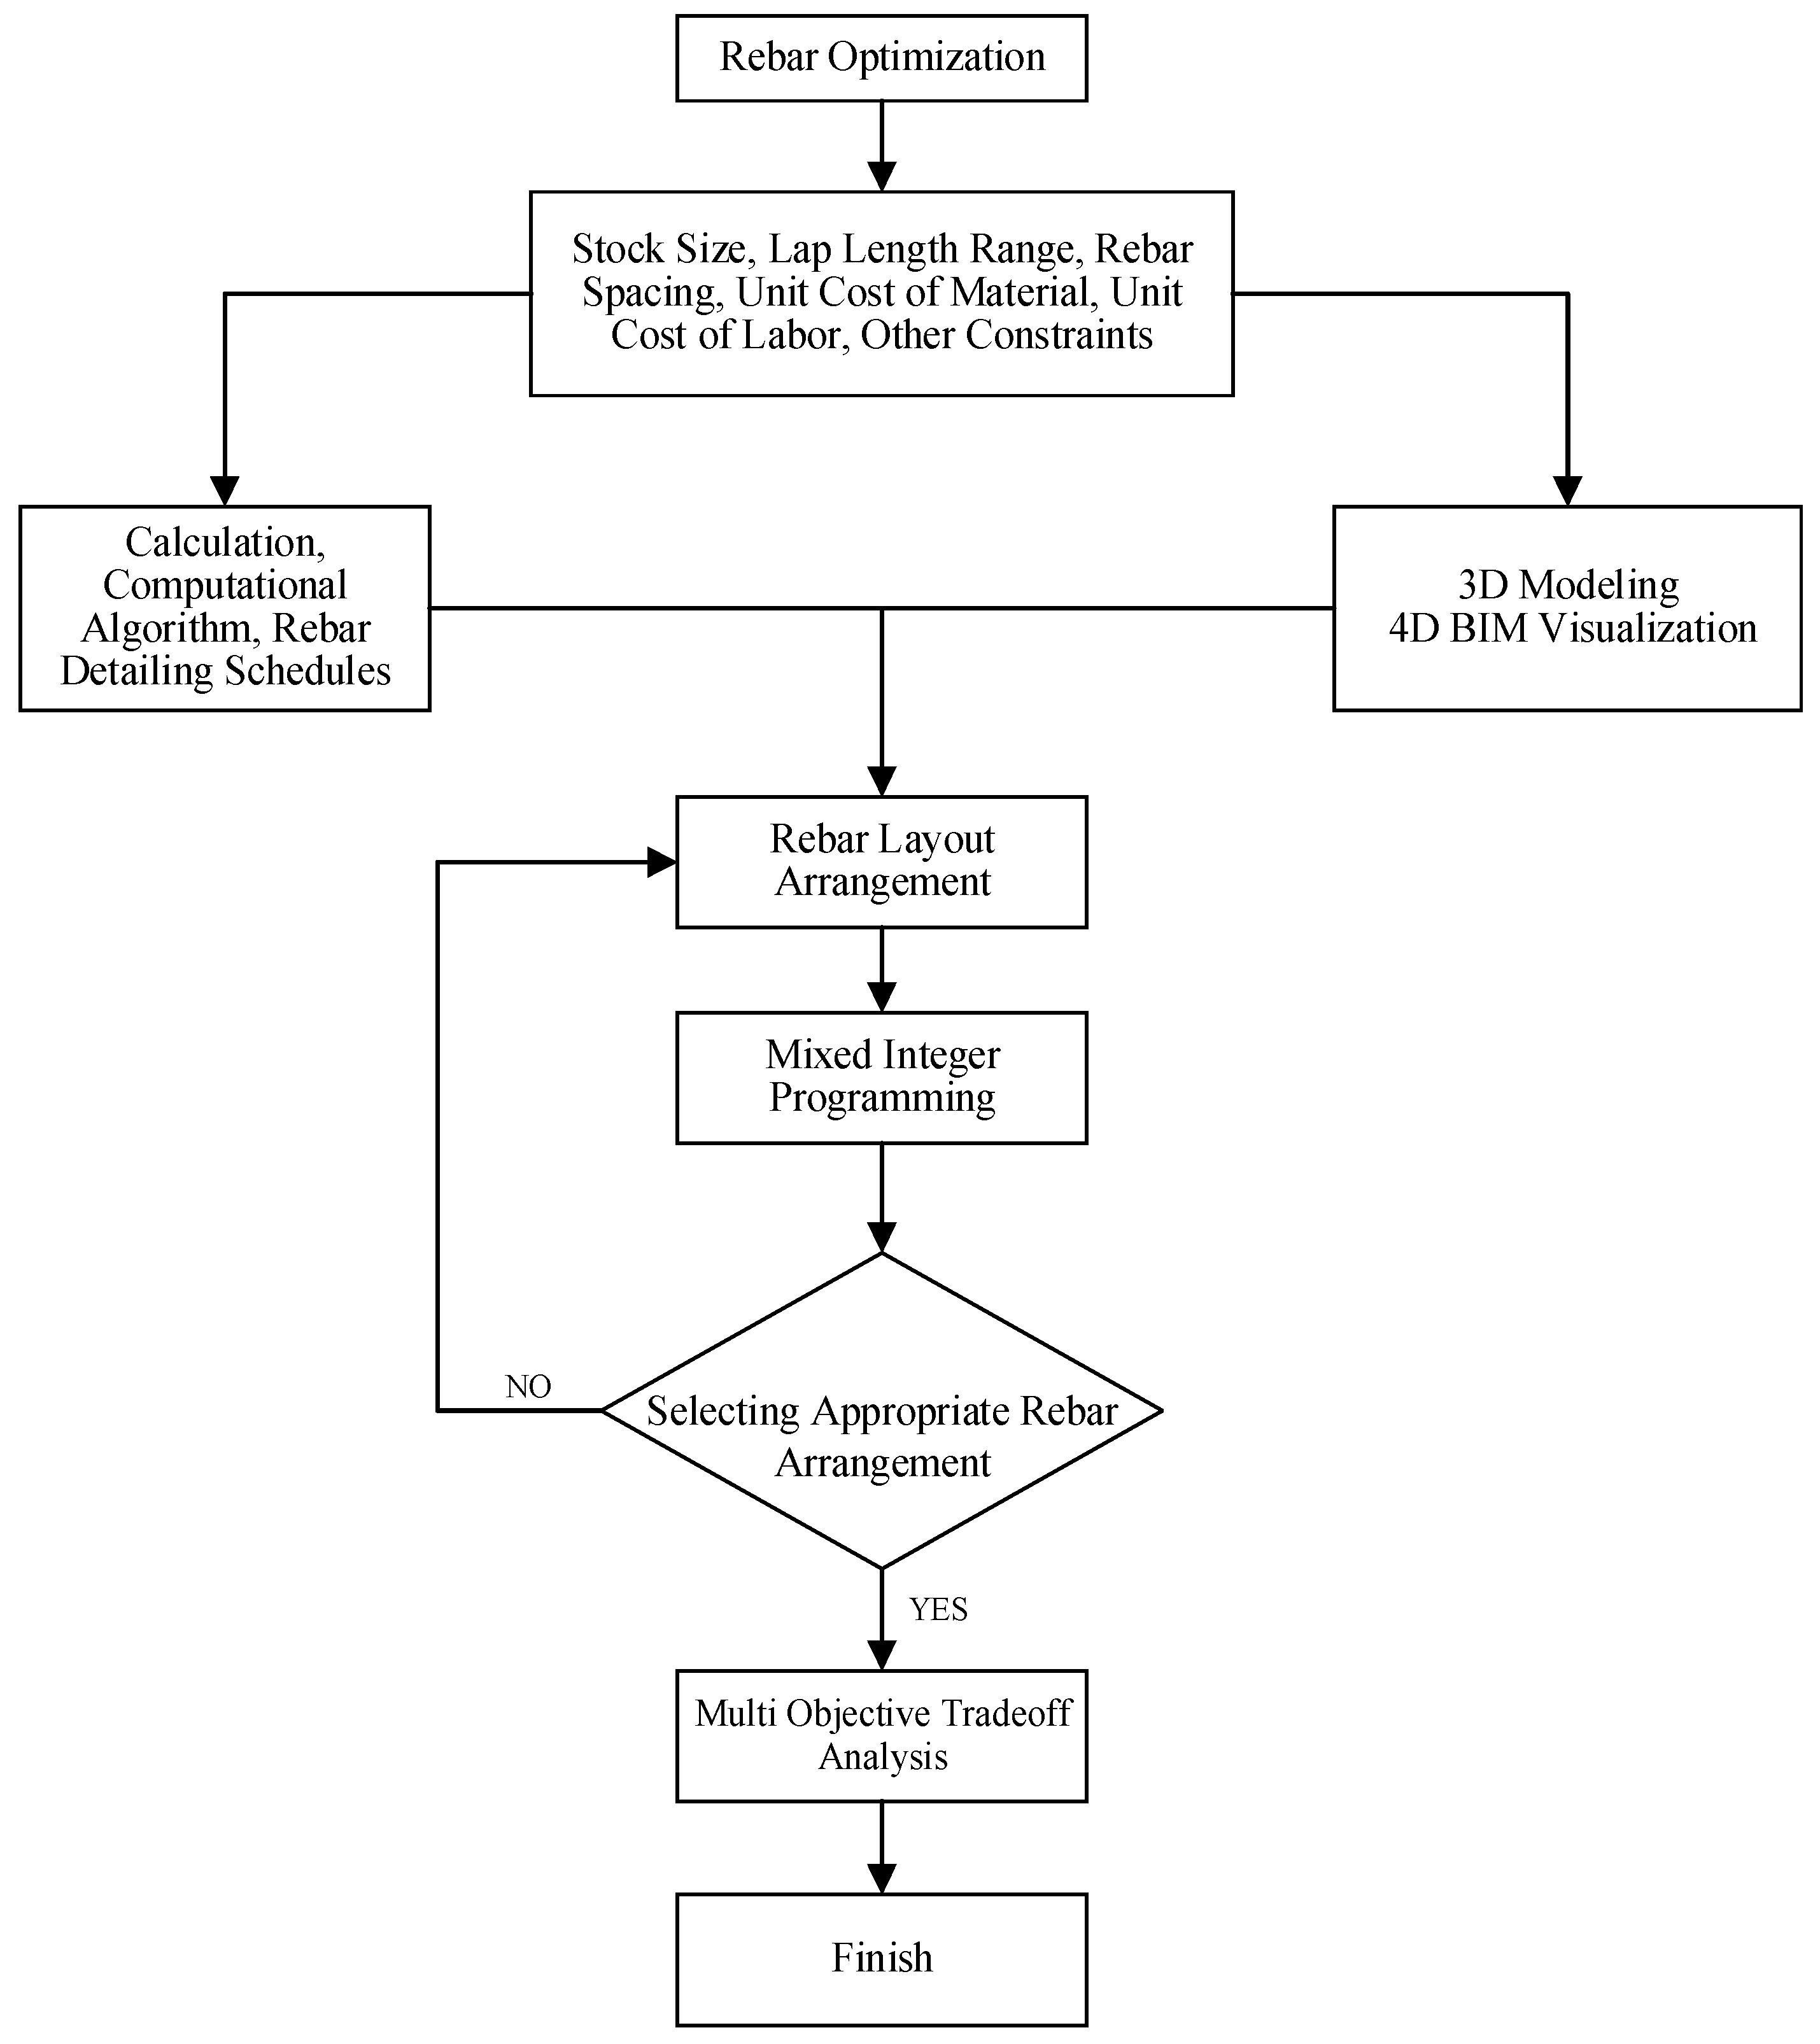
Figure 1. Multi-objective optimization process flow chart.
Applsci 15 10807 g001
Figure 2. User interface for optimization data input using Dynamo.
Applsci 15 10807 g002
Figure 3. The script as a workflow engine, bridging Dynamo, the BIM model, and fabrication scheduling to generate optimized outputs.
Applsci 15 10807 g003
Figure 4. An integrated data-driven framework that automates rebar optimization by mapping the flow of critical parameters from design inputs to fabrication-ready outputs.
Applsci 15 10807 g004
Figure 5. Scheduling using Revit, completing the bar bending schedule and bar cutting list.
Applsci 15 10807 g005
Figure 6. Bar bending schedule and bar cutting list.
Applsci 15 10807 g006
Figure 7. On-demand material selection for waste minimization, guided by the script’s decision to use either new or recycled bars.
Applsci 15 10807 g007
Figure 8. Partial rebar model of a public building project.
Applsci 15 10807 g008
Figure 9. Enabling full traceability of each rebar through automated assignment of unique identifiers, linking design to fabrication and quality control.
Applsci 15 10807 g009
Figure 10. Enhancing resource efficiency through phase-based calculation of rebar, aligning material supply with actual construction sequencing.
Applsci 15 10807 g010
Figure 11. Rebar model in a BIM-enabled commercial building.
Applsci 15 10807 g011
Table 1. Defining parameters in Revit.
Parameter NameParameter TypeFormat/UnitsExamplesDescription
Standard LengthUser InputInteger/mm12,000The length of the bars supplied by the factory.
Week NumberUser InputInteger/Number2, 3, 4, etc.Select the current week number (when cut-offs are created) and the next week’s number (when cut-offs are used).
Bar TypeModel InputString (Category)T12, T16, T20The type and diameter of the rebar.
Bar Length *Model InputInteger/mm6400Length of cut bar needed.
Host Type *Model InputString1P4The type of component that the rebar belongs to, i.e., CS1 Type Slab or 500 × 500 Column.
Host Mark *Model InputStringJ8A unique code is assigned to each component in the model for identification purposes.
Bar NumberModel InputInteger12A unique number assigned to each set of rebar within a component for identification purposes.
Cut-Off LengthCalculated ParameterInteger/mm5600The length that is cut off each bar during fabrication, i.e., production length—bar length.
Min Length by TypeCalculated ParameterInteger/mm400Defines the minimum length needed for each type of bar. Any length lower than this value will be categorized as waste.
Waste LengthCalculated ParameterInteger/mm5600The length that is wasted after rebar sorting under their respective categories.
Cut-Off CategoryCalculated ParameterString (Category)Waste, Short, Medium, LongRebar categories for categorization and matching purposes.
New Bar CategoryCalculated ParameterString (Category)Short, Medium, LongRebar categories for categorization and matching purposes.
Recycled BarCalculated ParameterBooleanTrue/FalseDefines whether or not this bar is made from a fresh production length or a previous cut-off length.
Donor RebarCalculated ParameterCombined String
(Host Type + Host Mark + Rebar Mark)
PC–J7–B/13.5When Recycled Bar = True, this parameter shows which cut-off length can be used here.
Next RebarCalculated ParameterCombined String
(Host Type + Host Mark + Rebar Mark)
PC–J7–B/13.5If a match is found, this parameter shows where the cut-off length can be used next.
* Denotes parameters that already exist within Revit.
Table 2. Cost breakdown of reinforcing rebar for different types of individual components.
Element TypeRebar Type (φ)Total Length (m)Waste Rebar Length (m)Cost Savings
(Converted to USD)
structural foundation879.522.2434.21
1271.690.32
14109.7634.24
1844.83.2
structural framework8457.676.1642.74
1259.412.6
2035.080.92
2537.7610.24
structural column10253.5963.9972.57
20126.8417.16
2542.285.72
structural wall850.60.1824.09
10454.2255.78
slab8478.36112.6431.07
10478.36112.64
stairs8308.5111.9315.53
1091.628.4
Total cost savings220.21
Table 3. Breakdown of savings achieved by successfully implementing the script in the project.
Element TypeRebar Type (φ)Total Tonnage (T)Tons of Waste
Generated (T)
Cost Savings
(Converted to USD)
structural foundation81.090.04877.51
122.220.01
144.651.66
183.140.26
structural framework837.960.515231.24
1211.082.34
2018.200.47
2530.538.28
structural column1038.339.6711,495.22
2076.7610.38
2539.885.40
structural wall80.600.002470.02
108.411.03
slab839.689.3410,901.50
1061.9814.59
stairs81.710.07141.60
100.790.25
Total cost savings29,117.09
Table 4. Overall results from the optimization in the second case study.
Element TypeNo of Production
Bars Used
Tons of Waste
Generated (T)
Weight Difference% ChangeCost Savings
(Converted to USD)
BestActualWorstBestActualWorst(Worst—Actual)
Pile Cap19593711230.0327.1433.356.2023%3611
Ground Beams401611830.040.991.470.4748%261
Slabs189208990320.0021.4930.298.8041%9302
STP (Mixed)2878549564390.0152.8164.8812.06623%7270
Total3302868216,7770.08295.70129.9834.2836%20,653
Table 5. Summary of the cost savings outcomes from the case studies.
Case StudyElement TypeTons of Waste
Generated (T)
% ChangeCost Savings
(Converted to USD)
BestActualWorst
1structural foundation0.011.651.9618%877.51
structural framework0.078.2711.6240%5231.24
structural column0.0419.3825.4531%11,495.22
structural wall0.0020.781.0332%470.02
slab0.0214.5923.9464%10,901.50
stairs0.030.240.3129%141.60
Total cost savings29,117.09
2Pile Cap0.0327.1433.3523%3611
Ground Beams0.040.991.4748%261
Slabs0.0021.4930.2941%9302
STP (Mixed)0.0152.8164.8823%7270
Total cost savings20,653
Disclaimer/Publisher’s Note: The statements, opinions and data contained in all publications are solely those of the individual author(s) and contributor(s) and not of MDPI and/or the editor(s). MDPI and/or the editor(s) disclaim responsibility for any injury to people or property resulting from any ideas, methods, instructions or products referred to in the content.