Understanding and Quantifying the Impact of Adverse Weather on Construction Productivity
Abstract
1. Introduction
2. Literature Review
2.1. Impact of Adverse Weather Events on Construction
2.2. Research on Multiple Adverse Weather Events in Construction
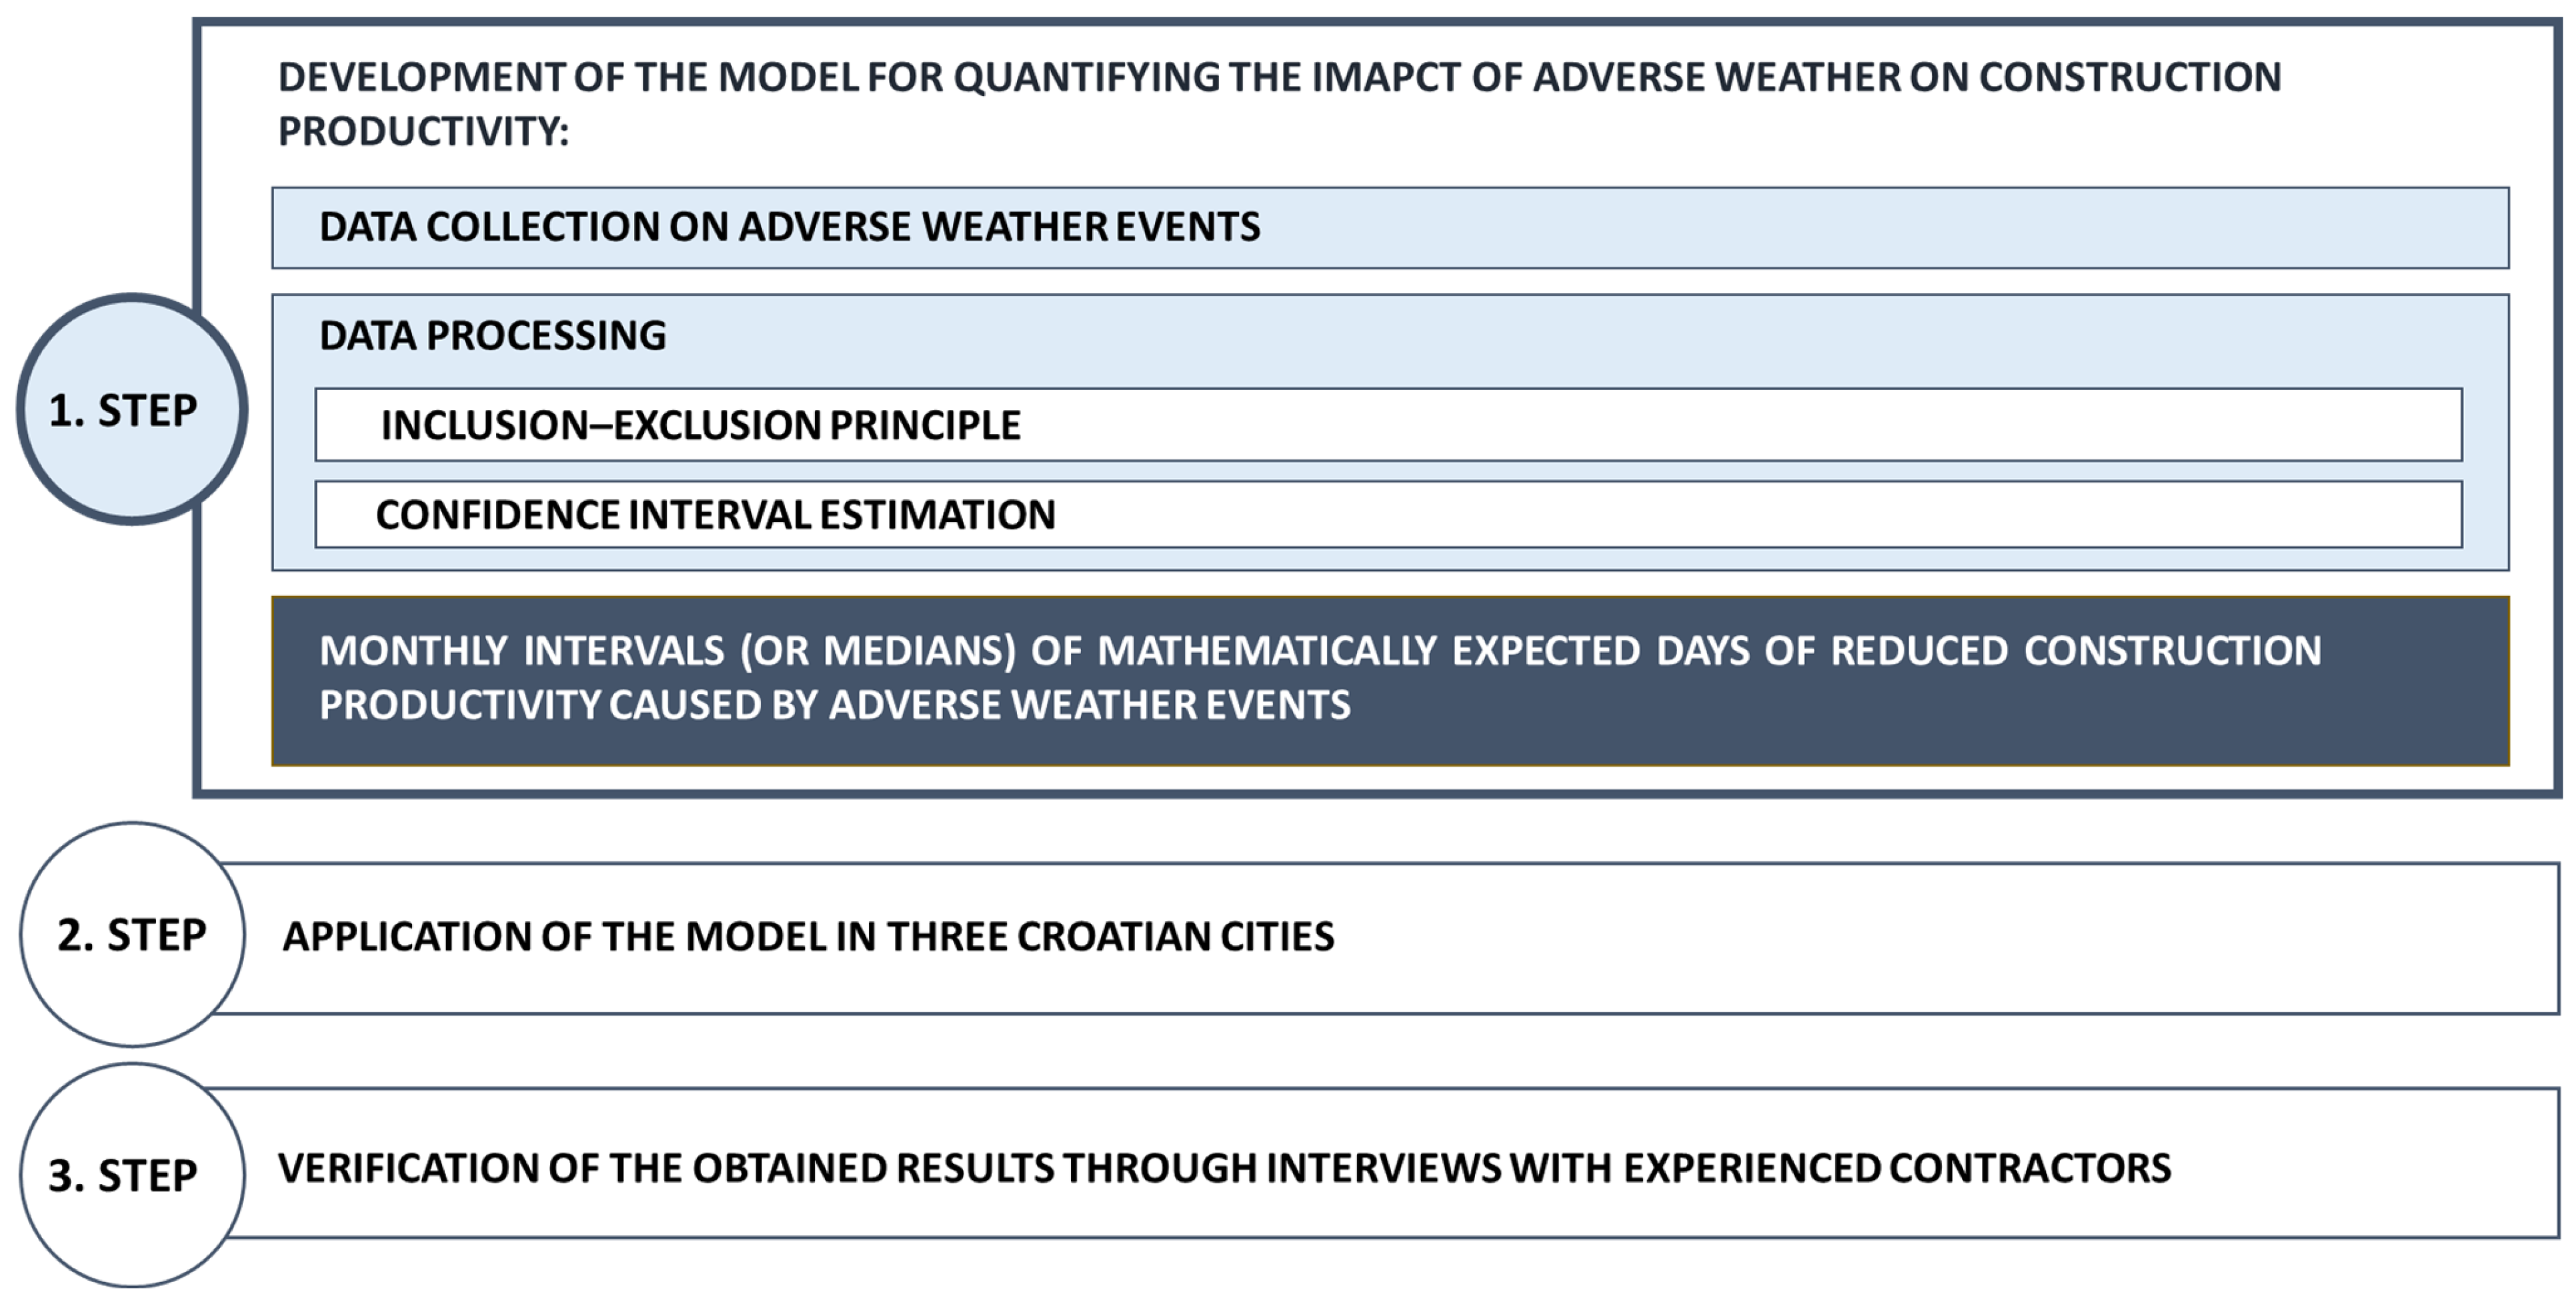
3. Model Development for Quantifying the Impact of Adverse Weather on Construction Productivity
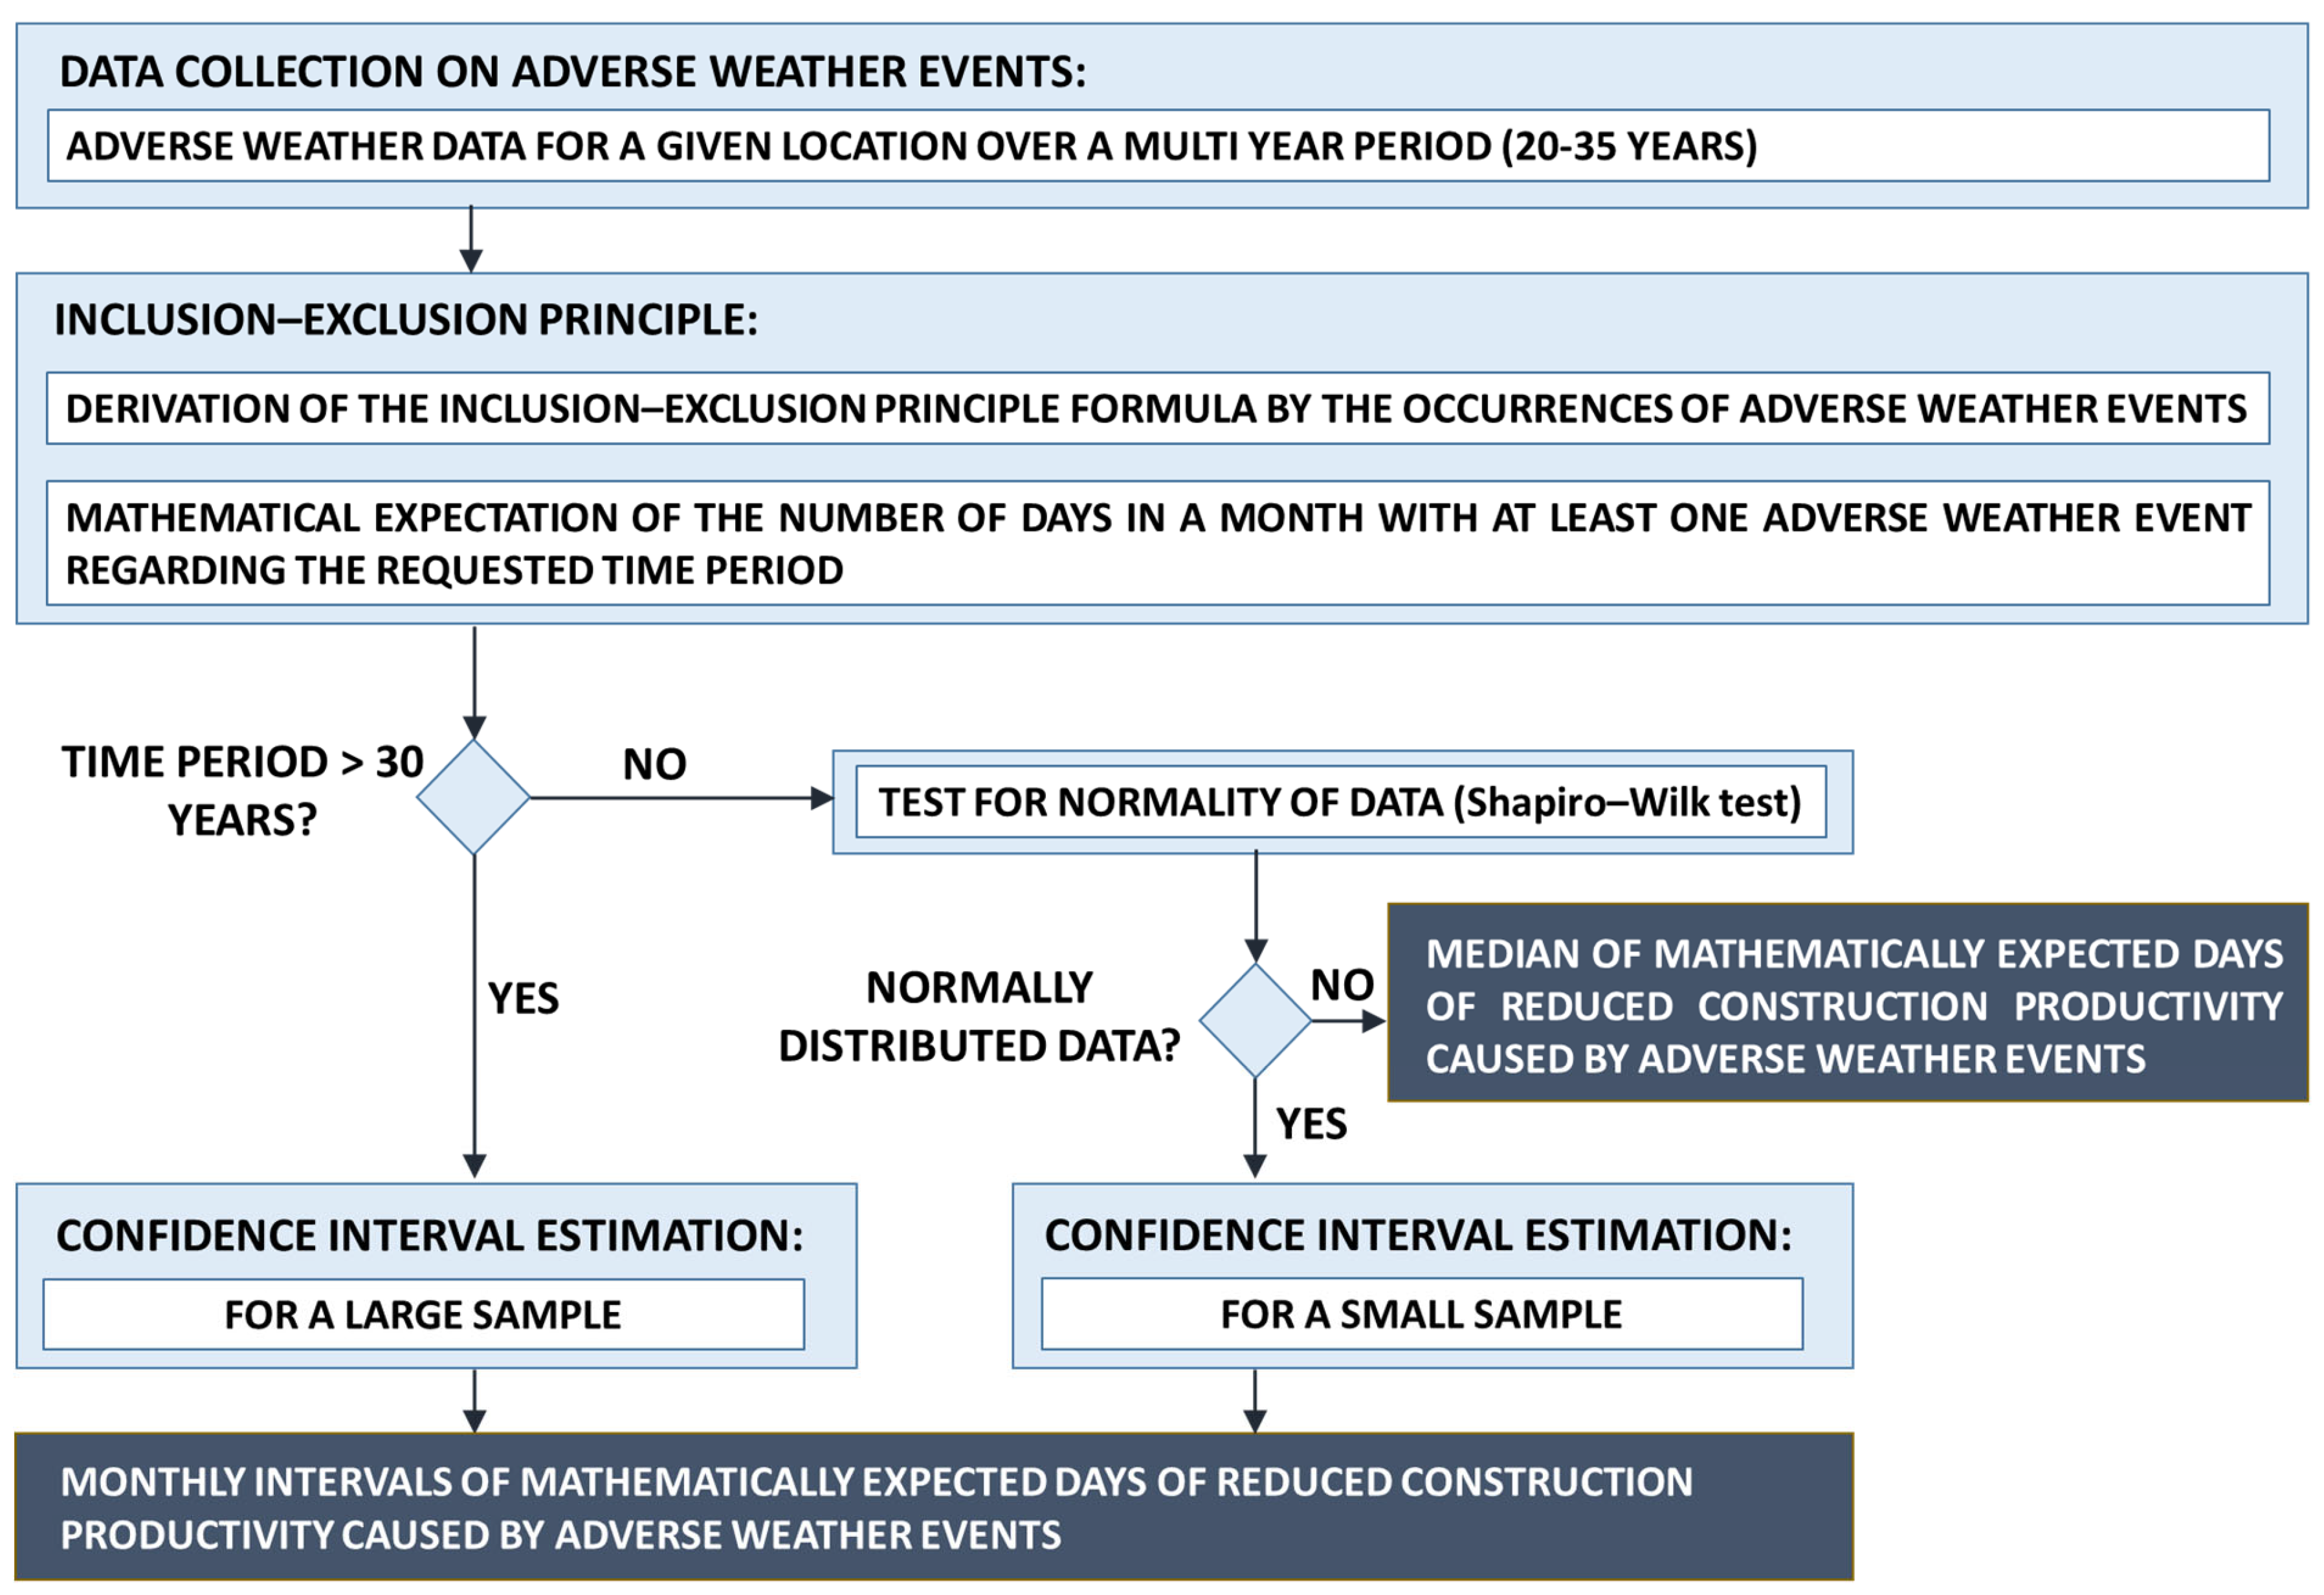
3.1. Data Collection on Adverse Weather Events
3.2. Data Processing
3.2.1. The Principle of Inclusion–Exclusion (PIE)
- a—number of days in a given month with precipitation (≥10 mm);
- b—number of days in a given month with stormy winds;
- c—number of days in a given month with cold days (Tmin < 0 °C);
- d—total number of days in a given month.
- a—number of days in a given month with precipitation (≥10 mm);
- b—number of days in a given month with stormy winds;
- c—number of days in a given month with cold days (Tmin < 0 °C);
- e—number of days in a given month with snow cover;
- d—total number of days in a given month.
- a—number of days in a given month with precipitation (≥10 mm);
- b—number of days in a given month with stormy winds;
- c—number of days in a given month with cold days (Tmin < 0 °C);
- e—number of days in a given month with snow cover;
- f—number of days in a given month with fog;
- d—total number of days in a given month.
3.2.2. Confidence Interval Estimation
- —sample mean;
- —interval width;
- —quantiles of Student’s t-distribution with (n − 1) degrees of freedom (df) for an area of α/2 in the upper (right) tail;
- s—sample standard deviation;
- n—sample size;
- α—significance level (for a confidence level of 1 − α).
- – sample mean;
- —interval width;
- —the Z-score corresponding to the desired confidence level (for example, 1.96 for a 95% confidence level);
- σ—population standard deviation (or the sample standard deviation if the population standard deviation σ is unknown);
- n—sample size;
- α—significance level (for a confidence level of 1 – α).
4. Model Application to Selected Cities (Rijeka, Krk, Pazin)
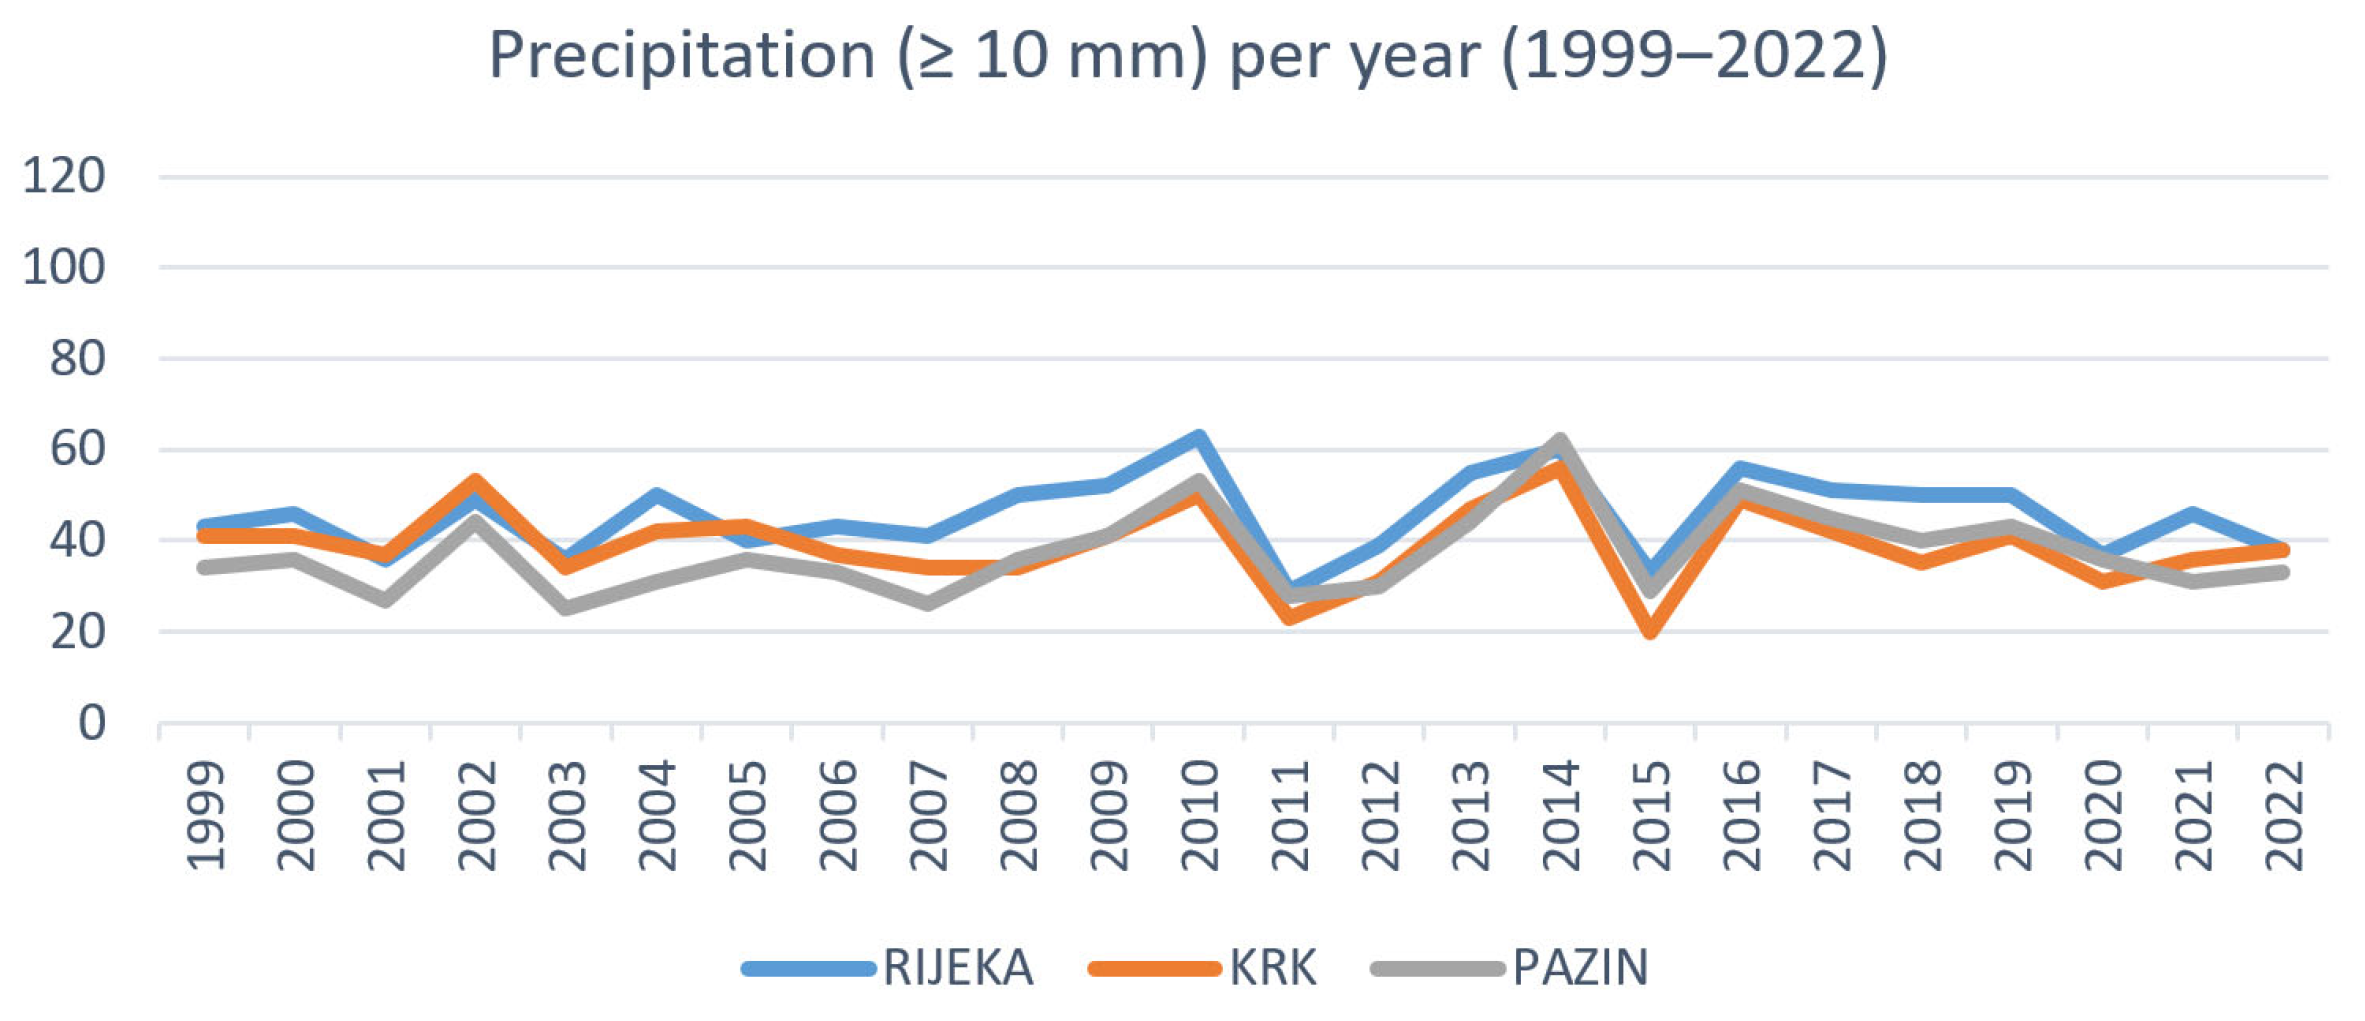
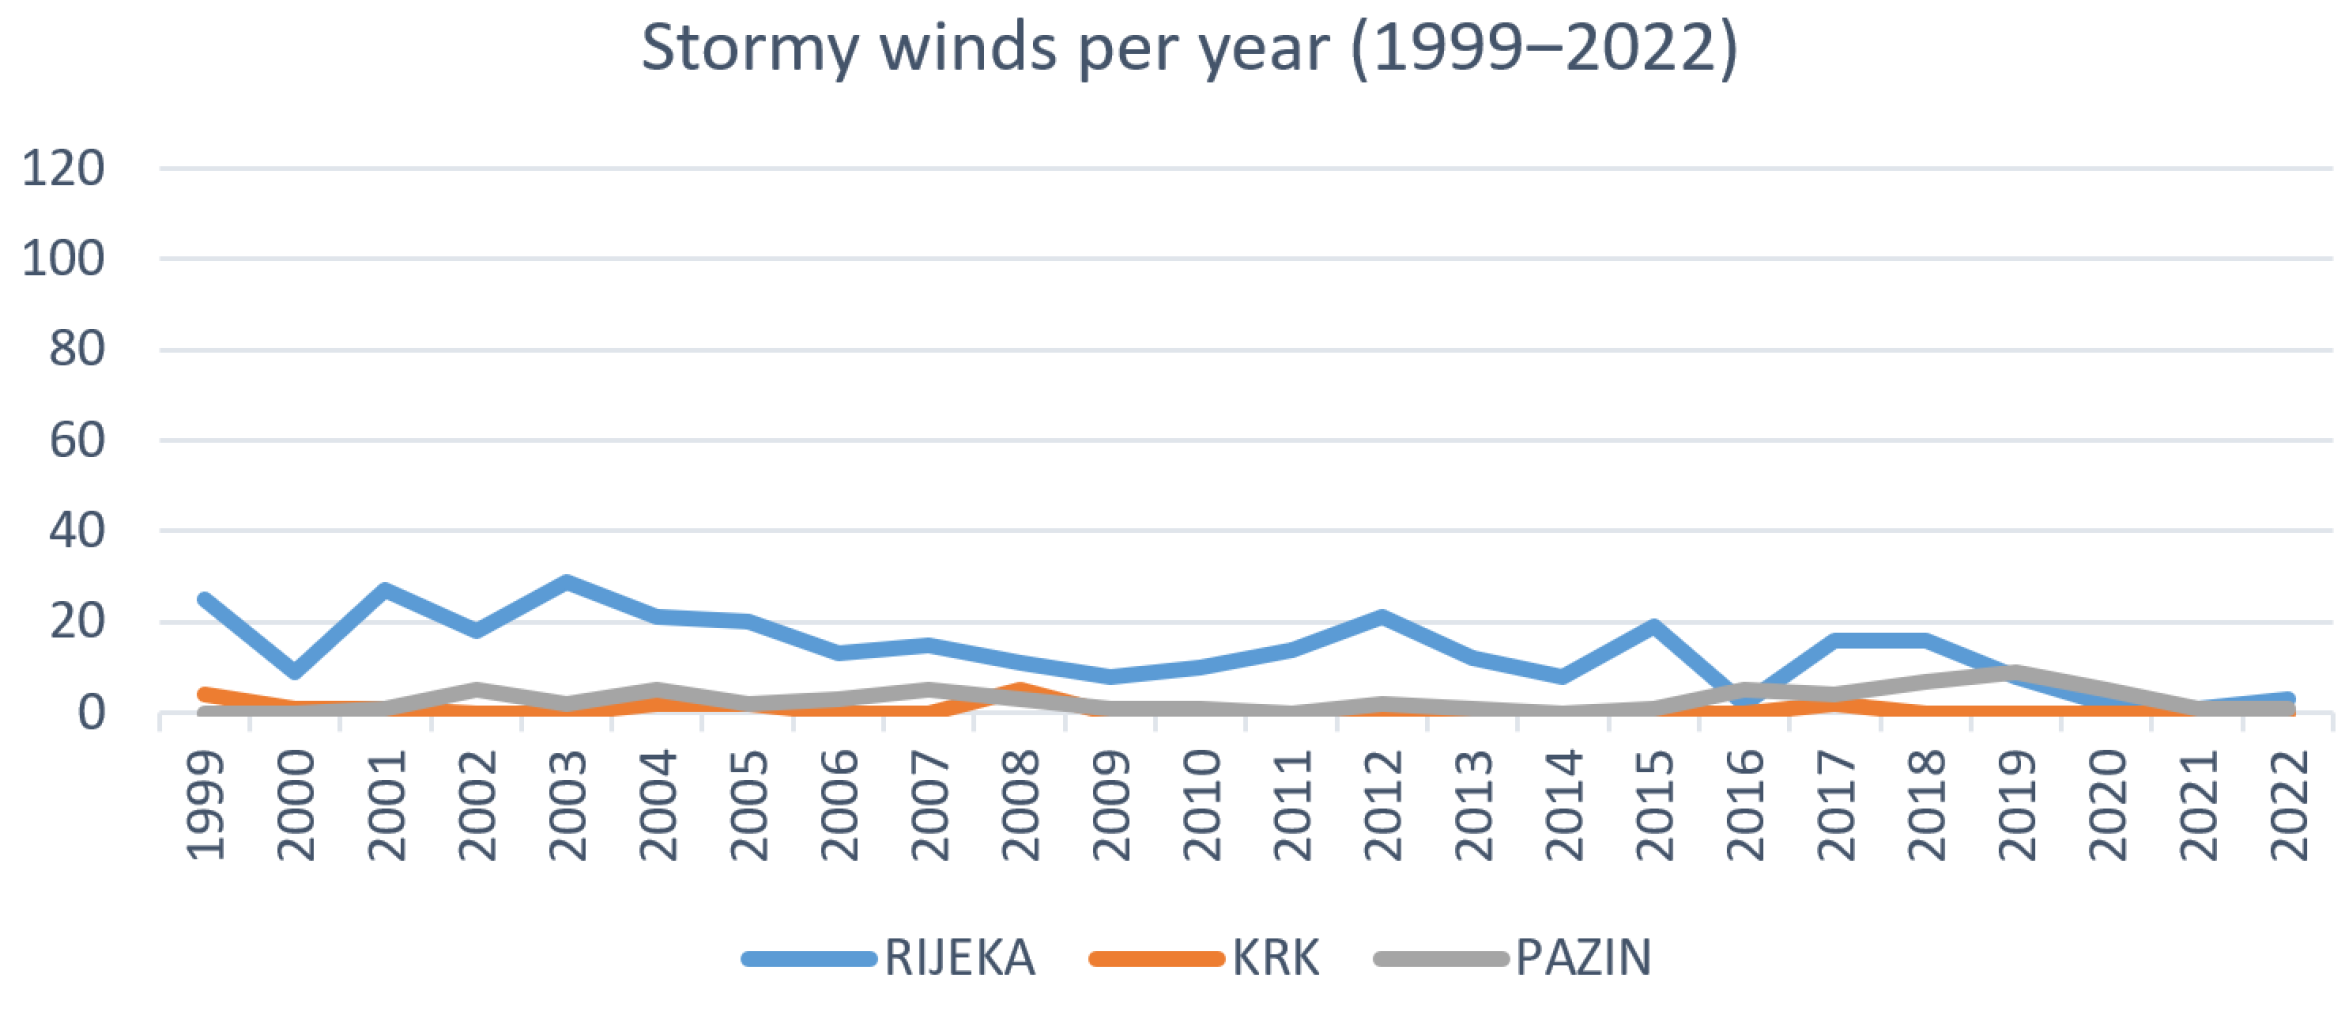
4.1. Data Collection of Adverse Weather Events for Rijeka, Krk, and Pazin
4.2. Data Processing for Rijeka, Krk, and Pazin
4.2.1. Applying the Principle of Inclusion–Exclusion (PIE)
4.2.2. Applying Confidence Interval Estimation
5. Results Verification
5.1. Contractors’ Experiences with Adverse Weather in Construction
5.2. Weather Events with the Greatest Impact on Productivity and Productivity Loss Periods
6. Conclusions
Author Contributions
Funding
Institutional Review Board Statement
Informed Consent Statement
Data Availability Statement
Conflicts of Interest
References
- El-Rayes, K.; Moselhi, O. Impact of rainfall on the productivity of highway construction. J. Constr. Eng. Manag. 2001, 127, 125–131. [Google Scholar] [CrossRef]
- Alshebani, M.N.; Wedawatta, G. Making the construction industry resilient to extreme weather: Lessons from construction in hot weather conditions. Procedia Econ. Financ. 2014, 18, 635–642. [Google Scholar] [CrossRef]
- Ballesteros-Pérez, P.; del Campo-Hitschfeld, M.L.; González-Naranjo, M.A.; González-Cruz, M.C. Climate and construction delays: Case study in Chile. Eng. Constr. Archit. Manag. 2015, 22, 596–621. [Google Scholar] [CrossRef]
- Marzouk, M.; Hamdy, A. Quantifying weather impact on formwork shuttering and removal operation using system dynamics. KSCE J. Civ. Eng. 2013, 17, 620–626. [Google Scholar] [CrossRef]
- Marzoughi, F.; Arthanari, T.; Askarany, D. A decision support framework for estimating project duration under the impact of weather. Autom. Constr. 2018, 87, 287–296. [Google Scholar] [CrossRef]
- Liu, X.; Song, Y.; Yi, W.; Wang, X.; Zhu, J. Comparing the random forest with the generalized additive model to evaluate the impacts of outdoor ambient environmental factors on scaffolding construction productivity. J. Constr. Eng. Manag. 2018, 144, 04018037. [Google Scholar] [CrossRef]
- Moohialdin, A.S.M.; Lamari, F.; Miska, M.; Trigunarsyah, B. Construction worker productivity in hot and humid weather conditions: A review of measurement methods at task, crew and project levels. Eng. Constr. Archit. Manag. 2020, 27, 83–108. [Google Scholar] [CrossRef]
- Moselhi, O.; Khan, Z. Analysis of labour productivity of formwork operations in building construction. Constr. Innov. 2010, 10, 286–303. [Google Scholar] [CrossRef]
- Tijanić, K.; Šopić, M.; Marović, I.; Car-Pušić, D. Analysis of the construction machinery work efficiency as a factor of the earthworks sustainability. In IOP Conference Series: Earth and Environmental Science; IOP Publishing: Philadelphia, PA, USA, 2019; Volume 222, p. 012009. [Google Scholar]
- Al Refaie, A.M.; Alashwal, A.M.; Abdul-Samad, Z.; Salleh, H. Weather and labor productivity in construction: A literature review and taxonomy of studies. Int. J. Product. Perform. Manag. 2021, 70, 941–957. [Google Scholar] [CrossRef]
- Šopić, M.; Bogdan, A.; Marović, I. Efficiency versus Effectiveness in Earthworks Based on Time Study Analysis. In Proceedings of the 15th International OTMC Conference and 6th IPMA Senet Conference: Smart Built Environment Through Digital Transformation, Zagreb, Croatia, 21–24 September 2022; pp. 336–353. [Google Scholar]
- Hwang, J.; Jeong, J.; Lee, M.; Jeong, J.; Lee, J. Establishment of outdoor thermal comfort index groups for quantifying climate impact on construction accidents. Sustain. Cities Soc. 2023, 91, 104431. [Google Scholar] [CrossRef]
- Ballesteros-Pérez, P.; Rojas-Céspedes, Y.A.; Hughes, W.; Kabiri, S.; Pellicer, E.; Mora-Melià, D.; del Campo-Hitschfeld, M.L. Weather-wise: A weather-aware planning tool for improving construction productivity and dealing with claims. Autom. Constr. 2017, 84, 81–95. [Google Scholar] [CrossRef]
- Ballesteros-Pérez, P.; Smith, S.T.; Lloyd-Papworth, J.G.; Cooke, P. Incorporating the effect of weather in construction scheduling and management with sine wave curves: Application in the United Kingdom. Constr. Manag. Econ. 2018, 36, 666–682. [Google Scholar] [CrossRef]
- Koehn, E.; Brown, G. Climatic effects on construction. J. Constr. Eng. Manag. 1985, 111, 129–137. [Google Scholar] [CrossRef]
- Schuldt, S.J.; Nicholson, M.R.; Adams, Y.A.; Delorit, J.D. Weather-related construction delays in a changing climate: A systematic state-of-the-art review. Sustainability 2021, 13, 2861. [Google Scholar] [CrossRef]
- Larsson, R.; Rudberg, M. Impact of weather conditions on in situ concrete wall operations using a simulation-based approach. J. Constr. Eng. Manag. 2019, 145, 05019009. [Google Scholar] [CrossRef]
- Thomas, H.R.; Ellis, R.D., Jr. Fundamental principles of weather mitigation. Pract. Period. Struct. Des. Constr. 2009, 14, 29–35. [Google Scholar] [CrossRef]
- Larsson, R.; Rudberg, M. Effects of weather conditions on concrete work task productivity—A questionnaire survey. Constr. Innov. 2023, 23, 306–321. [Google Scholar] [CrossRef]
- Jang, M.H.; Yoon, Y.S.; Suh, S.W.; Ko, S.J. Method of using weather information for support to manage building construction projects. In Proceedings of the AEI 2008: Building Integration Solutions, Denver, CO, USA, 24–27 September 2008; pp. 1–10. [Google Scholar]
- Mirahadi, F.; Zayed, T. Simulation-based construction productivity forecast using neural-network-driven fuzzy reasoning. Autom. Constr. 2016, 65, 102–115. [Google Scholar] [CrossRef]
- Gudac, I.; Marović, I.; Hanak, T. Sustainable optimization of winter road maintenance services under real-time information. Procedia Eng. 2014, 85, 183–192. [Google Scholar] [CrossRef]
- Moselhi, O.; Gong, D.; El-Rayes, K. Estimating weather impact on the duration of construction activities. Can. J. Civ. Eng. 1997, 24, 359–366. [Google Scholar] [CrossRef]
- Senouci, A.; Al-Abbasi, M.; Eldin, N.N. Impact of weather conditions on construction labour productivity in Qatar. Middle East J. Manag. 2018, 5, 34–49. [Google Scholar] [CrossRef]
- Šopić, M.; Car-Pušić, D. Statistička obrada podataka o vremenskim neprilikama u svrhu određivanja mjesečnog intervala s matematički očekivanim danima zastoja pri radu gradilišta na području grada Rijeke. Zb. Rad. (Građevinski Fak. Sveučilišta U Rijeci) 2018, 21, 67–85. [Google Scholar] [CrossRef]
- Shahin, A.; AbouRizk, S.M.; Mohamed, Y. Modeling weather-sensitive construction activity using simulation. J. Constr. Eng. Manag. 2011, 137, 238–246. [Google Scholar] [CrossRef]
- Jung, M.; Park, M.; Lee, H.S.; Kim, H. Weather-delay simulation model based on vertical weather profile for high-rise building construction. J. Constr. Eng. Manag. 2016, 142, 04016007. [Google Scholar] [CrossRef]
- Mohamed, S.; Srinavin, K. Forecasting labor productivity changes in construction using the PMV index. Int. J. Ind. Ergon. 2005, 35, 345–351. [Google Scholar] [CrossRef]
- Shan, Y.; Goodrum, P.M. Integration of building information modeling and critical path method schedules to simulate the impact of temperature and humidity at the project level. Buildings 2014, 4, 295–319. [Google Scholar] [CrossRef]
- Ibbs, W.; Sun, X. Weather’s effect on construction labor productivity. J. Leg. Aff. Disput. Resolut. Eng. Constr. 2017, 9, 04517002. [Google Scholar] [CrossRef]
- Nguyen, L.D.; Kneppers, J.; García de Soto, B.; Ibbs, W. Analysis of adverse weather for excusable delays. J. Constr. Eng. Manag. 2010, 136, 1258–1267. [Google Scholar] [CrossRef]
- Mohamed, E.; Jafari, P.; Chehouri, A.; AbouRizk, S. Simulation-based approach for lookahead scheduling of onshore wind projects subject to weather risk. Sustainability 2021, 13, 10060. [Google Scholar] [CrossRef]
- Marović, I.; Sušanj, I.; Ožanić, N. Development of ANN model for wind speed prediction as a support for early warning system. Complexity 2017, 2017, 3418145. [Google Scholar] [CrossRef]
- Apipattanavis, S.; Sabol, K.; Molenaar, K.R.; Rajagopalan, B.; Xi, Y.; Blackard, B.; Patil, S. Integrated framework for quantifying and predicting weather-related highway construction delays. J. Constr. Eng. Manag. 2010, 136, 1160–1168. [Google Scholar] [CrossRef]
- Shahin, A.; AbouRizk, S.M.; Mohamed, Y.; Fernando, S. Simulation modeling of weather-sensitive tunnelling construction activities subject to cold weather. Can. J. Civ. Eng. 2014, 41, 48–55. [Google Scholar] [CrossRef]
- Radujković, M.; Burcar Dunović, I.; Dolaček Alduk, Z.; Nahod, M.; Vukomanović, M. Organizacija Građenja; Udžbenici Sveučilišta u Zagrebu: Zagreb, Hrvatska, 2015. [Google Scholar]
- Sane, S.S. Combinatorial Techniques; Springer: Berlin/Heidelberg, Germany, 2013; Volume 65. [Google Scholar]
- Wilson, R.; Watkins, J.J. (Eds.) Combinatorics: Ancient & Modern; OUP Oxford: Oxford, UK, 2013. [Google Scholar]
- Mazur, D.R. Combinatorics: A Guided Tour; American Mathematical Society: Providence, RI, USA, 2020; Volume 55. [Google Scholar]
- Flajolet, P.; Sedgewick, R. Analytic Combinatorics; Cambridge University Press: Cambridge, UK, 2009. [Google Scholar]
- Andreescu, T.; Feng, Z. A Path to Combinatorics for Undergraduates: Counting Strategies; Springer Science & Business Media: Berlin/Heidelberg, Germany, 2013. [Google Scholar]
- Ferland, K. Discrete Mathematics and Applications; Chapman and Hall/CRC: London, UK, 2017. [Google Scholar]
- Soberón, P. Problem-Solving Methods in Combinatorics; Birkhäuser/Springer Basel AG: Basel, Switzerland, 2013. [Google Scholar]
- Lipschutz, S.; Lipson, M. Probability. Schaum’s Outlines, 2nd ed.; McGraw-Hill: New York, NY, USA, 2000. [Google Scholar]
- Schmuller, J. Statistical Analysis with R for Dummies; John Wiley & Sons Inc.: Hoboken, NJ, USA, 2017. [Google Scholar]
- Boyd, R. Introductory Statistics, 4th ed.; Creative Commons: San Francisco, CA, USA, 2021. [Google Scholar]
- Donnelly, R.A. The Complete Idiot’s Guide to Statistics, 2nd ed.; Penguin Group Inc.: New York, NY, USA, 2007. [Google Scholar]
- Lind, D.A.; Marchal, W.G.; Wathen, S.A. Basic Statistics for Business & Economics; McGraw-Hill Companies Inc.: New York, NY, USA, 2006. [Google Scholar]
- Pagano, R.R. Understanding Statistics in the Behavioral Sciences, 10th ed.; Cengage Learning: Wadsworth, OH, USA; Belmont, CA, USA, 2013. [Google Scholar]
- Wackerly, D.D.; Mendenhall, W.; Scheaffer, R.L. Mathematical Statistics with Applications, 7th ed.; Thomson Higher Education: Belmont, CA, USA, 2008. [Google Scholar]
- Siegel, A.F.; Wagner, M.R. Practical Business Statistics, 6th ed.; Elsevier Inc.: Oxford, UK, 2012. [Google Scholar]
- Levine, D.M.; Stephan, D.F. Even You Can Learn Statistics: A Guide for Everyone Who Has Ever Been Afraid of Statistics, 2nd ed.; Pearson Education Inc.: Upper Saddle River, NJ, USA, 2010. [Google Scholar]
- Rohatgi, V.K.; Saleh, A.M.E. An Introduction to Probability and Statistics, 2nd ed.; John Wiley & Sons Inc.: Montreal, QC, Canada, 2001. [Google Scholar]
- Lee, C.F.; Lee, J.; Chang, J.R.; Tai, T. Essentials of Excel, Excel VBA, SAS and Minitab for Statistical and Financial Analyses; Springer: Cham, Switzerland, 2016. [Google Scholar]
- Jackson, S.L. Research Methods and Statistics: A Critical Thinking Approach, 3rd ed.; Cengage Learning: Wadsworth, OH, USA; Belmont, CA, USA, 2009. [Google Scholar]
- Schmuller, J. Statistical Analysis with Excel for Dummies, 3rd ed.; John Wiley & Sons Inc.: Hoboken, NJ, USA, 2013. [Google Scholar]




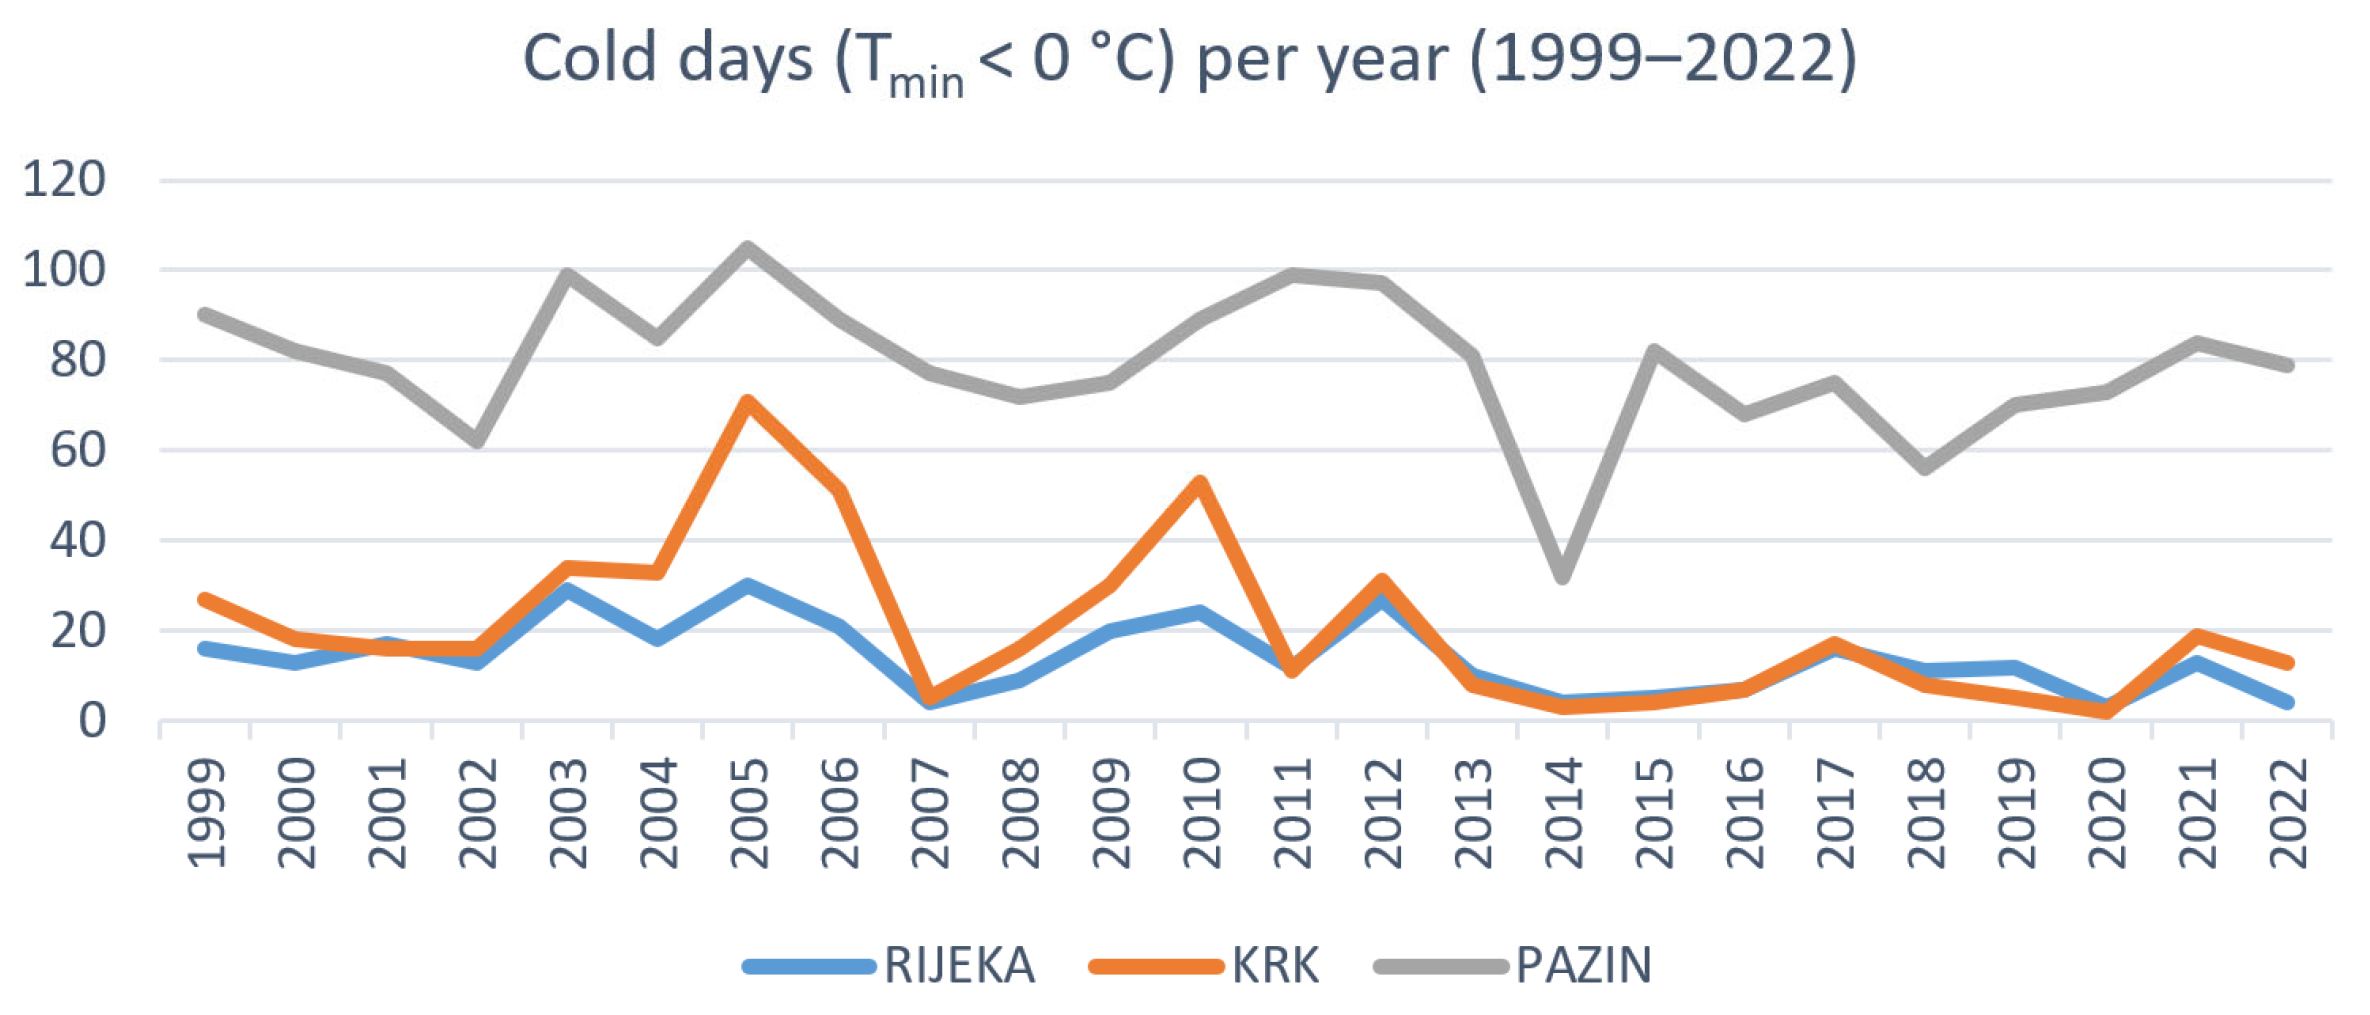

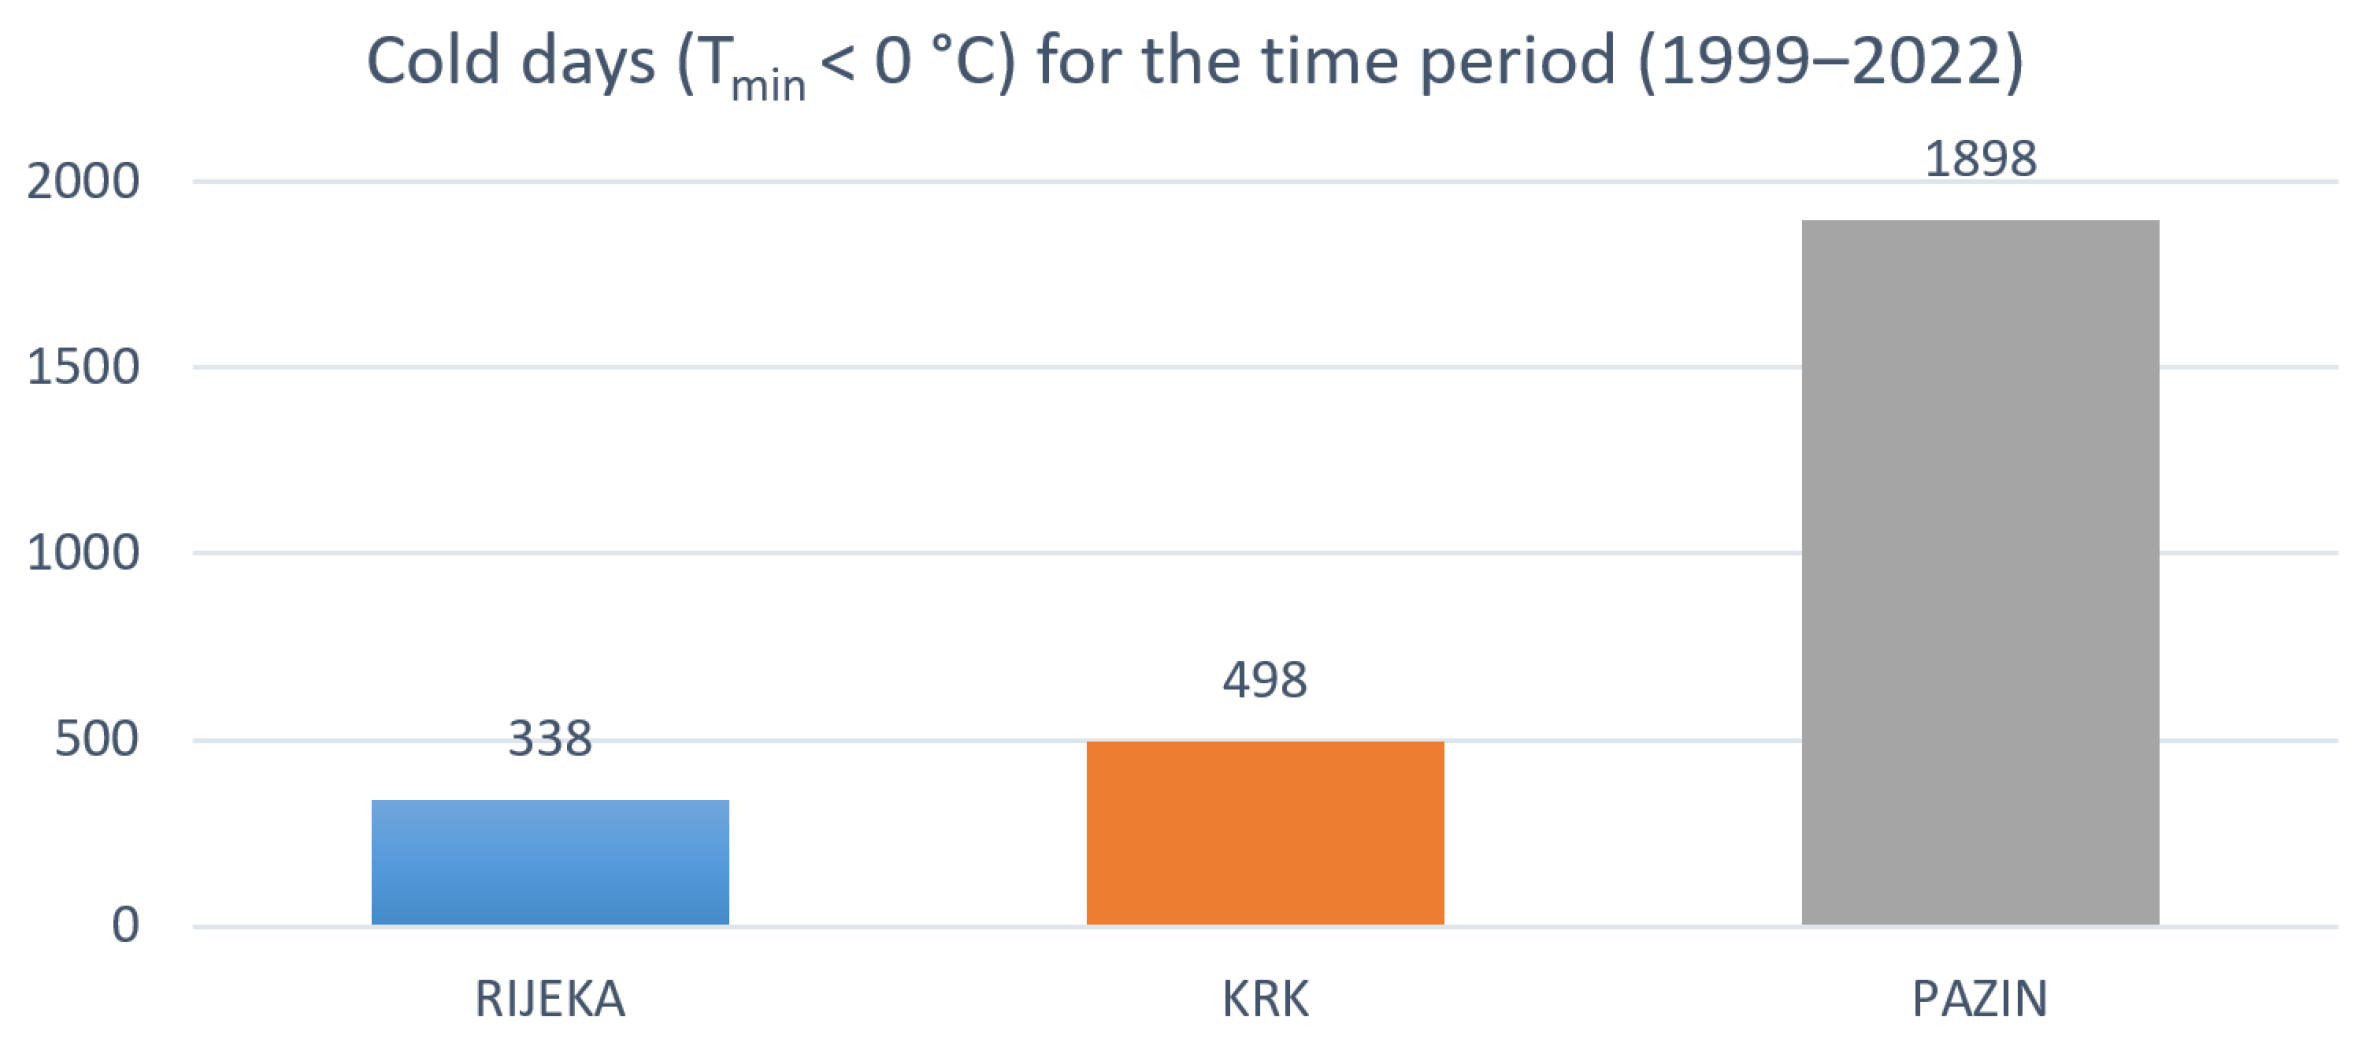


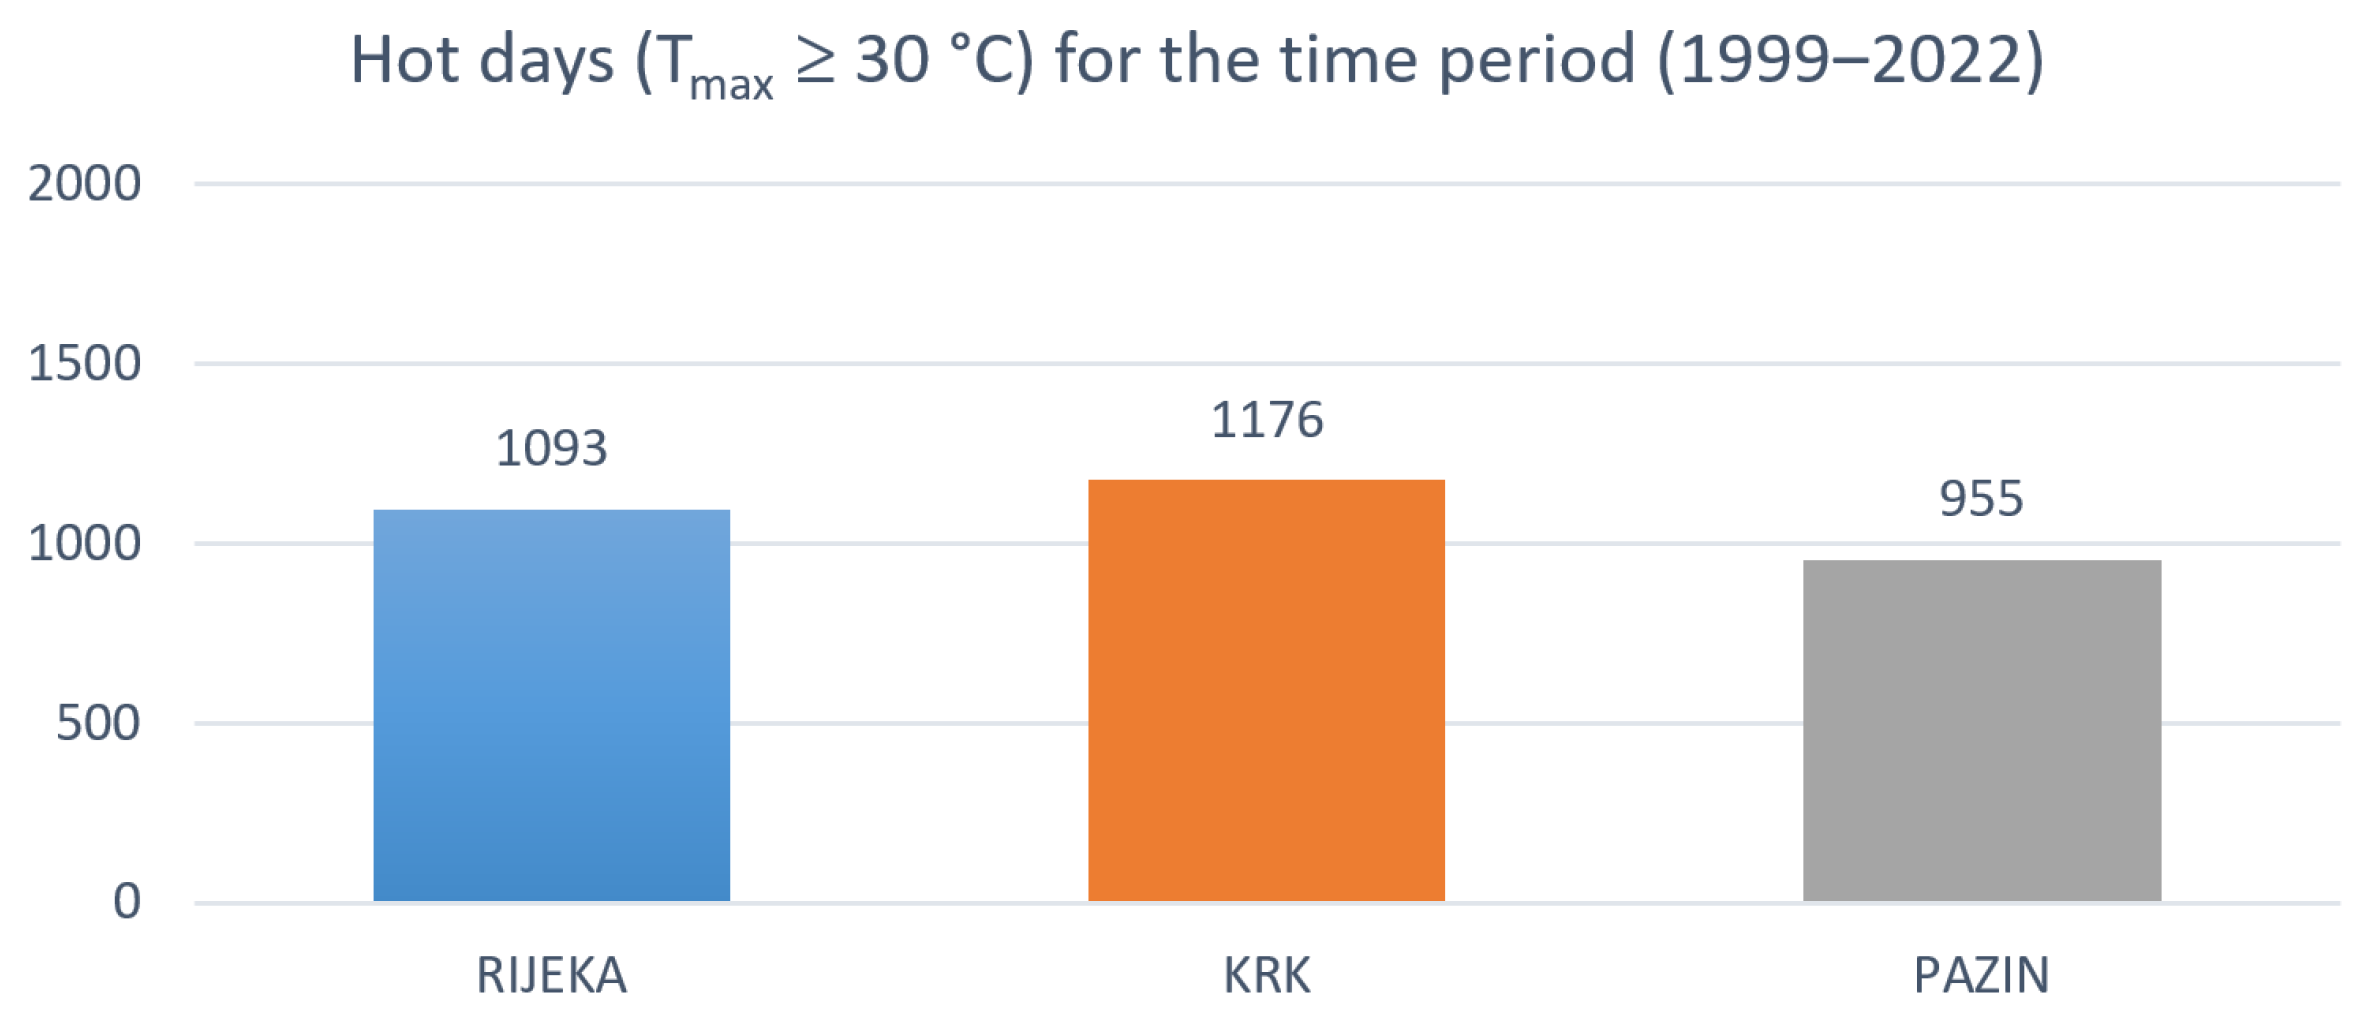

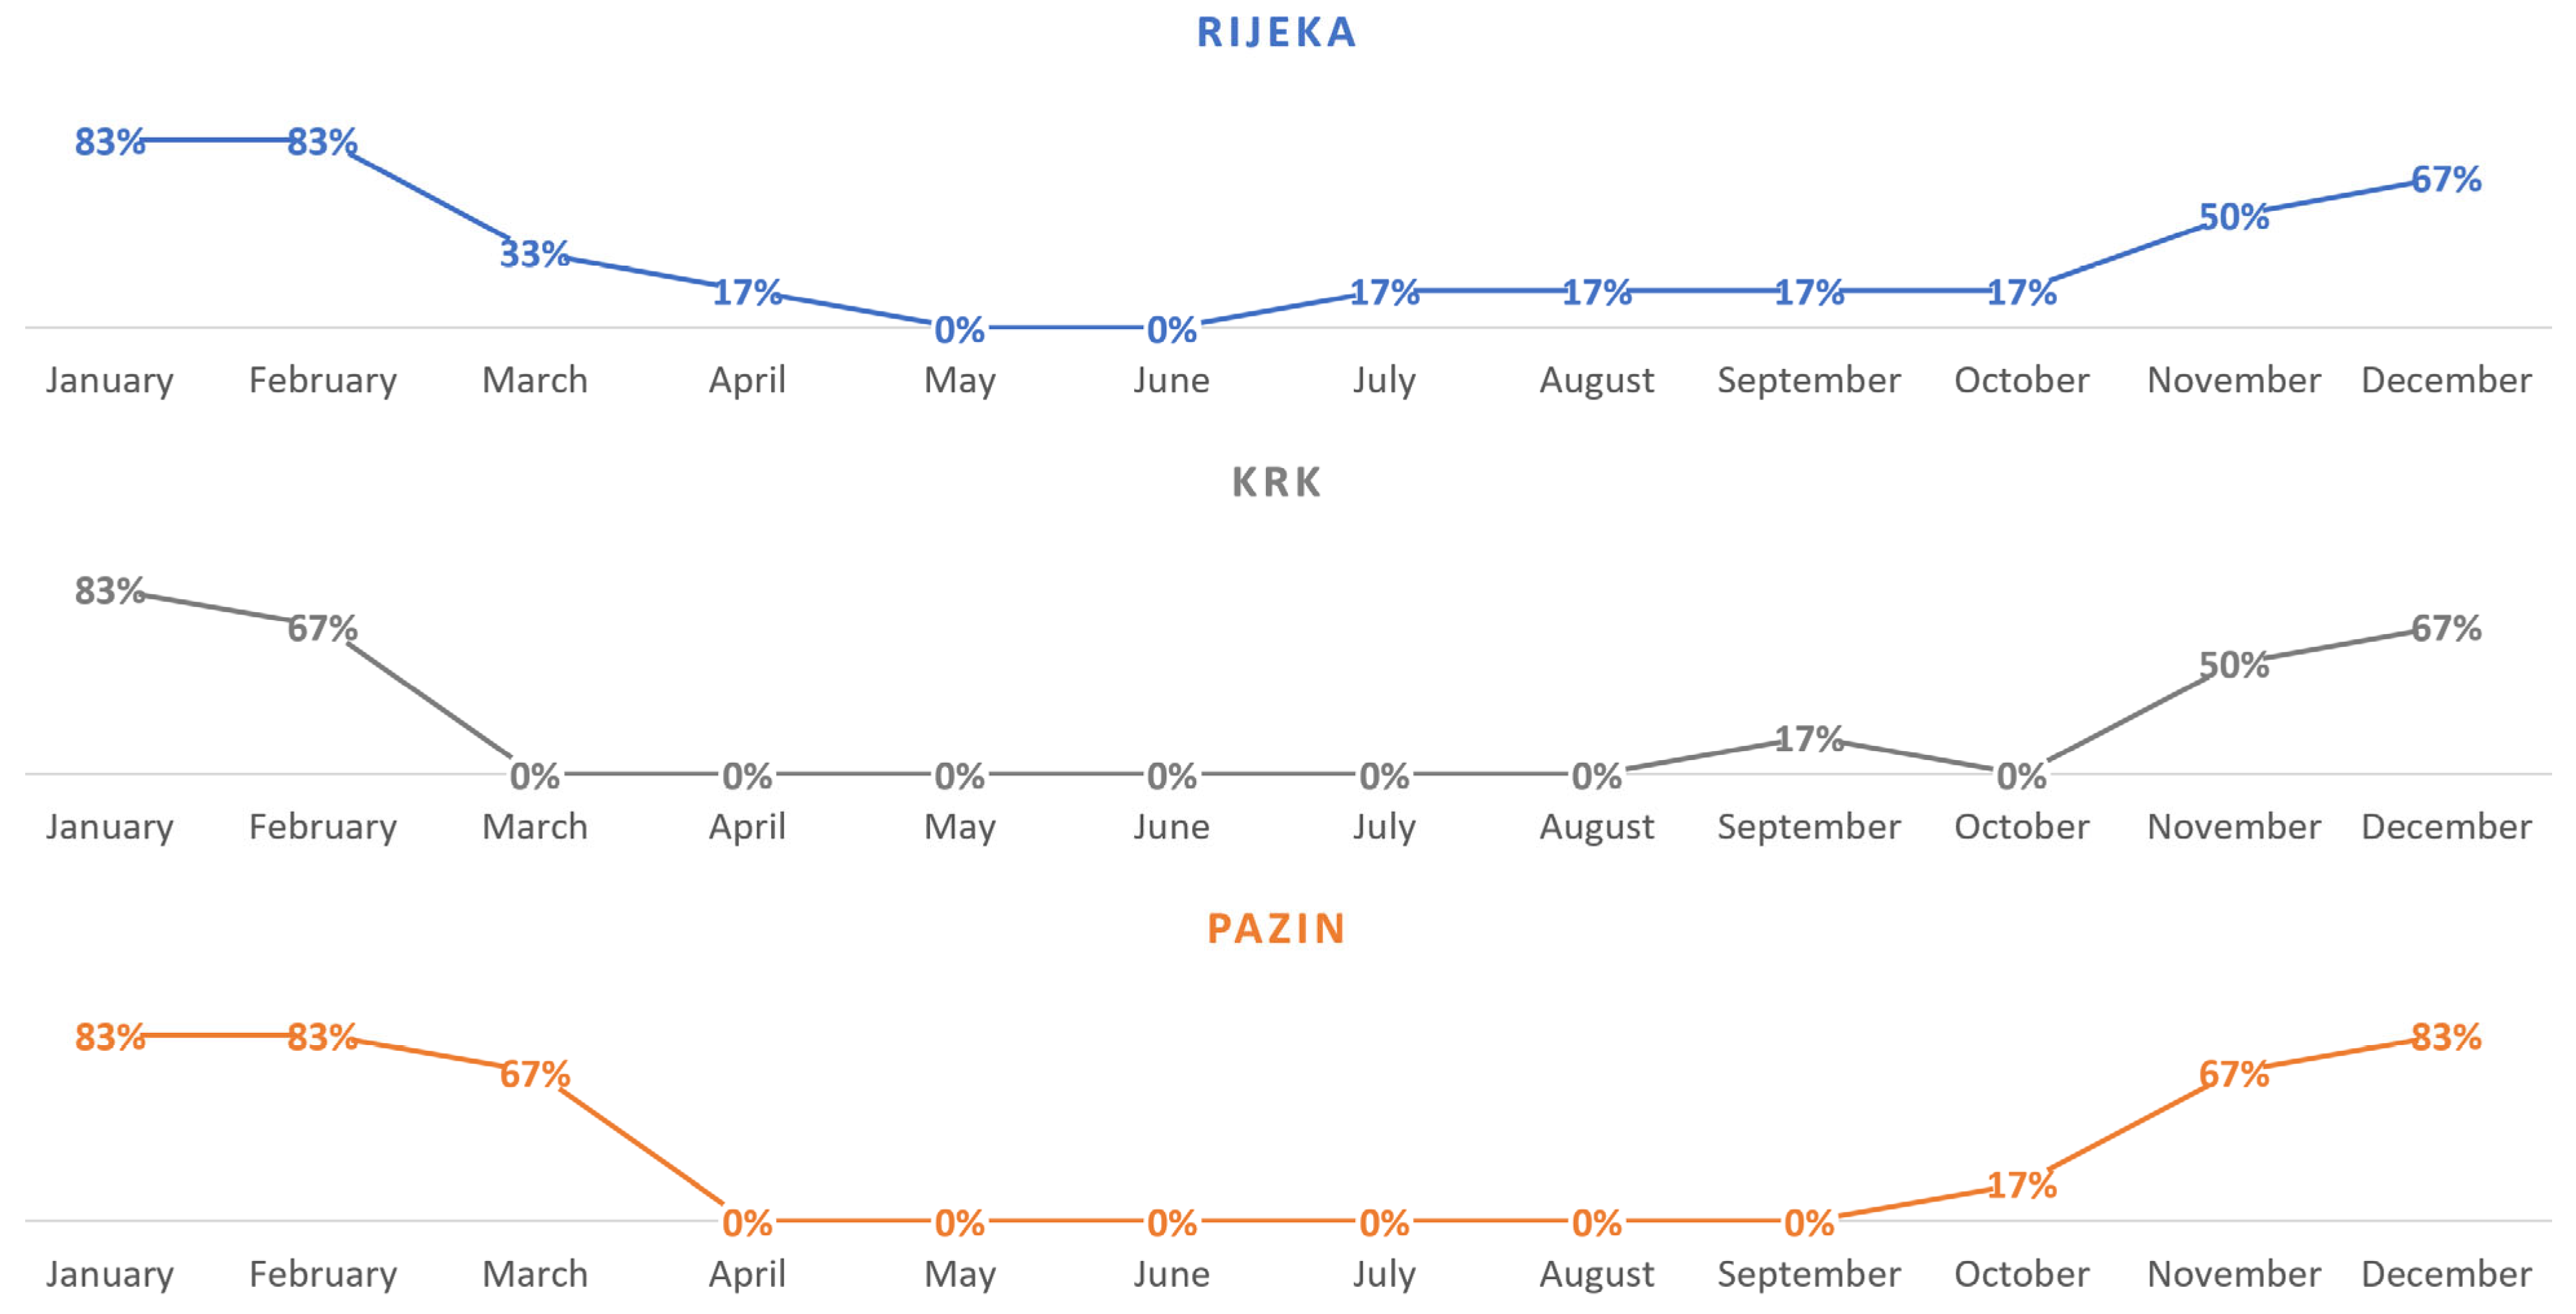
| Rijeka | January | |||
|---|---|---|---|---|
| Time Period | Precipitation | Stormy Winds | Cold Days | Mathematically Expected Days in January with at Least One Adverse Weather Event (i.e., Reduced Productivity Due to Weather) |
| 1999 | 4 | 2 | 2 | 7.37 |
| 2000 | 0 | 1 | 9 | 9.71 |
| 2001 | 7 | 5 | 4 | 13.47 |
| 2002 | 1 | 1 | 8 | 9.46 |
| 2003 | 4 | 7 | 8 | 15.49 |
| 2004 | 5 | 3 | 10 | 15.09 |
| 2005 | 1 | 7 | 7 | 13.02 |
| 2006 | 3 | 3 | 10 | 13.87 |
| 2007 | 5 | 1 | 1 | 6.65 |
| 2008 | 6 | 0 | 1 | 6.81 |
| 2009 | 7 | 1 | 9 | 14.52 |
| 2010 | 8 | 0 | 8 | 13.94 |
| 2011 | 2 | 4 | 5 | 9.82 |
| 2012 | 2 | 0 | 8 | 9.48 |
| 2013 | 6 | 3 | 2 | 9.88 |
| 2014 | 8 | 2 | 1 | 10.18 |
| 2015 | 4 | 1 | 1 | 5.71 |
| 2016 | 6 | 1 | 6 | 11.49 |
| 2017 | 2 | 3 | 14 | 16.64 |
| 2018 | 6 | 0 | 0 | 6.00 |
| 2019 | 3 | 0 | 8 | 10.23 |
| 2020 | 1 | 0 | 1 | 1.97 |
| 2021 | 7 | 0 | 6 | 11.65 |
| 2022 | 1 | 0 | 3 | 3.90 |
| Krk | January | |||
|---|---|---|---|---|
| Time Period | Precipitation | Stormy Winds | Cold Days | Mathematically Expected Days in January with at Least One Adverse Weather Event (i.e., Reduced Productivity Due to Weather) |
| 1999 | 4 | 2 | 5 | 9.82 |
| 2000 | 0 | 0 | 13 | 13.00 |
| 2001 | 7 | 0 | 0 | 7.00 |
| 2002 | 1 | 0 | 12 | 12.61 |
| 2003 | 4 | 0 | 13 | 15.32 |
| 2004 | 4 | 0 | 15 | 17.06 |
| 2005 | 1 | 0 | 18 | 18.42 |
| 2006 | 3 | 0 | 21 | 21.97 |
| 2007 | 3 | 0 | 1 | 3.90 |
| 2008 | 3 | 0 | 3 | 5.71 |
| 2009 | 4 | 0 | 11 | 13.58 |
| 2010 | 7 | 0 | 20 | 22.48 |
| 2011 | 1 | 0 | 4 | 4.87 |
| 2012 | 1 | 0 | 9 | 9.71 |
| 2013 | 8 | 0 | 2 | 9.48 |
| 2014 | 7 | 0 | 0 | 7.00 |
| 2015 | 4 | 0 | 1 | 4.87 |
| 2016 | 5 | 0 | 6 | 10.03 |
| 2017 | 2 | 2 | 14 | 16.12 |
| 2018 | 2 | 0 | 0 | 2.00 |
| 2019 | 3 | 0 | 4 | 6.61 |
| 2020 | 0 | 0 | 1 | 1.00 |
| 2021 | 8 | 0 | 11 | 16.16 |
| 2022 | 1 | 0 | 6 | 6.81 |
| Pazin | January | |||
|---|---|---|---|---|
| Time Period | Precipitation | Stormy Winds | Cold Days | Mathematically Expected Days in January with at Least One Adverse Weather Event (i.e., Reduced Productivity Due to Weather) |
| 1999 | 2 | 0 | 21 | 21.65 |
| 2000 | 0 | 0 | 30 | 30.00 |
| 2001 | 4 | 0 | 10 | 12.71 |
| 2002 | 1 | 0 | 23 | 23.26 |
| 2003 | 3 | 0 | 24 | 24.68 |
| 2004 | 2 | 0 | 25 | 25.39 |
| 2005 | 1 | 0 | 26 | 26.16 |
| 2006 | 3 | 2 | 26 | 26.78 |
| 2007 | 2 | 1 | 12 | 13.80 |
| 2008 | 3 | 0 | 12 | 13.84 |
| 2009 | 3 | 0 | 19 | 20.16 |
| 2010 | 6 | 0 | 23 | 24.55 |
| 2011 | 0 | 0 | 20 | 20.00 |
| 2012 | 1 | 1 | 26 | 26.32 |
| 2013 | 3 | 0 | 18 | 19.26 |
| 2014 | 6 | 0 | 6 | 10.84 |
| 2015 | 2 | 0 | 20 | 20.71 |
| 2016 | 3 | 0 | 20 | 21.06 |
| 2017 | 2 | 0 | 27 | 27.26 |
| 2018 | 2 | 0 | 11 | 12.29 |
| 2019 | 1 | 0 | 27 | 27.13 |
| 2020 | 0 | 0 | 25 | 25.00 |
| 2021 | 6 | 0 | 19 | 21.32 |
| 2022 | 0 | 0 | 25 | 25.00 |
| Rijeka | |||||||
|---|---|---|---|---|---|---|---|
| Mean | Median | Standard Deviation | Normal (Yes/No) Shapiro–Wilk Test | Interval Width | Confidence Interval Estimation | ||
| January | 10.26 | 10.03 | 3.84778 | yes | 1.62478 | 8.64 | 11.89 |
| February | 9.33 | 8.98 | 4.63913 | yes | 1.95893 | 7.38 | 11.29 |
| March | 5.61 | 5.71 | 3.17719 | yes | 1.34161 | 4.27 | 6.95 |
| April | 3.96 | 3.88 | 2.27692 | yes | 0.96146 | 3.00 | 4.93 |
| May | 4.66 | 4.00 | 2.36775 | yes | 0.99981 | 3.66 | 5.66 |
| June | 10.95 | 10.03 | 4.82908 | no | - | - | - |
| July | 18.91 | 19.51 | 4.96374 | yes | 2.09600 | 16.81 | 21.00 |
| August | 18.07 | 18.92 | 5.96864 | yes | 2.52034 | 15.55 | 20.59 |
| September | 7.48 | 6.83 | 2.55869 | yes | 1.08044 | 6.40 | 8.56 |
| October | 5.32 | 5.35 | 2.75191 | yes | 1.16203 | 4.16 | 6.48 |
| November | 7.32 | 7.96 | 3.05378 | yes | 1.28950 | 6.03 | 8.61 |
| December | 8.59 | 8.23 | 4.35823 | yes | 1.84032 | 6.75 | 10.43 |
| Krk | |||||||
|---|---|---|---|---|---|---|---|
| Mean | Median | Standard Deviation | Normal (Yes/No) Shapiro–Wilk Test | Interval Width | Confidence Interval Estimation | ||
| January | 10.65 | 9.76 | 6.02699 | yes | 2.54498 | 8.10 | 13.19 |
| February | 8.74 | 7.64 | 5.49830 | yes | 2.32173 | 6.42 | 11.06 |
| March | 4.28 | 3.90 | 3.71803 | no | - | - | - |
| April | 2.16 | 1.50 | 1.90374 | no | - | - | - |
| May | 3.65 | 3.95 | 2.33244 | yes | 0.98490 | 2.66 | 4.63 |
| June | 10.82 | 11.23 | 4.46866 | yes | 1.88695 | 8.93 | 12.70 |
| July | 19.81 | 20.89 | 4.99412 | yes | 2.10883 | 17.71 | 21.92 |
| August | 19.09 | 19.81 | 6.05883 | yes | 2.55842 | 16.53 | 21.65 |
| September | 6.78 | 6.33 | 2.62599 | yes | 1.10886 | 5.67 | 7.89 |
| October | 4.19 | 4.00 | 2.56758 | yes | 1.08419 | 3.10 | 5.27 |
| November | 6.17 | 6.00 | 3.31032 | yes | 1.39783 | 4.77 | 7.57 |
| December | 7.82 | 6.71 | 5.09182 | yes | 2.15009 | 5.67 | 9.97 |
| Pazin | |||||||
|---|---|---|---|---|---|---|---|
| Mean | Median | Standard Deviation | Normal (Yes/No) Shapiro–Wilk Test | Interval Width | Confidence Interval Estimation | ||
| January | 21.63 | 22.45 | 5.41822 | no | - | - | - |
| February | 18.77 | 19.02 | 4.50792 | yes | 1.90353 | 16.87 | 20.68 |
| March | 14.17 | 13.58 | 4.24400 | yes | 1.79208 | 12.38 | 15.96 |
| April | 5.35 | 5.25 | 2.72478 | yes | 1.15057 | 4.20 | 6.50 |
| May | 3.75 | 3.00 | 2.06942 | no | - | - | - |
| June | 9.77 | 10.07 | 4.42708 | yes | 1.86939 | 7.90 | 11.64 |
| July | 16.90 | 16.03 | 4.77628 | yes | 2.01685 | 14.88 | 18.91 |
| August | 16.43 | 18.14 | 6.00802 | yes | 2.53696 | 13.89 | 18.97 |
| September | 5.63 | 4.93 | 3.13016 | no | - | - | - |
| October | 5.06 | 4.94 | 2.55255 | yes | 1.07785 | 3.99 | 6.14 |
| November | 11.58 | 11.54 | 3.36596 | yes | 1.42132 | 10.16 | 13.01 |
| December | 18.95 | 19.05 | 4.14379 | yes | 1.74977 | 17.20 | 20.70 |
| Mathematically Expected Days with Reduced Construction Site Productivity Due to Adverse Weather | ||||||||||||
|---|---|---|---|---|---|---|---|---|---|---|---|---|
| Rijeka | Krk | Pazin | ||||||||||
| January | 9 | to | 12 | days | 8 | to | 13 | days | for | about | 22 | days |
| February | 7 | to | 11 | days | 6 | to | 11 | days | 17 | to | 21 | days |
| March | 4 | to | 7 | days | for | about | 4 | days | 12 | to | 16 | days |
| April | 3 | to | 5 | days | for | about | 2 | days | 4 | to | 7 | days |
| May | 4 | to | 6 | days | 3 | to | 5 | days | for | about | 3 | days |
| June | for | about | 10 | days | 9 | to | 13 | days | 8 | to | 12 | days |
| July | 17 | to | 21 | days | 18 | to | 22 | days | 15 | to | 19 | days |
| August | 16 | to | 21 | days | 17 | to | 22 | days | 14 | to | 19 | days |
| September | 6 | to | 9 | days | 6 | to | 8 | days | for | about | 5 | days |
| October | 4 | to | 6 | days | 3 | to | 5 | days | 4 | to | 6 | days |
| November | 6 | to | 9 | days | 5 | to | 8 | days | 10 | to | 13 | days |
| December | 7 | to | 10 | days | 6 | to | 10 | days | 17 | to | 21 | days |
Disclaimer/Publisher’s Note: The statements, opinions and data contained in all publications are solely those of the individual author(s) and contributor(s) and not of MDPI and/or the editor(s). MDPI and/or the editor(s) disclaim responsibility for any injury to people or property resulting from any ideas, methods, instructions or products referred to in the content. |
© 2025 by the authors. Licensee MDPI, Basel, Switzerland. This article is an open access article distributed under the terms and conditions of the Creative Commons Attribution (CC BY) license (https://creativecommons.org/licenses/by/4.0/).
Share and Cite
Šopić, M.; Vranković, A.; Marović, I. Understanding and Quantifying the Impact of Adverse Weather on Construction Productivity. Appl. Sci. 2025, 15, 10759. https://doi.org/10.3390/app151910759
Šopić M, Vranković A, Marović I. Understanding and Quantifying the Impact of Adverse Weather on Construction Productivity. Applied Sciences. 2025; 15(19):10759. https://doi.org/10.3390/app151910759
Chicago/Turabian StyleŠopić, Martina, Andro Vranković, and Ivan Marović. 2025. "Understanding and Quantifying the Impact of Adverse Weather on Construction Productivity" Applied Sciences 15, no. 19: 10759. https://doi.org/10.3390/app151910759
APA StyleŠopić, M., Vranković, A., & Marović, I. (2025). Understanding and Quantifying the Impact of Adverse Weather on Construction Productivity. Applied Sciences, 15(19), 10759. https://doi.org/10.3390/app151910759


