Article

The Potential of Bilberry and Blackcurrant Juices as a Source of Colorants in Intelligent Pectin Films

Department of Food Engineering and Process Management Institute of Food Sciences, Warsaw University of Life Sciences, 159c Nowoursynowska St., 02-776 Warsaw, Poland
*
Author to whom correspondence should be addressed.
Appl. Sci. 2025, 15(19), 10789; https://doi.org/10.3390/app151910789
Submission received: 2 September 2025 / Revised: 2 October 2025 / Accepted: 5 October 2025 / Published: 7 October 2025
(This article belongs to the Special Issue Functional Food: From Discovery to Application)

Abstract

The aim of this study was to develop biodegradable pectin films enriched with anthocyanin-rich fruit juices and evaluate their functional properties. Films were prepared with bilberry and blackcurrant juices, and their color response to pH, mechanical performance, thermal stability, and water vapor permeability were analyzed. The incorporation of juices significantly affected the films’ color, with ΔE values ranging from 8.41 to 39.24 for blackcurrant and 36.60 to 59.59 for wild bilberry juice, showing clear visual differences. Increasing juice concentration from 5% to 10% enhanced color intensity and opacity, with the highest opacity (12.90 a.u./mm) observed for films containing 2% pectin and 10% bilberry juice. Mechanical testing indicated reduced tensile strength after juice addition, with the lowest elongation (11.90%) noted for films with 2% pectin and 5% blackcurrant juice. The lowest water vapor permeability (7.43·10−11 g/m·s·Pa) was recorded for films with 2% pectin. Thermal analysis revealed greater mass loss in juice-enriched films (40–44.5%) compared to controls (37.6%), reflecting the presence of volatile compounds. pH testing confirmed the films’ indicator function, with red coloration at pH 2 and shifts toward blue-grey (bilberry) or orange-green (blackcurrant) at pH 8. These findings demonstrate that pectin films enriched with dark red fruit juices exhibit promising potential for smart food packaging applications.

1. Introduction

The rising demand for food production is driven largely by population growth and changes in food diversity. Although foods are generally nutritious, they are susceptible to spoilage caused by physical, chemical, and microbial processes. The World Health Organization reports that approximately 1 out of 10 people fall ill after consuming spoiled food. Each year, food poisoning results in the death of about 420,000 people worldwide [1]. This risk is further exacerbated during transportation, when environmental factors such as bacteria, chemicals, and naturally occurring enzymes can alter food morphology and reduce its nutrient content [2]. Due to the threat to human health and life resulting from the consumption of spoiled food, research has begun on monitoring this process. Currently, there are no strategies available on the market that enable real-time monitoring of food spoilage, mainly due to the fact that traditional methods, such as bacterial cultures, are time-consuming, labor-intensive, and unsuitable for the ongoing assessment of individual products. However, this is a necessary condition, as food spoilage is variable in nature. For this reason, there is growing interest in the development of sensors capable of tracking changes related to the food spoilage process in real time [3].
One solution that enables real-time monitoring of food spoilage is intelligent packaging. Intelligent packaging is a comprehensive solution that tracks changes in the product or its environment and actively responds to them. It uses chemical sensors and biosensors to monitor food quality and safety throughout the supply chain, from the manufacturer to the consumer. The sensors used in intelligent packaging enable the monitoring of parameters such as freshness, pH level, carbon dioxide content, presence of pathogens, oxygen, leaks, as well as time and temperature [4]. pH-sensitive indicators are among the most used tools for monitoring food freshness and quality. During the storage of packaged products, the growth of microorganisms and the decomposition of nutrients caused by both endogenous enzymes and the activity of microorganisms lead to the accumulation of metabolites such as CO2 and volatile nitrogen compounds (e.g., dimethylamine, trimethylamine, histamine, and others). The accumulation of these compounds causes a change in the pH value in the packaging environment. As a result, there is a visual change in the color of the pH indicators, which makes it possible to link the degree of freshness and quality of food with the observed color transformation [5]. Indicators based on pH change are made from a polymer substrate and pH-sensitive dyes. They work by changing color when biogenic amines are detected, which are produced as a result of microbial activity and protein decomposition in chilled meat products. Natural dyes, especially anthocyanins, are becoming increasingly important in the design of such indicators, as unlike chemosynthetic dyes, they are biocompatible and environmentally friendly. The sensitivity of freshness indicators is influenced by various factors, including the type of anthocyanins used, the structure of the indicator, interactions between the substrate and dyes, and environmental conditions [6]. Anthocyanins extracted from fruits, flowers, and leaves are successfully used to impart pH sensitivity to biopolymer films [7]. Sources of these pigments include red cabbage, plum skin, purple sweet potato, grape skin, bilberry juice and peel, blue butterfly peas, black carrots, roses, hibiscus, and black rice. To obtain films with unique color properties, new sources of anthocyanins are constantly being sought. At low pH (<2), anthocyanins mainly occur in the form of a flavyl cation, which gives them a red color. In the pH range of 3–6, neutral chinoid base (proton transfer) and pseudocarbinol base (hydration) structures dominate, leading to a change in color to purple or colorless. When the pH rises to 6–7, a blue color appears because of the formation of an anionic chinoid base. At high pH (>8), chalcone is formed in the process of tautomerization of the pseudobase carbinol, causing the color to change to yellow [8].
When food spoils, bacterial enzymes break down proteins and sulfur amino acids, resulting in the formation of ammonia and hydrogen sulfide (H2S) as volatile compounds. Water molecules from the environment first settle on the surface of the indicator film and only then penetrate its structure. In turn, the ammonia and H2S present in the environment react with the water contained in the film or absorbed into it, leading to the formation of hydroxide ions and hydrogen sulfide acid, respectively. These changes cause shifts in pH, which is visible as a change in the color of the film [9]. Therefore, the indicator, which was initially purple in color and used for meat with a pH of 5.97, changed color to purple-blue after 5 days of storage, and after 7 days it became completely blue, with the meat’s pH at 6.28 [10]. Spoiled food is characterized by discoloration, the presence of slime, and an unpleasant odor and taste. Lipolytic yeasts, such as Saccharomycopsis lipolytica, cause dark spots in meat fat, which contributes to a slight drop in the meat’s pH to approximately 5.5–6.0, although later in storage, it increases to 6.5–7.0. Lactic acid bacteria (Leuconostoc spp., Enterococcus spp., Pediococcus spp., and Carnobacterium spp.) produce hydrogen peroxide and slime on the meat surface, lowering the meat’s pH to 4.8–5.5. Lactic acid bacteria and Brochothrix thermosphacta metabolize sugars and amino acids, leading to the formation of volatile compounds and further acidification (pH < 5.0), imparting a sour taste and odor to the meat [11]. Proteolytic bacteria, such as Shewanella putrefaciens and Serratia liguefaciens, degrade proteins and amino acids, releasing hydrogen sulfide and nitrogen compounds. This process raises the pH to alkaline values (6.8–7.5) and is responsible for the characteristic rotten egg odor [12].
Dairy products are characterized by high nutritional value, but they also provide a suitable substrate for microorganisms, especially bacterial pathogens, which can cause food spoilage and consumer illness. During the process of milk transformation from fresh to spoiled, changes in both pH and volume occur. Raw milk has a pH of approximately 6.5–6.7, making it slightly acidic. As spoilage progresses, many bacteria produce lactic acid as a by product, causing a gradual decrease in pH [13]. This increase in acidity can be detected by a visible color change of an anthocyanin-based indicator. Therefore, colorimetric pH indicators can be effectively used to monitor the freshness of dairy products as well.
The cell walls of fruits and vegetables contain abundant pectin, a complex polysaccharide that plays a key role in food applications thanks to its gelling, thickening, and stabilizing properties [14]. To produce edible films and coatings, pectin can be obtained from the skins of fruits such as apples, oranges, kiwis, melons, and pomegranates. Commercial pectin (E440i) and amidated pectin (E440ii) are commonly used, most of which is obtained from citrus peels (85.5%) and apple pomace (14.0%). High demand for pectin in the food and beverage industry, followed by pharmaceuticals and other multifunctional applications, is driving further market growth [15]. Plastic food packaging causes serious environmental damage, which is why many countries are developing edible packaging technologies. One solution is the use of edible films and coatings, which reduce waste and support the circular economy. An example is pectin from dragon fruit peel, which is used to produce such films; this reduces waste and, at the same time, increases the value of the peel itself [16]. Despite pectin’s good film-forming properties, pure pectin films are brittle and have poor mechanical properties. These problems can be mitigated by combining pectin with other polymers, such as proteins or other polysaccharides. To increase the flexibility of pectin-based packaging films, glycerol is also commonly used as a plasticizer [17].
Bilberry (Vaccinium myrtillus L.) and blackcurrant (Ribes nigrum L.) are popular berries in Poland, and as fruits rich in anthocyanins, they can be a good natural source of dyes that can be used to develop smart pH-responsive films. The aim of the study was therefore to develop pectin films with the addition of bilberry and blackcurrant juices as a source of dyes, to evaluate their potential use as pH indicators, and to determine the optical, mechanical, and thermal properties of the prepared films.

2. Materials and Methods

2.1. Materials

Apple pectin was acquired from Pektowin S.A. (Jasło, Poland). Bilberry (Vaccinium myrtillus L.) and blackcurrant (Ribes nigrum L.) were obtained from the local market (Warsaw, Poland). Glycerol was purchased from Avantor Performance Materials Poland S.A., (Gliwice, Poland) and was used as a plasticizer.

2.2. Preparation of Fruit Juices

The fruits were washed and pressed using a fruit press. The pressed juices were centrifuged using a 4-15 SIGMA laboratory centrifuge (Sigma Laborzentrifugen GmbH, Osterode am Harz, Germany) for 7 min. The clear juices had 8.6 °Brix for bilberries and 18.9 °Brix for blackcurrants, respectively. The total soluble solids content in blueberries and blackcurrants was measured using a PAL-1 digital refractometer (ATAGO Co., Ltd., Tokyo, Japan) in three replicates, and the results were expressed in degrees Brix.

2.3. Film Preparation

The aqueous film-forming solutions were prepared using apple pectin at concentrations of 2% and 4%. The solutions were heated at 65 °C for 20 min using an RCT basic IKAMAG magnetic stirrer (IKA Poland, Warsaw), to obtain a homogeneous film-forming solutions. After cooling down, glycerol was added to the solutions at a concentration of 50% w/w of pectin. Fruit juices were added at 5 and 10% to both types of pectin solutions (2 and 4%), and the solutions without fruit juices were controls (own study). The film-forming solutions were poured into Petri dishes in a constant volume to control the film thickness and dried in a laboratory dryer SUP-65W (Wamed, Warsaw, Poland) at 35 °C for 24 h. After drying, the films were peeled off and conditioned for 48 h at 25 °C and 50% relative humidity in a KBF 240 climatic chamber (Binder, GmbH, Tuttlingen, Germany) prior to testing. The film’s compositions were presented in Table 1.

2.4. Thickness

The film thickness was measured with a ProGage thickness gauge (Thwing-Albert Instrument Company, West Berlin, NJ, USA) with a precision of 1 μm. Measurements were performed in at least 3 repetitions, depending on the tested properties.

2.5. Color

The color of fruit juices and film-forming solutions was measured in the CIE L*a*b* color system using a CR-5 colorimeter (Konica Minolta, Tokyo, Japan). A black standard and the distilled water were used as reference according to the manufacturer’s instructions. The color of the films was measured in reflectance mode with diffuse illumination and an 8 mm measurement using CR-400 colorimater (Konica Minolta, Tokyo, Japan). A white standard (L* = 95.91, a* = −0.32, b* = 2.61) was used as a reference. All measurements were performed in six repetitions, applying the CIE 2° standard observer with a D65 illuminant (Konica Minolta, Tokyo, Japan). In turn, the color of fruit juices was measured in transmittance mode. Quartz cuvettes with a 10 mm optical path length were used for the measurements. The color was presented as the L*a*b* parameters, and the total color difference between the film and the white standard according to the equation [18]:
Δ E = ( L * L ) 2 + ( a * a ) 2 + ( b * b ) 2
where ΔE—is the total color difference, L*, a*, b*—values for the standard, L, a, b—values for the films.

2.6. Opacity

The film opacity was determined by the spectrophotometric method. Measurement of the absorbance was made on 1 × 4 cm samples at a wavelength of 600 nm using a Helios Gamma UV/VIS spectrophotometer (ThermoElectron Corporation, Bath, UK). The measurement was performed in 6 repetitions, from which the average opacity value was calculated. The opacity of the films was calculated using the equation [19]:
O = A 600 l
where O—opacity (a.u./mm), A600—absorbance at a wavelength of 600 nm (nm), l—film thickness (mm).

2.7. Mechanical Properties

The mechanical properties of the films were determined in at least 6 repetitions using the TA-XT2i texturometer (Stable Micro System Texture Analyzer, Surrey, UK) based on the ASTM standard method D882-02 [20]. Strength (TS), elongation at break (E), and Young’s modulus (YM) of the analyzed films were determined.

2.8. Water Vapor Permeability (WVP)

The water vapor permeability of the analyzed films was determined using a modified gravimetric method developed by Debeaufort et al. [21]. Film samples were placed between two rubber-based rings on the top of a glass cell containing distilled water, which allowed fixing of the internal RH of permeation cells at 100%. Those permeation cells were introduced into a ventilated chamber maintained at 30% RH and of 25 ± 1 °C, ensuring a relative humidity gradient between two sides of the film at 30–100%. WVP was determined at steady state and from the change in the cell mass as a function of time using a climatic chamber KBF 240 (Binder, GmbH, Tuttlingen, Germany).

2.9. Thermal Properties

Thermogravimetric analyses were performed according to the method described previously [22] using a TGA/DSC 3 STARe system from Mettler-Toledo (Greifensee, Switzerland) to determine thermal stability and degradation of the analyzed films. Each film sample was heated at 5 °C min−1 from 30 to 600 °C in a nitrogen atmosphere with the flow rate of 50 mL·min−1. TGA and dTG curves were acquired and evaluated using STARe software version 16.2 (Mettler-Toledo, Greifensee, Switzerland).

2.10. pH Change

The films were cut and placed in buffers with a suitable pH in the range of 2–14 for 1 min. The color change was visually determined. Buffers with pH values of 2, 4, 6, 8, 10, and 12 were prepared to evaluate the pH-responsiveness of the films. Samples containing 4% pectin were used for the tests. Films were prepared with either 10% bilberry or 10% blackcurrant additions. Each film sample was immersed in the respective buffer solution, and changes in color and structural integrity were recorded.

2.11. Morphology of the Film

The morphology of the films was evaluated based on microscopic images taken using a TM3000 scanning electron microscope (Hitachi, Tokyo, Japan) at 1000× magnification.

2.12. Statistical Analysis

The obtained results were evaluated by one-way analysis of variance (ANOVA) using the software Statistica 13.0 (StatSoft Inc., Kraków, Poland). Tukey’s post hoc test was performed to identify differences in results, which are expressed by mean ± standard deviation, at the level of significance of 0.05.

3. Results and Discussion

3.1. The Optical Properties of Film-Forming Solutions and Film Characteristics

The study used bilberry and blackcurrant fruit juices as a source of colorants. These fruits contain anthocyanins, which are responsible for their dark purple color, which influenced the similar color of the film-forming solutions based on apple pectin. The control solutions had a light cream color, which was darker when a higher concentration of biopolymer was used. The addition of fruit juices caused the mixtures to take on a dark purple color, which was more intense at higher concentrations (10% juice addition). The results of the color parameters of the protective layer solutions and fruit juices are presented in Table 2.
In this study, it was observed that the L* parameter was the highest for the control pectin solutions without the addition of fruit juices, respectively, 21.50 for the 2% and 25.80 for the 4% pectin solutions (Table 2). The statistical analysis showed a significant increase in the L* parameter, which is attributed to the higher concentration of biopolymer and the lower lightness of the film-forming mixtures due to their naturally light color. Considering the fruit juices containing solutions, it was observed that an increase in the juice concentration, from 5 to 10%, resulted in a statistically significant reduction in lightness and lower values of the L* parameter. The values were in the range of 4.84–12.10 for pectin solutions with a 2% concentration and in the range of 6.40–15.90 for mixtures with a pectin concentration of 4%. When comparing the color of the solutions of the fruit juices used, it was observed that the addition of bilberry juice resulted in lower L* values (darker solutions) compared to blackcurrant juice (lighter solutions). The observed tendency is related to the natural color of fruit and juices obtained from them, which were 1.31 for bilberry and 2.70 for blackcurrant. The dark color of the juices is due to the high content of anthocyanins, the natural pigments present in the fruits [23,24].
The a* parameter represents the color from red (positive values) to green (negative values) [25]. The values of the a* parameter for the control solutions were −0.11 and 1.44 for 2 and 4% concentration of pectin, respectively. All the solutions with the addition of fruit juices showed the red color, and the presence of blackcurrant resulted in significantly higher values (16.30–20.70) compared to the bilberry juice (8.26–13.90). Taking into account the juice concentrations used, it was observed that an increase in the concentration from 5 to 10% significantly decreased the value of the a* parameter in the case of bilberry juice, from 11.20 to 8.26 for a 2% pectin concentration, and from 13.90 to 11.70 for a 4% pectin concentration (Table 2). However, in the case of mixtures with blackcurrant juice, the increase in juice concentration significantly increased the proportion of red color, from 16.30 to 17.90 and from 18.2 to 20.7 for 2% and 4% of biopolymer concentration, respectively. The obtained results correlated with the values obtained for pure fruit juices, which were 0.36 for bilberry and 4.70 for blackcurrant (Table 2).
The b* parameter indicates colors between blue (negative values) and yellow (positive values) [25]. The values of the solutions with the addition of fruit juices showed the blue color, which was significantly higher in values (4.70–7.40) for the film-forming solution with blackcurrant juice compared to the bilberry (2.01–3.19). Taking into account the juice concentrations, it was observed that the increase in concentration from 5 to 10% significantly decreased the value of the parameter b* in the case of a solution at 2% concentration of pectin with the addition of bilberry juice from 2.39 to 2.01, and in the case of a pectin concentration at 4%, an increase in the parameter b* from 3.01 to 3.19. However, for the mixture with blackcurrant juice, the increase in juice concentration significantly increased the proportion of blue color from 4.70 to 5.50 for a lower concentration of biopolymer (2%) and from 6.82 to 7.40 for the higher concentration (4%). The results are correlated with the values of parameter b* for pure fruit juices, which were 0.26 and 0.86 for bilberry and blackcurrant juices, respectively. The film-forming solutions with bilberry juice showed a greater proportion of blue color than the juice from blackcurrant. In addition, the solutions were darkest when the concentration of biopolymer was higher (4%) and blackcurrant juices were used. The mixtures containing fruit juices showed a statistically significantly lighter color (parameter L*) in comparison to pure fruit juices. Control film-forming solutions were slightly yellow (negative parameters b*). The color of the film-forming solutions was affected by the natural color of fruit juices, which was expected to be obtained in this study as one of the main potentials of the obtained films as intelligent materials.

3.2. The Effect of Apple Pectin and Fruit Juice Concentrations on the Optical Properties of Edible Films

The produced pectin films were characterized by a smooth, uniform structure. The control foils were slightly yellow and transparent. On the other hand, films containing fruit juices were characterized by a color related to the color of the fruit they came from, dark purple for bilberry and purple for blackcurrant (Figure 1).
An increase in fruit concentration in the film intensified color intensity, thus a significantly darker shade of purple appears at higher percentages of bilberry juice. Films with blackcurrant have a lighter, more delicate purple color compared to bilberry films, even at the same juice concentration. In addition, increasing the pectin concentration in the film slightly affected the color intensity and transparency of the film.
The pectin films with blackcurrant and bilberry juices were analyzed in order to use them as a color indicator for selected food products. Therefore, the color of the films, the main characteristic parameter of color-changing active packaging and an important parameter in quality assessment, was analyzed. In the case of food packaging, the transparency of the packaging is often desirable for product evaluation; however, in some cases, the dark color of the packaging material is important, e.g., for food containing compounds that are degradable because of exposure to light. In contrast, colorimetric indicators rely on a visually visible color that changes as the product changes unfavorably. The L*, a*, and b* parameters for the analyzed films are presented in Table 3.
It was observed that the L* parameter was the highest for both films without the addition of fruit juices, 92.20 and 91.80 for samples P2 and P4 with 2% and 4% concentration of pectin, respectively. Significantly lower values for parameter L*, except for film based on 2% pectin concentration with 5% of blackcurrant juice, were observed for films with fruit juices. A tendency of decreased values with the increased concentration of juices (5 and 10%) was observed. The addition of bilberry juice resulted in darker films compared to those with the addition of blackcurrant juices. The values of parameter L* for film containing bilberry juice were from 49.60 to 61.50 for a lower concentration of pectin (2%), and from 55.60 to 70.90 for films based on a higher concentration of pectin (4%). The values for films containing blackcurrant juice were in the range of 69.80–89.30. It can be noted that a lower concentration of pectin resulted in higher lightness of films, which is attributed to the higher proportion of pigments in the film matrix. The tendency for the sample brightness to decrease with increasing percentage of anthocyanins in the film was also demonstrated by Kurek et al. [26]. The value of the L* parameter with a 10% addition of blackcurrant anthocyanins was 16.93, while with a 20% addition of this component, it decreased to 8.15.
The values of the parameter a* for the control solutions were −0.41 for the 4% pectin concentration and 0.02 for the 2% pectin concentration, respectively. These values are very close to the value of the a* parameter for film-forming solutions (Table 2). The color of films with added bilberry juice was more red regardless of the degree of juice addition (28.30–41.60) compared to films with blackcurrant juice (5.49–32.10). This is an inverse relationship to the value of the a* parameter for film-forming solutions, which is caused by the use of anthocyanins from juices. It was observed that an increase in the juice concentration from 5% to 10% increased this parameter for the films with the addition of bilberry juices, from 34.50 to 41.60 for 2% pectin and from 28.30 to 41.60 for 4% pectin. For the film with the addition of blackcurrant juice, the parameter a* increased from 16.40 to 32.10 and from 5.49 to 16.40, for 2% and 4% pectin concentration, respectively. In their study, Li et al. [27] also found an increase in the proportion of red color in the film with increasing amounts of anthocyanins added. When the anthocyanin addition was 0.25%, the value of the a* parameter was 4.71, while after increasing the addition to 1%, this value increased to 9.25.
The values of the parameter b* for the control solutions were 12.90 for 4% pectin and 11.90 for 2% pectin, respectively. Films with the addition of bilberry juice showed the proportion of blue color in the range of 2.95–9.33, compared to films containing blackcurrant juice, the values of which were higher and ranged from 7.48 to 10.90. The experiment showed that increasing juice concentration from 5% to 10% resulted in higher values of the b* parameter for bilberries, from 2.95 to 9.33 for 2% pectin concentration. However, for blackcurrant juice, the value of this parameter decreased from 10.90 to 8.65 and from 7.48 to 9.02 for 2% and 4% pectin concentrations. A tendency towards an increase in the yellow color content in the film was also observed by Chen et al. [6] in their study. When the bilberry anthocyanin content was 5%, the b* parameter value reached 1.29. In turn, when the content of the additive was increased to 15%, the value of this parameter increased to 7.99.
The ΔE values in the tested samples indicate that the addition of blackcurrant and bilberry juices caused significant changes in the color of the film compared to the control. An increase in juice content further intensified this effect. The highest differences were observed for films with the addition of bilberry juice, which suggests that it includes a higher amount of colorants (anthocyanins) that give a more intense color. Also, in the study conducted by Chen et al. [6], an increase in the color difference was demonstrated when adding anthocyanins from blueberries. The delta E value for 5% blueberries was 33.29, while when 15% bilberries were added, the color difference value increased to 63.52 compared to the control variant.
Light refraction of the film is one of the most important functional properties when using such materials as food packaging, because a high enough light retention ability can greatly influence the shelf life of food products. In the case of colorimetric quality indicators, access to light can increase changes in natural dyes, which can affect the function of the indicator. In the case of colorimetric quality indicators, access to light can intensify changes in natural pigments, which may fade during storage, negatively affecting the function of the indicator, which should only change color under the influence of adverse changes occurring in the food product. According to Silva et al. [28], opacity or light refraction are optical properties of film that play an important role in controlling the influence of light, e.g., on colored films. The study observed that the highest opacity value was characteristic of a film with a 2% pectin concentration and a 10% addition of bilberry juice (12.92 a.u./mm). The same film shows the highest differences compared to the other colored film variants tested. For films based on 2% pectin, opacity values ranged from 4.56 to 12.90 a.u./mm, and for films with a 4% pectin concentration, from 3.92 to 9.78 a.u./mm. The film with the lowest opacity was found to be the film with 4% pectin concentration and 5% blackcurrant juice additive. Films with a 10% addition of bilberry juice showed statistically significant differences between the 2% and 4% pectin variants, 12.92 and 9.78 a.u./mm, respectively (Table 3). Pellá et al. [29] showed that the higher the polymer (starch) content, the greater the opacity of films with gelatin and casein additives. Gaspar et al. [30] also evaluated opacity and demonstrated color differences for films colored with fruit extracts. Other researchers have observed that plant extracts reduced light transmission, thus providing better protection against oxidative processes [31]. Liu et al. [32] showed that chitosan-based composite films with added antioxidants are characterized by lower light transmission through the sheet.

3.3. The Effect of Apple Pectin and Fruit Juice Concentrations on the Mechanical Properties of Films

In the study of mechanical properties, parameters such as tensile strength, elongation at break, and Young’s modulus for the initial measurement distance were examined. Tensile strength tells us about the mechanical resistance of the film, elongation at break about its elasticity, and Young’s modulus about its initial resistance to deformation [33]. Films with a 2% pectin concentration and a 5% addition of bilberry juice showed the lowest tensile strength (1.10 MPa). Films with the addition of the same juice, both 5% and 10%, showed no statistical differences. The highest tear resistance was observed in films with 4% pectin concentration and 5% addition of blackcurrant juice (5.34 MPa), and the same film showed significant differences compared to films with the same juice but with 2% pectin. In films with a 4% pectin concentration, it was observed that the higher the concentration of fruit juice additive, the lower the tensile strength. The opposite relationship was observed in film with a 2% pectin concentration. Al-Qahtan et al. [18] also showed that the lower the concentration of polysaccharide (starch) in biodegradable film (in this case with the addition of date powder), the lower the tensile strength.
The experiment showed that the elongation at break parameter did not show any statistically significant differences (Table 4). The greatest difference in elongation was observed between films with 2% pectin concentration and 5% addition of blackcurrant juice (11.90%) and the control sample with 4% pectin concentration (17.00%). In the case of films with 4% pectin concentration, the films showed a range of elongation at break values from 15.40% to 17.00%. In the case of films with 2% pectin concentration, the elongation at break values ranged from 11.90% to 12.92%. In the case of both 2% and 4% pectin films, no statistically significant differences were found between the films. Elongation at break tells us about the elasticity of the film, which is why the most elastic film turned out to be the control sample with 4% pectin concentration, and the film with 4% pectin concentration and 5% bilberry juice added. Al-Qahtani et al. [18] showed that the addition of date powder to starch-based films reduces the elasticity of the tested variants. The same relationship was observed in the study of colored films with added fruit juices, which reported a decrease in elasticity after the addition of fruit juice. Glycerol was also added to the colored films tested. In their publication, the authors described that the high elongation at break value occurred because glycerol reduced the intermolecular interaction between chains, thereby increasing the mobility of polymer chains.
Another important parameter in testing the mechanical properties of biodegradable films is Young’s modulus. This modulus tells us how resistant the film is to deformation. After the test, it was observed that the most visible differences occurred between films with 4% pectin concentration (88.43 MPa) and 2% pectin concentration with a 5% addition of blackcurrant juice (62.84 MPa). The same relationship could be observed for the elongation at break value. The Young’s modulus for films based on 4% pectin concentration ranged from 69.06 to 88.43 MPa, while for films based on 2% pectin concentration it ranged from 62.84 to 71.23 MPa. In both pectin concentration variants, a decrease in deformation resistance was observed when fruit juice was added to the film. Statistically significant differences were observed for the film with 2% pectin concentration and 5% bilberry juice additive compared to the control sample variant for 2% pectin (Table 4). Datta et al. [34] also showed that a sample made of polymer alone exhibited visible plasticity and high resistance to degradation at any point, compared to films with additives. In general, the decrease in Young’s modulus is primarily caused by the aggregation of fillers and cracks that occurred in the film structure, resulting in the breaking of the bond between the matrix and the filler.

3.4. The Effect of Apple Pectin and Fruit Juice Concentrations on the Water Vapor Permeability of Films

Water vapor permeability rate refers to the mass of water vapor permeating through a surface in a given time at a specified temperature and humidity. The water vapor permeability values for the tested colored films are shown in Table 5. The differences in values may depend on the polymer used, the chemical composition, physical properties, and thickness of the film [35]. A study on water vapor permeability through biodegradable films showed that there are statistically significant differences between the tested samples. The sample with 4% pectin concentration and 10% blackcurrant juice addition had the highest water vapor permeability (31.21·10−11 g/m·s·Pa) and did not show any significant differences from the sample with 2% pectin concentration and 10% blackcurrant juice additive. The control film or sample with 2% pectin concentration showed the lowest water vapor permeability (7.43·10−11 g/m·s·Pa). The same sample did not show a statistically significant difference from the one with 5% addition of bilberry juice. A significant effect was observed only after adding 10% bilberry juice.
Increased water vapor permeability after increasing the concentration of added juice was also observed in variants with added blackcurrant juice. As shown by Ke et al. [17], biopolymer films with the addition of red sweet potato extracts as a source of anthocyanins show lower water vapor permeability compared to pectin films. The water vapor permeability of the film decreased significantly from 3.96 ± 0.89·10−11 g/m·s·Pa for pectin film to 0.15 ± 0.04·10−11 g/m·s·Pa for films with extracts, indicating that the binding interactions between the extracts and the film matrix increased the strength and density of the film microstructure, creating a winding path that hinders water vapor transport [17].

3.5. The Effect of Apple Pectin and Fruit Juice Concentrations on the Thermal Properties of Films

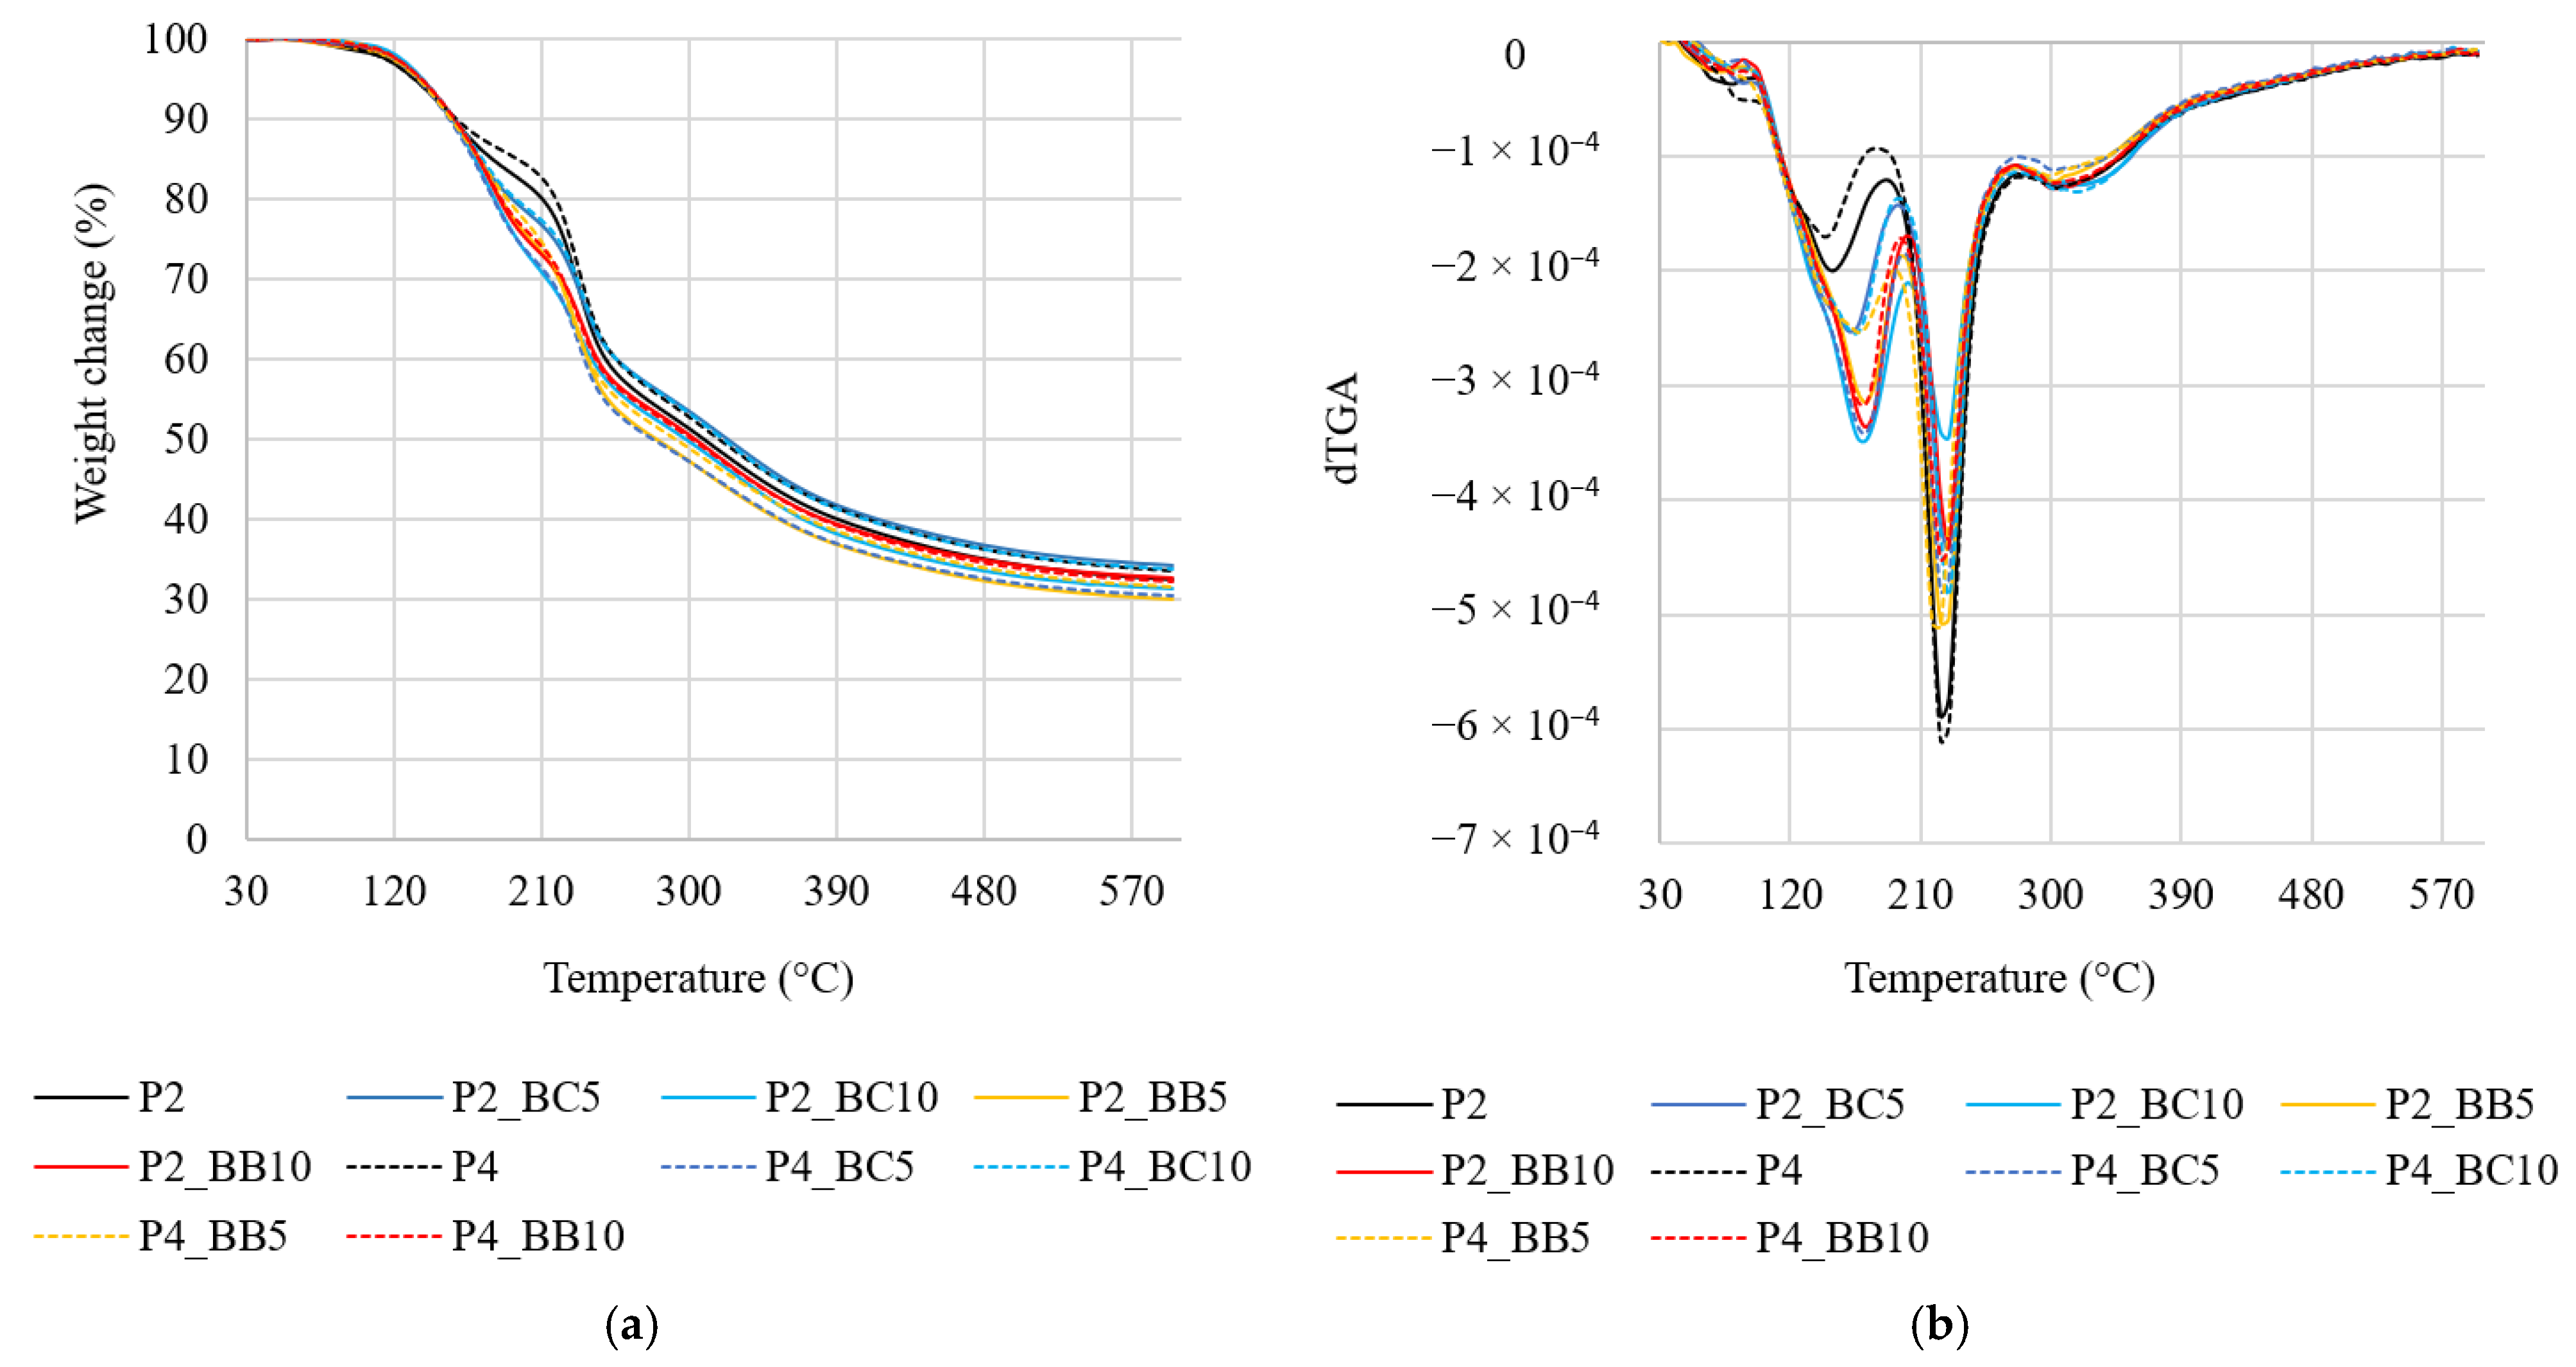
Thermogravimetric analysis (TGA) is used to assess the thermal stability of edible biopolymer films by identifying the temperatures at which different degradation events occur. This information is crucial for understanding how the films withstand heat during processing, storage, and practical food packaging applications. Figure 2 presents the weight loss kinetics (Figure 2a) during the samples’ thermal degradation and mathematically optimized first derivative (Figure 2b) expressing the decomposition rate as a function of temperature, considering that the heating rate was 5 °C per minute. As can be seen, the decomposition occurred similarly in all tested samples. The TGA curve of the edible film shows four main stages of weight loss across the studied temperature range from 30 to 600 °C. The corresponding dTGA curves display distinct peaks, which represent the maximum decomposition rates of the identified stages. Accordingly, Table 6 shows the peak temperature of decomposition at each identified stage and the percentage of material that disintegrated. The total mass loss observed for the control samples P2 and P4 was approximately 37.6%, while the juices incorporation resulted in increased values to 40–44.5%, indicating incorporation of more volatile compounds into the film.
The initial weight loss observed during heating up to 100 °C portrays the evaporation of free and bound water molecules [36], as well as some volatile compounds naturally present in the berry juices, such as anthocyanins [37]. Fortified films with a lower amount of pectin (P2) exhibited an increased weight loss in this stage. The P4 films generally showed a contrary tendency. However, the decomposition of plain control samples was three times as high in the film with 4% pectin compared to 2%. This indicates the hydrophilic nature of pectin, hence the greater amount of water contained by the P4 sample, and the ability of berry polyphenols to form hydrogen bonds with the polymer, which can influence water retention.
The transformations occurring in the first stage can also appear at higher temperatures, depending on the materials’ structure and the interactions between the composites of the matrix. The stronger the bonds and the more closed the structure, the higher the temperature required to free even substances characterized by a low boiling point. In biopolymer films, the second stage of thermal disintegration, in this study at the temperature in the range from 100 to 200 °C, usually corresponds mostly to plasticizer degradation [38], which in this case was glycerol. However, in films containing plant extracts, the onset of degradation here highlights the thermal sensitivity of juice-derived compounds, especially anthocyanins, organic acids, and sugars, which typically degrade within this range [39]. This is in accordance with the results obtained in this study, considering the notably higher weight loss recorded in the samples with the berry juices compared to the controls, in which the percentage of decomposition from the 1st and 2nd stages combined is at least two times lower than in films incorporated with the juices. This part of the TGA mostly indicates the role of natural components in modifying film stability. Considering the scale of thermal degradation at this point, fortification of films with bilberry and blackcurrant juices was highly disadvantageous to their thermal stability due to the introduction of components featuring relatively low stability themselves. However, shifts in the peak temperature toward higher values (increase by 15–25 °C for P2 and compared to the pure pectin films suggest that berry juices interacted with the matrix, possibly enhancing thermal resistance through crosslinking and causing changes in the polymer structure [40]. Additionally, de Oliveira et al. [41] suggest that at 170–180 °C, the first stages of CC and CO bonds in the pectin structure may degrade. Nevertheless, processing stages of the film manufacturing, application, and food storage rarely require using such high temperatures, and if so, they are easily adjustable to meet the requirements of the utilized material, e.g., pectin-based film.
The 3rd stage of decomposition was identified within the temperature range of 200 to 280 °C. The most significant weight loss occurs due to polysaccharide degradation and depolymerization of the pectin matrix, involving cleavage of glycosidic linkages and breakdown of the galacturonic acid backbone, which indicates the main decomposition of the pectin matrix [42]. Lower weight losses recorded in samples with berry juices than in controls indicate that in those films, pectin content was lower, likely due to the introduction of dry matter within the juices. The maximum degradation rate, expressed as a peak on the dTGA curve observed in this stage, represents the primary structural decomposition of the edible film. The peak temperature determined in the dTGA curve at this stage indicates the maximum rate of polymer decomposition, and was not remarkably affected by changes in the samples’ composition, but an increasing tendency may be noted in the P2 samples. Theoretically, the presence of berry juice components may slightly shift the maximum decomposition temperature, since sugars can accelerate thermal degradation, while polyphenols may delay it through antioxidant stabilization of the polymer matrix. In studies of citrus pectin reported by Liu et al. [43], the main degradation of the biopolymer started at 233 to 247 °C.
The 4th stage of decomposition occurred at 280 to 600 °C and is attributed to carbonization and mineralization of the residual mass. At temperatures above 500 °C, residual organic matter undergoes oxidative degradation and carbonization, leaving behind a final char residue [42]. The ash content may include minerals, such as calcium, potassium, or magnesium, originating from both biopolymers and additional components of the matrix, which contribute to higher residual mass. Results obtained in this study suggest that the addition of bilberry and blackberry juices caused the introduction of compounds exhibiting lower thermal stability, which corresponds to overall higher weight loss during heating to 600 °C of samples with the fruit juices (40–45%) than control samples (approximately 37.6% weight loss).

3.6. The Effect of Apple Pectin and Fruit Juice Concentrations on the Visual Changes of Films Under pH

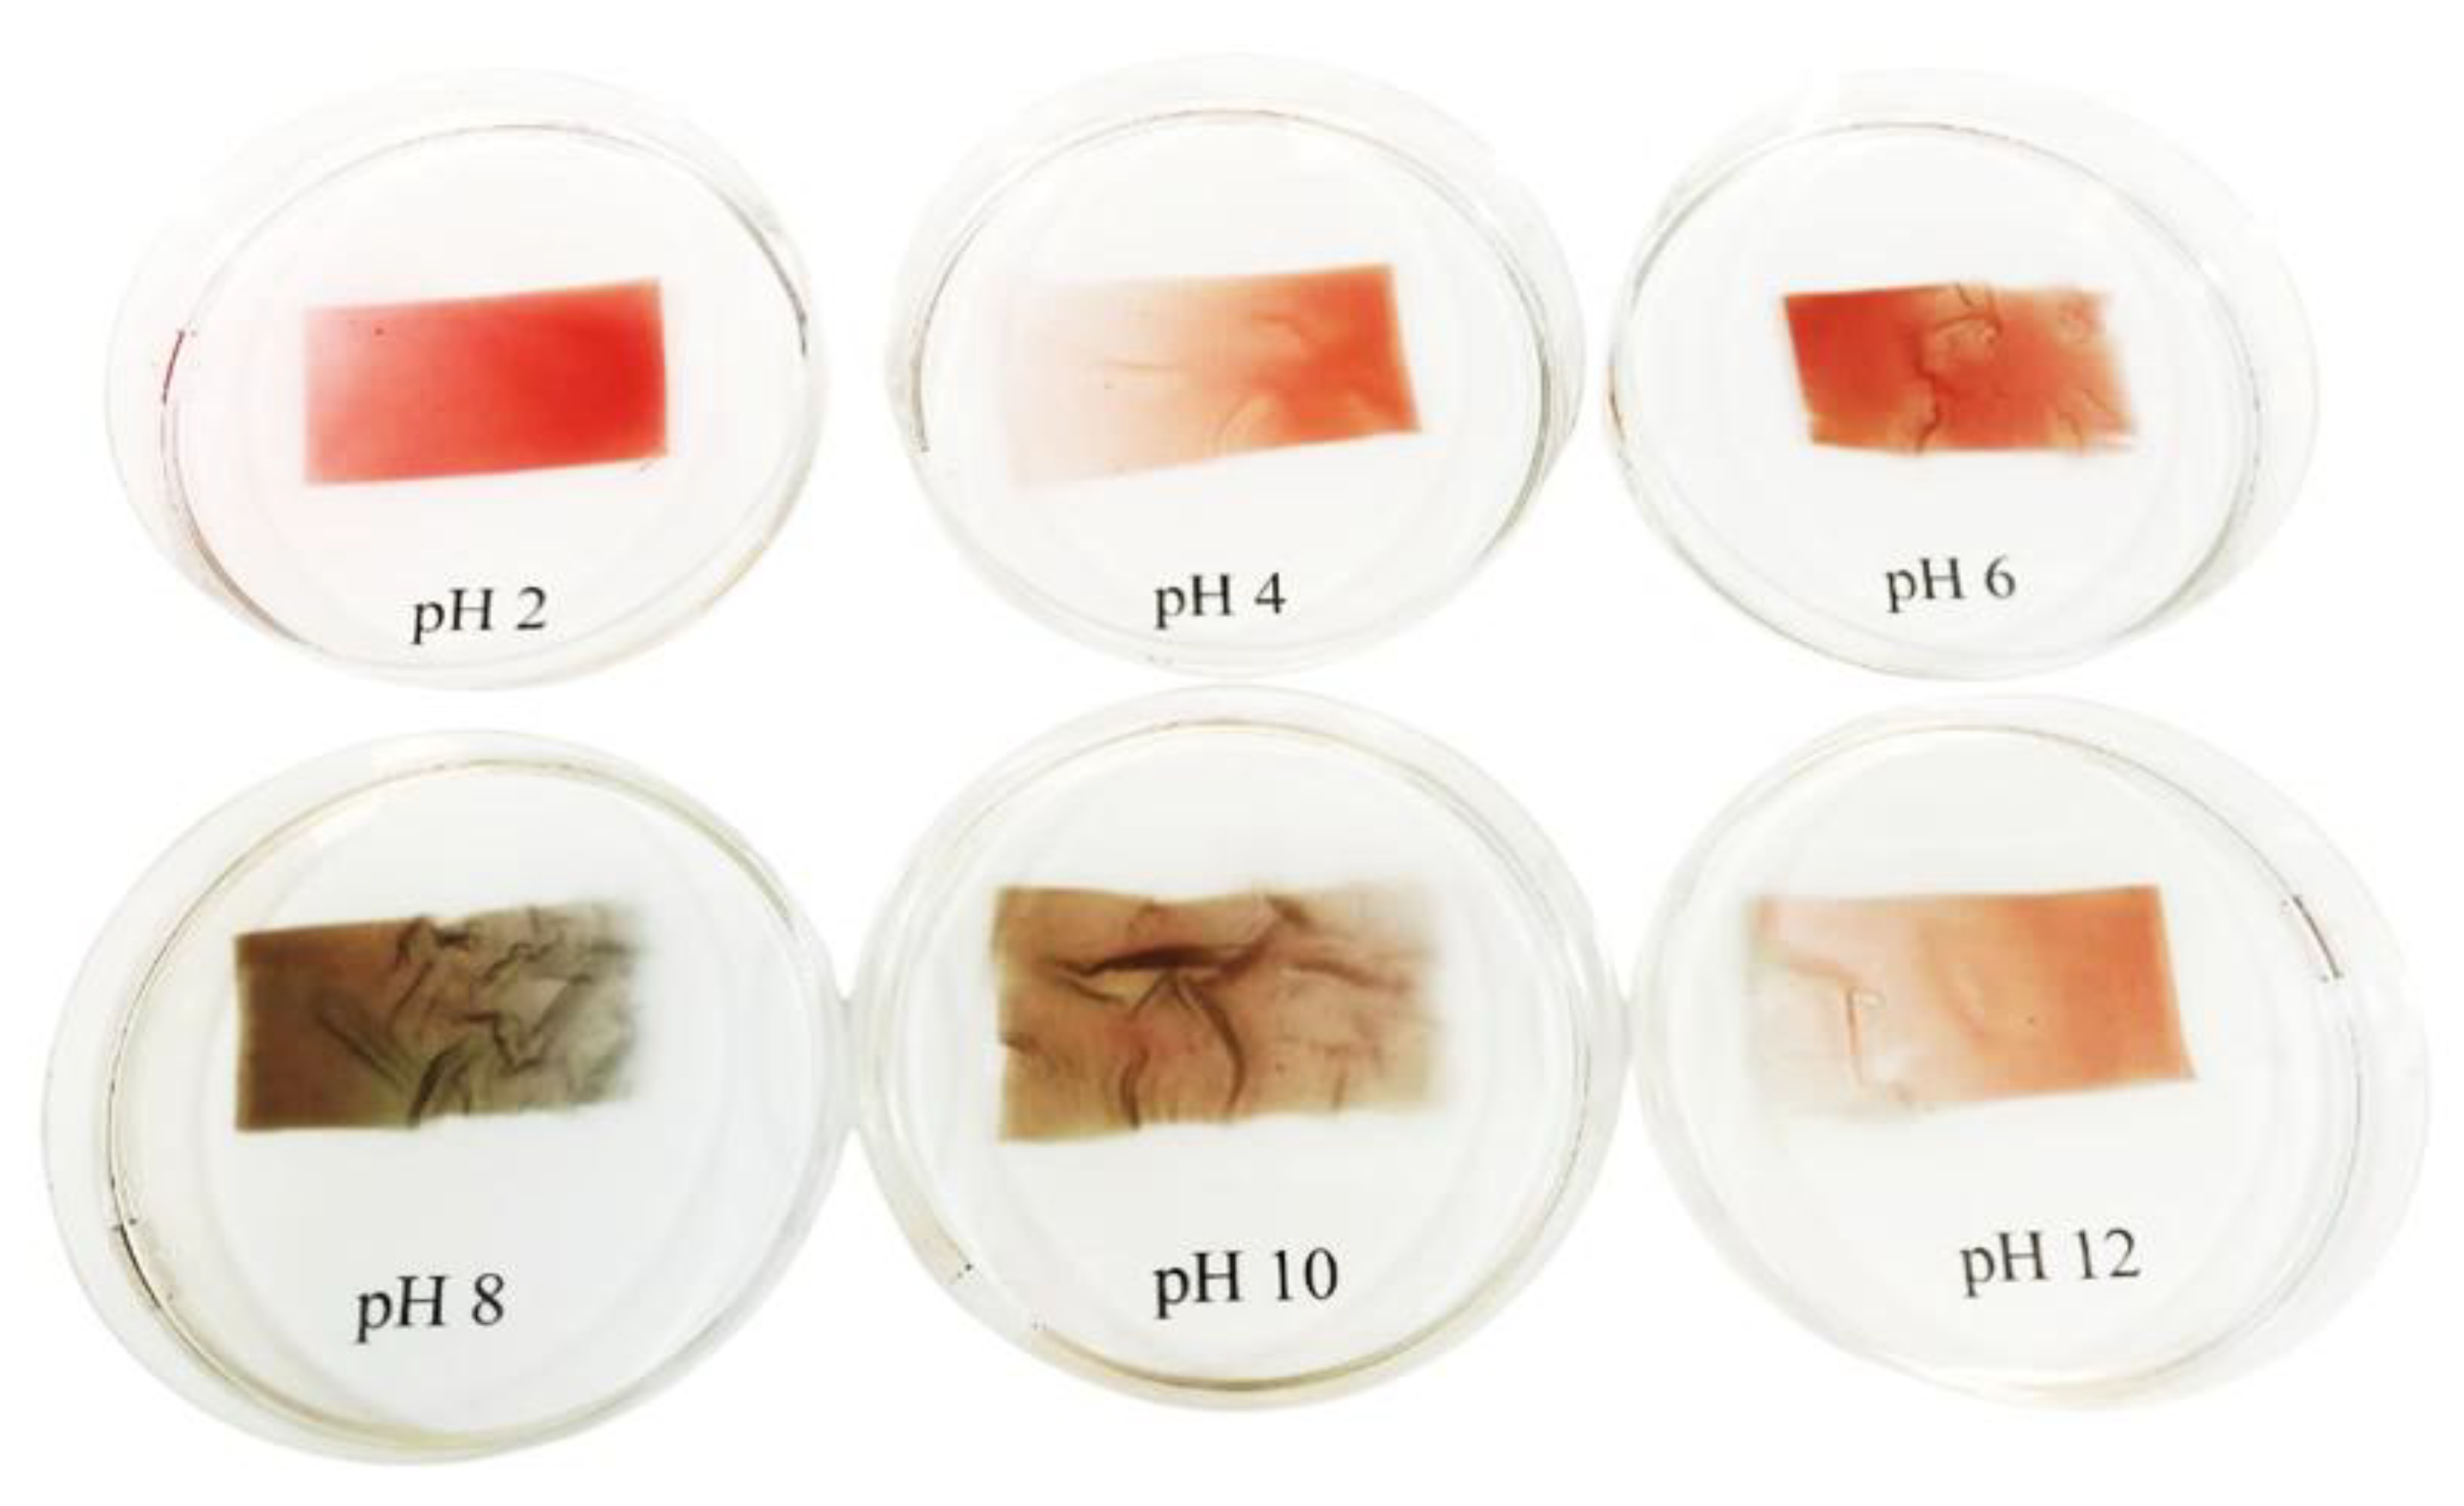
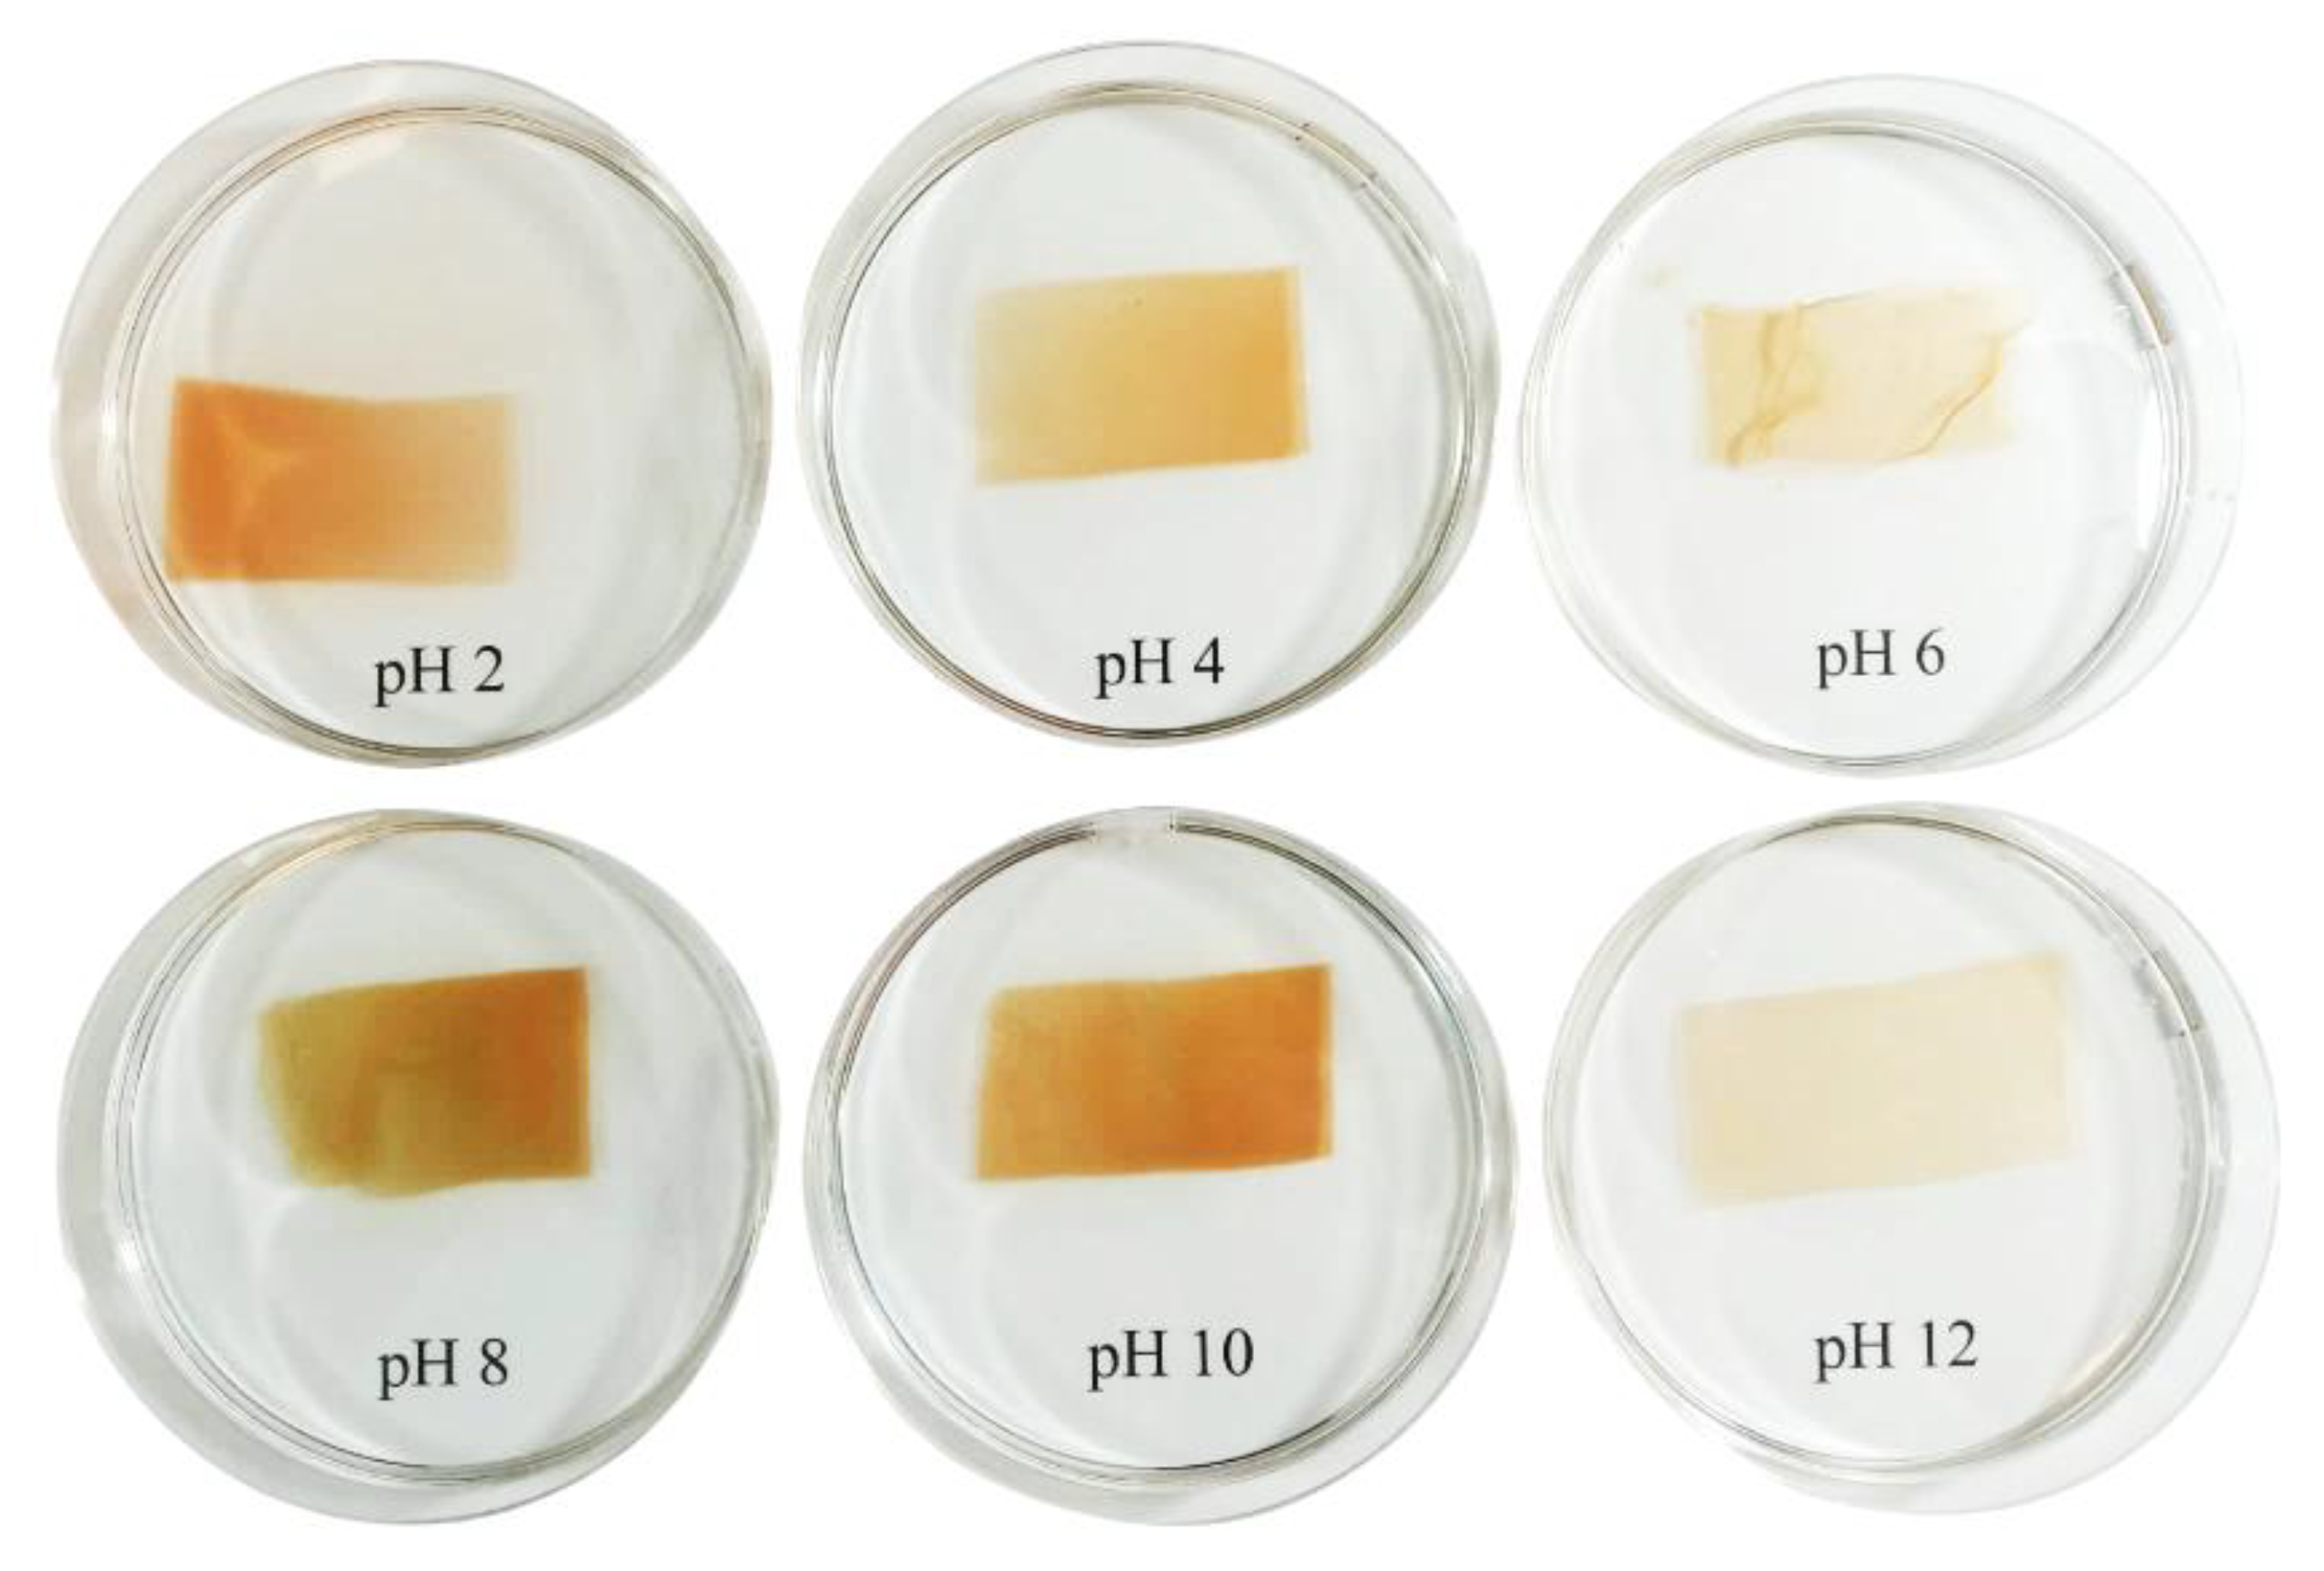
Intelligent packaging is designed to detect the present state of the environment inside the packaging and changing conditions that affect product quality and health safety. One of the monitoring systems is a colorimetric indicator, which allows changes in color to be seen by the untrained observer [44]. This provides information to the consumer before purchase, as well as to the store employee who monitors product safety on store shelves. In addition, this information is important for consumers at home when deciding which product to eat first. In the above experiment, strips of biopolymer film with the addition of natural dye as such an indicator were used (Figure 3 and Figure 4). A visual assessment of the color change of biopolymer films under the influence of appropriate pH buffers was carried out. At pH 2, both film variants exhibited a strengthening of the structure and a color shift towards red. At pH 8, films with 10% bilberry showed a color change towards dark blue/grey, while films with 10% blackcurrant exhibited dark orange/green. It was also noted that increasing the pH led to more flaccid and damaged film structures.
Ahmad et al. [45] also found that a change in the pH of the environment affects the color change of the film with the addition of butterfly pea extract, i.e., the color changed from blue (at pH 6.5) to green (at pH 8.45). Wu et al. [46] showed that a solution of anthocyanin dye extract was red at pH 3 and then blue at pH 5–6, which corresponds to the results obtained in this study. Júnior et al. [44] also observed biopolymer films with the addition of elderberry and bilberry juices, which are rich in anthocyanins. They demonstrated visible changes in the color of the film from dark red (pH 1.0–7.0) to dark yellow (pH 10.0–12.0). The changes in the color of the biodegradable films were associated with the release of volatile nitrogen compounds during food spoilage. The analyzed films showed a color change depending on the changing pH. However, this change was not very pronounced and changed rapidly with increasing film solubility in buffers. In addition, the color was not clear due to the characteristic cloudy color of film-forming pectin solutions.

3.7. The Effect of Fruit Juices on the Morphology of the Films

Figure 5 shows the morphology of the film layers: with 4% apple pectin (A), with 4% pectin and 10% bilberry juice (B), and with 4% pectin and 10% blackcurrant juice (C). The pure pectin layer (A) has a smooth and uniform surface, indicating a homogeneous polymer matrix. The addition of bilberry juice (B) causes slight roughness and surface heterogeneity, probably due to the presence of anthocyanins and other polyphenols interacting with the pectin matrix. Similarly, the film containing blackcurrant juice (C) shows slight surface irregularities and scattered particles, suggesting the incorporation of juice components into the pectin network. The addition of fruit juices slightly modifies the microstructure of the film without causing major discontinuities that could affect its mechanical and barrier properties.

4. Conclusions

The research focused on biodegradable films based on apple pectin (2% and 4%) with the addition of bilberry and blackcurrant juices. Changes in color and pH, mechanical properties (tensile strength, elongation at break, Young’s modulus), opacity, thermal properties, and water vapor permeability were analyzed. Films with fruit juices had an intense, dark purple color due to the presence of anthocyanins. The darkest film contained 2% pectin and 10% bilberry juice. The highest opacity was observed for the film with 2% pectin and 10% bilberry juice, and the lowest for 4% pectin and 5% blackcurrant juice. The addition of juices reduced the mechanical properties, with the film containing 4% pectin and 5% blackcurrant juice having the best strength. The film with 4% pectin and 10% blackcurrant juice showed the highest vapor permeability. Additionally, although berry juice fortification reduced the overall thermal stability of edible films by introducing volatile and easily degradable compounds, the interactions between polyphenols and the pectin matrix suggest potential improvements in structural integrity. Since most food processing and storage conditions do not reach the high decomposition temperatures observed, these films remain suitable for practical applications, with juice incorporation primarily affecting performance at elevated thermal conditions. At pH 8, the color shifted towards grey, and at pH 2, the film structure was strengthened, which promotes the durability of the packaging. Analyzing films with a pH indicator has the potential to be applied to various foods, and the results show that it is able to inform the consumer about the quality of the food inside the package when it is related to its pH. The novelty of this study lies in the development of biodegradable films based on apple pectin, enriched with natural juices from fruits rich in anthocyanins, which combine mechanical and barrier properties with a colorimetric freshness indicator. These films act as a natural sensor, with a change in color signaling a decline in food quality. In addition, the use of intelligent films increases consumer safety and enables informed decisions about consumption. As a result, this innovation not only protects health by preventing foodborne illnesses, but also helps to reduce product waste by distinguishing between spoiled food and food that is still fit for consumption.

Author Contributions

Conceptualization, S.G.; methodology, A.P., M.M., M.K. and S.G.; software, S.G.; validation, S.G.; formal analysis, A.P., M.M., M.K. and S.G.; investigation, S.G.; resources, A.P., M.M., M.K. and S.G.; data curation, S.G.; writing—original draft preparation, A.P., M.M., M.K. and S.G.; writing—review and editing, A.P., M.M., M.K. and S.G.; visualization, S.G.; supervision, S.G.; project administration, S.G.: funding acquisition, S.G. All authors have read and agreed to the published version of the manuscript.

Funding

This research received no external funding.

Institutional Review Board Statement

Not applicable.

Informed Consent Statement

Not applicable.

Data Availability Statement

The original contributions presented in this study are included in the article.

Acknowledgments

The authors thank Anna Safin and Katarzyna Rybak for their help during the analyses.

Conflicts of Interest

The authors declare no potential conflicts of interest with respect to the research, authorship and/or publication of this article.

References

  1. World Health Organization. Estimating the Burden of Foodborne Diseases. Available online: https://www.who.int/activities/estimating-the-burden-of-foodborne-diseases (accessed on 23 September 2025).
  2. Talib, A.; Samad, A.; Hossain, M.J.; Muazzam, A.; Anwar, B.; Atique, R.; Hwang, Y.-H.; Joo, S.-T. Modern Trends and Techniques for Food Preservation. Food Life 2024, 2024, 19–32. [Google Scholar] [CrossRef]
  3. Khan, S.; Monteiro, J.K.; Prasad, A.; Filipe, C.D.M.; Li, Y.; Didar, T.F. Material Breakthroughs in Smart Food Monitoring: Intelligent Packaging and On-Site Testing Technologies for Spoilage and Contamination Detection. Adv. Mater. 2024, 36, e2300875. [Google Scholar] [CrossRef]
  4. Mkhari, T.; Adeyemi, J.O.; Fawole, O.A. Recent Advances in the Fabrication of Intelligent Packaging for Food Preservation: A Review. Processes 2025, 13, 539. [Google Scholar] [CrossRef]
  5. Zhao, X.; Zhang, H.; Xiang, H.; Yu, D.; Gao, M.; Yan, R.; Zhang, D. A Nature PH Indicator with High Colorimetric Response Sensitivity for Pork Freshness Monitoring. Food Biosci. 2024, 57, 103519. [Google Scholar] [CrossRef]
  6. Chen, S.; Li, Z.; Ren, D.; Wu, X.; Xu, D. Improved Sensitivity of Freshness Indicator Based on Purple Sweet Potato Anthocyanins through PH Optimization and Its Application in Flesh Food Monitoring during Logistics. Innov. Food Sci. Emerg. Technol. 2025, 100, 103929. [Google Scholar] [CrossRef]
  7. Nastasi, J.R.; Hay, T.O.; Fitzgerald, M.A.; Kontogiorgos, V. Design and Evaluation of PH-Sensitive Pectin Films Infused with Anthocyanin-Rich Extracts from Australian Native Fruits for Intelligent Food Packaging Applications. Food Biophys. 2025, 20, 1. [Google Scholar] [CrossRef]
  8. Teixeira, S.C.; de Oliveira, T.V.; Assis Silva, R.R.; Ribeiro, A.R.C.; Stringheta, P.C.; Rigolon, T.C.B.; Pinto, M.R.M.R.; Soares, N. de F.F. Colorimetric Indicators of Açaí Anthocyanin Extract in the Biodegradable Polymer Matrix to Indicate Fresh Shrimp. Food Biosci. 2022, 48, 101808. [Google Scholar] [CrossRef]
  9. Shi, S.; Xu, X.; Feng, J.; Ren, Y.; Bai, X.; Xia, X. Preparation of NH3- and H2S-Sensitive Intelligent PH Indicator Film from Sodium Alginate/Black Soybean Seed Coat Anthocyanins and Its Use in Monitoring Meat Freshness. Food Packag. Shelf Life 2023, 35, 100994. [Google Scholar] [CrossRef]
  10. Kwak, M.; Min, S.C. Monitoring Meat Freshness with Intelligent Colorimetric Labels Containing Red Cabbage Anthocyanins Copigmented with Gelatin and Gallic Acid. Foods 2024, 13, 3464. [Google Scholar] [CrossRef]
  11. Pellissery, A.J.; Vinayamohan, P.G.; Amalaradjou, M.A.R.; Venkitanarayanan, K. Chapter 17—Spoilage Bacteria and Meat Quality. In Meat Quality Analysis; Biswas, A.K., Mandal, P.K., Eds.; Academic Press: Cambridge, MA, USA, 2020; pp. 307–334. ISBN 978-0-12-819233-7. [Google Scholar]
  12. Shaik, M.I.; Azhari, M.F.; Sarbon, N.M. Gelatin-Based Film as a Color Indicator in Food-Spoilage Observation: A Review. Foods 2022, 11, 3797. [Google Scholar] [CrossRef] [PubMed]
  13. Magnaghi, L.R.; Zanoni, C.; Alberti, G.; Quadrelli, P.; Biesuz, R. Towards Intelligent Packaging: BCP-EVOH@ Optode for Milk Freshness Measurement. Talanta 2022, 241, 123230. [Google Scholar] [CrossRef]
  14. Cherian, E.; TS, K.; KN, S.; KS, A.; Poothicote, N.G. Investigation into Pectin Extraction and Technological Implementations in the Food Industry. J. Sci. Food Agric. 2024, 104, 9102–9110. [Google Scholar] [CrossRef]
  15. Syarifuddin, A.; Muflih, M.H.; Izzah, N.; Fadillah, U.; Ainani, A.F.; Dirpan, A. Pectin-Based Edible Films and Coatings: From Extraction to Application on Food Packaging towards Circular Economy—A Review. Carbohydr. Polym. Technol. Appl. 2025, 9, 100680. [Google Scholar] [CrossRef]
  16. Zhang, X.; Chen, X.; Dai, J.; Cui, H.; Lin, L. Edible Films of Pectin Extracted from Dragon Fruit Peel: Effects of Boiling Water Treatment on Pectin and Film Properties. Food Hydrocoll. 2024, 147, 109324. [Google Scholar] [CrossRef]
  17. Ke, F.; Yang, M.; Ji, W.; Liu, D. Functional PH-Sensitive Film Based on Pectin and Whey Protein for Grape Preservation and Shrimp Freshness Monitoring. Food Chem. 2025, 463, 141092. [Google Scholar] [CrossRef]
  18. Al-Qahtani, S.D.; Al-Ola, K.A.A.; Al-Senani, G.M. Infiltration of Anthocyanidin and Cellulose-Reinforced Polylactic Acid into Delignified Wood toward Smart Packaging. Sustain. Chem. Pharm. 2024, 42, 101800. [Google Scholar] [CrossRef]
  19. Han, J.H.; Floros, J.D. Casting Antimicrobial Packaging Films and Measuring Their Physical Properties and Antimicrobial Activity. J. Plast. Film Sheeting 1997, 13, 287–298. [Google Scholar] [CrossRef]
  20. ASTM D882-02; Standard Test Method for Tensile Properties of Thin Plastic Sheeting. ASTM International: West Conshohocken, PA, USA, 2002. Available online: https://store.astm.org/d0882-02.html (accessed on 4 October 2025).
  21. Debeaufort, F.; Martin-Polo, M.; Voilley, A. Polarity Homogeneity and Structure Affect Water Vapor Permeability of Model Edible Films. J. Food Sci. 1993, 58, 426–429. [Google Scholar] [CrossRef]
  22. Mikus, M.; Galus, S.; Ciurzyńska, A.; Janowicz, M. Development and Characterization of Novel Composite Films Based on Soy Protein Isolate and Oilseed Flours. Molecules 2021, 26, 3738. [Google Scholar] [CrossRef] [PubMed]
  23. Mujanović, I.; Balijagić, J.; Bajagić, M.; Poštić, D.; Đurović, S. Variations in Polyphenol Content and Anthocyanin Composition in Bilberry Populations (Vaccinium myrtillus L.) Due to Environmental Factors. J. Food Compos. Anal. 2024, 136, 106732. [Google Scholar] [CrossRef]
  24. Wagner, A.; Dussling, S.; Nowak, A.; Zimmermann, L.; Bach, P.; Ludwig, M.; Kumar, K.; Will, F.; Schweiggert, R.; Steingass, C.B. Investigations into the Stability of Anthocyanins in Model Solutions and Blackcurrant Juices Produced with Various Dejuicing Technologies. Eur. Food Res. Technol. 2023, 249, 1771–1784. [Google Scholar] [CrossRef]
  25. Giusti, M.M.; Gordillo, B.; González-Miret, M.L. Color Analysis. In Nielsen’s Food Analysis; Ismail, B.P., Nielsen, S.S., Eds.; Springer International Publishing: Cham, Switzerland, 2024; pp. 509–522. ISBN 978-3-031-50643-7. [Google Scholar]
  26. Kurek, M.; Benbettaieb, N.; Ščetar, M.; Chaudy, E.; Repajić, M.; Klepac, D.; Valić, S.; Debeaufort, F.; Galić, K. Characterization of Food Packaging Films with Blackcurrant Fruit Waste as a Source of Antioxidant and Color Sensing Intelligent Material. Molecules 2021, 26, 2569. [Google Scholar] [CrossRef] [PubMed]
  27. Li, Y.; Hu, Z.; Huo, R.; Cui, Z. Preparation of an Indicator Film Based on Pectin, Sodium Alginate, and Xanthan Gum Containing Blueberry Anthocyanin Extract and Its Application in Blueberry Freshness Monitoring. Heliyon 2023, 9, e14421. [Google Scholar] [CrossRef] [PubMed]
  28. Medeiros Silva, V.D.; Coutinho Macedo, M.C.; Rodrigues, C.G.; Neris dos Santos, A.; de Freitas e Loyola, A.C.; Fante, C.A. Biodegradable Edible Films of Ripe Banana Peel and Starch Enriched with Extract of Eriobotrya Japonica Leaves. Food Biosci. 2020, 38, 100750. [Google Scholar] [CrossRef]
  29. Pellá, M.C.G.; Silva, O.A.; Pellá, M.G.; Beneton, A.G.; Caetano, J.; Simões, M.R.; Dragunski, D.C. Effect of Gelatin and Casein Additions on Starch Edible Biodegradable Films for Fruit Surface Coating. Food Chem. 2020, 309, 125764. [Google Scholar] [CrossRef]
  30. Gaspar, M.C.; Leocádio, J.; Mendes, C.V.T.; Cardeira, M.; Fernández, N.; Matias, A.; Carvalho, M.G.V.S.; Braga, M.E.M. Biodegradable Film Production from Agroforestry and Fishery Residues with Active Compounds. Food Packag. Shelf Life 2021, 28, 100661. [Google Scholar] [CrossRef]
  31. Souza, V.G.L.; Fernando, A.L.; Pires, J.R.A.; Rodrigues, P.F.; Lopes, A.A.S.; Fernandes, F.M.B. Physical Properties of Chitosan Films Incorporated with Natural Antioxidants. Ind. Crop. Prod. 2017, 107, 565–572. [Google Scholar] [CrossRef]
  32. Liu, J.; Liu, S.; Wu, Q.; Gu, Y.; Kan, J.; Jin, C. Effect of Protocatechuic Acid Incorporation on the Physical, Mechanical, Structural and Antioxidant Properties of Chitosan Film. Food Hydrocoll. 2017, 73, 90–100. [Google Scholar] [CrossRef]
  33. Nazari, M.; Matusiak, B.; Yoshizawa, N.; Takase, K. Comparative Study of Color Shift Metrics in Architectural Lighting: Impact of Tinted Glazing on View Color Perception. LEUKOS 2025, 2515558. [Google Scholar] [CrossRef]
  34. Datta, D.; Mahto, S.; Das, B. Biodegradability and Property Assessment of Different Categorized Polymeric Films. Mater. Today Proc. 2021, 43, 2014–2024. [Google Scholar] [CrossRef]
  35. Sahoo, R.; Sundara, R.; Venkatachalam, S. Morphology Dependent EMI Shielding Performance of Ag-Ni Core-Shell Nanowires. J. Alloys Compd. 2024, 981, 173693. [Google Scholar] [CrossRef]
  36. Aburto, J.; Moran, M.; Galano, A.; Torres-García, E. Non-Isothermal Pyrolysis of Pectin: A Thermochemical and Kinetic Approach. J. Anal. Appl. Pyrolysis 2015, 112, 94–104. [Google Scholar] [CrossRef]
  37. Oancea, S. A Review of the Current Knowledge of Thermal Stability of Anthocyanins and Approaches to Their Stabilization to Heat. Antioxidants 2021, 10, 1337. [Google Scholar] [CrossRef] [PubMed]
  38. Guadarrama-Lezama, A.Y.; Castaño, J.; Velázquez, G.; Carrillo-Navas, H.; Alvarez-Ramírez, J. Effect of Nopal Mucilage Addition on Physical, Barrier and Mechanical Properties of Citric Pectin-Based Films. J. Food Sci. Technol. 2018, 55, 3739–3748. [Google Scholar] [CrossRef] [PubMed]
  39. Gharanjig, H.; Iri, M.; Hosseinnezhad, M.; Gharanjig, K.; Jafari, S.M. Enhanced Thermal Stability of Anthocyanins through Natural Polysaccharides from Angum Gum and Cress Seed Gum. J. Food Sci. 2022, 87, 585–598. [Google Scholar] [CrossRef]
  40. Wang, C.; Cai, W.-D.; Yao, J.; Wu, L.-X.; Li, L.; Zhu, J.; Yan, J.-K. Conjugation of Ferulic Acid onto Pectin Affected the Physicochemical, Functional and Antioxidant Properties. J. Sci. Food Agric. 2020, 100, 5352–5362. [Google Scholar] [CrossRef]
  41. De Oliveira, A.C.S.; Ferreira, L.F.; de Oliveira Begali, D.; Ugucioni, J.C.; de Sena Neto, A.R.; Yoshida, M.I.; Borges, S.V. Thermoplasticized Pectin by Extrusion/Thermo-Compression for Film Industrial Application. J. Polym. Environ. 2021, 29, 2546–2556. [Google Scholar] [CrossRef]
  42. Wani, K.M.; Uppaluri, R.V.S. Characterization of Pectin Extracted from Pomelo Peel Using Pulsed Ultrasound Assisted Extraction and Acidic Hot Water Extraction Process. Appl. Food Res. 2023, 3, 100345. [Google Scholar] [CrossRef]
  43. Liu, N.; Yang, W.; Li, X.; Zhao, P.; Liu, Y.; Guo, L.; Huang, L.; Gao, W. Comparison of Characterization and Antioxidant Activity of Different Citrus Peel Pectins. Food Chem. 2022, 386, 132683. [Google Scholar] [CrossRef]
  44. Marangoni Júnior, L.; Vieira, R.P.; Jamróz, E.; Anjos, C.A.R. Furcellaran: An Innovative Biopolymer in the Production of Films and Coatings. Carbohydr. Polym. 2021, 252, 117221. [Google Scholar] [CrossRef]
  45. Ahmad, N.; Tayyeb, D.; Ali, I.; Alruwaili, N.K.; Ahmad, W.; ur Rehman, A.; Khan, A.H.; Iqbal, M.S. Development and Characterization of Hemicellulose-Based Films for Antibacterial Wound-Dressing Application. Polymers 2020, 12, 548. [Google Scholar] [CrossRef]
  46. Wu, L.-T.; Tsai, I.-L.; Ho, Y.-C.; Hang, Y.-H.; Lin, C.; Tsai, M.-L.; Mi, F.-L. Active and Intelligent Gellan Gum-Based Packaging Films for Controlling Anthocyanins Release and Monitoring Food Freshness. Carbohydr. Polym. 2021, 254, 117410. [Google Scholar] [CrossRef]
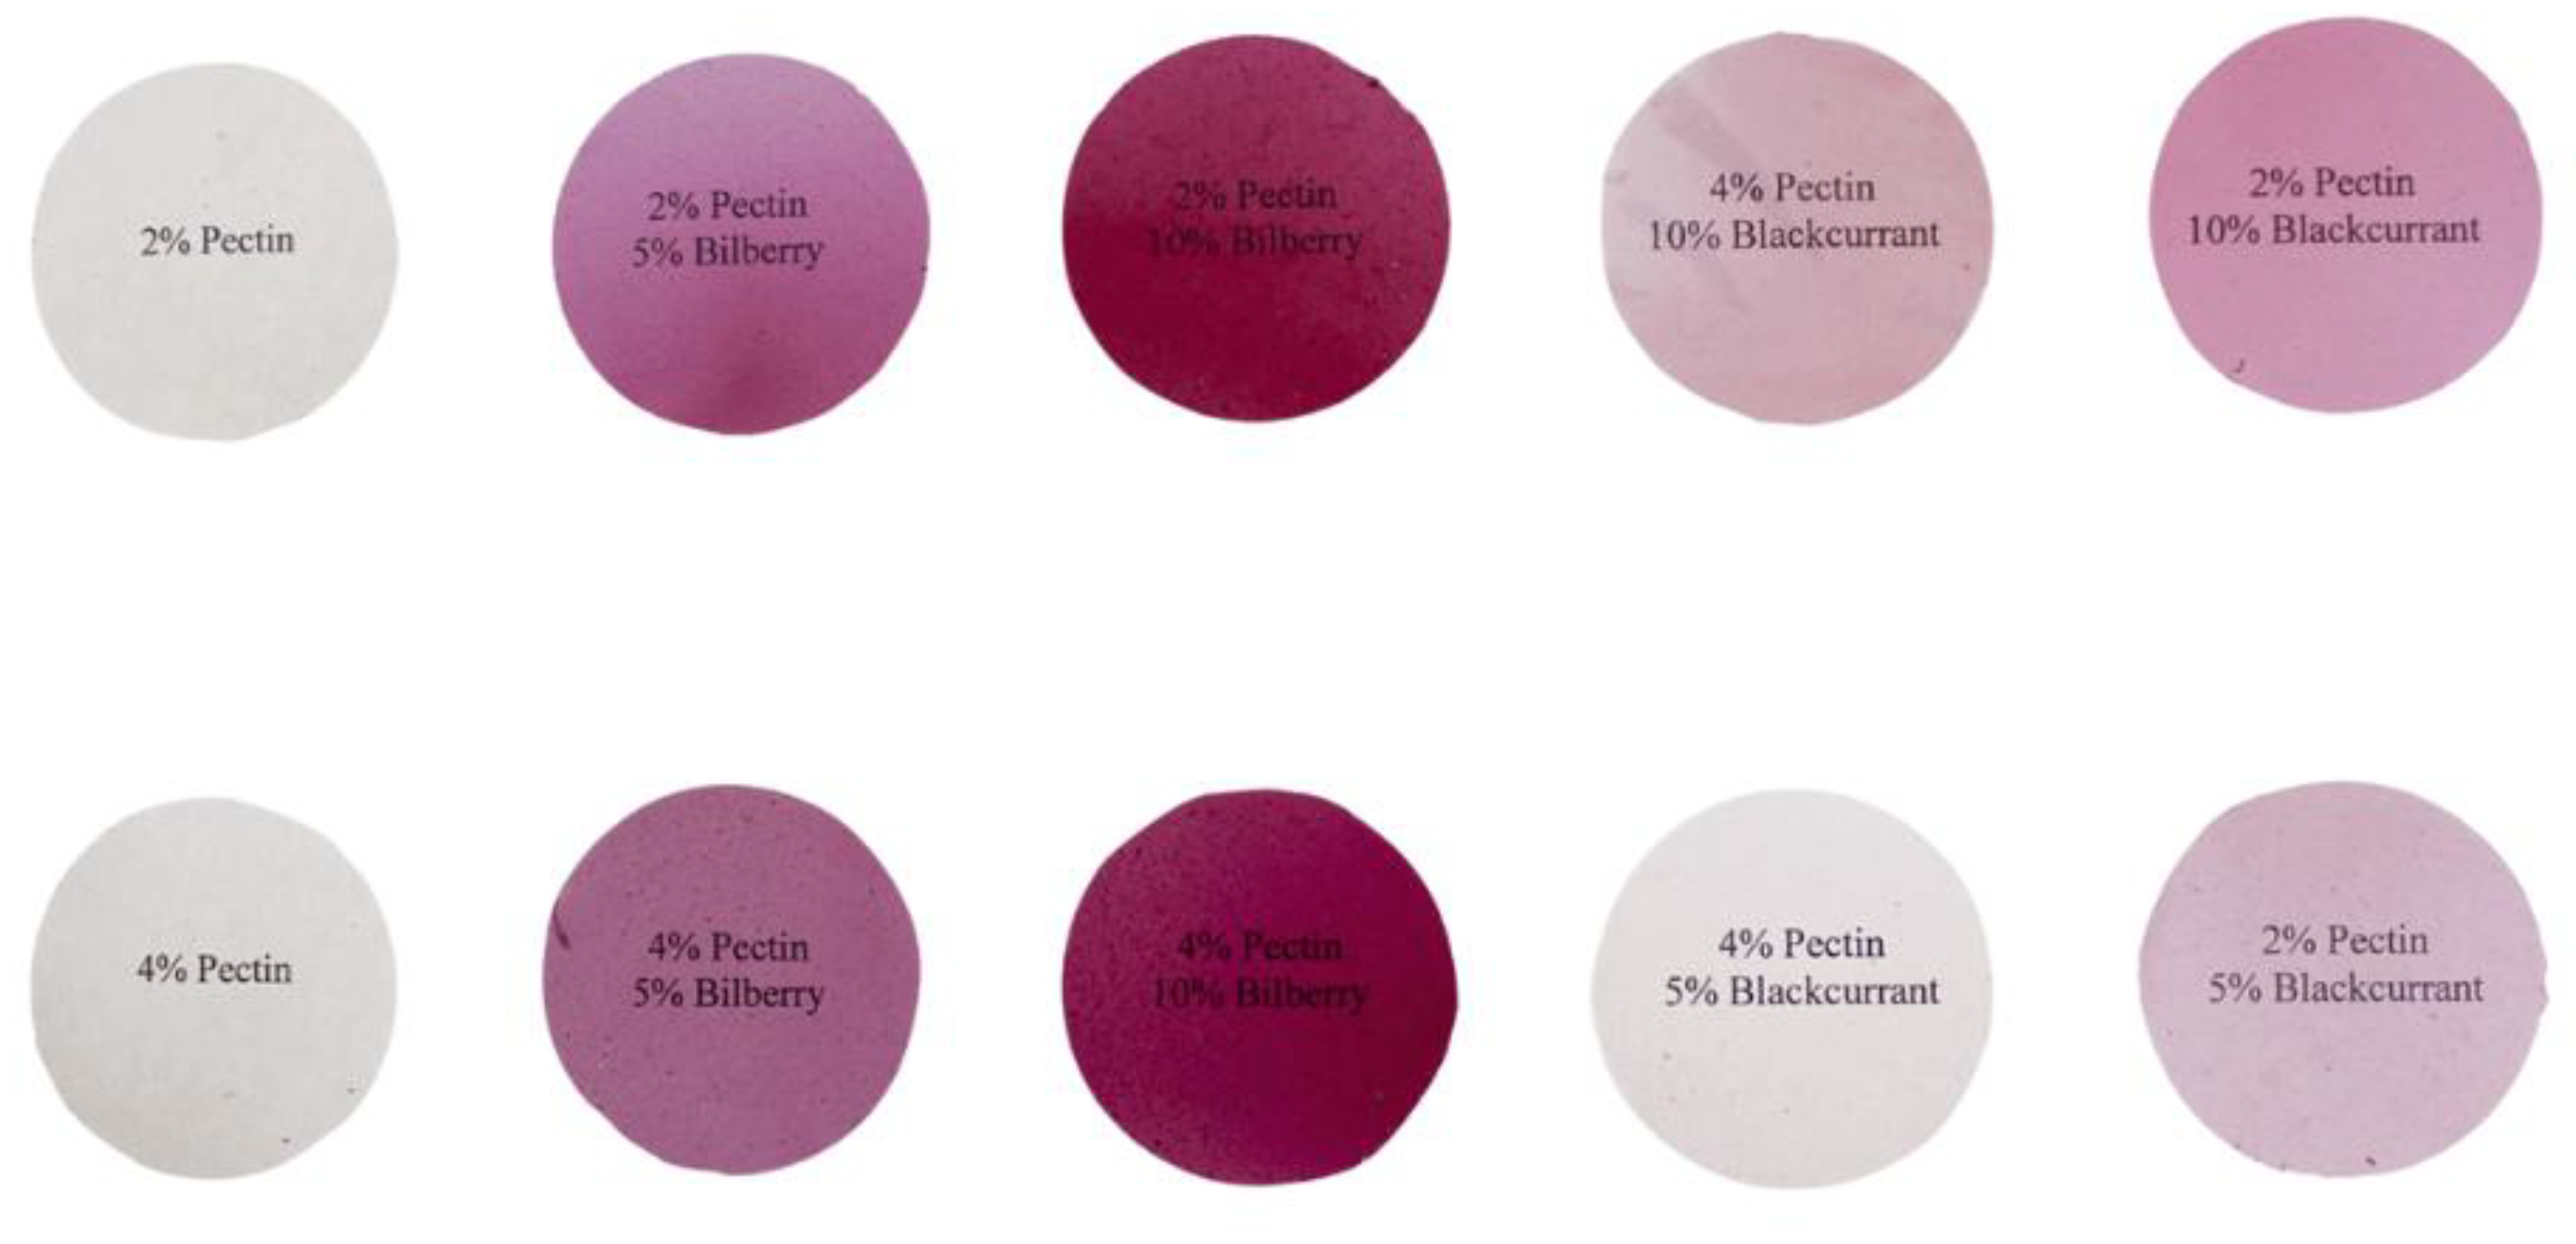
Figure 1. Pectin films with blackcurrant and bilberry juices.
Applsci 15 10789 g001
Figure 2. Results of thermogravimetric analysis. (a) Weight loss kinetic and (b) derivative thermogravimetry (dTGA) curves of pectin films with blackcurrant (BC) and bilberry (BB) juices.
Applsci 15 10789 g002
Figure 3. Reaction to pH change in films with 4% pectin concentration and 10% bilberry juice additive.
Applsci 15 10789 g003
Figure 4. Reaction to pH change in films with 4% pectin concentration and 10% blackcurrant juice additive.
Applsci 15 10789 g004
Figure 5. Microscopic images of the film layers’ surfaces: (A)—P4, (B)—P4_BB10, (C)—P4_BC10—magnification 1000×.
Applsci 15 10789 g005
Table 1. Film compositions.
FilmPectin (P)
(%)
Glycerol
(%)
Blackcurrant (BC)
(%)
Bilberry (BB)
(%)
P2250--
P2_BC52505-
P2_BC1025010-
P2_BB5250-5
P2_BB10250-10
P4450--
P4_BC54505-
P4_BC1045010-
P4_BB5450-5
P4_BB10450-10
Table 2. L*, a*, b* color parameters for the analyzed film-forming solutions based on pectin (P) with blackcurrant (BC) and bilberry (BB) juices.
SampleL*a*b*
P221.50 ± 0.03 k−0.11 ± 0.07 a7.80 ± 0.05 k
P2_BC512.10 ± 0.05 h16.30 ±0.11 i4.70 ± 0.12 g
P2_BC108.65 ± 0.07 f17.90 ±0.20 j5.50 ± 0.10 h
P2_BB56.98 ± 0.06 e11.20 ± 0.18 f2.39 ± 0.13 d
P2_BB104.84 ± 0.07 c8.26 ± 0.20 e2.01 ± 0.10 c
P425.80 ± 0.03 l1.44 ± 0.06 c12.20 ± 0.11 l
P4_BC511.40 ± 0.05 g18.20 ± 0.05 k6.82 ± 0.08 i
P4_BC106.40 ± 0.10 d20.70 ± 0.13 l7.40 ± 0.16 j
P4_BB515.90 ± 0.07 j13.90 ± 0.15 h3.01 ± 0.15 e
P4_BB1012.40 ± 0.05 i11.70 ± 0.19 g3.19 ± 0.14 f
Blackcurrant juice (BC)2.70 ± 0.06 b4.70 ± 0.22 d0.86 ± 0.11 b
Bilberry juice (BB)1.31 ± 0.05 a0.36 ±0.16 b0.26 ± 0.07 a
Superscript letters a–l indicate statistically significant differences within the same column (p < 0.05). Values in a given column that share at least one identical letter are not significantly different from each other, while values marked with different letters indicate significant differences.
Table 3. L*, a*, b*, color parameters, total color difference (∆E), and opacity (O) of pectin (P) films with blackcurrant (BC) and bilberry (BB) juices.
FilmL*a*b*ΔEO (a.u./mm)
P292.20 ± 1.39 f0.02 ± 0.37 a11.90 ± 3.23 ef-6.93 ± 1.25 b
P2_BC579.60 ± 3.46 e16.40 ± 2.87 c10.90 ± 0.83 def20.69 ± 4.05 b4.56 ± 1.09 a
P2_BC1069.80 ± 4.71 d32.10 ± 3.56 de8.66 ± 1.39 cd39.24 ± 5.67 a5.48 ± 1.31 ab
P2_BB561.50 ± 5.20 c34.50 ± 2.94 e2.95 ± 1.33 a47.07 ± 5.44 a6.17 ± 1.62 b
P2_BB1049.60 ± 1.77 a41.60 ± 2.49 f9.33 ± 1.60 cde59.59 ± 2.09 b12.90 ± 1.54 d
P491.80 ± 0.70 f−0.41 ± 0.08 a12.9 ± 1.97 f-6.69 ± 1.36 b
P4_BC589.30 ± 1.37 f5.49 ± 1.06 b7.48 ± 0.95 bc8.41 ± 1.44 a3.92 ± 0.48 a
P4_BC1081.50 ± 2.34 e16.40 ± 2.34 c9.02 ± 2.16 cde20.09 ± 3.37 b5.78 ± 1.36 b
P4_BB570.90 ± 2.93 d28.30 ± 2.74 d4.58 ± 0.38 ab36.60 ± 4.28 c4.08 ± 1.10 a
P4_BB1055.60 ± 2.05 b41.60 ± 0.62 f8.37 ± 0.63 cd55.70 ± 1.91 d9.78 ± 1.31 c
Superscript letters a–f indicate statistically significant differences within the same column (p < 0.05). Values in a given column that share at least one identical letter are not significantly different from each other, while values marked with different letters indicate significant differences.
Table 4. Mechanical properties of pectin (P) films with blackcurrant (BC) and bilberry (BB) juices.
FilmTensile Strength
(MPa)
Elongation at Break
(%)
Modul Younga
(MPa)
P21.97 ± 1.02 ab12.87 ± 1.92 ab71.23 ± 7.94 bc
P2_BC52.07 ± 1.40 ab11.90 ± 0.83 a62.84 ± 9.54 a
P2_BC102.90 ± 0.53 ab12.59 ± 0.67 ab67.69 ± 6.28 ab
P2_BB51.10 ± 0.91 a12.92 ± 0.39 ab64.59 ± 6.63 a
P2_BB101.22 ± 0.41 ab12.92 ± 1.17 ab67.38 ± 2.99 ab
P47.28 ± 0.82 d17.0 ± 2.67 b88.43 ± 13.88 c
P4_BC55.34 ± 0.44 cd15.40 ± 0.85 ab81.77 ± 3.45 bc
P4_BC103.87 ± 0.86 ab15.41 ± 2.09 ab71.59 ± 8.73 bc
P4_BB52.30 ± 1.25 ab16.74 ± 0.56 b69.23 ± 3.87 bc
P4_BB102.44 ± 1.04 ab16.40 ± 0.51 b69.06 ± 5.93 bc
Superscript letters a–d indicate statistically significant differences within the same column (p < 0.05). Values in a given column that share at least one identical letter are not significantly different from each other, while values marked with different letters indicate significant differences.
Table 5. Water vapor permeability (WVP) of pectin (P) films with blackcurrant (BC) and bilberry (BB) juices.
FilmWVP
(·10−11 g/m·s·Pa)
P27.43 ± 0.54 a
P2_BC520.54 ± 0.32 abc
P2_BC1023.39 ± 5.48 bc
P2_BB521.37 ± 2.53 bc
P2_BB1027.98 ± 3.76 c
P411.51 ± 0.32 ab
P4_BC523.09 ± 8.65 bc
P4_BC1031.21 ± 6.86 c
P4_BB521.37 ± 2.53 bc
P4_BB1023.64 ± 7.28 bc
Superscript letters a–c indicate statistically significant differences within the same column (p < 0.05). Values in a given column that share at least one identical letter are not significantly different from each other, while values marked with different letters indicate significant differences.
Table 6. Temperature (T) and weight loss (WL) related to stages of TG/DTG curves of pectin (P) films with bilberry (BB) and blackcurrant (BC) juices.
Film1st Stage 0–100 °C2nd Stage 100–200 °C3th Stage 200–280 °C4th Stage 280–600 °C
T (°C)WL (%)T (°C)WL (%)T (°C)WL (%)T (°C)WL (%)
P267.970.93147.166.60227.5815.04318.3414.99
P2_BC584.534.47162.8811.51229.749.93337.5517.22
P2_BC1064.191.62170.6617.01229.225.70335.8515.67
P2_BB562.622.47171.0213.37228.4212.12321.5115.17
P2_BB1064.251.73171.8916.15230.348.45316.3017.05
P480.382.99143.573.20227.5915.91321.4715.64
P4_BC564.171.66171.6617.19227.9110.11335.6814.35
P4_BC1078.321.68165.0412.56230.6610.61332.2316.29
P4_BB579.423.67168.2710.85222.6412.03337.6214.41
P4_BB1079.811.52170.0715.28227.7410.30321.4917.47
Disclaimer/Publisher’s Note: The statements, opinions and data contained in all publications are solely those of the individual author(s) and contributor(s) and not of MDPI and/or the editor(s). MDPI and/or the editor(s) disclaim responsibility for any injury to people or property resulting from any ideas, methods, instructions or products referred to in the content.