Review

X-Ray Absorption and Emission Spectroscopy in Pharmaceutical Applications: From Local Atomic Structure Elucidation to Protein-Metal Complex Analysis—A Review

by
Klaudia Wojtaszek
1,*,
Krzysztof Tyrała
2 and
Ewelina Błońska-Sikora
3
1
Department of Pharmaceutical Biophysics, Faculty of Pharmacy, Jagiellonian University Medical College, Medyczna 9, 30-688 Kraków, Poland
2
Independent Researcher, 30-669 Kraków, Poland
3
Department of Pharmaceutical Sciences, Collegium Medicum, Jan Kochanowski University of Kielce, IX Wieków Kielc 19a, 25-516 Kielce, Poland
*
Author to whom correspondence should be addressed.
Appl. Sci. 2025, 15(19), 10784; https://doi.org/10.3390/app151910784
Submission received: 30 July 2025 / Revised: 12 September 2025 / Accepted: 19 September 2025 / Published: 7 October 2025
(This article belongs to the Special Issue Contemporary Pharmacy: Advances and Challenges)

Abstract

X-ray absorption spectroscopy (XAS) and X-ray emission spectroscopy (XES) are analytical techniques enabling precise analysis of the electronic structure and local atomic environment in chemical compounds and materials. Their application spans materials science, chemistry, biology, and environmental sciences, supporting studies on catalytic mechanisms, redox processes, and metal speciation. A key advantage of both techniques is element selectivity, allowing the analysis of specific elements without matrix interference. Their high sensitivity to chemical state and coordination enables determination of oxidation states, electronic configuration, and local geometry. These methods are applicable to solids, liquids, and gases without special sample preparation. Modern XAS and XES studies are typically performed using synchrotron radiation, which provides an intense, monochromatic X-ray source and allows advanced in situ and operando experiments. Sub-techniques such as XANES (X-ray absorption near-edge structure), EXAFS (Extended X-ray Absorption Fine Structure), and RIXS (resonant inelastic X-ray scattering) offer enhanced insights into oxidation states, local structure, and electronic excitations. Despite their broad scientific use, applications in pharmaceutical research remain limited. Nevertheless, recent studies highlight their potential in analyzing crystalline active pharmaceutical ingredients (APIs), drug–biomolecule interactions, and differences in drug activity. This review introduces the fundamental aspects of XAS and XES, with an emphasis on practical considerations for pharmaceutical applications, including experimental design and basic spectral interpretation.

1. Introduction

The pharmaceutical industry relies on a diverse arsenal of analytical methods to ensure drug quality, safety, and efficacy [1,2]. Methods such as liquid chromatography–mass spectrometry (LC-MS/MS) and nuclear magnetic resonance (NMR) offer high sensitivity and structural elucidation capabilities [3], while Raman and near-infrared spectroscopy (NIR) enable non-destructive, real-time analysis [4]. Electrochemical techniques, valued for their portability and sensitivity, further complement these tools, especially in field applications. Despite these advantages, each method has inherent limitations. LC-MS/MS, for example, is prone to ion suppression in biological matrices such as plasma. Techniques like X-ray diffraction (XRD) or gas chromatography (GC) often require destructive sample preparation, including crystallization or derivatization [5]. Moreover, methods like NIR lack the elemental specificity needed to detect trace metal impurities in complex pharmaceutical formulations. The development and implementation of novel analytical methods enable not only more efficient drug development, but also more effective quality control and the personalization of therapy, which translates into greater safety and efficacy of pharmacotherapy [5]. X-ray absorption and emission spectroscopy methods—thanks to the use of synchrotron sources and modern detectors—allow, among other things, real-time monitoring of structural changes in drugs, the study of drug–DNA interactions, and coordination of metals in proteins. These techniques also offer very high sensitivity, which enables the analysis of even trace amounts of elements [6,7]. Moreover, due to the high penetration depth of X-ray radiation, this technique can be applied to the study of samples in solid, liquid, or gaseous states. One of the undoubted advantages of the XAS method is its independence from long-range order—the technique is suitable for the analysis of both crystalline and amorphous materials. The use of synchrotron radiation—characterized by high intensity and broad energy range—allows rapid measurements (from milliseconds to several minutes), which is particularly advantageous in studies of dynamic physicochemical processes [8].
The present review is organized in two complementary parts. The first part provides a tutorial-style overview of X-ray absorption and emission spectroscopies, explaining their principles, measurement strategies, and interpretation of spectra. The second part focuses on selected pharmaceutical applications, where these methods are used to characterize crystalline drug forms, investigate differences in drug activity and explore drug–biomolecule interactions. This structure is intended to guide readers from the basic methodology towards practical case studies relevant to pharmaceutical sciences.

2. X-Ray Spectroscopy Techniques

2.1. X-Ray Absorption Spectroscopy

2.1.1. Fundamental Principles of XAS

X-ray absorption spectroscopy (XAS) is an analytical technique based on the absorption of X-ray photons by matter. It involves measuring changes in the absorption coefficient (μ) of a material as a function of the incident photon energy. The analysis of the resulting absorption spectrum provides information about the density of unoccupied electronic states and the local atomic structure around the absorbing atom [9,10]. Each element has a characteristic absorption edge, representing a sharp increase in absorption when the photon energy reaches the binding energy of a core-level electron. This element-specific edge makes XAS highly selective, allowing targeted study of a chosen element through appropriate tuning of the excitation energy.

2.1.2. X-Ray Absorption Edges and Interaction Mechanisms

The ability of X-ray radiation to penetrate matter depends strictly on its energy; therefore, it is divided into three regimes: soft X-rays (<2 keV), tender X-rays (2–6 keV), and hard X-rays (>6 keV) [11]. This phenomenon involves the ejection of a core-level electron (e.g., from the 1s, 2s, or 2p orbital) when the energy of the incident photon equals or exceeds its binding energy. As a result of the absorption of the entire photon energy, an electron from the core level is ejected to a higher, unoccupied state or into the continuum. Figure 1 presents a diagram of the photoelectric effect, illustrating the absorption of X-ray radiation and the excitation of an electron from the K-shell. This process is accompanied by the attenuation of the intensity of the radiation beam, which will vary depending on the energy of the incident radiation.
The absorption spectrum for a given element is defined as the dependence of the absorption coefficient on the energy of the incident radiation, μ(E). It is characterized by a sharp increase, known as the absorption edge, which corresponds to the K, L, M, etc. shells and results from a sudden increase in the probability of electron excitation from a given shell. The binding energies of electrons at particular energy levels are characteristic of each element. Therefore, XAS measurements involve determining the absorption coefficient near and above the absorption edge of a selected element, allowing for the determination of the chemical state and local environment of a selected element, based on its characteristic absorption edge [12].

2.1.3. Measurement Modes: Transmission, Fluorescence, and Electron Yield

In XAS measurements, the absorption coefficient is most commonly determined using one of three methods: transmission mode, fluorescence mode, or by measuring electrons emitted as a result of absorption, i.e., by measuring the sample current. Each measurement method has its advantages and disadvantages, and the primary factor determining the choice of a particular technique is the type of sample being analyzed.
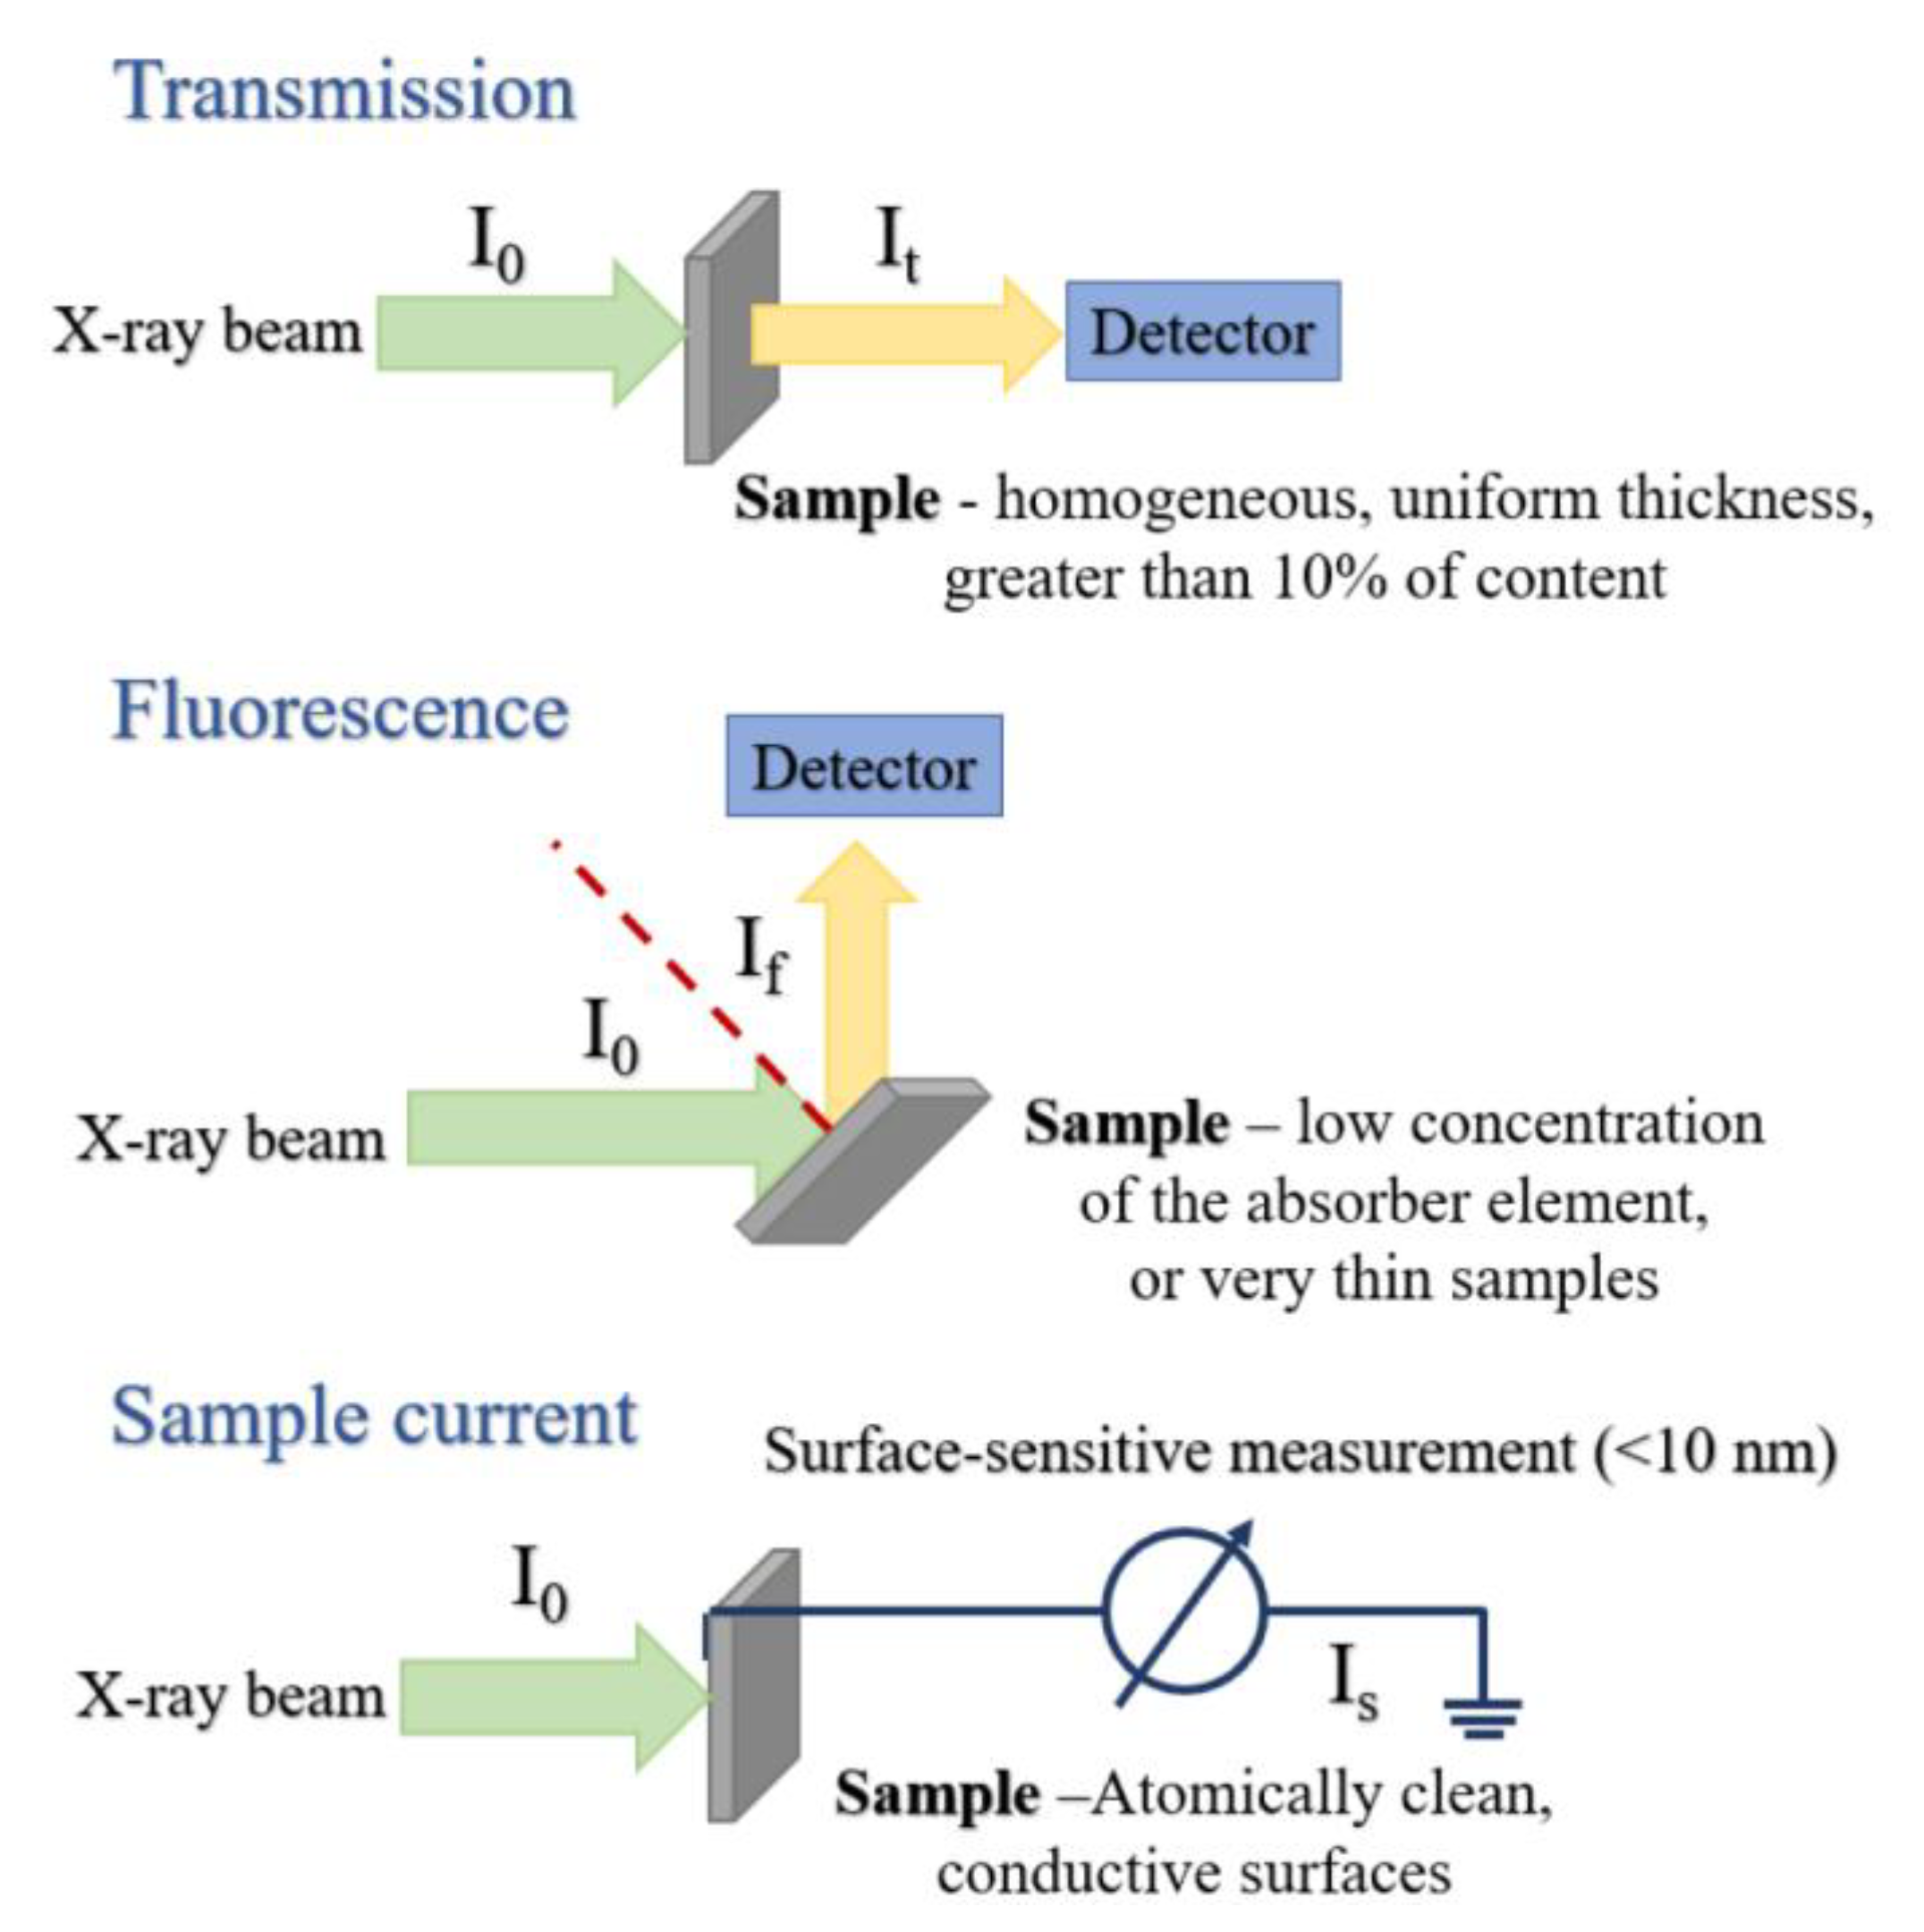
The most popular method for XAS measurements, which enables the acquisition of high-quality spectra with a short acquisition time, is the transmission method [13] determined by measuring the intensity of radiation incident on the sample (I0) and the intensity of radiation after it passes through the sample (It), using two ionization chambers placed before and after the sample, respectively (see Figure 2). Transmission geometry can be applied to homogeneous samples in which the content of the analyzed element exceeds 10% or the sample has a uniform thickness. Transmission is therefore a suitable method, for example, for the measurement of powder pellets, solutions of known concentration, or solid materials or solid materials with controlled thickness.
If the requirements for reliable transmission measurements are not met (for example, if the sample is inhomogeneous, contains a low concentration of the element of interest or is excessively thick), alternative acquisition modes such as fluorescence or electron yield measurements are employed.
Both the fluorescence mode and the measurement of secondary electrons utilize the phenomena of atomic relaxation processes, which are secondary effects resulting from the excitation of an electron from the inner (core) atomic levels during the absorption of X-ray radiation. As a result of the absorption process, a core hole created in the inner shell is filled by an electron from a higher shell. The recombination process is accompanied by the emission of a quantum of radiation with energy equal to the energy difference between the two levels and characteristic of a given element. The fluorescence photons generated in this way can be measured as total fluorescence yield (TFY) or partial fluorescence yield (PFY), which differ in the type of detection. In fluorescence geometry (see Figure 2), the intensity of the incident radiation on the sample (I0) is recorded using an ionization chamber, while the intensity of the characteristic X-ray radiation (fluorescence, If) generated by the interaction of X-rays with matter is measured using a dedicated detector. In fluorescence mode, the beam, sample, and detector are typically arranged in a 90° geometry, where both the incident X-ray beam and the detector are positioned at 45° with respect to the sample surface normal. This configuration minimizes background radiation and reduces elastic scattering (see Figure 2). Fluorescence mode is recommended for very thin samples or samples with a low concentration of the absorber element, such as highly diluted solutions or trace amounts of elements in various matrices.
The measurement of the absorption coefficient in fluorescence mode accurately reflects the actual state only for thin samples, as the probability of the self-absorption effect increases with the thickness and density of the sample [14]. This effect is a local distortion of absorption spectra caused by changes in the penetration depth of the incident radiation, depending on its energy value [15]. When the energy of the incident radiation is close to the absorption edge of the studied element, the radiation is more strongly absorbed. As a result, the penetration depth of the radiation is reduced, leading to the excitation of a smaller sample volume, which in turn decreases the intensity of the resulting signal [15]. Conversely, when the energy is above the edge, the radiation penetrates a larger sample volume due to reduced absorption, resulting in a stronger fluorescence signal. The effect on the spectral structure is therefore nonlinear. One method to minimize the significant impact of the self-absorption effect on measured spectra, especially when thin or less dense samples cannot be used, is to perform measurements at a small incident angle, which necessitates scanning the surface of the sample. In cases where the self-absorption effect is nonlinear, the solution involves data correction after measurement by applying post-processing corrections to the spectra using dedicated XAS analysis programs (e.g., the ATHENA program). Therefore, if the research system allows for measurements in transmission mode, in addition to fluorescence-mode measurements, an additional transmission-mode measurement should be performed to assess whether the spectra are affected by the self-absorption effect.
During the atomic relaxation process, electrons excited from the inner shells of the atom, as well as Auger electrons—analogous to fluorescent photons—are also released, creating a cascade of secondary electrons. This enables the measurement of the total electron yield (TEY), that is, the measurement of the sample current, or the partial electron yield (PEY) by introducing an analyzer and measuring characteristic Auger electrons [8]. The measurement of the sample current (TEY) is presented in Figure 2. The number of emitted electrons is proportional to the number of holes created in the sample and thus to the number of absorbed photons. Since the mean free path of electrons is very short, the TEY detection mode is a surface-sensitive measurement. Therefore, TEY measurements require atomically clean and conductive surfaces. This method is recommended for measuring thin layers located on a substrate or for observing changes that have occurred on the sample surface. The obtained signal results from measurement at a depth of only a few nanometers, which allows for the elimination of background signals from the substrate or, for example, the signal from unoxidized metal beneath its oxide layer.
It is essential, however, to carefully design experiments involving XAS techniques. Proper selection of the measurement mode (transmission, total fluorescence yield (TFY), or total electron yield (TEY)) requires detailed knowledge of the sample—particularly its thickness and elemental concentrations—as well as careful consideration of the potential for radiation-induced damage. It should also be taken into account that not all samples are suitable for analysis under ultra-high vacuum (UHV) conditions, and some may require specific temperature control during measurements.

2.1.4. XAFS: Spectral Features and Structural Interpretation

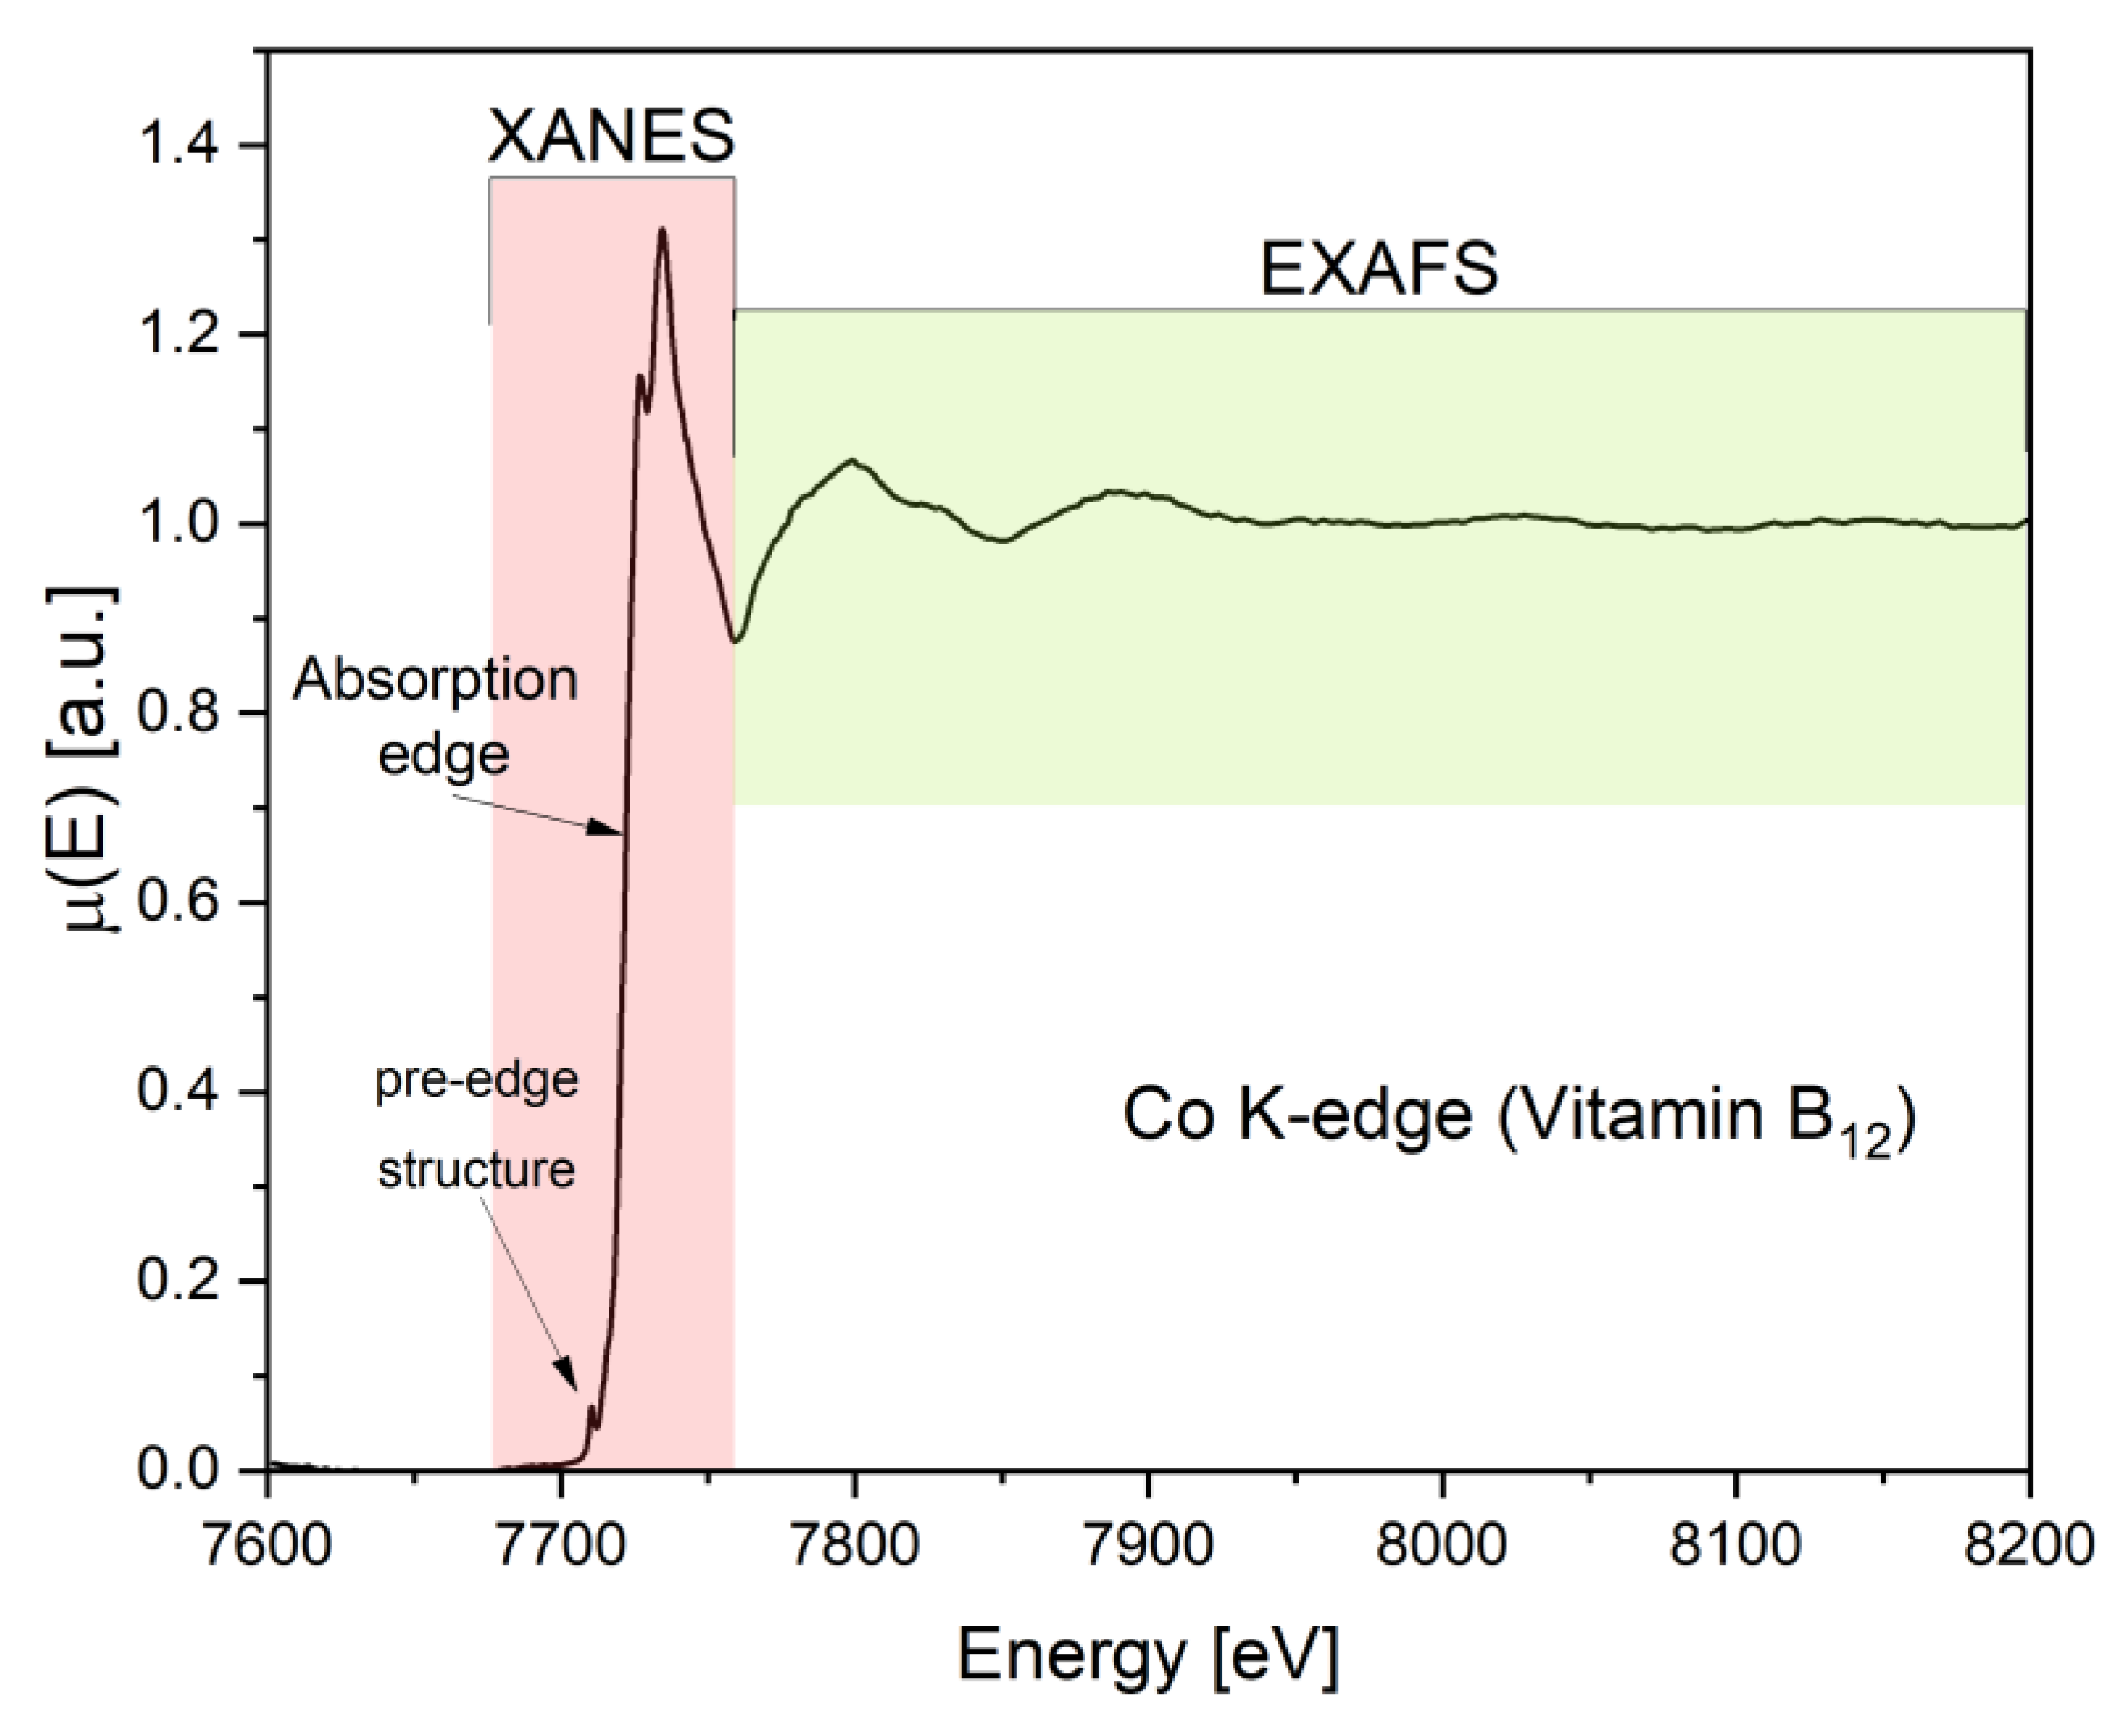
In the X-ray absorption spectrum, two main regions can be distinguished: X-ray absorption near-edge structure (XANES) and Extended X-ray Absorption Fine Structure (EXAFS) [16]. An exemplary XAS spectrum for the cobalt K-edge, measured for vitamin B12, is shown in Figure 3. The near-edge region (XANES) comprises pre-edge features, the white line corresponding to the 1s → p transition, and post-edge resonances that are highly sensitive to the oxidation state and local symmetry. At higher energies, the extended region (EXAFS) contains oscillations resulting from photoelectron scattering by neighboring atoms, which provide quantitative information on interatomic distances, coordination numbers, and structural disorder. Together, these two regions offer complementary insights: XANES reflects electronic structure, while EXAFS enables precise determination of local geometry. It is worth noting that the fine structure observed in XAS, comprising both the XANES and EXAFS regions, is commonly referred to in the literature as X-ray Absorption Fine Structure (XAFS). The term XAS refers to the method of obtaining these spectra.
XANES refers to the region of the XAS spectrum that encompasses the absorption edge, starting from the pre-edge features and including the so-called white line (the main absorption peak corresponding to the 1s → p electronic transition), as well as extending up to approximately 50 eV above the edge. This part of the XAS spectrum captures the absorption of X-ray radiation by an atom at energies close to the binding energy of its core electrons. XANES spectra are highly sensitive to both the oxidation state of the absorbing atom and its immediate chemical environment. In many cases, the spectral features are also influenced by multielectron effects associated with the excited state [18]. The XANES region reflects electronic transitions to higher unoccupied states and to the continuum, in accordance with the established selection rules for electric dipole transitions [19].
When recording spectra at the K-edge, transitions from the lowest 1s states to p-type states are observed. In contrast, absorption at the L-edge involves transitions from 2s states (the L1 edge) and from 2p states (the L2,3 edges) to p states and to s or d states, respectively [20,21,22]. In the XANES region, for the K-edge of 3d transition metals (elements from the fourth period of the periodic table), it is also possible to distinguish pre-edge features, known as pre-edge peaks [23]. These peaks arise due to quadrupole transitions from 1s to 3d states, which are dipole-forbidden according to selection rules [19].
XANES provides extensive information about the studied compound, including the number and type of atoms neighboring the absorber atom, their distances, and the angles between them. However, extracting this information is generally not straightforward. Based on experimental data, measurements can be performed for the absorption edge of a given element in various compounds (commonly referred to as reference compounds or standards). By comparing these results, conclusions regarding the structure and phase composition of the studied compound can be drawn. It is also possible to systematically vary the dopant concentration within the compound and observe how the spectrum evolves. Comparing spectra from different compounds offers insights into relative oxidation states or structural changes, although it does not provide precise details about the specific atomic environment. Another approach involves theoretical calculations: assuming a structure for the studied compound, calculating its absorption spectrum, and then comparing it with the experimental data. However, such calculations require prior knowledge—or at least reasonable assumptions—about the sample structure, including accurate atomic positions. Despite this limitation, theoretical calculations can yield detailed information about the local environment of the absorbing atom, bond hybridization, and electronic structure.
EXAFS is the region of the spectrum that extends more than 50 eV beyond the absorption edge. This spectral region arises from the scattering of photoelectrons emitted from the central atom by neighboring atoms and is characterized by oscillatory variations in the absorption coefficient (as a function of the incident radiation energy). The most significant and unique advantage of this technique lies in its elemental selectivity, which allows the local atomic environment around a specific element to be determined, even when its concentration is very low.
EXAFS provides insights into the short-range coordination environment of the atom under investigation, including parameters such as interatomic distances (R), coordination numbers (N) for nearest and next-nearest neighbors, and the associated mean square displacement (σ2). A detailed discussion of the quantum-mechanical origins of the EXAFS phenomenon—which arise from the interaction of X-rays with matter—is beyond the scope of this work and has been reviewed in detail in previous studies [24,25].
The analytical workflow comprises three fundamental stages: data processing, transformation interpretation, and quantitative modeling. Following absorption spectrum acquisition via synchrotron radiation (transmission or fluorescence mode), pre-edge background subtraction and edge-step normalization are essential. Subsequent energy-to-wavevector conversion yields the EXAFS oscillations, χ(k), representing post-edge absorption coefficient modulations [26]. The extracted χ(k) undergoes Fourier transformation, converting data from k-space to radial distance (R)-space. This generates a pseudoradial distribution function (RDF), where peak positions correspond to nearest-neighbor distances, amplitudes reflect coordination numbers, and peak broadening arises from structural disorder or thermal dynamics [26].
The analysis involves fitting structural parameters (coordination number N, bond distance R, and Debye−Waller factor σ2) using theoretical scattering paths. Software packages (e.g., Demeter: Athena/Artemis) enable comparison between experimental χ(k) and simulations derived from crystallographic models or hypothetical geometries [27].
Ab initio computational approaches, which derive properties directly from quantum mechanical principles, serve as indispensable tools for augmenting conventional EXAFS analysis. Their application becomes critical when empirical fitting fails to resolve structural ambiguities in dynamically disordered or low-symmetry systems. This proves essential for systems like solvated ions or surface-modified nanomaterials, where thermal fluctuations induce significant configurational disorder. Furthermore, ab initio calculations provide first-principles-derived Debye−Waller factors (σ2), which are paramount for accurate modeling of systems with strong vibrational anisotropy or static disorder [28].
The EXAFS analytical pathway—based on synchrotron radiation and encompassing spectrum normalization, Fourier transformation, and parametric fitting—enables the extraction of quantitative structural parameters with ~0.01 Å distance resolution and ~10% accuracy in coordination numbers [29,30]. Integration with ab initio simulations further extends its applicability to low-symmetry or dynamically disordered systems [26].

2.2. X-Ray Emission Spectroscopy

2.2.1. Fundamental Principles and Measurement Setup

X-ray emission spectroscopy (XES) is a method closely related to XAS, yet it provides different information about the system. The technique involves detecting X-ray photons emitted when an inner-shell (core) electron is ejected by the absorption of an incident high-energy photon, creating a core hole. This vacancy is subsequently filled—within femtoseconds (~10−15 s)—by an electron from a higher energy level. This transition results in the emission of a characteristic X-ray photon with energy determined by the difference between the initial and final state of the system. XES spectra provide information on electronic structure by measuring the density of occupied states.
A typical setup for XES measurements consists of a sample, a crystal analyzer, and a detector arranged to optimize the detection of characteristic fluorescence lines emitted following core-level excitation. Crystal analyzers use Bragg’s law of diffraction to selectively reflect X-ray photons of specific energies, enabling high-resolution energy dispersion of the emitted fluorescence [31]. Figure 4 presents a schematic diagram of the operation of a flat single-crystal spectrometer.
The geometry of a setup is optimized for detection of characteristic fluorescence lines. Among the most common geometries used are the von Hamos and the Johann or Johansson arrangements. In the von Hamos geometry, a cylindrically bent crystal disperses X-rays along one axis and focuses them orthogonally onto a 2D detector, enabling simultaneous collection of multiple emission lines with sub-eV energy resolution [32,33,34]. By contrast, Johann and Johansson spectrometers position the sample, curved analyzer, and detector along a Rowland circle, using spherically bent or grooved–spherical crystal analyzers to achieve high-resolution (<1 eV) emission spectra, particularly when operating near backscattering (around 80°) [32,35]. These geometries offer excellent energy selectivity and are well suited for analyzing subtle variations in oxidation states, spin states, and ligand environments, even in complex or dilute biological samples [31,33,36,37].

2.2.2. Emission Lines and Spectral Interpretation
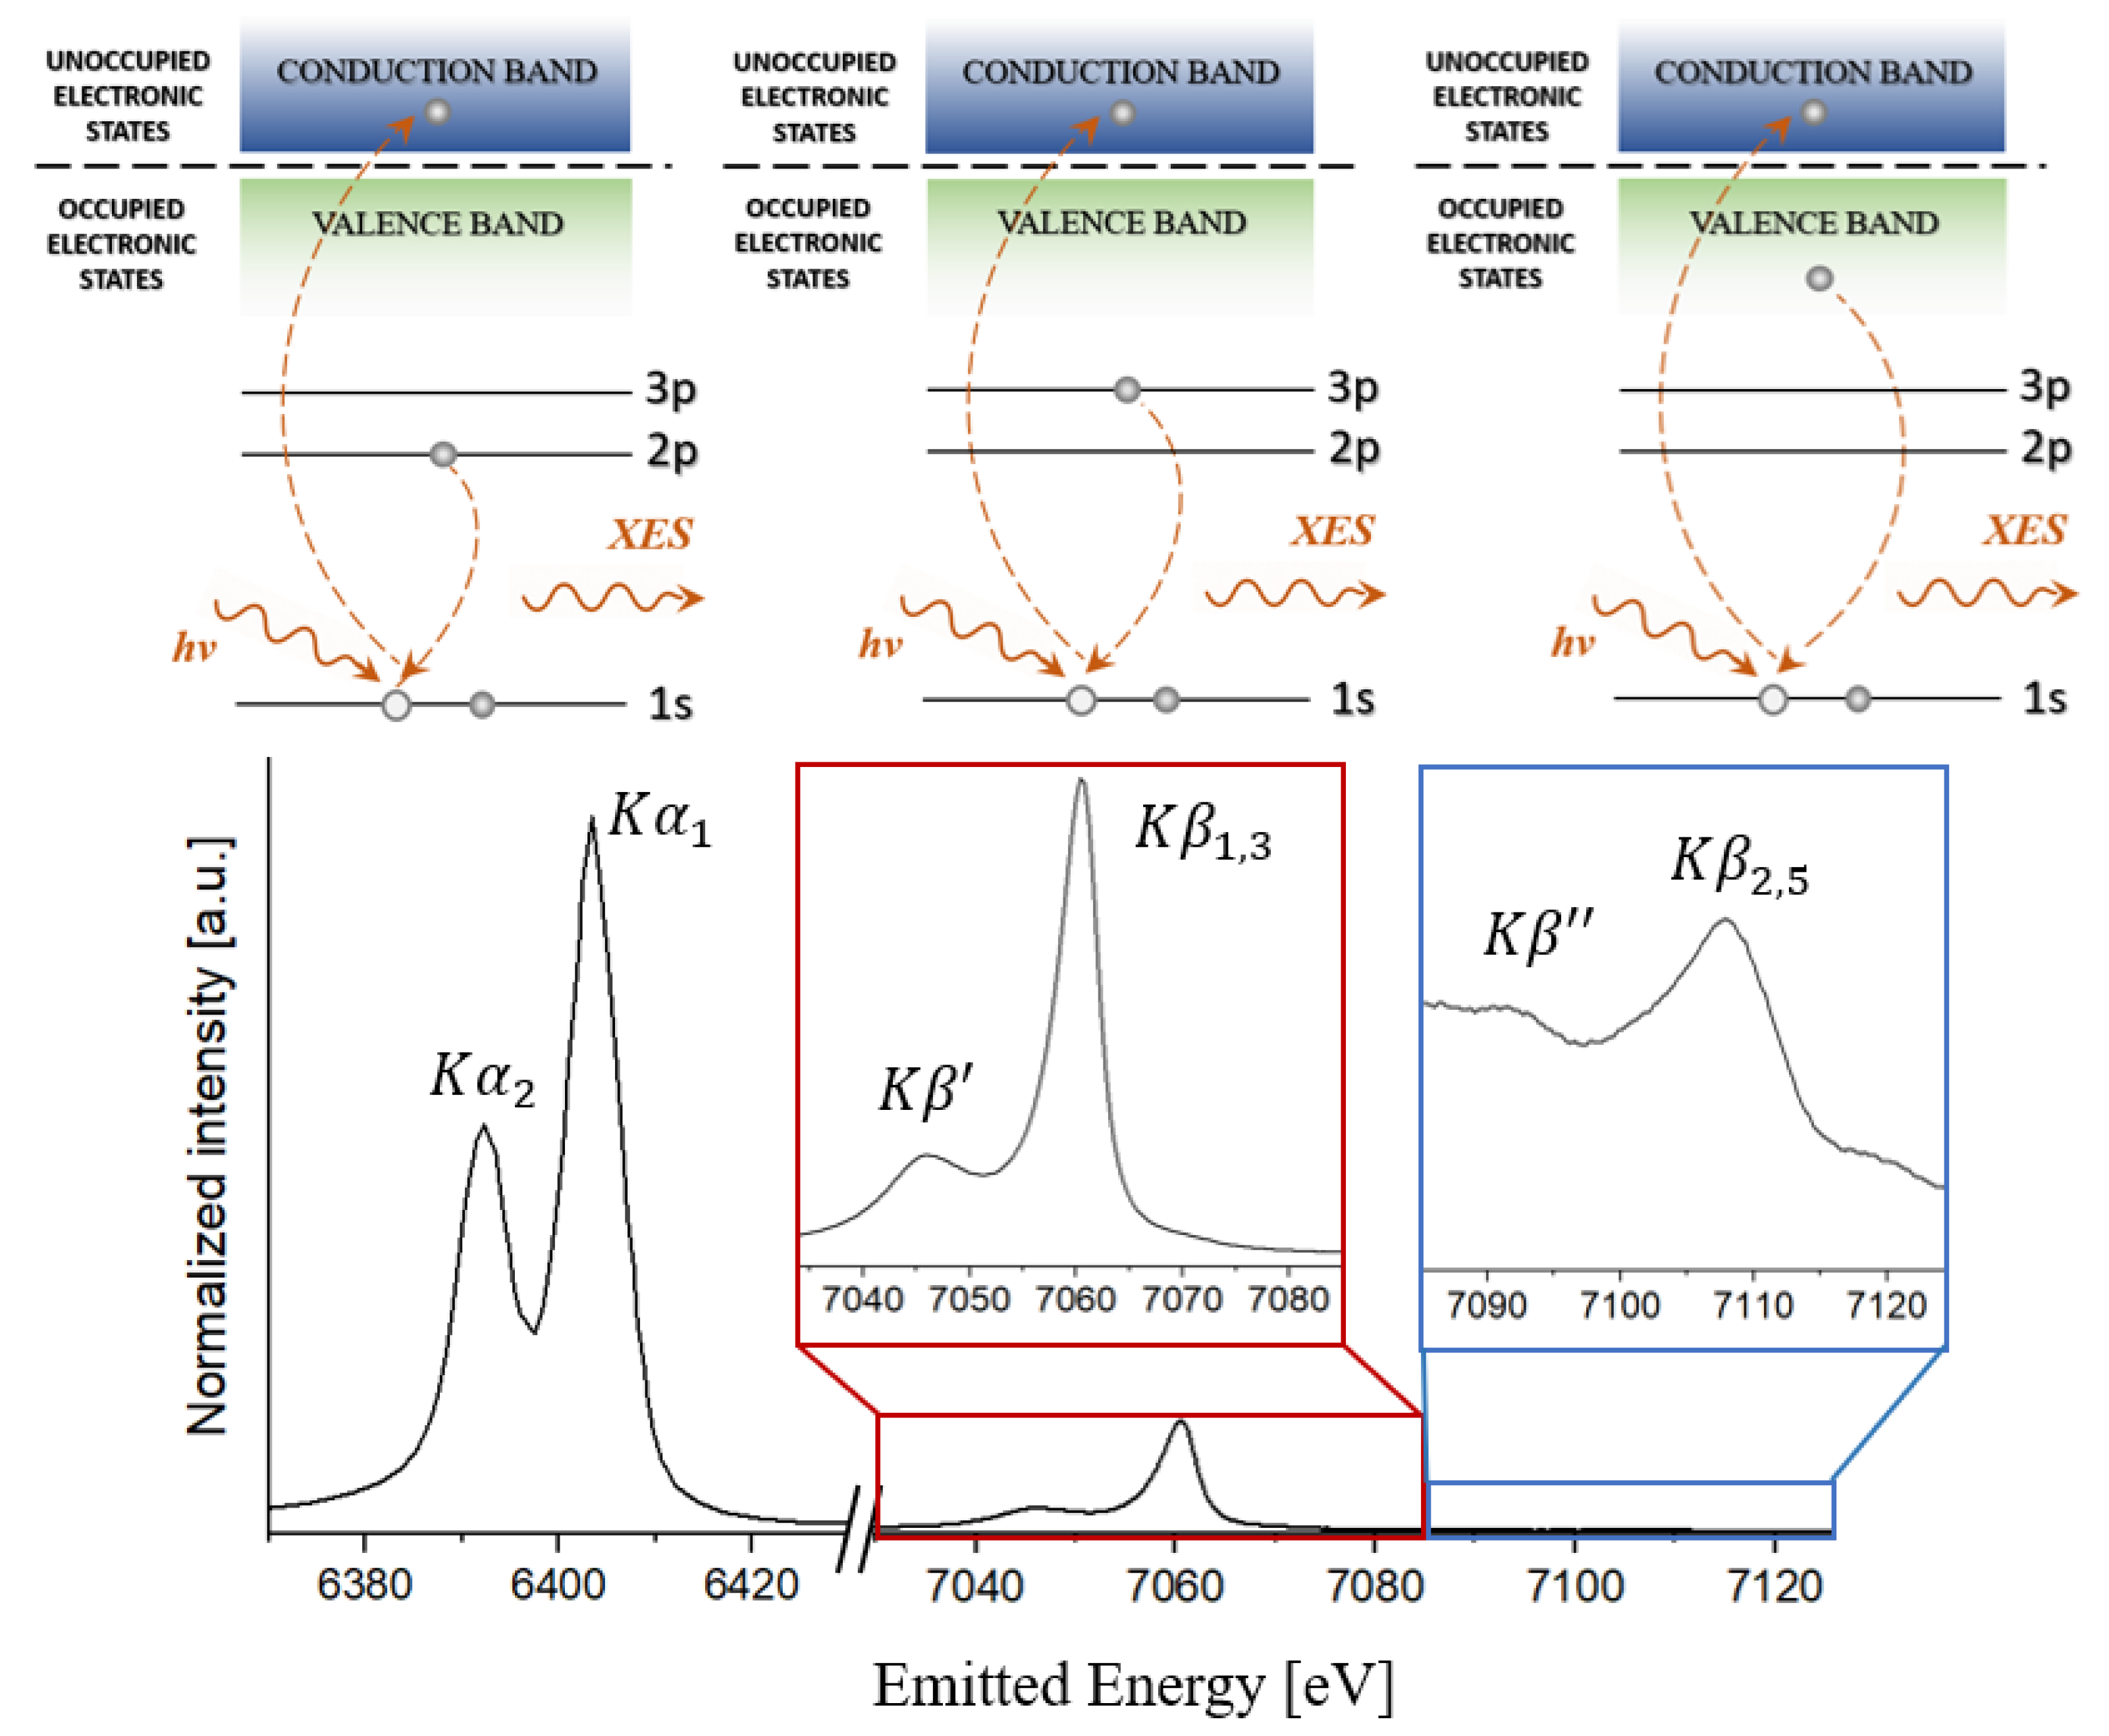
The most commonly studied transitions in XES are the K lines, especially the Kα and Kβ regions [31,36]. Kα lines result from 2p → 1s electronic transitions. Due to spin–orbit coupling, they split into two components: Kα1 and Kα2 (see Figure 5). Although they provide limited chemical information, Kα lines can be used to record XAS spectra when Bragg optics are employed. This approach, known as High-Energy Resolution Fluorescence Detection (HERFD), offers improved energy resolution, as it is dominated by the 2p core-hole lifetime rather than the broader 1s core-hole lifetime [31,36].
The Kβ region arises when the 1s core hole is filled with 3p (or higher) electrons. Kβ spectra are weaker due to their approximately 1000-fold lower probability of occurrence compared to Kα. The main Kβ line can split into Kβ1,3 and Kβ′ (resulting from 3p3/2 → 1s and 3p1/2 → 1s transitions). The Kβ′ line arises as a result of differences in exchange coupling between the open valence shell and the core hole. This splitting of the Kβ1,3 and Kβ′ lines can be an indicator of the number of unpaired electrons and therefore serves as a marker for the spin state of the measured system [36,38]. These types of measurements can provide insights into metal–ligand covalency [31]. Additionally, the valence-to-core (VtC) XES region can be defined. It consists of much less probable transitions from valence or ligand orbitals to core-hole shells such as Kβ2,5 and Kβ″. This region can provide detailed information about ligand identity, ionization potential, and protonation states due to the high sensitivity to the chemical environment surrounding the metal center [31,36]. A notable example of valence-to-core XES is its use in identifying the central atom within the FeMo cofactor of nitrogenase. By means of the XES, it was determined that the central atom was carbon due to the 2p → 1s carbon−iron transition [39].
Figure 5. Representative X-ray emission spectrum of Fe2O3, showing the main Kα and Kβ fluorescence lines normalized to the Kα1 peak, along with schematic diagrams indicating the electronic transitions responsible for each emission. The complete emission profile reflects contributions from various final states, allowing for detailed analysis of the electronic structure and local chemical environment of iron. Scheme redrawn from [40] reproduced from the SSHADE/FAME open database [41,42].
Applsci 15 10784 g005
An interesting type of emission spectroscopy is resonant inelastic X-ray scattering (RIXS), a technique closely related to resonant X-ray emission spectroscopy (RXES). While these terms are often used interchangeably, RXES generally refers to the measurement of emitted X-rays following resonant excitation, whereas RIXS emphasizes the inelastic scattering process that reveals how emitted photon energies depend on the excitation energy. Unlike standard XES, where the incident energy is fixed well above the absorption edge, RIXS scans the excitation energy across the absorption edge, enhancing sensitivity to specific electronic states and allowing energy-selective probing of distinct chemical environments. The resulting RIXS 2D maps plot emission energy versus excitation energy, enabling detection of subtle differences in chemical bonding, oxidation state, and coordination environment [31,33,37,43].
RIXS can be applied to characterize the electronic properties of transition metal complexes used in pharmacological research. An example of this type of research was identification of interactions between the metal center and various biomolecular ligands in platinum-based anticancer drugs. By tuning the incident X-ray energy around the metal absorption edge and recording the corresponding emission spectra, researchers can resolve fine details in the valence electronic structure. This approach enables the differentiation between complexes of varying oxidation states and coordination geometries, contributing to a deeper understanding of metal–biomolecule interactions [33].
Another example is the investigation of the physical oxidation state of iron in both synthetic model complexes and the complex metalloenzyme nitrogenase. The study demonstrates that traditional indicators of oxidation state—such as integer oxidation numbers—often fall short of capturing the real, physical electronic configuration of metal centers in complex systems. Instead, RXES reveals nuanced shifts in the Kβ1,3 mainline and VtC spectral features that correlate with changes in metal–ligand covalency and electron delocalization, which together contribute to the physical oxidation state [37].

2.2.3. Applications XES in Pharmaceutical and Bioinorganic Systems

For pharmaceutical and bioinorganic systems, samples typically contain metal centers in sufficient concentration to generate detectable emission signals, often in the millimolar range. However, the concentration of the target element can be a limiting factor in biological systems where metals often occur in trace amounts. Since XES is an element-specific technique, it tolerates chemically complex environments; however, the overlapping fluorescence and scattering signals should be taken into consideration [36]. In the context of sensitive pharmaceutical materials, maintaining the native oxidation state and coordination environment is crucial, which may require cryogenic temperatures to prevent radiation damage and preserve the functional state of metallodrugs or biomolecules [44]. Solid samples, freeze-dried powders, thin films, or frozen solutions are commonly used forms, prepared to ensure homogeneity and minimize self-absorption effects [33,37].
Beyond these experimental considerations, X-ray emission spectroscopy (XES) provides element-specific information about the electronic structure of metal centers in pharmaceutical compounds, including oxidation state, spin state, ligand environment, and covalency. This makes XES particularly useful for studying metalloenzymes, metal-based drugs, and complexes where subtle electronic differences affect activity or stability [36,45].
Experimentally, XES requires a high-brilliance X-ray source, a crystal analyzer spectrometer to detect characteristic emitted photons, and careful sample handling to minimize radiation damage. Samples can be solids, powders, or frozen solutions, often mounted in liquid jets or cryogenic holders to allow in situ measurements under near-physiological conditions [36,46].
Practically, XES allows researchers to monitor redox changes, ligand exchange, or metal coordination changes in real time, informing mechanistic hypotheses and guiding experimental design for beamtime proposals. While XES beamlines are less common than standard XAS facilities, these capabilities make XES a powerful tool for designing targeted studies and obtaining data that cannot be easily accessed by other techniques [36,45,47].

2.3. X-Ray Sources

The principal source of radiation for XAS and XES methodologies is particle accelerators known as synchrotrons. Charged particles, possessing an electric charge and moving at relativistic velocities within a magnetic field, are compelled by the field to bend their trajectory perpendicularly to the vector of magnetic induction B [48]. The change in the particle’s direction causes emission of electromagnetic radiation tangential to the particle’s path, which is referred to as synchrotron radiation. This radiation is characterized by exceptional intensity, high collimation, and a broad, continuous spectral range—from infrared, through visible and ultraviolet light, to soft and hard X-ray regions.
Synchrotron radiation enables investigations aimed at the determination of matter structure and the understanding of processes occurring within materials. It serves as a universal research tool not only in fundamental physics, but also exerts a significant influence on the advancement of fields such as chemistry, materials engineering, biology, medicine, and many others [49]. Synchrotrons of the first and second generations utilized bending magnets to change the direction of motion for accelerated electrons, directing and accelerating them along a circular track under conditions of ultra-high vacuum. In the design of third-generation storage rings, which began developing in the 1990s, additional devices were introduced that allowed the generation of synchrotron radiation not only within curved sections, but also in straight sections of the storage ring, known as wigglers and undulators [50,51,52]. Fourth-generation sources, called X-ray Free Electron Lasers (XFELs), are developed using long, straight undulator sections stretching over several hundred meters. These are capable of producing very short, highly coherent X-ray pulses with extremely high intensity and brightness [53].
Research on pharmaceutical applications is conducted primarily using third-generation synchrotrons, which are characterized by high stability and the ability to perform experiments with high temporal resolution in the microsecond and nanosecond range [54]. These synchrotrons are preferred for high-resolution studies, extensive series of measurements, and difference analyses, where measurement repeatability is essential. They constitute a versatile tool in pharmaceutical research, making it possible, among other things, to analyze drug structure and their interactions with other molecules under conditions closely resembling the natural environment [55].
In contrast, XFEL sources generate ultrashort, femtosecond X-ray pulses with extremely high intensity and coherence. One of the major advantages of XFELs is the ability to record data before the onset of radiation-induced sample damage, which is especially important when studying radiation-sensitive structures. These ultrashort pulses enable tracking of rapid changes occurring in samples, for example, during molecular and enzymatic processes in real time on a femtosecond timescale [51], which corresponds to the typical time window for key reactions in chemistry, biology, and medicine. The primary techniques for studying the dynamics of processes at XFEL sources are pump-probe methods [56]. This method utilizes two precisely synchronized pulses. The first pulse initiates the phenomenon under investigation in the sample (e.g., a phase transition)—it can be an optical pulse or another type, such as an electrical pulse. The second pulse is used to record the transient state of the system after a certain delay following excitation. The use of a strong, monochromatic, and stable XFEL source enables precise studies of the dynamics of structural changes or chemical reactions with high spatial and temporal resolution. XFELs thus allow for dynamic analyses of ultrafast processes and structures undergoing rapid transformations and are highly sensitive to radiation, facilitating the observation of transient states in chemical reactions involving drugs and proteins, as well as mechanisms of action at the subatomic scale.
It should be emphasized that, in recent years, there has been a noticeable increase in interest in conducting X-ray experiments, including those utilizing laboratory sources of radiation, in order to facilitate access to XAS and XES spectroscopy, particularly for routine measurements in the fields of chemistry and catalysis [32].

2.4. How to Choose the Appropriate X-Ray Energy Regime

As previously mentioned, X-ray radiation employed in spectroscopic techniques is characterized by a broad energy range. The energy of the X-rays determines their penetration depth into the examined material, thus defining the detection method as well as the potential applications in pharmaceutical sciences.
Soft X-ray radiation, with relatively low energy in the range up to 2 keV, is characterized by a penetration depth from nanometers to several micrometers. In this radiation range, the most commonly studied edges are the K-edge of light elements, such as carbon, nitrogen, or oxygen, and the L-edges of transition metals. Due to high absorption by air and moisture, experiments require conditions of ultra-high vacuum—the samples must be compatible with such an environment, must not release gases and must be free of surface contaminants. The best approach is to prepare samples in the form of thin layers, films, proteins deposited on matrices, pellets, or tablets. For biological substances and polymers, it is essential to ensure that the sample does not change its phase under vacuum and does not sublime [57,58] and whether the sample should be cooled to maintain its structure. The possibility of radiation-induced damage should also be considered. If the TEY mode is used, the sample must also be conductive.
Tender X-ray radiation (energy range: 2–6 keV) represents a compromise between the surface sensitivity of soft X-rays and the bulk penetration capability characteristic of hard X-rays. The interaction depth is on the order of several to several tens of micrometers, which enables the analysis of nanostructures, interfacial layers, specific phases, as well as the investigation of subtle ligand and electronic effects. It allows for the measurement of the K-edge of light and transition elements (Z from 16 to 30) and L-edge for heavier elements. For lower energies, a helium atmosphere or partial vacuum may be required. This approach allows the acquisition of unique information on the distribution and chemical state of elements at interfaces, the study of nanostructures, ligand identification, and reaction dynamics [59,60].
Hard X-ray radiation is characterized by high photon energy, above 6 keV, and a penetration depth ranging from hundreds of micrometers to several centimeters, which enables the analysis of relatively thick samples as well as materials in real-world conditions. It permits bulk analysis of materials such as drugs, pharmaceutical preparations, and biological tissues, including under in situ or operando conditions, without the need for specialized vacuum requirements. Energetically, hard X-rays allow access to the absorption edges of heavier elements, which is crucial for the diagnostics and design of new drugs containing metal complexes or for studies of biomacromolecular structures. By measuring occupied states (XES), information about valence transitions, oxidation states, and the dynamics of redox processes—essential in enzyme and catalyst studies—can be obtained [61]. Hard X-ray radiation, combined with RIXS/RXES techniques, enables detailed analysis of excited, relaxation, and electronic states, and also allows mapping of electron dynamics and spin transitions in metal complexes.

2.5. Research Objectives

In recent years, several comprehensive reviews have been published on the application of XAS in pharmaceutical sciences. Among them is a 2013 review, which discusses both the theoretical foundations and practical applications of XAS in research on the structural characterization of metal-based anticancer compounds in vivo [62]. This work provides a thorough analysis of both XANES and EXAFS, illustrating their use in drug characterization and in different tissue forms. The review also discusses the advantages and limitations of XAS methods in pharmaceutical studies. Another noteworthy example is a review from 2010 to 2015, presenting studies that employ XAS to investigate homogeneous catalytic reactions in fine chemical and pharmaceutical contexts [63]. This publication is distinguished by its comparison of XAS with other techniques, notably NMR spectroscopy, highlighting that, unlike XAS, such methods do not provide insights into the reaction mechanism. A 2001 review covers three specific applications of XANES and EXAFS in practical hospital questions concerning drug administration and bioavailability [64]. It discusses studies on zinc complexes in parenteral nutrition, copper−histidine complexes in the treatment of Menkes disease, and arsenic-containing antileukaemic drugs.
The aim of this review is to explore the potential of synchrotron-based spectroscopic techniques—XAS, XES, and RXES—for advancing pharmaceutical research. The novelty of this review lies in the compilation and systematization of current scientific reports from the past decade (2014–2024), with a special focus on the potential of X-ray spectroscopic techniques in pharmaceutical research, from both analytical and cognitive perspectives. This work serves as a concise guide to the theoretical foundations and experimental methods of XAS and XES, intended for non-specialists. Its goal is to assist in preparing initial synchrotron measurements and analyzing the resulting data. The paper presents an overview of the latest advances in the application of these methods in pharmaceutical sciences, with particular emphasis on studies of drug mechanisms of action and their interactions with biomolecules. This work highlights the advantages of these techniques over classical spectroscopic methods, emphasizing their elemental selectivity, the ability to analyze samples under biologically relevant conditions, and the possibility of monitor dynamic processes at the atomic level.

3. Applications of X-Ray Spectroscopy in Pharmaceutical Sciences

3.1. Structural and Physicochemical Characterization of Drug

The most common application of X-ray spectroscopy in pharmaceutical research involves structural studies and physicochemical characterization of drugs [65,66]. Due to its high sensitivity to the local chemical environment, XAS has become a powerful tool for distinguishing between different structural forms of active pharmaceutical ingredients (APIs) [67,68,69,70]. Such studies are particularly important because solid-state properties, including crystallinity, hydration state, and coordination environment, strongly influence drug solubility, stability, and ultimately therapeutic efficacy [71,72,73]. Both XANES and EXAFS are well suited to probe these features, as they provide element-specific insights into the electronic state and local geometry. In the following subsections, representative case studies are presented to illustrate how X-ray spectroscopies have been applied to API polymorphism and to metal-containing pharmaceutical compounds.

3.1.1. Crystalline Polymorphism and Solid-State Forms

XANES and EXAFS measurements have been successfully applied to detect and quantify both polymorphic and amorphous forms, even in the presence of excipients [66,70,74]. Representative case studies demonstrate that XANES can effectively distinguish between different crystalline forms of APIs, highlighting its potential in solid-state pharmaceutical analysis. Structural differences between polymorphs can markedly affect solubility, thermal stability, and bioavailability, making their reliable identification a critical step in drug development [71,72,73]. A crystal polymorph is a crystal composed of molecules of the same chemical composition, but with a different crystal structure [71]. These structural variations are of great importance in pharmaceutical sciences, as they directly affect solubility, thermal stability, dissolution rate, and thus bioavailability [72,73].
For example, metastable crystals have a higher solubility than stable crystals, and this is sometimes used to improve the solubility of poorly soluble drugs. Controlling the crystalline form of APIs is essential during drug development to prevent undesirable polymorphic transformations during manufacturing or storage, which could result in loss of biological activity or regulatory compliance issues [75].
In studies employing XAS to investigate APIs, the analysis of absorption spectra profiles has facilitated the identification of individual crystalline forms of APIs [74] and their differentiation from amorphous counterparts [66]. Notably, investigations of the bromine K-edge in compounds such as eletriptan hydrobromide, dextromethorphan hydrobromide, and scopolamine hydrobromide salts have demonstrated that excipients composed of light elements (C, H, O, N) do not interfere with the XANES spectra of the target element [68]. Moreover, it has been shown that the XANES spectral features are influenced by weak intermolecular interactions present in API crystals, including hydrogen and halogen bonding [70].
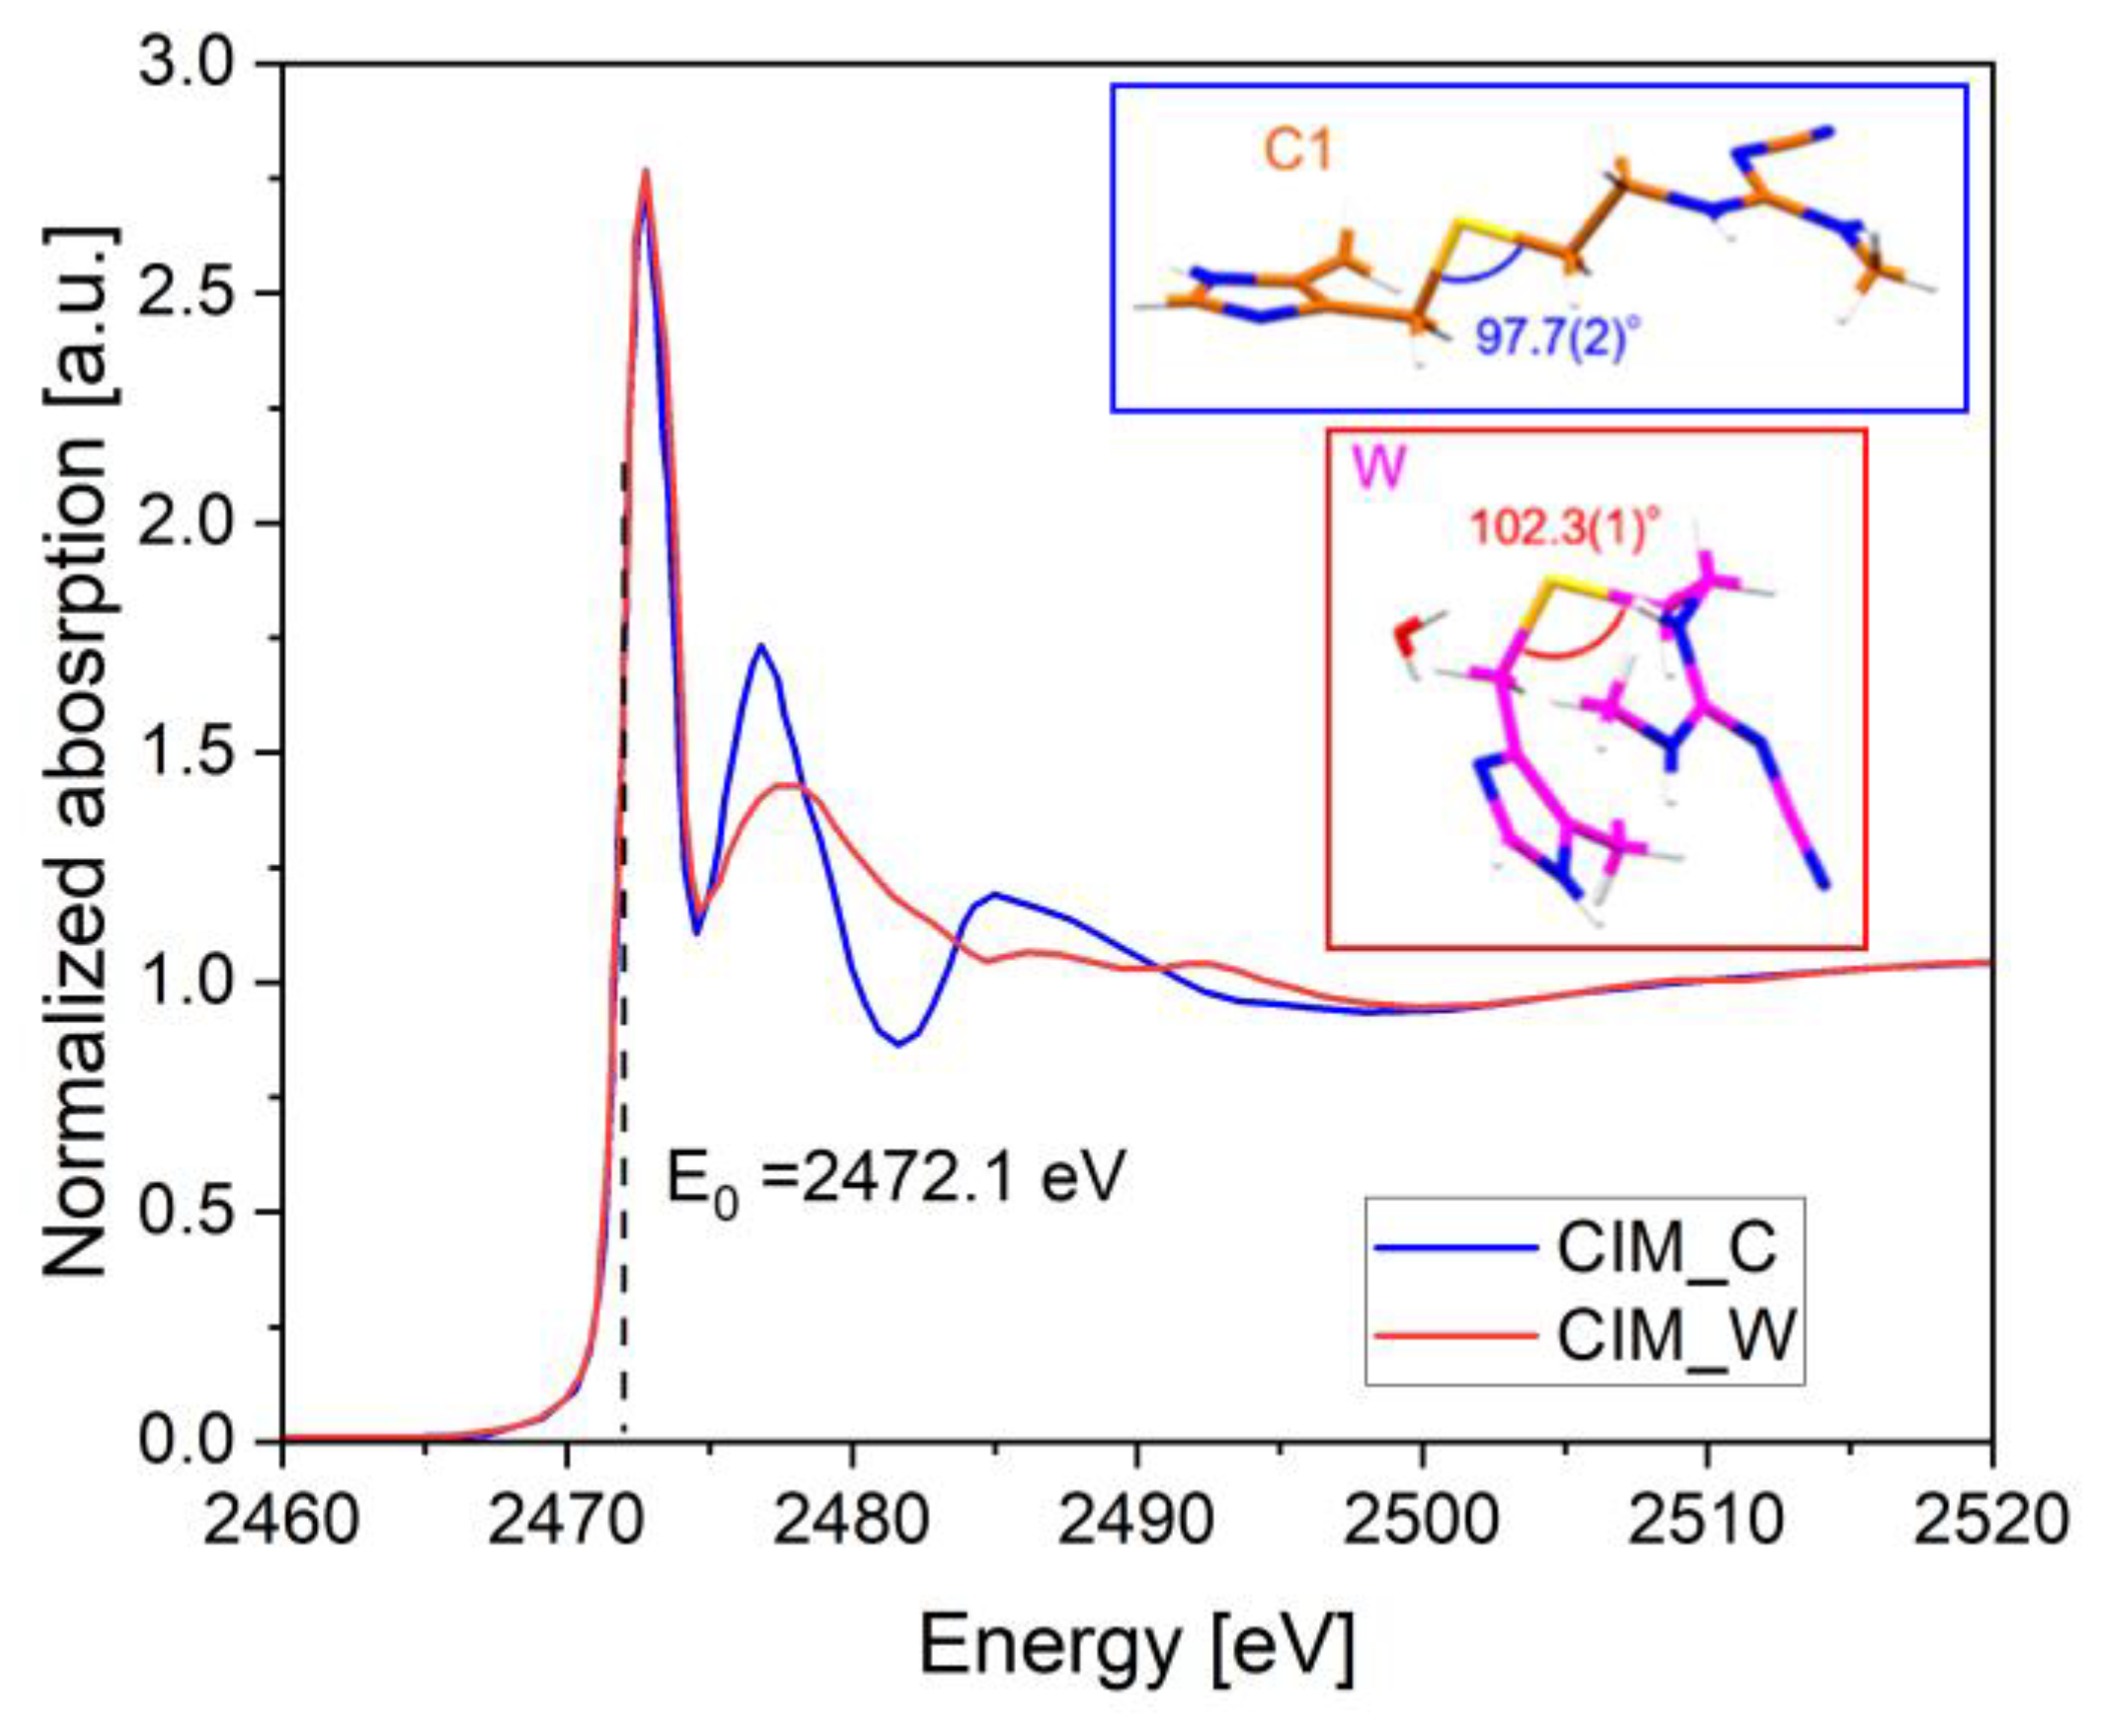
An exemplary study illustrating this phenomenon was conducted by Suzuki et al. [76]. The authors employed X-ray absorption fine structure to differentiate between crystal polymorphs of cimetidine (CIM), a histamine H2 receptor antagonist used in the treatment of gastric inflammation and peptic ulcer disease. Three anhydrous crystalline forms of CIM (CIM_A, CIM_B, CIM_C), one monohydrate crystal (CIM_W), and a mixture of two crystalline forms were prepared to enable quantitative assessment of one of the forms. XANES measurements of the S K-edge (E0 = 2472.0 eV) were performed at the BL6N1 beamline of the Aichi Synchrotron Radiation Center (AichiSR, Seto, Japan), using the total electron yield method under atmospheric helium at 25 °C. Samples were mounted on an electrically conductive double-sided carbon tape. The XANES spectra were processed using ATHENA software. The S K-edge XANES spectra for two example CIM crystals obtained in the study [76] are shown in Figure 6. In all samples, the absorption K-edge energy (E0) of sulfur was 2472.1 eV—this indicates that sulfur was present in the same oxidation state in each sample. The spectra revealed differences in the absorption intensities of the first peaks (commonly referred to as the white line) (CIM C < CIM W < CIM B < CIM A). In the case of the S K-edge, the most pronounced changes in the absorption spectrum were observed in the energy range of 2474.0–2484.0 eV. Based on the spectral shape within this range, three groups were identified: I (CIM_B and CIM_C), II (CIM_A), and III (CIM_W). Subsequently, the crystal structures were analyzed to investigate the origins of the differences observed in the XANES spectra. It was noted that the classification of structures according to the C–S–C bond angle corresponded to the grouping based on the XANES spectral features. Crystal forms composed of molecules with larger C–S–C bond angles tend to exhibit a gently sloping XANES peak, whereas those with smaller bond angles may produce a sharper peak. Therefore, it was suggested that differences in the C–S–C bond angle may be one of the factors responsible for variations in the XANES spectra. However, it was also considered that other factors may be involved in the changes observed in the spectra.
In addition, the study examined intermolecular interactions involving the sulfur atom in each crystal form of CIM, as this factor was suspected to contribute to spectral variations. It was suggested that C–H···S hydrogen bonds can also alter the shape of the XANES spectra. When such hydrogen bonds are formed, two electron pairs from the sulfur atom are partially transferred to the electron orbital of the hydrogen atom. This leads to a change in the energy or shape of the sulfur atom’s electron orbital, which could, in turn, affect the energy value of the XANES peak. Furthermore, it was concluded that interactions between neighboring sulfur atoms (S–S) may also influence the XANES spectra.
When analyzing samples containing more than one type of compound or, as in this case, different polymorphic forms, a crucial aspect of XAFS analysis is fitting the obtained spectra using the linear combination fitting (LCF) method. The fundamental assumption of this method is that the XANES spectrum of a multiphase material is a weighted sum of spectra originating from the individual phases. The weights correspond to the percentage content of the phases comprising the material [28]. This approach involves reconstructing the spectrum measured during the experiment by using reference spectra of compounds that may be components of the analyzed sample. The application of the LCF method requires that the reference spectra are measured under the same conditions as the analyzed sample and that the reference materials are homogeneous. Linear combination fitting of spectra can be performed using several programs, including Athena, which is part of the Demeter package [77].
It should be noted that the use of the LCF method is also associated with several limitations, concerning both the fitting statistics and the nature of the sample under study. Fitting by LCF is particularly inefficient for multicomponent materials and those with a high degree of disorder, where spectra of different components can be very similar to each other [78]. The method is also insensitive to minor differences in the local structure, which makes discrimination of similar phases difficult. Moreover, with regard to the studied sample, the results of LCF strongly depend on the availability and quality of the reference spectra, as well as their representativeness for the actual conditions of the sample. The absence of standards covering all possible phases or an overly limited range results in the misestimation of the contributions of specific phases and undermines the reliability of quantitative interpretation. In addition, instrumental noise, background disturbances, and self-absorption effects result in the LCF outcomes being burdened with considerable error [79]. LCF for EXAFS-range spectra does not allow the determination of structural parameters such as distances or coordination numbers, but only the relative proportions of the components. Accurate analysis requires that the sum of the component contributions to the fit equals (or is close to) 1 and that the contribution of each component be statistically significant. Therefore, these fits should be treated with caution, as certain estimates that are best confirmed by another analytical technique.
Suzuki et al. [76] also demonstrated the applicability of LCF to quantify mixtures of cimetidine crystal forms. CIM_W readily converts into CIM_A during manufacturing and storage, which poses a challenge for quality control. To address this, binary mixtures of CIM_A and CIM_W were prepared at defined proportions (5, 10, 20, 50, and 90% CIM_A) and measured under identical conditions. The LCF method applied to the sulfur K-edge XANES spectra enabled precise reconstruction of the experimental spectra and accurate quantification of the components. The calculated content of CIM_A showed excellent correlation with the actual composition (R2 = 0.9967), confirming that XANES spectroscopy is suitable for quantitative assessment of API crystalline forms.
In a related publication, Huang et al. [68] investigated crystalline forms of bromhexine hydrochloride (BRH-HCl) using both conventional techniques (X-ray powder diffraction, thermogravimetry) and XAFS at the Cl and Br K-edges in TEY mode. Four crystalline forms (0, I, II, S) were analyzed, along with commercial tablets measured in two conditions: with and without PTP packaging. The Cl K-edge spectra indicated significant variations in the local environment of chloride ions, reflecting differences in hydrogen-bond interactions with the protonated amino group. Br K-edge XANES spectra, although showing identical edge energies (E0) across all samples, revealed characteristic differences in the spectral shape between polymorphs. These variations were attributed to interatomic interactions such as hydrogen bonds, halogen–π interactions (Br···benzene) and halogen–halogen contacts (Br···Br). Importantly, the study demonstrated that XAFS enables direct and non-destructive identification of crystalline forms not only in bulk powders but also in finished pharmaceutical tablets, even when still sealed in PTP sheets, underlining its unique potential as a complementary tool for solid-state analysis.
Collectively, these studies highlight the value of XAS in the characterization of API polymorphs, offering complementary information to classical techniques such as X-ray diffraction. Unlike diffraction methods, which fail to detect amorphous content, XANES and EXAFS provide element-specific information that enables reliable identification and quantification of crystalline and amorphous forms, supporting the development of stable and bioavailable drug formulations.

3.1.2. Metal-Containing Pharmaceutical Compounds

In addition to the analysis of organic polymorphs, EXAFS is particularly valuable for studying metal-containing pharmaceutical compounds, as it provides detailed information about the oxidation state and coordination environment of the metal center.
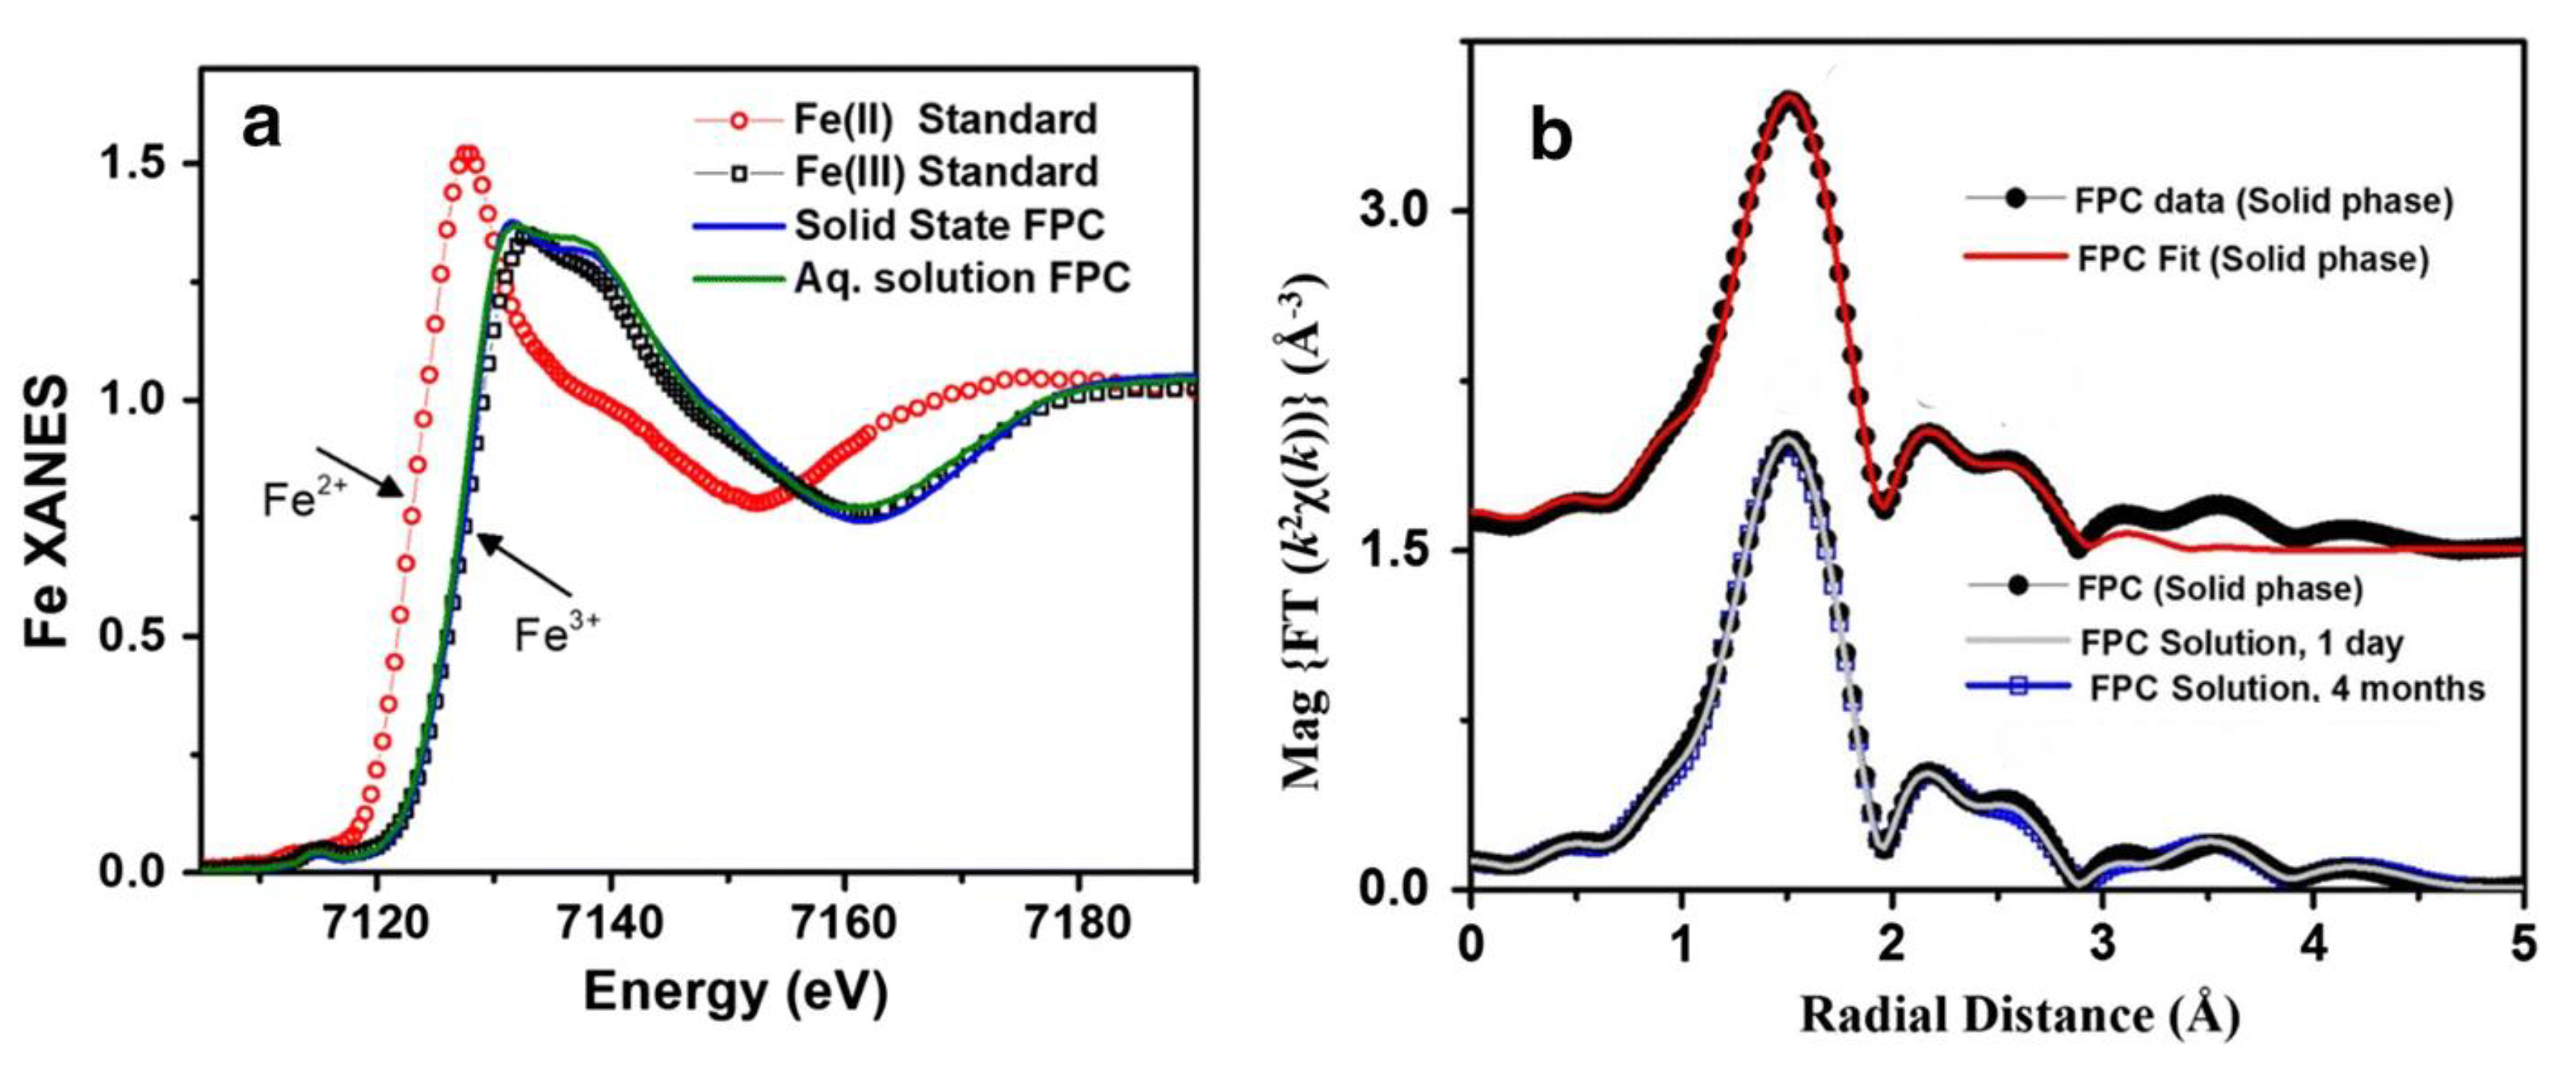
An example of such research is the physicochemical characterization of ferric pyrophosphate citrate (FPC), which was approved for parenteral administration by the U.S. Food and Drug Administration in 2015 [80]. This compound is used among patients dependent on hemodialysis due to chronic kidney disease, in whom iron deficiency accompanied by anemia has been observed. Patients affected by this condition cannot take oral iron supplementation due to possible complications [81]. FPC is the first carbohydrate-free, non-colloidal, water-soluble iron salt suitable for parenteral administration. In the study by Gupta, Pratt, and Mishra (2018) [80], the characteristics of the solid phase and solution of FPC were determined, including the coordination environment of iron and its neighboring atoms, as well as the stability of FPC in solution. It should be noted that soluble complexes of iron pyrophosphate and citrate are generally referred to as soluble ferric pyrophosphate (SFP). In addition to infrared spectroscopy measurements (used to identify the main functional groups present in FPC) and chromatography (FPC stoichiometry), XAS spectra were recorded in transmission mode at the iron K-edge, in both the XANES and EXAFS regions. Measurements were performed for powdered and aqueous FPC solutions (10 mM) and food-grade SFP, as well as for reference samples (standards) of iron—Fe2+ and Fe3+. IR and HPLC analyses of FPC confirm the presence of the expected anions, citrate and pyrophosphate, as well as phosphate and sulfate. XANES data of FPC, compared to Fe2+ and Fe3+ standards, revealed that all the iron in FPC is present as Fe3+ (Figure 7a). Moreover, the solid-phase structure is maintained in solution. In order to determine the oscillation originating from a specific coordination shell, a Fourier transform of the EXAFS signal is performed from k-space (wave number space) to R-space (distance space) (see Figure 7b). In Fourier-transformed EXAFS spectra, the first peak corresponds to atoms located in the first coordination sphere of the iron atom—that is, atoms directly bonded to iron (its nearest neighbors). The second peak corresponds to atoms in the second coordination sphere (the next-nearest neighbors), and so on. The intensity (height) of a peak reflects the number of atoms, while the position of the peak corresponds to the bond distance. Meanwhile, the peak width and shape are indicative of structural disorder, thermal vibrations, or possible contributions from multiple scattering events within the local environment. Qualitative analysis of the EXAFS structure carried out in study [58] showed that the FPC compound has both Fe–O–P and Fe–O–C signals, which means that the nearest neighbor of Fe3+ is oxygen, with a bond length of 2.00 ± 0.01 Å. The next nearest neighbors to iron are phosphorus and carbon, with bond lengths of 3.24 ± 0.01 Å and 2.90 ± 0.01 Å, respectively. On the other hand, the EXAFS structure for food-grade SFP suggests the presence of only a Fe–O–P signal.
Extended EXAFS analysis demonstrated that, within this system, only pyrophosphate and citrate anions are coordinated to the iron atom. FPC is composed exclusively of Fe3+ ions, wherein each iron center is coordinated by one pyrophosphate and two citrate molecules—the latter increase both the solubility and thermodynamic stability of the resulting complex.
This study illustrates how EXAFS can provide quantitative structural information on the coordination of metal centers in pharmaceutical formulations. In the case of FPC, the technique confirmed the exclusive presence of Fe3+ and identified pyrophosphate and citrate ligands as stabilizing groups, highlighting the potential of X-ray spectroscopy in the characterization of metal-based drugs.

3.2. Investigation of Differences in Drug Activity

Differences in drug activity often arise from subtle changes in metal coordination or ligand environment. X-ray absorption spectroscopy can capture these variations directly at the therapeutic metal center. In this section, representative case studies are grouped according to therapeutic categories.

3.2.1. Neurological Drugs (Cu-Targeting Chelators for Alzheimer’s Disease)

Metal chelators targeting Cu(II)–Aβ complexes are a promising therapeutic strategy for Alzheimer’s disease, where subtle differences in binding mode affect biological activity. A notable application of XAS in biomedical research involves the investigation of potential therapeutic agents for Alzheimer’s disease [82]. Guided by the widely accepted amyloid cascade hypothesis [83], which postulates that aberrant metabolism of amyloid precursor protein (APP) results in the overproduction of neurotoxic β-amyloid (Aβ) peptides—particularly Aβ(1–42) [84]—the study explored mechanisms underlying Aβ aggregation and associated neurodegeneration [85]. Amyloid plaques are composed mainly of Aβ peptides and are known to contain trace metals such as Zn2+, Cu2+, and Fe2+ [86]. Disruption of metal homeostasis, especially involving copper ions, has been strongly linked to Aβ aggregation and plaque formation.
In this context [82], the researchers evaluated the activity of three 8-hydroxyquinoline-based metal chelators—clioquinol (CQ), PBT2, and B2Q—by comparing their interactions with Cu(II)-bound Aβ (1–42). To probe changes in the local electronic and geometric environment of copper, the study employed both conventional X-ray absorption spectroscopy (XAS) and high-energy resolution fluorescence-detected XAS (HERFD-XAS).
Unlike standard XAS, HERFD-XAS selectively detects a high-resolution fluorescence emission line (e.g., Kα) from the sample after synchrotron excitation, rather than integrating the full emitted spectrum [87]. A crystal analyzer is used to isolate a narrow bandwidth within the emission profile, effectively reducing the intrinsic spectral broadening caused by the short lifetime of the electronic hole. This refinement enables significantly enhanced spectral resolution, allowing for more precise analysis of subtle changes in the oxidation state and coordination geometry of metal centers upon drug interaction.
The experiments were conducted at the Stanford Synchrotron Radiation Lightsource (SSRL) at the SLAC National Laboratory in Menlo Park, California, on two beamlines: XAS measurements were performed on the biological XAS beamline (BL) 7-3, while HERFD-XAS was carried out on BL 6-2. The samples were measured at an angle of 45° in total fluorescence yield (TFY) mode, at a temperature of approximately 10 K, using a liquid helium flow cryostat. In the present study [54], XANES spectra were measured for the following samples: Cu(II)Aβ(1–42), Cu(II)Aβ(1–42) + CQ, Cu(II)Aβ(1–42) + B2Q, Cu(II)Aβ(1–42) + PBT2, Cu(II)-bis-CQ, Cu(II)-bis-B2Q, and Cu(II)-bis-PBT2.
The analysis of the obtained XANES spectra showed that the addition of 2 molar equivalents of either CQ or B2Q to a solution of Cu(II)Aβ(1–42) produces spectra that more closely resemble those of Cu(II)-bis-CQ or Cu(II)-bis-B2Q [60]. The resulting near-edge spectral features indicate that CQ and B2Q effectively sequester Cu(II) ions from Aβ(1–42), leading to spectra nearly identical to those observed for the corresponding Cu(II)-bis-ligand complexes in solution. This suggests that, under these conditions, CQ and B2Q are capable of almost quantitatively extracting Cu(II) from the Aβ(1–42). In contrast, when 2 molar equivalents of PBT2 are introduced to a solution of Cu(II)-Aβ(1–42), the resulting XANES spectra exhibit features characteristic to both Cu(II)-Aβ(1–42) and Cu(II)-bis-PBT2. This observation implies incomplete sequestration of Cu(II) ions by PBT2.
Additionally, the researchers employed LCF of Cu(II)Aβ(1–42) and Cu(II)-bis complexes (with either CQ or B2Q) to analyze the XAS edge spectra. Their results suggest that approximately 83% of the Cu(II) is bound as a bis complex, with 83 ± 2% complexed with CQ and 83 ± 1% with B2Q. On the other hand, the LCF analysis for PBT2 performed in the same way suggests that PBT2 removes only part of the Cu(II) from Aβ(1–42) (59 ± 2%). Collectively, these results demonstrate that while CQ and B2Q are highly effective at extracting almost all Cu(II) from Aβ(1–42), PBT2 is only partially effective in this regard. LCF was also performed for EXAFS spectra in this study, confirming the results previously obtained via XANES analysis.

3.2.2. Anticancer Drugs (Rh and Ru Complexes)

Rhodium and ruthenium complexes exemplify how X-ray spectroscopy can reveal correlations between coordination environment and anticancer activity. XAS research methods and LCF analysis also allowed a deeper understanding of structure–reactivity–activity relationships for octahedral Rh(III) anticancer complexes [88], mer,cis-RhCl3(S-dmso)2(O-dmso) (A1), and mer,cis-RhCl3(S-dmso)2(2N-indazole) (A2), with a range of antimetastatic and cytotoxic activities comparable to those observed for rhodium-based drugs that have entered phase II clinical trials [89]. In this study, Rh K-edge XAS spectra were collected at the wiggler XAS Beamline ID-12 of the Australian Synchrotron, ANSTO, in TFY mode. Samples were positioned at a 45° angle to the incident X-ray in a He-filled closed cycle cryostat, maintained at 5 K. Both XANES and EXAFS data were obtained for compounds A1 and A2, as well as for rhodium foil, and the interactions of Rh(III) complexes with saline buffer, cell culture media, serum proteins (albumin and apo-transferrin), native and chemically degraded collagen gels, and A549 lung cancer cells were examined [88]. Since LCF methods were applied in this study, model Rh(III) compounds were also prepared and categorized into three groups according to donor type and composition. Model compounds containing exclusively or predominantly S and/or Cl donors were classified as soft donor models (S1–S6), those with only O donors as oxygen donor models (O1–O3), and the remaining model compounds as mixed donor models (M1–M9).
The study distinguished three key spectral parameters, presented as 3D plots: the edge energy (E0, eV—determined from the first derivative), the normalized white line height (HWL, dimensionless), and the energy of the second oscillation maximum (ESOM, eV). The main spectral features of A1 and A2 resembled those of the soft donor model complexes, which were characterized by strong EXAFS oscillations beyond 23.3 keV, and their HWL values were comparable to those of the μE of the SOM. For the reaction products of compounds A1 and A2, white line features were similar to those of the mixed donor and oxygen donor model complexes, yet their low-energy EXAFS showed characters that were similar to those of the soft donor model complexes. Depending on the interaction and the time/duration of the reaction, the parameters E0, HWL, and ESOM for the Rh K-edge spectra changed compared to A1 and A2 before reaction, often involving only one or two parameters. In general, such changes may indicate either a change in the oxidation state (E0) or a change in the immediate coordination environment of the investigated element. In the case of Rh discussed here, the observed effect is due to a change in the coordination environment (as indicated by changes in the donor model, e.g., from a soft donor model to a mixed donor model).
Subsequently, in the study [88], three different LCF analyses were performed on reaction products: in aqueous buffers and serum protein adducts, in serum-free and serum-supplemented cell culture media, and in collagen gels and rh-treated bulk cells. The conclusions drawn from the LCF analysis and from the 3D scatter analysis allowed for the formulation of many findings regarding the speciation of rhodium in extracellular fluids, in the extracellular matrix, in the cytoplasm, and in the cell nucleus, for which a detailed description is provided in source [88].
After initial aquation and hydrolysis, during which Cl– and S-/O-dmso ligands are gradually displaced, the Rh(III) complexes undergo additional ligand substitution reactions with biological nucleophiles, such as amino acid residues found in serum proteins. The interaction of A1 with chemically degraded collagen gel is considered a key factor underlying its antimetastatic properties. XAS analyses performed on bulk cells treated with Rh complexes support a structure–reactivity relationship: the more reactive A1 primarily exhibits antimetastatic activity, while A2, which is less reactive, is mainly cytotoxic. This pattern mirrors the relationships seen with typical Ru(III)-based anticancer agents.
A complementary investigative case involves the Ru(III) anticancer complexes NAMI-A and KP1019. Using Ru K-edge X-ray absorption spectroscopy under biologically relevant conditions (aqueous buffers, protein solutions/gels, undiluted serum, cell-culture media, and HepG2 cells), Levina et al. [90] demonstrated profound transformations of the Ru coordination environment. Linear-combination fitting showed the absence of parent-drug signatures and indicated the formation of Ru(IV/III) clusters together with coordination to S-donor, amine/imine, and carboxylate groups of proteins. Notably, KP1019 exhibited ~20-fold higher cellular uptake than NAMI-A under identical conditions; however, this uptake diminished markedly after KP1019 decomposed in culture media, suggesting that passive diffusion of the intact complex drives initial cellular entry [89].
Together with the Rh(III) examples above, these Ru(III) data underscore how XANES/EXAFS track ligand substitution, speciation changes, and uptake behavior that underpin divergent anticancer activity profiles. This element-specific perspective complements conventional assays and informs rational metallodrug design.

3.3. Metal-Based Drug Interactions with Biomolecules

The use of X-ray spectroscopic techniques for investigating drug–biomolecule interactions enables high-resolution analysis of structural and electronic transformations within biological systems. These methods offer atom-specific insights into the local coordination environment of metal centers in protein active sites, the nature of coordination bonds, and the spatial distribution of electronic charge. Due to its element specificity, XAS is particularly well suited for monitoring changes in oxidation state and coordination geometry, while XES provides detailed information on the electronic configuration of the metal site. Furthermore, RXES facilitates energy-resolved mapping of electronic and spin-state excitations, which is essential for elucidating the molecular mechanisms underlying drug interactions with biological targets such as enzymes and nucleic acids. When applied under physiologically relevant conditions, in situ X-ray spectroscopies enable real-time observation of these interactions, providing critical insights that support the rational design of pharmaceuticals with improved pharmacokinetic profiles and reduced adverse effects.
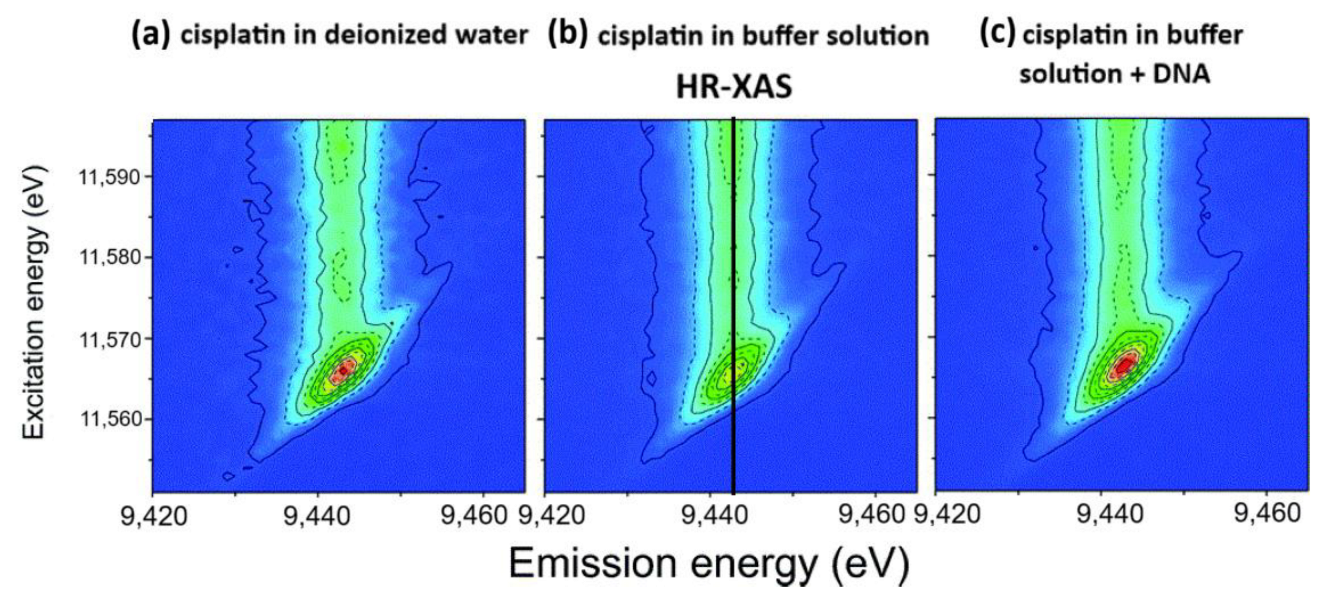
A particularly noteworthy case study in this context was presented by Lipiec et al. [91], who developed an in situ RIXS-based methodology for investigating the interaction between platinum-based chemotherapeutics and DNA under near-physiological conditions. In this work, the binding of cisplatin, a widely used anticancer drug, to calf thymus DNA was characterized using resonant inelastic X-ray scattering (RIXS) at the Pt L3-edge. The experiments were performed at the SuperXAS beamline of the Swiss Light Source using a von Hamos-type high-resolution crystal spectrometer. RIXS spectra were obtained by scanning the incident X-ray energy across the absorption edge while simultaneously recording emitted photons, which enabled the construction of two-dimensional RIXS maps (Figure 8). In addition, high-resolution X-ray absorption spectra (HR-XAS) can be extracted from RIXS maps by slicing across the most intense emission energy (~9443 eV). To support interpretation of experimental data and to assess changes in the electronic structure and coordination of platinum upon DNA binding, theoretical simulations were performed using the FEFF9.0 code [91].
The RIXS results demonstrated that, under physiological conditions, water molecules replace chloride ligands as a result of drug hydration. The subsequent interaction with DNA led to the incorporation of aqua complexes into the DNA structure, accompanied by the simultaneous loss of water and chloride ligands. Data analysis indicated that Pt is coordinated by two adjacent guanines, forming cis-Pt(NH3)2{d(GpG)-N7(1),-N7(2)} after ligand substitution [91].
This is not the only study investigating platinum anticancer compounds in which RXES methods were used. Sá et al. (2016) examined chemical speciation of chiral platinum complexes [92]. In their work, diastereomers were distinguished on the basis of their metal electronic configuration. RXES measurements were carried out at the Pt L3-edge using a wavelength-dispersive spectrometer in von Hamos geometry at the SuperXAS beamline. RXES maps for cis- and trans-platinum compounds were analyzed using HR-XAS slicing and valence-to-core (VtC) emission features. The spectral differences between cis and trans isomers were correlated with their strikingly different biological activities (cisplatin being ~50 times more active than the trans isomer, as reflected by IC50). HR-XAS simulations with FEFF9.0 further revealed that in cisplatin the white-line inflection point is shifted to higher energy and its intensity slightly increased, reflecting more unoccupied electronic states and thus greater ability to form bonds. In the VtC region, cis- and trans-complexes displayed distinct spectral features: the trans isomer exhibited two clear peaks originating from overlap of Pt–5d and Cl–2p states, whereas cisplatin showed loss of this overlap and broadening of the second peak. In addition, the influence of different substituents was investigated, and substitution at the R1 position with fluorine was shown to increase drug effectiveness.
These examples demonstrate that RXES and RIXS can provide atom-specific mechanistic insights into hydration, ligand exchange, and DNA binding of platinum drugs. They explain the markedly higher biological activity of cisplatin compared with its trans isomer and illustrate the broader utility of synchrotron-based spectroscopies for understanding drug–biomolecule interactions.

4. Discussion and Conclusions

This review has presented recent advances in the application of synchrotron-based X-ray spectroscopic techniques to pharmaceutical sciences. By compiling representative examples, we have shown that X-ray absorption spectroscopy (XAS), X-ray emission spectroscopy (XES), and related methods such as resonant inelastic X-ray scattering (RIXS) and resonant X-ray emission spectroscopy (RXES) provide atom-specific information on oxidation states, coordination geometries, and electronic structures of active pharmaceutical ingredients and metallodrugs. Importantly, these methods can be applied under near-physiological conditions, which enables in situ monitoring of structural transformations and drug–target interactions that are not accessible with conventional spectroscopic or diffraction techniques [80,82,91,92]. To provide an overview of the diverse applications presented in Section 3.1, Section 3.2 and Section 3.3, the representative case studies are summarized in Table 1.
One of the most significant contributions of XAS is in the study of crystalline polymorphism and solid-state forms of active pharmaceutical ingredients (APIs). Small structural differences between polymorphs can dramatically influence solubility, stability, and bioavailability. Studies of cimetidine, bromhexine hydrochloride, and other pharmaceuticals have shown that sulfur, chlorine, and phosphorus K-edge XANES and EXAFS are sensitive to polymorphic variations, enabling not only qualitative differentiation but also quantitative analysis of mixtures through LCF [68,76]. Such applications highlight the potential of XAS as a complementary technique to powder diffraction for solid-state characterization and pharmaceutical quality control.
Another important area is the investigation of metal-containing drugs. For example, ferric pyrophosphate citrate (FPC) was characterized by Fe K-edge XANES and EXAFS, which confirmed the presence of Fe3+ and identified citrate and pyrophosphate ligands as stabilizing groups [80]. This study demonstrated that EXAFS can provide quantitative structural information on the coordination environment of therapeutic metal centers in both solid and solution states. Related work on ruthenium and rhodium complexes revealed how XAS tracks aquation, ligand exchange, and protein binding in biological fluids, which directly correlates with pharmacological activity profiles [88,90]. These findings underscore the unique value of synchrotron methods for elucidating the structure and reactivity of metallodrugs under biologically relevant conditions.
Differences in drug activity can also be rationalized by X-ray spectroscopies. HERFD-XAS studies of Cu(II)-chelating agents demonstrated how small variations in coordination mode translate into significant differences in therapeutic efficacy against Alzheimer’s disease [82]. Rhodium(III) complexes investigated by EXAFS and XANES showed that donor atom preferences are directly correlated with cytotoxic versus antimetastatic properties [88]. Similarly, Ru(III) drug candidates such as NAMI-A and KP1019 exhibited distinct aquation and protein-binding behaviors revealed by Ru K-edge XAS, which explain their divergent anticancer profiles [90]. Collectively, these examples demonstrate how XAS contributes to establishing structure–activity relationships, an essential component of rational drug design.
Direct drug–biomolecule interactions represent another field where synchrotron-based spectroscopies have provided unique insights. In situ RIXS of cisplatin binding to DNA showed that the drug undergoes hydration and subsequent coordination to adjacent guanines, yielding the canonical cis-Pt(NH3)2{d(GpG)-N7(1),-N7(2)} adduct [91]. RXES further enabled the discrimination of cis and trans stereoisomers of platinum complexes and correlated subtle electronic differences with large variations in biological activity [68]. These studies highlight how high-resolution synchrotron spectroscopies can capture mechanistic details of drug–target interactions at the atomic level.
Despite these strengths, several limitations remain. Access to high-brilliance synchrotron sources and specialized beamlines is still limited, which restricts the routine use of these methods in pharmaceutical laboratories. The complexity of data analysis, particularly for EXAFS fitting and theoretical simulations using programs such as FEFF, requires expertise not commonly available outside specialized groups. Sample preparation also presents challenges, especially when working with biological materials under physiological conditions, as radiation damage and sample heterogeneity can complicate interpretation. Furthermore, while XES and RIXS provide unique information on electronic structure, the number of dedicated beamlines worldwide remains small, and long measurement times can limit throughput.
Looking ahead, continued developments in synchrotron and XFEL technologies are expected to expand the applicability of X-ray spectroscopies in pharmaceutical sciences. XFELs offer femtosecond time resolution and extremely high brightness, enabling studies of ultrafast processes such as ligand exchange dynamics and radiation-sensitive systems. Advances in soft and tender X-ray spectroscopies will also open opportunities for probing organic pharmaceuticals and drug interactions at light-atom edges (C, N, O, S). In parallel, improvements in detector technologies, data analysis software, and the integration of machine-learning approaches promise to make EXAFS fitting and RXES/RIXS map interpretation more efficient and broadly accessible. Finally, the increasing use of in situ and operando methodologies will allow real-time monitoring of drug transformations in environments that closely mimic physiological conditions.
However, several technical and practical challenges remain. Reliable measurements in complex pharmaceutical formulations can be hampered by low analyte concentrations, radiation damage to sensitive biological samples, and limitations of detection in heterogeneous matrices [63,93,94]. In addition, EXAFS and XANES analysis requires advanced simulations and expertise that are not always available in pharmaceutical laboratories, and access to dedicated XES and RIXS beamlines is still limited worldwide.
In conclusion, synchrotron-based X-ray absorption and emission spectroscopies provide unique, atom-specific information on drug structure, activity, and interactions with biomolecules. They complement and extend classical analytical methods by delivering insights into solid-state forms, metal coordination, structure–activity relationships, and drug–target interactions. Although limitations such as restricted facility access and complex data analysis remain, rapid advances in instrumentation and computational methods will continue to enhance their applicability. As these techniques become more widely accessible and standardized, they are likely to play an increasingly important role in rational drug design and the development of safe and effective metallodrugs.

Author Contributions

Conceptualization, K.W.; investigation, K.W.; writing—original draft preparation, K.W. and K.T.; writing—review and editing, E.B.-S.; visualization, K.W. All authors have read and agreed to the published version of the manuscript.

Funding

This research received no external funding.

Institutional Review Board Statement

Not applicable.

Informed Consent Statement

Not applicable.

Conflicts of Interest

The authors declare no conflicts of interest.

Abbreviations

The following abbreviations are used in this manuscript:
XASX-ray absorption spectroscopy
XESX-ray emission spectroscopy
APIsactive pharmaceutical ingredients
RIXSresonant inelastic X-ray scattering
RXESresonant X-ray emission spectroscopy
LC-MS/MSchromatography–mass spectrometry/mass spectrometry
NMRnuclear magnetic resonance
NIRnear-infrared spectroscopy
XRDX-ray diffraction
GCgas chromatography
I0incident intensity
Itintensity of radiation after it passes through the sample (transmission)
Ifintensity of the characteristic X-ray radiation (fluorescence)
Isintensity of the sample current
TFYtotal fluorescence yield
PFYpartial fluorescence yield
TEYtotal electron yield
PEYpartial electron yield
UHVultra-high vacuum
XANESX-ray absorption near-edge structure
EXAFSExtended X-ray Absorption Fine Structure
XAFSX-ray Absorption Fine Structure
RDFpseudoradial distribution function
HERFD-XAShigh-energy resolution fluorescence-detected X-ray absorption spectroscopy
VtCvalence-to-core
LCFlinear combination fitting
E0absorption edge energy
BRH-HClbromhexine hydrochloride
FPCferric pyrophosphate citrate
SEPsoluble ferric pyrophosphate
APPamyloid precursor protein
SSRLStanford Synchrotron Radiation Lightsource
BLbeamline
A549lung cancer cells
HR-XAShigh-resolution X-ray absorption spectroscopy
DOSdensity of states

References

  1. Zacharis, C.K.; Markopoulou, C.K. Recent Trends in Pharmaceutical Analytical Chemistry. Molecules 2020, 25, 3560. [Google Scholar] [CrossRef] [PubMed]
  2. Shinde, N.; Thakare, S.; Wagh, V.; Gurav, S.; Pawar, G.; Mali, S. Analytical Techniques in Pharmaceutical Analysis. Int. J. Pharm. Sci. 2024, 2, 1843–1853. [Google Scholar] [CrossRef]
  3. Wishart, D. NMR Spectroscopy and Protein Structure Determination: Applications to Drug Discovery and Development. Curr. Pharm. Biotechnol. 2005, 6, 105–120. [Google Scholar] [CrossRef]
  4. Liu, Y.; Zhang, J.; Yan, K.; Wei, Y.; Zhang, Q.; Lu, F.; Yan, Z. Real-time Quantitative Monitoring of Synthesis Process of Clevidipine Butyrate Using Raman Spectroscopy. Chin. J. Anal. Chem. 2017, 45, E1701–E1708. [Google Scholar] [CrossRef]
  5. Siddiqui, M.R.; AlOthman, Z.A.; Rahman, N. Analytical techniques in pharmaceutical analysis: A review. Arab. J. Chem. 2013, 10, S1409–S1421. [Google Scholar] [CrossRef]
  6. Timoshenko, J.; Roldan Cuenya, B. In situ/Operando Electrocatalyst Charakterization by X-ray Absorpion Spectroscopy. Chem. Rev. 2021, 121, 882–961. [Google Scholar] [CrossRef]
  7. Czapla-Masztafiak, J.; Kwiatek, W.M.; Sá, J.; Szlachetko, J. X-Ray Spectroscopy on Biological Systems. In X-Ray Scattering; Ares, A.E., Ed.; IntechOpen: London, UK, 2017. [Google Scholar] [CrossRef]
  8. Newville, M. Fundamental of XAFS. Rev. Mineral. Geochem. 2004, 78, 33–74. [Google Scholar] [CrossRef]
  9. Sá, J. High-Resolution XAS/XES: Analyzing Electronic Structuresof Catalysis; CRC Press Taylor and Francis Group: Boca Raton, FL, USA, 2014. [Google Scholar]
  10. Schnohr, C.S.; Ridgway, M.C. Introduction to X-Ray Absorption Spectroscopy. In X-Ray Absorption Spectroscopy of Semiconductors; Rhodes, W.T., Ed.; Springer Series in Optical Sciences; Springer: Atlanta, GA, USA, 2014; Volume 190, pp. 1–26. [Google Scholar]
  11. Takahara, A.; Higaki, Y.; Hirai, T.; Ishige, R. Application of Synchrotron Radiation X-ray Scattering and Spectroscopy to Soft Matter. Polymers 2020, 12, 1624. [Google Scholar] [CrossRef]
  12. Farges, F.; Wilke, M. Planetary, Geological and Environmental Sciences. In X-Ray Absorption and X-Ray Emission Spectroscopy Theory and Applications; Van Bokhoven, J.A., Lamberti, C., Eds.; John Wiley & Sons, Ltd.: Hoboken, NJ, USA, 2016. [Google Scholar] [CrossRef]
  13. Gianolio, D. How to Start an XAS Experiment. In X-Ray Absorption and X-Ray Emission Spectroscopy Theory and Applications; Van Bokhoven, J.A., Lamberti, C., Eds.; John Wiley & Sons, Ltd.: Hoboken, NJ, USA, 2016. [Google Scholar] [CrossRef]
  14. Błachucki, W.; Hoszowska, J.; Dousse, J.-C.; Kayser, Y.; Stachura, R.; Tyrała, K.; Wojtaszek, K.; Sá, J.; Szlachetko, J. High energy resolution off-resonant spectroscopy: A review. Spectrochim. Acta Part B At. Spectrosc. 2017, 136, 23–33. [Google Scholar] [CrossRef]
  15. Ravel, B. Understanding self-absorption in fluorescence XAS. In Proceedings of the Advanced EXAFS Data Analysis Workshop 2011, Ghent, Belgium, 12–14 January 2011. [Google Scholar]
  16. Penner-Hahn, J.E. X-Ray Absorption Spectroscopy; John Wiley & Sons, Ltd.: Hoboken, NJ, USA, 2005. [Google Scholar] [CrossRef]
  17. Carriere, M.; Pignol, D.; Arnoux, P. Co K Edge XAS Transmission and XAS Fluorescence of Organic and Inorganic Co(II) and Co(III) Reference Compounds for the Study of Co in Bacteria, Dataset/Spectral Data; SSHADE/FAME (OSUG Data Center): Grenoble, France, 2014; EXPERIMENT_MC_20141201_001. [CrossRef]
  18. Joly, J.; Grenier, S. Theory of X-Ray Absorption Near Edge Structure. In X-Ray Absorption and X-Ray Emission Spectroscopy Theory and Applications; Van Bokhoven, J.A., Lamberti, C., Eds.; John Wiley & Sons, Ltd.: Hoboken, NJ, USA, 2016; pp. 73–97. [Google Scholar] [CrossRef]
  19. Cotton, F.A. Chemical Applications of Group Teory, 3rd ed.; John Wiley & Sons, Ltd.: Hoboken, NJ, USA, 1991. [Google Scholar]
  20. Szlachetko, J.; Sá, J. X-Ray Spectroscopy—The Driving Force to Understand and Develop Catalysis. In Advanced Catalytic Materials—Photocatalysis and Other Current Trends; Noreña, L., Ed.; IntechOpen: London, UK, 2016. [Google Scholar] [CrossRef]
  21. De Groot, F.; Kotani, A. Core level spectroscopy of solids. In Advances in Condensed Matter Science; Sarma, D.D., Kotliar, G., Tokura, Y., Eds.; CRC Press Taylor & Francis Groupe: Boca Raton, FL, USA, 2008; Volume 6. [Google Scholar] [CrossRef]
  22. Laskowski, R.; Blaha, P. Understanding the L2,3 x-ray absorption spectra of early 3d transition elements. Phys. Rev. B 2010, 82, 205104. [Google Scholar] [CrossRef]
  23. De Groot, F.M.F. X-ray absorption and dichroism of transition metals and their compounds. J. Electron. Spectrosc. Relat. Phenom. 1994, 67, 529–622. [Google Scholar] [CrossRef]
  24. Teo, B.K. EXAFS spectroscopy: Basic principles and data analysis. In Inorganic Chemistry Concepts, 1st ed.; Jorgensen, C.K., Lappert, M.F., Lippard, S.J., Margrave, J.L., Niedenzu, K., Noth, H., Parry, R.W., Yamatera, H., Eds.; Springer: New York, NY, USA, 1986; Volume 9. [Google Scholar]
  25. Koningsberger, D.C.; Mojet, B.L.; Van Dorssen, G.; Ramaker, D.E. XAFS Spectroscopy: Fundamental Principles and Data Analysis. Top. Catal. 2000, 10, 143–155. [Google Scholar] [CrossRef]
  26. Lee, P.A.; Citrin, P.H.; Eisenberger, P.; Kincaid, B. Extended x-ray absorption fine structure—Its strengths and limitations as a structural tool. Rev. Mod. Physiscs 1981, 53, 769. [Google Scholar] [CrossRef]
  27. Jeong, E.; Hwang, I.; Han, S. Quantitative analysis of EXAFS data sts using deep reinforcement learning. Sci. Rep. 2025, 15, 17417. [Google Scholar] [CrossRef]
  28. d’Acapito, F.; Rehman, M. Effectiveness of ab initio molecular dynamics in simulating EXAFS spectra from layered systems. J. Synchrotron Radiat. 2024, 31, 1078–1083. [Google Scholar] [CrossRef] [PubMed]
  29. Ławniczak-Jabłońska, K.; Klepka, M.; Wolska, A.; Walczak, M.; Demchenko, I.N.; Zajdel, P.; Kisiel, A. Spektroskopia absorpcyjna promieniowania rentgenowskiego. In Promieniowanie Synchrotronowe w Fizyce i Chemii Ciała Stałego; Kowalski, B.J., Paszkowicz, W., Eds.; Wydownictwo Naukowe UAM: Poznań, Poland, 2024. [Google Scholar] [CrossRef]
  30. Koningsberger, D.C.; Prins, R. X-Ray Absorption: Principles, Applications, Techniques of EXAFS, SEXAFS and XANES; John Wiley and Sons: New York, NY, USA, 1988. [Google Scholar]
  31. Glatzel, P.; Bergmann, U. High resolution 1s core hole X-ray spectroscopy in 3d transition metal complexes—Electronic and structural information. Coord. Chem. Rev. 2005, 249, 65–95. [Google Scholar] [CrossRef]
  32. Zimmermann, P.; Peredkov, S.; Abdala, P.M.; DeBeer, S.; Tromp, M.; Müller, C.; van Bokhoven, J.A. Modern X-ray spectroscopy: XAS and XES in the laboratory. Coord. Chem. Rev. 2020, 423, 213466. [Google Scholar] [CrossRef]
  33. Sá, J.; Czapla-Masztafiak, J.; Lipiec, E.; Kayser, Y.; Kwiatek, W.; Wood, B.; Deacon, G.B.; Berger, G.; Dufrasne, F.; Fernandes, D.L.; et al. The use of Resonant X-ray Emission Spectroscopy (RXES) for the electronic analysis of metal complexes and their interactions with biomolecules. Drug Discov. Today Technol. 2015, 16, 1–6. [Google Scholar] [CrossRef]
  34. Szlachetko, J.; Nachtegaal, M.; de Boni, E.; Willimann, M.; Safonova, O.; Sa, J.; Smolentsev, G.; Szlachetko, M.; van Bokhoven, J.A.; Dousse, J.-C.; et al. A von Hamos x-ray spectrometer based on a segmented-type diffraction crystal for single-shot x-ray emission spectroscopy and time-resolved resonant inelastic X-ray scattering studies. Rev. Sci. Instrum. 2012, 83, 103105. [Google Scholar] [CrossRef]
  35. Kvashnina, K.O.; Scheinost, A.C. A Johann-type X-ray emission spectrometer at the Rossendorf beamline. J. Synchrotron Radiat. 2016, 23, 836–841. [Google Scholar] [CrossRef]
  36. Kowalska, J.; DeBeer, S. The role of X-ray spectroscopy in understanding the geometric and electronic structure of nitrogenase. Biochim. Biophys. Acta (BBA) Mol. Cell Res. 2015, 1853, 1406–1415. [Google Scholar] [CrossRef] [PubMed]
  37. Castillo, R.G.; Hahn, A.W.; Van Kuiken, B.E.; Henthorn, J.T.; McGale, J. DeBeer, S. Probing Physical Oxidation State by Resonant X-ray Emission Spectroscopy: Applications to Iron Model Complexes and Nitrogenase. Angew. Chem.Int. Ed. 2021, 60, 10112–10121. [Google Scholar] [CrossRef] [PubMed]
  38. Rogvall, J.; Singh, R.; Vacher, M.; Lundberg, M. Sensitivity of Kβ mainline X-ray emission to structural dynamics in iron photosensitizer. Phys. Chem. Chem. Phys. 2023, 25, 10447–10459. [Google Scholar] [CrossRef] [PubMed]
  39. Lancaster, K.M.; Roemelt, M.; Ettenhuber, P.; Hu, Y.; Ribbe, M.W.; Neese, F.; Bergmann, U.; DeBeer, S. X-ray emission spectroscopy evidences a central carbon in the nitrogenase iron-molybdenum cofactor. Science 2011, 334, 974–977. [Google Scholar] [CrossRef]
  40. Rovezzi, M.; Glatzel, P. Hard x-ray emission spectroscopy: A powerful tool for the characterization of magnetic semiconductors. Semicond. Sci. Technol. 2014, 29, 023002. [Google Scholar] [CrossRef]
  41. Ould-Chikh, S.; Vollmer, I.; Aguilar Tapia, A. Fe K Edge XAS HERFD (Kbeta1,3) and XES of Synthetic Maghemite Gamma-Fe2O3 at Ambient Conditions, Dataset/Spectral Data; SSHADE/FAME (OSUG Data Center): Grenoble, France, 2018; EXPERIMENT_SOC_20181115_005. [CrossRef]
  42. Joe, Y.I.; O’neil, G.C.; Miaja-Avila, L.; Fowler, J.W.; Jimenez, R.; Silverman, K.L.; Swetz, D.S.; Ullom, J.N. Observation of iron spin-states using tabletop x-ray emission spectroscopy and microcalorimeter sensors. J. Phys. B At. Mol. Opt. Phys. 2016, 49, 024003. [Google Scholar] [CrossRef]
  43. Weinhardt, L.; Benkert, A.; Meyer, F.; Blum, M.; Hauschild, D.; Wilks, R.G.; Bär, M.; Yang, W.; Zharnikov, M.; Reinert, F.; et al. Local electronic structure of the peptide bond probed by resonant inelastic soft X-ray scattering. Phys. Chem. Chem. Phys. 2019, 21, 13216–13223. [Google Scholar] [CrossRef]
  44. Błachucki, W.; Kayser, Y.; Czapla-Masztafiak, J.; Guo, M.; Juranić, P.; Kavčič, M.; Källman, E.; Knopp, G.; Lundberg, M.; Milne, C.; et al. Inception of electronic damage of matter by photon-driven post-ionization mechanisms. Struct. Dyn. 2019, 6, 024901. [Google Scholar] [CrossRef]
  45. Bhargava, A.; Chen, C.Y.; Finkelstein, K.D.; Ward, M.J.; Robinson, R.D. X-ray emission spectroscopy: An effective route to extract site occupation of cations. Phys. Chem. Chem. Phys. 2018, 20, 28990–29000. [Google Scholar] [CrossRef]
  46. Ortega, R.; Carmona, A.; Llorens, I.; Solari, P.L. X-ray absorption spectroscopy of biological samples. A tutorial. J. Anal. At. Spectrom. 2012, 27, 2054–2065. [Google Scholar] [CrossRef]
  47. Porcaro, F.; Roudeau, S.; Carmona, A.; Ortega, R. Advances in element speciation analysis of biomedical samples using synchrotron-based techniques. TrAC Trends Anal. Chem. 2018, 104, 22–41. [Google Scholar] [CrossRef]
  48. Balerna, A.; Mobilio, S. Introduction to Synchrotron Radiation. In Synchrotron Radiation. Basics, Methods and Applications; Springer: Berlin/Heidelberg, Germany, 2015. [Google Scholar]
  49. Pełka, J.B. Synchrotron Radiation in Biology and Medicine. Acta Phys. Pol. A 2008, 114, 309–329. [Google Scholar] [CrossRef]
  50. Kisiel, A. Synchrotron jako narzędzie: Zastosowania promieniowania synchrotronowego w spektroskopii ciała stałego. Synchrotron Radiat. Nat. Sci. 2006, 5. [Google Scholar]
  51. Bergmann, U.; Kern, J.; Schoenlein, R.; Wernet, P.; Yachandra, V.; Yano, J. Using X-ray free-electron lasers for spectroscopy of molecular catalysts and metalloenzymes. Nat. Rev. Phys. 2021, 3, 264–282. [Google Scholar] [CrossRef]
  52. Winick, H. Synchrotron Radiation Sources—Present Capabilities and Future Directions. J. Synchrotron Rad. 1998, 5, 168–175. [Google Scholar] [CrossRef] [PubMed]
  53. Gawelda, W.; Szlachetko, J.; Milne, C. X-Ray Spectroscopy at Free Electron Lasers. In X-Ray Absorption and X-Ray Emission Spectroscopy: Theory and Applications; Van Bokhoven, J.A., Lamberti, C., Eds.; John Wiley & Sons, Ltd.: Hoboken, NJ, USA, 2016. [Google Scholar]
  54. Pełka, J.B. Synchrotron Radiation in Biology and Medicine. Acta Phys. Pol. A 2022, 141, 3–34. [Google Scholar] [CrossRef]
  55. Cao, M.; Dang, Z.; Wnag, Y. Multimodal techniques based on synchrotron radiation X-rays for revealing interactions of metallic nanoparticles with biological matrices. Fundam. Res. 2015. [Google Scholar] [CrossRef]
  56. Nango, E.; Kubo, M.; Tono, K.; Iwata, S. Pump-Probe Time-Resolved Serial Femtosecond Crystallography at SACLA: Current Status and Data Collection Strategies. Appl. Sci. 2019, 9, 5505. [Google Scholar] [CrossRef]
  57. Hitchcock, A.P.; Morin, C.; Zhang, X.; Araki, T.; Dynes, J.; Stöver, H.; Brash, J.; Lawrence, J.R.; Leppard, G.G. Soft X-ray spectromicroscopy of biological and synthetic polymer systems. J. Electron. Spectrosc. Relat. Phenom. 2005, 144–147, 259–269. [Google Scholar] [CrossRef]
  58. Sedlmair, J. Soft X-Ray Spectromicroscopy of Environmental and Biological Samples. In Göttingen Series in X-Ray Physics; Universitätsverlag Göttingen: Göttingen, Germany, 2011; Volume 7. [Google Scholar]
  59. Kathyola, T.; Chang, S.-Y.; Willneff, E.; Willis, C.; Cibin, G.; Wilson, P.; Kroner, A.; Shotton, E.; Dowding, P.; Schroeder, S. X-ray Absorption Spectroscopy as a Process Analytical Technology: Reaction Studies for the Manufacture of Sulfonate-Stabilized Calcium Carbonate Particles. Ind. Eng. Chem. Res. 2023, 62, 16198–16206. [Google Scholar] [CrossRef]
  60. Koziej, D.; DeBeer, S. Application of Modern X-ray Spectroscopy in Chemistry—Beyond Studying the Oxidation State. Chem. Mater. 2017, 29, 7051–7053. [Google Scholar] [CrossRef]
  61. Emamian, S. X-ray Emission Spectroscopy of Single Protein Crystals Yields Insights into HEME Enzyme Intermediates. J. Phys. Chem. Lett. 2023, 25, 41–48. [Google Scholar] [CrossRef]
  62. Hummer, A.; Rompel, A. X-Ray Absorption Spectroscopy: A Tool to Investigate the Local Structure of Metal-Based Anticancer Compounds In Vivo. In Advances in Protein Chemistry and Structural Biology; Donev, R., Ed.; Elsevier: Amsterdam, The Netherlands; Academic Press: Maryland Heights, MO, USA, 2013; Volume 93, pp. 257–305. [Google Scholar] [CrossRef]
  63. Sherborne, G.; Nguyen, B. Recent XAS studies into Homogeneous metal catalyst in fine chemical and pharmaceutical syntheses. Chem. Cent. J. 2015, 9, 37. [Google Scholar] [CrossRef]
  64. Nicolis, I.; Deschamps, P.; Curis, E.; Corriol, O.; Acar, V.; Zerrouk, N.; Chaumeil, J.-C.; Guyone, F.; Bénazeth, S. XAS applied to pharmaceuticals: Drug administration and bioavailability. J. Synchrotron Rad. 2001, 8, 984–986. [Google Scholar] [CrossRef]
  65. Yang, Y.; Pushie, M.; Cooper, D. Structural Characterization of SmIII(EDTMP). Mol. Pharm. 2015, 12, 4108–4114. [Google Scholar] [CrossRef]
  66. Kuter, D.; Streltsov, V.; Davydova, N.; Venter, G.A.; Naidoo, K.J.; Egan, T.J. Solution structures of chloroquine–ferriheme complexes modeled using MD simulation and investigated by EXAFS spectroscopy. J. Inorg. Biochem. 2016, 154, 114–125. [Google Scholar] [CrossRef]
  67. Ito, M.; Shiba, R.; Suzuki, H.; Noguchi, S. Chlorine K-edge X-ray absorption near-edge structure analysis of clarithromycin hydrochloride metastable crystal. J. Pharm. Sci. 2020, 109, 2095–2099. [Google Scholar] [CrossRef]
  68. Huang, Z.; Suzuki, H.; Ito, M.; Noguchi, S. Direct detection of the crystal form of an active pharmaceutical ingredient in tablets by X-ray absorption fine structure spectroscopy. Int. J. Pharm. 2022, 625, 122057. [Google Scholar] [CrossRef] [PubMed]
  69. Ito, N.; Ito, M.; Suzuki, H.; Noguchi, S. Characterization of Bisphosphonate Hydrate Crystals by Phosphorus K-Edge X-Ray Absorption Near-Edge Structure Spectroscopy. Chem. Pharm. Bull. 2024, 72, 480–486. [Google Scholar] [CrossRef] [PubMed]
  70. Suzuki, H.; Iwata, M.; Ito, M.; Noguchi, S. X-ray Absorption Near-Edge Spectroscopy Analysis of Indomethacin in Crystalline Forms and in Amorphous Solid Dispersions. Mol. Pharm. 2021, 18, 3475–3483. [Google Scholar] [CrossRef]
  71. Knapman, K. Polymorphic predictions: Understanding the nature of crystalline compounds can be critical in drug development and manufacture. Mod. Drug Discov. 2000, 3, 53–54. [Google Scholar]
  72. Lee, A.Y.; Erdemir, D.; Myerson, A.S. Crystal Polymorphism in Chemical Process Development. Annu. Rev. Chem. Biomol. Eng. 2011, 2, 259–280. [Google Scholar] [CrossRef] [PubMed]
  73. Clavier, T. Impact of Polymorphism on Drug Formulation and Bioavailability. J. Chem. Pharm. Res. 2024, 16, 9–10. [Google Scholar] [CrossRef]
  74. Suzuki, H.; Tomita, A.; Ito, M.; Noguchi, S. Bromine K-edge X-ray absorption near-edge structure analysis on hydrobromide-salt crystals and the solid dispersion of active pharmaceutical ingredients. Chem. Pharm. Bull. 2022, 70, 182–186. [Google Scholar] [CrossRef] [PubMed]
  75. Talaczynska, A.; Dzitko, J.; Cielecka-Piontek, J. Benefits and Limitations of Polymorphic and Amorphous Forms of Active Pharmaceutical Ingredients. Curr. Pharm. Des. 2016, 22, 4975–4980. [Google Scholar] [CrossRef]
  76. Suzuki, H.; Matsushima, M.; Ito, M.; Noguchi, S. Analysis of Cimetidine Crystal Polymorphs by X-ray Absorption Near-Edge Spectroscopy. Mol. Pharm. 2023, 20, 1213–1221. [Google Scholar] [CrossRef]
  77. Ravel, B.; Newville, M. ATHENA, ARTEMIS, HEPHAESTUS: Data analysis for X-ray absorption spectroscopy using IFEFFIT. J. Synchrotron Rad. 2005, 12, 537–541. [Google Scholar] [CrossRef]
  78. Joress, H.; Ravel, B.; Anber, E.; Hollenbach, J.; Sur, D.; Hattrick-Simpers, J.; Taheri, M.L.; DeCost, B. Why is EXAFS for complex concentrated alloys so hard? Challenges and opportunities for measuring ordering with X-ray absorption spectroscopy. Matter 2023, 6, 3763–3781. [Google Scholar] [CrossRef]
  79. Rojsatien, S.; Mannodi-Kanakkithodi, A.; Walker, T.; Nietzold, T.; Colegrove, E.; Lai, B.; Cai, Z.; Holt, M.; Chan, M.K.; Bertoni, M.I. Quantitative analysis of Cu XANES spectra using linear combination fitting of binary mixtures simulated by FEFF9. Radiat. Phys. Chem. 2023, 202, 110548. [Google Scholar] [CrossRef]
  80. Gupta, A.; Pratt, R.; Mishra, B. Physicochemical characterization of ferric pyrophosphate citrate. Biometals 2018, 31, 1091–1099. [Google Scholar] [CrossRef]
  81. Macdougall, I.; Tucker, B.; Thompson, J.; Tomson, C.R.; Baker, L.R.; Raine, A.E. A randomized controlled study of iron supplementation in patients treated with erythropoietin. Kidney Int. 1996, 50, 1694–1699. [Google Scholar] [CrossRef] [PubMed]
  82. Summers, K.L.; Roseman, G.; Schilling, K.M.; Dolgova, N.V.; Pushie, M.J.; Sokaras, D.; Kroll, T.; Harris, H.H.; Millhauser, G.L.; Pickering, I.J.; et al. Alzheimer’s Drug PBT2 Interacts with the Amyloid β 1–42 Peptide Differently than Other 8-Hydroxyquinoline Chelating Drugs. Inorg. Chem. 2022, 61, 14626–14640. [Google Scholar] [CrossRef] [PubMed]
  83. Hardy, J.A.; Higgins, G.A. Alzheimer’s disease: The amyloid cascade hypothesis. Science 1992, 256, 184–185. [Google Scholar] [CrossRef] [PubMed]
  84. Liao, M.; Tzeng, Y.; Chang, L.; Huang, H.; Lin, T.; Chyan, C.; Chen, Y. The correlation between neurotoxicity, aggregative ability and secondary structure studied by sequence truncated Aβ peptides. FEBS Lett. 2007, 581, 1161–1165. [Google Scholar] [CrossRef]
  85. De-Paula, V.J.; Radanović, M.; Diniz, B.S.; Forlenza, O.V. Alzheimer’s disease. Subcell. Biochem. 2012, 65, 329–352. [Google Scholar] [CrossRef]
  86. Bagheri, S.; Squitti, R.; Haertlé, T.; Siotto, M.; Saboury, A.A. Role of Copper in the Onset of Alzheimer’s Disease Compared to Other Metals. Front. Aging Neurosci. 2018, 23, 446. [Google Scholar] [CrossRef]
  87. Proux, O.; Lahera, E.; Del Net, W.; Kieffer, I.; Rovezzi, M.; Testemale, D.; Irar, M.; Thomas, S.; Aguilar-Tapia, A.; Bazarkina, E.F.; et al. High-Energy Resolution Fluorescence Detected X-Ray Absorption Spectroscopy: A Powerful New Structural Tool in Environmental Biogeochemistry Sciences. J. Environ. Qual. 2017, 46, 1146–1157. [Google Scholar] [CrossRef]
  88. Liang, J.; Levina, A.; Jia, J.; Kappen, P.; Glover, C.; Johannessen, B. Reactivity and Transformation of Antimetastatic and Cytotoxic Rhodium(III)–Dimethyl Sulfoxide Complexes in Biological Fluids: An XAS Speciation Study. Inorg. Chem. 2019, 58, 4880–4893. [Google Scholar] [CrossRef]
  89. Mestroni, G.; Alessio, E.; Sessanta Santi, A.; Geremia, S.; Bergamo, A.; Sava, G.; Boccarelli, A.; Schettino, A.; Coluccia, M. Rhodium(III) Analogues of Antitumour-Active Ruthenium(III) Compounds: The Crystal Structure of [ImH] [trans-RhCl4(Im)2] (Im = imidazole). Inorg. Chem. 1998, 273, 62–71. [Google Scholar] [CrossRef]
  90. Levina, A.; Aitken, J.B.; Gwee, Y.Y.; Lim, Z.J.; Liu, M.; Singharay, A.M.; Wong, P.F.; Lay, P.A. Biotransformations of anticancer ruthenium(III) complexes: An X-ray absorption spectroscopic study. Chemistry 2013, 19, 3609–3619. [Google Scholar] [CrossRef]
  91. Lipiec, E.; Czapla, J.; Szlachetko, J.; Kayser, Y.; Kwiatek, W.; Wood, B.; Deacone, G.B.; Sá, J. Novel in situ methodology to observe the interactions of chemotherapeutical Pt drugs with DNA under physiological conditions. Dalton Trans. 2014, 4, 13839–13844. [Google Scholar] [CrossRef]
  92. Sá, J.; Czapla-Masztafiak, J.; Lipiec, E.; Kayser, Y.; Fernandes, D.L.A.; Szlachetko, J.J.; Dufrasnef, F.; Berger, G. Resonant X-ray emission spectroscopy of platinum(ii) anticancer complexes. Analyst 2016, 141, 1226–1232. [Google Scholar] [CrossRef]
  93. Diklić, N.; Clark, A.; Herranz, J.; Diercks, J.; Aegerter, D.; Nachtegaal, M.; Beard, A.; Schmidt, T. Potential Pitfalls in the Operando XAS Study of Oxygen Evolution Electrocatalysts. ACS Energy Lett. 2022, 7, 1735–1740. [Google Scholar] [CrossRef]
  94. Finzel, J.; Sanroman Gutierrez, K.; Hoffman, A.; Resasco, J.; Christopher, P.; Bare, S. Limits of Detection for EXAFS Characterization of Heterogeneous Single-Atom Catalysts. ACS Catal. 2023, 13, 6462–6473. [Google Scholar] [CrossRef]
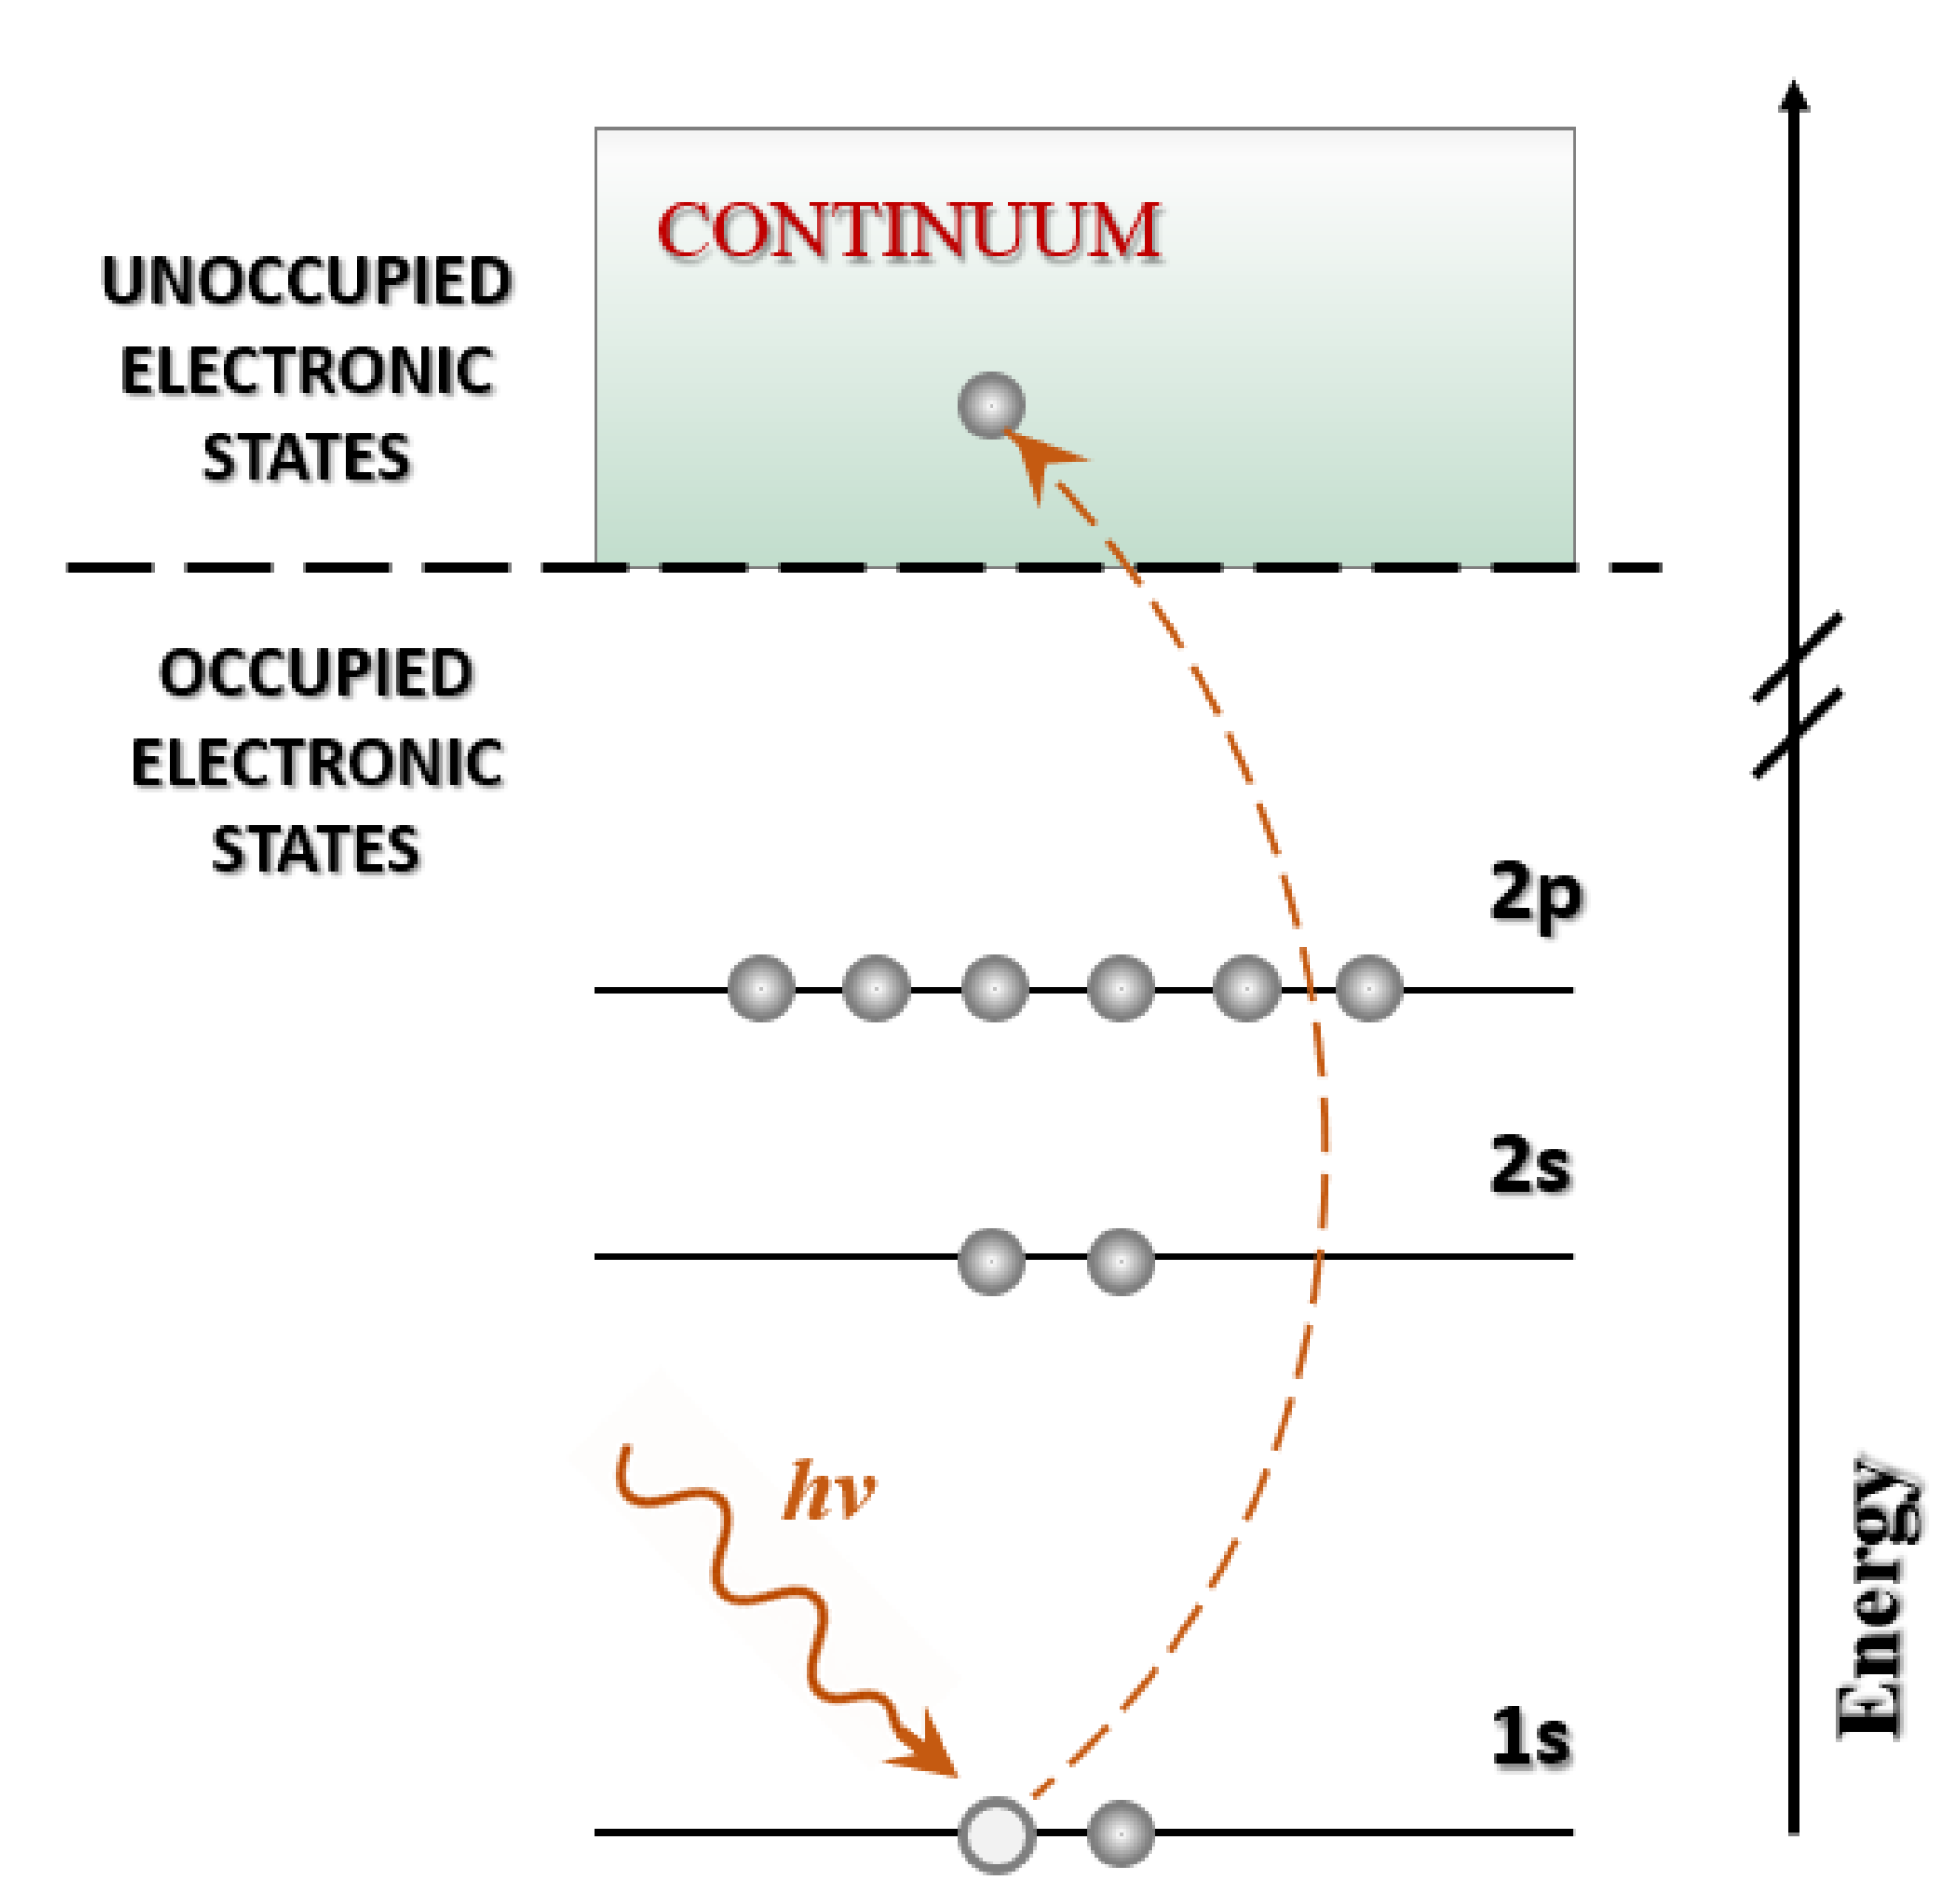
Figure 1. Schematic representation of the photoelectric effect, in which the absorption of X-rays results in the ejection of an electron from the 1s level of a given atom.
Applsci 15 10784 g001
Figure 2. Schematic comparison of three XAS data acquisition methods: transmission, fluorescence, and sample current measurement. Each approach is illustrated by the arrangement of the X-ray beam, sample, and detector, as well as by examples of typical sample requirements under which each method is applied. This illustration provides a quick overview of the different analytical strategies employed in X-ray absorption spectroscopy (XAS).
Applsci 15 10784 g002
Figure 3. XAS spectrum of the Co K-edge (vitamin B12) measured in fluorescence mode. Distinct spectral regions (XANES, EXAFS) are indicated. Data were reproduced from the SSHADE/FAME open database [17].
Applsci 15 10784 g003
Figure 4. Schematic diagram of the operation of a flat single-crystal spectrometer, illustrating the path of the photon beam from the sample through collimators to the crystal analyzer and detector, as well as the key geometric arrangement for diffraction-based measurements.
Applsci 15 10784 g004
Figure 6. S K-edge XANES spectra of CIM_C (blue) and CIM_W (red) crystals and their structural formulas [76]. The same energy value for the absorption edge (E0—2472.1 eV) means that sulfur has the same oxidation state in each sample. The most pronounced changes in the spectra were observed in the energy range of 2474.0–2484.0 eV. The figure was reprinted with permission from Suzuki et al., “Analysis of Cimetidine Crystal Polymorphs by X-ray Absorption Near-Edge Spectroscopy”, Molecular Pharmaceutics, Copyright 2023 American Chemical Society.
Applsci 15 10784 g006
Figure 7. (a) XANES spectra of iron(II) and iron(III) standards, along with FPC in both solid and solution phases, demonstrate that FPC contains exclusively iron(III) and that its solid-phase structure is preserved in solution. (b) EXAFS analysis of FPC in the solid state and in solution is shown for both Day 1 and Month 4. The figures were reproduced from [80].
Applsci 15 10784 g007
Figure 8. In situ RIXS maps measured around the Pt L3-edge of cisplatin in deionized water (a), cisplatin in buffer solution (b), and cisplatin in buffer solution + DNA (c). HR-XAS was extracted from RIXS by slicing across the most intense emission energy (~9443 eV) [92]. The maps were reproduced with permission from Lipiec et al., Dalton Transactions published by The Royal Society of Chemistry, 2014.
Applsci 15 10784 g008
Table 1. Representative case studies of synchrotron-based X-ray spectroscopies applied in pharmaceutical sciences.
Drug/SystemSpectroscopic TechniqueKey FindingsRef.
Cimetidine (CIM)S K-edge XANES, EXAFSDifferentiation of polymorphs (CIM_A, CIM_B, CIM_C, and CIM_W); quantification of mixtures via LCF (R2 = 0.9967)[76]
Bromhexine hydrochloride (BRH-HCl)Cl and Br K-edge XANES/EXAFSDetection of polymorphic forms; identification of H-bonds, halogen–π, and halogen–halogen interactions; direct analysis of tablets in PTP[68]
Ferric pyrophosphate citrate (FPC)Fe K-edge XANES, EXAFSConfirmation of Fe3+; coordination by citrate and pyrophosphate; stability in solution; first clinical parenteral iron salt[80]
Cu–Aβ peptide complexes (Alzheimer’s)Cu K-edge HERFD-XASChelators (PBT2, CQ, and B2Q) show distinct binding modes; differences explain therapeutic activity[82]
Rhodium(III) complexes (A1, A2)Rh K-edge XANES, EXAFSDonor atom preferences correlate with cytotoxic vs. antimetastatic activity[88]
Ruthenium(III) complexes (NAMI-A, KP1019)Ru K-edge XASAquation and protein binding; speciation explains distinct pharmacological profiles.[90]
Cisplatin–DNAPt L3-edge RIXSIn situ RIXS reveals hydration and DNA binding; formation of cis-Pt(NH3)2{d(GpG)-N7(1),-N7(2)} adduct[91]
Chiral Pt complexes (cis/trans stereoisomers)Pt L3-edge RXES, HR-XAS, VtCDiscrimination between isomers; subtle electronic differences correlate with ~50-fold difference in activity.[92]
Disclaimer/Publisher’s Note: The statements, opinions and data contained in all publications are solely those of the individual author(s) and contributor(s) and not of MDPI and/or the editor(s). MDPI and/or the editor(s) disclaim responsibility for any injury to people or property resulting from any ideas, methods, instructions or products referred to in the content.