Article

Optimization of Impedance-Based Real-Time Assay in xCELLigence RTCA SP16 Device for the Analysis of Fully Differentiated Caco-2 Cells

1
Doctoral School of Medical and Health Sciences, Jagiellonian University Medical College, św. Łazarza 16, 31-530 Cracow, Poland
2
Department of Pathophysiology, Faculty of Medicine, Jagiellonian University Medical College, Czysta 18, 31-121 Cracow, Poland
3
Center for the Development of Therapies for Civilization and Age-Related Diseases, Jagiellonian University Medical College, Medyczna 9, 31-066 Cracow, Poland
4
Faculty of Pharmacy, Department of Technology and Biotechnology of Drugs, Jagiellonian University Medical College, Medyczna 9, 31-008 Cracow, Poland
*
Author to whom correspondence should be addressed.
Appl. Sci. 2025, 15(15), 8298; https://doi.org/10.3390/app15158298
Submission received: 15 March 2025 / Revised: 15 July 2025 / Accepted: 23 July 2025 / Published: 25 July 2025
(This article belongs to the Special Issue Contemporary Pharmacy: Advances and Challenges)

Abstract

Impedance-based cellular assays allow determination of biological functions of cell populations in real-time by measuring electrical impedance. As compared to end-point assays, such as trans-epithelial electrical resistance assays, for example, they enable fast, non-invasive, and easy detection of cell kinetics—their growth, attachment, and interaction can be monitored over time. In our experiment, Caco-2 cells were cultured on E-plates 16. Next, fully differentiated cells were treated with either TNF-α or 3,4-dihydroxy-L-phenylalanine (L-DOPA). We aimed to verify the possibility of real-time testing of the viability, monolayer formation, and integrity (i.e., the presence of a functional and polarized monolayer) of Caco-2 cells by the xCELLigence real-time cell analyzer (RTCA) S16 system (Agilent Technologies).

1. Introduction

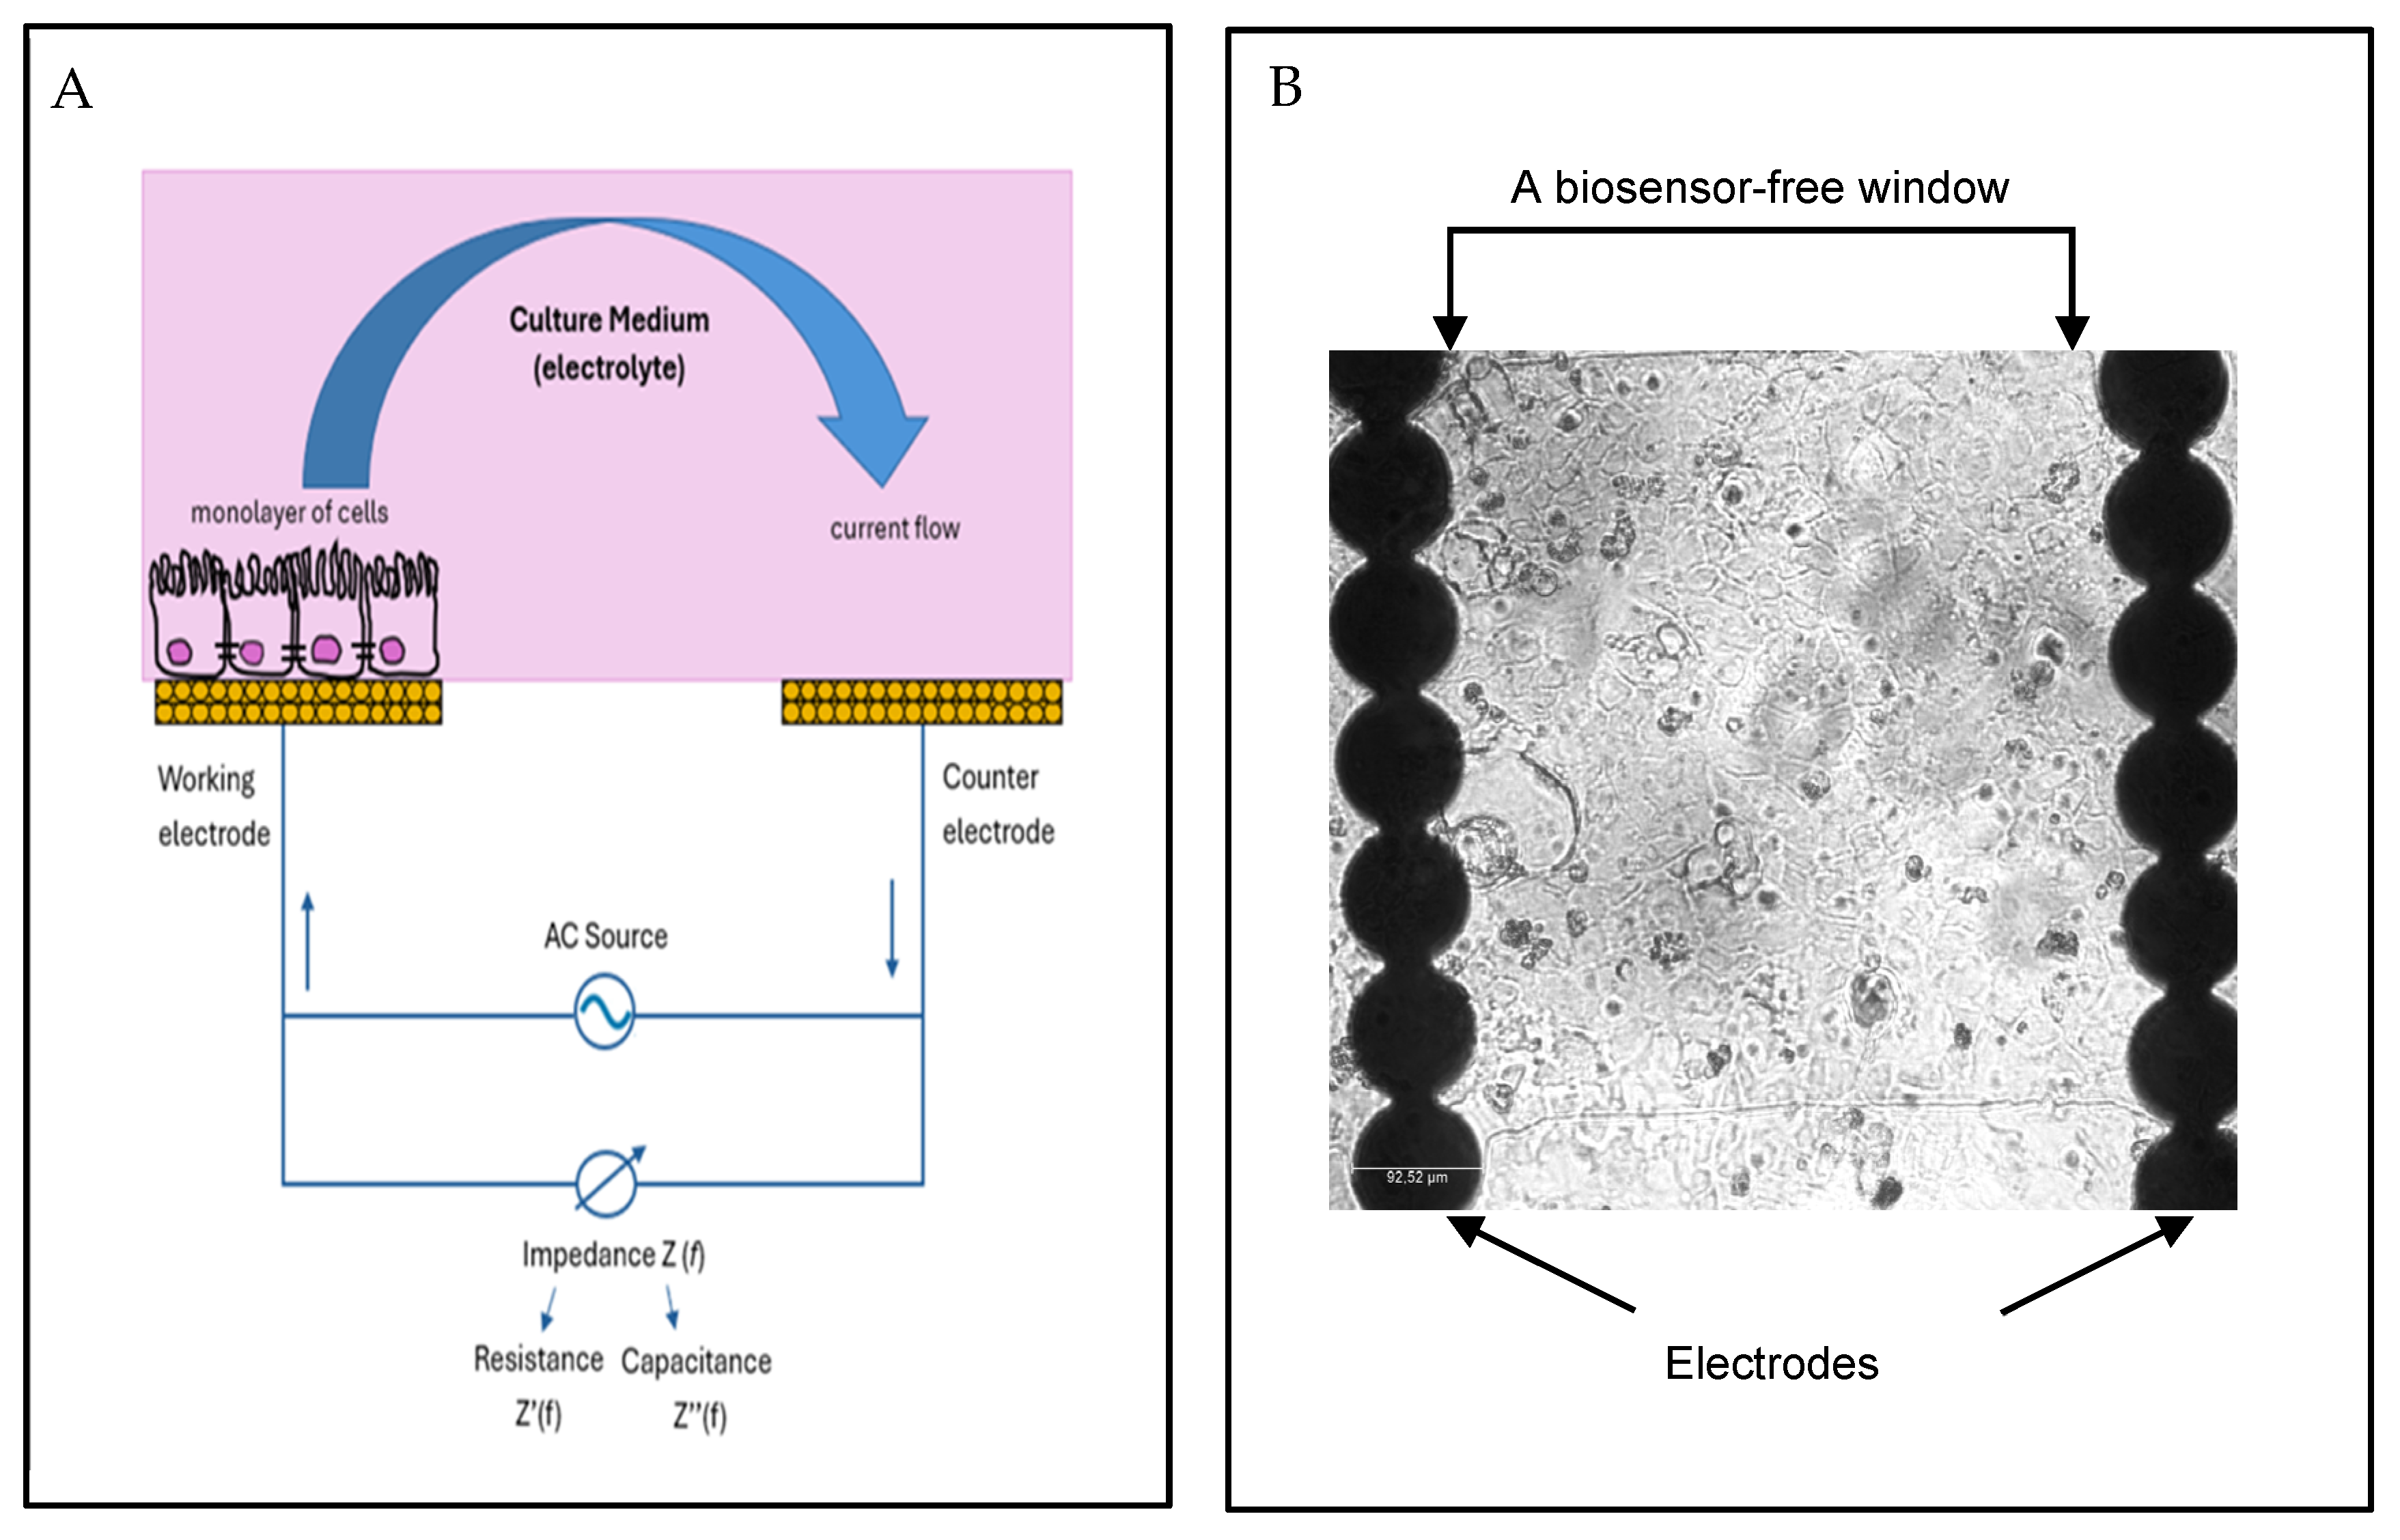
1.1. Cell-Based Impedance Assays

Over 90% of current biological procedures use traditional radiolabeled or fluorescent probes for understanding complex biological processes of tissues in their native environment [1]. These procedures are less sensitive more invasive and provide end-point results that are harmful to cells. The discovery of a novel, label-free technology to monitor cellular response, morphology, and proliferation provides a distinct advantage to read out drug action, cell–cell interaction, and quantification [2]. The impedance-based cellular assay (IBCA) has emerged as a new and alternative method for dynamic, real-time monitoring of cell kinetics, morphology, and behavior based on impedance change over time. It allows the measurement of electronic signals on sensors, developed due to changes in the biological status of cells, and converts them to digital signals for processing and analysis [3]. The major advantages of real-time cell analysis (RTCA) over conventional approaches include the following: fast and easy detection of cell kinetics and quality attachment with the substrate in real-time; an automated measurement of drug candidate effect on therapeutic target, which provides a highly reproducible data set during the drug development process; and broad application with high sensitivity and accuracy of the system that exceeds limitations from end-point assays [4,5].

1.2. TEER Method for Monitoring of Caco-2 Monolayer Integrity

The term intestinal (gut) permeability describes the drugs or chemical compounds passing from the intestinal lumen through the intestinal epithelial cells lining the gastrointestinal wall. It was Farquhar and Palade (1963) who demonstrated that there are small areas of fusion between adjacent cells [6]. The intercellular junctions are highly specialized multi-layered membranes and are classified into 3 different types: tight junctions (TJs or zonula occludens), desmosomes (or macula adherens), and adherent junctions (or zonula adherens) [6,7]. TJs, which are the most apical junctions, create a watertight sealing between the intercellular epithelial spaces and form a barrier to limit the paracellular pathway of solutes [8,9,10]. The TJs also develop polarization by forming a boundary between the apical and basolateral membranes [10]. TJs and permeability of intestinal cells can be well studied using various in vitro models. One of the best, well-established and verified models of studying these parameters is the human epithelial colorectal adenocarcinoma cell line (Caco-2). The word “Caco-2” is derived from “cancer colon” and hence their ability for spontaneous differentiation into a single layer of intestinal columnar epithelial cells resembles the highly functionalized human epithelial barrier with morphological and biochemical similarities to intercellular junctions. Caco-2 cells are polarized, enabling them to transport ions across the cell membrane, induce secretory functions, and present absorptive transporters involved in both efflux and influx as part of the active transport system and tight junction (TJ) formation [11]. The Caco-2 cell line is also approved by the Food and Drug Administration in drug discovery, permeability, and transport studies. It is also used for study on epithelial permeability, membrane integrity, and bidirectional movement of substances that mainly depends on the development of cell-to-cell junctional complexes.
The TJ expression in Caco-2 cells can be assessed by trans-epithelial electrical resistance (TEER) [12]. Although the TEER is widely used for determination of Caco-2 monolayer integrity before testing of compounds’ permeability as well as the TJs functions, there are some limitations of this method. In the standard TEER protocol, the Caco-2 cells are seeded on Transwell® inserts containing membrane with 0.4 µm pores and cultured in a 24-well plate for around 18–21 days. This time is necessary for full differentiation into cells, which express TJs, microvilli, and a number of enzymes and transporters (peptidases, esterases, and P-glycoprotein) that are characteristic of enterocytes [12]. For TEER measurement by the device called a voltohm meter, a pair of electrodes should be inserted in each well to both the apical and basolateral compartments. This procedure is invasive, time-consuming, and laborious, especially since it should be repeated many times over 15 days from the start of the culture in order to capture the high level of resistance, which is necessary for experiments. The readings of TEER require removing the cells from the incubator affecting the physiological conditions (i.e., pH and temperature). The measurement may be inaccurate and non-repeatable as it depends on the position of the electrodes and the experience of the operator [13]. Another limitation of this method is its low throughput, which prevents extensive studies to assess the impact of compounds or materials on membrane integrity and permeability.

1.3. IBCA for Monitoring of Caco-2 Cells Membrane Integrity and Viability in Real-Time

Due to the aforementioned limitations of the TEER method, we decided to apply IBCA performed in the xCELLigence real-time cell analyzer (RTCA) S16 (Pilot Scale) purchased from Agilent Technologies, Inc. (Santa Clara, CA, USA) in order to optimize a dynamic monitoring of the Caco-2 cell kinetics, which form the population of fully differentiated cells ready for non-invasive real-time investigation of their morphology, membrane integrity as well as viability. The xCELLigence RTCA S16 is the smallest member of the xCELLigence family. The instrument consists of a single 16-well E-plate analyzer (placed inside the incubator at 37 °C and 5% CO2), a computer with RTCA integrated software pro 2.8.1 (Agilent Technologies, Inc., Santa Clara, CA, USA) and the single-use sterile E-plate 16 PET (polyethylene terephthalate) (Agilent Technologies, Inc., Santa Clara, CA, USA), which consist of 16 wells with gold plated electrodes integrated into the bottom of wells. According to the website (http://www.agilent.com, accessed: 25 February 2025), the other devices from xCELLigence family offered by Agilent Technologies include the following: xCELLigence RTCA SP (Single Plate) or MP (Multiple Plates) used for cell health characterization, immune cell-mediated killing, viral cytopathic effects, cytotoxicity, cell adhesion, cell barrier function and cell signaling; xCELLigence RTCA eSight—Imaging & Impedance, which combines label-free impedance technology with bright-field and fluorescence imaging; xCELLigence RTCA DP (Dual Purpose) instrument, which continuously measures cell invasion and migration (CIM) and monitors cell health as well as behavior; xCELLigence RTCA HT (High Throughput Model) integrated with BioTek BioSpa 8 automated incubator instrument for high throughput screening of therapeutic antibodies, drug compounds, and cytotoxicity on 384-well electronic microplate (E-Plate 384); and last but not least the most advanced xCELLigence RTCA CardioECR (Cardiomyocyte Contractility & Electrical Activity) dedicated for assessment of cardiomyocyte contractility, viability, and electrophysiology.
The gold microelectrodes in E-Plate 16 PET inserted into xCELLigence RTCA S16 allow for a dynamic monitoring of cell adhesion, spreading, proliferation, attachment quality with the substrate, morphology, and cell–cell interaction properties. They are submersed in an electrically conductive solution, and the current flows under the working microelectrode. An electric circuit is said to be complete when an electric potential is applied across the biosensors; the electrons exit from the negative terminal, pass through the culture medium, and deposit onto the positive terminal. The weak current applied can flow through the cell–cell junctions, between cell and substrate, and through cell membranes. As the cells adhere to the surface and begin to grow over time, a relative change in electric impedance is observed due to the electrochemical properties of the cells (Figure 1A). Upon reaching confluence, the cells form a plateau, and changes in impedance are recorded and converted automatically into a unitless and dimensionless parameter called cell index (CI) [14]. A zero CI means there is no attachment of cells; however, a higher CI reflects increased cell adhesion to the plate. The current and voltage applied through the electrodes are ~1 µA and >10 mV, respectively. Neither the gold microelectrode surfaces nor the applied electrical potential have effects on cells health, behavior, and metabolism. When a small change occurs in cells’ growth, the xCELLigence RTCA S16 automatically and accurately measures the corresponding changes in impedance and converts the analog electronic signals to digital signals that represent information required for calculating multiple biological parameters and for processing the data and plotting graphs. At the bottom of the E-plate 16, there is a biosensor-free window (Figure 1B) that facilitates microscopic visualization of cells and correlates electronic signals with morphological changes in cells observed under a microscope. According to the manufacturer, the magnitude of impedance depends on the number, shape, size, and degree of attachment of the cells. A small disruption to the cellular proteins or membranes, mainly due to the addition of a test compound, can lead to detachment of cells from the plate bottom or cause injury or death to the cells that can be immediately observed as a decrease or loss of impedance in real-time [15].
Although the xCELLigence real-time device was already used to study the integrity of the Caco-2 membrane, the described protocol included 8 days of post confluence culture in a medium containing 10% FBS [16]. However, the exact time of incubation time before confluence was not given by the authors. Thus, the proposed incubation time could be insufficient for full Caco-2 cell differentiation, as at least 17–18 days of cell growth is recommended. Moreover, the exact number of cells seeded on E-plate 16 was not reported in the article, and the type of E-plate used was not given, either [16]. The applied xCELLigence system (Roche Applied Science), known as the Real-Time Cell Electronic Sensing System (RT–CES, ACEA Biosciences), is also not currently offered for sale by Agilent Technologies. Thus, in the present work, we decided to optimize the xCELLigence RTCA S16 system, enabling real-time monitoring of Caco-2 cell proliferation, viability, morphology, and membrane integrity on E-plates 16 so that appropriate experiments could be carried out on fully differentiated Caco-2 cells. The optimization procedure included determination of the appropriate number of cells for seeding, selecting the suitable concentration of FBS as well as the time of media changes. The differentiated Caco-2 cell cultures on E-plate 16 were treated next with either 100 ng/mL of TNF-α or 100 µg/mL of 3,4-dihydroxy-L-phenylalanine (L-DOPA) in order to verify the possibility of real-time testing the membrane integrity or viability of Caco-2 cells by the xCELLigence RTCA S16 system.

2. Materials and Methods

2.1. Cell Culture General Procedure

Caco-2 cells obtained directly from the American Type Culture Collection (ATCC number HTB-37, Rockville, MD, USA) were maintained in high-grade T75 cell culture plastic flasks (ThermoFisher Scientific, Waltham, MA, USA). The medium consisted of Dulbecco’s Modified Eagle’s Medium supplemented with 20% fetal bovine serum, 1% non-essential amino acids, and 100 IU/mL penicillin–100 µg/mL streptomycin, all obtained from GibcoTM. The cells were cultured at 5% CO2 at 37 °C in an HERAcell 240 incubator (Heraeus, Hanau, Germany). The proliferation time of Caco-2 cells is 3–4 days [17,18]. The trypsinization in the subculturing procedure was performed with the use of 0.25% trypsin-EDTA (GibcoTM). For experimental purposes, only Caco-2 cells between passages 23 and 28 were used.

2.2. xCELLigence System

The xCELLigence real-time cell analyzer (RTCA) S16 (Pilot Scale) was purchased from Agilent Technologies, Inc. (Santa Clara, CA, USA). The instrument consists of a single 16-well E-plate analyzer (which was placed inside the HERAcell 240 CO2 incubator), a computer with RTCA integrated software pro 2.8.1 (Agilent Technologies, Inc., Santa Clara, CA, USA), and the single-use sterile E-plate 16 PET (polyethylene terephthalate) (Agilent Technologies, Inc., Santa Clara, CA, USA) having 16 wells with a diameter of 5.0 ± 0.075 mm, 270 ± 10 µL volume, and gold-plated electrodes on the bottom of each well.

2.3. The Effect of TNF-α on Caco-2 Epithelial Barrier Integrity Monitored by TEER Method

The monolayer characteristic of Caco-2 cells was observed by transepithelial electrical resistance (TEER) using the Millicell-ERS 2 (Electrical Resistance System) Voltohm meter (Merck Millipore, Burlington, MA, USA). Caco-2 cells (2 × 10⁴ cells/well) were seeded onto microporous filters in cell culture chamber inserts (Corning®, 6.5 mm Transwell® with 0.4 µm Pore Polycarbonate Membrane Insert, product number 3413, Corning, NY, USA) for 21 days. The polycarbonate membrane is semipermeable, which allows the exchange of ions and nutrients. The medium was changed every 48 h with complete medium supplemented with 20% FBS in the apical and basolateral compartments in the first 7 days of seeding, followed by complete 20% FBS medium in the basolateral compartment only and 1% FBS in the apical compartment for the next 2 weeks [19]. Once the Caco-2 cells differentiated and a monolayer was established, a pair of electrodes was inserted in each well, and the electrical resistance was measured until similar values were recorded for three consecutive measurements [12]. The resistance was measured in Ohms (Ω). Different doses of TNF-α (ThermoFisher Scientific, Waltham, MA, USA) were added in the apical compartments, followed by the measurement of resistance in Ω at different time intervals: 0, 4, 8, 12, 24, and 48 h [20].

2.4. Quantitative Assessment of Caco-2 Cell Kinetics in xCELLigence RTCA S16

2.4.1. Preparation of the Cells

When the Caco-2 cells reached 80–90% confluence on T75 cell culture flasks, they were harvested with 0.25% trypsin-EDTA and resuspended in pre-warmed fresh complete cell culture media (20% of FBS), followed by counting and adjusting the cell concentration to obtain cell densities of 5000, 10,000, 20,000, and 40,000 cells per well.

2.4.2. Seeding of Cells onto xCELLigence E-Plate 16

E-plates 16 PET were prepared for seeding first by adding 50 µL of complete culture media into each well and leaving the plate in the cell culture hood for a few minutes to ensure that the culture media and E-plate 16 surface achieve equilibrium at room temperature. Once equilibrium was achieved, 100 µL of cell suspension in concentrations of 5000, 10,000, 20,000, and 40,000 cells/well was added. The total volume in each well was 100 µL. For baseline control wells, 100 µL of complete media and 100 µL of sterile PBS were added, respectively. The E-plate 16 was left in the cell culture hood for a minimum of 20 min at room temperature before starting the experiment to allow the cells to distribute evenly at the bottom of the wells.

2.4.3. Monitoring of Real-Time Caco-2 Cells Grow in E Plate 16

The xCELLigence RTCA S16 system continuously monitored the cells during proliferation and confluence in real-time for 50 h. The media was not changed. Sweep (the single measurement of impedance) interval in the xCELLigence software was set to 30 min for 100 repetitions (50 h in total) for all cells densities.

2.5. Optimization of Cultivation the Differentiated Caco-2 Cells in xCELLigence RTCA S16

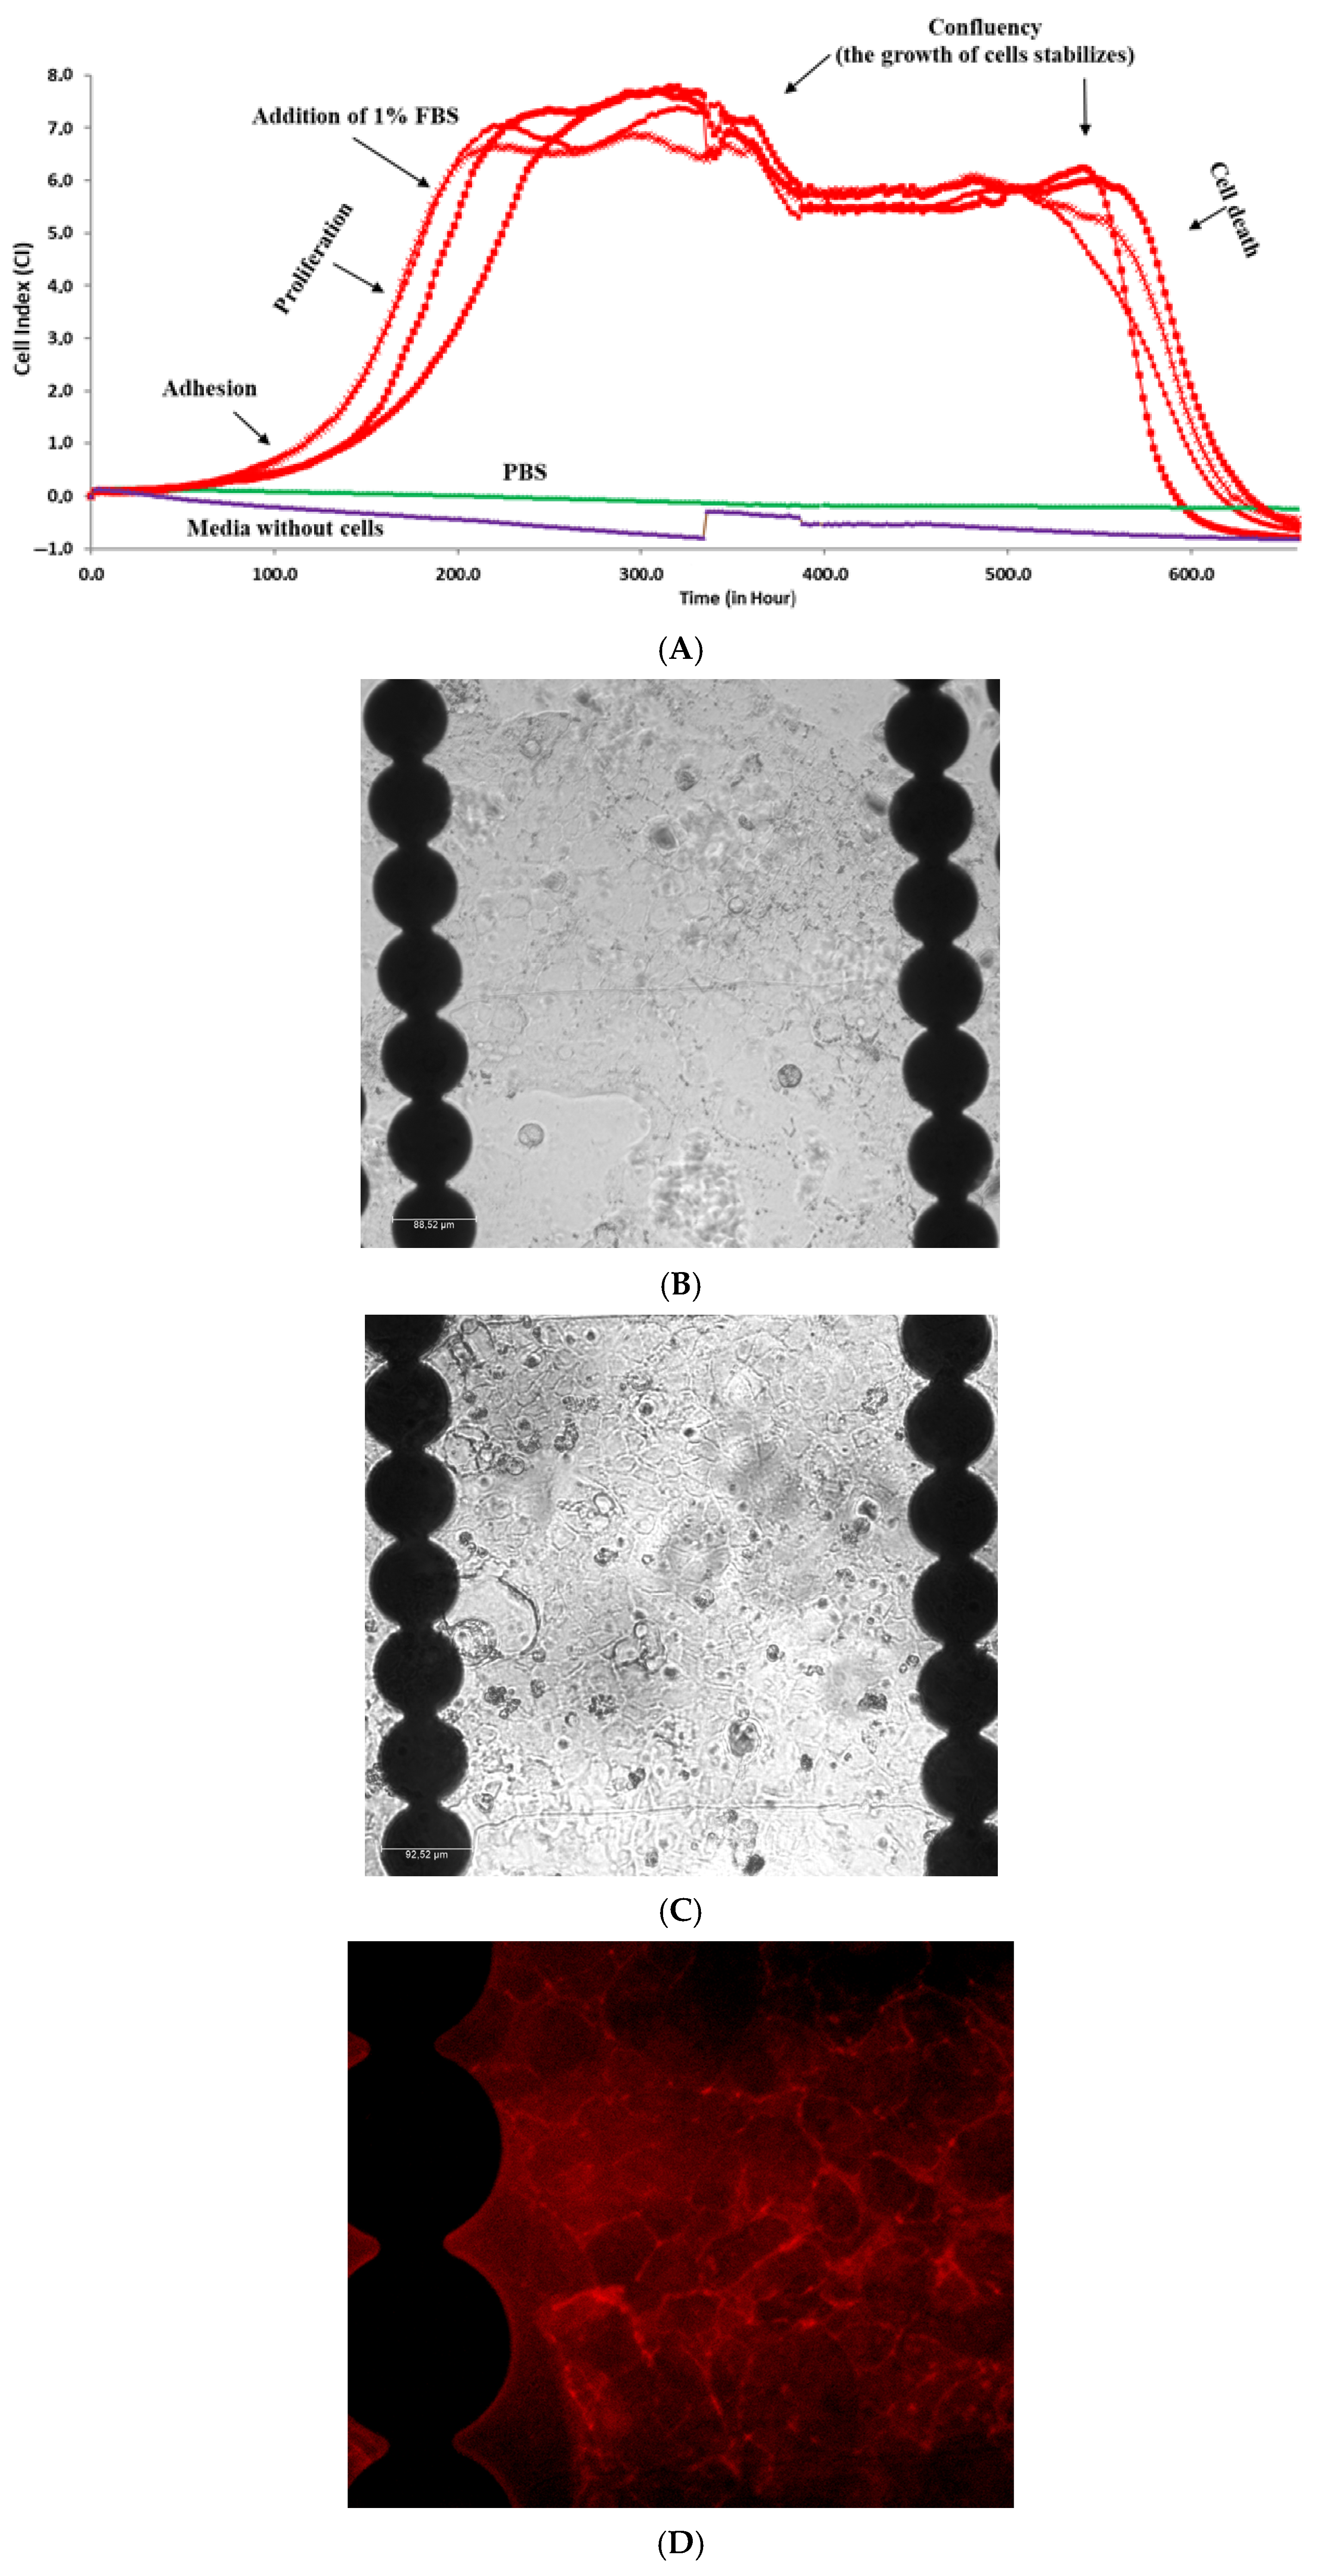
2.5.1. Real-Time Monitoring of Caco-2 Cells Growth in Complete Media

The preparation of cells and seeding procedure were similar to that described in Section 2.4. The Caco-2 cells were seeded at 3000 or 5000 cells/wells in complete media (20% of FBS). The xCELLigence RTCA S16 continuously monitored the cells during proliferation, confluence, and death in real-time. The media was changed every 4–5 days. Sweep interval in the xCELLigence software was set to 30 min for 720 repetitions (360 h, 15 days in total post-seeding).

2.5.2. Real-Time Monitoring of Caco-2 Cells Growth in Media Containing 1% of FBS

The preparation of cells and seeding procedure were similar to that described in Section 2.4. The Caco-2 cells were seeded at 2000 cells/wells in complete media (20% of FBS) and incubate until the cell growth the proliferation phase. The complete media have been replaced by 1% FBS media, depending on the intensity of the proliferation phase. Sweep interval in the xCELLigence software was set in the first experiment to 30 min for 720 repetitions (360 h, 15 days in total post-seeding) or 30 min for 1320 repetitions in the second independent experiment (660 h, 27.5 days in total post-seeding).

2.5.3. Staining Procedure of Caco-2 Cells for Occludin

The preparation of cells and seeding procedure were similar to that described in Section 2.4. The Caco-2 cells were seeded on E-plate 16 at 2000 cells/wells in complete media (20% of FBS) and incubated until the cell growth the proliferation phase. The complete media have been replaced by 1% FBS media at 170 h incubation (the CI curve is not shown in the manuscript). The incubation was terminated at 425 h, and all treatments were performed directly on the E-16 plate. Briefly, cells were fixed with 4% cold paraformaldehyde for 15 min, permeabilized with 0.2% Triton X-100 in PBS for 15 min and blocked with 5% goat serum and 0.05% Tween-20 for 60 min at the room temperature. Then, cells were incubated with rabbit anti-occludin antibody (#40-4700, ThermoFisher Scientific, Waltham, MA, USA, dilution 1:750) in Tris with 5% goat serum and 0.05% Tween-20 overnight at 4 °C. The next morning, cells were washed with PBS and incubated with the goat anti-rabbit conjugated with Alexa 594 secondary antibody (dilution 1:1000; Jackson Immunoresearch, Cambridgeshire, UK) in Tris with 5% goat serum and 0.05% Tween-20 for 60 min at the room temperature and washed with PBS. Ibidi mounting medium (ibidi GmbH, Germany) was added directly to wells before cells were visualized under the Leica DMi8 (Leica, Wetzlar, Germany) microscope.

2.6. The Effect of TNF-α on Caco-2 Epithelial Barrier Integrity Monitored by xCELLigence RTCA S16

The preparation of cells and seeding procedure were similar to that described in Section 2.4. The Caco-2 cells were seeded at 2000 cells/wells in full media (20% of FBS). The media change from 20% to 1% FBS was performed at 260 h of incubation. The fresh 1% FBS media was added at 385 h of incubation. Next, the Caco-2 cells were treated with TNF-α (100 ng/mL) at 450 h post-seeding (18.75 days), and the CI was carefully monitored for the next 48 h. Sweep interval in the RTCA software was set to 30 min for 1050 repetitions (525 h in total). The Caco-2 cells were treated next with TNF-α (100 ng/mL) at 240 h of incubation, and the CI was carefully monitored for the next 48 h. Sweep interval in the RTCA software was set to 30 min for 580 repetitions (290 h in total).

2.7. The Effect of L-DOPA on Undifferentiated Caco-2 Cells Monitored by MTS Method

Cell viability was measured after cell exposure to L-DOPA (Sigma-Aldrich, Saint Louis, MO, USA) by using MTS (3-(4,5-dimethylthiazol-2-yl)-5-(3-carboxymethoxyphenyl)-2-(4-sulfophenyl)-2H-tetrazolium), CellTiter96® AQueous One Solution Cell Proliferation Assay purchased from Promega (Promega, Madison, WI, USA). Briefly, the cells were seeded in transparent 96-well plates at a density of 5000/well and allowed to adhere for 24 h. The L-DOPA in the concentration range 0–200 µg/mL was added into culture media and incubated for 72 h. The medium with L-DOPA was next removed from all wells, and MTS diluted in fresh media was added for 2 h. The absorbance was measured next at 492 nm by the multifunctional plate reader Synergy H1 (BioTek, Winooski, VT, USA). The IC50 value and statistical significances were calculated by GraphPad Prism 8.0.1 (GraphPad Software, Inc., San Diego, CA, USA).

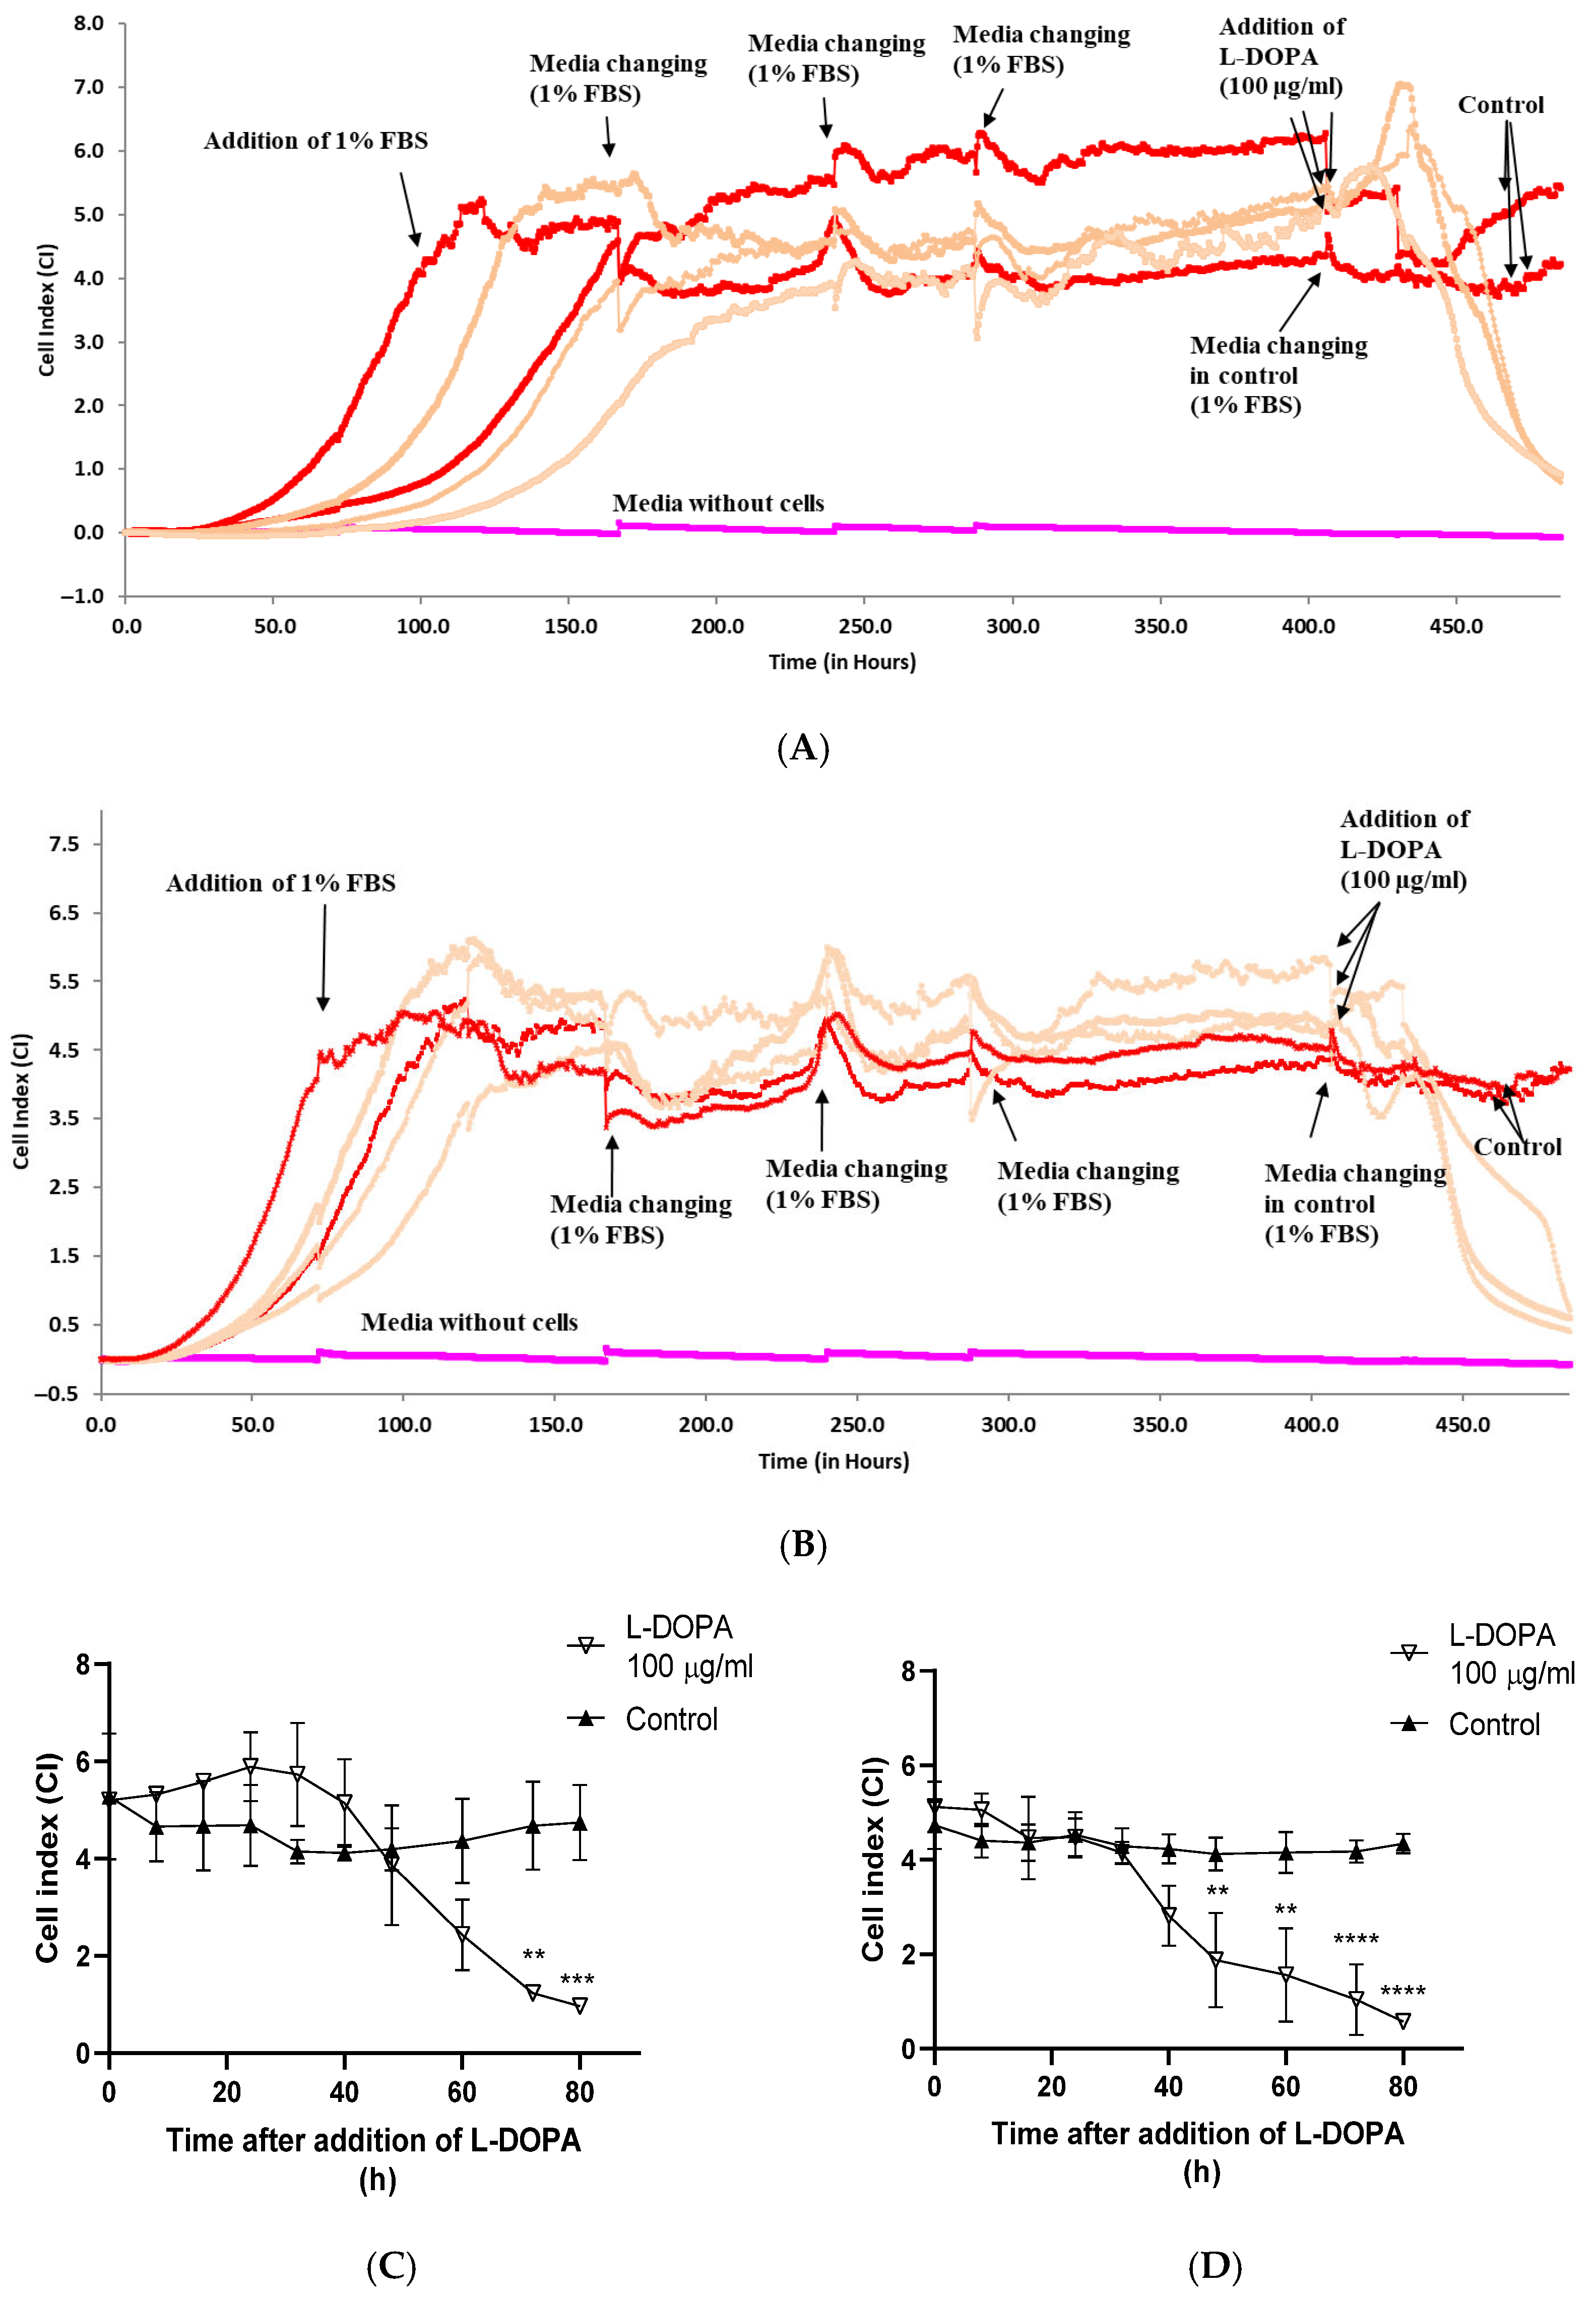
2.8. The Effect of L-DOPA on Differentiated Caco-2 Cells Monitored by xCELLigence RTCA S16

The preparation of cells and seeding procedure were similar to that described in Section 2.4. The Caco-2 cells were seeded at 2000 cells/wells in full media (20% of FBS). The media change from 20% to 1% FBS was performed at 75 h of incubation in the first independent experiment and 96 h in the second experiment. The fresh 1% FBS media were changed every 4–5 days of incubation. The Caco-2 cells were treated next with L-DOPA (100 µg/mL) at 406 h (first experiment) or 404 h (second experiment) of incubation (17 days post-seeding), and the CI was carefully monitored for the next 80 h. Sweep interval in the RTCA software was set to 30 min for 970 repetitions (485 h in total) in both experiments. The statistical significances were calculated by GraphPad Prism 8.0.1 (GraphPad Software, Inc., San Diego, CA, USA).

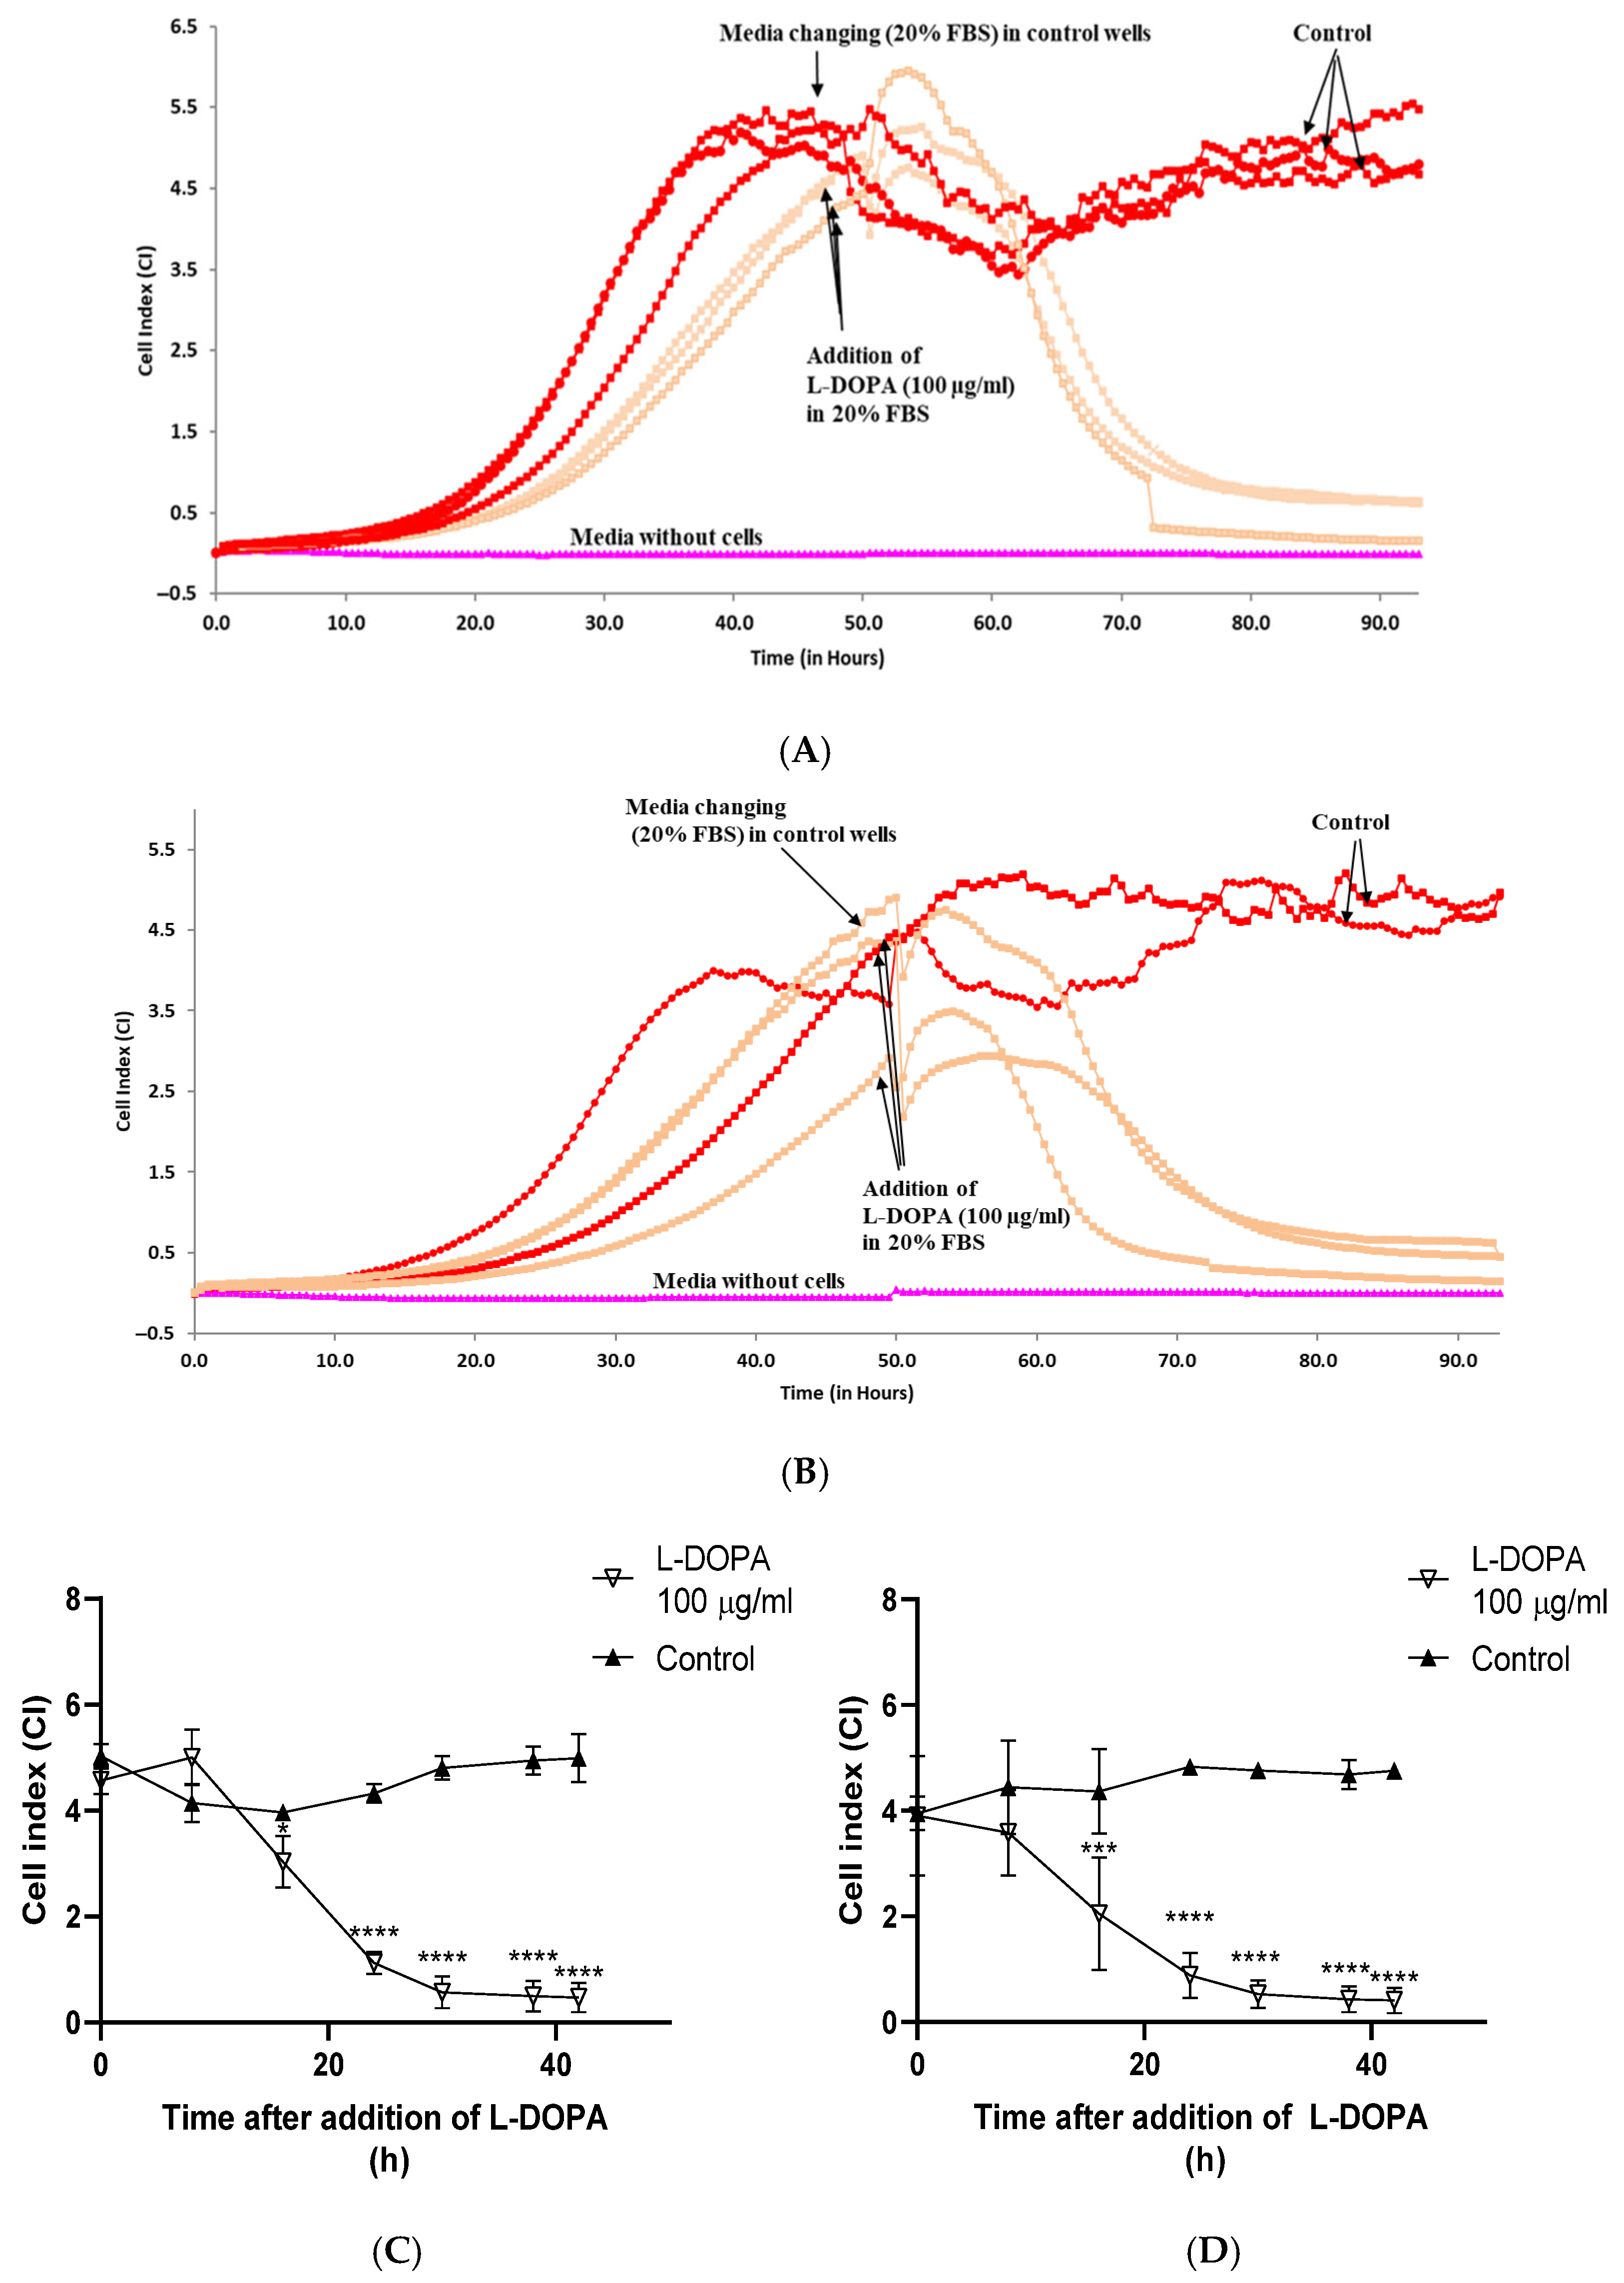
2.9. The Effect of L-DOPA on Undifferentiated Caco-2 Cells Monitored by xCELLigence RTCA S16

The preparation of cells and seeding procedure were similar to that described in Section 2.4. The Caco-2 cells were seeded at 20,000 cells/wells in full media (20% of FBS). The Caco-2 cells were treated next with L-DOPA (100 µg/mL in fresh media 20% of FBS) at 48 h and the CI was carefully monitored for next 48 h. Sweep interval in the RTCA software was set to 30 min for 192 repetitions (96 h in total) in both experiments. The statistical significances were calculated by GraphPad Prism 8.0.1 (GraphPad Software, Inc., San Diego, CA, USA).

3. Results

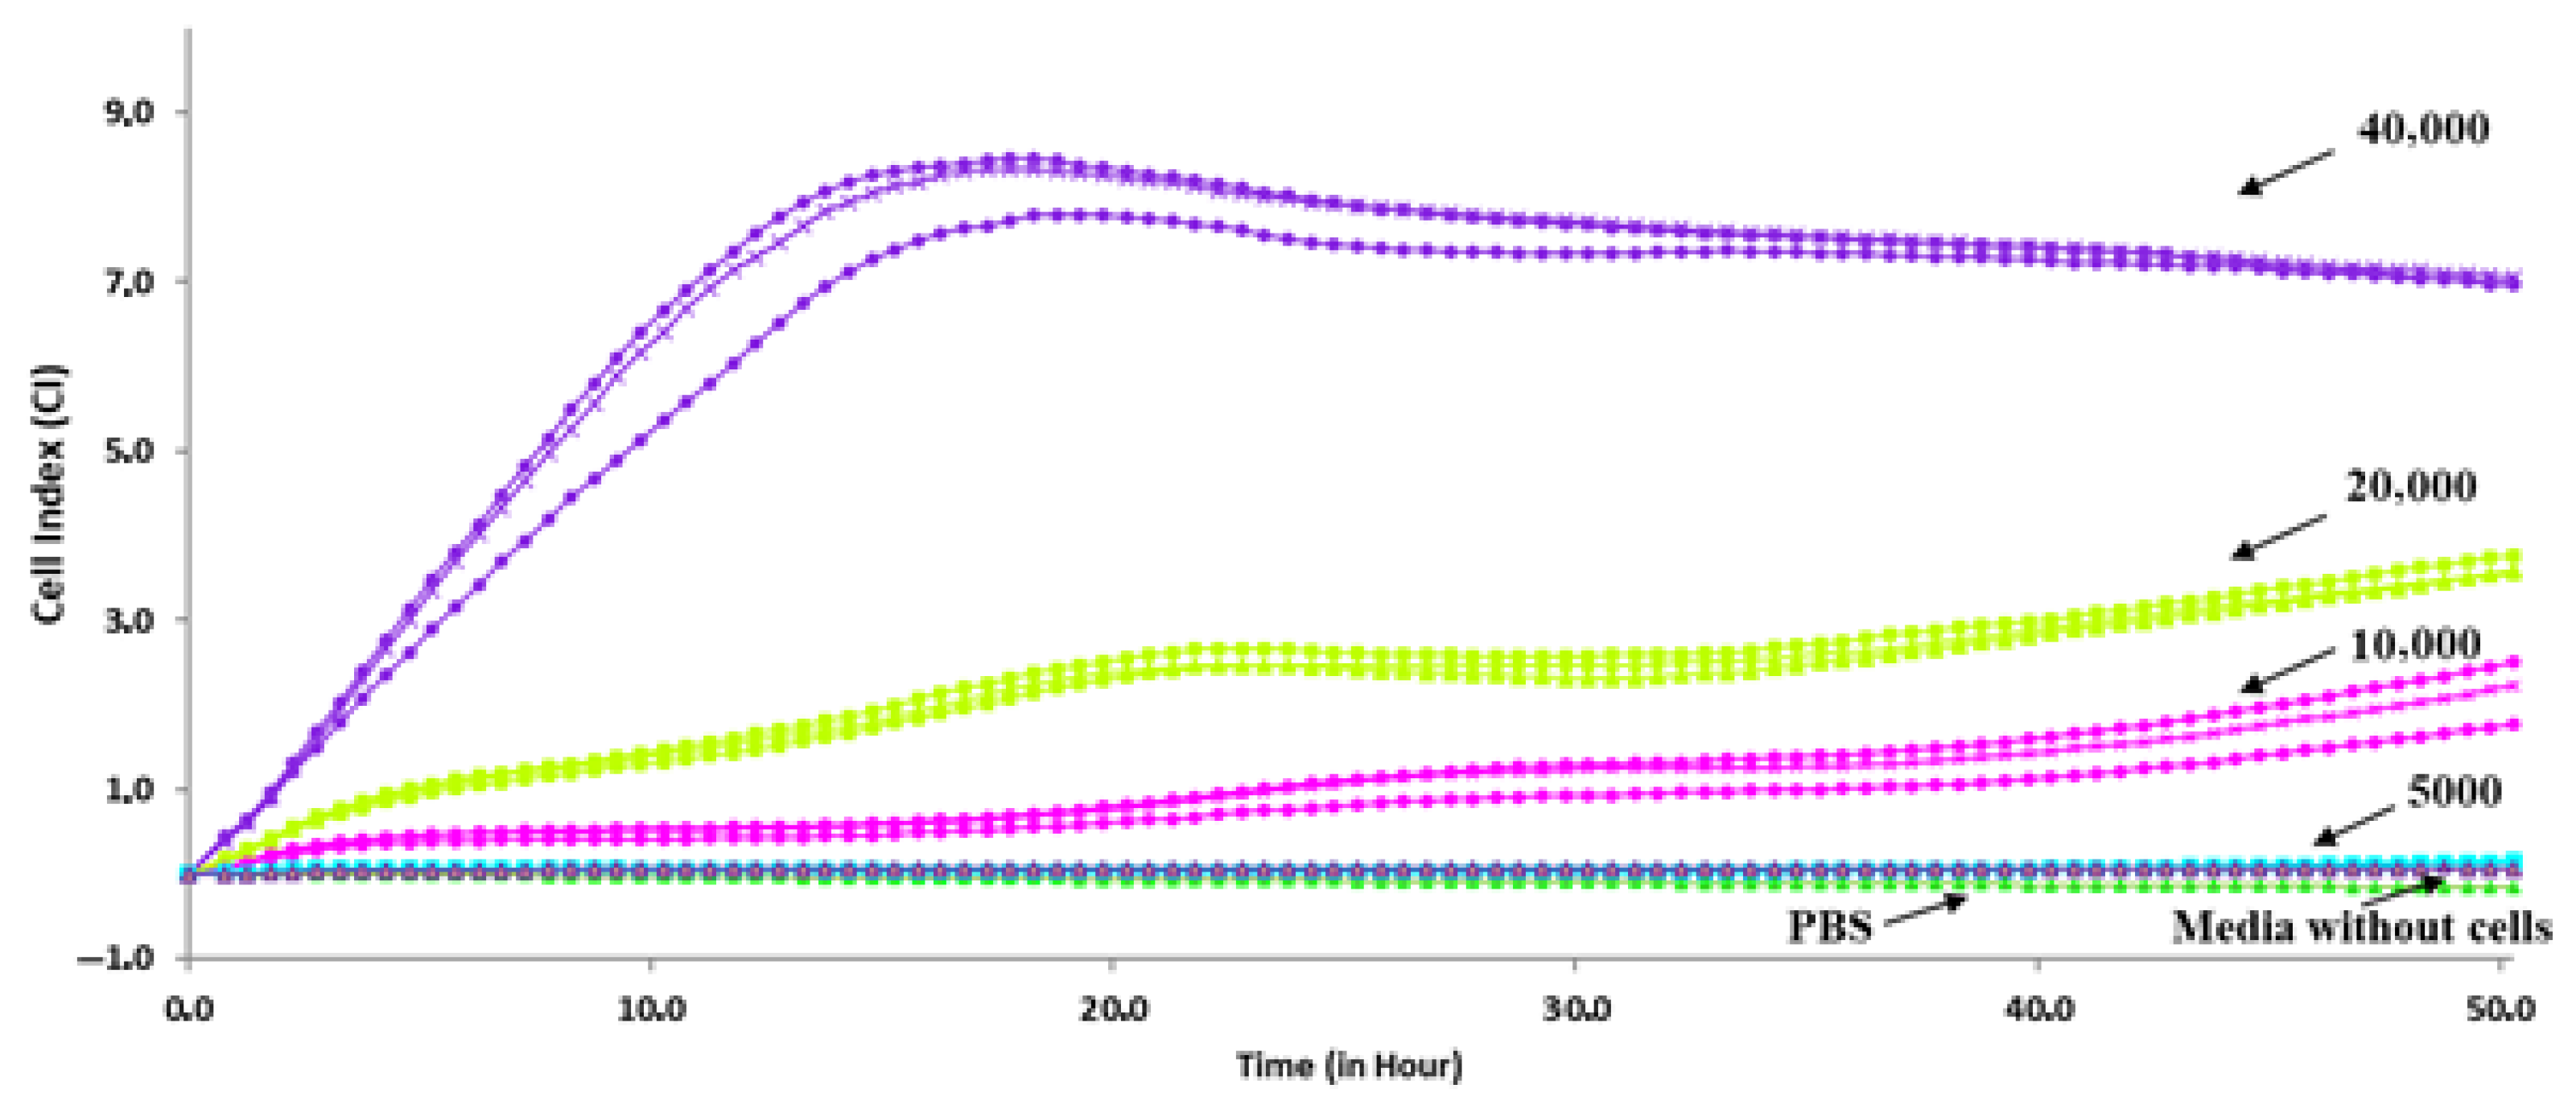
3.1. Determination of Optimal Density and FBS Concentrations for Caco-2 Cells Growth

The optimalization of Caco-2 cell cultivation on E-plate 16 started with the determination of suitable cell density for the long incubation necessary for their differentiation. To this purpose various concentrations of Caco-2 cells were cultured in a complete medium (20% of FBS) in E-plate 16 and the growth of cells was observed in real-time. Results showed that when Caco-2 cells were seeded in serial dilution, including 5000, 10,000, 20,000, and 40,000 cells per well in a complete medium, concentration-dependent curves with different CI values were recorded in real-time. The cut-off time of the experiment was 50 h. During the initial 18 h of seeding the cells in 40,000/well concentration, there was a pronounced increase in the CI with a value of 8.5 on the read-outs due to rapid exponential growth of cells, followed by a confluence of cells that indicates that the cells cannot increase further and thus form a plateau, as shown in Figure 2. The wells with Caco-2 cells in 20,000 concentrations showed a comparatively slower proliferation rate than 40,000 cells. The maximum CI value after 18 h of incubation reaches up only to 1.5. The wells with 10,000 concentrations of cells in the E-plate 16 showed a CI value of 0.5, and 5000 cells showed CI similar to the baselines after 18 h of the experiment and only slightly higher than baselines after 50 h. The overall results showed concentration-dependent adhesion, proliferation, and plateau (reached only for 40,000 cells) in real-time xCELLigence RTCA S16 (Figure 2).
Due to the fact that Caco-2 cells need for differentiation and TJ formation at least 17–18 days of incubation, we decided in the next experiment to seed the lowest tested amount of 5000/well (Figure 3A) [12]. Medium was changed every 72 h. In the first 48 h of cell seeding, Caco-2 cells started to adhere at the bottom of the gold-plated electrodes in each well of E-plate 16. The shape of the cells at this stage was spherical, and the total volume of medium in each well was 150 μL. In the next stage, the cells start the adhesion, followed by the proliferation stage, where the cells enter the rapid growth phase at around 120 h of incubation. It was observed by the device in real-time in the form of increasing CI values. When the cells reached maximum proliferation in the complete medium, a short plateau between 160 and 180 h of experiment was recorded due to the cells’ highest confluence, indicating the cells will no longer proliferate. The highest CI, around 5.0, was achieved at around 170 h of incubation. In the final stage of the experiment, the cells started to lose adhesion, which marked the cell death process, which ended after 310 h of incubation (Figure 3A).
Due to the unsatisfactory results of the experiment and the failure to obtain the required full cell viability after the recommended incubation time required for Caco-2 differentiation, we decided to repeat the study with seeding a smaller number of cells, i.e., 3000/well. Medium was changed again every 72 h. Similarly, various phases of cell kinetics were recorded, including adhesion, proliferation, plateau, and cell death, as shown in Figure 3B. The cell adhesion phase was observed between 0 and 120 h of incubation, comparably to the previous experiment for cells seeded at 5000/well. However, an extension of the proliferation phase was observed, and the cell culture reached a maximum CI of 4.5 after approximately 237 h of incubation. On the other hand, a similar too-short plateau period, lasting about 20 h, was noted. What is more, the significant drop in CI (~40%) was observed after the media changing procedure at 190 h. The cell death phase started at 240 h of incubation and finished around 350 h, 60 h later than in the previous assay (Figure 3).
Both experiments indicate that the proposed cell densities of 3000 and 5000/well and FBS concentration of 20% are inappropriate for investigation of fully differentiated Caco-2 cells; thus, we decided to decrease the cell density again to 2000/well together with incubation in media containing a low concentration of 1% FBS. As was shown in Figure 4, the cell adhesion phase was recorded between 0 and 160 h when the cells were incubated with 20% of FBS. The addition of fresh media with 20% of FBS at 165 h of incubation resulted in acceleration of proliferation and an increase in CI from around 1.0 to 3.0. Thus, in the middle of this fast proliferation state (190 h of post-seeding incubation), we decided to add 1% of FBS. It resulted in the decrease in CI back to 1.0, probably due to too dynamic change in media and FBS concentration recorded by sensitive microelectrodes, and next the cells entered the long proliferation phase. The cells reached a maximum CI of 4.5 after approximately 310 h of incubation. The plateau horizontal line was observed from 310 h up to 360 h of incubation when the experiment was terminated.
The experiment was repeated next under the same conditions, but the device was set up for a longer real-time monitoring of the cell growth, i.e., 660 h (27.5 days). As was shown in Figure 5A, the decreasing of cell density to 2000/well and replacement of 20% FBS with 1% in the middle of the proliferation phase seemed to resolve the problem of too short a plateau period and too early cell death. The media changing from 20% FBS to 1% FBS was performed more carefully again in the middle of the proliferation state at 190 h of incubation, when the cells reached CI = 6.0. This time the observed before CI fluctuations during media changing from 20 to 1% of FBS were not recorded. The fresh media with 1% FBS were next added every 3–4 days. The real-time CI indicated a formation of a monolayer of differentiated Caco-2 cells ready to perform the investigations of epithelial barrier functions after the desired 432 h (18 days) of incubation (Figure 5A). The viability of cells was also monitored and confirmed with bright-field microscopy (Figure 5B,C). The long plateau horizontal line was observed from 360 h of incubation up to 520 h. Next, the quick cell death phase was recorded, which ended at around 620–640 h of incubation. To confirm the formation of TJs in the XCELLigence device, the Caco-2 cells were stained in the next experiment directly on the E-16 plate after 425 h incubation post-seeding. The expression of a tight junction protein, namely occludin, is shown in Figure 5D.

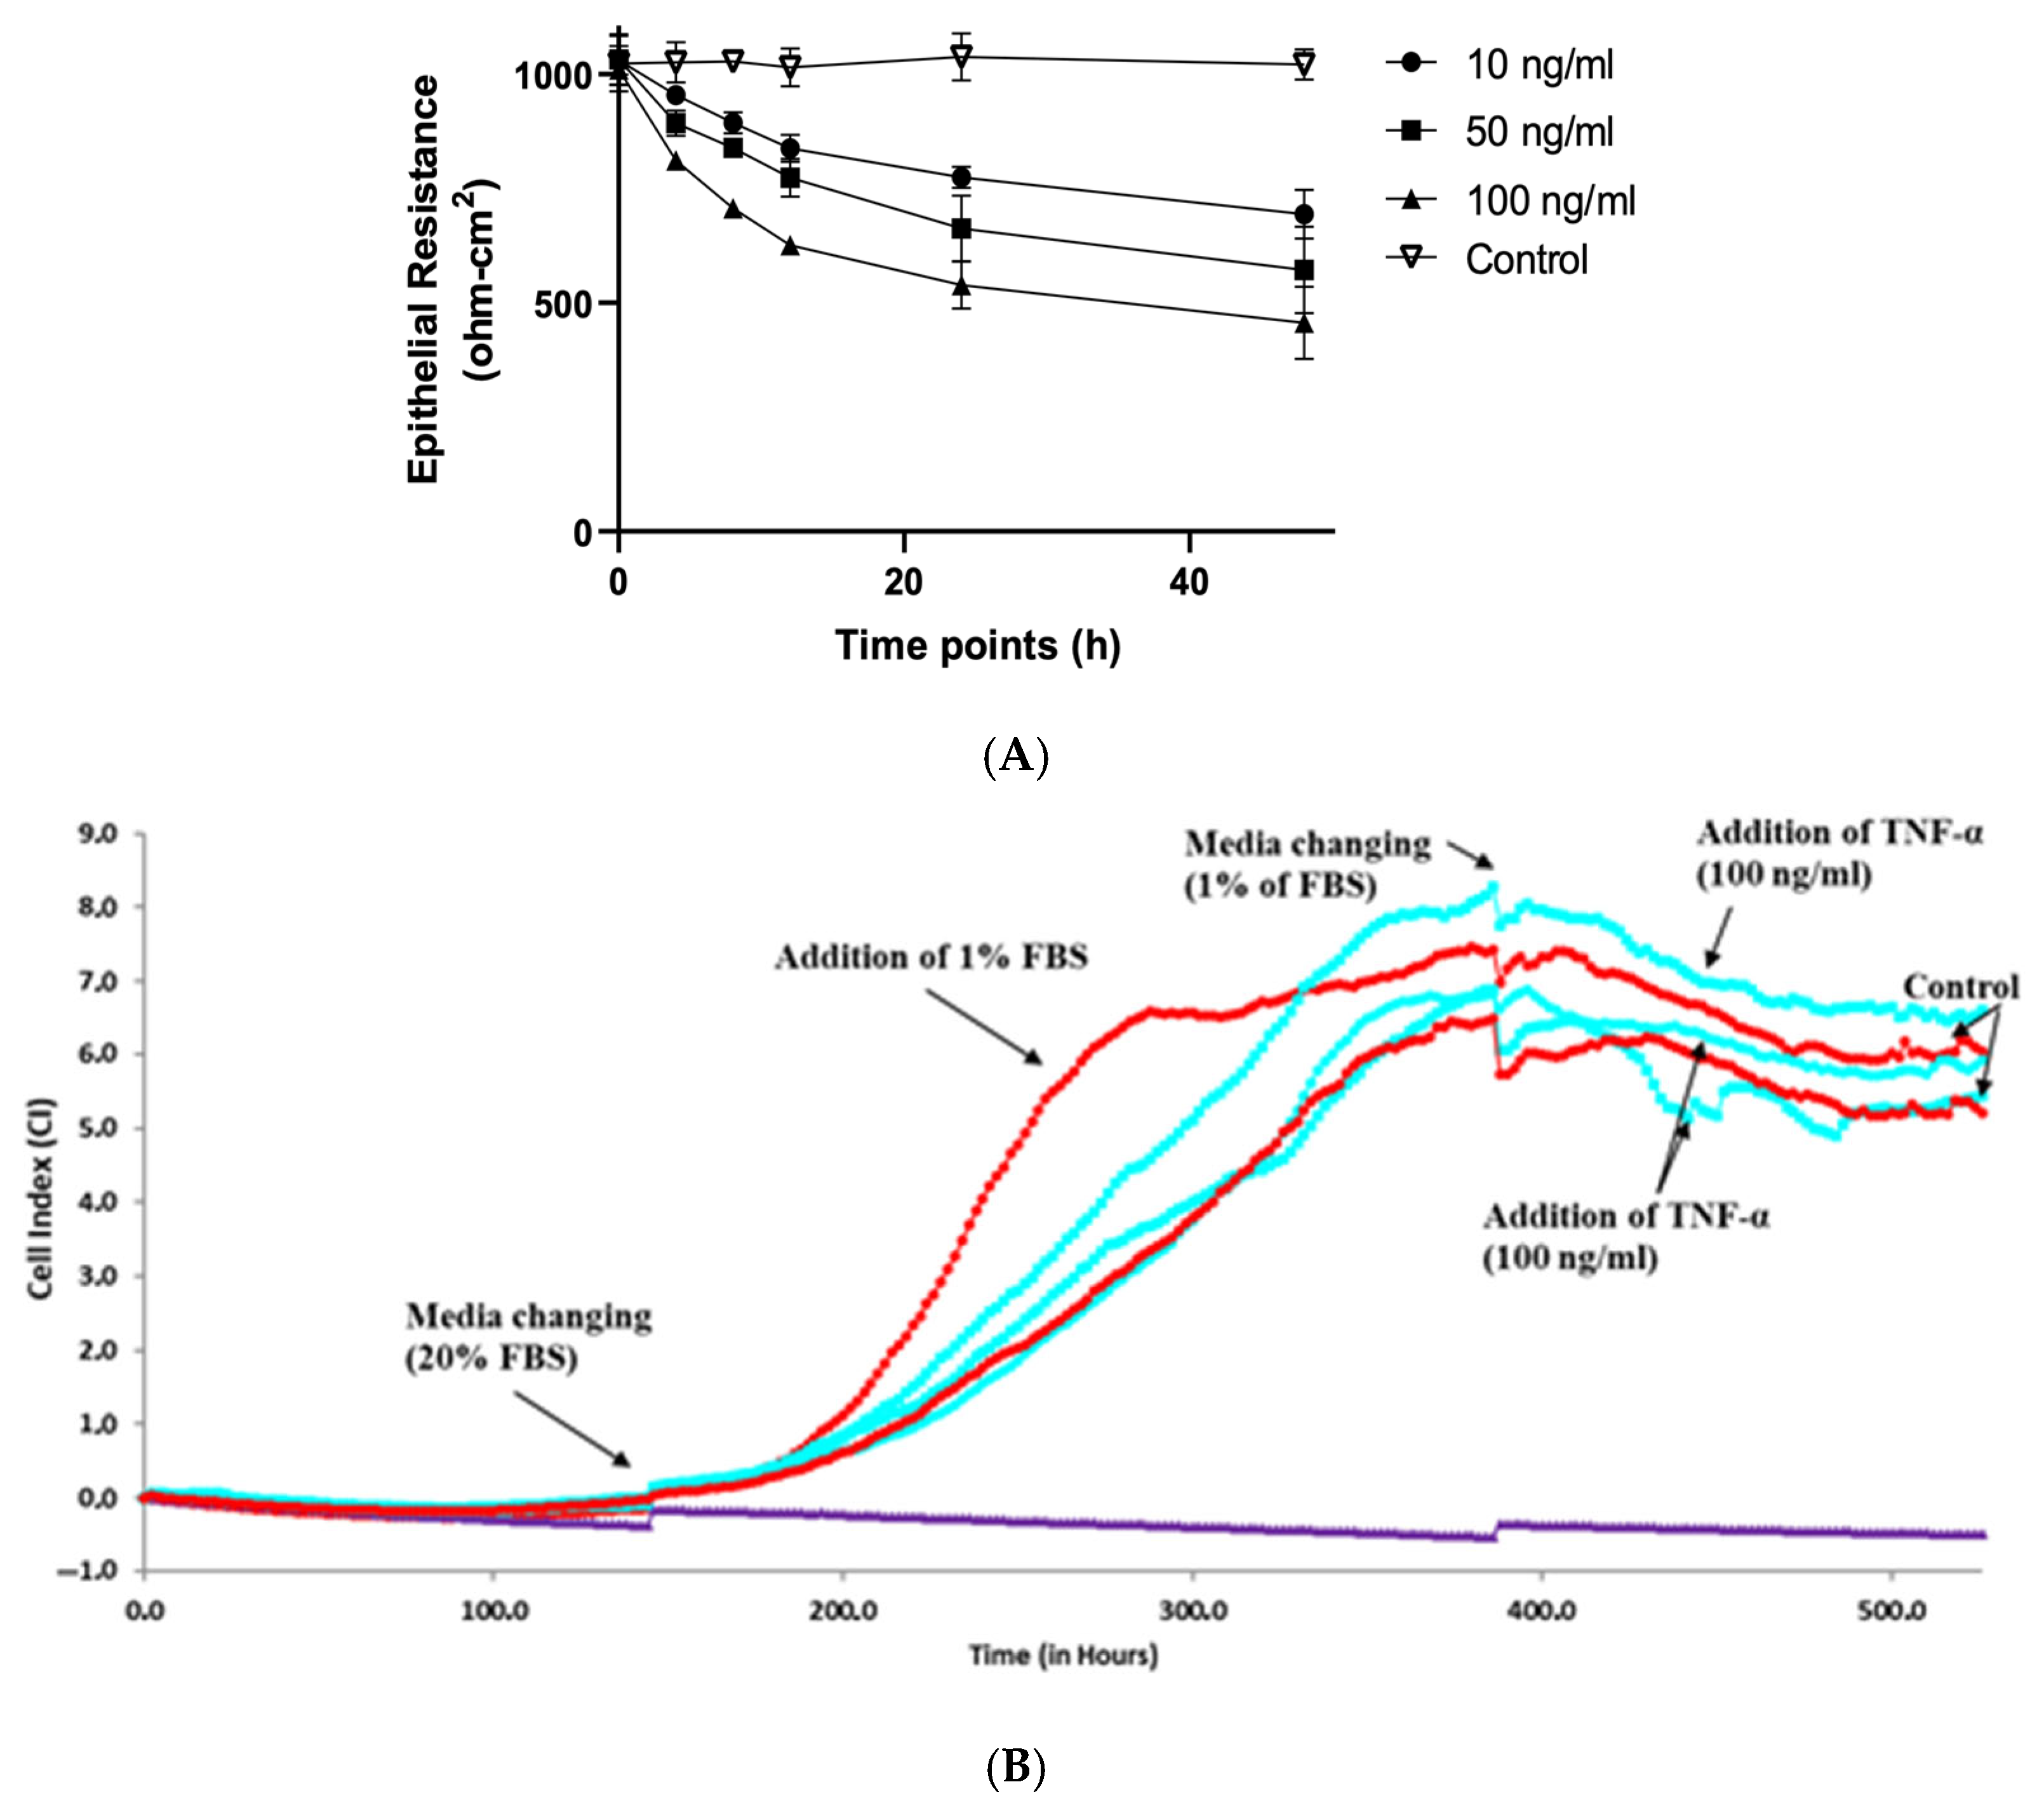
3.2. The Assessment of TNF-α Effect on Caco-2 Epithelial Barrier Function by xCELLigence RTCA S16

The loss of integrity of the monolayer as well as barrier functions of the human colorectal adenocarcinoma cell line Caco-2 are usually examined by the addition of a proinflammatory cytokine, TNF-α, in the apical compartments of the Transwell® plate. The cells require at least 18 days post-seeding on the Transwell® membrane before treatment with TNF-α to be fully confluent and to acquire the ability to fully express TJ proteins such as occludin or zonulin-1 (ZO-1) and to form TJs [12,21]. The TEER is measured by a voltohm meter every 24–48 h to ensure that the monolayer of cells acts as a barrier between the apical and the basolateral compartments. The TEER values are directly proportional to barrier integrity, suggesting that the highest values are reached as the cells proliferate and become confluent, indicating the tightness and intactness of the monolayer of Caco-2 cells. In our in-house experiments the TNF-α was added to apical compartment of Transwell® insert at 10, 50 and 100 ng/mL concentrations when the membrane resistance of cultivated Caco-2 cells reached around 1000 Ω. A dose-dependent decline of the resistance was observed next at different time points, such as 0, 4, 8, 12, 24, and 48 h, when compared to the control (Figure 6A). For the highest concentration of TNF-α, 100 ng/mL, a marked decrease in TEER value up to 500 Ω was measured at 48 h. Thus, we selected the highest used concentration of TNF-α (100 ng/mL) for the real-time assay on E-plate 16 in order to determine if the similar decline of impedance as was shown for TEER can also be recorded by xCELLigence RTCA S16. In this experiment Caco-2 cells (2000/well) were seeded in complete media on E-plate 16. The media change from 20% to 1% FBS was performed at 260 h of incubation. The cells reached confluence with a maximum CI at 385 h post-seeding. The Caco-2 cells were treated next with TNF-α (100 ng/mL) at 450 h of incubation (cyan curves). However, no significant decline in CI was recorded in real-time for 48 h after treatment with TNF-α. As was shown in Figure 6B, the real-time CI lines were comparable between control (red curves) and tested wells.

3.3. The Effect of L-DOPA on Viability of Differentiated Caco-2

L-DOPA is one of the compounds that are of wide interest to scientists in the context of its activity in the digestive system. In the intestinal epithelial cells, L-DOPA is converted by DOPA-decarboxylase to dopamine, which can act via dopamine receptors located in the gastrointestinal tract (GIT). The Caco-2 cell line is a well-established human intestinal cell model that has been used for years for investigating the gastrointestinal-related activity of a range of different biomolecules [12]. Although the toxicity of L-DOPA to Caco-2 cells was already tested, the applied protocol included the use of undifferentiated Caco-2 cells subjected to overnight culture prior to the toxicity experiment [22]. The authors used the standard MTT procedure in order to calculate the IC50 value for L-DOPA. The Caco-2 cells were incubated for the 72 h at the presence of different L-DOPA concentrations ranged from 0 to 120 µg/mL. As a result, the IC50 value calculated after 72 h exposure of Caco-2 cells to various doses of L-DOPA was 81.2 ± 4.81 µg/mL. Moreover, the level of released LDH was also tested and was around 180% of control (not treated cells) after incubation with 120 µg/mL of L-DOPA for 72 h [22].
In our in-house toxicity study, the L-DOPA was added first to undifferentiated cells (24 h post-seeding) in the following range of concentrations: 0.1, 1, 5, 10, 100, and 200 µg/mL. The viability of cells was assessed next using the MTS procedure after 72 h of incubation (Figure 7). The calculated from our study IC50 value was 59.47 µg/mL and was comparable to the literature [22].
For real-time evaluation of the L-DOPA activity against differentiated Caco-2 cells, we followed the previously optimized procedure with cells seeded in the concentration of 2000 cells per well and incubated in 20% FBS during adhesion and early proliferation phases (Figure 5A). The media changing from 20% to 1% FBS was performed at 75 h or 96 h of incubation (Figure 8). In both experiments the cells reached the highest confluence with a maximum CI between 3.5 and 5.5. The Caco-2 cells were treated next with L-DOPA (100 µg/mL) at either 406 h (first experiment, Figure 8A) or 404 h of incubation (second experiment, Figure 8B). In the first experiment, the quick decline was noticed within 72 h of treatment with L-DOPA, confirming its toxicity against Caco-2 cells in the used dose of 100 µg/mL (Figure 8A). The toxic effect of L-DOPA on cells started around 60 h from the addition. The similar loss of viability was observed in the repeated independent experiment (Figure 8B). However, the real-time toxic effect of L-DOPA on cells was observed earlier than in the previous experiment, at around 40 h from the addition. The comparison of CI curves and the statistical analysis after the addition of L-DOPA (100 µg/mL) are shown in Figure 8C,D. The temporary increase in CI immediately after the addition of L-DOPA was observed only in the first experiment (Figure 8A). Therefore, we suspect that this effect may be not directly related to cells but rather to high concentration of the tested compound introduced to E-plate 16 in fresh media and the response of highly sensitive gold electrodes on the rapid changes in environment, such as it was observed during media changing in the previous experiments (Figure 4, Figure 5 and Figure 6).
A similar experiment was performed in order to compare the real-time effect of L-DOPA (100 µg/mL) between differentiated and undifferentiated Caco-2 cells. Cells were seeded at 20,000 cells/well and incubated only for 48 h before the treatment in full media with 20% of FBS (Figure 9A,B). The effect of L-DOPA was observed much quicker in comparison to the previous experiments with differentiated cells (Figure 8 and Figure 9). The significant decrease in CI was observed even after 16–18 h after treatment (Figure 9C,D), whereas for differentiated cells it was after 40–50 h (Figure 8B,C). The effect for undifferentiated cells was similar between the two independent experiments (Figure 9C,D). The temporary fluctuations in CI immediately after the addition of L-DOPA were observed in both experiments.

4. Discussion

The purpose of this work was to optimize preparation of a Caco-2 monolayer with fully differentiated cells ready for real-time investigation of epithelial barrier and viability by the xCELLigence RTCA S16 device. Although the xCELLigence real-time system was already used to study the integrity of the Caco-2 membrane, the data provided by the authors of this study were insufficient—i.e., no information about total post-seeding incubation time of Caco-2 cells, number of seeded cells, exact time of media change, or type of used E-plate were given [16]. Here we propose a complete and replicable protocol to study fully differentiated Caco-2 cells cultivated on E-plate 16. Cells should be seeded in the concentration of 2000 cells per well in cell culture medium supplemented with 20% fetal bovine serum (FBS) until the proliferation state is reached. Next, the old media should be replaced by fresh cell culture medium supplemented with 1% FBS. Cells should be incubated at least 17–18 days post-seeding to be differentiated and ready for experiments, as it is recommended in the literature [12]. The real-time analysis measured by xCELLigence system showed that long and stable horizontal line of the confluent cells was reached (Figure 5A). What is more, the staining procedure successfully confirmed the expression of occludin, a transmembrane protein that regulates the permeability of epithelial barriers [21], and, thus, the presence of TJs in Caco-2 cells cultivated on E-plate 16 (Figure 5D). The cells also showed a high cellular index (CI) and were ready for subsequent/other experiments after around 17–18 days post-seeding. According to our observations, a decrease in the CI curve was directly related to their death, detachment, and change in shape, which could be clearly observed under a microscope. Thus, we confirmed that the xCELLigence Real-Time Cell Analyzer (RTCA), a non-invasive, impedance-based biosensor system can indeed measure Caco-2 cells’ viability, growth, proliferation, and differentiation. The CI changes in time were summarized in Table 1.
The major advantages of this system include the following: rapid, effortless, and continuous detection of cell kinetics and quality attachment in real-time with high sensitivity, accuracy, and reproducibility as compared to the standard TEER protocol. One should remember that since RTCA uses microelectrodes embedded in a cell culture plate to measure changes in electrical impedance as cells attach, grow, and interact with the surface, measurements can be affected by electroactive compounds added to the media. Thus, according to our observations, the tested substances should be added carefully, directly to the old media on E-plate 16, in order to avoid the fluctuation of CI. It should also be mentioned that according to the manufacturer’s recommendation, E-plates are disposable after a single use, yet it was already reported that E-plates can be successfully regenerated and reused several times without significantly affecting experimental results [23]. What is more, we expect that the xCELLigence RTCA S16 system could be used for other epithelial cell models. We recommend starting the optimization procedure as described above, namely: (1) selecting the appropriate cell seeding density; (2) monitoring the CI (cell index) curves, with particular attention to the duration of the plateau phase—where most experiments are typically conducted; and (3) reducing the FBS concentration (if necessary) during the mid-proliferation stage.
Furthermore, membrane integrity (i.e., the presence of a functional, polarized monolayer) was tested with the use of TNF-α (100 ng/mL), and the results were compared to the classic TEER method [20]. However, no significant decline in electrical impedance—expected as a result of the TNF-α effect on TJs and membrane integrity of Caco-2 cells—was observed using the xCELLigence RTCA S16 (Figure 6). Thus, the used device is inadequate for the assessment of the integrity of a polarized Caco-2 cells’ monolayer as compared to the TEER method. Another disadvantage of the xCELLigence RTCA S16 is that the system does not allow for compartmentalization into distinct apical and basolateral regions of the monolayer for polarization studies. Our final experiment involved incubation with 1% FBS and treatment of fully differentiated Caco-2 cells with a high dose of L-DOPA (100 µg/mL). According to the literature, this concentration has been reported to be toxic to undifferentiated Caco-2 cells [22]. This effect was similar in our in-house MTS cytotoxicity test (Figure 7). Our next real-time experiments also confirmed the cytotoxic effect of L-DOPA on Caco-2 cells cultured for at least 17 days post-seeding. Based on these findings, we propose that the described protocol using the xCELLigence RTCA S16 system is suitable for real-time assessment of the effects of test compounds on the viability of fully differentiated Caco-2 cells. Yet, the mechanisms of action on enterocytes of the abovementioned compounds, namely TNF-α and L-DOPA differ, too. TNF-α is known for its strong proinflammatory potential and to disrupt tight junctions [24]. TNF-α impairs the TJ function by activating the NF-κB pathway and reducing ZO-1 production [25]. For differentiated Caco-2 monolayers, using TNF-α around 10–100 ng/mL is typical for permeability or junctional disruption studies, and only partial toxicity can be expected at ~300 ng/mL [26]. L-DOPA, due to its auto-oxidation to highly reactive quinones and semiquinones as well as reactive oxygen species, can cause damage to cellular components (including mitochondria) and lead to cell death in vitro, especially in non-dopaminergic neurons [27]. Furthermore, due to the fact that Caco-2 cells can convert L-DOPA to dopamine (DOPA decarboxylase is present and measurable) [28], auto-oxidation can also lead to the formation of dopamine-derived quinones and subsequent mitochondrial membrane depolarization, ATP synthesis inhibition, and caspase-mediated apoptosis [29]. Differentiated Caco-2 cells exhibit key characteristics like the formation of tight junctions, microvilli, and expression of enterocyte-specific proteins, all of which contribute to a functional intestinal barrier. Undifferentiated Caco-2 cells express very low levels of enterocyte-specific enzymes [30], are characterized by decreased expression of intestinal transporters [31], and thus are more prone to toxicity, which could explain the difference in the cellular index in differentiated vs. undifferentiated Caco-2 cells treated by a high dose of L-DOPA on E plate 16 (Figure 8 and Figure 9).
In summary, the TEER method is a valuable tool for studying the integrity and function of cellular barriers, while the xCELLigence RTCA S16 system can provide a continuous assessment of cell behavior in response to various stimuli (Table 2). The choice between these two techniques should depend on the specific research question being investigated; however, they could also be used in parallel.

Author Contributions

Conceptualization and methodology, G.L.; in vitro studies with Caco-2 cells, N.K., M.K. and G.L.; original draft preparation, N.K., M.K.-Ł. and G.L.; writing—review and editing, M.K.-Ł., G.L. and K.G.; supervision G.L. and K.G. All authors have read and agreed to the published version of the manuscript.

Funding

This research was funded by the Priority Research Area qLife under the program “Excellence Initiative—Research University” at the Jagiellonian University in Krakow (U1C/P04/NO/01.02) and statutory grant from Jagiellonian University Medical College N41/DBS/001348.

Institutional Review Board Statement

Not applicable.

Informed Consent Statement

Not applicable.

Data Availability Statement

No new data were created or analyzed in this study. Data sharing is not applicable to this article.

Acknowledgments

This research was carried out with the use of research infrastructure co-financed by the Smart Growth Operational Programme POIR 4.2, project no. POIR.04.02.00-00-D023/2.

Conflicts of Interest

The authors declare no conflicts of interest.

Abbreviations

The following abbreviations are used in this manuscript:
CIcell (cellular) index
GITgastrointestinal tract
IBCAimpedance-based cellular assay
RTCAreal time cell analyzer
TJstight junctions
TEERtrans-epithelial electrical resistance

References

  1. Shane, H.M.; Ung, B.; Bader, C.; Brooks, R.; Lazniewska, J.; Johnson, I.R.D.; Sorvina, A.; Logan, J.; Martini, C.; Moore, C.R.; et al. Fluorescence microscopy-an outline of hardware, biological handling, and fluorophore considerations. Cells 2022, 11, 35. [Google Scholar]
  2. Möller, C.; Slack, M. Impact of new technologies for cellular screening along the drug value chain. Drug. Discov. Today 2010, 15, 384–390. [Google Scholar] [CrossRef]
  3. Hamidi, H.; Lilja, J.; Ivaska, J. Using xCELLigence RTCA instrument to measure cell adhesion. Bio-Protocol 2017, 7, e2646. [Google Scholar] [CrossRef]
  4. Hillger, J.M.; Lieuw, W.L.; Heitman, L.H.; IJzerman, A.P. Label-free technology and patient cells: From early drug development to precision medicine. Drug Discov. Today. 2017, 22, 1808–1815. [Google Scholar] [CrossRef]
  5. McGuinness, R. Impedance-based cellular assay technologies: Recent advances, future promise. Curr. Opin. Pharmacol. 2007, 7, 535–540. [Google Scholar] [CrossRef]
  6. Farquhar, M.G.; Palade, G.E. Junctional complexes in various epithelia. J. Cell Biol. 1963, 17, 375–412. [Google Scholar] [CrossRef]
  7. Staehelin, A.L. Three types of gap junctions interconnecting intestinal epithelial cells visualized by freeze-etching. Proc. Natl. Acad. Sci. USA 1972, 69, 1318–1321. [Google Scholar] [CrossRef]
  8. Förster, C. Tight junctions and the modulation of barrier function in disease. Histochem. Cell Biol. 2008, 130, 55–70. [Google Scholar] [CrossRef]
  9. Harhaj, N.S.; Davis, A.A. Regulation of tight junctions and loss of barrier function in pathophysiology. Int. J. Biochem. Cell Biol. 2004, 36, 1206–1237. [Google Scholar] [CrossRef] [PubMed]
  10. Furuse, M.; Hirase, T.; Itoh, M.; Nagafuchi, A.; Yonemura, S.; Tsukita, S.; Tsukita, S. Occludin: A novel integral membrane protein localizing at tight junctions. J. Cell Biol. 1993, 123, 1777–1788. [Google Scholar] [CrossRef] [PubMed]
  11. Lopez-Escalera, S.; Wellejus, A. Evaluation of Caco-2 and human intestinal epithelial cells as in vitro models of colonic and small intestinal integrity. Biochem. Biophys. Rep. 2022, 31, 101314. [Google Scholar] [CrossRef]
  12. Lea, T. Caco-2 Cell Line. The Impact of Food Bioactives on Health: In Vitro and Ex Vivo Models; Springer: Berlin/Heidelberg, Germany, 2015; pp. 103–111. [Google Scholar]
  13. Benson, K.; Cramer, C.; Galla, H.J. Impedance-based cell monitoring: Barrier properties and beyond. Fluids Barriers CNS 2013, 10, 5. [Google Scholar] [CrossRef] [PubMed]
  14. Kho, D.; MacDonald, C.; Johnson, R.; Unsworth, C.P.; O’Carroll, S.J.; du Mez, E.; Angel, C.E.; Graham, E.S. Application of xcelligence RTCA biosensor technology for revealing the profile and window of drug responsiveness in real time. Biosensors 2015, 5, 199–222. [Google Scholar] [CrossRef]
  15. Morgan, K.; Gamal, W.; Samuel, K.; Morley, S.D.; Hayes, P.C.; Bagnaninchi, P.; Plevris, J.N. Application of impedance-based techniques in hepatology research. J. Clin. Med. 2020, 9, 50. [Google Scholar] [CrossRef]
  16. Sun, M.; Fu, H.; Cheng, H.; Cao, Q.; Zhao, Y.; Mou, X.; Zhang, X.; Liu, X.; Ke, Y. A dynamic real-time method for monitoring epithelial barrier function in vitro. Anal. Biochem. 2012, 425, 96–103. [Google Scholar] [CrossRef]
  17. Hidalgo, I.J.; Raub, T.J.; Borchardt, R.T. Characterization of the human colon carcinoma cell line (Caco-2) as a model system for intestinal epithelial permeability. Gastroenterology 1989, 96, 736–749. [Google Scholar] [CrossRef]
  18. Pinto, M.; Robine-Leon, S.; Appay, M.D.; Kedinger, M.; Triadou, N.; Dussaulx, E.; Lacroix, B.J.; Fogh, S.A.; Haffen, K.; Fogh, J.; et al. Enterocyte-like differentiation and polarization of the human-colon carcinoma cell-line Caco-2 in culture. Biol. Cell. 1983, 47, 323–330. [Google Scholar]
  19. Ferruzza, S.; Rossi, C.; Scarino, M.L.; Sambuy, Y. A protocol for differentiation of human intestinal Caco-2 cells in asymmetric serum-containing medium. Toxicol. In Vitro 2012, 26, 1252–1255. [Google Scholar] [CrossRef]
  20. Cui, W.; Li, L.X.; Sun, C.M.; Wen, Y.; Zhou, Y.; Dong, Y.L.; Liu, P. Tumor necrosis factor alpha increases epithelial barrier permeability by disrupting tight junctions in Caco-2 cells. Braz. J. Med. Biol. Res. 2010, 43, 330–337. [Google Scholar] [CrossRef] [PubMed]
  21. Blasig, I.E.; Bellmann, C.; Cording, J.; Del Vecchio, G.; Zwanziger, D.; Huber, O.; Haseloff, R.F. Occludin protein family: Oxidative stress and reducing conditions. Antioxid. Redox Signal. 2011, 15, 1195–1219. [Google Scholar] [CrossRef]
  22. Balas, M.; Dumitrache, F.; Badea, M.A.; Fleaca, C.; Badoi, A.; Tanasa, E.; Dinischiotu, A. Coating dependent in vitro biocompatibility of new Fe-Si Nanoparticles. Nanomaterials 2018, 8, 495. [Google Scholar] [CrossRef]
  23. Stefanowicz-Hajduk, J.; Adamska, A.; Bartoszewski, R.; Ochocka, J.R. Reuse of E-plate cell sensor arrays in the xCELLigence Real-Time Cell Analyzer. BioTechniques 2016, 61, 117–122. [Google Scholar] [CrossRef]
  24. Lee, B.; Moon, K.M.; Kim, C.Y. Tight Junction in the Intestinal Epithelium: Its Association with Diseases and Regulation by Phytochemicals. J. Immunol. Res. 2018, 16, 2645465. [Google Scholar] [CrossRef] [PubMed]
  25. Ma, T.; Iwamoto, G.K.; Hoa, N.T.; Akotia, V.; Pedram, A.; Boivin, M.A.; Said, H.M. TNF-alpha-induced increase in intestinal epithelial tight junction permeability requires NF-kappa B activation. Am. J. Physiol. Gastrointest. Liver. Physiol. 2004, 286, G367–G376. [Google Scholar] [CrossRef]
  26. Couto, M.R.; Andrade, N.; Magro, F.; Martel, F. Bile salts and proinflammatory cytokines inhibit MCT1-mediated cellular uptake of butyrate and interfere with its antiproliferative properties. Exp Cell Res. 2023, 429, 113670. [Google Scholar] [CrossRef] [PubMed]
  27. Pardo, B.; Mena, M.A.; Casarejos, M.J.; Paíno, C.L.; De Yébenes, J.G. Toxic effects of L-DOPA on mesencephalic cell cultures: Protection with antioxidants. Brain Res. 1995, 682, 133–143. [Google Scholar] [CrossRef]
  28. Vieira-Coelho, M.A.; Soares-Da-Silva, P. Uptake and intracellular fate of L-DOPA in a human intestinal epithelial cell line: Caco-2. Am J Physiol. 1998, 275, C104–C112. [Google Scholar] [CrossRef]
  29. Jana, S.; Sinha, M.; Chanda, D.; Roy, T.; Banerjee, K.; Munshi, S.; Patro, B.S.; Chakrabarti, S. Mitochondrial dysfunction mediated by quinone oxidation products of dopamine: Implications in dopamine cytotoxicity and pathogenesis of Parkinson’s disease. Biochim. Biophys. Acta. 2011, 1812, 663–673. [Google Scholar] [CrossRef] [PubMed]
  30. Engle, M.J.; Goetz, G.S.; Alpers, D.H. Caco-2 cells express a combination of colonocyte and enterocyte phenotypes. J. Cell. Physiol. 1998, 174, 362–369. [Google Scholar] [CrossRef]
  31. Maubon, N.; Le Vee, M.; Fossati, L.; Audry, M.; Le Ferrec, E.; Bolze, S.; Fardel, O. Analysis of drug transporter expression in human intestinal Caco-2 cells by real-time PCR. Fundam. Clin. Pharmacol. 2007, 21, 659–663. [Google Scholar] [CrossRef]
Figure 1. Schematic representation of current flow in the RTCA system. Cells are grown on working electrodes, and the AC current flows under the working electrode (A). The Caco-2 cells on E-plate 16 after 9 days of incubation (B). The formation of a monolayer was observed by Leica DMi8 microscopy (10×). The cells were seeded in the concentration of 2000 cells/well and incubated in 20% FBS-containing media for the first 6 days and for the next 8 days in 1% FBS. At the bottom of the E-plate 16, there are both electrodes and a biosensor-free window that facilitates microscopic visualization of cells and correlates electronic signals with morphological changes in cells, which can be observed under a microscope. The electrode diameter is approximately 90 µm and is marked on the Figure 1B.
Applsci 15 08298 g001
Figure 2. Optimization of initial concentration of cells. Different CI curves were recorded by xCELLigence RTCA S16 from different densities of Caco-2 cells cultivated in full media containing 20% FBS. The baselines include media only, representing no cells and PBS.
Applsci 15 08298 g002
Figure 3. The CI curves of Caco-2 seeded with cell density 5000/well (blue lines) (A) and 3000/well (red lines) (B) and cultured for 360 h (15 days) in full media (20% of FBS). The baselines include a cell-free medium well (violet) and PBS (green).
Applsci 15 08298 g003
Figure 4. The CI curve of Caco-2 with cell density 2000/well cultured for 360 h in full media (20% of FBS), which were replaced next by 1% of FBS at 190 h of incubation (red lines). The baselines include a cell-free medium well (violet) and PBS (green).
Applsci 15 08298 g004
Figure 5. The CI curve of Caco-2 with cell density 2000/well cultured for 660 h (A). The cells were incubated in full media (20% of FBS) which were replaced next by 1% of FBS at 190 h (red lines). The baselines include a cell-free medium well (violet) and PBS (green). The Caco-2 cells on E-plate 16 after 120 h (5 days) (B) and 336 h (14 days) (C) of incubation. The formation of a monolayer was observed by Leica DMi8 microscopy (10×). The cells were seeded in the concentration of 2000 cells/well and incubated in 20% FBS-containing media for the first 6 days and then for 8 days in 1% FBS. Representative photomicrograph of Caco-2 cells stained on an E-16 plate for occludin (red, Alexa Fluor 564), Leica DMi8 (20×) (D).
Applsci 15 08298 g005
Figure 6. Concentration and time-dependent inhibitory effect of TNF-α on epithelial resistance of the monolayer of Caco-2 cells. Data from one experiment in triplicate (A). The CI curves of Caco-2 with cell density 2000/well treated by 100 ng/mL of TNF-α at 450 h (cyan). Untreated, control cells were marked by red. The cells were incubated in full media (20% of FBS) which were replaced next by 1% of FBS at 260 h. The baseline (violet) includes a cell-free medium well. Data from one experiment in triplicate (B).
Applsci 15 08298 g006
Figure 7. The effect of L-DOPA on undifferentiated Caco-2 cell line viability after 72 h of incubation at 37 °C and 5% CO2. The statistical significance (GraphPad Prism 8.0.1) was evaluated by a one-way ANOVA, followed by Dunett’s Comparison Test (* p < 0.05, **** p < 0.0001 compared with negative control DMSO 1% in growth media).
Applsci 15 08298 g007
Figure 8. The CI curves of Caco-2 with cell density 2000/well treated by 100 µg/mL of L-DOPA (pale pink). Untreated, control cells were marked by red. The cells were incubated in full media (20% of FBS), which was replaced next by 1% of FBS at 75 h or 96 h incubation. The baselines include a cell-free medium well (violet) (first independent experiment (A) and second independent experiment (B). The comparison of CI curves after addition of L-DOPA (100 µg/mL) to differentiated Caco-2 cells (17 days post-seeding) (first independent experiment, (C) second independent experiment, (D). The statistical analysis was calculated using one-way ANOVA followed by Dunett’s Comparison Test: ** p < 0.01, *** p < 0.001, **** p < 0.0001 vs. negative control.
Applsci 15 08298 g008
Figure 9. The CI curves of Caco-2 with the cell density 20,000/well treated by 100 µg/mL of L-DOPA (pale pink). Untreated, control cells were marked by red. The cells were incubated in full media only (20% of FBS). The baselines include a cell-free medium well (violet) first independent experiment (A) and second independent experiment (B). The comparison of CI curves after the addition of L-DOPA (100 µg/mL) to undifferentiated Caco-2 cells (48 h post-seeding) in the first independent experiment (C) and second independent experiment (D). The statistical analysis was calculated using One-way ANOVA followed by Dunett’s Comparison Test: *** p < 0.001, **** p < 0.0001 vs. negative control.
Applsci 15 08298 g009
Table 1. Changes in observed CI values depending on the cell-growth phase.
Cell Growth PhaseCell
Adhesion
DifferentiationConfluency/
Plateau
Physiological
Cell Death
Fluctuations upon Addition of Fresh MediaFluctuations upon Addition of L-DOPA
Observed CI or changes in CIBetween
0–1.0
Start: 0.5–1.0
End: 4.0–8.5
Between 4.0 and 8.5Start: 4.0–8.5
End: 0.0–0.5
max. ± 2.0
(± 40%)
max +2.0
(+40%)
Table 2. A brief comparison between Transepithelial Electrical Resistance (TEER) and xCELLigence RTCA Real-Time Cell Analyzer (RTCA) S16 techniques.
TEERxCELLigence RTCA S16
Method of measurementElectrical resistance across a cell monolayerElectrical impedance changes in a cell culture
Primary focusBarrier integrity and function—tightness of cell junctionsCell behavior such as viability, growth, proliferation, and differentiation
Secondary applicationsDrug permeability and toxicityDrug screening and cytotoxicity
Disclaimer/Publisher’s Note: The statements, opinions and data contained in all publications are solely those of the individual author(s) and contributor(s) and not of MDPI and/or the editor(s). MDPI and/or the editor(s) disclaim responsibility for any injury to people or property resulting from any ideas, methods, instructions or products referred to in the content.

