Article

Anthocyanins Separated from Degrained Purple-Corn Cobs with Aqueous Biphasic Systems as Food Pigments

by
Abigail López-Herrera
1,
Rafael Angel del Sagrado Corazón Ortega-Paczka
2,
Ofelia Sandoval-Castilla
1,
Leticia García-Cruz
3,* and
Salvador Valle-Guadarrama
1,*
1
Posgrado en Ciencia y Tecnología Agroalimentaria, Universidad Autónoma Chapingo, Mexico-Texcoco km 38.5, Chapingo, Texcoco de Mora 56230, Mexico
2
Departamento de Agroecología, Universidad Autónoma Chapingo, Mexico-Texcoco km 38.5, Chapingo, Texcoco de Mora 56230, Mexico
3
Laboratorio de Calidad de Maíz, Campo Experimental Valle de México, Instituto Nacional de Investigaciones Forestales, Agrícolas y Pecuarias (INIFAP), Carretera Los Reyes-Texcoco km 13.5, Coatlinchán, Texcoco de Mora 56250, Mexico
*
Authors to whom correspondence should be addressed.
Appl. Sci. 2025, 15(19), 10730; https://doi.org/10.3390/app151910730
Submission received: 6 August 2025 / Revised: 27 September 2025 / Accepted: 29 September 2025 / Published: 5 October 2025
(This article belongs to the Section Food Science and Technology)

Abstract

Featured Application

The anthocyanins recovered from degrained purple-corn cobs have potential to be used in the food industry, contributing to the replacement of artificial dyes.

Abstract

The importance of purple corn (Zea mays L.) varieties has increased due to their high anthocyanin contents both in the kernels and the degrained cob. The aim of this work was to separate anthocyanins from degrained purple-corn cobs to assess their pigmentation potential in food matrices. Two populations of purple corn were used, namely, Negro de Ixtenco (NIX) and Negro de Ixtenco x Negro de Perú (PIX), collected in Juchitepec, Mexico. Flours of degrained cob were obtained with average moisture, crude protein, ash, lipid, crude fiber, and carbohydrate contents of 7.06, 3.70, 4.48, 0.76, 37.73, and 46.27%, respectively. Aqueous biphasic systems composed of a mixture of 7.88% trisodium citrate, 2.63% citric acid, and 50.88% ethanol were applied at an atmospheric pressure of 77,993.0 Pa and 25 °C, aided by ultrasound and orbital agitation. Extracts with anthocyanin concentrations of 33.01 and 39.55 mg per gram of degrained corn cob were obtained from NIX and PIX, respectively. Pigmentation kinetics were assessed in yogurt and corn dough, which had a logarithmic tendency towards hue angles of 2.25 and 333.05°, respectively. A 60% pigmentation relative to the limit was suggested, which required 0.45 and 11.65% of the extract in yogurt and corn dough, respectively. Pigmentation stability was verified in refrigerated yogurt and in cooked corn dough.

1. Introduction

Corn (Zea mays L.) is native to Mexico, but it has been introduced to many regions of the world [1], so its genetic diversity is large [2]. In Latin America, 219 races have been identified [3], including pigmented corns, whose color is due to the presence of anthocyanins [4,5]. In addition to their chromophoric properties, these compounds exhibit antioxidant and anti-inflammatory attributes [6]. However, the presence of anthocyanins in those materials is not exclusive to the grain and, after processing, by-products remain, such as the degrained cob [7], which is commonly intended for animal consumption, but its color suggests high concentrations of such compounds. The extraction of bioactive substances is a viable way to revalue by-products of the agro-industrial activity [8], and anthocyanins can eventually be used in the fortification or pigmentation of other food matrices or in the cosmetic industry [9].
Traditional methods for extracting anthocyanins involve grinding, drying, or freeze-drying the plant material, followed by soaking it in a solvent–water mixture with or without acid to perform solid–liquid extraction under certain temperature conditions [10,11]. More recent solid–liquid procedures include the use of natural deep eutectic solvents, which are liquids naturally present in cells, prepared by mixing hydrogen bond acceptor and hydrogen bond donor eutectic solvents, with strong solvation ability for most compounds, which enhance the extraction procedures [12]. Likewise, the solid–liquid extraction procedures have included ultrasound [13] or enzyme contact [14] to weaken the solid structure and promote the release of compounds. Additionally, the use of pressurized water at subcritical conditions has been studied, which avoids using high temperatures during extraction [15]. Another group of techniques has included adsorption and desorption processes based on resins [16], and the use of recycling preparative high-performance liquid chromatography, through which several limitations of the single preparative chromatography have been solved, particularly in cases like anthocyanins separation [17], although these options require complex equipment and are costly.
A recent alternative to separate anthocyanins is the use of aqueous biphasic systems, which are based on a salting-out phenomenon and allow the extraction of compounds and their concentration through a non-thermal treatment [18]. The technique is commonly implemented with mixtures of two polymers, a mixture of a polymer and a salt [18], or a mixture of an organic solvent and a salt [19], where, depending on the concentrations, two immiscible phases can be formed that favor the separation of compounds. In the present work, this alternative was selected to separate anthocyanins from degrained pigmented corn cobs, due to its advantages relative to other techniques, which were summarized by Didion et al. [20] as follows: the scale up potential, which means that the process can be performed in industrial-scale equipment; process integration capability, since extraction and purification objectives can be achieved; biocompatibility due to the low toxicity of the compounds used, and further complicated processing to remove these compounds is unnecessary. In addition, this technique enables the selective separation of compounds [19] and, with a careful selection of components with a high sustainability score, the procedure can be recognized as a green technology [20].
During the development of aqueous biphasic systems, the presence of both types of components is essential, since phase formation depends on a salting-out mechanism [21]. In this context, although polymer–salt systems are most commonly implemented in this technique, the use of organic solvents offers a more direct strategy to eliminate them by evaporation [19,22], which is an advantage. In the case of anthocyanins, the technique has been used with systems that have included salts such as ammonium sulfate [23]. However, the eventual use of extracts in food matrices requires the residual concentrations of the salt to be assessed and an assurance that they are not toxic. In this sense, the use of sodium citrate may be a feasible alternative that can be approved by the corresponding organizations, but this salt can increase the pH to alkaline values where anthocyanins are unstable [24]. Hernández-Rodríguez et al. [22] demonstrated that the use of a system based on acetone, sodium citrate, and citric acid provides a suitable medium for extracting anthocyanins, providing pH control. However, the presence of residual amounts of acetone can be a disadvantage for the potential use of the extracts in foods, and Pérez-Orozco et al. [10] showed that ethanol could be a better solvent. In this context, the aim was to separate anthocyanins from degrained purple-corn cobs to assess their potential ability to pigment food matrices.

2. Materials and Methods

2.1. Plant Material

Two groups of purple corn were studied, Negro de Ixtenco (NIX) (Figure 1) and Negro de Ixtenco x Negro de Perú (PIX), both collected in Juchitepec, Mexico (19°06’08”N, 98°52’45”W; 2,650 m above sea level). The cobs were manually degrained, and the shelled cobs were ground with a hammer mill (FT-MM-02, JERSA, CDMX, Mexico). The powder was sieved through a 40-mesh screen to obtain flour with an approximate particle size of 425 µm, which exhibited a density of 0.1962 (±0.0075) g/cm3. The flour was subjected to an evaluation of color and the quantification of the total soluble phenol and anthocyanin contents. Likewise, a proximate analysis was performed, with the methodologies described in the “Evaluation of variables” section.

2.2. Preparation of the Binodal Diagram

The procedure described by Carranza-Gomez et al. [18] was used with modifications to construct a binodal diagram through the cloud point method applied in a thermically isolated room at atmospheric pressure of 77,993.0 Pa and 25 °C (±0.5). All materials were placed in the room 24 h before the procedure and temperature was monitored every 30 min with a Kestrel 4000 weather tracker (Kestrel Instruments, Forestry Suppliers Inc., Jackson, MS, USA). Solutions of trisodium citrate (Na3C3H5O(COO)3; SC) and citric acid (3-carboxy-3-hydroxypentanedioic acid; CA) were prepared at a 40% concentration. Three grams of the SC solution and one gram of the CA solution were placed in a tared 70 mL Pyrex® tube with a lid. Ethanol (CH3-CH2-OH, EtOH) grade 96 was added dropwise with manual stirring until a permanent cloudy appearance was observed. Deionized water was then added until a clear appearance was obtained. The dropwise addition of ethanol was repeated until the solution was cloudy, then water was added again until the mixture appeared clear, and so on. Under each condition of turbidity or transparency, the weight of the tube was registered with analytical scale (Ohaus, Parsippany, NJ, USA) with a resolution of 0.0001 g. Binodal concentrations of SC ( x b i n , % w/w), CA ( y b i n , % w/w), and EtOH ( z b i n , % w/w) were determined through mass balances with Equations (1)–(3), where x S C , i 1 , y C A ,   i 1 , and z E T ,   i 1 are the concentrations (%) of the same compounds in a previous mixture ( i 1 ), while x S C ,   0 (40%), y C A ,   0 (40%), and z E T ,   0 (96%) are the concentrations (%) of components in the original solutions. Likewise, m S C , m C A , and m E T are the masses of solutions of SC, CA, and EtOH that together with water ( m H ) were added in the ith stage. Additionally, m H corresponded to the sum of water directly added and that contained in the ethanol grade 96. Finally, m i 1 was the mass of the previous ( i 1 ) mixture. The entire procedure was performed in triplicate. The concentrations of SC and CA were added to obtain a total concentration of salt of each state ( w b i n = x b i n + y b i n , % w/w).
x b i n   % = x S C , i 1 100 m i 1 + x S C , 0 100 ( m S C ) m i 1 + m S C + m C A + m E T + m H × 100
y b i n   % = y C A , i 1 100 m i 1 + y C A , 0 100 ( m C A ) m i 1 + m S C + m C A + m E T + m H × 100
z b i n   % = z E T , i 1 100 m i 1 + z E T , 0 100 ( m E T ) m i 1 + m S C + m C A + m E T + m H × 100
Data for w b i n and z b i n were analyzed using non-linear regression with Sigma Plot software [25] to adjust them to Equation (4) [26], which represents a binodal curve, where k 1 , k 2 , and k 3 are regression constants.
z b i n = k 1   exp [ k 2 w b i n 0.5 k 3 ( w b i n ) 3 ]
Average experimental binodal conditions with the lowest and highest concentrations of SC plus CA were identified and the corresponding highest and lowest concentrations of ethanol were determined with Equation (4); thus, the experimental binodal conditions A ( w b i n m i n , z b i n m a x ) and B ( w b i n m a x , z b i n m i n ) were identified. The method described by Hernández-Rodríguez et al. [22] was applied with modifications to construct a tie line, which is a straight line that connects the compositions of two coexisting phases in equilibrium [27] and corresponds to intersections with the binodal curve.
Based on the lever-arm rule [28], we hypothesized that mixtures of SC, CA, EtOH, and water, with the composition located on the straight line that joined states A and B, can produce biphasic systems. The composition of the middle point in the A-B line was determined to verify this hypothesis, and the corresponding state was experimentally prepared with a total mass m M . After a resting period, a biphasic system with a top phase of mass m t and composition ( w b i n t , z b i n t ), a bottom phase with mass m b and composition ( w b i n b , z b i n b ), and a mass partition β developed, as expressed in the form of Equation (5). In addition, the composition of the mixture M ( w M , z M ) was expressed through mass balances in the form of Equations (6)–(8) [29].
β = m t m M
w b i n t   β + w b i n b   ( 1 β ) = w M
z b i n t   β + z b i n b   ( 1 β ) = z M
m t + m b = m M
Equation (4) was expressed as Equations (9) and (10) to determine the concentrations w b i n t , z b i n t , w b i n b , and z b i n b at the intersections of the binodal curve and the tie line, and these equations were simultaneously solved with Equations (6) and (7) [29] using the function fsolve available in the Optimization Toolbox of Matlab® R2008a [30] with the script described in Table 1, where the solution implied three degrees of freedom specified through the experimental values of w M , z M , and β .
z b i n t = k 1   exp [ k 2 w b i n t 0.5 k 3 ( w b i n t ) 3 ]
z b i n b = k 1   exp [ k 2 w b i n b 0.5 k 3 ( w b i n b ) 3 ]
Equation (4) and tie line were graphed, both limited by the concentrations ( w b i n t , z b i n t ) and ( w b i n b , z b i n b ).

2.3. Separation of Bioactive Compounds

Nine states (C, D, M, E, F, G, H, I, J; Figure 2a) were identified in terms of their concentrations of SC, CA, and EtOH, and mixtures were prepared in a thermically isolated room at 25 °C (±0.5 °C) and an atmospheric pressure of 77.993.0 Pa. The feasibility of forming biphasic systems was verified with the following procedure: a solution with the required concentrations of SC and CA was prepared, which was agitated with a vortexer (Cole-Parmer de Mexico S.A. de C.V., CDMX, Mexico) for 1 min. Ethanol grade 96 was added, and the mixture was manually agitated for 1 min, after which a biphasic system immediately formed. Subsequently, degrained cob flour of the population NIX was added at concentration of 0.67% and incubated for 30 min. The mixture was filtered through a mesh to eliminate the solid phase, and systems were left to stand again for 10 min in syringes to facilitate phase recuperation. Two phases were expected to form in each mixture, a top phase ( t ) mainly composed of alcohol, and a bottom phase ( b ) mainly composed of salt. In this scenario, the systems included two phases and three chemical components (water, alcohol, and salt); thus, according to the Gibbs phase rule [31], their complete characterization involved three degrees of freedom. In this regard, a state was defined as a biphasic system in equilibrium at a pressure of 77,993.0 Pa, temperature of 25 °C, and a given composition. The phases were separated, and their volume ( V t , V b ) was measured with a graduated cylinder. Then, the volume ratio ( V r = V t / V b ) was calculated and the pH, anthocyanin concentration, total soluble phenol concentration, and anthocyanin separation yield were measured with the methodologies described in the “Evaluation of variables” section. The state to be used in subsequent stages was selected, which was prepared at different temperatures (25, 40, and 55 °C), different periods of ultrasound treatment (0, 30, and 120 s), and different shaking times (0, 15, 30, 45, and 60 min), to evaluate the effects of these variables on anthocyanin extraction. Ultrasound was applied in a Branson bath (Bransonic M1800H, Branson Ultrasonics Co., Brookfield, CT, USA) at constant wave frequency (70 W, 40 kHz). Shaking was applied using orbital equipment (ISHD16HD6, Ohaus, NJ, USA) at 175 rpm and a controlled temperature.

2.4. Pigmenting Potential

Two materials were chosen to evaluate the pigmentation potential of extracts. One was natural yogurt; the other consisted of corn dough, obtained from 1 kg of nixtamalized corn flour, 250 g of vegetable shortening, and 240 mL of warm chicken broth. The shortening was manually beaten for 10 min to obtain a soft and fluffy paste, the corn dough was gradually added with constant mixing, and finally, the warm chicken broth was added with continuous manual mixing until a paste that floated in cold water was obtained [32].
In both cases, the technique of aqueous biphasic systems was applied with the flour from both groups (NIX and PIX) using the methodology described above. In each case, the top phase was recovered from the systems and was subjected to ethanol vaporization in a rotary evaporator (Büchi R-300, Büchi Labortechnik AG, Flawil, Switzerland) operated at 45 °C, 121 rpm, and a pressure of 70 mbar. The resulting extract was evaluated for the anthocyanin content, and it was used in pigmentation analyses.
Batches of 5 g of yogurt and 22 g of corn dough were prepared. Anthocyanin extract was added in the range of 0 to 2.3% or 0 to 25.0%, respectively, and the color of the obtained product was measured. Data were subjected to non-linear regression analyses with the Sigma Plot [25] program to fit the values of lightness ( L ), hue angle ( H ), and chroma ( C ) to models with the forms of Equations (11)–(13), respectively, where e c is the extract concentration (%) and k 4 to k 12 are regression constants.
L = k 4 + k 5   1 e k 6   e c
H = k 7 + k 8   1 e k 9   e c
C = k 10 + k 11   1 e k 12   e c
The limiting values of lightness ( L l i m ), hue angle ( H l i m ), and chroma ( C l i m ) that an infinite amount of extract can cause were determined using Equations (14)–(16), which represent the asymptotic lines to the curves corresponding to Equations (11)–(13), respectively [18].
L l i m = k 4 + k 5
H l i m = k 7 + k 8
C l i m = k 10 + k 11
Finally, based on the data for the hue angle, the amount of extract required to obtain 60% pigmentation ( e c 60 ) with respect to the limit value ( H l i m ) was evaluated with Equation (17).
e c 60 = 1 k 9   l n ( 2.5 )
Tests were conducted to evaluate pigment stability. In the case of yogurt, 25 g batches were prepared and incorporated with the extract obtained from flours of NIX and PIX in the quantity given by e c 60 . Half of the batches were placed in isolated rooms at 4 °C and the other half at 25 °C, both for 30 days of storage. Batches were removed daily from each storage room, and they were evaluated for lightness ( L ), hue angle ( H ), and chroma ( C ) attributes to assess pigment stability. In the case of corn dough, 22 g pigmented batches were prepared, which were cooked through contact with saturated steam, and the resulting product was also subjected to evaluations of L , H , and C , namely, the pigmentation evaluation focused on the effect of the high-temperature cooking.

2.5. Evaluation of Variables

Proximate analysis was performed with AOAC [33] methodologies and consisted of determining the moisture, crude protein, ethereal extract, ash, crude fiber, and carbohydrate contents. Color was determined using Hunter Lab equipment (Mini Scan XE Plus 45/0-L, VA, USA), with the results presented as lightness ( L ), hue angle ( H ), and chroma ( C ) [34]. pH was assessed with a portable potentiometer (Hanna Instruments, model HI-8424, Woonsocket, RI, USA). The anthocyanin concentration was determined colorimetrically using a spectrophotometer with a microplate reader (Epoch, Biotek instruments, Winooski, VT, USA) and a cyanidin standard curve, with results reported as mg of cyanidin equivalents per 100 g of sample (mg CyEs/100 g) or mg of cyanidin equivalents per mL of extract (mg CyEs/mL). The total soluble phenol (TSP) concentration was determined with the Folin–Ciocalteu method [35] using a spectrophotometer with a microplate reader. Twenty-five microliters of the extract, 125 μL of distilled water, 20 μL of the Folin–Ciocalteu reagent (0.2 N), and 30 μL of 20% sodium carbonate were added to the wells of a microplate. The mixture was allowed to stand for 30 min in the dark, and absorbance was determined at 760 nm. Total soluble phenols (TSPs) were quantified based on a ferulic acid (FA) standard curve. The results are presented as mg of ferulic acid equivalents per 100 g of sample (mg FAEs/100 g) or in mg of ferulic acid equivalents per mL of extract (mg FAEs/mL) in the case of biphasic systems.

2.6. Data Analysis

The flour type (NIX and PIX) was considered a source of variation in the experiments. In the pigmentation analyses, time was also considered as a source of variation. The data were subjected to analysis of variance and treatment means were compared using the Tukey test, with a significance level of 0.05. The goodness of fit of the experimental Equations (4) and (11)–(13) was evaluated with the determination coefficient ( r 2 ), defined using Equation (18) [36], where xexp represents the experimental data, xmod represents the data estimated using the model, and xmean represents the mean value. As r 2 was closer to unity, the fitting of data to the model was considered adequate. All the procedures were performed in triplicate.
r 2 = 1 1 n x e x p x m o d 2 1 n x e x p x m e a n 2

3. Results and Discussion

3.1. Visual and Compositional Characteristics of Degrained Corn Cob Flours

The degrained cob flours of NIX and PIX populations had average values of 7.06, 3.70, 4.48, 0.76, 37.73, and 46.27% for moisture, crude protein, ash, ethereal extract, crude fiber, and carbohydrates, respectively (Table 2), and the differences (α ≤ 0.05) in the moisture, ash, and crude fiber contents were small but significant. According to Rodríguez-Salinas et al. [37], the typical proximate composition of corn grain includes 71–74% carbohydrates, 9.0–12.6% protein, 3.5–6.0% lipids, 1.0–1.4% ash, and 1.2–1.8% crude fiber, which indicated differences with the degrained cob composition, mainly in the carbohydrate, protein, and crude fiber contents.
On the other hand, the proximate composition of the degrained cob is highly variable. However, it stands out for its high crude fiber content (38.4%) [38] and dietary fiber content (75.2–81.3%) [39,40], although it has low protein content (0.59–3.24%) and ethereal extract content (1.4–1.8%) [38,39]. In this sense, the utilization of the degrained corn cob is limited to its consideration as a source of fiber and energy, based on its high carbohydrate content. Therefore, the extraction of bioactive compounds such as phenolics, particularly anthocyanins, can promote greater revaluation of this by-product.
The total soluble phenol (TSP) concentration averaged 4709.1 mg FAEs/100 g (dry basis), while the average anthocyanin (Ant) concentration was 1665.0 mg CyEs/100 g (dry basis), without significant differences (α > 0.05) between populations (Table 2). Previous studies of purple-corn cobs have reported that the anthocyanins present in these materials are cyanidin-3-glucoside, pelargonidin-3-glucoside, peonidin-3-glucoside, and their malonate counterparts [41,42]. The concentration of TSP in the evaluated populations was higher than that reported by Khamphasan et al. [43] for purple cob of population III-43 (1376.5 g/100 g) of the Cacahuacintle race, populations I-34 (1102.2 mg/100 g) and I-13 (100.4 mg/100 g) of purple-corn cob, as well as for populations TB/KND/PF10 (1176.5 mg CGEs/g 100) and TB/KND/PF3 (1455.4 mg CGEs/g 100). Additionally, the results obtained for the anthocyanin contents in populations NIX and PIX were higher than those reported by Mendoza-Mendoza et al. [4] for purple cob of population III-43 (1376.5 g/100 g) of the Cacahuacintle race and populations I-34 (1102.2 mg/100 g) and I-13 (100.4 mg/100 g) of degrained purple cob.
The degrained cob flours presented color with a lightness ( L ) between 26.5 and 36.1, which was associated with dark materials, chroma ( C ) between 10.0 and 11.5, and hue angle ( H ) between 17 and 26°, with no significant differences (α > 0.05) between populations (Table 2). The hue angle is expressed on a scale that varies from 0 to 360°, where 0 and 360° correspond to red, 90° to yellow, 180° to green, and 270° to blue [34], which indicated that the materials had a hue that was very close to absolute red, derived from the presence of anthocyanins [4]. In this regard, Aguilar-Hernández et al. [44] analyzed flours from corn samples from Tepatitlán, Jalisco, Mexico, where they identified two groups, one with hue angle between 10.6 and 11.4° and another where the attribute varied between 38.0 and 43.5°. In this regard, the pith and the woody ring (Figure 1) of the cob are not pigmented [42,45,46], which causes a departure from red tones when grinding the entire cob.

3.2. Binodal Phase Diagram

The cloud point method allowed the determination of binodal data for which the mixture of ethanol, sodium citrate, and citric acid transitioned from a monophasic condition to a biphasic condition. The data fitted well ( r 2 = 0.9991 ± 0.0007) to Equation (4), where k 1 , k 2 , and k 3 had values of 83.1364, −0.2008, and 6.5651 × 10⁻⁶, respectively. Equation (4) [26] is commonly used to represent binodal data. Constants k 1 and k 2 had values of the same magnitude as other systems; however, constant k 3 differed [22,47]. The present work used a system based on an organic solvent and a salt. If a polymer such as polyethylene glycol is used instead of ethanol, the value of constant k 3 can be significantly higher [18,47]. The binodal curve delimits a region where the system maintains a monophasic condition from a region where two immiscible phases are formed, and the lesser the value of k 3 , the higher the concentrations required to form biphasic systems.
The binodal data for the salt content varied within the range of 1.8998 (±0.0347) to 30.2394% (±0.6491). Based on Equation (4), the experimental binodal concentrations A (1.8998, 63.0336% w/w) and B (30.2394, 22.9827% w/w) were identified. The middle point between A and B corresponded to state M (16.0696, 43.0082%), which was physically prepared and formed a biphasic system, but with a mass partition ( β ) equal to 0.6865 (Equation (5)), which indicated that the mixture M was not located at the central point of the tie line and that, according to the lever-arm rule [28], the composition of top and bottom phases of system M did not correspond to binodal concentrations of A and B. Thus, the limits of the tie line were determined with the simultaneous resolution of Equations (6), (7), (9), and (10) using the script described in Table 1, which indicated that both the binodal curve and the tie line were limited at concentrations K (3.6224, 56.7126%) and L (43.3265, 12.9982%) (Figure 2a). Based on this premise, biphasic systems can only be formed with concentrations of salt and ethanol located in the region delimited by the binodal curve and the tie line. To verify this result, the composition of two sets of states was identified at approximately equidistant distances, one of them on the K-L tie line (G, M, H, I, and J) and the other on the experimental A-B line (C, D, M, E, and F). The results showed that all the mixtures formed biphasic systems, which confirmed that all of them exhibited saturated conditions [27]. However, when the corn cob flour was added, systems H, I, and J exhibited the precipitation of salt in the bottom phase, which indicated that the liquid–liquid equilibrium was altered, and this phase was not recovered. On the other hand, such phenomenon did not occur with states located on the A-B line because they were not located at the limit of the phase envelope delimited by the binodal curve and the tie line. Thus, it was decided to study the extraction of anthocyanins considering only states on the A-B line, since they were experimentally verified through the cloud point method and exhibited the formation of biphasic systems even after flour addition. Additionally, works focused on separations based on aqueous biphasic systems have commonly studied the effect of the length of the tie line by identifying secondary tie lines between a main tie line and the binodal curve [48], and the results have shown that the greater the distance to the binodal curve, the greater the separation efficiency [19,22]. Furthermore, organic solvents like acetone or propanol cause the development of narrow biphasic regions [19,22], suggesting a study of the extraction process with states located only along the main tie line.

3.3. Bioactive Compounds

Figure 2a shows the binodal diagram, which was studied from a scheme of liquid–liquid separation. Samples of degrained cob flours were added to the biphasic systems, which modified the scheme to a solid–liquid separation, to study the extraction of anthocyanins. The separation of anthocyanins from the degrained cob flours using aqueous biphasic systems was evaluated at states C (5.00, 58.65%), D (10.5, 50.88%), M (16.07, 43.01%), E (21.50, 35.33%), and F (27.00, 27.56%) located on the experimental A-B line. Each state developed two phases, a top phase whose composition was mainly alcoholic, and a bottom phase whose composition was mainly saline.
Figure 2. Binodal diagram of the mixture of trisodium citrate, citric acid, and ethanol (a), and variations in the pH (b), volume ratio between phases (c), concentration of anthocyanins (d), and separation yield (e) in five states located on the experimental A-B line. Different capital letters in boxes b, d, and e indicate significant differences (Tukey’s test, 0.05). Different small letters on the lines indicate significant differences between means (Tukey’s test, 0.05). States on the K-L line or the A-B line correspond to conditions of equilibrium at a temperature of 25 °C, pressure of 77,993.0 Pa, and the given composition.
Applsci 15 10730 g002
As the concentration of ethanol decreased and the concentrations of trisodium citrate and citric acid increased, the volume of the top phase decreased and that of the bottom phase increased; thus, the volume ratio ( V r ) significantly diminished (α ≤ 0.05; Figure 2b) as a consequence of the salting-out phenomenon produced by the increase in the salt concentration [21]. In state C, the top phase was almost 60 times larger than the bottom phase and salt precipitated, which did not occur in the other states.
The pH decreased significantly (α ≤ 0.05) in the top phase from 5.62 to 5.29 as the ethanol concentration decreased and the salt concentration increased in the formulation (Figure 2c). On the other hand, pH had values between 4.90 and 5.12 in the bottom phase, without significant variation (α > 0.05) in all the evaluated states. The incorporation of citric acid aimed to prevent the presence of alkaline conditions that degrade anthocyanins, and the lower pH values in the bottom phase relative to the top phase (α ≤ 0.05) suggested higher concentrations of this compound in that phase, which coincided with the report of Hernández-Rodríguez et al. [22]
On the other hand, anthocyanins accumulated at a higher quantity in the top phase than in the bottom phase (α ≤ 0.05), with concentrations ranging between 0.22 and 0.30 mg CyEs/mL and between 0 and 0.17 mg CyEs/mL, respectively (Figure 2d), which produced higher values (α ≤ 0.05) of separation yield in the top phase (Figure 2e).
The separation of anthocyanins was a result of two mechanisms. On one hand, solid–liquid extraction was induced due to the presence of ethanol as the dissolvent. On the other hand, a salting-out phenomenon occurred, where the interaction of salts with water, mainly SC, caused the exclusion of ethanol and anthocyanins, favoring the formation of biphasic systems [19,21,22]. As the salt concentration increased, a higher quantity of water was retained in the bottom phase, causing an increase in the volume of that phase and an increase in the concentration of anthocyanins. Consequently, as the salt concentration increased, the concentration of anthocyanins in the top phase decreased along with the separation yield of that phase, which suggested the use of state D with 7.88% trisodium citrate, 2.63% citric acid, and 50.88% ethanol as a basis to extract anthocyanins from degrained cob flours.
In order to improve the extraction process, routines with aqueous biphasic systems with the composition of state D were prepared with agitation times of 0, 15, 30, 45, and 60 min using orbital equipment (ISHD16HD6, Ohaus, Parsippany, NJ, USA) at 175 rpm and 25 °C, and the concentrations of anthocyanins in top phases were 0.23 (±0.01), 0.26 (±0.01), 0.24 (±0.01), 0.25 (±0.02), and 0.31 (±0.003) mg CyEs/mL, respectively, with significant difference (α ≤ 0.05) between 0 and 60 min, which indicated that the longer the agitation time, the higher the concentration of anthocyanins in the top phase. With a similar purpose, ultrasound was applied in a Branson bath (Bransonic M1800H, Branson Ultrasonics Co., Brookfield, CT, USA) at 0, 30, and 120 s, where top phases were obtained with anthocyanin concentrations of 0.23 (±0.01), 0.30 (±0.02), and 0.32 (±0.004) mg CyEs/mL, respectively, with significant differences (α ≤ 0.05) between 0 and 120 s. In addition, the effect of the temperature was evaluated at 25, 40, and 55 °C with mixtures having the composition of state D, where anthocyanin concentrations in the top phases were 0.31 (±0.01), 0.29 (±0.03), and 0.29 (±0.01) mg CyEs/mL, respectively, without significant differences (α > 0.05) between thermal conditions. Based on these results, a temperature of 25 °C was confirmed as adequate to prepare aqueous biphasic systems. However, an agitation time of only 30 min was selected based on the hypothesis that the combined use of this time and ultrasound applied for 120 s can maximize the anthocyanin extraction.
Based on these results, the preparation of aqueous biphasic systems with mixtures having the composition of state D was confirmed by dissolving SC and CA through vortexing (Cole Parmer de Mexico S.A. de C.V., CDMX, Mexico) for 1 min, adding ethanol 96 grade, and manual stirring for 1 min, adding degrained cob flour at concentration of 0.67%, followed by resting for 30 min to favor the imbibition of the solid, sonication at a constant wave frequency (70 W, 40 kHz) for 2 min, shaking in orbital equipment at 175 rpm and 25 °C for 30 min, resting for 10 min, filtration, recovery of the liquid phase, resting for 10 min, and separation of the formed phases. Thus, the anthocyanin extraction process included two stages: one corresponding to liquid–liquid separation and another where solid–liquid extraction occurred. In the first stage, when the mixture of trisodium citrate (SC), citric acid (CA), and ethanol (EtOH) was complete, a biphasic system was immediately formed. According to the technical sheet (Sigma Aldrich Química, S. R.L. C.V., CDMX, Mexico), SC is practically insoluble in EtOH, which explained the rapid formation of the biphasic system after the addition of EtOH to the saline solution due to a salting-out phenomenon [21]. This behavior contrasted with other systems based on polyethylene glycol and trisodium citrate, where centrifugation was required after a passive sedimentation period to achieve the formation of the biphasic system [18]. On the other hand, the presence of CA controlled the system pH, considering the objective of separating anthocyanins. However, CA weakens the salting-out effect because its presence, in conjunction with SC, induces the formation of a buffer [49], and due to its greater affinity for ethanol, CA tends to migrate to the top phase of the system, increasing the salt concentration in that region. Nevertheless, considering the different handling stages of systems, solid–liquid extraction was performed for 82 min, in addition to the time used during transitions between the steps of imbibition, ultrasonication, orbital shaking, and subsequent resting periods, where the transport of substances from the solid matrix to the liquid phases occurred.
The top phases of systems presented anthocyanin concentrations of 33.01 (±0.074) and 39.55 (±0.32) mg CyEs per gram of degrained cob flour when NIX and PIX flours were used, and the difference between populations was significant (α ≤ 0.05). A significant differences (α ≤ 0.05) in the value of 1.23 (±0.06) mg CyEs/g for both flours in the bottom phase was observed. The anthocyanin separation yield in top phases was 97.0 and 96.41%, respectively, which were higher than those reported by Liu et al. [23] in a system consisting of ethanol and ammonium sulfate used to extract anthocyanins from sweet potatoes. The results were also similar to those obtained by Gullón et al. [50], although they used a procedure at 120 °C with 111 min of extraction. In addition, the lower concentration of anthocyanins in the bottom phase was due to a salting-out phenomenon that favored the hydrophobicity of these compounds and increased the affinity for ethanol, which caused anthocyanins to migrate to the top phase [22]. On the other hand, the corn cob flour was added at concentration of 0.67% and this apparent low quantity was selected due to the low density of the plant material (0.1962 ±0.0075 g/cm3), which made the imbibition of the solid material difficult. Nevertheless, the concentration of anthocyanins was higher than that obtained by Mandache et al. [8] from by-products of peaches. Furthermore, several studies have evaluated the anthocyanin concentration in purple-corn cobs using conventional extraction methods with sample-to-solvent ratios ranging from 1:20 to 1:100 to avoid solvent saturation, due to the high concentration of anthocyanins present in this part of the plant [51,52,53].
Similar to anthocyanins, the soluble phenol content was 492.09 (±0.01) and 512.36 (±0.01) mg FAEs per gram of degrained cob flour for NIX and PIX in the top phases, respectively, without a significant difference between populations (α > 0.05), while significantly lower values (α ≤ 0.05) of 14.29 (±0.02) and 13.77 (±0.01) mg FAEs/g were obtained in the bottom phases, which indicated that these compounds mostly migrated to the top phase of the systems, with extraction yields in that phase of 97.18% (±0.03) and 97.38% (±0.01) for NIX and PIX, respectively. However, the concentrations obtained were lower than those reported by Mandache et al. [8] for by-products of peaches. In addition to the composition of the system, the pH is important for the extraction and stability of anthocyanins. In this regard, the pH was 5.44 (±0.00) at the concentrations evaluated. Liu et al. [23] obtained a pH of 3.3 when extracting anthocyanins with ethanol (25% w/w) and ammonium sulfate (22% w/w), which created a favorable environment to maintain the stability of these compounds.

3.4. Pigmentation Potential of Foods

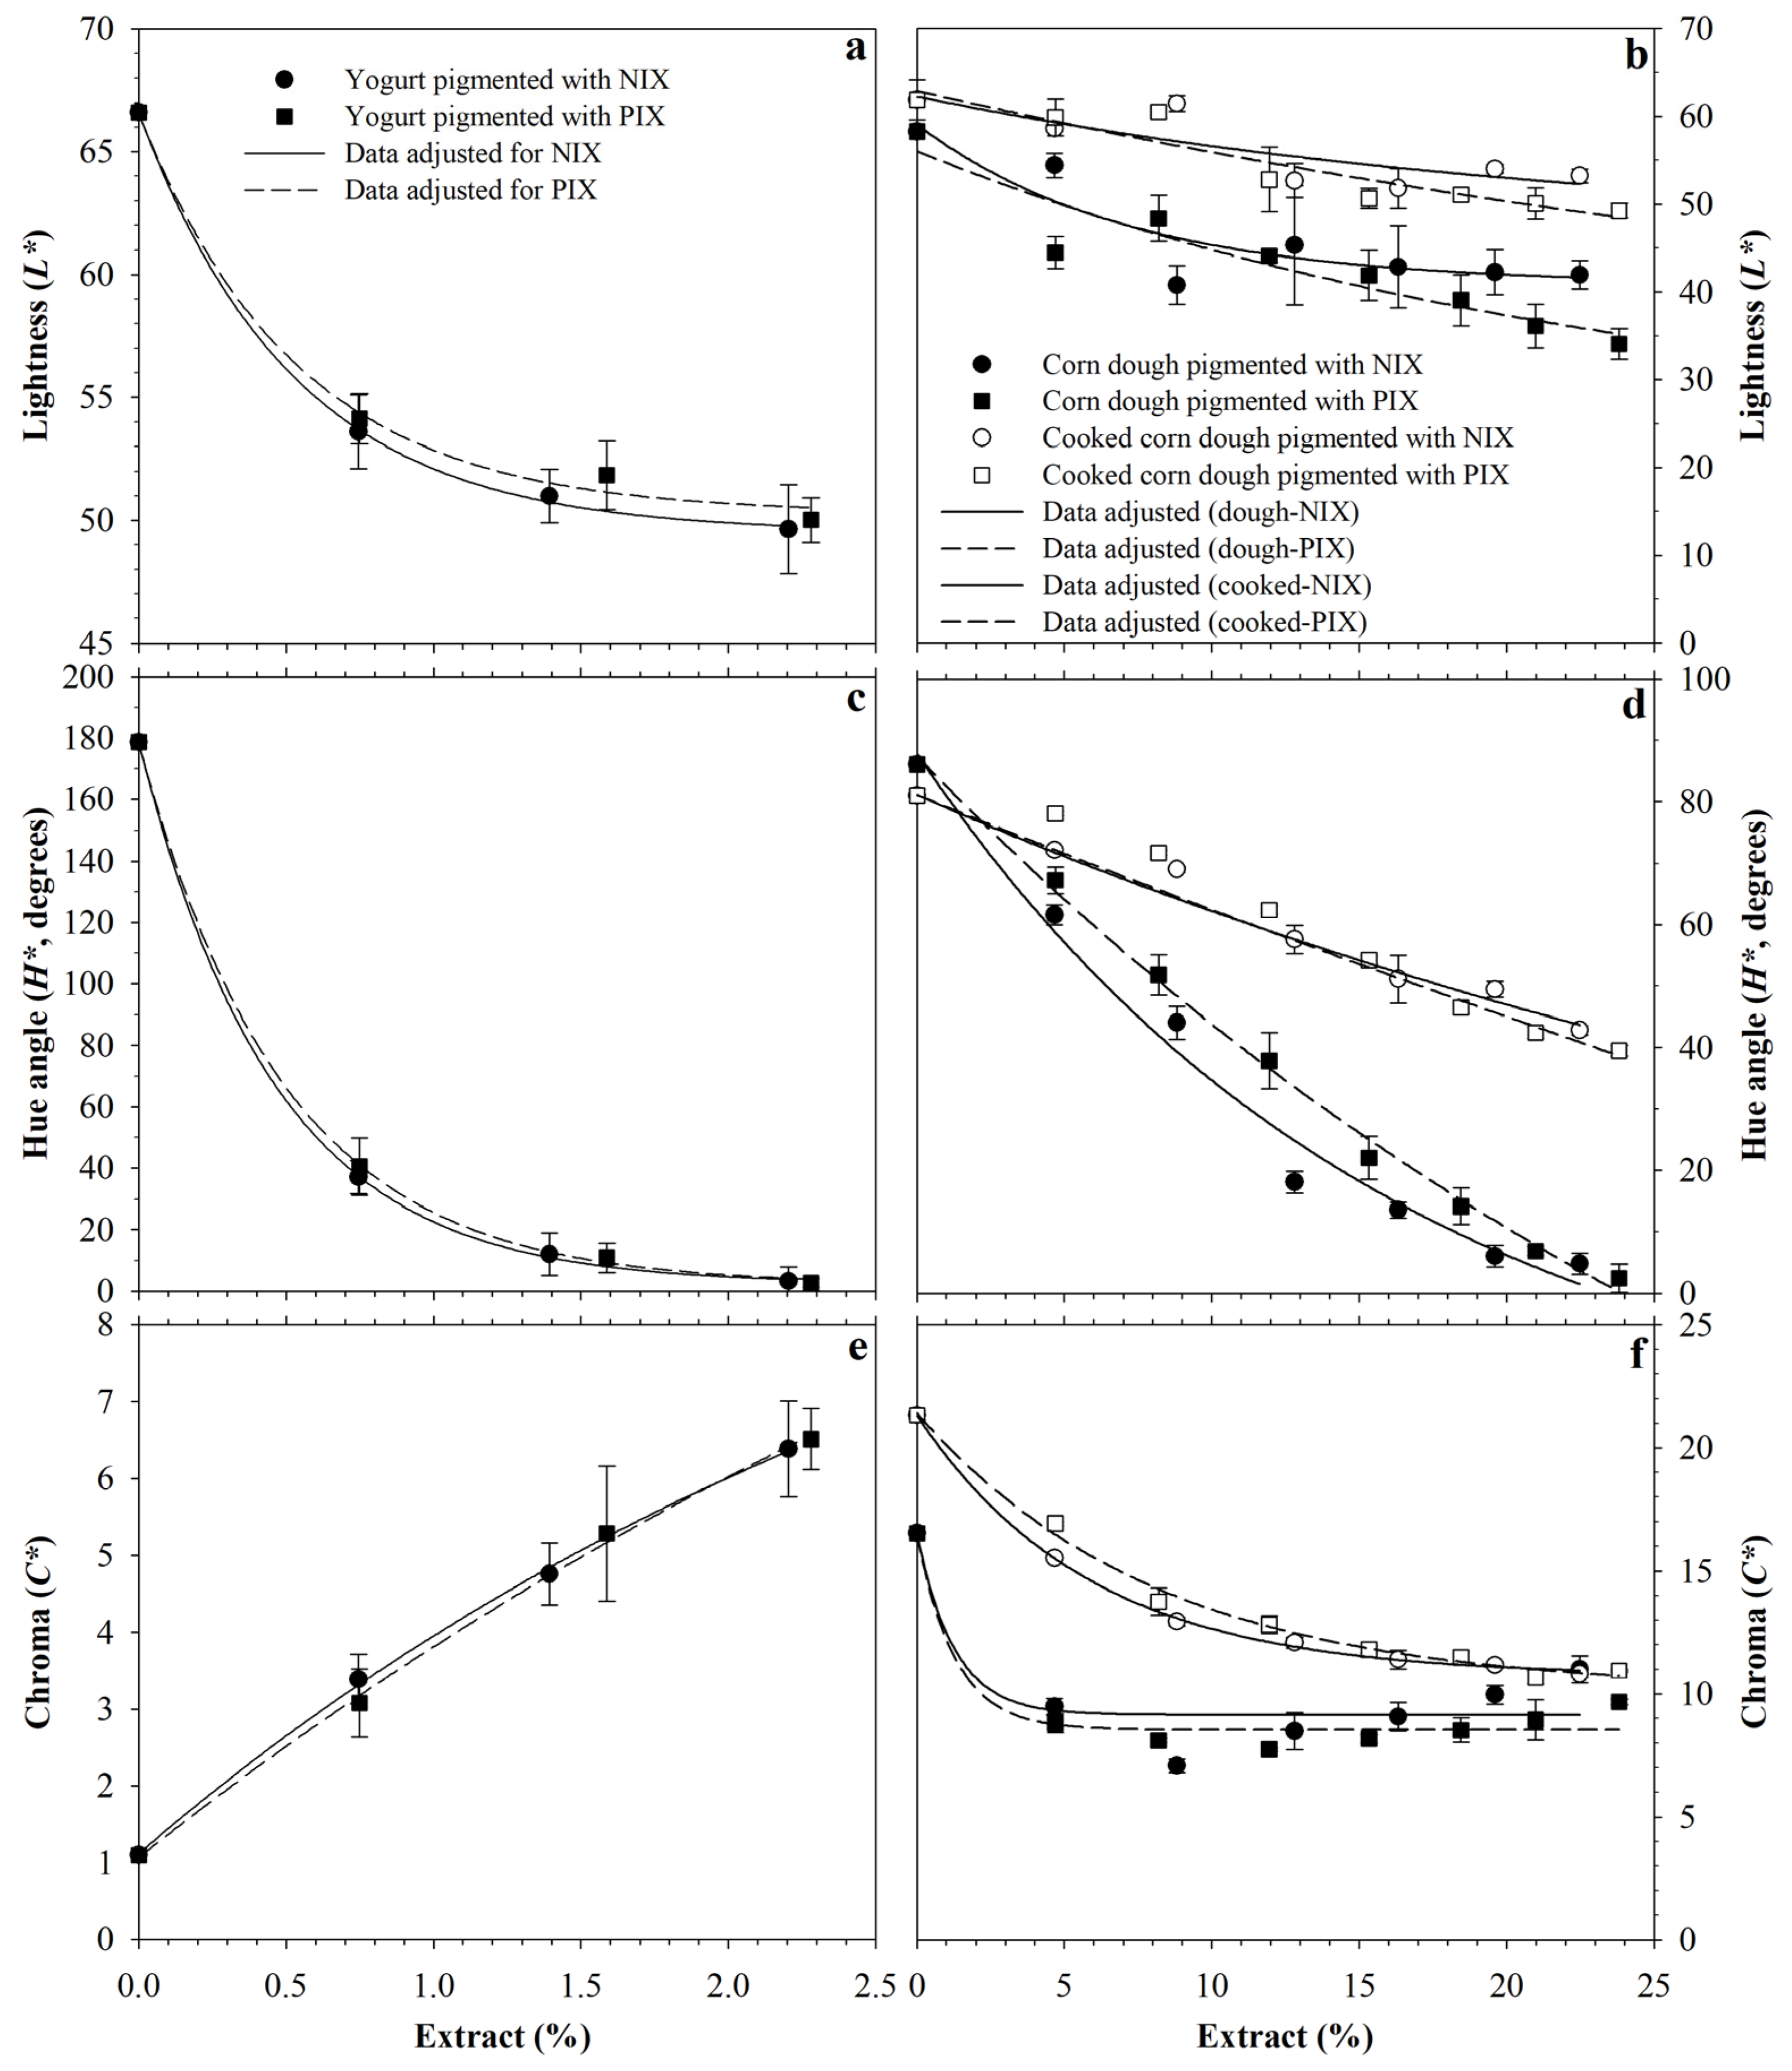
Two pigmentation assays were conducted, one with yogurt and the other with corn dough. In the case of yogurt, extracts with 39.58 (±0.04) mg CyEs/mL of anthocyanins were obtained from the top phases of the biphasic systems from NIX flours and 40.42 (±0.10) mg CyEs/mL from PIX flours after ethanol evaporation. The yogurt used in pigmentation assays had initial lightness, hue angle, and chroma values equal to 66.6, 178.71°, and 1.1, respectively. The gradual addition of extracts caused reductions in H and L , while C* increased. In all cases, the changes occurred logarithmically (Figure 3), which were similar to the results obtained by Carranza-Gomez et al. [18].
The data fitted well to Equations (11)–(13), with the values of k 4 to k 12 , and r 2 shown in Table 3. The effects of the two extracts were similar; however, the logarithmic behavior suggested that complete yogurt pigmentation required very large amounts of extracts. In this regard, Equations (14)–(16) indicated that the infinite addition of NIX and PIX extracts can cause a lightness between 49.51 and 50.28, hue angle between 2.37 and 2.13°, and chroma between 11.45 and 15.14. The proximity of hue angle data to 0 or 360° indicated that the addition of extracts caused the hue to tend toward red [34] due to the presence of anthocyanins [4].
The reduction in lightness was an expected result, since the whitish appearance of the natural yogurt is altered upon the addition of any agent that modifies the color attributes. However, as the amount of the extract increased, the product acquired a purer color, which was reflected in an increase in chroma. On the other hand, a pigmentation of 60% was decided with respect to the maximum possible value to avoid the excessive use of the extract, and, based on the hue angle data and Equation (17), the concentrations of 0.44 and 0.46% of NIX and PIX flour extract, respectively, were determined to be used for pigmenting yogurt.
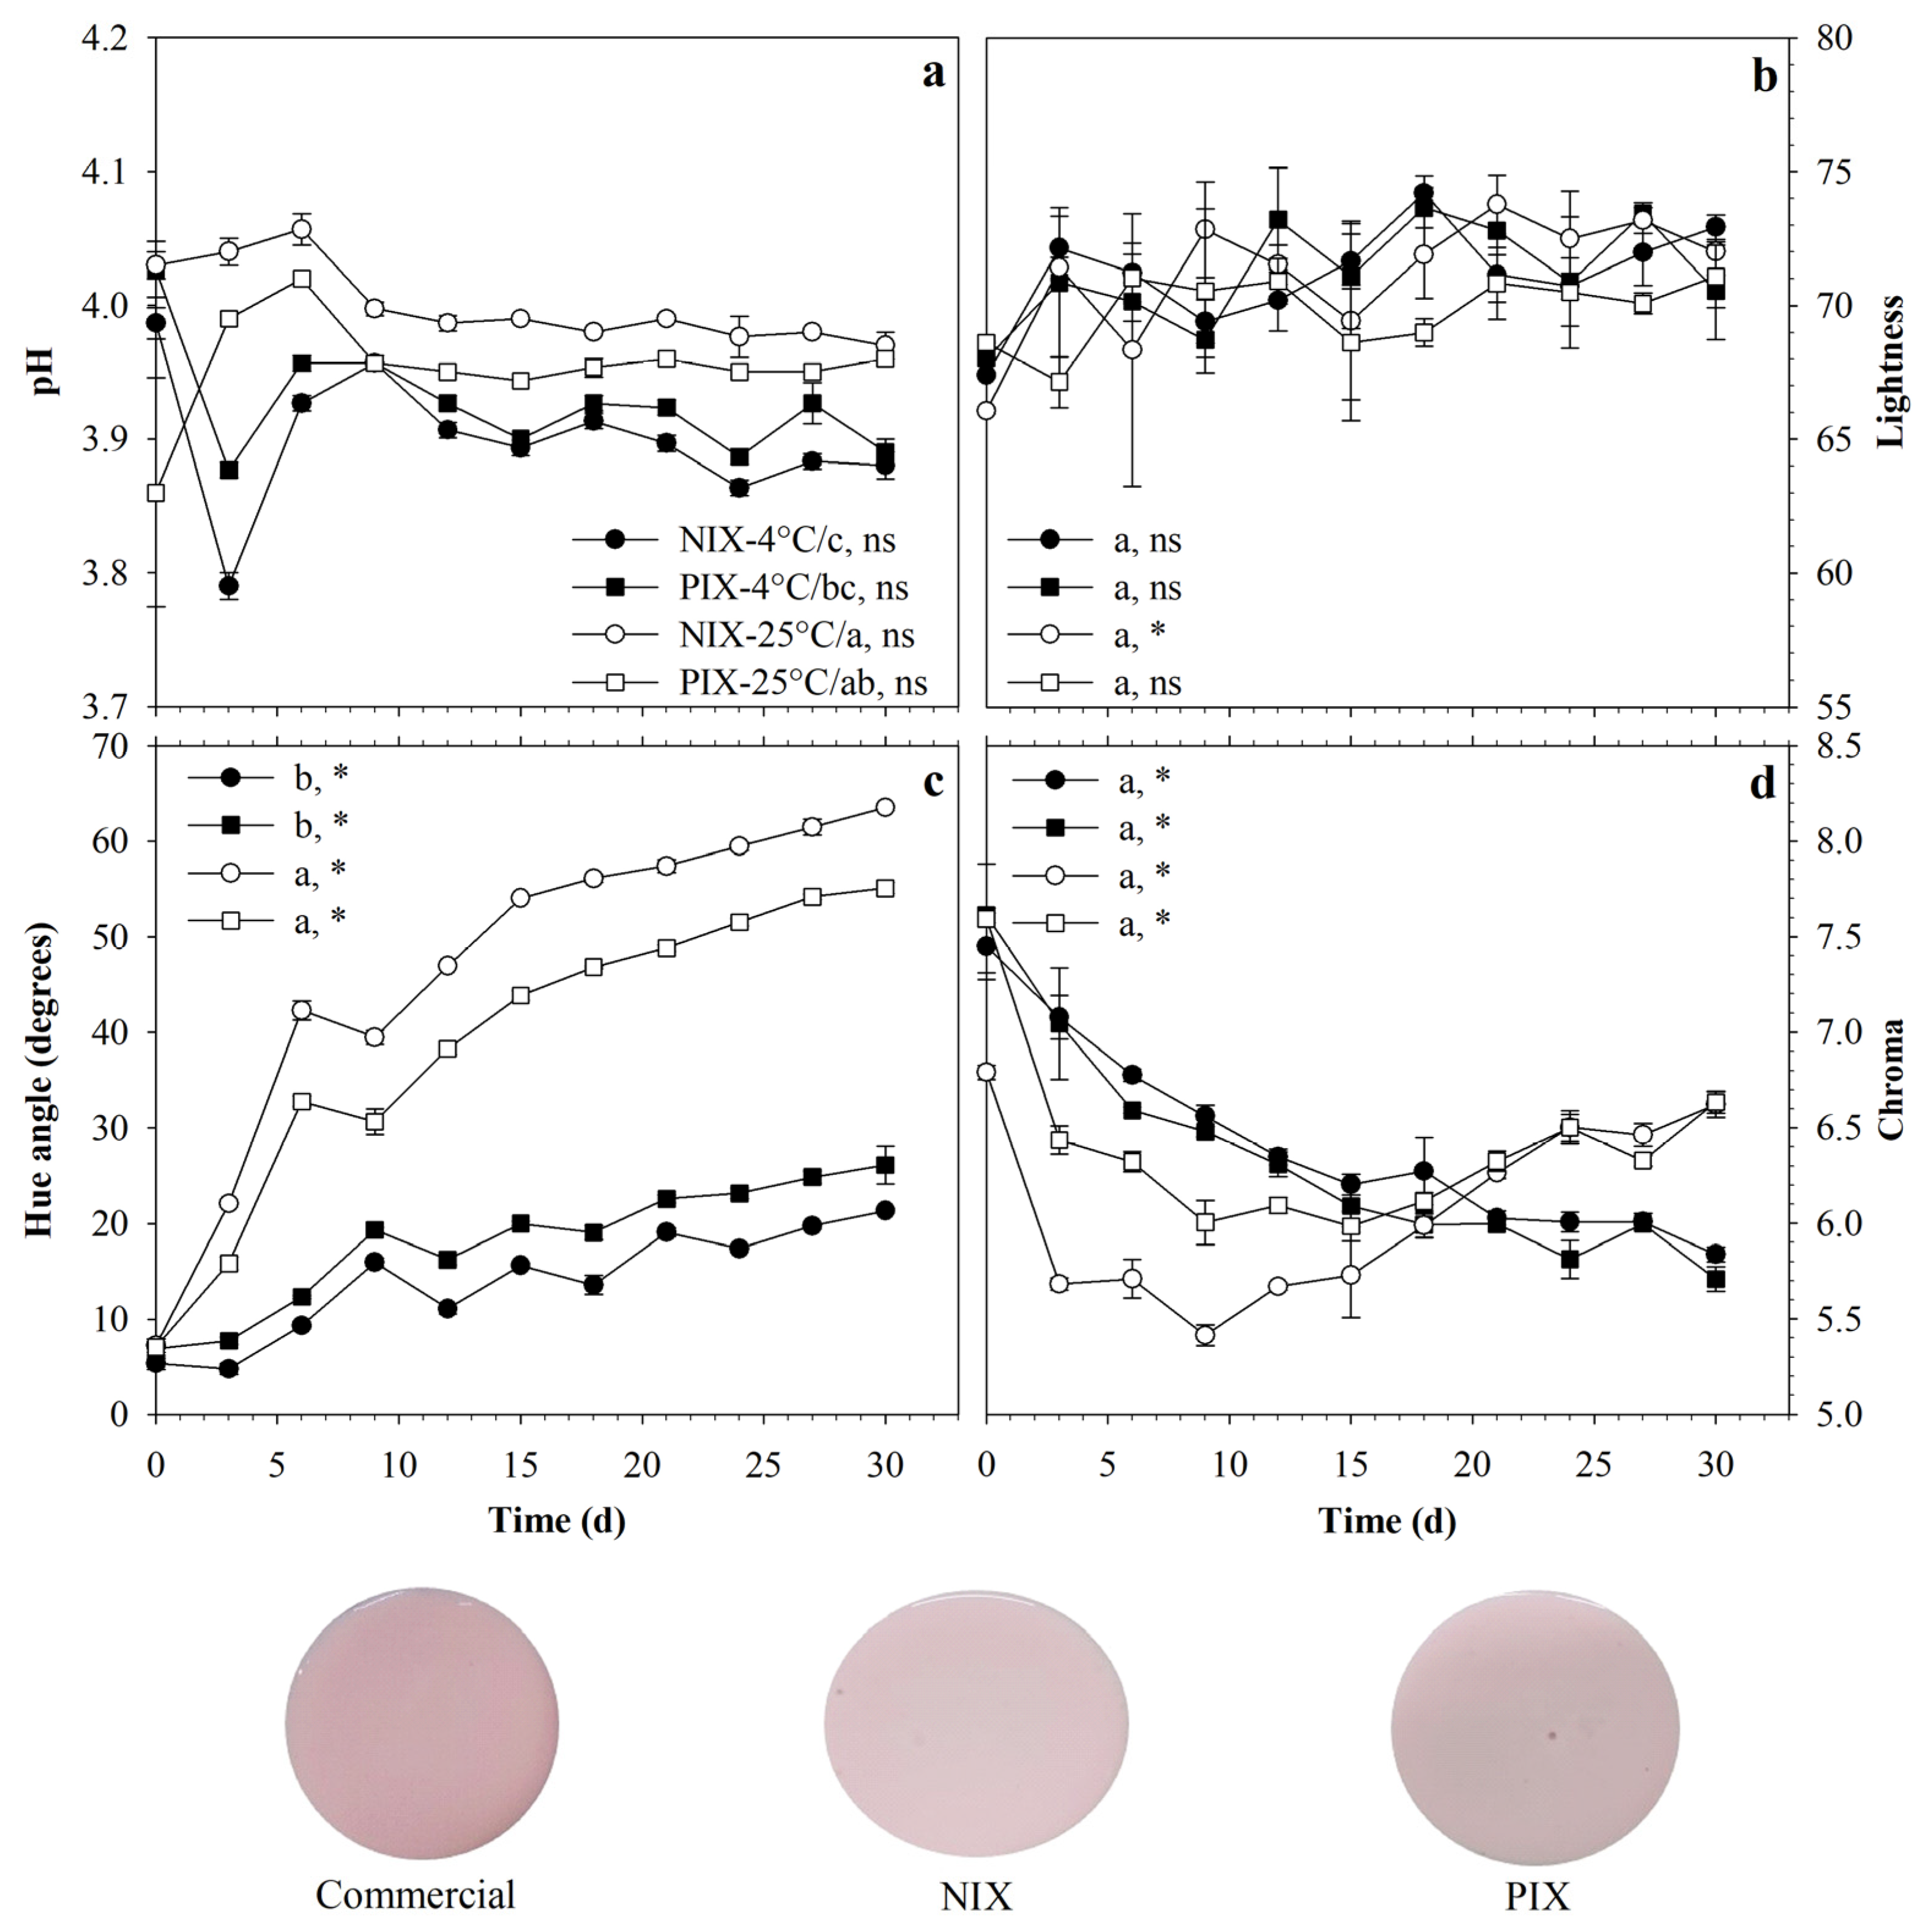
Based on this information, batches of yogurt were prepared and flour extract was added at the indicated concentration to evaluate the pigmentation potential, obtaining a product that recorded L , H , and C values of 67.72 (±0.45), 6.14° (±1.13), and 7.53 (±0.12), respectively, when the NIX extract was used, and values of 67.35 (±1.82), 7.17° (±0.11), and 7.19 (±0.57), respectively, with the PIX extract. In both cases, the visual appearance was like a product marketed under the name “strawberry flavor” (Figure 4). Batches were placed at 4 and 25 °C for 30 d, and the pH was maintained in the range of 3.9 to 4.1 throughout storage, with average values of 3.90 (±0.05) and 3.92 (±0.04) for batches with the NIX and PIX extracts stored at 4 °C and 4.00 (±0.03) and 3.95 (±0.04) for batches stored at 25 °C, respectively (Figure 4a). Although the statistical analysis showed that higher values were obtained at 25 °C (α ≤ 0.05), the effect was not significant because the magnitudes were within the range in which anthocyanins are more stable, from 1.0 to 5.0 [24]; that is, pH was not a factor contributing to the deterioration of these compounds.
The lightness of the pigmented products ranged from 66.0 to 74.0, with no differences (α > 0.05) between treatments (Figure 4b). In addition, an upward trend was observed over time, although this trend was only significant when the products were pigmented with the NIX extract at 25 °C. Therefore, in general, this color attribute was not affected by the extract type, temperature, or time.
In the case of the hue angle, two groups formed as a function of temperature. From an average value of 6.65° (±0.88), the batches stored at 4 °C varied significantly with time (α ≤ 0.05) to range from 21.0 to 26.0, with no difference (α > 0.05) between types of extracts (Figure 4c); thus, the materials maintained the reddish hue. However, batches stored at 25 °C varied significantly with time (α ≤ 0.05) up to a range between 55.0 and 63.0, with no difference (α > 0.05) between extracts, indicating that products obtained from NIX and PIX flours had the same yogurt pigmentation potential. However, this property depended on the handling temperature, since the use of refrigeration was necessary to maintain the pigmentation capacity over time. On the other hand, chroma tended to decrease over time in a similar manner at both temperatures and with both types of extracts, although the modification was moderate and changed from a general average value of 7.36 (±0.39) to range between 5.89 and 6.51 (Figure 4d).
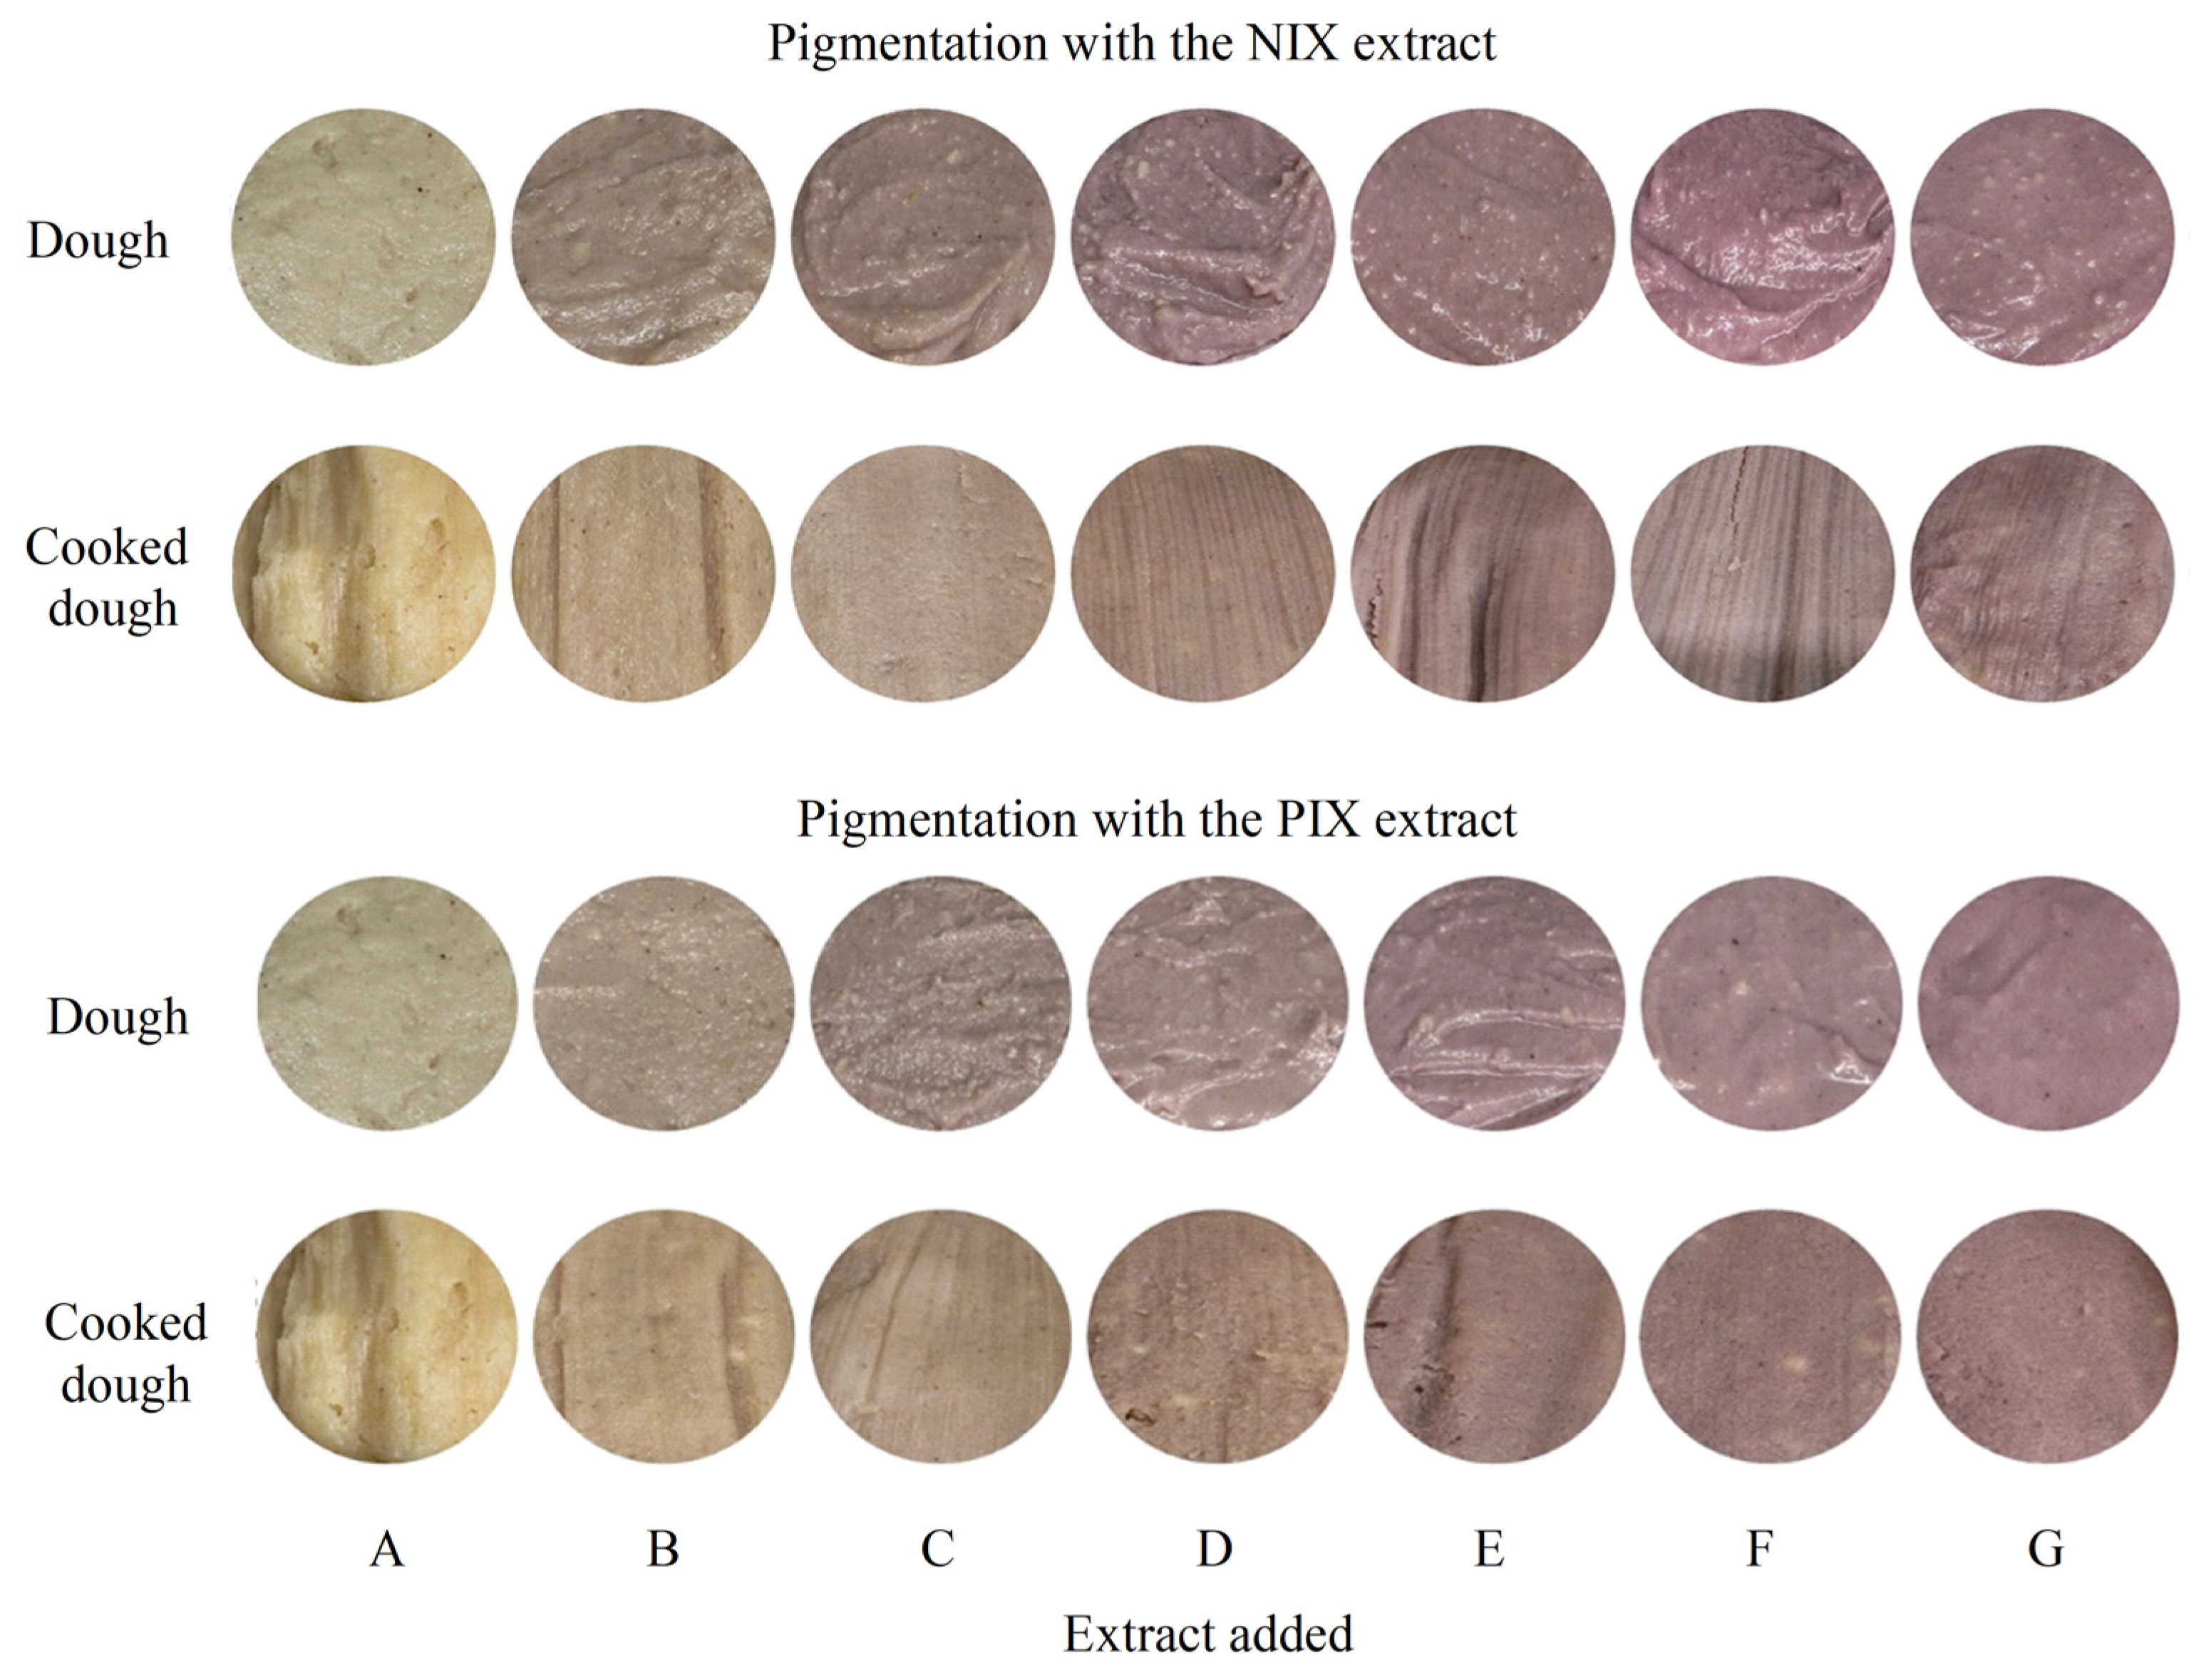
For the pigmentation of corn dough, aqueous biphasic systems were prepared and extracts with 41.97 (±0.21) and 38.60 (±0.09) mg CyEs/mL of anthocyanins were obtained from NIX and PIX flours, respectively, from the top phases after ethanol evaporation. The corn dough had initial color with a lightness of 58.3, chroma of 16.5, and hue angle of 86.1°. The gradual addition of extracts from populations NIX and PIX caused decreases in the three attributes, which also occurred logarithmically, consistent with Equations (11)–(13), respectively, with the values of the constants k 3 to k 12 shown in Table 3. Based on Equations (14)–(16), lightness of the corn dough tended toward a limit value of 40.8 with the NIX extract and to 22.6 with the PIX extract. The hue angle tended toward 346.5° with NIX and 319.6° with PIX, while chroma tended toward 9.1 with NIX and 8.5 with PIX. However, the small differences obtained for both extracts indicated that they caused similar effects. On the other hand, although extracts caused reductions in lightness and chroma, they also caused the hue angle to change from white–yellow to pink–purple (Figure 5) again due to the presence of anthocyanins in the pigmenting material.
However, edible corn products are obtained by cooking the dough. In this case, the cooked product was obtained by exposing the dough to steam for 1 to 2 h [32]. The present work was conducted at an atmospheric pressure of 77,993 Pa, and thus the cooking steam temperature was 82.7 °C, which was applied for 70 min, and caused increases in the color attributes (Figure 3), showing that anthocyanins underwent degradation upon exposure to high temperature. Tortillas are one of the main forms in which corn is consumed [54,55], where the grain is subjected to conditions that favor the deterioration of anthocyanins. In this regard, Vernon-Carter et al. [56] reported a loss of up to 10% of anthocyanins after cooking tortillas obtained with white corn flour incorporated with anthocyanins, although in that case, the time of exposure to high temperature was only approximately 80 s. However, even with this loss of pigmenting agents, the logarithmic behavior in the cooked dough was maintained with increasing extract concentration and, based on Equations (14)–(16), lightness tended toward a limit value of 46.5 with the NIX extract and 27.6 with the PIX extract. Meanwhile, the hue angle tended toward 352.3° with NIX and 307.5° with PIX. Likewise, chroma tended toward 10.7 with NIX and 10.1 with PIX. In this regard, although cooking caused a loss of pigmentation with the extracts, the results showed that this adverse effect could be compensated by adding a larger amount of extract or adjusting the pH to a more acidic condition for the hue angle to be closer to red and increased chroma [24]. Nevertheless, a pigmentation level of 60% of the mass was also chosen, and based on Equation (17), 10.85% of the NIX extract and 12.45% of the PIX extract were required to obtain the indicated pigmentation in the cooked dough. Likewise, these results demonstrated that extracts had moderate resistance to the heat treatment of cooking and therefore can be used as replacements for artificial dyes. Nevertheless, evaluations of convenient alternatives are needed to protect anthocyanins from thermal treatment, such as encapsulation [57], interactions with protective elements such as silk fibroin nanofibrils [58], or even chelation [59]. In addition, exploring alternatives is necessary to reduce the quantity of extract required to achieve a desirable level of pigmentation, which can be achieved by controlling the pH to a more acidic levels to reduce hue and increase chroma, while avoiding changes in flavor. Additionally, another condition that favors the preparation of a more concentrated extract can be selected.
On the other hand, the corn processing agroindustry is large [60] and is constantly evolving through product diversification [61,62]. However, at the same time, large amounts of waste or by-products are generated, which is why, in line with circular economy policies, different alternatives are being proposed to achieve their revaluation [63,64]. In this context, the results of this work showed that revaluing the degrained purple-corn cob is feasible to obtain pigments and use them in the food industry.

4. Conclusions

Aqueous biphasic systems based on ethanol, sodium citrate, and citric acid, aided by ultrasound and orbital agitation, allowed the separation of anthocyanins from degrained purple-corn cob flours. The extracts obtained showed potential for pigmenting food matrices, but due to their logarithmic behavior, very large amounts of the extracts are required to obtain complete pigmentation, and an optimized amount of extract must be determined. The use of degrained purple-corn cob flour extracts allowed for the stable pigmentation of yogurt and corn dough.

Author Contributions

Conceptualization, S.V.-G., L.G.-C., and A.L.-H.; methodology, S.V.-G. and L.G.-C.; software, S.V.-G. and A.L.-H.; validation, O.S.-C. and L.G.-C.; formal analysis, S.V.-G., L.G.-C., and R.A.d.S.C.O.-P.; investigation, A.L.-H., L.G.-C., and S.V.-G.; resources, S.V.-G.; data curation, A.L.-H. and L.G.-C.; writing—original draft preparation, S.V.-G., L.G.-C., and A.L.-H.; writing—review and editing, S.V.-G., L.G.-C., and A.L.-H.; visualization, S.V.-G. and L.G.-C.; supervision, R.A.d.S.C.O.-P., L.G.-C., and O.S.-C.; project administration, S.V.-G.; funding acquisition, S.V.-G. All authors have read and agreed to the published version of the manuscript.

Funding

This research was funded by Universidad Autónoma Chapingo, Mexico, grant number 24212-C-62.

Data Availability Statement

The original contributions presented in this study are included in the article. Further inquiries can be directed to the corresponding author.

Acknowledgments

The authors thank the Secretaría de Ciencia, Humanidades, Tecnología e Innovación (SECIHTI), Mexico, for the support received from the National Scholarship Program.

Conflicts of Interest

The authors declare no conflicts of interest.

Abbreviations

The following abbreviations were used in this manuscript:
C Chroma
H Hue angle (degrees)
L Lightness
AntAnthocyanin content (mg CyEs/100 g)
CACitric acid (3-carboxy-3-hydroxypentanedioic acid)
CyECyanidin equivalent
EtOHEthanol (CH3-CH2-OH) grade 96
FAEFerulic acid equivalent
NIXNegro de Ixtenco purple corn
pHPotential of hydrogen
PIXNegro de Ixtenco x Negro de Perú purple corn
SCTrisodium citrate (Na3C3H5O(COO)3)
TSPTotal soluble phenol content (mg FAEs/100 g)

References

  1. POWO Plants of the World Online. Royal Botanic Gardens, Kew. 2025. Available online: https://powo.science.kew.org/ (accessed on 8 June 2025).
  2. Hernández, E.d.l.C.; Andueza-Noh, R.H.; Latournerie-Moreno, L.; Ruiz-Sanchez, E.; Gordillo Ruiz, M.C.; Pérez, G.R. Diversity and Genetic Structure of Maize Landraces Cultivated in the Zoque Region from Chiapas, Mexico. Diversity 2025, 17, 159. [Google Scholar] [CrossRef]
  3. Pérez Ruiz, R.V.; Aguilar Toalá, J.E.; Cruz Monterrosa, R.G.; Rayas Amor, A.A.; Rodríguez, M.H.; Villasana, Y.C.; Pérez, J.H. Mexican Native Maize: Origin, Races and Impact on Food and Gastronomy. Int. J. Gastron. Food Sci. 2024, 37, 100978. [Google Scholar] [CrossRef]
  4. Mendoza-Mendoza, C.G.; Mendoza-Castillo, M.D.C.; Delgado-Alvarado, A.; Sánchez-Ramírez, F.J.; Kato-Yamakake, T.Á. Anthocyanins Content in the Kernel and Corncob of Mexican Purple Corn Populations. Maydica 2020, 65, 1–10. [Google Scholar]
  5. Rojas, M.L.; Ramirez, K.; Linares, G. Biocompounds Recovery from Purple Corn Cob By-Product: Extraction Kinetics, Thermal and Physicochemical Stability of Liquid and Powdered Anthocyanin-Rich Extract. Food Bioprod. Process. 2025, 149, 25–35. [Google Scholar] [CrossRef]
  6. Trezzi, S.; Scaccabarozzi, G.; Nossa, R.; Piazza, C.; Bianchi, A.R.; Rosi, E.; Tizzoni, F.; Mauri, M.; Camillo, L.; Baragetti, A.; et al. Behavioural, Cognitive, and Neurophysiological Effects of a Synbiotic Supplementation Enriched with Pigmented Corn Extract or Cornstarch in Drug-Naïve Children with Attention-Deficit Hyperactivity Disorder: A Randomised, Double-Blind, Comparison-Controlle. Clin. Nutr. ESPEN 2025, 65, 408–417. [Google Scholar] [CrossRef] [PubMed]
  7. Castorina, G.; Cappa, C.; Negrini, N.; Criscuoli, F.; Casiraghi, M.C.; Marti, A.; Rollini, M.; Consonni, G.; Erba, D. Characterization and Nutritional Valorization of Agricultural Waste Corncobs from Italian Maize Landraces through the Growth of Medicinal Mushrooms. Sci. Rep. 2023, 13, 21148. [Google Scholar] [CrossRef]
  8. Mandache, M.; Topală, C.M.; Vijan, L.E.; Cosmulescu, S. The Characterization of Peach Pomace and the Influence of Its Incorporation on the Chemical Composition of Biscuits. Appl. Sci. 2025, 15, 6983. [Google Scholar] [CrossRef]
  9. Colombo, R.; Ferron, L.; Papetti, A. Colored Corn: An up-Date on Metabolites Extraction, Health Implication, and Potential Use. Molecules 2021, 26, 199. [Google Scholar] [CrossRef]
  10. Pérez-Orozco, J.P.; Sánchez-Herrera, L.M.; Barrios-Salgado, E.; Sumaya-Martínez, M.T. Kinetics of Solid-Liquid Extraction of Anthocyanins Obtained from Hibiscus Rosa-Sinensis. Rev. Mex. Ing. Química 2020, 19, 813–826. [Google Scholar] [CrossRef]
  11. Tena, N.; Asuero, A.G. Up-to-Date Analysis of the Extraction Methods for Anthocyanins: Principles of the Techniques, Optimization, Technical Progress, and Industrial Application. Antioxidants 2022, 11, 286. [Google Scholar] [CrossRef] [PubMed]
  12. Singh, L.; Singh, B.; Bhatt, I.D. NADES-Based Extraction Optimization and Enrichment of Cyanidin-3-O-Galactoside from Rhododendron Arboreum Sm.: Kinetics and Thermodynamics Insights. Food Chem. 2024, 455, 139793. [Google Scholar] [CrossRef] [PubMed]
  13. Nawawi, N.I.M.; Khushairi, N.A.A.A.; Ijod, G.; Azman, E.M. Extraction of Anthocyanins and Other Phenolics from Dried Blackcurrant (Ribes nigrum L.) Pomace via Ultrasonication. Sustain. Chem. Environ. 2025, 9, 100208. [Google Scholar] [CrossRef]
  14. Wang, Y.; Sun, L.; Peng, J.; Wang, Z.; Zhao, T.; Cao, J.; Liu, Y.; Cheng, G.; Brennan, C. Chemical Composition and Functional Properties of Protein-Polyphenol Complexes from Purple Rice: Effects of Alkaline and Enzymatic Extraction. Food Chem. 2025, 489, 145010. [Google Scholar] [CrossRef]
  15. Maciel-Silva, F.W.; Castro, L.E.N.; Sganzerla, W.G.; Costa, J.M.; Rostagno, M.A.; Forster-Carneiro, T. Valorization of Black Grape Pomace by Pressurized Hot Water Extraction and Hydrolysis: Real-Time Online and in-Line Monitoring. J. Environ. Chem. Eng. 2024, 12, 111641. [Google Scholar] [CrossRef]
  16. Santos, R.O.; Keller, L.M.; Mohammad, S.S.; Barbosa Júnior, J.L.; Barbosa, M.I.M.J. Adsorption and Desorption Process for High Recovery and Purification of Anthocyanins from (Clitoria ternatea L.) Using Macroporous Resins. J. Dispers. Sci. Technol. 2024, 1–11. [Google Scholar] [CrossRef]
  17. Pereda-Miranda, R.; Castañeda-Gómez, J.F.; Fragoso-Serrano, M. Recycling Preparative Liquid Chromatography, the Overlooked Methodology for the Purification of Natural Products. Rev. Bras. Farmacogn. 2024, 34, 927–947. [Google Scholar] [CrossRef]
  18. Carranza-Gomez, M.; Valle-Guadarrama, S.; Domínguez-Puerto, R.; Sandoval-Castilla, O.; Guerra-Ramírez, D. Bioactive Compounds and Pigmenting Potential of Vaccinium corymbosum Extracts Separated with Aqueous Biphasic Systems Aided by Centrifugation. Processes 2025, 13, 1072. [Google Scholar] [CrossRef]
  19. García-Cruz, L.; Valle-Guadarrama, S.; Soto-Hernández, R.M.; Guerra-Ramírez, D.; Zuleta-Prada, H.; Martínez-Damián, M.T.; Ramírez-Valencia, Y.D. Separation of Pitaya (Stenocereus pruinosus) Betaxanthins, Betacyanins, and Soluble Phenols through Multistage Aqueous Two-Phase Systems. Food Bioprocess Technol. 2021, 14, 1791–1804. [Google Scholar] [CrossRef]
  20. Didion, P.Y.; Gijsbert Tjalsma, T.; Su, Z.; Malankowska, M.; Pinelo, M. What Is next? The Greener Future of Solid Liquid Extraction of Biobased Compounds: Novel Techniques and Solvents Overpower Traditional Ones. Sep. Purif. Technol. 2023, 320, 124147. [Google Scholar] [CrossRef]
  21. Gomes, J.; Ferreira, S.; Reinert, O.; Gandol, R.; Ayra, L.; Santos, V.; Veloso, C.M.; Ilh, C.; Cristina, R.; Bonomo, F. Evaluation of Salting-out Effect in the Liquid e Liquid Equilibrium of Aqueous Two-Phase Systems Composed of 2-Propanol and Na2SO4/MgSO4 at Different Temperatures. Fluid Phase Equilib. 2017, 450, 184–193. [Google Scholar] [CrossRef]
  22. Hernández-Rodríguez, G.; Valle-Guadarrama, S.; Guerra-Ramírez, D.; Domínguez-Puerto, R.; López-Cruz, I.L. Anthocyanins of Ardisia spp. Fruits Separated with pH Driven-Aqueous Biphasic Systems. Sep. Sci. Technol. 2025, 60, 426–437. [Google Scholar] [CrossRef]
  23. Liu, X.; Mu, T.; Sun, H.; Zhang, M.; Chen, J. Optimisation of Aqueous Two-Phase Extraction of Anthocyanins from Purple Sweet Potatoes by Response Surface Methodology. Food Chem. 2013, 141, 3034–3041. [Google Scholar] [CrossRef]
  24. Feitosa, B.F.; Decker, B.L.A.; de Brito, E.S.; Marques, M.C.; Rodrigues, S.; Mariutti, L.R.B. Anthocyanins Stability Theory—Evidence Summary on the Effects of Microencapsulation. Food Bioprod. Process. 2025, 153, 77–86. [Google Scholar] [CrossRef]
  25. SPSS, Inc. Sigma Plot 2000 User’s Guide; SPSS Inc.: Chicago, IL, USA, 2000; ISBN 1-56827-232-4. [Google Scholar]
  26. Merchuk, J.C.; Andrews, B.A.; Asenjo, J.A. Aqueous Two-Phase Systems for Protein Separation Studies on Phase Inversion. J. Chromatogr. B 1998, 711, 285–293. [Google Scholar] [CrossRef] [PubMed]
  27. Seader, J.D.; Henley, E.J.; Roper, D.K. Separation Process Principles: Chemical and Biochemical Operations, 3rd ed.; John Wiley & Sons, Inc.: Danvers, MA, USA, 2011; ISBN 978-0-470-48183-7. [Google Scholar]
  28. Williamson, J.C. Liquid–Liquid Demonstrations: Phase Equilibria and the Lever Rule. J. Chem. Educ. 2021, 98, 2356–2363. [Google Scholar] [CrossRef]
  29. Marchel, M.; João, K.G.; Marrucho, I.M. On the Use of Ionic Liquids as Adjuvants in PEG-(NH4)2SO4 Aqueous Biphasic Systems: Phase Diagrams Behavior and the Effect of IL Concentration on Myoglobin Partition. Sep. Purif. Technol. 2019, 210, 710–718. [Google Scholar] [CrossRef]
  30. The Mathworks Inc. Optimization ToolboxTM User’s Guide, R2008a; The Mathworks Inc.: Natick, MA, USA, 2008. [Google Scholar]
  31. Beltran, J.G.; Bruusgaard, H.; Servio, P. Gas Hydrate Phase Equilibria Measurement Techniques and Phase Rule Considerations. J. Chem. Thermodyn. 2012, 44, 1–4. [Google Scholar] [CrossRef]
  32. Pilcher, J.M. Que Vivan Los Tamales!: Food and the Making of Mexican Identity; University of New Mexico Press: Albuquerqe, NM, USA, 1998; ISBN 978-0-8263-1873-2. [Google Scholar]
  33. AOAC. Methods of Analysis, 17th ed.; Association of Official Analytical Chemists: Washington, DC, USA, 2000. [Google Scholar]
  34. Sant’Anna, V.; Gurak, P.D.; Ferreira, M.L.D.; Tessaro, I.C. Tracking Bioactive Compounds with Colour Changes in Foods—A Review. Dye. Pigment. 2013, 98, 601–608. [Google Scholar] [CrossRef]
  35. Singleton, V.L.; Rossi, J.A. Colorimetry of Total Phenolics with Phosphomolybdic-Phosphotungstic Acid Reagents. Am. J. Enol. Vitic. 1965, 16, 144–158. [Google Scholar] [CrossRef]
  36. Madadi, B.; Pazuki, G.; Nasernejad, B. Partitioning of Cefazolin in Biocompatible Aqueous Biphasic Systems Based on Surfactant. J. Chem. Eng. Data 2013, 58, 2785–2792. [Google Scholar] [CrossRef]
  37. Rodríguez-Salinas, P.A.; Zavala-García, F.; Urías-Orona, V.; Muy-Rangel, D.; Heredia, J.B.; Niño-Medina, G. Chromatic, Nutritional and Nutraceutical Properties of Pigmented Native Maize (Zea mays L.) Genotypes from the Northeast of Mexico. Arab. J. Sci. Eng. 2020, 45, 95–112. [Google Scholar] [CrossRef]
  38. Lee, C.M.; Gan, Y.L.; Chan, Y.L.; Yap, K.L.; Tang, T.K.; Tan, C.P.; Lai, O.M. Physicochemical and Sensory Analyses of High Fibre Bread Incorporated with Corncob Powder. Int. Food Res. J. 2019, 26, 1609–1616. [Google Scholar]
  39. Njideka, B.E.; Chijioke, M.B.; Chioma, O.N.; Nnennaya, A.N.; Iheduzaju, P.I.A. Maize Cob as Dietary Fiber Source for High-Fiber Biscuit Primary Tabs. GSC Biol. Pharm. Sci. 2020, 12, 138–144. [Google Scholar] [CrossRef]
  40. do Nascimento, G.K.S.; dos Santos, T.M.; Andressa, I.; Benassi, V.M.; de Andrade Neves, N.; Schmiele, M. Exploring the Use of Purple Corn Cob Flour as a New Fiber Source in Pan Bread Improved by Commercial Hemicellulases. Recent Prog. Nutr. 2024, 4, 1–17. [Google Scholar] [CrossRef]
  41. de Pascual-Teresa, S.; Santos-Buelga, C.; Rivas-Gonzalo, J.C. LC–MS Analysis of Anthocyanins from Purple Corn Cob. J. Sci. Food Agric. 2002, 82, 1003–1006. [Google Scholar] [CrossRef]
  42. Yang, Z.; Zhai, W. Identification and Antioxidant Activity of Anthocyanins Extracted from the Seed and Cob of Purple Corn (Zea mays L.). Innov. Food Sci. Emerg. Technol. 2010, 11, 169–176. [Google Scholar] [CrossRef]
  43. Khamphasan, P.; Lomthaisong, K.; Harakotr, B.; Ketthaisong, D.; Scott, M.P.; Lertrat, K.; Suriharn, B. Genotypic Variation in Anthocyanins, Phenolic Compounds, and Antioxidant Activity in Cob and Husk of Purple Field Corn. Agronomy 2018, 8, 271. [Google Scholar] [CrossRef]
  44. Aguilar-Hernández, Á.D.; Salinas Moreno, Y.; Ramírez-Díaz, J.L.; Alemán-de la Torre, I.; Bautista-Ramírez, E.; Flores-López, H.E. Antocianinas y Color en Grano y Olote de Maíz Morado Peruano Cultivado En Jalisco, México. Rev. Mex. Ciencias Agrícolas 2019, 10, 1071–1082. [Google Scholar] [CrossRef]
  45. Hao, R.; Zhang, H.; Feng, Y.; Yang, D.; Zhao, Z.; Zhao, S. The Effect of Different Solvents and Acidifying Reagents on the Anthocyanin Profiles and Antioxidant Capacity of Purple Corn. Chem. Pap. 2022, 76, 4691–4704. [Google Scholar] [CrossRef]
  46. Medina-Hoyos, A.; Narro-León, L.; Chávez-Cabrera, A. Purple Corn (Zea mays L.) Crop in the Peruvian Highlands: Adaptation and Identification of High-Yield and High Anthocyanin Content Cultivars. Sci. Agropecu. 2020, 11, 291–299. [Google Scholar] [CrossRef]
  47. González-Amado, M.; Rodil, E.; Arce, A.; Soto, A.; Rodríguez, O. Fluid Phase Equilibria The Effect of Temperature on Polyethylene Glycol (4000 or 8000)—(Sodium or Ammonium) Sulfate Aqueous Two Phase Systems. Fluid Phase Equilib. 2016, 428, 95–101. [Google Scholar] [CrossRef]
  48. Sandate-Flores, L.; Rodríguez-Rodríguez, J.; Velázquez, G.; Mayolo-Deloisa, K.; Rito-Palomares, M.; Torres, J.A.; Parra-Saldívar, R. Low-Sugar Content Betaxanthins Extracts from Yellow Pitaya (Stenocereus pruinosus). Food Bioprod. Process. 2020, 121, 178–185. [Google Scholar] [CrossRef]
  49. Nelson, D.L.; Cox, M.M. Lehninger Principles of Biochemistry, 5th ed.; W.H. Freeman and Company: New York, NY, USA, 2008. [Google Scholar]
  50. Gullón, P.; Eibes, G.; Lorenzo, J.M.; Pérez-Rodríguez, N.; Lú-Chau, T.A.; Gullón, B. Green Sustainable Process to Revalorize Purple Corn Cobs within a Biorefinery Frame: Co-Production of Bioactive Extracts. Sci. Total Environ. 2020, 709, 136236. [Google Scholar] [CrossRef]
  51. Li, C.-Y.; Kim, H.-W.; Won, S.; Min, H.-K.; Park, K.-J.; Park, J.-Y.; Ahn, M.-S.; Rhee, H.-I. Corn Husk as a Potential Source of Anthocyanins. J. Agric. Food Chem. 2008, 56, 11413–11416. [Google Scholar] [CrossRef]
  52. De Nisi, P.; Borlini, G.; Parizad, P.A.; Scarafoni, A.; Sandroni, P.; Cassani, E.; Adani, F.; Pilu, R. Biorefinery Approach Applied to the Valorization of Purple Corn Cobs. ACS Sustain. Chem. Eng. 2021, 9, 3781–3791. [Google Scholar] [CrossRef]
  53. Benjaruk, V.; Varaporn, L. Antioxidant Properties and Color Stability of Anthocyanin Purified Extracts from Thai Waxy Purple Corn Cob. J. Food Nutr. Res. 2015, 3, 629–636. [Google Scholar]
  54. Vázquez-Carrillo, M.G.; Palacios-Rojas, N.; Mier-Sainz Trapaga, R.; García-Cruz, L.; Rosas-Zamora, G.; Rosales-Nolasco, A.; Santillano-Gómez, L.C. Commercial Limes (Calcium Hydroxide) in Corn Tortilla Production: Changes in PH, Color, Sensory Characteristics, and Shelf Life. Qual. Assur. Saf. Crop. Foods 2025, 17, 173–185. [Google Scholar] [CrossRef]
  55. Félix-Sámano, A.L.; Félix-Medina, J.V.; Quintero-Soto, M.F.; Diaz-Peña, I.; Gutiérrez-Dorado, R. Nixtamalization and Extrusion Processes: Effects on Physicochemical, Nutritional, and Nutraceutical Properties in the Processing of Corn into Tortilla. Int. J. Food Sci. 2025, 2025, 1–26. [Google Scholar] [CrossRef]
  56. Vernon-Carter, E.J.; Alvarez-Ramirez, J.; Bello-Perez, L.A.; Gonzalez, M.; Reyes, I.; Alvarez-Poblano, L. Supplementing White Maize Masa with Anthocyanins: Effects on Masa Rheology and on the in Vitro Digestibility and Hardness of Tortillas. J. Cereal Sci. 2020, 91, 102883. [Google Scholar] [CrossRef]
  57. Xie, J.; Sameen, D.E.; Xiao, Z.; Zhu, H.; Lai, Y.; Tang, T.; Rong, X.; Fu, F.; Qin, W.; Chen, M.; et al. Protecting Anthocyanins of Postharvest Blueberries through Konjac Glucomannan/Low-Acyl Gellan Gum Coatings Contained Thymol Microcapsule during Low-Temperature Storage. Food Chem. 2025, 463, 141347. [Google Scholar] [CrossRef]
  58. Ma, Z.; Jing, P. Stabilization of Black Rice Anthocyanins by Self-Assembled Silk Fibroin Nanofibrils: Morphology, Spectroscopy and Thermal Protection. Int. J. Biol. Macromol. 2020, 146, 1030–1039. [Google Scholar] [CrossRef] [PubMed]
  59. Tachibana, N.; Kimura, Y.; Ohno, T. Examination of Molecular Mechanism for the Enhanced Thermal Stability of Anthocyanins by Metal Cations and Polysaccharides. Food Chem. 2014, 143, 452–458. [Google Scholar] [CrossRef]
  60. da Rosa, R.G.; Ferreira, V.C.; Barroso, T.L.C.T.; Castro, L.E.N.; Forster-Carneiro, T. Corn Biomass as a Feedstock for Biorefinery: A Bibliometric Analysis of Research on Bioenergy, Biofuel and Value-added Products. Biofuels Bioprod. Biorefin. 2025, 19, 206–230. [Google Scholar] [CrossRef]
  61. García-Cordero, A.L.; Jimenez-Alvarado, R.; Bautista, M.; Diaz-Sánchez, F.; Ibarra, I.S.; Sánchez-Ortega, I.; Santos, E.M. Improvement of Corn Extruded Snacks Properties by Incorporation of Pulses. Rev. Mex. Ing. Química 2024, 23, 1–28. [Google Scholar] [CrossRef]
  62. Sánchez-Nuño, Y.A.; Nuño, K.; Martínez-Preciado, A.H.; Silva-Jara, J.M.; Velázquez-Carriles, C.A.; Gomez-Aldapa, C.A.; Villarruel-López, A. Design and Optimization of a Second-Generation Extruded Snack Using Carrot Waste, Blue Corn Flour, and Ellagic Acid as Functional Ingredients. Foods 2025, 14, 1657. [Google Scholar] [CrossRef]
  63. Sharma, N.; Bhardwaj, A.; Esua, O.J.; Pojić, M.; Tiwari, B.K. Cereal Processing By-Products and Wastewater for Sustainable Protein Extraction. Waste Manag. 2025, 201, 114790. [Google Scholar] [CrossRef] [PubMed]
  64. Asiri, A.S.; Matar, A.; Mahmoud Ismail, A. Chemical Composition, Physical Properties, and Sensory Evaluation of Wheat-Based Cookies Enriched with Different Proportions of Corn Silk. Ital. J. Food Sci. 2024, 36, 317–330. [Google Scholar] [CrossRef]
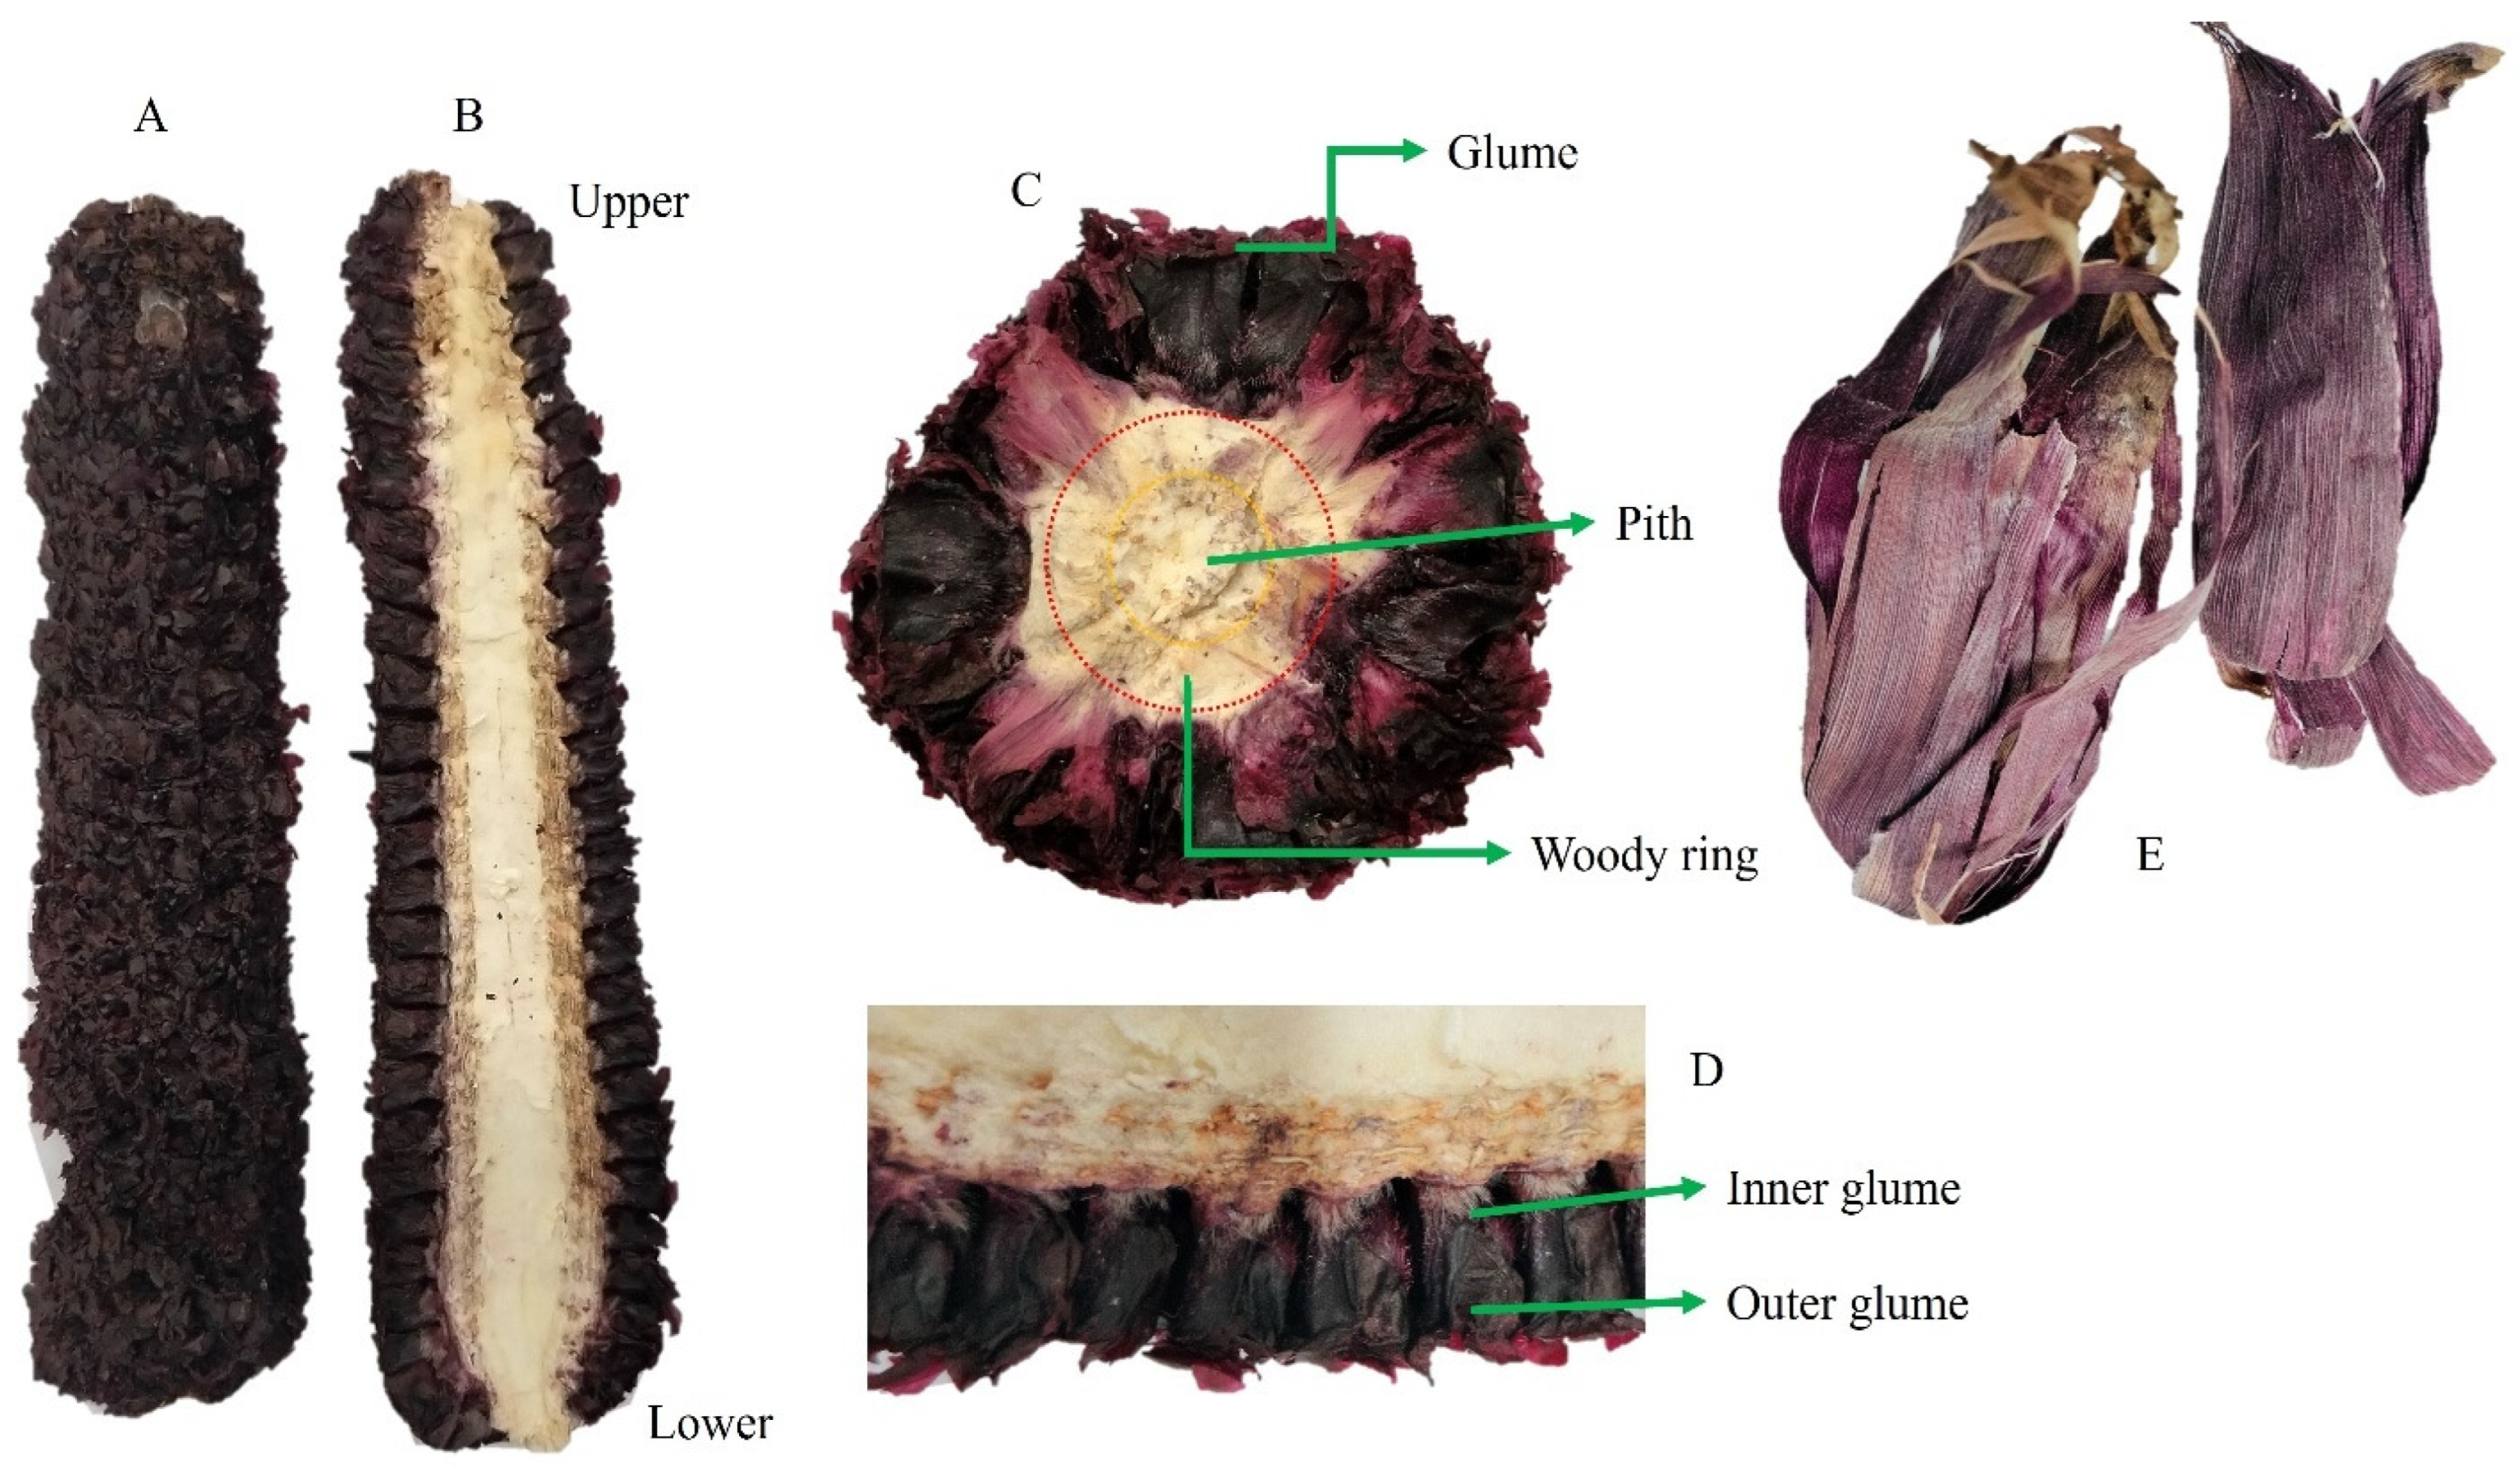
Figure 1. Macrostructure of a degrained purple-corn cob from San Juan Ixtenco, Tlaxcala, Mexico: (A) whole degrained corn cob; (B) longitudinal section of the corn cob; (C) cross-section of the lower part of the cob; (D) axial section of the corn cob; and (E) corn leaf (totomoxtle).
Applsci 15 10730 g001
Figure 3. Variations in lightness (a,b), hue angle (c,d), and chroma (e,f) during pigmentation tests of yogurt (left panels) and corn dough (right panels) with NIX and PIX extracts. Error bars represent the standard deviations.
Applsci 15 10730 g003
Figure 4. Visual appearance (bottom panel), pH (a), lightness (b), hue angle (c), and chroma (d) of yogurt pigmented with extracts of degrained purple-corn cob flours from the populations NIX and PIX during storage at 4 and 25 °C. ns: non-significant difference over time (α > 0.05). *: significant difference over time (α ≤ 0.05). Commercial: visual appearance of yogurt marketed under the name “strawberry flavor”.
Applsci 15 10730 g004
Figure 5. Visual appearance of corn dough and cooked corn dough pigmented with extracts obtained from degrained cob flours from populations NIX and PIX. Amounts of the NIX and PIX extracts added (%), respectively: A (0, 0), B (4.67, 4.70), C (8.81, 8.20), D (12.81, 11.95), E (16.32, 15.33), F (19.60, 18.45), and G (22.48, 23.81).
Applsci 15 10730 g005
Table 1. Matlab® script used to determine the concentration limits of the tie line.
Matlab® Code
function F = system (vars)
W_t = vars (1); W_b = vars (2);
Z_t = k1*exp(k2*sqrt(W_t) − k3*W_top^3);
Z_b = k1*exp(k2*sqrt(W_b) − k3*W_b^3);
F (1) = β*W_t + (1 − β)*W_b-Wm;
F (2) = β*Z_t + (1 − β)*Z_b-Zm;
end
W_t_initial =   w b i n m i n ; W_b_initial =   w b i n m a x ;
initial_solution = [W_t_initial, W_b_initial];
options = optimoptions (‘fsolve’,‘Display’, ‘iter’);
[solution, fval] = fsolve (@system, initial_solution, options);
W_t = solution (1); W_b = solution (2);
Table 2. Proximate composition, bioactive compounds, and color of degrained purple-corn cob flours obtained from NIX and PIX.
VariableFlour
NIXPIX
Proximal analysis
Moisture (%)7.13 (±0.03) a6.99 (±0.02) b
Crude protein (%)3.91 (±0.05) a3.44 (±0.06) a
Ash (%)4.70 (±0.00) a4.25 (±0.04) b
Ethereal extract (%)0.72 (±0.09) a0.79 (±0.22) a
Crude fiber (%)36.59 (±2.82) b38.87 (±0.33) a
Carbohydrates (%)46.95 (±2.56) a45.66 (±0.32) a
Bioactive compounds
TSP4678.1 (±149.0) a4740.1 (±170.8) a
Ant1678.2 (±6.1) a1651.8 (±11.7) a
Color
L 26.57 (±2.64) a28.24 (±2.52) a
H 17.04 (±4.07) a21.75 (±4.06) a
C 10.01 (±0.12) a10.97 (±0.39) a
NIX, Negro de Ixtenco; PIX, Negro de Ixtenco x Negro de Perú; L , lightness; H , hue angle (degrees); C , chroma; TSP, total soluble phenol content (mg/100 g, dry basis); Ant, total anthocyanin content (mg/100 g, dry basis). The same letters in the same row indicate non-significant differences (Tukey’s test, 0.05). Values in parentheses represent standard deviations.
Table 3. Pigmentation parameters of yogurt, corn dough, and cooked corn dough corresponding to Equations (11)–(13).
Lightness ( L * )Hue Angle ( H * )Chroma ( C * )
k 4 k 5 k 6 r L * 2 k 7 k 8 k 9 r H * 2 k 10 k 11 k 12 r C * 2
Pigmentation of yogurt with extract of NIX
66.6−17.11.88580.999178.7−176.32.16560.9991.110.30.32100.999
Pigmentation of yogurt with extract of PIX
66.6−16.31.85000.995178.7−176.52.02050.9991.114.10.21700.998
Pigmentation of corn dough with extract of NIX
59.1−18.30.14010.83187.8−101.30.08440.98516.5−7.40.79330.838
Pigmentation of corn dough with extract of PIX
56.0−33.40.04110.88787.4−127.80.07360.99616.5−8.00.77420.958
Pigmentation of cooked corn dough with extract of NIX
62.3−15.80.04440.69681.2−88.90.02890.99521.3−10.60.17000.999
Pigmentation of cooked corn dough with extract of PIX
62.9−35.30.02210.88981.1−133.60.01850.99621.4−11.30.12250.993
Disclaimer/Publisher’s Note: The statements, opinions and data contained in all publications are solely those of the individual author(s) and contributor(s) and not of MDPI and/or the editor(s). MDPI and/or the editor(s) disclaim responsibility for any injury to people or property resulting from any ideas, methods, instructions or products referred to in the content.