Article

Variation in Seismic Wave Velocities at Shallow Depth and the Masking of Nonlinear Soil Behavior Based on the ARGONET (Cephalonia, Greece) Vertical Array Data

by
Zafeiria Roumelioti
1,*,
Fabrice Hollender
2,3,
Nikolaos Theodoulidis
4 and
Ioannis Grendas
1
1
Department of Geology, University of Patras, 26504 Rio Patras, Greece
2
French Alternative Energies and Atomic Energy Commission (CEA), DES, 13108 Saint Paul Lez Durance, France
3
Grenoble Alpes, National Centre for Scientific Research (CNRS), Institute for Research and Development (IRD), University Gustave Eiffel, ISTerre, 38000 Grenoble, France
4
Institute of Engineering Seismology and Earthquake Engineering (ITSAK-EPPO), 55535 Thessaloniki, Greece
*
Author to whom correspondence should be addressed.
Appl. Sci. 2025, 15(19), 10727; https://doi.org/10.3390/app151910727
Submission received: 10 September 2025 / Revised: 24 September 2025 / Accepted: 29 September 2025 / Published: 5 October 2025
(This article belongs to the Special Issue New Advances in Engineering Seismology)

Abstract

We investigate the variation in shear-wave velocity (VS) in the shallow soil of the ARGONET vertical array in Cephalonia, Greece, utilizing an extensive 8–10-year dataset of earthquake records and applying seismic interferometry by deconvolution and Generalized Additive Models (GAMs). We identify and quantify the contributions of seasonal variation, soil anisotropy, soil nonlinearity, and long-term VS changes. Of the examined factors, nonlinearity produces the strongest VS changes in the form of reduction of up to several tens of m/s. The azimuthal and seasonal partial effects appear similar in strength. However, VS also exhibits year-to-year variation, with lower levels likely linked to the slow recovery of the soil following strong earthquakes in the broader region. When this partial effect is also considered, the temporal variation of VS is more significant than the azimuthal variation. We also observed that strong weather phenomena, such as the unusual hurricane “Ianos” that hit western Greece in 2020, are captured in our model through tensor interaction terms. Our model can identify VS drops related to nonlinear soil behavior even when masked by other effects. We demonstrate and verify this through seismic interferometry to stepwise increasing parts of earthquake recordings highlighting these within-events or coseismic VS drops.

1. Introduction

Numerous past studies have proven that the method of seismic interferometry by deconvolution is highly accurate and robust for providing in situ shear wave velocities, VS, from vertical array earthquake waveform data [1,2,3,4,5]. When earthquake recordings sample time densely, VS variation can be tracked with high resolution [6,7].
In shallow unconsolidated sediments, V S can vary considerably over time due to environmental factors such as air and soil temperature, soil moisture, and changes in the water table depth (e.g., [3,6,7,8,9,10,11,12,13,14]). Reduction of V S is also a frequently reported expression of soil nonlinearity, linked to shear-modulus degradation (e.g., [15,16,17,18]). Following strong earthquakes, long-term V S drops often reflect substantial changes in soil properties that take few hours to years to recover (e.g., [17,19,20,21,22,23,24,25,26]).
A past study [6] examined the temporal variation of V S at ARGONET vertical array site on the island of Cephalonia in western Greece. Using data from the first ~2.5 years of the infrastructure’s operation, available at that time, ref. [6] focused on a significant seasonal variation. It was argued that in shallow unsaturated soil layers at the study site, this variation can be as high as 40% of the yearly minimum velocity value. It was demonstrated how this seasonal effect can impact high-frequency site response, a topic addressed explicitly in a following paper [27]. It was also noted that V S lowering due to the seasonal pattern may be of the same order of magnitude as V S decrease due to soil nonlinearity, at least at low strain levels.
In this paper, we extend previous work with the purpose of studying in detail not only the seasonal effect at the ARGONET site, but also the contributions of soil anisotropy and nonlinearity to V S variation. Using seismic interferometry by deconvolution, we analyze a more complete earthquake waveform dataset spanning 8 to 10 years to determine the multiyear V S variation at the site. Using a generalized additive model (GAM) [28], we study the major factors contributing to this variation and assess their relative importance quantitatively. Because shallow, unconsolidated soil significantly impacts a site’s response during earthquakes (e.g., [29,30,31,32,33,34,35,36,37]), understanding V S changes and recognizing the mechanisms causing them is crucial for improving earthquake resilience. Such targeted monitoring could also be useful in enhancing the resilience of underground structures [38]. Our study focuses on a single well-instrumented site to develop a methodology for identifying and quantifying the various causes of V S variation. This methodology could then be applied to other sites with different geologies.

2. Data

The ARGONET borehole array [39], situated in Argostoli, the capital of Cephalonia Island in western Greece, serves as the source for all herein processed seismic data. The infrastructure is strategically positioned within the seismotectonic setting of the pivotal region between the Hellenic subduction zone to the south and the Apoulia-Aegean continental collision zone to the north (Figure 1, inset map). This complicated geological context results in high levels of seismicity, making the ARGONET location ideal for gathering strong motion records in Europe.
The ARGONET borehole array consists of 5 accelerometer stations, one on the ground surface (CK0) and four in boreholes (CK6, CK15, CK40, CK83 at depths of 5.6 m, 15.5 m, 40.3 m, and 83.4 m, respectively). ARGONET data collection started in July 2015, and only CK6 was installed a year later, in July 2016.
Since September 2024, ARGONET data have been available in raw format and in real-time through the European Integrated Data Archive (EIDA) [40]. Furthermore, a preprocessed, ready-to-use collection of the strongest recorded events is available with periodic updates through a dedicated web portal (see Data Availability Statement). Detailed information about this database and the infrastructure in general is provided by [39].
For this study, we used the ARGONET database in the version that included events from the array’s launch in July 2015 through 31 May 2024. The dataset contains accelerometric waveforms from 1347 earthquakes. No waveforms were discarded prior to analysis; the only selection criterion was that the minimum Peak Ground Acceleration (PGA) recorded at the deepest sensor be equal to or greater than 0.2 mg in the vertical component. Metadata on the processed events, i.e., origin time, hypocenter location, and local magnitude, ML, were obtained from the online catalog of the Institute of Geodynamics of the National Observatory of Athens (see Data Availability Statement). Approximately 9% of the events in the ARGONET database were missing from the NOA catalog due to their small magnitude; for these events, we followed NOA’s routine location approach to determine the missing source parameters and maintain uniformity in the ARGONET catalog.
Figure 2 provides a brief description of the dataset through graphs. The ML ranges from 0.8 to 6.6, and the epicentral distances (Repi) range from 1 km to 792 km. The recorded waveforms are mostly weak to moderate, with PGA at the ground surface station CK0 and in the originally recorded directions reaching up to 0.17 g.

3. Interferometry by Deconvolution

We apply the method of seismic interferometry by deconvolution to the sensor pairs CK0-CK6 (0–5.6 m) and CK0-CK15 (0–15.5 m) of the ARGONET vertical array. The method deconvolves the Fourier transform of the recorded signal at sensor j, A j ω , from the Fourier transform of the signal at reference station i, A i ( ω ) (e.g., [4,5]):
D j i t = F T 1 A i ( ω ) m a x A j ω , k A j ω , A j ω A j ω m a x ,
where ω is the angular frequency, F T 1 the inverse Fourier transform and k the “water-level” parameter introduced to stabilize the deconvolution at very low denominator values [41], herein set to 10% of the average spectral power. The deconvolution result is the impulse response (Green’s function) between the two seismic sensors. This assumes that the source signature and path effects are common to both sensor locations and are therefore effectively eliminated.
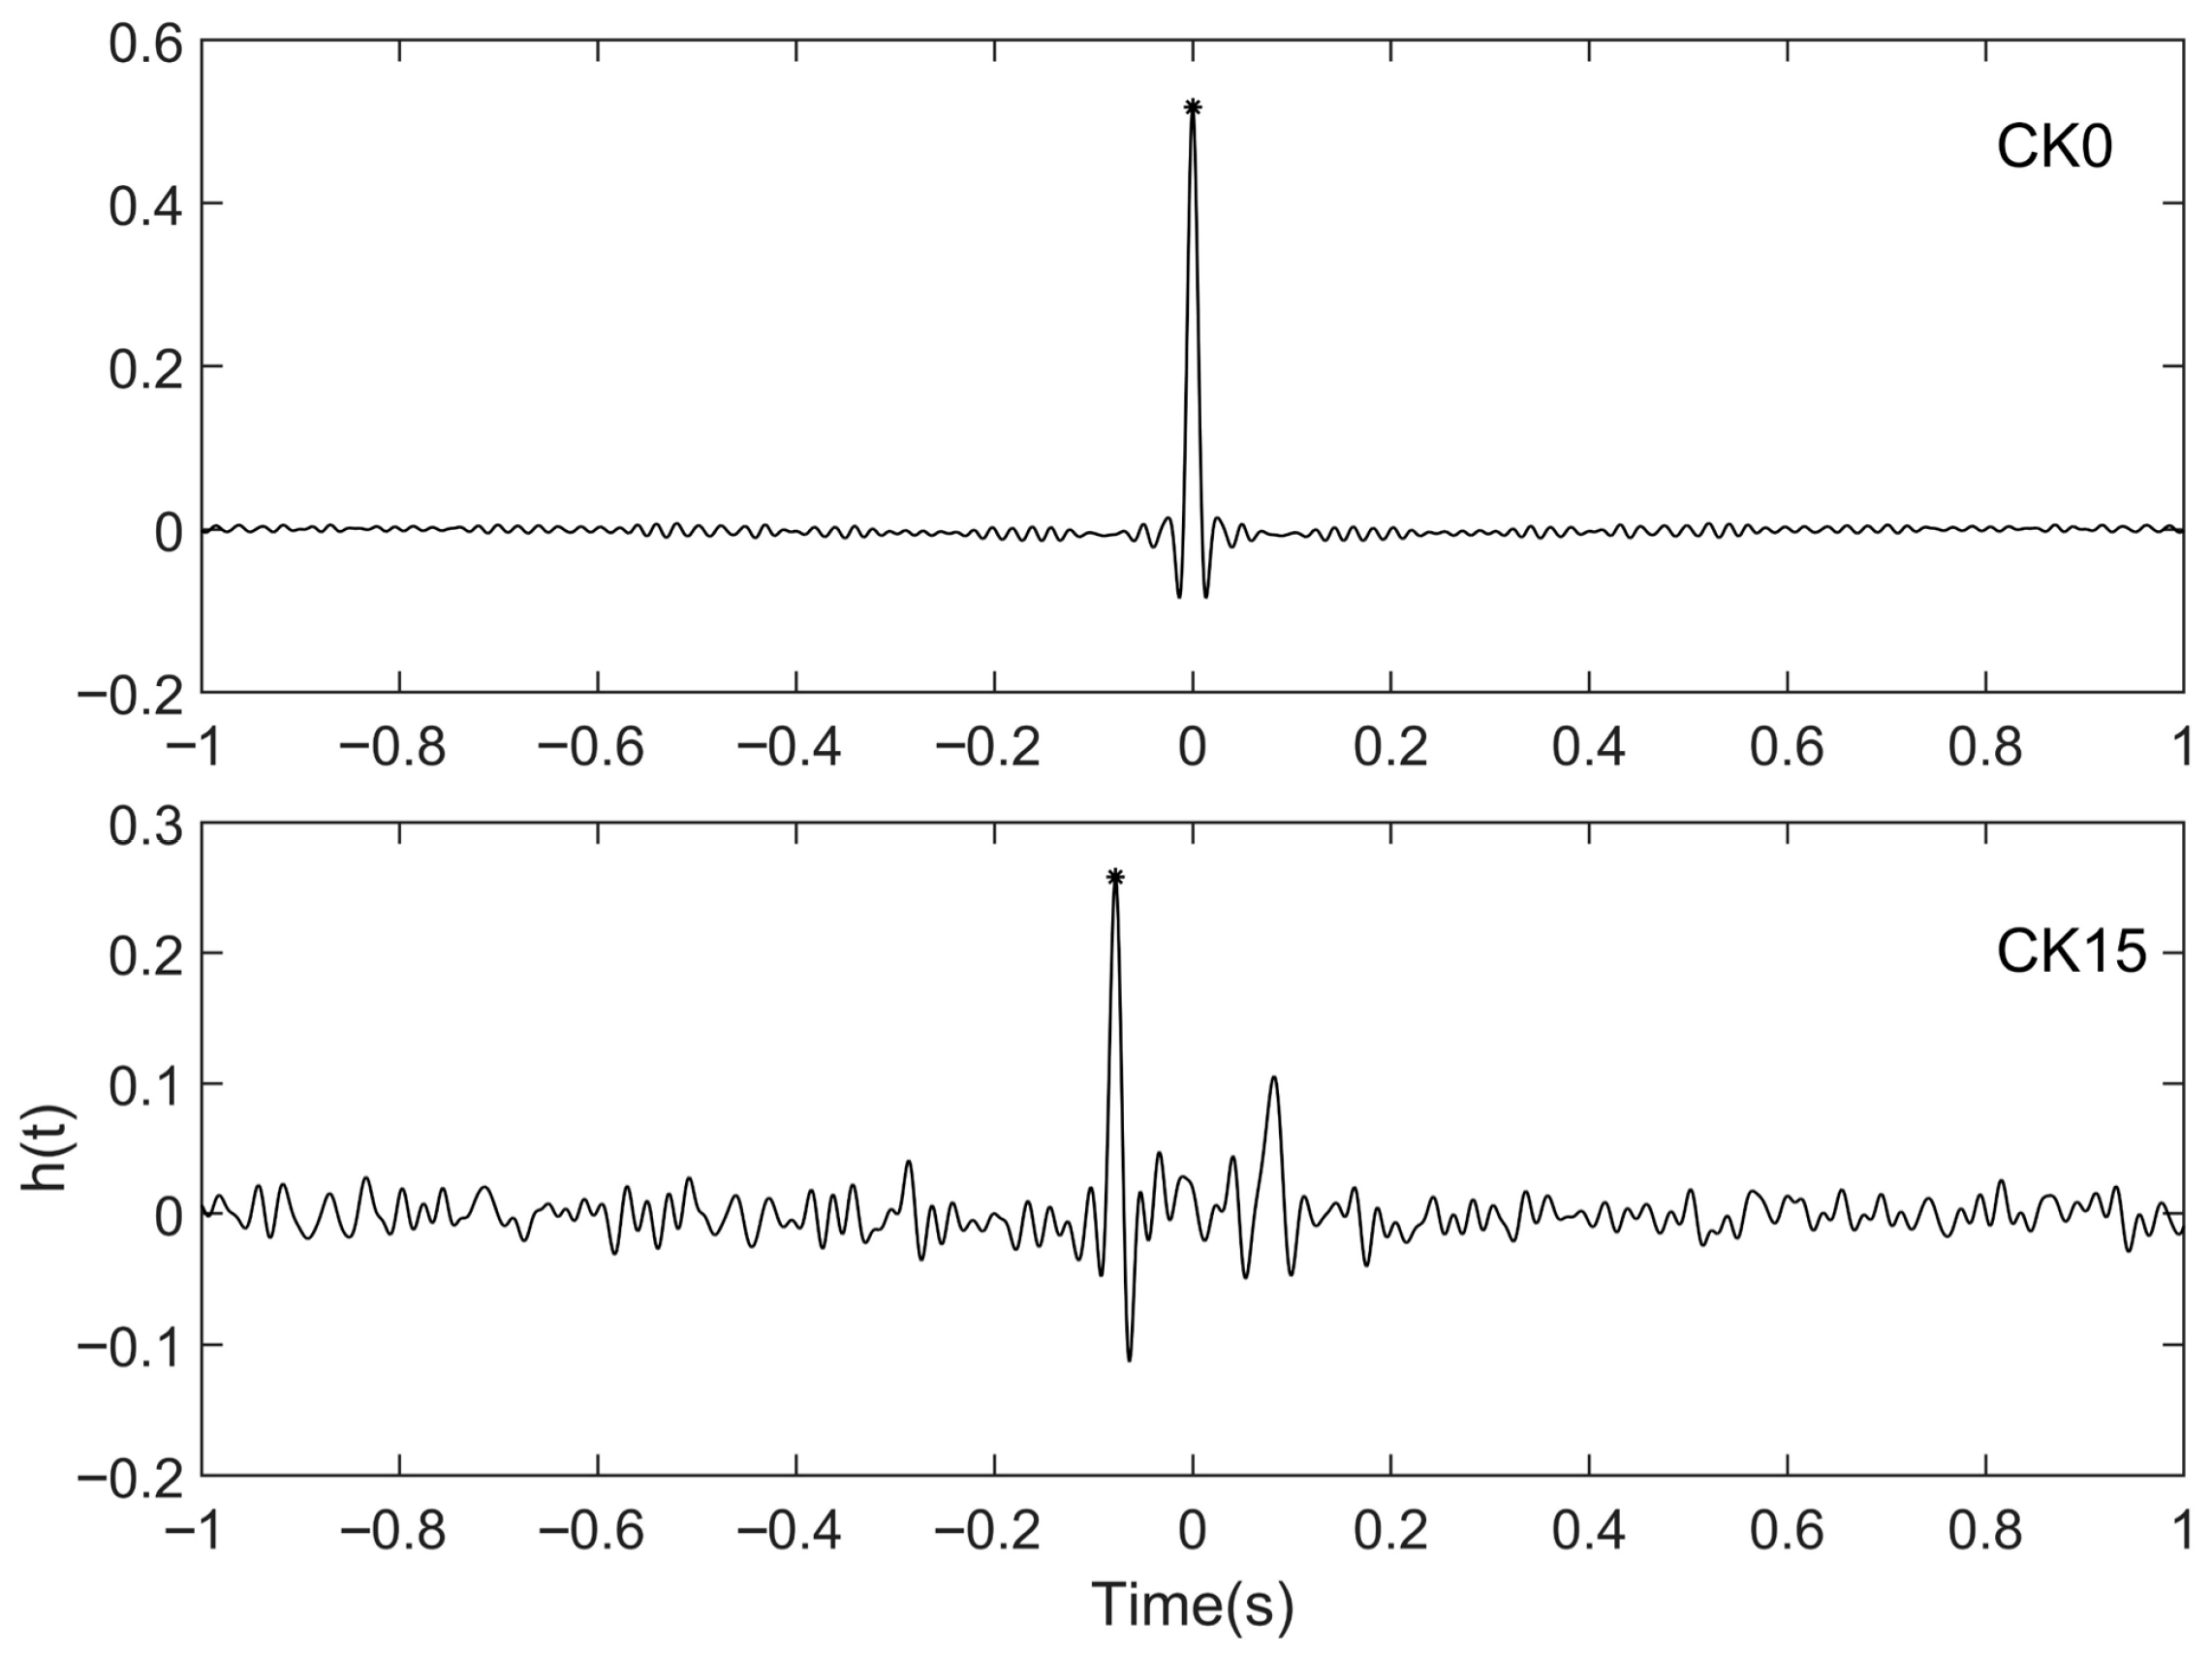
The result of the deconvolution is an upward-propagating pulse, like the one shown in Figure 3 (negative part on the x-axis). In many cases, a similar downward-propagating pulse representing the reflected energy at the ground surface is visible on the right, positive side of the plots. Although the downward pulse could also be exploited, for instance, for studying the attenuation [42] or further constraining V S values, for this study, we only considered the upward pulse, using its peak to measure the travel time between sensors. Given the exact distance between the two stations in the array, travel times can be translated into seismic wave velocities. Velocity corresponds to the most energetic phase of the waveform used. For horizontal components, it is commonly the V S , and for vertical components, it is commonly the V P .
Prior to analysis by interferometry, the waveforms were cut from 2 s before the P-wave onset to the point at which the normalized Arias intensity of the time series reached the value of 75%. This ensured that the most energetic S-waves were included while minimizing possible strong effects from surface waves.

4. Interferometry Results

4.1. Temporal Variation of V S

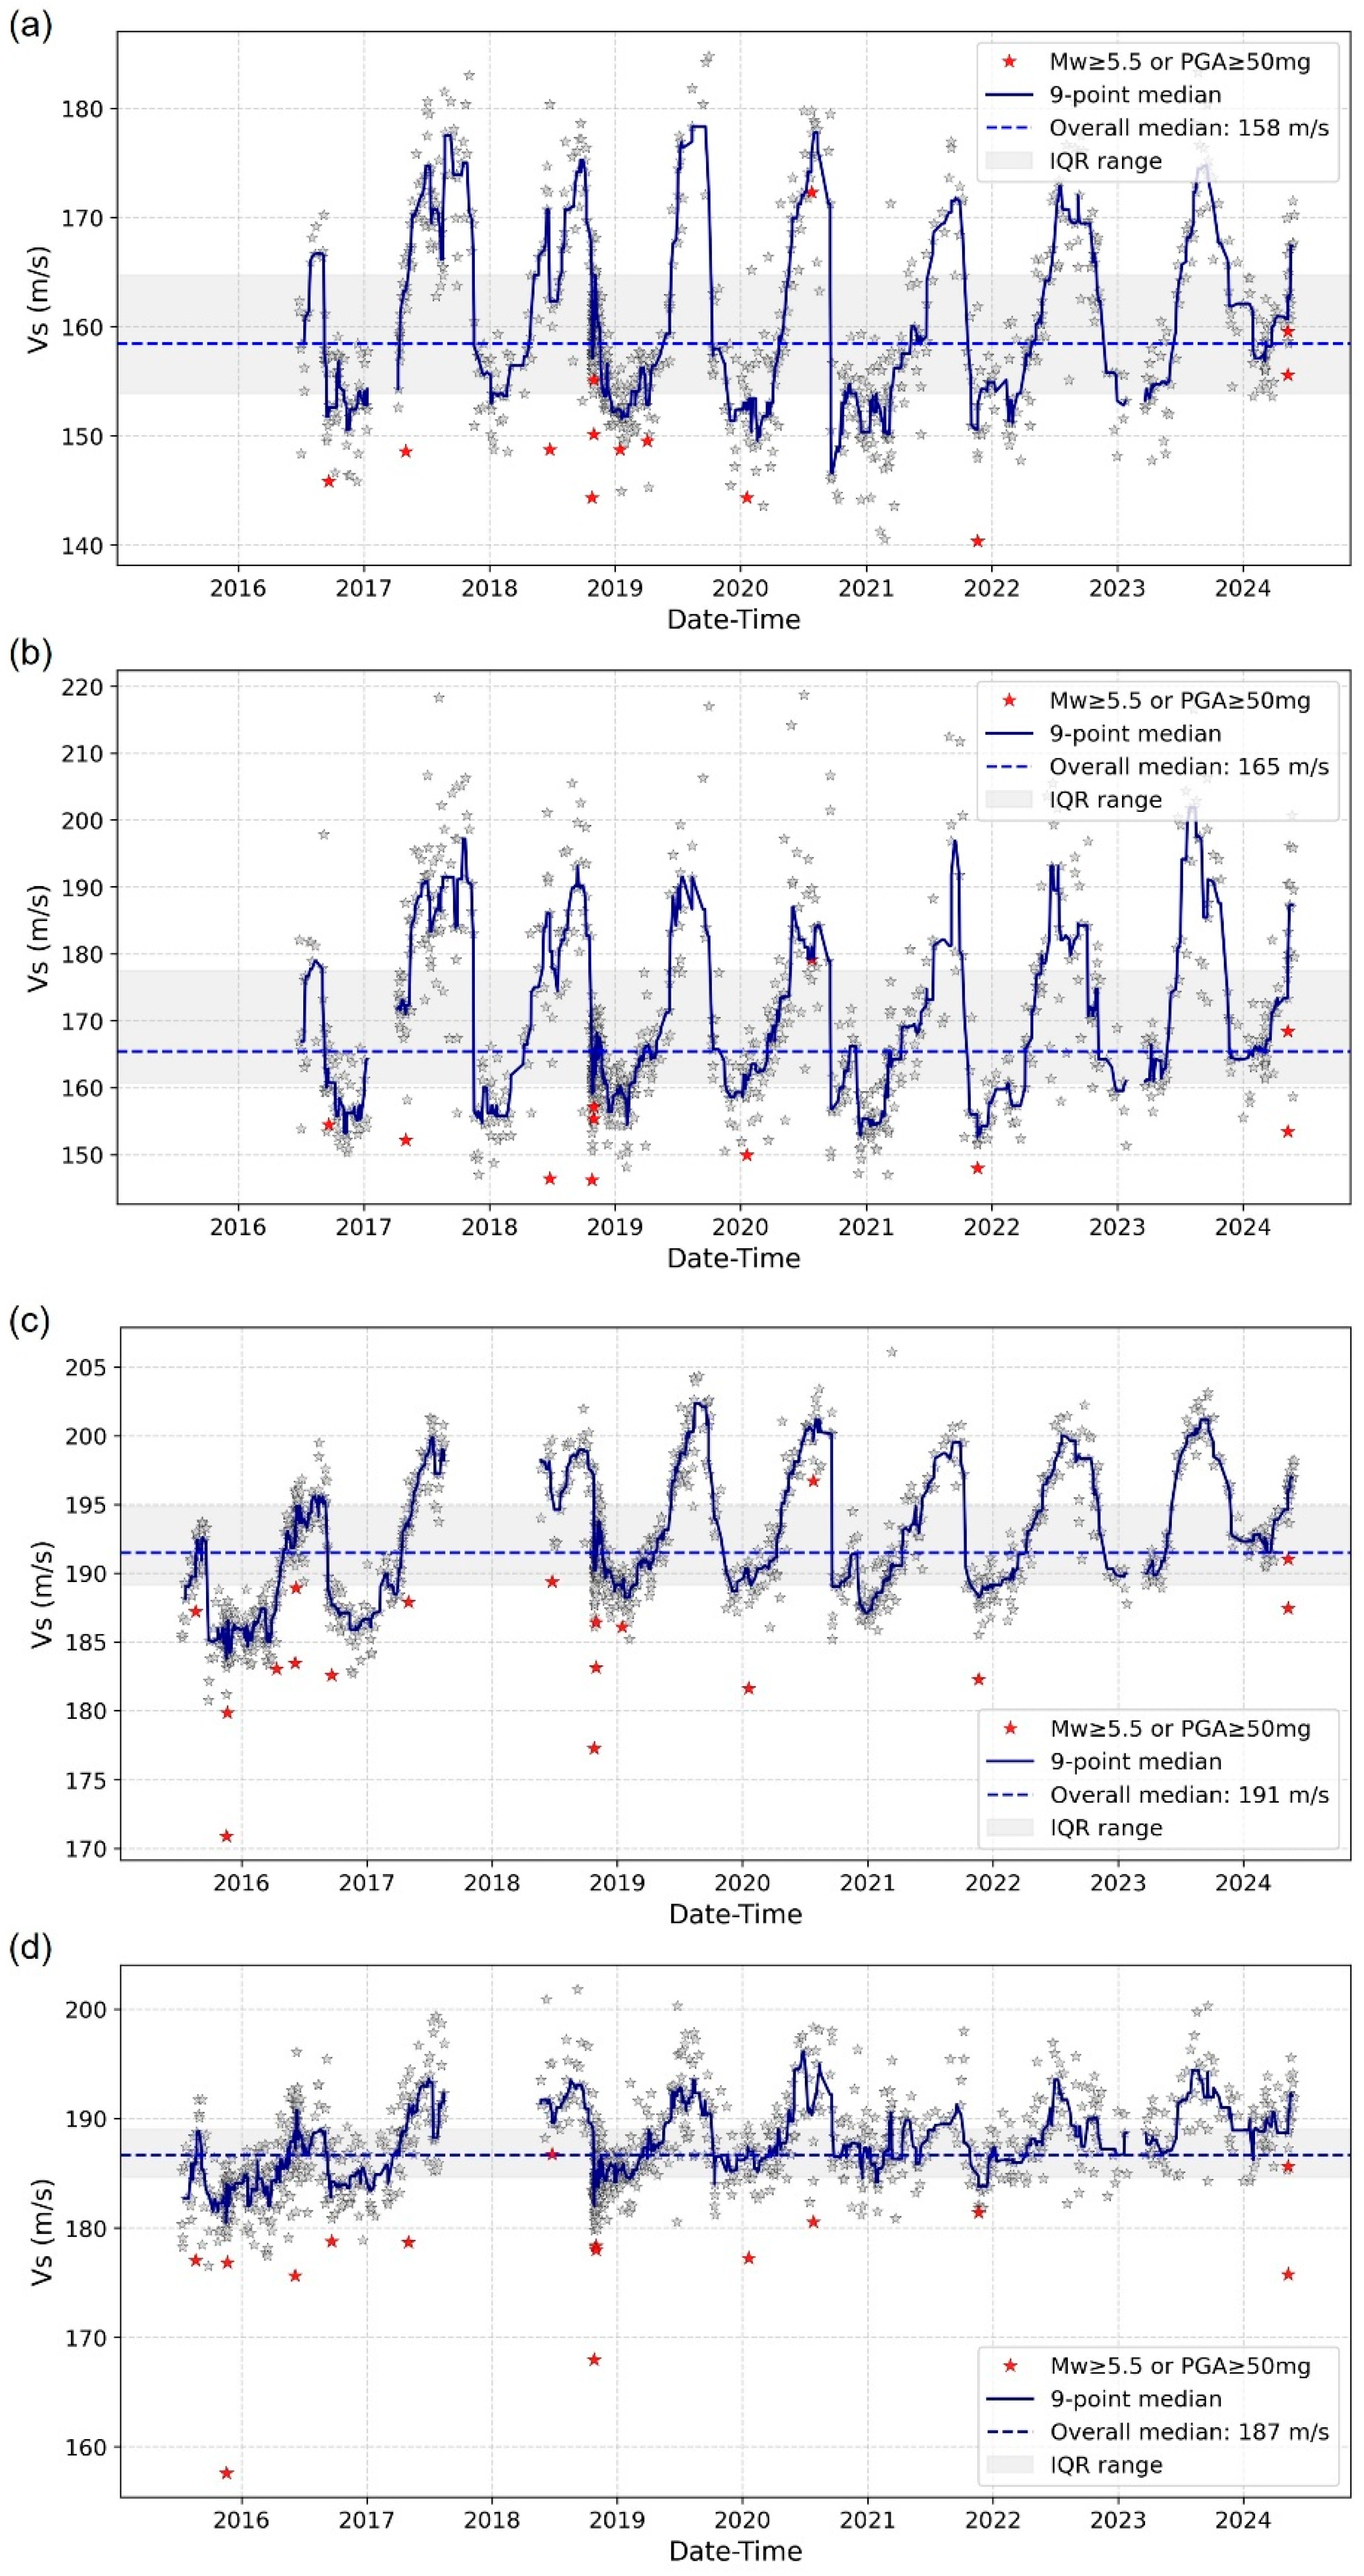
Figure 4 shows the interferometry results for the two horizontal components in the east–west (EW) and north–south (NS) directions, and for the depth intervals of 0–5.6 m and 0–15.5 m. The star symbols correspond to velocity values obtained by processing individual event waveforms. The red symbols highlight results from earthquakes of magnitude 5.5 or greater, or a PGA of 50 mg or greater in any of the CK0 components. The thick line is a nine-point median smooth interrupted wherever there is a considerable gap in the data. This can be due to temporary technical problems with one of the sensors in the pair or a natural, short-term shortage of events above our threshold levels. After testing various smooths, the nine-point median was chosen as the most appropriate to highlight the underground pattern while avoiding extreme complexity. The dashed horizontal line marks the median value of the distribution, and the shaded area marks the interquartile range (IQR), i.e., the area that includes 50% of the defined V S values.
Despite some gaps in the data, all panels in Figure 4 indicate an annual pattern consistent with previous studies of the site based on smaller datasets [6,27]. Generally, lower V S values are observed during the winter, rainy months and higher during the summer, dry months. The effect is stronger in the 0–5.6 m compared to the broader range of 0–15.5 m results. Longer-period variations may also be present, as suggested by the different velocity levels at the beginning and end parts of the dataset, especially for the 0–15.5 m depth interval.

4.2. Indication for Nonlinear Soil Behavior from V S

As mentioned above, in Figure 4 the red star symbols mark the values calculated based on the strongest records in the analyzed dataset. It is confirmed and further highlighted by the results in Figure 4, particularly for the 0–15.5 m depth range (Figure 4c,d), that the strongest recordings systematically give smaller values for the V S . As described in the “Section 1”, the decrease in the value of V S under the strongest seismic shaking has been attributed by many researchers to the phenomenon of nonlinear soil behavior and for the top 5.6 m of the ARGONET soil column this phenomenon has been investigated to some extent by [43].
What is of particular interest in the context of the present work is that the effect of the nonlinear soil behavior can be masked by the seasonal variation of V S values. This masking is more likely to occur when strong ground shaking occurs during the summer months when V S values are elevated. In such cases, even a significant drop in V S may bring the level close to the mean value, preventing the identification of the drop.

4.3. Azimuthal Variation of V S

Figure 4 shows differences in the median V S in the EW and NS directions, particularly in the 0–5.6 m depth interval. We investigated the azimuthal variations in the measured velocities further by rotating the recordings of both sensors in each studied pair from 0 to 175 degrees in 5-degree intervals (the results are mirrored in 180 to 355 degrees). We performed interferometry by deconvolution in all different directions, and the resulting values per station pair and event are plotted as points in Figure 5. The two continuous lines are nine-point median smooths of the highest (red) and lowest (blue) V S values across the studied events.
Figure 5a refers to the shallowest examined depth interval, 0–5.6 m. It suggests an average difference between the maximum and minimum V S values, i.e., an average distance between the two median curves of 14 ± 7 m/s. This is equivalent to an azimuthal variation of 9 ± 4% of the median V S (161.5 m/s; average of the EW and NS median values in Figure 4a,b). However, a more accurate description of Figure 5a requires considering that the distance between the two smoothed curves for extreme values is not constant over time. The anisotropy itself appears to vary seasonally. During the dry summer months, the two curves are up to 39 m/s apart, and during the rainy winter months, they are up to 4 m/s apart. This suggests that topsoil formations at the ARGONET site become more anisotropic in summer. This could result from various mechanisms or from a combination of them, such as the differential thermal expansion of the soil, desiccation cracks close to the surface, preferential collapse of pores, etc.
Figure 5b suggests that in the 0–15.5 m depth interval anisotropy is less inconsistent over time with an amplitude of 8 ± 2 m/s (3–5% of the median V S for this zone). In the same plot, three sets of V S values are significantly lower than the rest. These sets are associated with the M6.4, 2015 Lefkada earthquake at Repi = 56 km, the M6.7, 2018 Zakynthos earthquake at Repi = 92 km, and a more recent (May 2024) M4.1 earthquake at Repi = 10 km, which, although small in magnitude, it provided the strongest recordings in the database in terms of PGA due to its proximity to ARGONET. As previously mentioned, lower V S values may be related to nonlinear soil behavior during elevated ground shaking, and these three events are strong candidates for having triggered such phenomena in all directions.
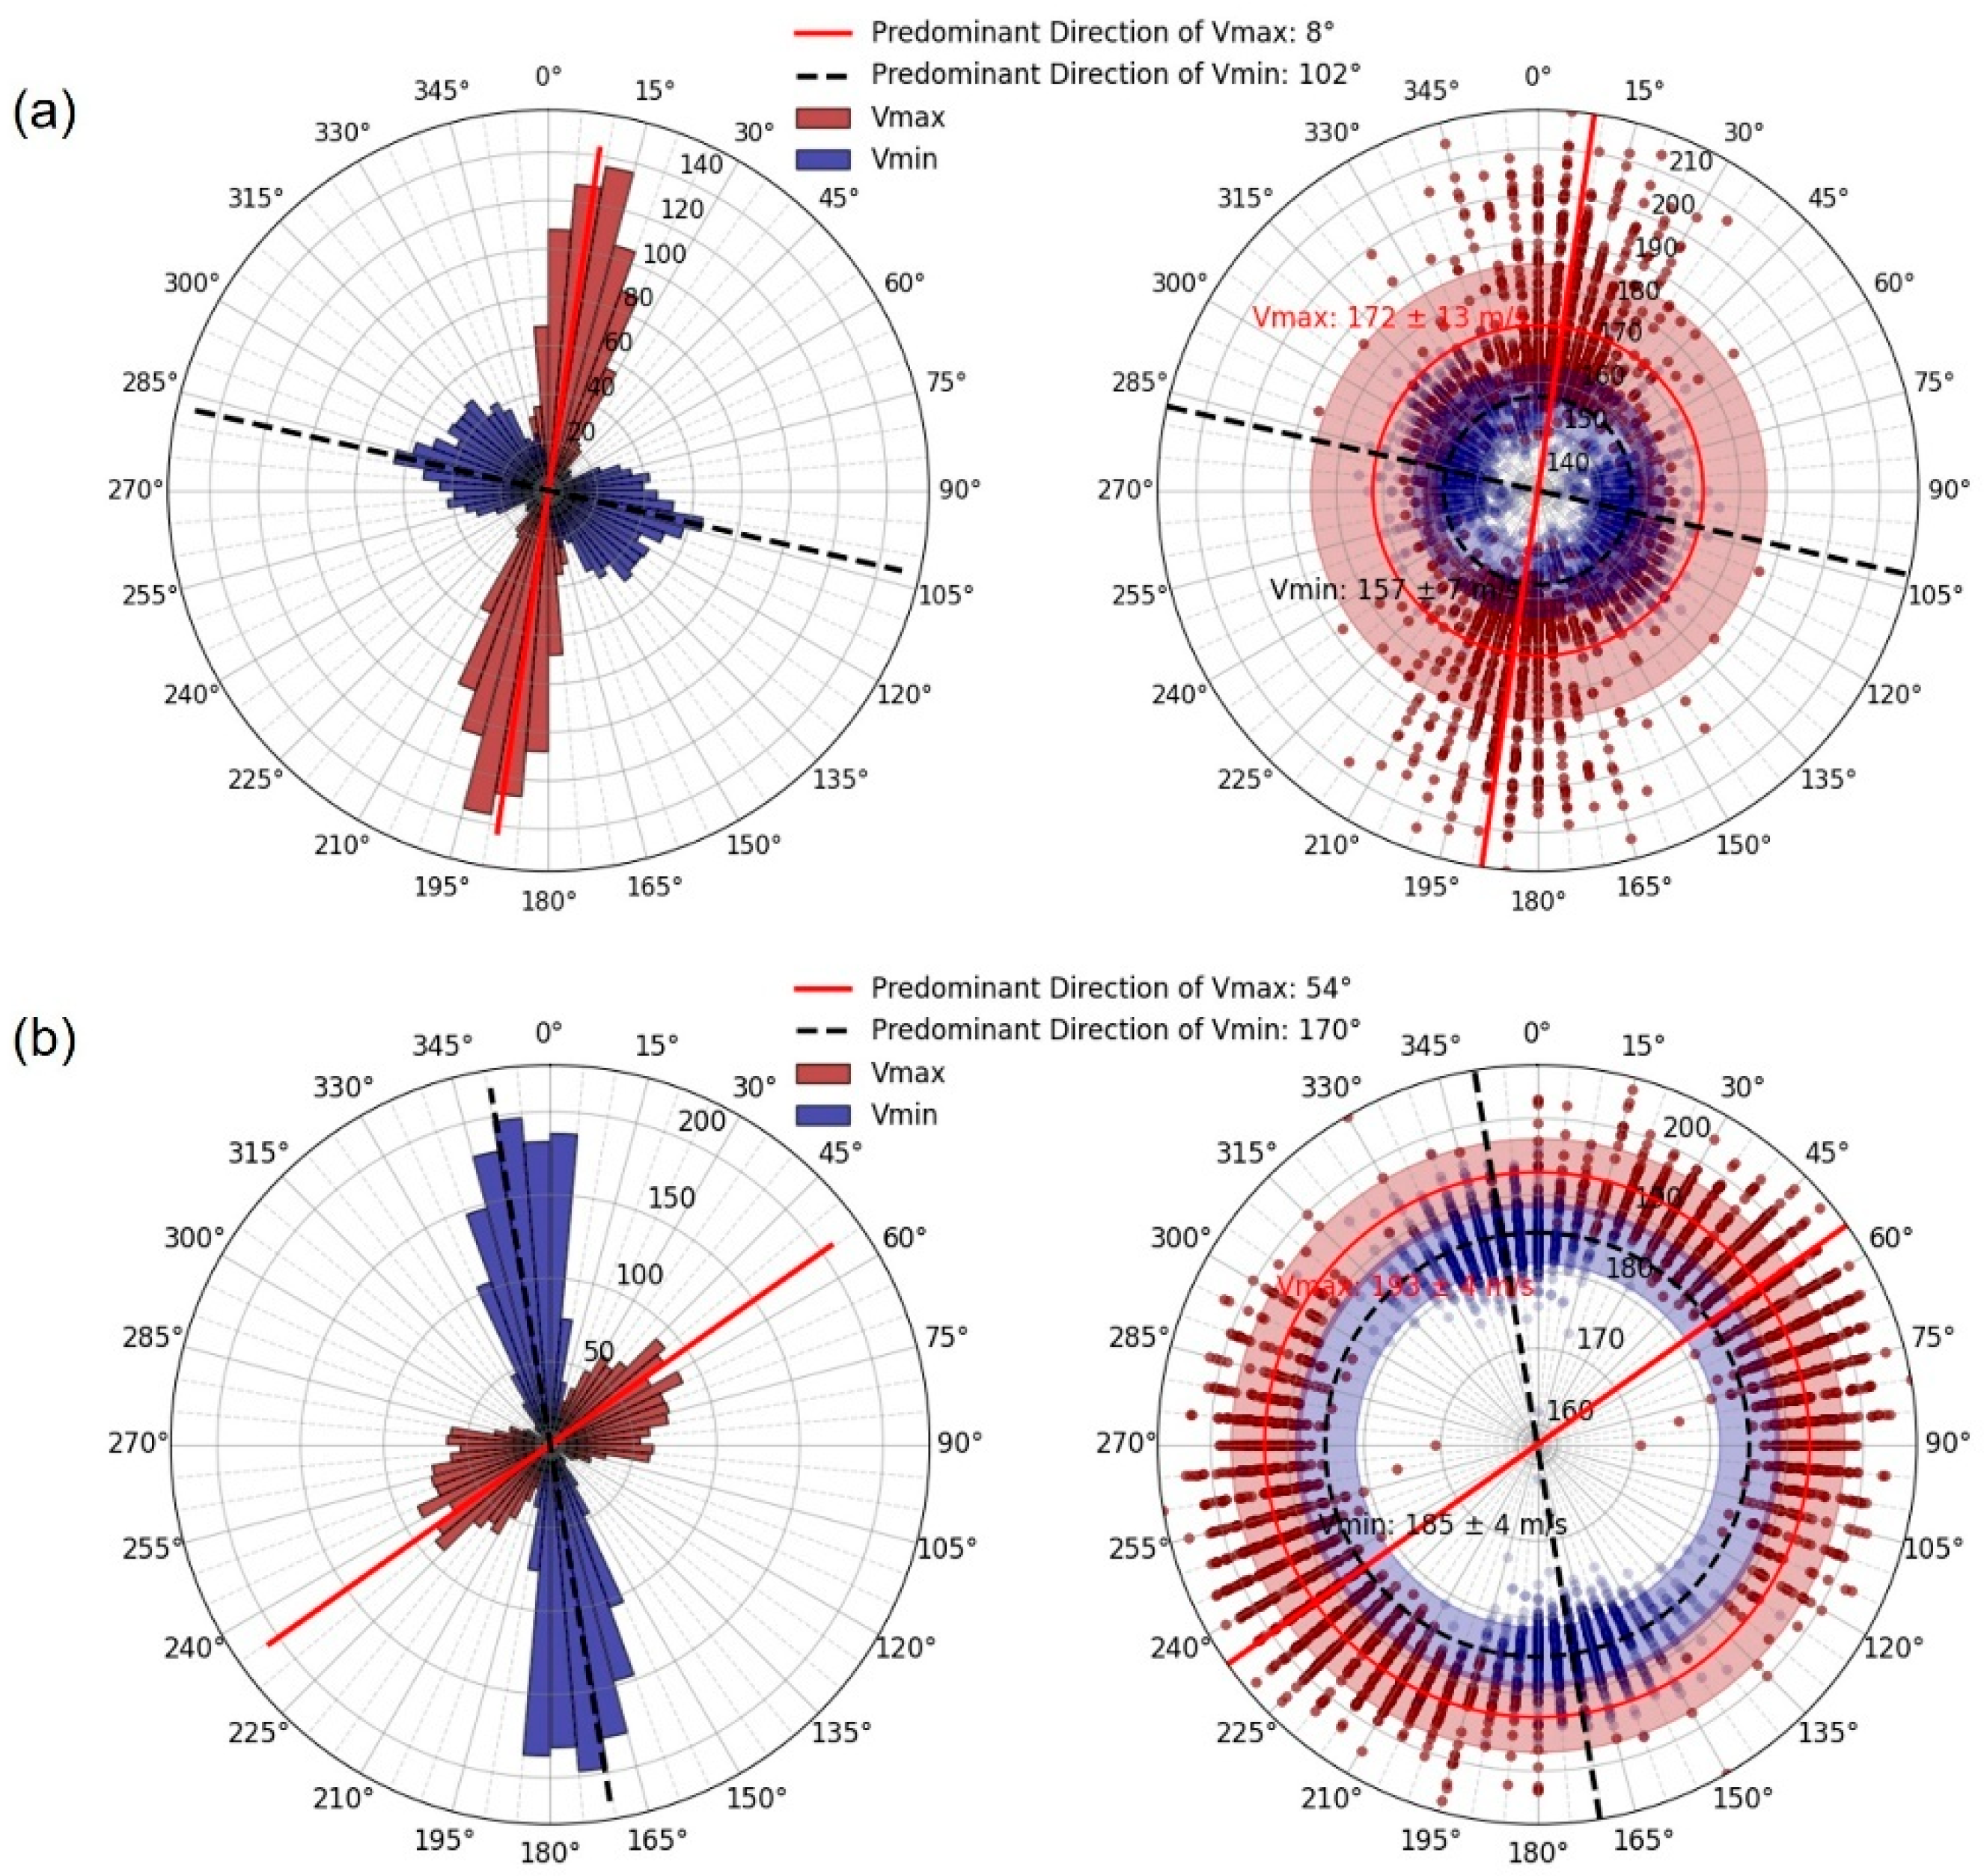
Figure 6 illustrates the directional distribution of maximum (Vmax) and minimum (Vmin) V S for the two examined depth intervals. In the left part, the rose diagrams highlight the predominant fast-shear and slow-shear directions (solid red and dashed black lines, respectively). On the right, a polar scatter plot shows the individual Vmax and Vmin values as dots. The shaded red and blue bands show the mean ±1 standard deviation for Vmax and Vmin, respectively. Solid red and dashed black lines mark the mean velocities and predominant directions. For the 0–5.6 m depth interval (Figure 6a), the sectors of the rose diagram are significantly longer for Vmax in the 355–30° interval, suggesting a more pronounced preference for the fast-shear direction. In contrast, Vmin is more dispersed, making the slow-shear direction more difficult to identify. The opposite is observed for the 0–15.5 m depth interval; Vmin directions are more focused (335–10°), and Vmax is more dispersed around 54°.
Overall, anisotropy appears to change in amplitude and direction with depth within the soil column. This change is most probably related to changes in sediment material, depositional conditions, aging, hydrology, etc.

5. Disentangling the Various Partial Effects on V S Through a Generalized Additive Model

Although the seasonal and azimuthal variations are wider at shallower depths, the V S reductions associated with stronger events are more pronounced at 0–15.5 m, as demonstrated in Figure 5. To further investigate the effect of soil nonlinearity on V S , we hereafter focus on the 0–15.5 m depth interval.
The idea is that V S reductions due to nonlinear soil behavior exist in our dataset, even at levels similar to those of the seasonal and azimuthal variations. To identify these reductions, the various co-acting effects need to be separated and to accomplish this, we applied generalized additive models (GAMs) (e.g., [28,44,45]). In GAMs, the relationship between the dependent variable y and the predictor variables x i follows smooth patterns, s i ( x i ) , that can be linear or nonlinear. Thus, GAMs generalize the linear regression framework, and the relationship between the predictors and the response does not need to be described beforehand. The response variable is then modeled as a sum of different components of smooth relationships, along with linear predictors, if any. This is mathematically described as:
g y = β 0 + s 1 ( x 1 ) + s 2 ( x 2 ) + s 3 ( x 3 ) + + s n ( x n ) ,
where g   is a function that links the expected value of the dependent variable to the predictor variables, and β 0 is the intercept. The smooth functions, s i ( x i ) , are typically represented by splines, which consist of piecewise polynomial segments connected at specific points called “knots”. By adjusting the placement of the knots and the degree of the polynomial, spline functions can act as flexible curves and approximate even complicated nonlinear relationships. There are different types of splines, such as thin-plate regression in which the locations of the knots are automatically assigned, cubic regression, cyclic cubic, etc., depending on the needs of each study.
We chose GAMs over more conventional modeling, such as standard linear or nonlinear with polynomial regression, because of the complexity of our variation, gaps in our data, and strong evidence of multiple phenomena acting simultaneously (e.g., seasonal variation and nonlinear soil behavior). GAMs minimize random guesses about the form of the relationships, and through graphical representations of the smooth functions, they allow for visual inspection and understanding of the nature of the relationships. This provides insight into their driving mechanisms. Since GAMs are based on smooth functions, they are not appropriate for detailed modeling of abrupt changes in data, such as spikes or jumps, as may be expected during or immediately after a large earthquake. If such changes exist, they will be smoothed out. However, GAMs excel at identifying concurrent trends, which was of primary importance for this study.
To model V S , we initially restricted our dataset to Repi ≤ 150 km, focal depth ≤ 25 km and ML ≥ 1.6. This was done to avoid regions of extreme data sparsity in parts of the parametric space that were not of particular interest for this study. After filtering, our dataset retains 97.5% of the events (only 34 were removed) but remains poor in large magnitudes and PGA values, and in large distances. Therefore, the results in this part of the parametric space are expected to be less well-constrained.
We used a scaled t distribution-based GAM to downweight the influence of extreme V S values [28]. This may seem counterintuitive for identifying drops related to nonlinear soil behavior, but it was necessary for obtaining more stable, smooth estimates and robust model diagnostics. We tested various combinations of predictors and performed comprehensive diagnostics, e.g., residual analysis, comparison of observed and fitted values, significance of main predictors and their interactions, and appropriate specification of smooth terms. The final model structure is:
V S ~ s y e a r + s D o Y ,   c y c l i c + s a z + t e ( m a g ,   R e p i ) + t i D o Y ,   y e a r ,
where y e a r is the year of the measurement, D o Y is the day of the year, m a g is the magnitude of each event, and R e p i the epicentral distance from ARGONET. The main term y e a r was assigned the maximum allowable basis dimension of k = 10, which is imposed by the number of unique observation years (2015–2024). Its role is to account for possible variation in the level of V S from year to year. We used D o Y to model the seasonal variation with cyclic cubic regression splines (CRS) to prevent unrealistic differences in the smooth levels at the beginning and end of the year. Although our dataset includes earthquake waveforms for 325 unique D o Y values (in certain days there were no waveforms in any of the studied years), we used only 24 basis functions (k = 24), aiming to a smooth seasonal variation representative of most years. Large deviations from the smooth seasonal pattern—e.g., extreme rainfall on certain days or weeks and possible time shifts in the pattern as a whole (e.g., the rainy season starting later in the fall in some years)—are expected to be captured by the tensor term t i D o Y ,   y e a r , which specifies interactions between the D o Y and y e a r main terms. The last predictor is also a tensor term, t e ( m a g ,   R e p i ) , with a basis of k = 8 × 8, which specifies interactions between earthquake magnitude and epicentral distance. This practically represents the possible nonlinear soil behavior effect. The difference between the tensor products t e   and t i (   ) is that the former combines the main and interaction effects into a single smooth term, while the latter explicitly refers to the interactions, separately from the main effects. We also tested m a g and R e p i as main terms with their t i (   ) interaction but found an unstable trade-off between the three. Although this did not affect the overall quantification of the contribution of nonlinearity, it complicated interpretation. To stabilize the model and facilitate interpretation, we kept one smooth for all through the t e   term. In addition to the predictors appearing in Equation (3), we considered including the focal depth and back azimuth of earthquake sources. Neither parameter significantly improved the prediction of V S values, so they were dropped from the analysis.
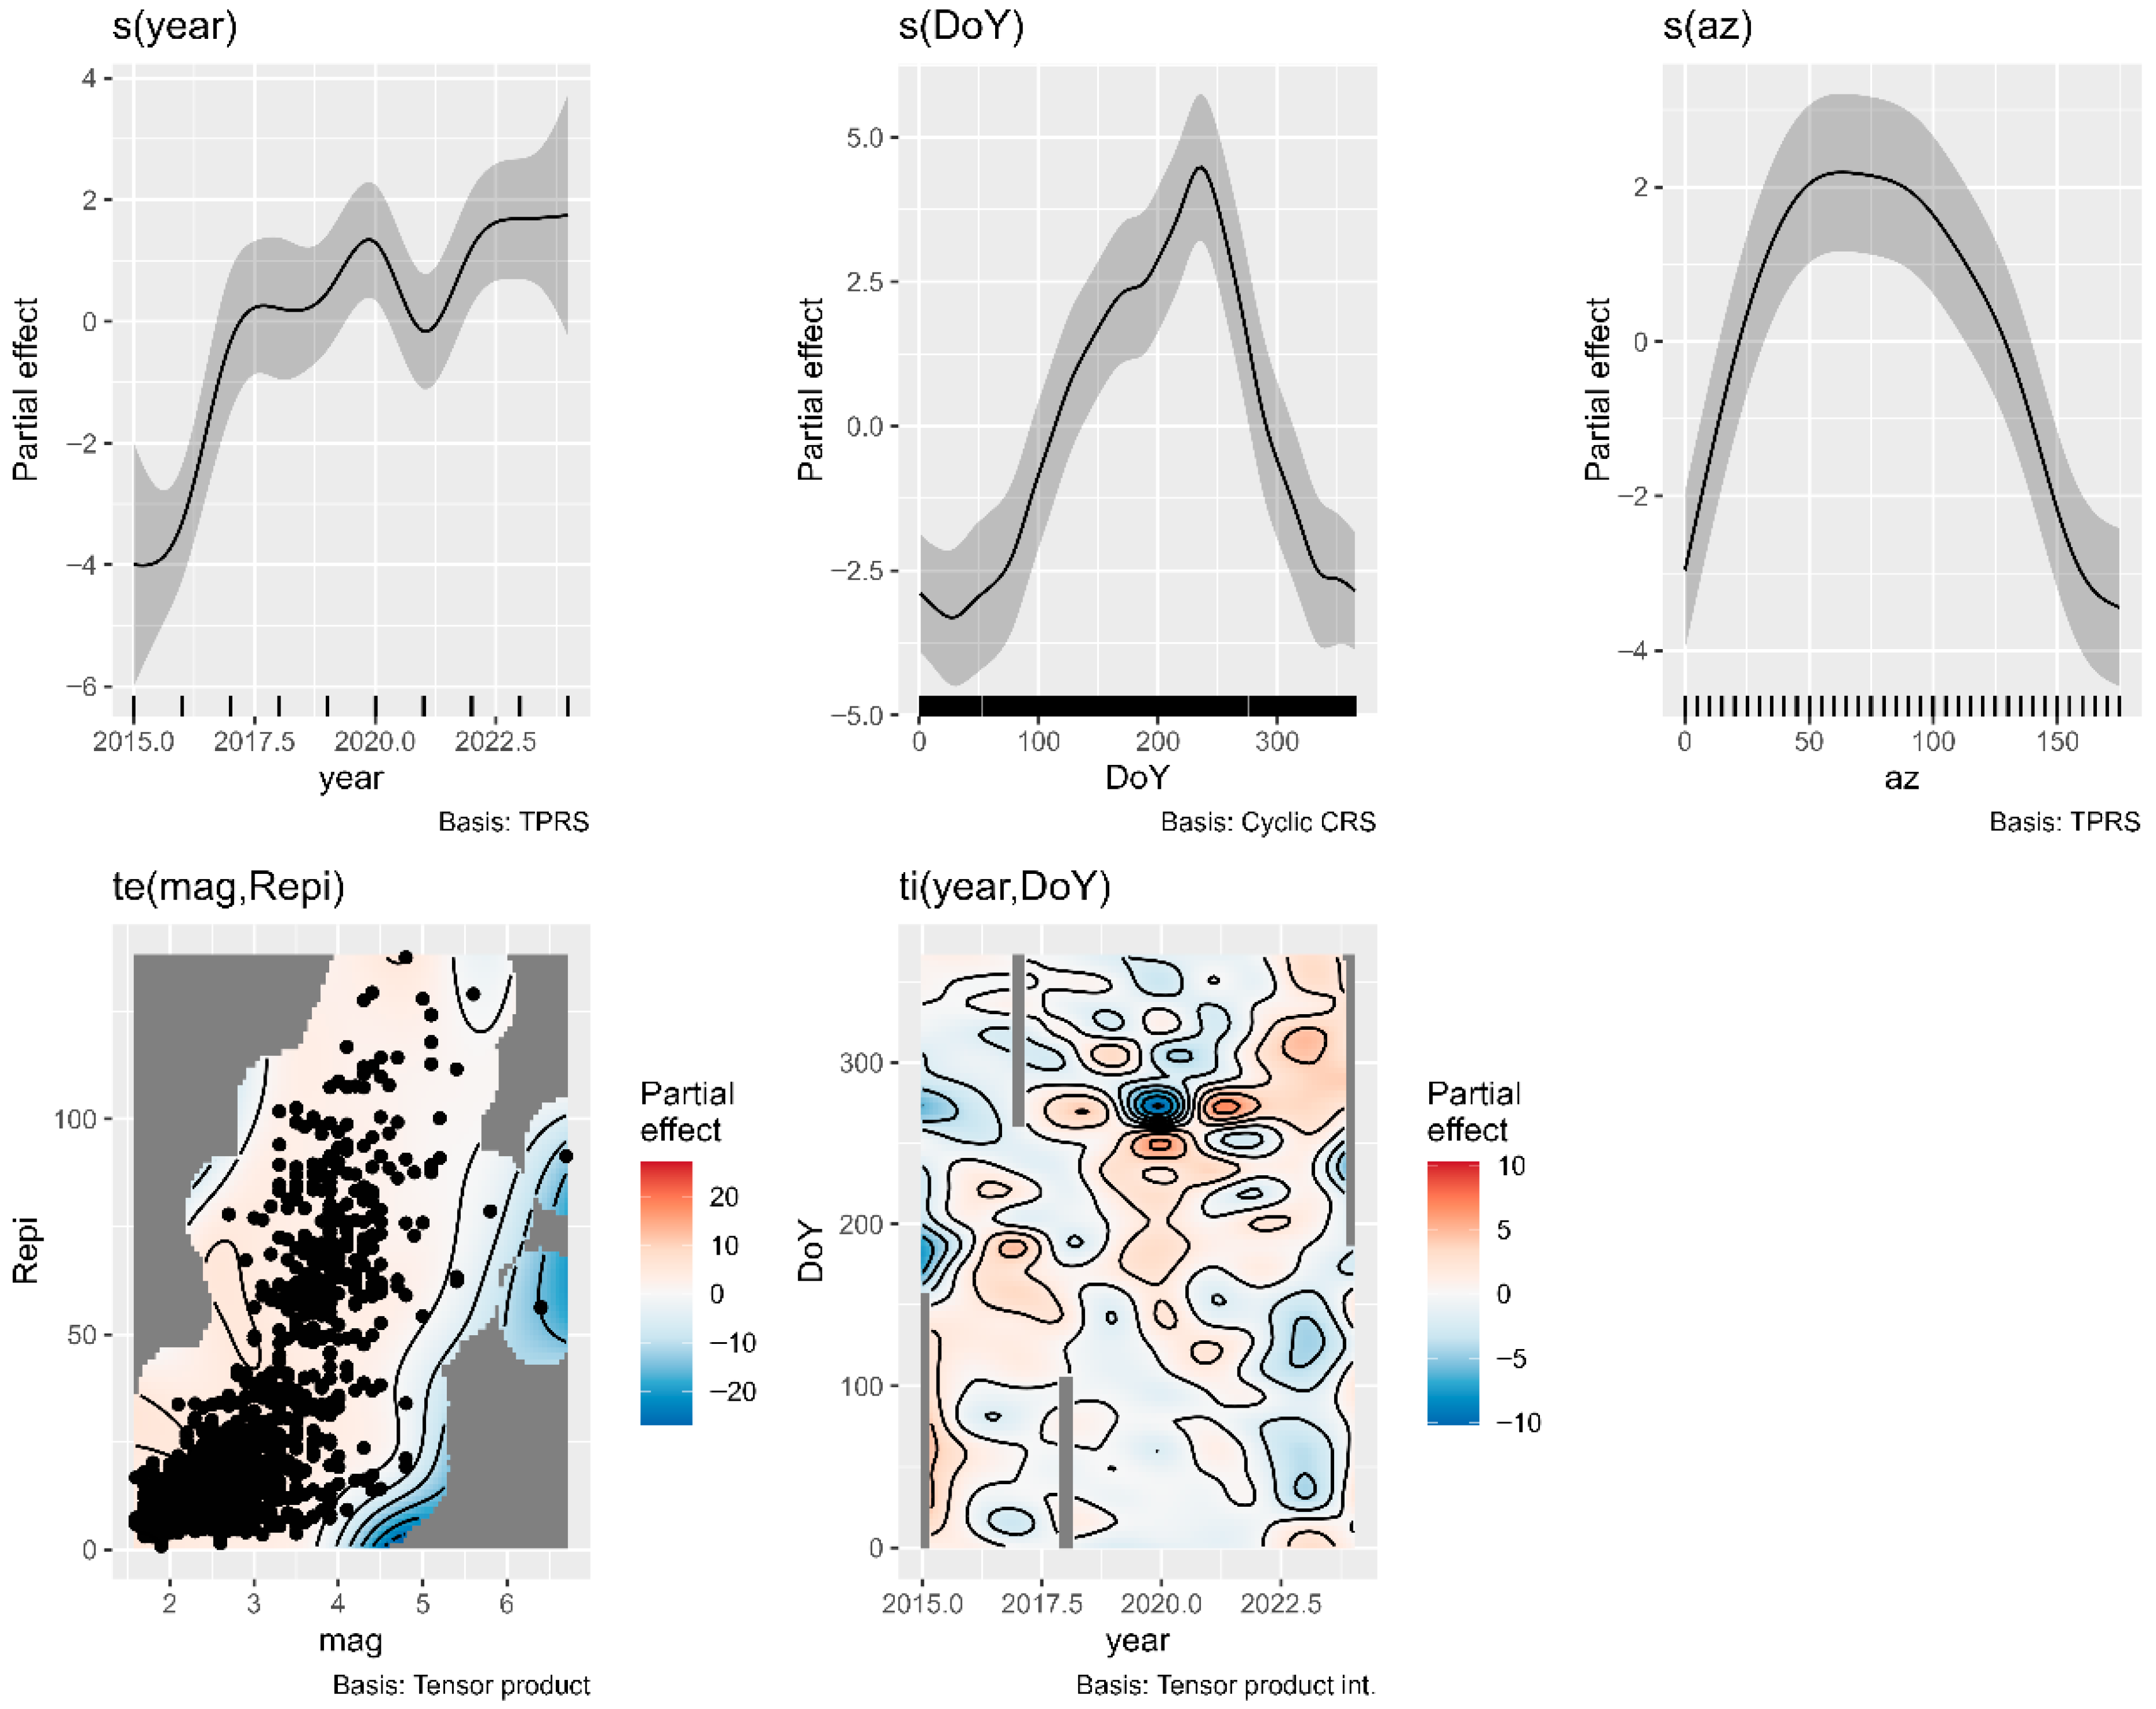
Figure 7 shows how the preferred model breaks down the V S variation into different components or partial effects. The model explains 80.9% of the variance in V S values (adjusted R2 = 0.809) and 70.6% of the deviance, with the intercept and all smooth terms and interactions being statistically significant. The year-to-year term [ s y e a r ] suggests variation in the level of V S throughout the years of observation. V S begins at lower levels in 2015, gradually increases until 2017, and then flattens out or possibly increases at a much slower rate since 2017, with small reverberations in time and amplitude. Therefore, this partial effect is both negative and positive for V S , and its strength is inferred by the y-axis values, which range from −4.0 m/s to +1.7 m/s. Although the borehole station (CK15) of the pair has been reinstalled twice within the period considered (in May 2018 and in October 2019), this variation is unlikely due to instrument drifting because it is also observed in other sensor pairs of the array. This is particularly true for the first part of the stronger upward trend. One possible explanation for the low level of V S in 2015 and its steady increase until 2017 is that it reflects soil recovery after two strong earthquakes occurred at Repi ≤ 15 km from ARGONET four months before its launch (M6+ on 26 January and 3 February 2014) (e.g., [46]).
The annual variation [ s D o Y ] clearly shows higher V S values in the summer, peaking after mid-August ( D o Y = 236), and lower values in the winter. Similar to the previous term, this seasonal variation can be either negative or positive, ranging from −3.3 m/s to +4.5 m/s. The smooth for seasonality is asymmetric; it has a longer, slower ascending phase and a shorter, rapid descent. This observation aligns with the hysteresis observed in soil-water characteristic curves, which can be explained by various mechanisms (e.g., [47]). During the ascending part, there is an interruptive period of very slow or no V S increase from mid-June to early July (days ~170–190). Previous studies have shown that the seasonal variation of V S is highly correlated with precipitation and/or the amount of water in the soil (e.g., [3,6,7,10,11,12,13,14,48,49,50,51,52,53]). The “step” in the ascending phase may correspond to the interruption of the soil drying phase associated with late spring/early summer showers.
The partial effect s a z models soil anisotropy, i.e., the variation of V S as a function of observation azimuth. The smooth function shows a clear minimum at ~170° and a broad maximum centered at ~65°, which are values very close to those in Figure 6b. The amplitude of the effect ranges from −3.4 m/s to +2.2 m/s, with approximately ±1 m/s needed to reach 95% confidence. The confidence bands are wider around the higher V S values, most probably reflecting the seasonality of the anisotropy itself, as discussed earlier in relation to Figure 5.
The tensor product t e ( m a g ,   R e p i ) accounts for how V S changes simultaneously with magnitude and epicentral distance. Based on the 2D mapping of this partial effect in Figure 7, we conclude that there is a negative effect on V S for larger magnitude events. As expected, the magnitude threshold beyond which V S is negatively affected increases with increasing epicentral distance. Interestingly, at small distances, V S reduction appears to be triggered by even smaller earthquakes of magnitude 4–5 and below. The implications for soil nonlinearity based on this partial effect are discussed further in the following section dedicated to nonlinearity.
The major features of the mapping of the interaction term t i D o Y × y e a r , as shown in Figure 7, align well with significant deviations from the average seasonal pattern in the study area. For instance, the largest negative value of this partial effect is centered in September 2020. On 17–18 September 2020, one of the most extreme weather phenomena of the last 25 years, the medicane “Ianos”, hit the eastern Mediterranean, especially Greece (e.g., [54]). Cephalonia and nearby islands were declared under a state of emergency, and they experienced record-breaking amounts of rainfall. The effect on V S at ARGONET was direct and impressive. The average V S of the nine earthquakes in our dataset just before 17 September is 200.3 m/s; the corresponding average after 18 September is 188.2 m/s. This constitutes a V S drop of over 12 m/s that occurred relatively early in the fall and rapidly. This rapid change is unique to one year in our dataset and cannot be incorporated into the smooth seasonal variation; however, it is accounted for by t i D o Y × y e a r . Other milder interactions are also compatible with the meteorological data [55,56]. For example, there are low values in September of 2015 and 2016, which are associated with elevated early fall precipitation, and a positive partial effect in September and October of 2022 and 2023, which were dry compared to other years.
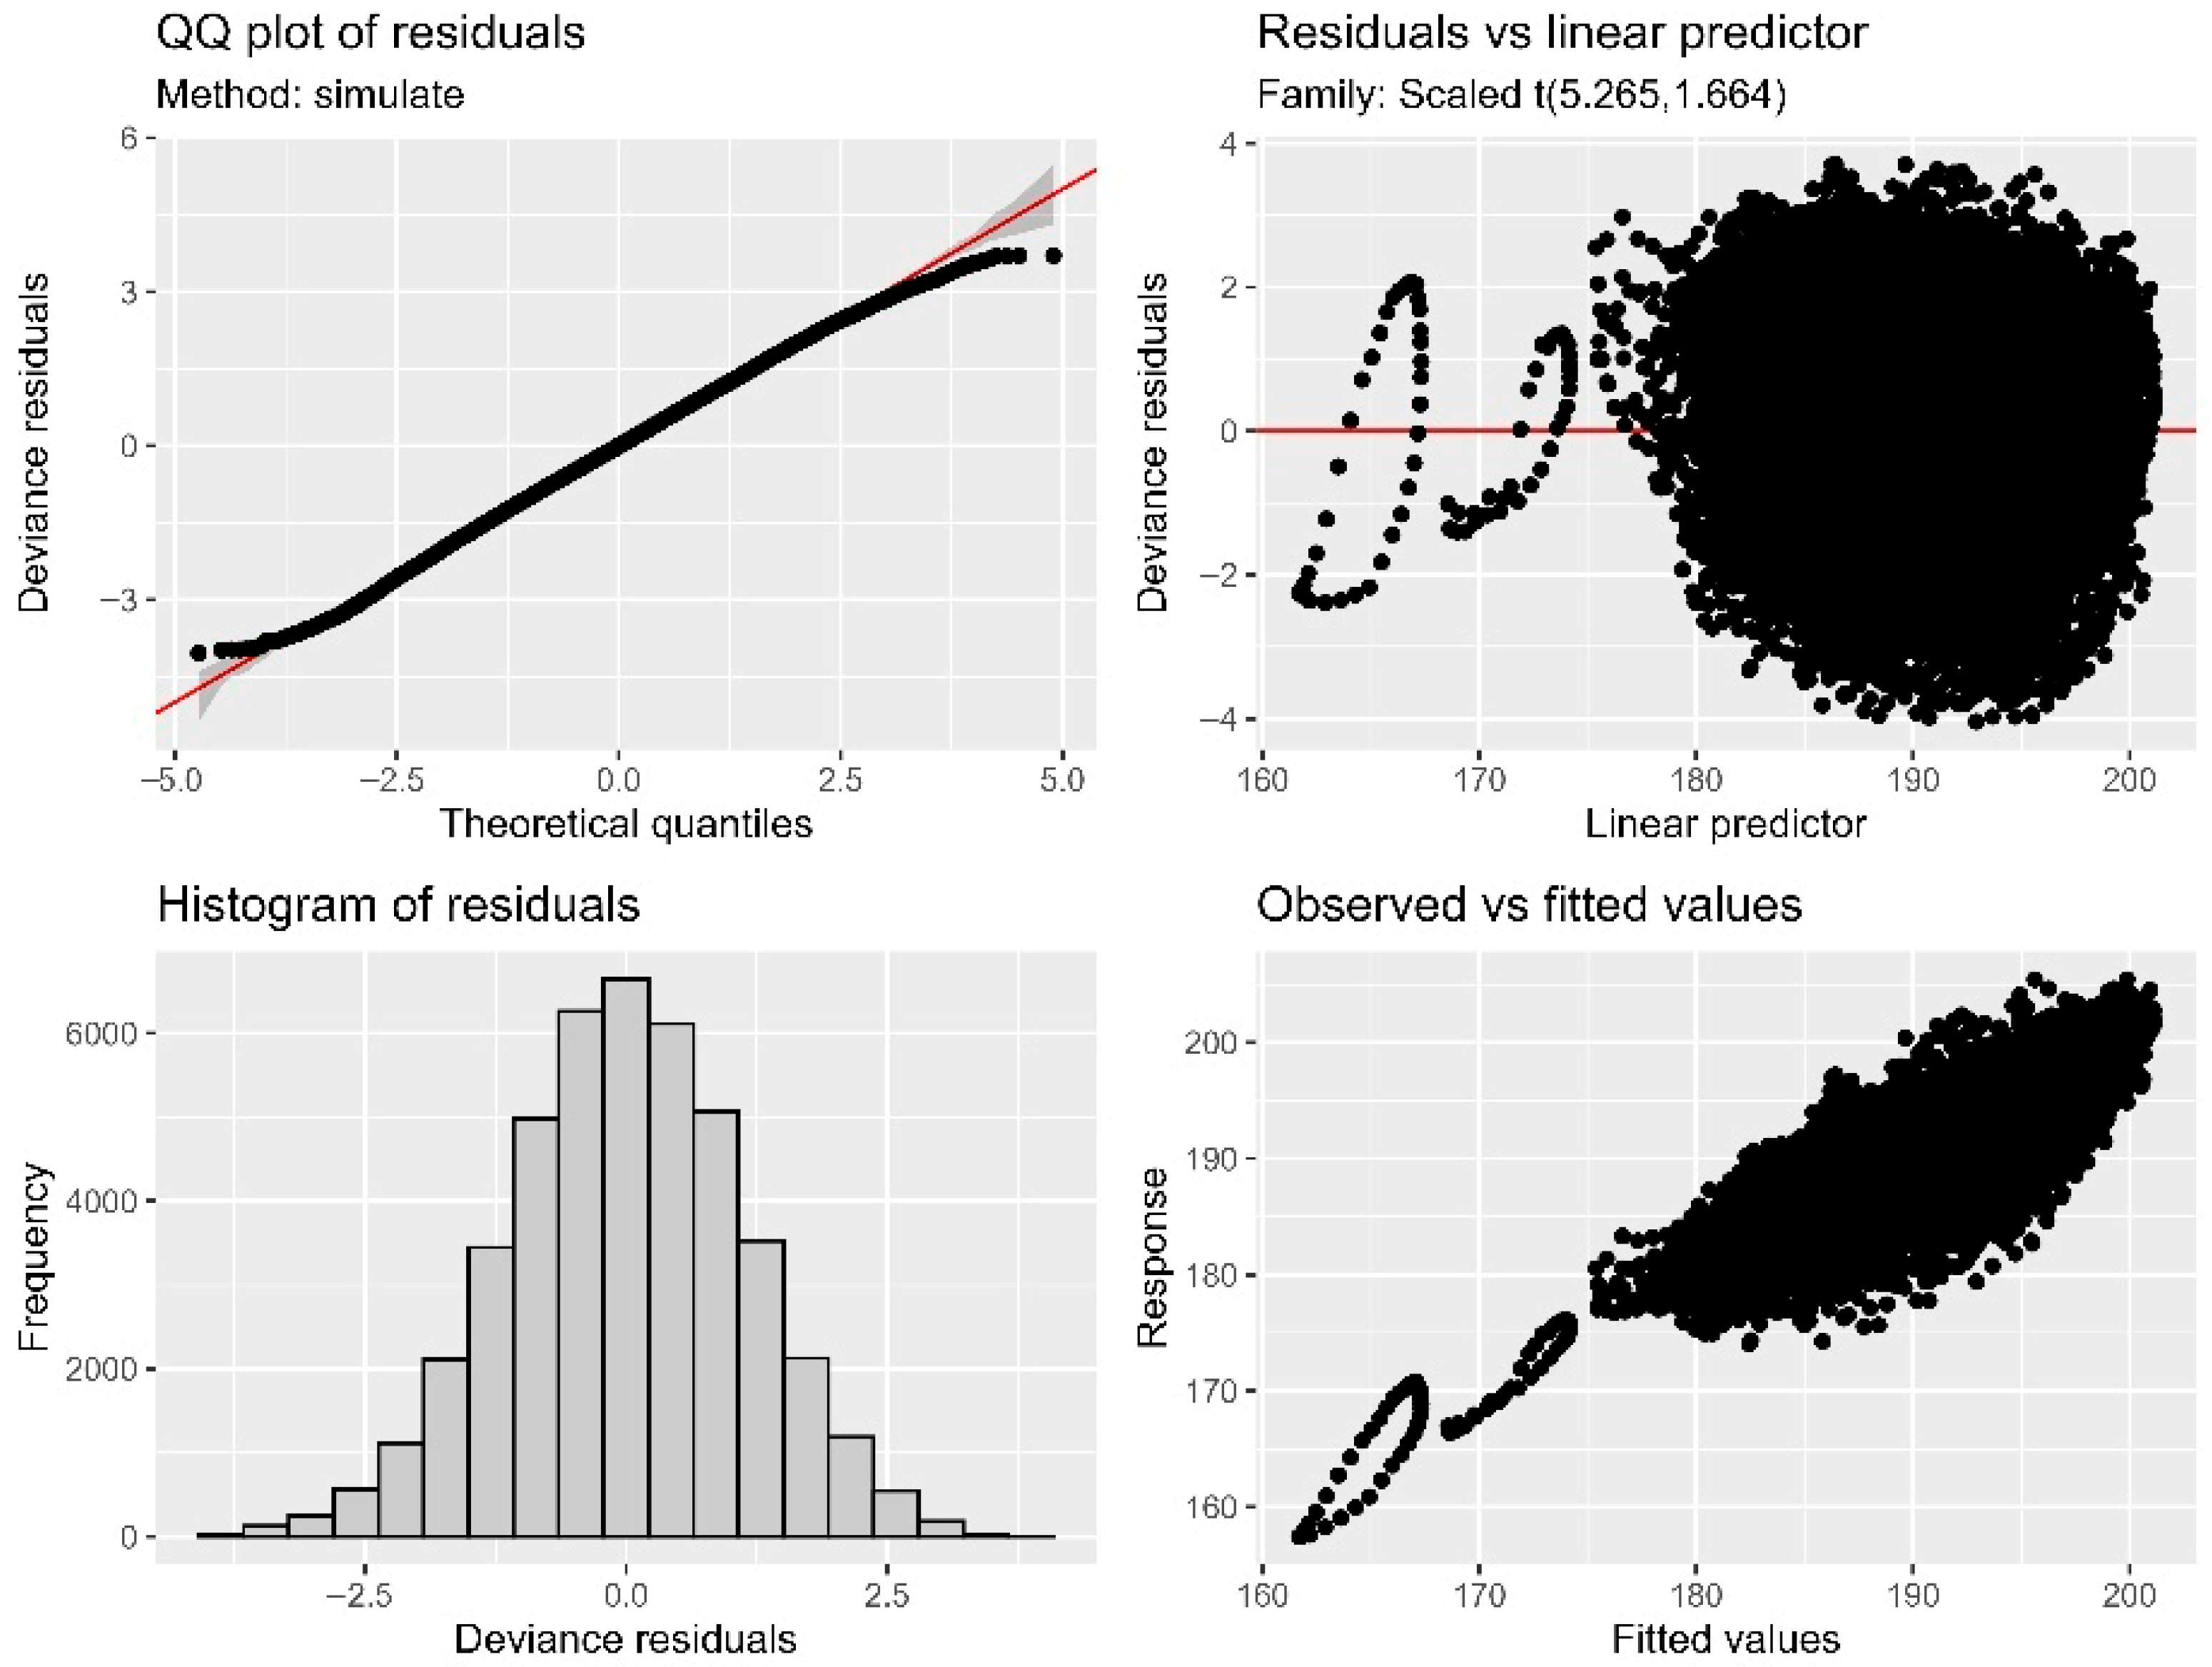
Figure 8 gathers standard diagnostics for the GAM analyzed in Figure 7. These were produced using the appraise function of the Gratia package [57]. Figure 8 includes a Q-Q plot and a histogram of the residuals, which demonstrate a largely normal distribution. Good fitness is achieved for typical observations, with only some deviation at the extreme ends, primarily at the highest theoretical quantiles. Figure 8 also includes scatter plots of the model residuals versus the fitted values, which display random scatter throughout the V S range. The response versus the fitted values generally follows the 1:1 line, with limited deviations which are not systematic. Loops of points correspond to V S values of the same event at different azimuths, centered at close to zero residual.
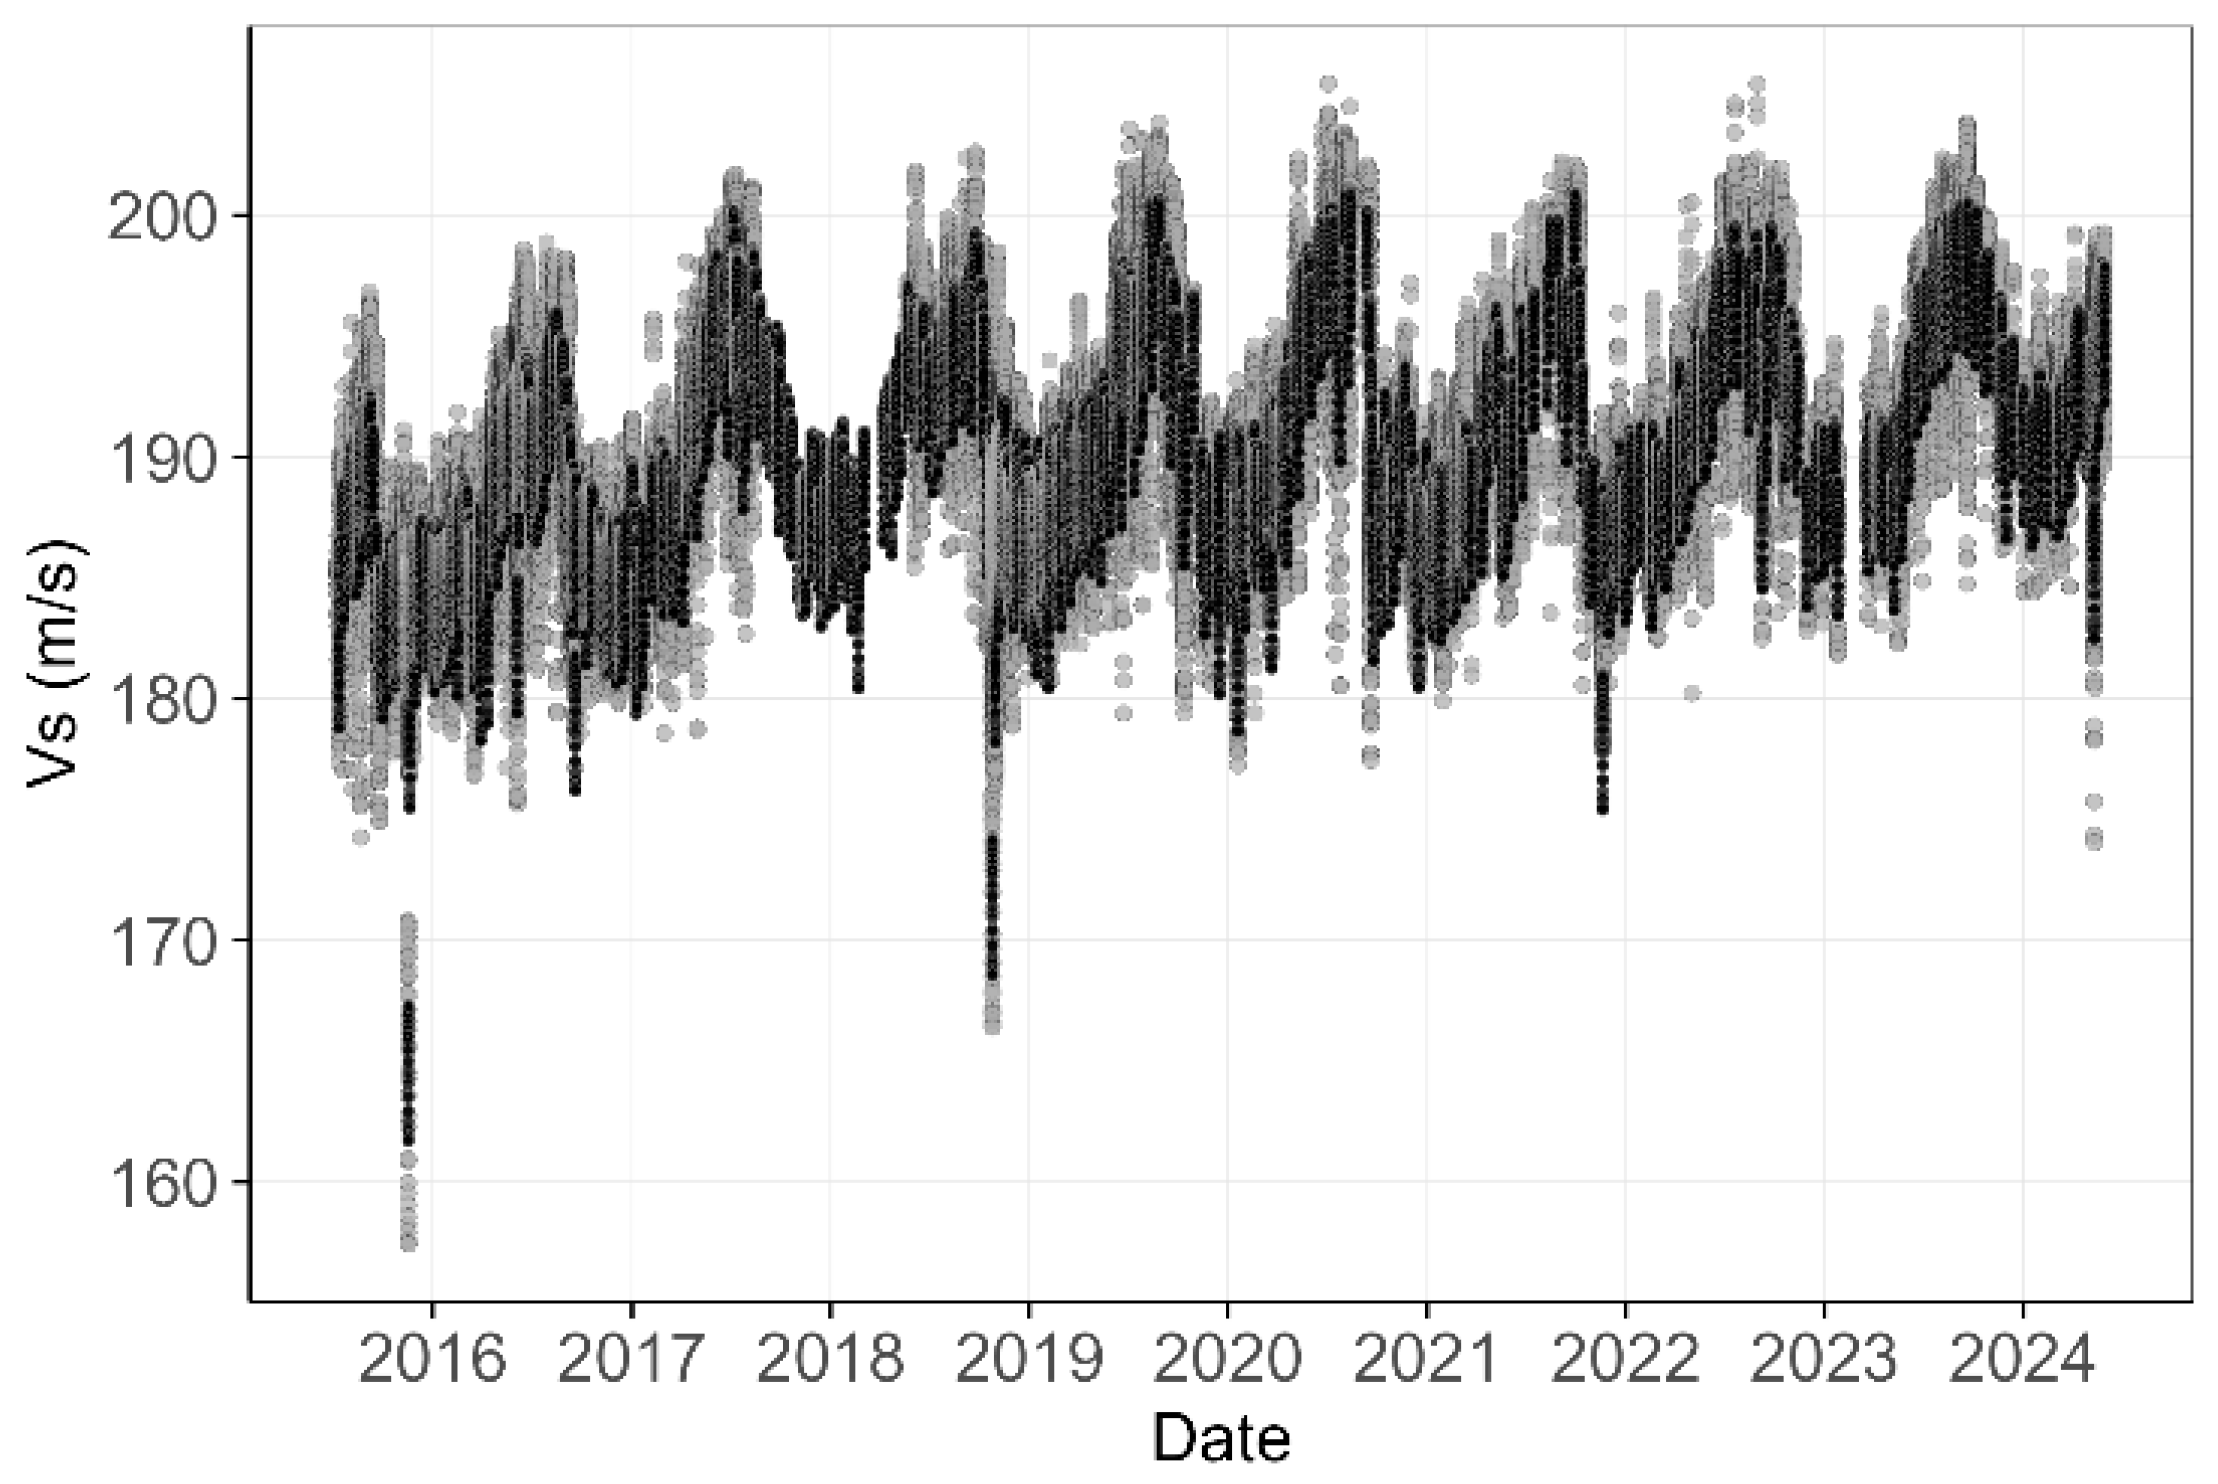
Figure 9 compares the observed and GAM-based, synthetic V S values for the 0–15.5 m depth interval and for the entire time frame of the analysis. The two sets of values generally align well. However, we may be missing some azimuthal variation because our model does not account for the seasonality of anisotropy. This is implied by the fact that the range of synthetic values for certain events is narrower than the range of actual observations. On a positive note, using the GAM allows us to fill in gaps in our dataset. For instance, we can address the absence of observed V S values (i.e., absence of gray points) in the first half of 2018 when the CK15 station was out of operation.

6. Implications for the Masking of V S Reduction Due to Nonlinear Soil Behavior

Figure 10 shows the events identified by the GAM as having a reduced V S explicitly associated with the t e ( m a g ,   R e p i ) partial effect (Table S1). In Figure 10a, epicentral distance is plotted against magnitude. Blue points show a V S reduction (ΔVs), with darker color and larger symbol size indicating stronger reduction (up to 15.2 m/s). In Figure 10b, the measured by interferometry V S values are plotted for all events and azimuths with time as in Figure 5b, although now gray points are for events that according to the GAM do not show any reduction associated with the tensor product t e ( m a g ,   R e p i ) and blue points show those affected, the same as in Figure 10a. Black circles are the predicted V S values, incorporating all partial effects from the GAM (interactions, seasonal variation and azimuthal dependencies). There is generally good agreement between observations (blue points) and predictions (black circles), which shows that the GAM performs well not only in general for the dataset on which it has been trained, but also specifically for the events that are possibly associated with nonlinear soil behavior.
We verified that all 16 events indicated by the GAM analysis as possibly related to soil nonlinearity present coseismic V S reduction. To do so, we repeated the analysis with seismic interferometry by deconvolution, but this time in a piecewise manner. We started with the analysis of a time window of 3 s duration that included the onset of P waves. Then, the processing window gradually increased in steps of 0.1 s up to the time corresponding to 75% of the Arias intensity. The result is a time series of V S values showing the variations in the parameter in the examined depth interval during each earthquake. In Figure 11 we show the analysis in the NS component for two example events, one strong (M6.4 Lefkada earthquake) and one weaker (M3.9, 19 June 2019) demonstrating the V S drop, at the entrance of the S-waves.

7. Conclusions

This study comprehensively investigated the variation in shear-wave velocity ( V S ) in the topsoil of the ARGONET vertical array site in Cephalonia, Greece. Rather than using laboratory or geophysical measurements, this study used an extensive set of 1347 earthquake records obtained on-site. By applying seismic interferometry by deconvolution on sensor pairs at depths of 0–5.6 m and 0–15.5 m and subsequently employing a Generalized Additive Model (GAM), we successfully disentangled multiple factors contributing to V S variation.
Due to the high seismicity of Cephalonia and the consequent sufficiency of earthquake records, we were able to conduct a detailed analysis of the variation in interferometric V S values. We verified a previously observed annual pattern [6,27] with higher values during the dry summer months and lower values during the rainy winter season. This effect was found to be more pronounced in the topmost soil formations (0–5.6 m) than in the broader examined depth interval (0–15.5 m), implying a strong relationship with atmosphere-soil interactions.
We further detected a significant azimuthal V S variation independent of the earthquake’s back-azimuth, which suggests soil anisotropy. This anisotropy was found to change in both amplitude and direction with depth. Additionally, we demonstrated that the anisotropy also exhibits seasonal dependency, strengthening during the dry summer months, particularly in the shallowest part of the soil column (0–5.6 m). This may be due to mechanisms such as differential thermal expansion or desiccation cracks.
Stronger earthquakes in terms of magnitude and/or PGA typically resulted in low V S values, often beyond the lower levels of the seasonal and azimuthal variations. These findings were interpreted as evidence of nonlinear soil behavior. Crucially, the study highlighted that this V S reduction due to nonlinear soil behavior can be masked by seasonal and azimuthal V S variation, particularly when strong ground shaking occurs during periods of elevated V S in the summer.
Having made these observations directly on the interferometric V S values, we subsequently used a generalized additive model to separate the different factors contributing to the variation of V S . This method was chosen due to its flexibility to model both linear and nonlinear relations without the need for a priori constraints on the type of relations. The GAM proved to be a robust tool for separating and quantifying the relative contributions of the co-acting factors and explained 80.9% of the V S variance. We have not extracted the GAM with the purpose of predicting V S for events outside the training dataset. We have rather used it to disentangle the various factors affecting V S and identify more events exhibiting V S reduction potentially linked—at least partly—to nonlinear soil response. We identified several such events and verified through time-evolving seismic interferometry by deconvolution analysis that they indeed show co-seismic V S reduction at the arrival of the S-waves. For some of these events, the V S reduction due to soil nonlinearity was masked primarily by the seasonal V S variation.
The GAM further revealed longer-period variations in V S over time (year-to-year), which may reflect the soil’s slow recovery following strong earthquakes in the broader region. More data, especially following strong earthquakes, are needed to fully understand these longer-period variations and incorporate them reliably into predictive models.
The efficiency of the GAM was further demonstrated by its ability to capture the effects of an extreme atmospheric event, hurricane “Ianos”, which hit western Greece in 2020. The model’s tensor interaction terms successfully captured the unusual (unique in one out of the 10 years covered by the dataset) and rapid V S changes caused by this event.
Identifying and quantifying the various causes of V S variation, particularly directly from on-site earthquake records, greatly improves our understanding of how shallow, unconsolidated soil impacts a site’s response during earthquakes. In addition, this approach helps us identify the most appropriate tactics for measuring the characteristic values of V S used for geotechnical site characterization. It also highlights the need to at least report the relevant variations. Although our study focused on a single well-instrumented site, it demonstrated the capabilities of modern data and analysis tools to identify and separate the various co-acting factors that shape an important seismological and geotechnical parameter. Similar results are needed for numerous other sites with different geologies toward improving earthquake resilience globally.

Supplementary Materials

The following supporting information can be downloaded at: https://www.mdpi.com/article/10.3390/app151910727/s1, Table S1. Information on the 16 events identified by the GAM as having a reduced V S explicitly associated with the t e ( m a g ,   R e p i ) partial effect. Vs values from interferometry and the GAM refer to 0° azimuth of observation.

Author Contributions

Conceptualization, Z.R.; methodology, Z.R.; software, Z.R.; validation, Z.R., F.H. and I.G.; formal analysis, Z.R.; investigation, Z.R.; resources, Z.R. and F.H.; data curation, Z.R. and F.H.; writing—original draft preparation, Z.R.; writing—review and editing, Z.R., F.H., N.T. and I.G.; visualization, Z.R.; supervision, Z.R.; project administration, Z.R.; funding acquisition, Z.R. All authors have read and agreed to the published version of the manuscript.

Funding

This research was supported by the Hellenic Foundation for Research and Innovation (H.F.R.I.) under the “2nd Call for H.F.R.I. Research Projects to support Faculty Members & Researchers” (Project Number: 2724).

Institutional Review Board Statement

Not applicable.

Informed Consent Statement

Not applicable.

Data Availability Statement

All waveforms processed in this study come from the ARGONET online database at https://argonet-kefalonia.org/data/argonet_data/ (assessed on 30 May 2025). Metadata on the processed events, i.e., origin time, hypocenter location, and local magnitude, ML, were obtained from the online catalog of the Institute of Geodynamics of the National Observatory of Athens (NOA; http://bbnet.gein.noa.gr, assessed on 28 March 2025).

Acknowledgments

The ARGONET infrastructure was established within the framework of the Sinaps@ project (ANR-11-RSNR-0022). Its maintenance is funded by EDF (Électricité de France) and CEA (French Alternative Energies and Atomic Energy Commission) and operated by ITSAK (Institute of Engineering Seismology and Earthquake Engineering), the University of Patras, and the Ionian University. ARGONET constitutes the in situ experimental platform of the SEISM Institute (http://www.institut-seism.fr/en/, assessed 30 June 2025). Python 3.13, ObsPy [58] and Matlab [59] were used to analyze the time variation in velocities and generate most figures. For the GAMs analysis we used R v4.3.3 (R Core Team, 2023) and the mgcv package [28]. The map in Figure 1 was generated using the Generic Mapping Tools [60].

Conflicts of Interest

The authors declare no conflicts of interest.

Abbreviations

The following abbreviations are used in this manuscript:
PGAPeak Ground Acceleration
GAMGeneralized Additive Model
IQRInterquartile Range
CRSCubic Regression Splines
TPRSThin Plate Regression Splines

References

  1. Mehta, K.; Snieder, R.; Graizer, V. Downhole receiver function: A case study. Bull. Seismol. Soc. Am. 2007, 97, 1396–1403. [Google Scholar] [CrossRef]
  2. Nakata, N.; Snieder, R. Near-surface weakening in Japan after the 2011 Tohoku-Oki earthquake. Geophys. Res. Lett. 2011, 38. [Google Scholar] [CrossRef]
  3. Nakata, N.; Snieder, R. Estimating near-surface shear wave velocities in Japan by applying seismic interferometry to KiK-net data. J. Geophys. Res. 2012, 117, B01308. [Google Scholar] [CrossRef]
  4. Chandra, J.; Guéguen, P.; Steidl, J.H.; Bonilla, L.F. In Situ Assessment of the G-γ Curve for Characterizing the Nonlinear Response of Soil: Application to the Garner Valley Downhole Array and the Wildlife Liquefaction Array. Bull. Seism. Soc. Am. 2015, 105, 993–1010. [Google Scholar] [CrossRef]
  5. Guéguen, P. Predicting nonlinear site response using spectral acceleration VS PGV/VS30: A case history using the Volvi-Test site. Pure Appl. Geophys. 2016, 173, 2047–2063. [Google Scholar] [CrossRef]
  6. Roumelioti, Z.; Hollender, F.; Guéguen, P. Rainfall-Induced Variation of Seismic Waves Velocity in Soil and Implications for Soil Response: What the ARGONET (Cephalonia, Greece) Vertical Array Data Reveal. Bull. Seism. Soc. Am. 2020, 110, 441–451. [Google Scholar] [CrossRef]
  7. Qin, L.; Steidl, J.H.; Qiu, H.; Nakata, N.; Ben-Zion, Y. Monitoring seasonal shear wave velocity changes in the top 6 m at Garner Valley in southern California with borehole data. Geophys. Res. Lett. 2022, 49, e2022GL101189. [Google Scholar] [CrossRef]
  8. Rubin, A.M. Using Repeating Earthquakes to Correct High-Precision Earthquake Catalogs for Time-Dependent Station Delays. Bull. Seism. Soc. Am. 2002, 92, 1647–1659. [Google Scholar] [CrossRef]
  9. Paoletti, V. Remarks on factors influencing shear wave velocities and their role in evaluating susceptibilities to earthquake-triggered slope instability: Case study. Nat. Hazards Earth Syst. Sci. 2012, 12, 2147–2158. [Google Scholar] [CrossRef]
  10. Sens-Schönfelder, C.; Wegler, U. Passive image interferometry and seasonal variations of seismic velocities at Merapi volcano, Indonesia. Geophys. Res. Lett. 2006, 33, L21302. [Google Scholar] [CrossRef]
  11. Larose, E.; Bontemps, N.; Lacroix, P.; Taipe, E. Landslide monitoring in southern Peru: SEG Geoscientists without borders® project. Proc. SEG Tech. Program Expand. Abstr. 2017, 5322–5326. [Google Scholar] [CrossRef]
  12. Wang, Q.-Y.; Brenguier, F.; Campillo, M.; Lecointre, A.; Takeda, T.; Aoki, Y. Seasonal crustal seismic velocity changes throughout Japan. J. Geophys. Res. Res. Solid Earth 2017, 122, 7987–8002. [Google Scholar] [CrossRef]
  13. Clements, T.; Denolle, M.A. Tracking groundwater levels using the ambient seismic field. Geophys. Res. Lett. 2018, 45, 6459–6465. [Google Scholar] [CrossRef]
  14. Miao, Y.; Shi, Y.; Wang, S.Y. Temporal change of near surface shear wave velocity associated with rainfall in Northeast Honshu, Japan. Earth Planets Space 2018, 70, 204. [Google Scholar]
  15. Wen, K.-L. Non-linear soil response in ground motions. Earthq. Eng. Struct. Dyn. 1994, 26, 599–608. [Google Scholar]
  16. Sato, K.; Kokusho, T.; Matsumoto, M.; Yamada, E. Nonlinear seismic response and soil property during strong motion. Soils Found. 1996, 36, 41–52. [Google Scholar] [CrossRef] [PubMed]
  17. Sawazaki, K.; Sato, H.; Nakahara, H.; Nishimura, T. Temporal change in site response caused by earthquake strong motion as revealed from coda spectral ratio measurement. Geophys. Res. Lett. 2006, 33, L21303. [Google Scholar] [CrossRef]
  18. Shi, Y.; Wang, S.Y.; Cheng, K.; Miao, Y. In situ characterization of nonlinear soil behavior of vertical ground motion using KiK-net data. Bull. Earthq. Eng. 2020, 18, 4605–4627. [Google Scholar] [CrossRef]
  19. Rubinstein, J.L.; Beroza, G.G. Evidence for widespread nonlinear strong ground motion in Mw 6.9 Loma Prieta Earthquake. Bull. Seism. Soc. Am. 2004, 94, 1595–1608. [Google Scholar] [CrossRef]
  20. Rubinstein, J.L.; Beroza, G.G. Depth constraints on nonlinear strong ground motion from the 2004 Parkfield earthquake. Geophys. Res. Lett. 2005, 32, L14313. [Google Scholar] [CrossRef]
  21. Sawazaki, K.; Sato, H.; Nakahara, H.; Nishimura, T. Time-Lapse Changes of Seismic Velocity in the Shallow Ground Caused by Strong Ground Motion Shock of the 2000 Western-Tottori Earthquake, Japan, as Revealed from Coda Deconvolution Analysis. Bull. Seism. Soc. Am. 2009, 99, 352–366. [Google Scholar] [CrossRef]
  22. Peng, Z.; Ben-Zion, Y. Temporal changes of shallow seismic velocity around the Karadere-Duzce branch of the North Anatolian Fault and strong ground motion. Pure Appl. Geophys. 2006, 163, 567–599. [Google Scholar] [CrossRef]
  23. Takagi, R.; Okada, T. Temporal change in shear velocity and polarization anisotropy related to the 2011 M9.0 Tohoku-Oki earthquake examined using KiK-net vertical array data. Geophys. Res. Lett. 2012, 39, L09310. [Google Scholar] [CrossRef]
  24. Sawazaki, K.; Snieder, R. Time-lapse changes of P- and S-wave velocities and shear wave splitting in the first year after the 2011 Tohoku earthquake, Japan: Shallow subsurface. Geophys. J. Int. 2013, 193, 238–251. [Google Scholar] [CrossRef]
  25. Wang, H.Y.; Jiang, W.P.; Wang, S.Y.; Miao, Y. In situ assessment of soil dynamic parameters for characterizing nonlinear seismic site response using KiK-net vertical array data. Bull. Earthq. Eng. 2019, 17, 2331–2360. [Google Scholar] [CrossRef]
  26. Régnier, J. Non-linear soil response at strong motion observation sites with a focus on borehole array. In Proceedings of the 6th IASPEI/IAEE International Symposium: Effects of Surface Geology on Seismic Motion, Kyoto, Japan, 30 August–1 September 2021. [Google Scholar]
  27. Grendas, I.; Roumelioti, Z.; Theodoulidis, N.; Hollender, F. Ground-Motion Dependency on Seasonal Variations: Observations at the ARGONET Array, Cephalonia, Greece. Bull. Seism. Soc. Am. 2025, 115, 1801–1817. [Google Scholar] [CrossRef]
  28. Wood, S.N. Generalized Additive Models: An Introduction with R, 2nd ed.; CRC Press: Boca Raton, FL, USA, 2017. [Google Scholar]
  29. Gutenberg, B. Effects of ground on earthquake motion. Bull. Seismol. Soc. Am. 1957, 47, 221–250. [Google Scholar] [CrossRef]
  30. Wiggins, J.J.H. Effect of site conditions on earthquake intensity. J. Struct. Div. 1964, 90, 279–314. [Google Scholar] [CrossRef]
  31. Borcherdt, R.D. Effects of local geology on ground motion near San Francisco Bay. Bull. Seismol. Soc. Am. 1970, 60, 29–61. [Google Scholar]
  32. Bard, P.-Y.; Bouchon, M. The Two-Dimensional Resonance of Sediment-Filled Valleys. Bull. Seism. Soc. Am. 1985, 75, 519–541. [Google Scholar] [CrossRef]
  33. Tucker, B.E.; King, J.L. Dependence of sediment-filled valley response on input amplitude and valley properties. Bull. Seism. Soc. Am. 1984, 74, 153–165. [Google Scholar] [CrossRef]
  34. Bard, P.Y. Effects of surface geology on ground motion: Recent results and remaining issues. In Proceedings of the 10th European Conference on Earthquake Engineering, Vienna, Austria, 28 August–2 September 1994; pp. 305–323. [Google Scholar]
  35. Anderson, J.G.; Lee, Y.; Zeng, Y.; Day, S. Control of strong motion by the upper 30 meters. Bull. Seism. Soc. Am. 1996, 86, 1749–1759. [Google Scholar] [CrossRef]
  36. Aki, K.; Richards, P.G. Quantitative Seismology, 2nd ed.; University Science Books: Sausalito, CA, USA, 2002. [Google Scholar]
  37. Kristek, J.; Moczo, P.; Bard, P.Y.; Hollender, F.; Stripajová, S. Computation of amplification factor of earthquake ground motion for a local sedimentary structure. Bull. Earthq. Eng. 2018, 16, 2451–2475. [Google Scholar] [CrossRef]
  38. Gan, B.-L.; Zhang, D.-M.; Huang, Z.-K.; Zheng, F.-Y.; Zhu, R.; Zhang, W. Ontology-driven knowledge graph for decision-making in resilience enhancement of underground structures: Framework and application. Tunn. Undergr. Space Technol. 2025, 163, 106739. [Google Scholar] [CrossRef]
  39. Theodoulidis, N.; Hollender, F.; Mariscal, A.; Moiriat, D.; Bard, P.Y.; Konidaris, A.; Cushing, M.; Konstantinidou, K.; Roumelioti, Z. The ARGONET (Greece) Seismic Observatory: An Accelerometric Vertical Array and Its Data. Seism. Res. Lett. 2018, 89, 1555–1565. [Google Scholar] [CrossRef]
  40. KF Network, Institute of Engineering Seismology Earthquake Engineering, Atomic Energy and Alternative Energies Commission, University of Patras, & Ionian University. ARGONET, a Vertical Accelerometric Array Implemented on the Island of Kefalonia in Greece [Data set]. 2015, International Federation of Digital Seismograph Networks. Available online: https://doi.org/10.7914/3my7-3148 (accessed on 29 July 2025).
  41. Clayton, R.W.; Wiggins, R.A. Source shape estimation and deconvolution of teleseismic bodywaves. Geophys. J. R. Astron. Soc. 1976, 47, 151–177. [Google Scholar] [CrossRef]
  42. Riga, E.; Hollender, F.; Roumelioti, Z.; Bard, P.Y.; Pitilakis, K. Assessing the applicability of deconvolution of borehole records for determining near-surface shear wave attenuation. Bull. Seism. Soc. Am. 2019, 109, 621–635. [Google Scholar] [CrossRef]
  43. Roumelioti, Z.; Hollender, F. Seasonal Variation of VS at Shallow Depth and Nonlinear Behavior of Soil Based on the ARGONET Vertical Array Data. Tech. Ann. 2024, 1. [Google Scholar] [CrossRef]
  44. Hastie, T.; Tibshirani, R. Generalized Additive Models. Statist. Sci. 1986, 1, 297–310. [Google Scholar] [CrossRef]
  45. Wood, S.N. mgcv: Mixed GAM Computation Vehicle with Automatic Smoothness Estimation, R Package Vvrsion 1.9-3. 2025. Available online: https://cran.r-project.org/web/packages/mgcv/index.html (accessed on 28 September 2025).
  46. Saltogianni, V.; Moschas, F.; Stiros, S. The 2014 Cephalonia Earthquakes: Finite Fault Modeling, Fault Segmentation, Shear and Thrusting at the NW Aegean Arc (Greece). Pure Appl. Geophys. 2018, 175, 4145–4164. [Google Scholar] [CrossRef]
  47. Pham, H.Q.; Fredlund, D.G.; Lee Barbour, S. A study of hysteresis models for soil-water characteristic curves. Can. Geotech. J. 2005, 42, 1548–1568. [Google Scholar] [CrossRef]
  48. James, S.R.; Knox, H.A.; Abbott, R.E.; Screaton, E.J. Improved moving window cross-spectral analysis for resolving large temporal seismic velocity changes in permafrost. Geophys. Res. Lett. 2017, 44, 4018–4026. [Google Scholar] [CrossRef]
  49. Voisin, C.; Guzmán, M.A.R.; Réfloch, A.; Taruselli, M.; Garambois, S. Groundwater Monitoring with Passive Seismic Interferometry. J. Water Resour. Prot. 2017, 09, 1414–1427. [Google Scholar] [CrossRef]
  50. Illien, L.; Andermann, C.; Sens-Schönfelder, C.; Cook, K.L.; Baidya, K.P.; Adhikari, L.B.; Hovius, N. Subsurface Moisture Regulates Himalayan Groundwater Storage and Discharge. AGU Adv. 2021, 2, e2021AV000398. [Google Scholar] [CrossRef]
  51. Mao, S.; Lecointre, A.; van der Hilst, R.D.; Campillo, M. Space-time monitoring of groundwater fluctuations with passive seismic interferometry. Nat. Commun. 2022, 13, 4643. [Google Scholar] [CrossRef]
  52. Delouche, E.; Stehly, L. Seasonal Seismic Velocity Variations Measured Using Seismic Noise Autocorrelations to Monitor the Dynamic of Aquifers in Greece. J. Geophys. Res. Solid Earth 2023, 128, e2023JB026759. [Google Scholar] [CrossRef]
  53. Shen, Z.; Yang, Y.; Fu, X.; Adams, K.H.; Biondi, E.; Zhan, Z. Fiber-optic seismic sensing of vadose zone soil moisture dynamics. Nat. Commun. 2024, 15, 6432. [Google Scholar] [CrossRef]
  54. Lagouvardos, K.; Karagiannidis, A.; Dafis, S.; Kalimeris, A.; Kotroni, V. Ianos—A hurricane in the Mediterranean. Bull. Am. Meteorol. Soc. 2022, 103, E1621–E1636. [Google Scholar] [CrossRef]
  55. Copernicus Climate Change Service ERA5-Land Hourly Data from 1950 to Present. Copernicus Climate Change Service (C3S) Climate Data Store (CDS). 2024. Available online: https://doi.org/10.24381/cds.e2161bac (accessed on 1 October 2024).
  56. Muñoz Sabater, J.; Dutra, E.; Agustí-Panareda, A.; Albergel, C.; Arduini, G.; Balsamo, G.; Boussetta, S.; Choulga, M.; Harrigan, S.; Hersbach, H.; et al. ERA5-Land: A state-of-the-art global reanalysis dataset for land applications, Earth Syst. Sci. Data 2021, 13, 4349–4383. [Google Scholar] [CrossRef]
  57. Simpson, G.L. gratia: Graceful ggplot-Based Graphics and Other Functions for GAMs Fitted Using mgcv, [R package] Version 0.11.1. 2023. Available online: https://cran.r-project.org/web/packages/gratia/index.html (accessed on 28 September 2025).
  58. Beyreuther, M.; Barsch, R.; Krischer, L.; Megies, T.; Behr, Y.; Wassermann, J. ObsPy: A Python toolbox for seismology. Seism. Res. Lett. 2010, 81, 530–533. [Google Scholar] [CrossRef]
  59. MathWorks. MATLAB, Version R2022a; MathWorks: Natick, MA, USA, 2022.
  60. Wessel, P.; Luis, J.F.; Uieda, L.; Scharroo, R.; Wobbe, F.; Smith, W.H.F.; Tian, D. The Generic Mapping Tools version 6. Geochem. Geophys. Geosystems 2019, 20, 5556–5564. [Google Scholar] [CrossRef]
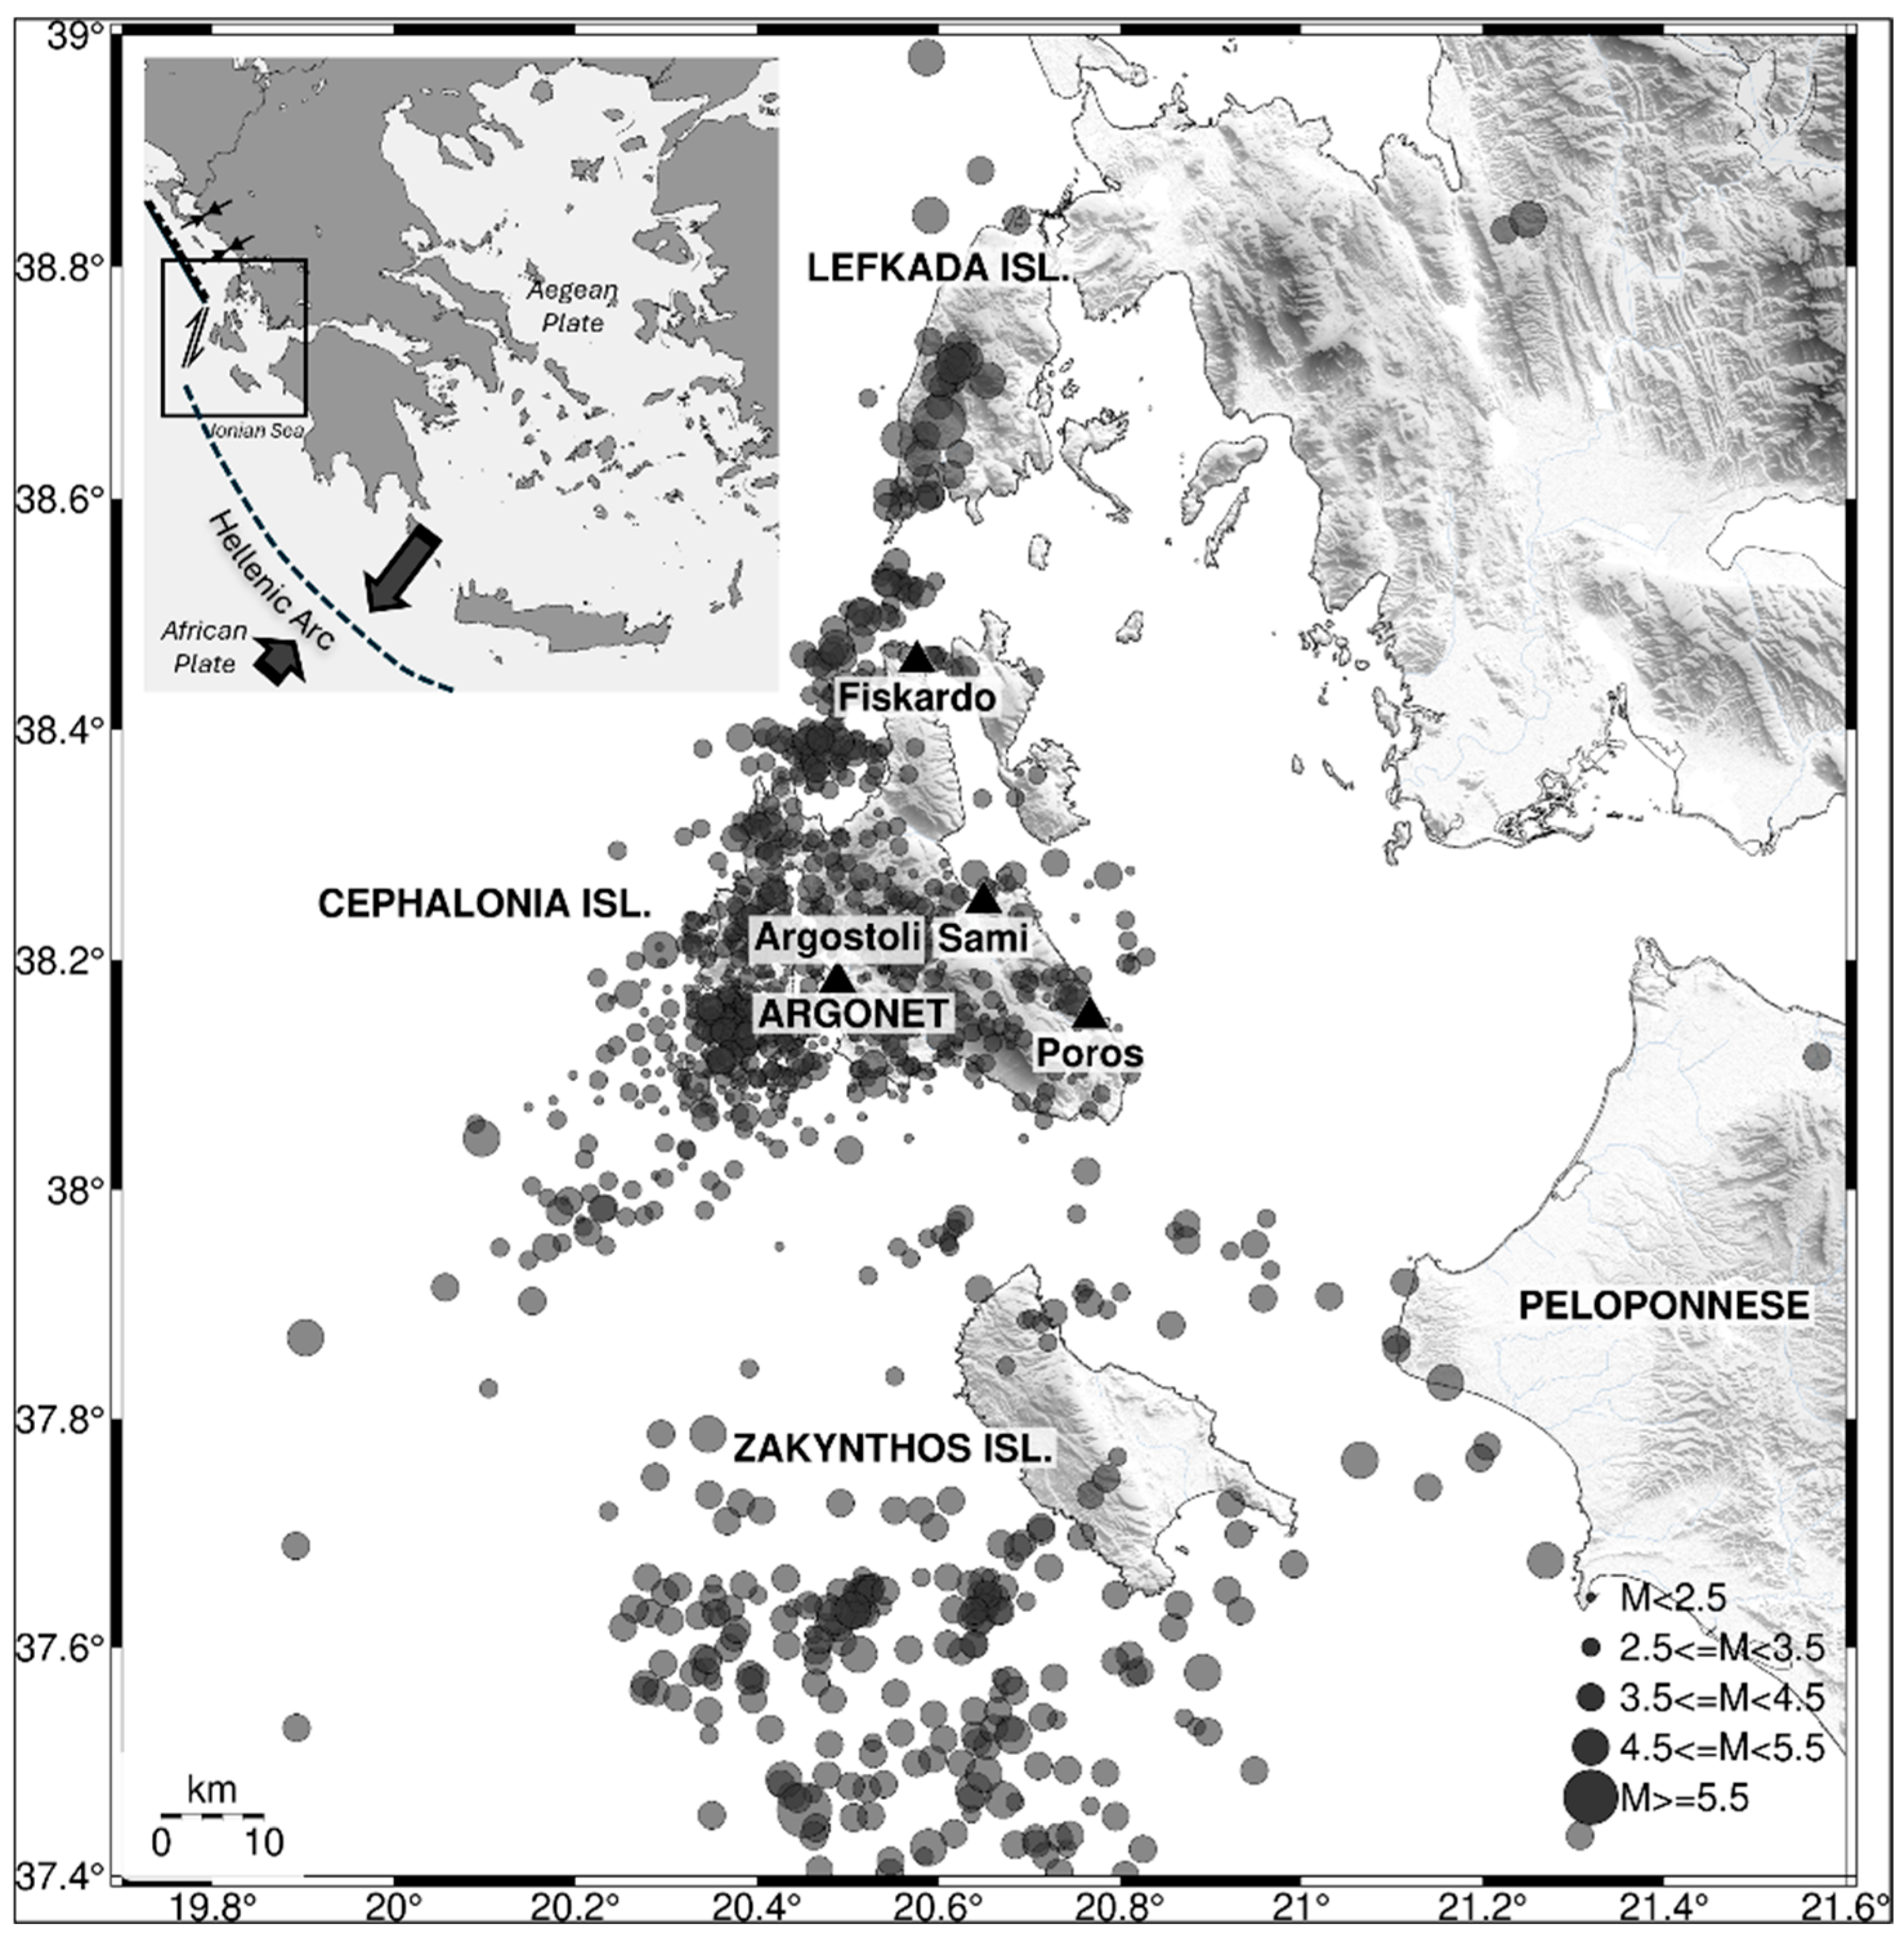
Figure 1. Regional map centered on the island of Cephalonia with earthquake epicenters from the ARGONET dataset up to 31 May 2024. The inset map summarizes the region’s general seismotectonic setting.
Applsci 15 10727 g001
Figure 2. Graphical description of the dataset: (a) distribution of ML magnitudes in bins and (b) PGA in the originally recorded directions versus the epicentral distance, Repi.
Applsci 15 10727 g002
Figure 3. Example of interferograms using the horizontal components of an ML 3.2 earthquake at an epicentral distance of R = 16.1 km. The results are shown for the CK0-CK15 sensor pair. Black dots mark the peaks used to measure the travel time of the pulse between stations. These measurements are then used to compute V S .
Applsci 15 10727 g003
Figure 4. Time variation in the V S values inferred by seismic interferometry by deconvolution at (a) the EW and (b) NS components of the CK0-CK6 sensor pair (0–5.6 m depth interval) and (c) the EW and (d) NS components of the CK0-CK15 sensor pair (0–15.5 m depth interval). Star symbols represent individual V S values. The thick line is a nine-point median smooth, interrupted wherever there is a considerable gap in the data. Also shown are the median V S (dashed line) and the interquartile ranges (IQR) of the distributions.
Applsci 15 10727 g004
Figure 5. Azimuthal variation of V S in (a) the 0–5.6 m depth interval and (b) the 0–15.5 m depth interval. Dots correspond to V S values from interferometry. Each vertical alignment of the dots results from processing the recordings of a single event in different directions (0–175° with a rotation step of 5°). The red continuous line is a nine-point median smooth of the highest per event V S values and the blue one of the lowest. The average distance between these curves (average fast—average slow) as well as their peak values are noted in the legend.
Applsci 15 10727 g005
Figure 6. Azimuthal distribution of maximum V S (Vmax) and minimum V S (Vmin) for (a) the 0–5.6 m and (b) 0–15.5 m depth intervals.
Applsci 15 10727 g006
Figure 7. GAM (Equation (3)) for V S in the 0–15.5 m depth interval; partial effects as smooth functions [ s   ] of the year of observation ( y e a r ), the day of the year ( D o Y ), and azimuth of observation ( a z ) and (bottom row) tensor product interaction terms of magnitude ( m a g ) with epicentral distance from ARGONET ( R e p i ) and D o Y with y e a r . All partial effects are in units of V S (m/s). Circular symbols in t e ( m a g ,   R e p i ) are data points. Shaded areas in smooth functions mark the 95% confidence interval of the partial effect. Below each plot, the type of the basis functions considered in the GAM is noted: TPRS (Thin Plate Regression Splines) or CRS (Cyclic Cubic Regression Splines).
Applsci 15 10727 g007
Figure 8. Plots of standard diagnostics for the model in Figure 7 (Equation (3)).
Applsci 15 10727 g008
Figure 9. Comparison of observed V S values (gray symbols) in the 0–15.5 m depth interval at ARGONET to predicted ones (black symbols) by the GAM (Figure 7, Equation (3)).
Applsci 15 10727 g009
Figure 10. Events associated with V S reduction from GAM analysis: (a) Magnitude-distance dependence of V S reductions, showing events with (blue) and without (gray) reductions (ΔVₛ). Color intensity and symbol size reflect the strength of the reduction, (b) Temporal evolution of interferometric V S for the 0–15.5 m depth interval (as in Figure 5b), with observed reductions (blue-filled circles; colored as in panel (a), and with no reduction (gray). Open circles are model predictions for the observations in blue, accounting for all partial effects in the GAM.
Applsci 15 10727 g010
Figure 11. Examples of V S variation analysis (0–15.5 m) by interferometry during individual earthquakes: (a) the M6.4 Lefkada earthquake, which occurred at a distance of ~56 km from ARGONET on 17 November 2015 and (b) a M3.9 earthquake, which occurred at a distance of ~8 km on 19 June 2019. The top part of each subplot shows the time history of ground acceleration in the NS component of CK0, and the bottom part maps the variation of V S over time. Interferometry was applied to time windows that gradually increased in duration starting with a minimum duration of 3 s at the beginning of the record and progressing to include longer segments at 0.1 s intervals. The black curves are running averages of the discrete V S values resulting from interferometry.
Applsci 15 10727 g011
Disclaimer/Publisher’s Note: The statements, opinions and data contained in all publications are solely those of the individual author(s) and contributor(s) and not of MDPI and/or the editor(s). MDPI and/or the editor(s) disclaim responsibility for any injury to people or property resulting from any ideas, methods, instructions or products referred to in the content.