Abstract
Salt cavern gas storage (SCGS) is a key development direction for future energy storage. However, the stability of the surrounding rock in underground SCGS remains a challenging issue to be resolved. This study uses numerical simulation methods to analyze the stability of the surrounding rock in SCGS at different height-to-diameter ratios and burial depths during both solution mining and long-term operation. The research results show that: SCGS at the same burial depth, as the height-to-diameter ratio increases from 1.2 to 2.2, the maximum displacement of the surrounding rock decreases by 32.3% and the plastic zone area decreases by 54.1%. However, the density of the plastic zone and the volume shrinkage of SCGS rate increase. The optimal cavern shape lies between a height-to-diameter ratio of 1.2 and 1.5. At the same height-to-diameter ratio, the stability of the salt cavern decreases as burial depth increases: the maximum displacement of the surrounding rock, cavern shrinkage rate, and plastic zone area increase by 94.6%, 99.05%, and 78.61%, respectively. Therefore, within a reasonable burial depth range, a shallower burial depth is more favorable for the stability of the surrounding rock. The presence of interlayers reduces cavern displacement, plastic zone, and cavity volume shrinkage, thereby influencing the stability of the surrounding rock. Among them, the interlayer located at the cavern waist reduced the cavern shrinkage rate by 10% and the maximum displacement by 21.9%, exerting the greatest influence on the stability of the surrounding rock.
1. Introduction
Salt rock is internationally recognized as an ideal medium for underground energy storage [1,2,3,4,5]. During the solution mining and long-term operation of SCGS, the deformation of the surrounding rock increases with the duration of operation. Excessive deformation can lead to surrounding rock instability, gas storage leakage, and other safety incidents [6,7,8,9], causing significant losses. Therefore, studying the stability of SCGS during the solution mining and long-term operation stages is of critical importance for guiding engineering construction.
At present, the single-well oil-pad convection method is widely adopted in China for the construction of salt cavern reservoirs. This method involves injecting fresh water or unsaturated brine to dissolve the salt rock and utilizes the oil cushion interface layer to control the dissolution morphology (Figure 1), aiming to form an ideal cavity geometry [10,11].

Figure 1.
Schematic Diagram of Solution Mining Cavern Construction.
However, during the solution mining process, issues such as controlling the brine concentration and the collapse of insoluble interlayers pose significant challenges to the safety of the solution mining operation. Liang et al. [12]. analyzed the solution mining mechanism of salt deposits and provided a mathematical expression for salt rock dissolution, clarifying the solution transport laws in solution mining and laying a foundation for the theory of solution mining. Wang et al. [13] established a multi-physics field coupling model to evaluate the brine flow rate and concentration distribution in real-time during the solution mining process, comparing the results with field data to verify the accuracy of the predictions. Zhao et al. [14] focused on the fracture behavior of inclined interlayers during the solution mining process, established mechanical models for different cavern-construction stages under various constraint conditions and revealing their mechanical responses under different constraint conditions. Ge et al. [15] through block drop experiments in water, explored the effects of block drop paths, block geometry, and initial conditions, providing valuable references for wellbore protection strategies and cavity shape optimization design.
The above factors pose significant safety risks for the construction of underground salt cavern gas storage facilities. However, such facilities not only face instability risks during the solution mining process but are also adversely affected during long-term operation by geological structural planes such as faults and joints, due to their relatively low strength [16]. The presence of interlayers can effectively constrain the deformation of the salt rock, thereby enhancing cavern stability and safety [17,18,19]. Studies have shown that factors such as the content, number, dip angle, as well as the anisotropy of elastic modulus and Poisson’s ratio of interlayers have significant impacts on the long-term stability of salt caverns, and these can be regulated through appropriate engineering measures [20,21,22]. Regarding the influence of cavern geometry on stability, Liu et al. [23] employed numerical simulations to compare the shrinkage rate and plastic zones of caverns with different shapes and concluded that elliptical caverns demonstrate better stability than other cavern geometries. Liu et al. [24], through both physical experiments and numerical simulations, found that under the same construction duration, the solution-mined volume of a twin-well horizontal (TWH) cavern is 2.5 times that of a single-well vertical (SWV) cavern, thereby verifying the feasibility of replacing SWV caverns with TWH caverns and finding that storage caverns with high injection and production frequency are suitable for depths of less than 1000 m, while caverns at depths greater than 1000 m are suitable for storing gases with lower injection and production frequencies. Mortazavi et al. [25] conducted a comprehensive study of the design parameters of SCGS, evaluating the effects of cavern volume, geostress state, and other factors, and concluded that the smaller the lateral geostress coefficient and cavern volume, the stronger the cavern stability.
Most of the above studies have focused on the influence of cavern properties and interlayer collapse on the overall stability of the surrounding rock, but the effects of cavern height-to-diameter ratio, burial depth, and the position of individual interlayers on cavern stability have not yet been fully clarified. In China, salt rock formations are mostly thin-bedded and interlayered, with geological conditions far more complex than those of salt domes [26,27,28]. Therefore, the aforementioned studies cannot be fully applied to the construction of salt cavern gas storage in bedded salt formations. Investigating the impacts of cavern height-to-diameter ratio, burial depth, and individual interlayer position on cavern stability in bedded salt is of great significance for guiding the construction of underground salt cavern gas storage facilities under such geological conditions.
This study uses FLAC3D 5.0 software to analyze the stability of a typical vertical pear-shaped gas storage cavern during both the water-soluble solution mining and long-term operation phases. It explores the influence of different height-to-diameter ratios, burial depths, and interlayer positions on the stability of the surrounding rock by comparing the surrounding rock stress, plastic zone, maximum displacement, and cavity volume shrinkage, in order to determine the effects of these variables on cavern stability.
2. Materials and Methods
2.1. Geological Overview
The study area selected in this paper is the salt rock deposition area in the Zhixi Bridge depression on the western side of Jintan City, China (Figure 2). The salt rock in this region is relatively stable both laterally and longitudinally, with the long axis measuring about 12 km and the short axis about 6 km, extending in a northeast direction. The overall thickness ranges from 67.8 to 230.95 m. The central part of the salt rock layer, with a thickness greater than 180 m, covers an area of approximately 12 km2, making it an ideal location for the construction of SCGS. The main salt rock layer in this area is buried at a depth of about 800 to 1200 m, with a few thin interlayers. The thickness of individual interlayers is generally less than 0.11 m, and only in some areas are there interlayers as thick as 4 m, with an average thickness of 1.5 m. The lithology consists of calcium-bearing glauberite mudstone, mudstone, and salt-bearing mudstone.
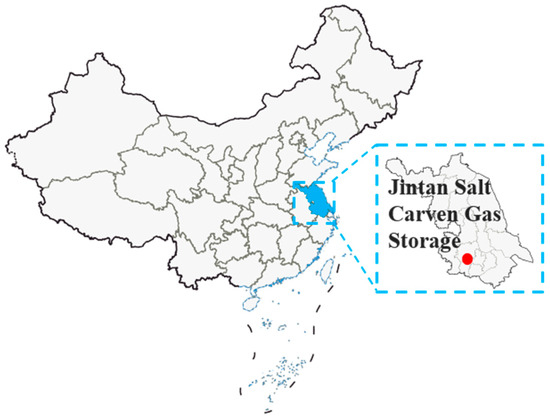
Figure 2.
Schematic Diagram of the Jintan Salt Mine.
2.2. Model and Boundary Conditions
Based on the geological data from the Jintan area in Jiangsu, a proposed underground SCGS is located within a 200 m thick salt rock layer, with 150 m of mudstone as the cap rock and base rock. A quarter of the numerical simulation model is established as shown in Figure 3. The model has a length and width of 400 m, and the solution mining area is divided into 9 sections from bottom to top, mined layer by layer. The overlying rock layer load is simplified as a uniform load applied to the top surface of the model, while normal displacement constraints are applied to the other surfaces.
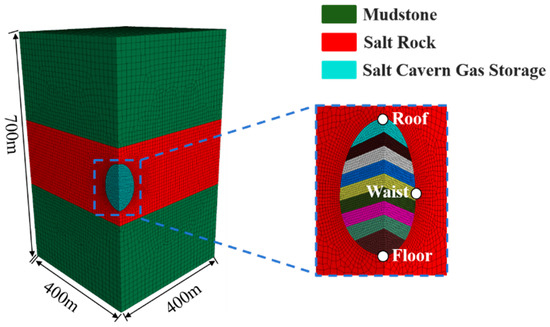
Figure 3.
Model Diagram (The different colored zones within the salt cavern gas storage section in the dashed box on the right represent different extraction layers).
2.3. Simulation Process
Based on the experimental conditions described above, the Mohr-Coulomb constitutive model is selected for geostress equilibrium, and the layered solution mining process is simulated using the built-in null element in FLAC3D. After fresh water is injected to dissolve the salt rock, normal stress is applied to the cavern walls to simulate the brine pressure during the solution mining process. After the solution mining is completed, the plastic zone and displacement generated by the surrounding rock during the solution mining are removed, and the simulation begins to study the impact of the rheological effects of the salt rock on the stability of the surrounding rock under operational loading. Based on this simulation process, the influence of different burial depths, height-to-diameter ratios, and interlayer positions on the stability of the surrounding rock is investigated.
2.4. Constitutive Model and Parameter Selection
The solution mining process typically lasts for 2 to 3 years, with the dissolution time for each layer of the cavern being even shorter. Therefore, a static analysis is used to assess the stability of the surrounding rock during the solution mining phase. The plastic zone during the solution mining process are controlled by the Mohr-Coulomb criterion. The Mohr–Coulomb criterion can clearly indicate whether instability, collapse, or interlayer sliding will occur after dissolution [29].The expression for the Mohr-Coulomb criterion is as follows:
where σ1 and σ3 represent the first and third principal normal stresses, MPa; c represents the cohesion, MPa; and φ represents the internal friction angle, °.
The directions of σ1 and σ3 correspond to the principal stress directions rather than the directions of the x, y, z axes in a general coordinate system. This is inconsistent with the stress directions shown in the subsequent figure. It should be noted that the sign convention for stresses in the Mohr-Coulomb criterion is opposite to the stress sign convention used in FLAC3D.
FLAC3D includes various creep constitutive models, and this study selects the built-in Power constitutive model in FLAC3D for creep calculations. The model provides a good fit for the steady-state creep behavior of a salt cavern gas storage facility over extended operational periods [30]. The standard exponential form of its equation is shown in Equation (2):
where cr is the creep rate, 1/day; A, n represent the rheological parameters of the rock; represents the Von Mises stress, MPa.
Zhang et al. [19] conducted a series of experiments on salt rock from the Jintan area to measure its mechanical parameters, which were subsequently used in numerical simulation studies. This study adopts the experimental parameters from Zhang et al., and compares the simulation results with their experimental findings. The results show a good agreement between the simulation outcomes and the reference data, indicating that the model can be reliably applied to analyze the surrounding rock stability of salt cavern gas storage during both cavity construction and operational phases. Relevant parameters are listed in Table 1.

Table 1.
Mechanical Parameters of Surrounding Rock [19].
2.5. Operation Condition Design
This study considers the impact of factors such as cavern shape, cavern burial depth, and interlayer position on the stability of salt solution mining and long-term operation. A total of 11 numerical simulation conditions are designed (Table 2). The cavern shape is controlled by adjusting the maximum diameter while maintaining a constant cavern height, and the interlayer thickness is set to the average thickness of the selected region, which is 2.5 m. Considering that the freshwater injection pressure of 3.5 MPa. All the calculation conditions are shown in Table 1, where the overburden load and brine pressure vary with the depth of the strata. The internal pressure under each condition is the brine pressure minus the injection pressure, and the operational time is set to 50 years.

Table 2.
Operation Condition Design.
3. Result
There is currently no unified standard for the stability evaluation of salt cavern gas storage. Commonly used evaluation indicators include the volume of the plastic zone, surrounding rock deformation, and cavern shrinkage rate. This paper will employ four indicators—cavern plastic zone volume, surrounding rock stress, surrounding rock deformation, and cavern shrinkage rate—to assess cavern stability. Generally, the surrounding rock deformation should not exceed 10% of the maximum cavern diameter, and the annual cavern shrinkage rate should not exceed 1% [18].
3.1. Impact of Different Height-to-Diameter Ratios on Surrounding Rock Stability
- (1)
- Surrounding Rock Stress
Figure 4 shows the stress distribution contour map of the surrounding rock after solution mining. It can be seen that during the solution mining phase, the surrounding rock around the cavern is primarily under compressive stress. When the height-to-diameter ratio is 1.2, the region with smaller stress in the x-direction is mainly concentrated at the waist of the cavern, with the stress magnitude around 0.5 MPa. The region with larger stress in the z-direction is also concentrated at the waist of the cavern, with a stress magnitude of 35 MPa. When the height-to-diameter ratio is 2.2, the x-direction stress at the cavern waist is 0.4 MPa, while the z-direction stress decreases to 35.5 MPa. As the height-to-diameter ratio increases, the x-direction stress decreases by 0.1 MPa, and the z-direction stress increases by 0.5 MPa, resulting in a more uniform stress distribution in the surrounding rock. Additionally, as the height-to-diameter ratio increases, the area with higher z-direction stress at the waist of the cavern becomes progressively smaller.
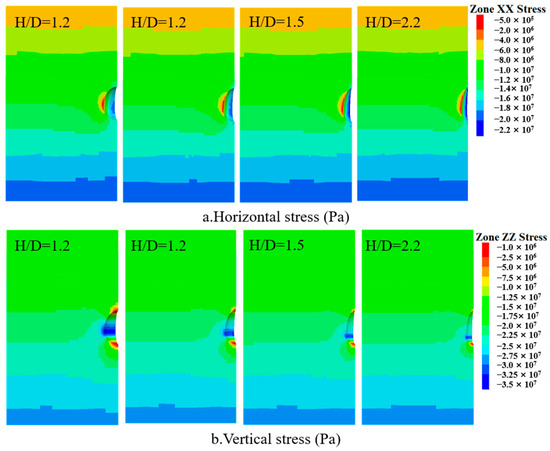
Figure 4.
Surrounding rock stress during solution mining phase under different height−to−diameter ratios.
After 50 years of operation (Figure 5), the x-direction and z-direction stresses in the cavern remain compressive. The region with smaller x-direction stress is primarily concentrated at the waist of the cavern, with the stress magnitude around 4 MPa. The region with larger z-direction stress is mainly concentrated at the waist, with a stress magnitude of about 17 MPa. When the height-to-diameter ratio is 2.2, the area with smaller x-direction stress increases and becomes more concentrated on the inner wall of the cavern, with the stress magnitude at 2.7 MPa. The region with higher z-direction stress expands, and the overall distribution becomes more uniform, with the z-direction stress at the waist of the cavern reaching 22 MPa. Overall, as the height-to-diameter ratio increases, the x-direction stress gradually decreases, the z-direction stress gradually increases, and the surrounding rock stress distribution in the cavern becomes more uniform.

Figure 5.
Surrounding rock stress during the operation phase under different height-to-diameter ratios.
- (2)
- Surrounding Rock Plastic Zone
Figure 6a shows the distribution of the surrounding rock plastic zone during the solution mining phase for different height-to-diameter ratios. The plastic zone is primarily located on the inner surface of the cavern, and as the height-to-diameter ratio increases, the area of the surrounding rock plastic zone significantly decreases. The largest plastic zone area occurs for the cavern with a height-to-diameter ratio of 1.2, with the plastic zone mainly distributed at the bottom and waist of the cavern. When the height-to-diameter ratio reaches 2.2, the plastic zone appears only at the bottom of the cavern.
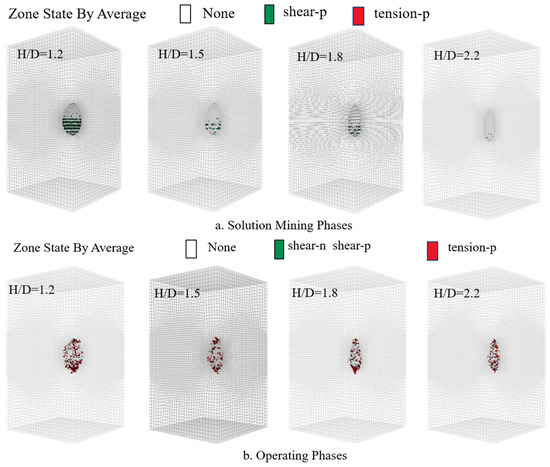
Figure 6.
Plastic zone of surrounding rock during operation under different height-to-diameter ratios.
Figure 6b shows the distribution of the surrounding rock plastic zone after 50 years of operation for different height-to-diameter ratios. The distribution of the plastic zone during operation differs from that during solution mining. During operation, the plastic zone is mainly distributed inside the surrounding rock, with fewer plastic zones on the cavern surface. In the operation phase, the plastic zone is primarily concentrated in the regions at the top and bottom of the cavern, with the plastic zone area at the waist being relatively sparse. It is noteworthy that as the height-to-diameter ratio increases, the ratio of the plastic zone volume to the cavern volume also increases.
- (3)
- Surrounding rock displacement
From Figure 7, it can be observed that under different height-to-diameter ratios, the displacement distribution patterns of caverns with different shapes are similar: displacement gradually decreases from the excavation surface to the surrounding rock. The left side of the cavern waist shifts rightward, while the right side shifts leftward, showing an overall outward expansion trend in the x-direction. In the y-direction, the surrounding rock at the cavern roof settles downward, while the surrounding rock at the cavern floor uplifts upward, showing an overall contraction trend toward the center. From Figure 9, it can be seen that the displacement at the cavern waist is 0.048 m for a cavern with a height-to-diameter ratio of 1.2, and 0.04 m for a cavern with a ratio of 2.2, decreased by 0.08 m. For the cavern with a ratio of 1.2, the displacement at the cavern roof is 0.10 m and at the cavern floor is 0.11 m, while for the cavern with a height-to-diameter ratio of 2.2, the displacement at the cavern roof is 0.03 m, representing an increase of 0.01 m, while the displacement at the cavern floor is 0.06 m, representing an increase of 0.03 m.
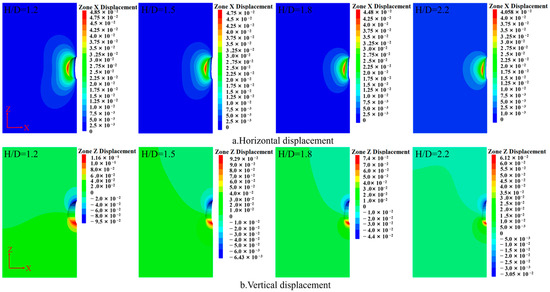
Figure 7.
Displacement of surrounding rock during the solution mining phase under different height-to-diameter ratios.
The displacement trend of the surrounding rock during the operation phase is similar to that during the solution mining phase, but due to the longer operational time, the displacement is much larger during the operation phase. During the operation phase, the displacement of the surrounding rock gradually decreases from the walls toward the outer regions, with the maximum displacement occurring at the cavern waist (Figure 8). From Figure 9, it can be seen that for a height-to-diameter ratio of 1.8, the displacement at the cavern waist is 3.09 m, and when the height-to-diameter ratio increases to 2.2, the displacement at the waist reduces to 2.09 m, decreased by 1 m. The same trend is observed at the cavern roof and floor. For a height-to-diameter ratio of 1.2, the displacement at the roof is 2.88 m and at the floor is 2.55 m. As the height-to-diameter ratio increases, for a ratio of 2.2, the displacement at the roof decreases to 1.55 m and at the floor to 1.11 m, showing a decreasing trend with increasing height-to-diameter ratio, decreased by 1.33 m and 1 m, respectively.
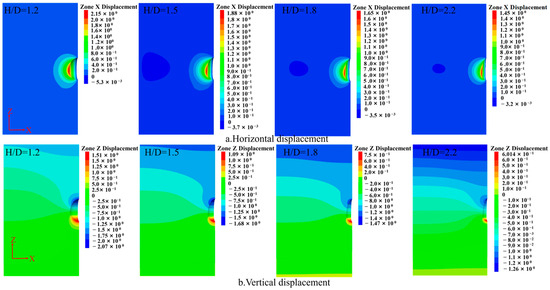
Figure 8.
Displacement of surrounding rock during the operation stage with different height-to-diameter ratios.
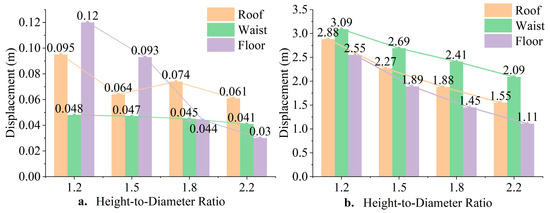
Figure 9.
(a) Surrounding rock displacement during the solution mining stage with different height-to-diameter ratios. (b) Surrounding rock displacement during the operation stage with different height-to-diameter ratios.
Figure 10 presents the change law of the volume shrinkage of SCGS with different height-to-diameter ratios. It can be observed that as the cavern operates, the volume shrinkage continues to increase. After 50 years of operation, only the cavern with a height-to-diameter ratio of 2.2 has a volume shrinkage exceeding 30%. As the height-to-diameter ratio increases from 1.2 to 2.2, the cavern volume shrinkage increases from 29.17% to 30.19%, showing an increase of 1.02%. The cavern volume shrinkage increases as the height-to-diameter ratio increases.
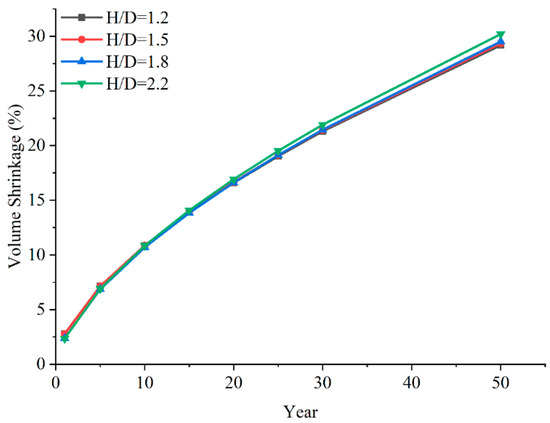
Figure 10.
Relation between volume shrinkage and operating time of SCGS with different height-to-diameter ratios.
3.2. Analysis of Surrounding Rock Stability at Different Burial Depths
- (1)
- Surrounding Rock Stress
In the solution mining phase, the surrounding rock stress distribution in underground SCGS is similar at different burial depths (Figure 11). The x-direction stress is primarily concentrated at the cavern roof and floor, with the smallest stress at the cavern waist. The maximum z-direction stress is located at the cavern waist and gradually decreases toward the roof and floor. At a burial depth of 500 m, the x-direction stress at the cavern waist is 0.5 MPa, and the z-direction stress is 18 MPa. At a burial depth of 1500 m, the x-direction stress at the cavern waist is 1.5 MPa, and the z-direction stress is 49 MPa, the x-direction stress increased by 1 MPa and the z-direction stress by 31 MPa, at the cavern waist. At the cavern roof and floor, at a burial depth of 500 m, the x-direction stress is 7 MPa and the z-direction stress is 1.67 MPa. At a burial depth of 1500 m, the z-direction stress is 2.6 MPa and the x-direction stress is 17 MPa, also increasing with burial depth. The x-direction and z-direction stresses increased by 10 MPa and approximately 1 MPa, respectively.
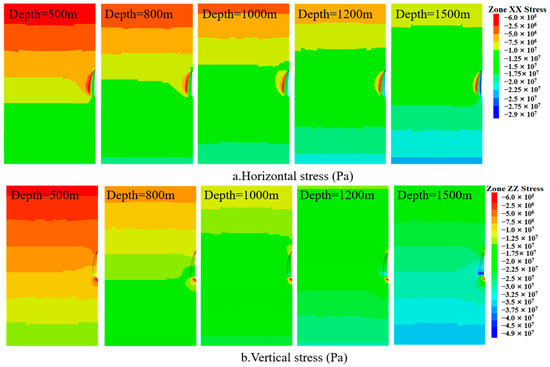
Figure 11.
Surrounding rock stress during the solution mining phase under different burial depth.
During the operation phase, the surrounding rock stress distribution of caverns at different burial depths is essentially the same. Similarly, as the burial depth of the cavern increases, the stress in all directions of the surrounding rock also increases (Figure 12). At the cavern waist, the x-direction stress is 2 MPa at a burial depth of 500 m and 2.7 MPa at a burial depth of 1500 m, increased by 0.7 MPa. At the cavern roof and floor, the z-direction stress is 3.33 MPa at a burial depth of 500 m and 7.23 MPa at a burial depth of 1500 m, increased by 4 MPa.
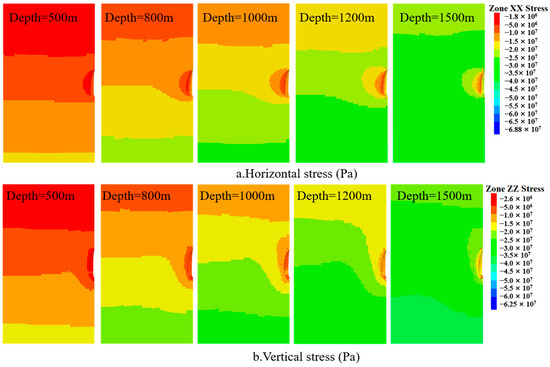
Figure 12.
Surrounding rock stress during the operation phase under different burial depth.
- (2)
- Surrounding Rock Plastic Zone
Figure 13a shows the distribution of the surrounding rock plastic zone during the solution mining phase at different burial depths. During the solution mining phase, the surrounding rock plastic zone is only located on the cavern surface, and there is no significant change in the plastic zone as the burial depth increases. When the burial depth is 500 m and 800 m, the plastic zone of the surrounding rock is consistent. However, when the burial depth reaches 1500 m, the plastic zone appears at the cavern waist, and the plastic zone area increases. The extent of the plastic zone increases as the burial depth increases.
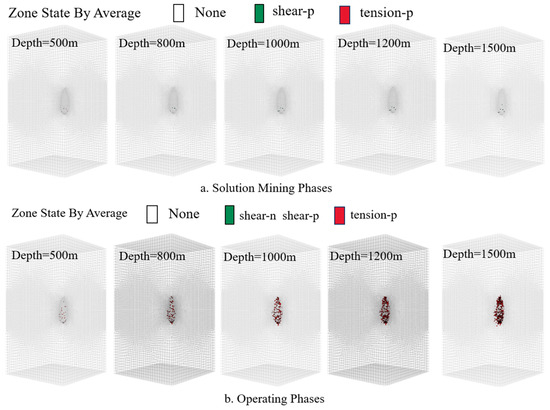
Figure 13.
Plastic zone of surrounding rock during operation under different burial depth.
During the operation phase, the impact of burial depth on the surrounding rock plastic zone becomes more evident. As shown in Figure 13b, as the burial depth increases, the volume of the plastic zone also increases. At a burial depth of 500 m, only a small plastic damage area exists on the cavern surface. As the burial depth increases, the area of the plastic zone also increases. When the burial depth reaches 1500 m, the plastic zone is distributed throughout the entire surrounding rock of the cavern.
- (3)
- Surrounding rock displacement
The surrounding rock displacement at different burial depths is shown in Figure 14a. During the solution mining phase, the displacement trend of the surrounding rock at different burial depths does not change significantly. It is noteworthy that at a burial depth of 500 m, the maximum displacement occurs at the cavern waist. When the burial depth exceeds 500 m, the maximum displacement occurs at the cavern roof and floor. From Figure 15, it can be seen that at a burial depth of 500 m, the maximum displacement at the cavern waist is 0.03 m, while the maximum displacements at the cavern roof and floor are 0.01 m and 0.03 m, respectively. When the burial depth is 1500 m, the displacement at the cavern waist is 0.05 m, and the displacements at the roof and floor are 0.05 m and 0.09 m, respectively. All displacements increase as the burial depth increases.
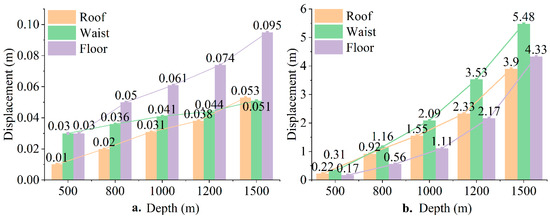
Figure 14.
(a) Surrounding rock displacement during the solution mining stage with different burial depth. (b) Surrounding rock displacement during the operation stage with different burial depth.
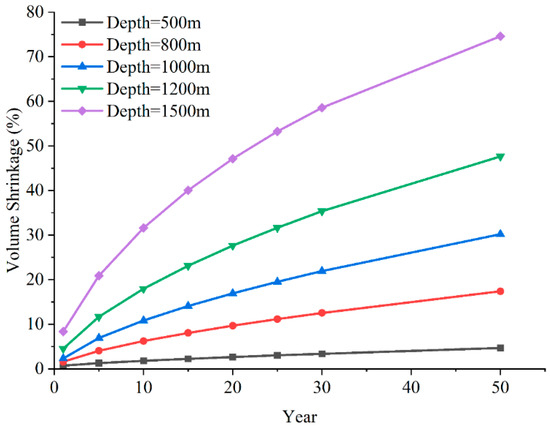
Figure 15.
Relation between volume shrinkage and operating time of SCGS with different burial depth.
After 50 years of operation, the cavern displacement is shown in Figure 14b. As the burial depth increases, the range of surrounding rock displacement also gradually increases. At a burial depth of 500 m, the surrounding rock displacement is primarily located at the cavern surface, with a roof displacement of 0.22 m, waist displacement of 0.31 m, and floor displacement of 0.17 m. When the burial depth reaches 1500 m, the displacement range significantly expands from the cavern surface. The displacement at the roof is 3.90 m, at the waist is 6.48 m, and at the floor is 4.33 m.
Figure 15 shows the variation in cavern volume shrinkage with time at different burial depths. As seen in the figure, as the burial depth of the cavern increases, the volume shrinkage also increases. After 30 years of operation, the cavern volume shrinkages for burial depths of 1200 m and 1500 m exceed 30%. When the burial depth is 500 m, the cavern volume shrinkage after 50 years of operation is only 4.6%. However, when the burial depth increases to 1500 m, the cavern volume shrinkage increases to 74.59%.
3.3. Analysis of the Influence of Different Interlayer Positions on Surrounding Rock Stability
- (1)
- Surrounding Rock Stress
Compared to caverns without interlayers, the surrounding rock stress of caverns with interlayers increases. As shown in Figure 16, for a cavern without interlayer influence, the minimum x-direction stress is concentrated at the cavern waist, with a stress magnitude of about 0.8 MPa. The maximum z-direction stress is also concentrated at the cavern waist, with a stress magnitude of about 32 MPa. For caverns with interlayers, after solution mining, the x-direction stress distribution becomes more uniform, with the smaller stress still concentrated at the cavern waist, but the stress magnitude increases to about 4 MPa. The larger z-direction stress is still concentrated at the cavern waist, with a value of approximately 29 MPa.
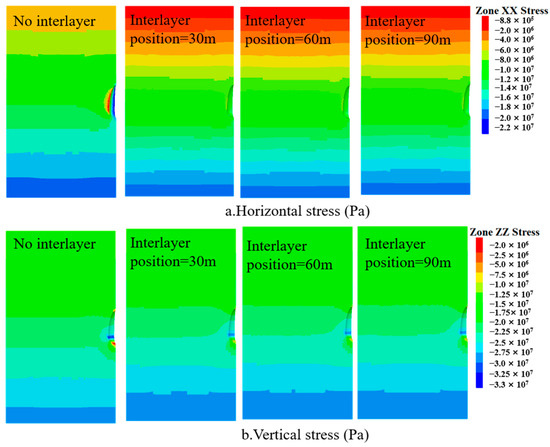
Figure 16.
Surrounding rock stress during the solution mining phase under different interlayer positions.
After considering the influence of interlayers, it can be clearly observed from the figure that there is a significant stress concentration in the x-direction at the location of the interlayer (Figure 17). The closer the interlayer is to the cavern surface, the more pronounced the stress concentration effect. In the z-direction, the closer the interlayer is to the cavern surface, the more significant the stress concentration effect. After 50 years of operation, the transverse stress at the interlayer decreases significantly under the influence of the interlayer. When the interlayer is located at 30 m and 60 m, clear tensile stress appears at the interlayer. When the interlayer height is 90 m, although no tensile stress occurs at the interlayer, the stress at the interlayer is significantly reduced. In the vertical direction, the stress at the interlayer is greater than the original rock stress, with the maximum stress occurring at the interlayer. As the distance from the interlayer increases, the stress gradually returns to the original rock stress on both the upper and lower sides.
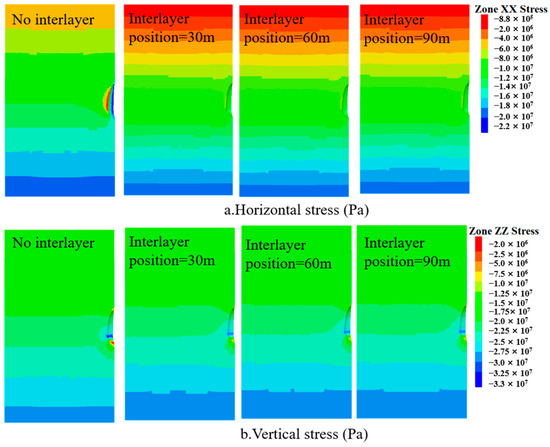
Figure 17.
Surrounding rock stress during the operation phase under different interlayer positions.
- (2)
- Surrounding Rock Plastic Zone
Figure 18a shows the relationship between the volume of the surrounding rock plastic zone and the interlayer position during the solution mining phase. It can be seen from the figure that the volume of the plastic zone in the surrounding rock of the cavern is significantly reduced under the influence of the interlayer, compared to caverns without interlayer influence. The effect of the interlayer position on the cavern surrounding rock plastic zone differs. When the interlayer is located at 30 m, the plastic zone area of the surrounding rock is the smallest.
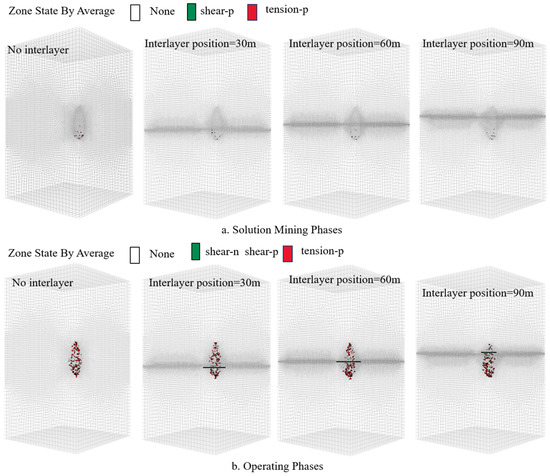
Figure 18.
Plastic zone of surrounding rock during operation under different interlayer positions.
Figure 18b shows the distribution of the plastic zone after 50 years of operation under the influence of the interlayer. It is clear from the figure that after 50 years of operation, shear damage originating from the cavern surface expands outward at the interlayer location, and the plastic zone volume of the salt rock on both sides of the interlayer decreases. Notably, when the interlayer is located 30 m from the cavern floor, the surrounding rock plastic zone volume is the smallest. When the interlayer is located 90 m from the cavern floor, the plastic zone volume of the cavern surrounding rock is the largest. The largest extent of interlayer damage occurs when the interlayer is located 60 m from the cavern floor.
- (3)
- Surrounding rock displacement
During the solution mining phase, the presence of the interlayer has minimal impact on the surrounding rock displacement. In the x-direction, the surrounding rock experiences lateral contraction due to the interlayer, with the smallest lateral displacement occurring at the cavern waist when the interlayer is located at 60 m. In the z-direction, the interlayer has the greatest effect on the vertical displacement when it is located at 90 m. In this case, the displacement at the cavern roof decreases, while the displacement at the cavern floor increases. When the interlayer is located at 60 m, its effect on vertical displacement is minimal.
During the operation phase, the presence of the interlayer significantly reduces the lateral displacement at the interlayer location. Without the influence of the interlayer, the maximum lateral displacement of the surrounding rock is 2.08 m (Figure 19). Under the influence of the interlayer, the lateral displacements are 1.85 m, 1.88 m, and 1.99 m, with the maximum impact occurring when the interlayer is located at 30 m. In the vertical direction, without the influence of the interlayer, the displacement at the cavern roof and floor are 1.55 m and 1.11 m, respectively. Under the influence of the interlayer, the displacements are 1.52 m, 1.05 m, 1.52 m, 1.11 m, 1.47 m, and 1.11 m, respectively. The greatest impact on the surrounding rock occurs when the interlayer is located at 30 m.
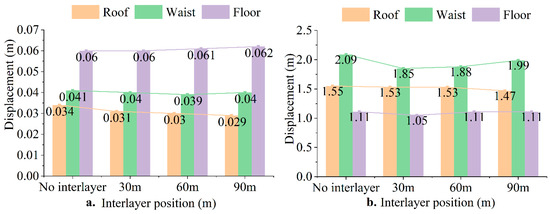
Figure 19.
(a) Surrounding rock displacement during the solution mining stage with different interlayer positions. (b) Surrounding rock displacement during the operation stage with different interlayer positions.
Figure 20 shows the variation in cavern volume shrinkage with time under the influence of different interlayer positions. It can be seen that the cavern volume shrinkage is significantly reduced due to the presence of the interlayer. Without the interlayer, the cavern volume shrinkage is 30.20%. When the interlayer is present, the cavern volume shrinkages are 27.59%, 27.22%, and 27.97%, respectively. This indicates that the presence of the interlayer has a significant impact on the cavern volume shrinkage, with the most notable reduction in contraction occurring when the interlayer is located at 60 m.
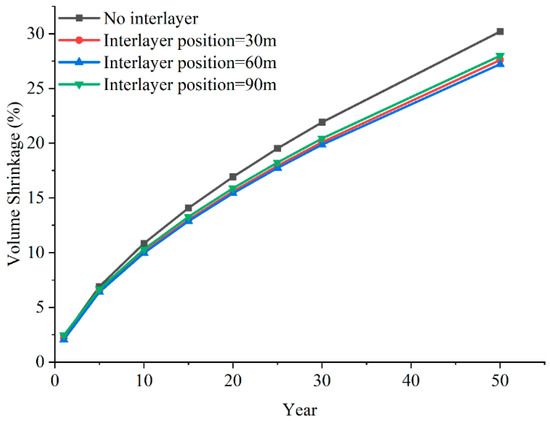
Figure 20.
Relation between volume shrinkage and operating time of SCGS with different interlayer positions.
4. Discussion
The cavern’s height-to-diameter ratio has a significant impact on the surrounding rock stability during both the solution mining and operation phases. As the height-to-diameter ratio increases, both the displacement of the surrounding rock and the stresses at the cavern roof and floor increase, while the stresses at the cavern waist decrease. Moreover, the relative area of the plastic zone in the surrounding rock also increases with the height-to-diameter ratio. This is because as the height-to-diameter ratio increases, the curvature of the cavern at the waist decreases, and the stress concentration factor reduces. As a result, both the lateral and vertical stresses at the cavern waist decrease, and the displacement at the waist also reduces. However, at the roof and floor, as the height-to-diameter ratio increases, the curvature also increases, leading to an increase in the stress concentration factor. This, in turn, increases the stress at the roof and floor, which enhances the resistance to the gravitational effect at the cavern top and the unloading effect at the cavern bottom. The overall stiffness of the cavern increases, which reduces the displacement at the roof and floor. Additionally, regardless of the cavern shape, during the solution mining phase, the maximum z-direction stress always occurs at the intersection of the semicircular and semi-elliptical sections. This is the point of maximum curvature in the entire cavern, where the stress concentration factor is the highest. Therefore, it is evident that the stability of the surrounding rock is influenced by the curvature of the cavern.
During the solution mining and operational phases of a salt cavern gas storage facility, as the burial depth increases, the displacement, stress, and plastic zone range of the cavern also increase. During the solution mining phase, the maximum displacement of a cavern at a burial depth of 1500 m is 84.6% larger than that of a cavern at a burial depth of 500 m. This value increases to 332.5% during the operational phase. This is because, with increasing burial depth, the in situ stress of the surrounding rock also rises, leading to more pronounced stress redistribution after cavern excavation. As a result, the plastic zone and displacement of the surrounding rock significantly increase. Additionally, with higher in situ stress, the stress concentration effect becomes more evident at locations with larger curvature in the surrounding rock. The stress concentration factor at these high-curvature areas increases noticeably, further contributing to the growth of displacement and the plastic zone in the surrounding rock. Moreover, salt rock exhibits significant creep behavior. As operational time extends, the influence of burial depth on the surrounding rock becomes more pronounced. Therefore, selecting an appropriate burial depth during the construction of the gas storage facility is a critical factor for ensuring its safe operation.
Under the influence of interlayers, the lateral displacement of the surrounding rock is significantly reduced during both the solution mining and operation phases. The effect of interlayers on constraining lateral displacement is most pronounced at the cavern waist. Additionally, because the mechanical properties of the interlayer are superior to those of salt rock, the interlayer also exerts a constraint on vertical displacements at the cavern roof and floor. The differences in the creep rate and mechanical properties between the interlayer and salt rock result in significant stress concentration at the interlayer, which causes the plastic zone at the interlayer to be larger than that in the original salt rock. The presence of the interlayer reduces the displacement, volume shrinkage, and plastic zone of the cavern’s surrounding rock. The maximum curvature of the surrounding rock occurs at a distance of 30 m from the cavern floor, which is why the largest deformations often appear in this area. Consequently, interlayers located at the 30 m depth can more effectively constrain deformation and plastic failure of the surrounding rock. Therefore, from the perspective of surrounding rock stability, the presence of interlayers is beneficial for cavern stability. Additionally, the position of interlayers has a significant impact on the curvature-varying surrounding rock. Therefore, during the solution mining process, increasing the curvature of the cavern wall in areas with abundant interlayers can enhance the overall stability of the cavern.
It should be noted that in this study, the numerical simulations assumed a service life of 50 years for the salt cavern, without considering potential seismic loading. Due to the viscoplastic characteristics and self-healing properties of salt rock, short-term seismic effects are generally unlikely to cause permanent damage. However, in strong earthquake zones, they may still adversely affect the stability of the storage facility. Therefore, future research could build upon this study by incorporating dynamic analysis to provide a more comprehensive assessment of the long-term stability of salt cavern gas storage.
5. Conclusions
This study employed numerical simulation to investigate the surrounding rock stability during the solution mining and subsequent operation phases of caverns with different aspect ratios, burial depths, and interlayer positions. The study provides insights into how different cavern shapes, burial depths, and interlayer positions affect the stability of the surrounding rock. The main conclusions are as follows:
- (1)
- With an increase in the height-to-diameter ratio, the curvature at the cavern waist decreases, while the curvature at the cavern roof and floor increases, resulting in a more uniform stress distribution in the surrounding rock of the cavern. The displacement of the surrounding rock, the area of the plastic zone, and the cavern shrinkage rate all decrease as the height-to-diameter ratio increases. However, the density of the plastic zone in the surrounding rock increases with the height-to-diameter ratio. This indicates that either excessively large or small height-to-diameter ratios are detrimental to cavern stability, and the ratio should be maintained within the range of 1.2 to 1.5.
- (2)
- For caverns with the same height-to-diameter ratio, as the burial depth increases, the maximum displacement, plastic zone area, and cavern volume shrinkage of the surrounding rock all increase. Moreover, when the burial depth exceeds 1000 m, the growth rate of these indicators significantly increases. Therefore, from the perspective of surrounding rock stability, the burial depth of caverns should not be too great. For salt cavern gas storage facilities with a minimum operating pressure of about 40% of the formation pressure, an optimal burial depth is between 800 m and 1000 m.
- (3)
- Caverns with interlayers exhibit a lower shrinkage rate, enhanced resistance to surrounding rock deformation, and a reduced volume of the plastic zone, thereby improving overall stability. Furthermore, interlayers located in areas of higher curvature demonstrate a more pronounced restraining effect on surrounding rock displacement, while conversely, they are more effective in restraining the cavern shrinkage rate. Therefore, from the perspective of overall surrounding rock stability, the interlayer at the 60 m depth in a pear-shaped cavern (where curvature is minimal) contributes most favorably to overall stability.
Author Contributions
Conceptualization, X.Y. and Y.Q.; methodology, X.Y. and Y.Q.; software, X.Y. and Z.H.; validation, X.Y.; formal analysis, X.Y.; investigation, X.Y., Y.Q., S.L., J.Q., Z.H., Y.G., S.F. and N.X.; Resources, S.L., Y.Q. and N.X.; data curation, S.L. and X.Y.; writing—original draft preparation, X.Y. and S.L.; writing—review and editing, X.Y., Y.Q. and S.L.; visualization, X.Y. and Y.Q.; supervision, Y.Q., N.X., S.L., S.F. and J.Q.; project administration, Y.Q., N.X., S.L., J.Q. and S.F.; funding acquisition, Y.Q. All authors have read and agreed to the published version of the manuscript.
Funding
This research was funded by the National Key R&D Program of China, grant number 2023YFB4005500.
Institutional Review Board Statement
Not applicable.
Informed Consent Statement
Not applicable.
Data Availability Statement
Data are contained within the article. Data will be made available on request.
Acknowledgments
We sincerely thank the editors and all reviewers for their constructive and excellent reviews that helped improve the manuscript.
Conflicts of Interest
Author Shaopo Li was employed by the company Research Institute of Technology, Shougang Group Co. Ltd. The remaining authors declare that the research was conducted in the absence of any commercial or financial relationships that could be construed as a potential conflict of interest.
References
- Bai, W.; Shi, X.; Zhu, S.; Wei, X.; Huang, Y. Opportunities and Challenges of Large-Scale Salt Cavern Hydrogen Storage in China Coupled with Renewable Energy Sources. Clean Energy 2025, 9, 179–196. [Google Scholar] [CrossRef]
- Li, H.; Ma, H.; Zhang, H.; Shi, X. A New Evaluation System for Feasibility and Stability Analyses of Ultra-Large Salt Caverns Gas Storage. Rock Mech. Rock Eng. 2024, 57, 3091–3107. [Google Scholar] [CrossRef]
- Ma, X.; Xu, Z.; Chen, L.; Shi, X. Creep Deformation Analysis of Gas Storage in Salt Caverns. Int. J. Rock Mech. Min. Sci. 2021, 139, 104635. [Google Scholar] [CrossRef]
- Mohanty, S.; Vandergrift, T. Long Term Stability Evaluation of an Old Underground Gas Storage Cavern Using Unique Numerical Methods. Tunn. Undergr. Space Technol. 2012, 30, 145–154. [Google Scholar] [CrossRef]
- Yang, C.; Wang, T.; Chen, H. Theoretical and Technological Challenges of Deep Underground Energy Storage in China. Engineering 2023, 25, 168–181. [Google Scholar] [CrossRef]
- Ma, L.; Wang, Y.; Wang, M.; Xue, B.; Duan, L. Mechanical Properties of Rock Salt under Combined Creep and Fatigue. Int. J. Rock Mech. Min. Sci. 2021, 141, 104654. [Google Scholar] [CrossRef]
- Taheri, S.R.; Pak, A.; Shad, S.; Mehrgini, B.; Razifar, M. Investigation of Rock Salt Layer Creep and Its Effects on Casing Collapse. Int. J. Min. Sci. Technol. 2020, 30, 357–365. [Google Scholar] [CrossRef]
- Wang, T.T.; Ma, H.L.; Shi, X.L.; Yang, C.H.; Zhang, N.; Li, J.L.; Ding, S.L.; Daemen, J.J.K. Salt Cavern Gas Storage in an Ultra-Deep Formation in Hubei, China. Int. J. Rock Mech. Min. Sci. 2018, 102, 57–70. [Google Scholar] [CrossRef]
- Zhang, M.; Yang, Q. Stability Analysis of Storage Caverns in Bedded Salt Rock Formation. Appl. Mech. Mater. 2013, 353–356, 1345–1352. [Google Scholar] [CrossRef]
- Ge, X.; Li, Y.; Shi, X.; Chen, X.; Ma, H.; Yang, C.; Shu, C.; Liu, Y. Experimental Device for the Study of Liquid–Solid Coupled Flutter Instability of Salt Cavern Leaching Tubing. J. Nat. Gas Sci. Eng. 2019, 66, 168–179. [Google Scholar] [CrossRef]
- Ge, X.; Li, Y.; Shi, X.; Ma, H.; Wang, K.; Yin, H. Dynamics and Enhanced Stability Properties of Slender Leaching Tubings in Salt Cavern Storage with a Y-Type Manifold Fitted at Free Downstream End. J. Energy Storage 2021, 43, 103–170. [Google Scholar] [CrossRef]
- Weiguo, L.; Yangsheng, Z. Analysis on mechanism of salt deposit solution mining. J. Taiyuan Univ. Technol. 2002, 33, 234–237. [Google Scholar]
- Wang, J.; Wang, Z.; Zeng, Q.; Ding, G.; Li, K.; Wanyan, Q.; Wang, Y. Simulation of Flow Field of Solution Mining Salt Cavities for Underground Gas Storage. J. Energy Resour. Technol. 2022, 145, 022001. [Google Scholar] [CrossRef]
- Zhao, Z.; Li, T.; Ma, Q.; Shang, J.; Du, J.; He, R. Failure Characteristics Analysis of the Inclined Interlayer during Water-soluble Cavity Construction of Underground Salt Caverns for Large-scale Energy Storage. Deep Undergr. Sci. Eng. 2025; early access. [Google Scholar]
- Ge, X.; Li, Y.; Li, J.; Shi, X.; Ma, H. Falling behavior and application of interlayer-collapse-formed blocks during solution mining in salt cavern storages. China J. Rock Mech. Eng. 2023, 42, 918–929. [Google Scholar]
- Ren, S.; Tao, Z.; He, M.; Pang, S.; Li, M.; Xu, H. Stability analysis of open-pit gold mine slopes and optimization of mining scheme in Inner Mongolia. China J. Mt. Sci. 2020, 17, 2997–3011. [Google Scholar] [CrossRef]
- Ge, X.; Huang, J.; Zhou, K.; Su, K.; Wang, W.; Li, Y.; Shi, X. Research of Interlayer Dip Angle Effect on Stability of Salt Cavern Energy and Carbon Storages in Bedded Salt Rock. Geoenergy Sci. Eng. 2024, 243, 213291. [Google Scholar] [CrossRef]
- Liu, W.; Jiang, D.; Chen, J.; Daemen, J.J.K.; Tang, K.; Wu, F. Comprehensive Feasibility Study of Two-Well-Horizontal Caverns for Natural Gas Storage in Thinly-Bedded Salt Rocks in China. Energy 2018, 143, 1006–1019. [Google Scholar] [CrossRef]
- Zhang, N.; Shi, X.; Wang, T.; Yang, C.; Liu, W.; Ma, H.; Daemen, J.J.K. Stability and Availability Evaluation of Underground Strategic Petroleum Reserve (SPR) Caverns in Bedded Rock Salt of Jintan, China. Energy 2017, 134, 504–514. [Google Scholar] [CrossRef]
- Zhang, X.; Liu, W.; Jiang, D.; Qiao, W.; Liu, E.; Zhang, N.; Fan, J. Investigation on the Influences of Interlayer Contents on Stability and Usability of Energy Storage Caverns in Bedded Rock Salt. Energy 2021, 231, 120968. [Google Scholar] [CrossRef]
- Peng, J.; Zhou, J.; Liang, G.; Peng, C.; Hu, C.; Guo, D. Investigation on the Long-Term Stability of Multiple Salt Caverns Underground Gas Storage With Interlayers. J. Energy Resour. Technol. 2023, 145, 081202. [Google Scholar] [CrossRef]
- Zhang, J.; Liu, X.; Jia, H.; Du, X.; Wang, Z.; Pan, G.; Zhang, M. Fitting of anisotropic strength parameters of laminated shale and its influence on wellbore instability. Geomech. Geophys. Geo-Energy Geo-Resour. 2025, 11, 43. [Google Scholar] [CrossRef]
- Liu, W.; Zhang, Z.; Fan, J.; Jiang, D.; Daemen, J.J.K. Research on the Stability and Treatments of Natural Gas Storage Caverns With Different Shapes in Bedded Salt Rocks. IEEE Access 2020, 8, 18995–19007. [Google Scholar] [CrossRef]
- Wang, T.; Ding, Z.; He, T.; Xie, D.; Liao, Y.; Chen, J.; Zhu, K. Stability of the Horizontal Salt Cavern Used for Different Energy Storage under Varying Geological Conditions. J. Energy Storage 2024, 84, 110817. [Google Scholar] [CrossRef]
- Mortazavi, A.; Nasab, H. Analysis of the Behavior of Large Underground Oil Storage Caverns in Salt Rock: Analysis of the Behavior of Large Underground Oil Storage Caverns. Int. J. Numer. Anal. Methods Geomech. 2017, 41, 602–624. [Google Scholar] [CrossRef]
- Liu, W.; Zhang, Z.; Chen, J.; Fan, J.; Jiang, D.; Jjk, D.; Li, Y. Physical Simulation of Construction and Control of Two Butted-Well Horizontal Cavern Energy Storage Using Large Molded Rock Salt Specimens. Energy 2019, 185, 682–694. [Google Scholar] [CrossRef]
- Peng, H.; Fan, J.; Zhang, X.; Chen, J.; Li, Z.; Jiang, D.; Liu, C. Computed Tomography Analysis on Cyclic Fatigue and Damage Properties of Rock Salt under Gas Pressure. Int. J. Fatigue 2020, 134, 105523. [Google Scholar] [CrossRef]
- Yang, J.; Li, H.; Yang, C.; Li, Y.; Wang, T.; Shi, X.; Han, Y. Physical Simulation of Flow Field and Construction Process of Horizontal Salt Cavern for Natural Gas Storage. J. Nat. Gas Sci. Eng. 2020, 82, 103527. [Google Scholar] [CrossRef]
- Ma, H.; Wei, X.; Shi, X.; Liang, X.; Bai, W.; Ge, L. Evaluation methods of salt pillar stability of salt cavern energy storage. Energies 2022, 15, 7570. [Google Scholar] [CrossRef]
- Ramesh Kumar, K.; Makhmutov, A.; Spiers, C.J.; Hajibeygi, H. Geomechanical simulation of energy storage in salt formations. J. Sci. Rep. 2021, 11, 19640. [Google Scholar] [CrossRef]
Disclaimer/Publisher’s Note: The statements, opinions and data contained in all publications are solely those of the individual author(s) and contributor(s) and not of MDPI and/or the editor(s). MDPI and/or the editor(s) disclaim responsibility for any injury to people or property resulting from any ideas, methods, instructions or products referred to in the content. |
© 2025 by the authors. Licensee MDPI, Basel, Switzerland. This article is an open access article distributed under the terms and conditions of the Creative Commons Attribution (CC BY) license (https://creativecommons.org/licenses/by/4.0/).