Abstract
The goal of this study is to analyze trends in clinical utilization of CT brain perfusion (CTP) across the past 10 years, during which there have been substantial changes in neuro-interventional and neuroimaging guidelines related to emergent stroke therapy, particularly intra-arterial mechanical thrombectomy. The Cosmos platform, a multi-institutional data aggregation tool containing health record data from billions of encounters, was used to retrospectively identify millions of patients with active clinical encounters during the study period (2015–2024). For each calendar quarter, numbers and proportions of active patients undergoing mechanical thrombectomy or brain CTP were obtained using billing code queries. CTP utilization per 100,000 active patients grew slowly from Q1-2015 to Q3-2017, ranging from 4.32 to 9.45, but beginning in Q4-2017, coinciding with the publication of landmark stroke trials, CTP utilization began to increase more rapidly, almost 4-fold higher as determined through segmented linear regression, reaching 61.24 per 100,000 in Q4-2024. Although causation cannot be proven in this study, the observed increases in CTP utilization likely reflect rapid adoption of evidence-based adjustments to stroke triage guidelines after eligibility for mechanical neurointervention had been widened to 24 h from symptom onset.
1. Introduction
Acute ischemic stroke (AIS) is a medical emergency caused by the sudden occlusion of cerebral blood vessels, leading to reduced blood flow and potential infarction of brain tissue [1]. It remains a major global health concern, representing the second leading cause of death worldwide and a leading contributor to long-term disability [2]. Given the narrow therapeutic window for effective intervention, rapid diagnosis and treatment are essential for optimizing outcomes.
Computed Tomography Perfusion (CTP) is an advanced neuroimaging technique that facilitates evaluation of blood flow during an acute ischemic stroke. CTP can allow for distinction between areas of the brain that are damaged beyond repair and areas that are salvageable. This distinction is key in assessing the benefit of interventions past the typical treatment window. CTP utilizes contrast dye and CT scanning to generate a comprehensive mapping of blood flow and volume [3]. This imaging modality has been effective in triaging acute ischemic stroke as well as various other neurological diseases.
Mechanical Thrombectomy (MT) is a minimally invasive endovascular procedure used to treat ischemic stroke caused by large vessel occlusions. Along with the guidance of real-time imaging, a catheter is maneuvered to the brain to remove a clot with the use of an aspiration device or a stent retriever. MT has proven to be effective in reducing long-term disability as well as improving functional outcomes. A 2023 meta-analysis reaffirmed the effectiveness of MT across various randomized trials, demonstrating improved survival and recovery without increased rates of serious complications [4].
The last few decades have been characterized by a push to advance management options for acute ischemic stroke, leading to the publication of a core group of studies in 2015 that supported the use of mechanical thrombectomy in addition to standard medical therapy for large-vessel, occlusive strokes of the anterior circulation [5]. These trials proved MT’s efficacy in stroke patients within a last known well (LKW) time of 6 h or less but did not clarify the utility in patients with late presentations. Two additional landmark trials, DAWN and Defuse-3, demonstrated the efficacy of MT for late-presenting stroke patients up to 24 h after their LKW time, granted that certain clinical and brain perfusion characteristics were satisfied [6,7]. These trials utilized advanced neuroimaging modalities, such as CT Perfusion, to characterize the ischemic core and penumbra sizes of infarcts. This work influenced the 2019 American Stroke Association updates to stroke guidelines, which recommended CTP or CT angiography (CTA) for identifying potential MT candidates [8]. With expanding indications for advanced neuroimaging and MT, it is important to identify both trends in utilization and access to these procedures, as well as the impact they have on the healthcare system.
Several studies have sought to characterize these trends in the utilization of CTP and MT, as well as patient access to these services. From 2016 to 2020, there has been a documented increase in both CTP and MT utilization at various comprehensive stroke centers throughout the country [9,10,11,12]. However, these retrospective studies included smaller patient cohorts (ranging from ~400 to 4000 patients) and were limited to single institutions comprising 1–3 hospitals. In addition, one study reported decreased MT utilization within a single-center facility for patients of lower income classes [13]. Other studies have established that CTP and MT are more readily accessible in urban, higher-income areas than those that are rural [14,15,16]. While these recent investigations have characterized trends in CTP utilization, MT utilization, and the related socioeconomic factors, few have utilized a multi-institutional, national-level database that captures a large subset of the U.S. population.
The purpose of this study was to investigate the utilization and socioeconomic trends of advanced neuroimaging and neuro-intervention following the landmark trials leading to the ASA 2019 guideline updates. Characterizing these trends at the national level may provide useful insights into the impacts of updated stroke management guidelines in the U.S. over time. We seek to characterize the trends in the utilization of CTP and MT in a national-level database that spans the time prior to and following the publication of DAWN and Defuse-3. Additionally, we seek to test the hypothesis that socioeconomic status (SES), financial class (FC), and geographic location impact the rate of CTP utilization and subsequent MT consideration.
2. Materials and Methods
In this HIPAA-compliant study, data for patient encounters were retrospectively obtained through the Cosmos platform (Epic Systems, Verona, WI, USA, https://userweb.epic.com (accessed on 22 August 2025)) from January 2015 through December 2024. This dataset was created in collaboration with a community of Epic health systems representing more than 300 million patient records from over 1748 hospitals and 40,700 clinics across multiple geographic regions (including all 50 U.S. states). As it is a HIPAA-limited dataset of aggregated de-duplicated data, it was deemed exempt under human subjects research guidelines. With a broad range of contributing organizations providing data on over billions of encounters, this platform provides a sample of patients that is sufficiently large to approximate trends within a large subset of the national U.S. population. The population of active patients was identified for each calendar quarter (ex: 1 January–31 March), where an active patient was defined as a patient who had undergone a medical encounter of any type within the given quarter. The number of active patients, rather than the number of patient encounters, was used in each calendar quarter, as patients could have had multiple encounters of the same type within a calendar quarter.
Patients who had undergone CTP or MT were identified in Cosmos by querying for each procedure’s associated billing code, which is standardized throughout the United States. The number of patients who underwent a procedure (CTP or MT) as a proportion of the active patient population was then calculated and reported for each calendar quarter. Notably, the billing code for MT was introduced in 2016 and thus, MT data was reported from 2016 to 2024. Similarly, the incidence of ischemic stroke was identified by querying for the diagnosis’ billing code, and this value was expressed as a proportion of the active patient population in each calendar quarter. Additionally, the percentage of CTPs and MTs performed per acute ischemic stroke diagnosis, based on ICD-10 codes in the I63 group, was reported.
To assess whether disparities exist with regard to socioeconomic status, insurance type (financial class), or rural–urban demographics during the first few years following the new stroke guidelines, we assessed these variables separately for the baseline quarters (prior to Q4 2017) and for the early post-event period consisting of the subsequent 4 years (through 2021). To quantify CTP and MT utilization across different SES classes, the total number of patients undergoing each procedure was calculated across all analyzed calendar quarters for the baseline (prior to Q4 2017) and for the subsequent period through 2021. SES was approximated using the Social Vulnerability Index (SVI) percentile ranking, which is derived from U.S. Centers for Disease Control census tract data linked to each patient’s most recent residential zip code. Because SVI reflects community-level characteristics rather than individual attributes, it was used as a proxy for patient socioeconomic status, consistent with prior healthcare access studies. Each active patient was classified into 1 of 4 quartiles based on this variable: SVI Percentile Less than 25% (<25th), SVI Percentile 25–50% (25–50th), SVI Percentile 50–75% (50–75th), and SVI Percentile 75% or more (>75th). Patients without an SVI value (1.4% of all patients recorded across all quarters) were excluded from this analysis. In a similar manner, patients were also subdivided across the rural–urban spectrum based on zip code and census tract data. To simplify the analysis, the geographic categories in Cosmos were condensed into 4 groups: Metropolitan, Micropolitan, Small Town, and Rural. Each patient encounter has an associated financial class, recorded based on payer type as one of the following: Miscellaneous/Other, Medicare, Medicaid, Self-Pay, and None of the Above. Because patients can have different recorded financial classes at different visits, it is possible for some patients to be counted under more than 1 FC within a given quarter.
To assess outcomes related to these observations, we extracted stroke mortality data from Cosmos within a 2-year analysis window in both the baseline interval (2015–2016) and the post-event interval (2022–2023). This represents all-cause mortality but is recorded only if the death date occurs within the analysis window and is known to the Epic-participating institution. The population for these analyses is patients who had any diagnosis of acute cerebral infarction based on ICD-10 codes in the I63 group and who underwent the procedure of interest (CTP or MT) during the analysis window.
Statistical analysis was performed using SPSS Statistics software version 29.0.1.0 (IBM, Chicago, IL, USA). To assist interpretation of changes in trends before and after Q4 2017, a segmented linear regression analysis was performed for data sets examining changes in utilization over time, with the study period partitioned at the Q4 2017 time point. Error bars for data representing proportions denote 95% confidence intervals based on the normal approximation of the binomial. Error bars for data representing averages of continuous variables represent standard errors of the mean. Statistical significance of proportion data between 2 independent samples was assessed using the chi-square test.
3. Results
A total of approximately 2.4 billion active patient records were identified in Cosmos by summing the number of unique active patients per quarter from 2015 through 2024, with 31.6 million (1.30%) being assigned an AIS diagnosis code, 737,618 (0.031%) being billed for CTP, and 99,465 (0.004%) being billed for MT (Table 1).

Table 1.
Proportion of total patients across all fiscal quarters analyzed who were billed for AIS, CTP, and MT.
CTP utilization per 100,000 active patients rose steadily from Q1 of 2015 to Q3 of 2017, ranging from 4.32 CTPs per 100,000 to 9.45 per 100,000 (Figure 1). CTP utilization then began to increase more rapidly in a near-linear fashion beginning in Q4 of 2017, reaching 61.24 per 100,000 in Q4 of 2024. Segmental regression shows that the observations fit well to a pattern of linear growth that accelerated beginning at the Q4 2017 inflection point (R2 = 0.92 for the baseline segment and R2 = 0.98 for the post-event segment). The baseline rate of growth obtained from linear regression was 0.45 ± 0.04 per 100 K active patients per quarter, and the slope of the trend after Q4 2017 was 1.72 ± 0.05.
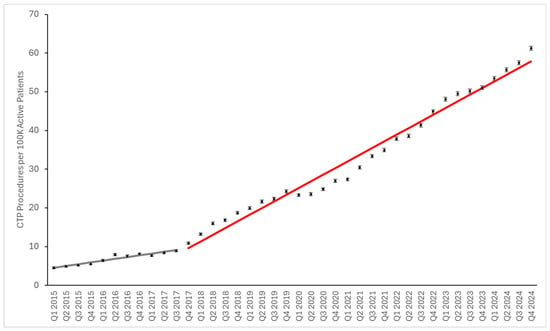
Figure 1.
CT brain perfusion utilization relative to active patient population. Data points represent numbers of procedures per 100 K active patients. Error bars represent 95% confidence intervals. Grey and red lines represent fitted segmented linear regression models for before and after Q4 2017, respectively. Although the data in the post-2017 phase is not completely linear, with a mild dip in utilization during 2020, the linear model shows a relatively good fit (R2 of 0.98).
MT utilization per 100,000 active patients grew steadily from Q1 of 2016 to Q3 of 2017, ranging from 1.44 per 100,000 to 2.50 per 100,000 (Figure 2). MT utilization also began to increase beginning in Q4 of 2017, reaching 6.36 per 100,000 in Q4 of 2024. The growth during this period consisted of a sharp rise in utilization around Q4 2017, followed by a slower growth rate across the remainder of the study period, fitting well to 2 segments of linear growth (R2 = 0.92 for both segments). The slope of the baseline trend was 0.18 ± 0.03 per 100 K active patients per quarter, and the slope of the trend after Q4 2017 was 0.09 ± 0.01, following an abrupt rise of ~0.7 per 100 K patients around the inflection point.

Figure 2.
Intracranial Thrombectomy/Thrombolysis relative to active patient population. Data points represent numbers of procedures per 100 K active patients. Error bars represent 95% confidence intervals. Grey and red lines represent fitted segmented linear regression models for before and after Q4 2017, respectively.
As some of the observed trends could be a result of increased frequency of acute ischemic strokes (AISs), we also evaluated the above utilization metrics as a ratio of the number of patients with an AIS diagnosis. The proportion of CTPs being performed per AIS diagnosis increased gradually from Q1 of 2015 to Q3 of 2017, ranging from 0.49% to 0.80% (Figure 3). From Q4 of 2017, the proportion of CTPs being performed more rapidly increased to a peak of 3.8% in Q4 of 2024. The proportion of MTs being performed per AIS diagnosis also increased throughout the study, increasing from 0.15% in Q1 of 2016 to 0.39% in Q4 of 2024 (Figure 4). When expressed as a percentage of AIS diagnoses, CTP and MT utilization both showed post-2017 changes qualitatively similar to the per-population utilization figures.
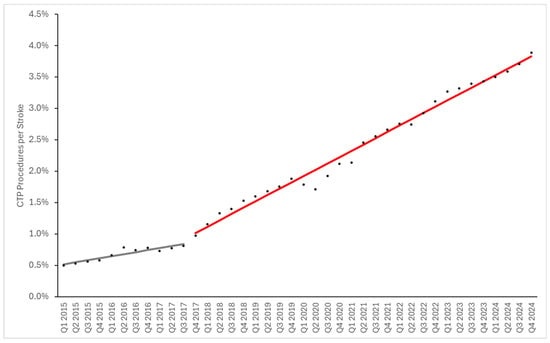
Figure 3.
CTP Utilization per Stroke Diagnosis. Data points represent numbers of procedures per 100 K active patients. Grey and red lines represent fitted segmented linear regression models for before and after Q4 2017, respectively. The slope of the baseline trend was 0.032% ± 0.005% (standard error) per stroke diagnosis per quarter, and the slope of the trend after Q4 2017 was 0.1% ± 0.002%.

Figure 4.
MT Utilization per Stroke Diagnosis. Data points represent numbers of procedures per 100 K active patients. Grey and red lines represent fitted segmented linear regression models for before and after Q4 2017, respectively. The slope of the baseline trend was 0.014% ± 0.002% (standard error) per stroke diagnosis per quarter, and the slope of the trend after Q4 2017 was 0.0030% ± 0.0003%.
To ascertain potential differences in the observed trends among different communities, we analyzed the effects of socioeconomic status using the SES SVI, the effects of rural vs. urban settings using the Rural–Urban Commuting Area Codes, and the effects of financial class (i.e., insurance payer type). We used these variables to partition the data into different categories when reporting summary metrics for the baseline period (before Q4 2017) and the early post-event period (the first four years following Q4 2017). Baseline CTP and MT utilization were highest in the 3rd SES SVI quartile, followed by the 4th quartile (most vulnerable) (Figure 5 and Figure 6). Post-event MT utilization showed similar findings (Figure 5). However, in the early post-event period, CTP was highest in the 4th quartile, followed by the 3rd quartile. For both procedures, communities associated with the 3rd and 4th quartiles of SES SVI, which are more socioeconomically vulnerable than the median, show a mildly larger increase in utilization after Q4 2017, indicating that the most vulnerable socioeconomic communities have likely benefited from the updated stroke guidelines. These inter-SES differences are substantially smaller in magnitude than the difference between baseline and post-event utilization, supporting that SES has little effect on the observed utilization growth.
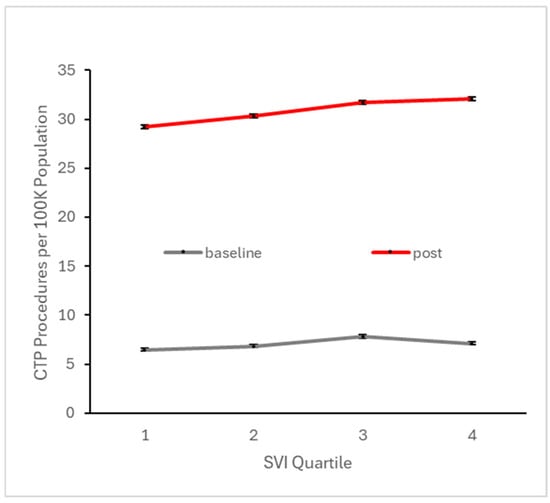
Figure 5.
Number of patients per 100 K active patients across all baseline quarters (i.e., prior to Q4 2017) and across all quarters in the subsequent four years undergoing CTP, stratified by SES social vulnerability index quartile. Higher quartile denotes higher vulnerability, which is typically associated with lower SES.
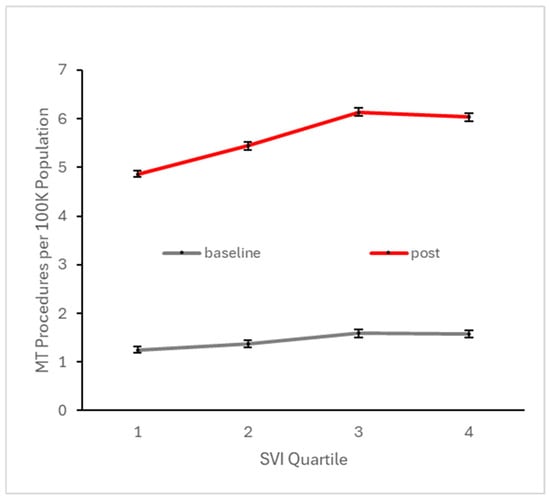
Figure 6.
Number of patients per 100 K active patients across all baseline quarters (i.e., prior to Q4 2017) and across all quarters in the subsequent four years undergoing MT, stratified by SES social vulnerability index quartile. Higher quartile denotes higher vulnerability, which is typically associated with lower SES.
To explore potential disparities with respect to urban vs. rural settings, we similarly analyzed baseline and early post-event utilization after stratifying across this variable. CTP and MT utilization at both the baseline and early post-event periods were highest in small town settings, but these rural–urban differences were substantially smaller than the differences between baseline and post-event utilization (Figure 7 and Figure 8). With regard to financial class (insurance payer type), we observed small declines in the proportion of CTP and MT cases paid by Medicare, offset by small increases in the proportion paid by Medicaid (Figure 9 and Figure 10). This suggests that the Medicaid population, typically low-income patients, benefits slightly more than other groups from the expanded therapeutic window.
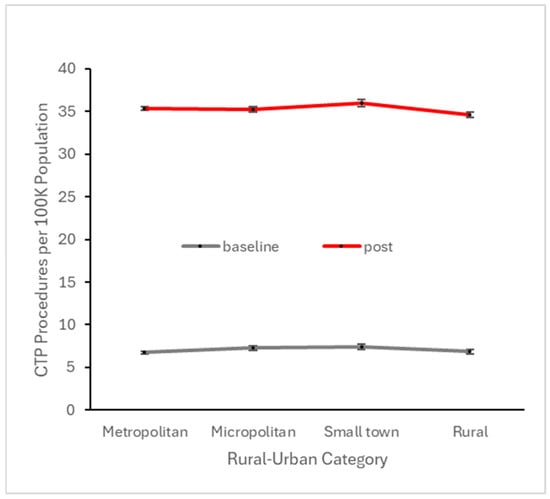
Figure 7.
Number of patients per 100 K active patients across all baseline quarters (i.e., prior to Q4 2017) and across all quarters in the subsequent four years undergoing CTP, stratified by rural–urban category.
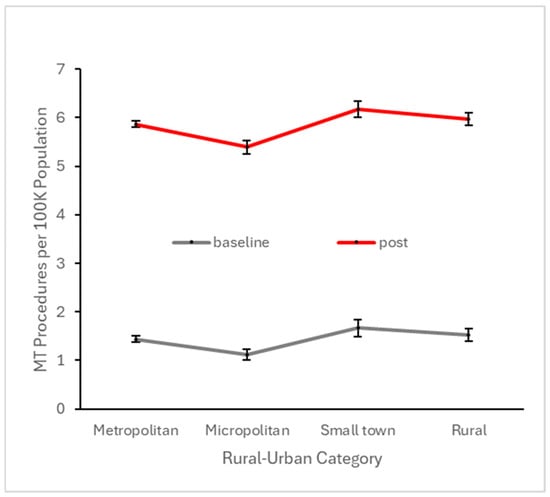
Figure 8.
Number of patients per 100 K active patients across all baseline quarters (i.e., prior to Q4 2017) and across all quarters in the subsequent four years undergoing MT, stratified by rural–urban category.
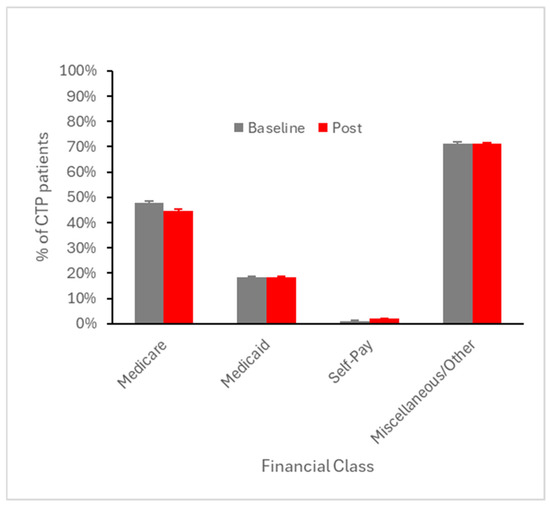
Figure 9.
Percent of CTP patients averaged across all baseline quarters (i.e., prior to Q4 2017) and across all quarters in the subsequent four years, stratified by financial class (payer type). Error bars represent SEM.

Figure 10.
Percent of MT patients averaged across all baseline quarters (i.e., prior to Q4 2017) and across all quarters in the subsequent four years, stratified by financial class (payer type). Error bars represent SEM.
All-cause mortality among stroke patients undergoing CTP did not change from the baseline to the post-event interval, but mortality among patients undergoing MT showed a statistically significant increase from 22% to 26% (p < 0.0001) (Figure 11). We were not able to assess functional neurologic outcomes from the current dataset.

Figure 11.
All-cause mortality rate among patients who underwent a CTP or MT procedure and who had a documented diagnosis of AIS during a 2-year subset of the baseline interval and the post-implementation interval.
4. Discussion
The purpose of this study was to examine CTP and MT usage over time in a large, multicenter patient population and identify any trends in utilization. The Cosmos database (Epic Systems, Verona, WI, USA) was used to retrospectively identify millions of patients with medical encounters between the years of 2015 and 2024 and to determine the volume of MT and CTPs performed. Our results indicate a large increase in utilization of CT brain perfusion over the 10-year period. The proportion of patients undergoing CTP in the first quarter of 2015 was 0.0043%, as compared to 0.010% by the first quarter of 2018, coinciding with the DAWN trial publication. This proportion increased to 0.061% by the end of 2024, representing a substantial increase (almost 4-fold) in the rate of growth in utilization compared to the pre-2018 era, suggesting a rapid increase in adoption of new therapy guidelines in 2018 recommending this advanced imaging modality in the acute stroke setting [4]. Further, the initial proportion of patients undergoing MT during the first quarter of 2016 was 0.0014%, which increased to 0.0064% by the end of 2024, supporting that increased CTP utilization correlates with increased detection of emergent strokes treatable through intra-arterial interventions. CTP utilization increased by over 1300% from 2015 to 2024, while MT utilization increased by over 300% from 2016 to 2024. Notably, the increase in utilization of CTP was 4-fold that for MT in this patient population, which is not unexpected given that CTP may identify patients who are not eligible for intra-arterial thrombectomy more often than patients who are eligible.
The temporal increase in CTP and MT utilization observed in our study aligns with updates to clinical guidelines, but additional factors may also have contributed. Over the past decade, U.S. hospitals have seen a modest increase in CT scanner availability from around 40.9 scanners per million people in 2011 to approximately 42.6 in 2020, which may have facilitated broader access to advanced imaging in acute stroke care [17]. In parallel, the adoption of standardized in-hospital “stroke code” protocols has been associated with significantly shorter intervals from symptom recognition to neuroimaging and reperfusion treatment in cohort studies [18]. While our study design cannot establish causation, these systemic developments provide additional context for the observed trends.
Our results do not show large disparities in utilization of either CTP or MT across demographic variables such as urban vs. rural communities, socioeconomic status, or financial class. Although mild disparities exist in our dataset, such disparities are much smaller in magnitude than the overall increase in utilization over the time period. One possible explanation for the relatively small effects of these variables on utilization is the increasing use of regionalized stroke systems of care, including hub-and-spoke models in which patients are triaged directly to comprehensive stroke centers [19]. Such centralized pathways may mitigate geographic disparities that are more evident in other healthcare contexts. Additionally, our use of residential zip codes to ascertain socioeconomic vulnerability from census tract data may obscure more granular inter-individual differences in access, which could explain why our findings differ from earlier single-region analyses. However, a systematic review analyzing healthcare studies that employed the SVI concluded that SVI is a viable tool to establish the degree of neighborhood-level social vulnerability to health outcomes and health system outcomes [20]. Although disparities related to stroke care have been documented, it is plausible that the revised therapeutic criteria have made stroke care more accessible by virtue of a wider time window for therapeutic intervention. For instance, stroke patients from low-income or rural areas may require more time to reach a comprehensive stroke center and would have therefore been less likely to be eligible for MT under previous guidelines. This is supported by our findings of more vulnerable populations showing mildly greater increases in utilization after the stroke guidelines were updated.
As indications for AIS treatment expanded to include tissue-based criteria defined by advanced neuroimaging like CTP, several studies reported a significant increase in CTP utilization. In a recent single-center retrospective study of the DAWN trial’s effect on utilization patterns, 443 patients underwent CTP for stroke evaluation for two years ending December 2018. The 2017 studies were considered ‘pre-DAWN’, while the 2018 studies were considered ‘post-DAWN’, and each patient was designated as an early presenter (within 6 h) or late presenter (over 6 h). Overall, there was a 50% increase in CTPs performed in 2018 as compared to 2017. Post-DAWN, the proportion of all CTs that were CTP increased by 40%, while CTP in late presenters increased by 70% in 2018 [9].
Interestingly, we found that from the baseline interval to the post-event interval, all-cause mortality among stroke patients undergoing CTP did not change, but all-cause mortality among stroke patients undergoing MT increased over time. This increase in mortality may be due to sicker patients being treated with MT, as proposed in prior publications [21]. Because of the expanded therapeutic window, more patients may be deemed eligible for MT, some of whom would have been considered too risky to treat under the former criteria. However, we did not specifically explore this relationship in our dataset, and other potential factors such as changes in operator experience or post-procedural care over time are not able to be examined with our current data. Outcome assessment was not a primary objective of our study, which focuses on utilization assessment, which is a prerequisite for outcome assessment following the updated practice guidelines. Future studies specifically designed for outcome assessment would be needed to document whether the observed changes translate to improved health outcomes.
The increased utilization of CT perfusion imaging and mechanical thrombectomy carries important clinical implications for acute ischemic stroke management. By expanding the treatment window and refining patient selection criteria, particularly through advanced imaging techniques like CT perfusion, more patients are now eligible for potentially life-saving interventions. This shift enables more tailored and evidence-based decision-making, improves functional outcomes by identifying patients with salvageable brain tissue, and encourages protocol-driven workflows that reduce treatment delays. To fully realize these benefits, however, hospitals and stroke centers must be equipped with the necessary imaging capabilities, interventional teams, and streamlined processes to accommodate the higher demand for both diagnostics and procedures. These findings highlight the importance of continued investment not only in technology but also in training and system-level preparedness to support equitable and timely access to advanced stroke care.
While this study leverages a large, multi-institutional dataset to identify meaningful trends in imaging and intervention, certain limitations should be acknowledged. Most notably, the analysis was limited to data from institutions utilizing the Epic electronic health record system, as captured through the Cosmos database. As a result, hospitals and clinics that do not use Epic were not included, potentially introducing selection bias and limiting the generalizability of our findings to all healthcare settings. Non-Epic institutions may have different imaging capabilities, patient populations, or institutional protocols that influence CT perfusion and mechanical thrombectomy utilization. However, Epic represents approximately 42.3% of the U.S. hospital EHR market [22], encompassing many academic medical centers, large health systems, and community hospitals. As such, the patient population and institutional practices captured in our dataset likely reflect a broad segment of stroke care delivery across the United States, even if not fully inclusive of all settings. Additionally, while Cosmos allows for large-scale data aggregation, it relies on accurate and consistent coding practices across sites, which may vary. While coding for some variables, such as race, may vary across different institutions, the common use of a standardized medical coding system used for documentation and billing is likely to produce relatively reliable data when querying by diagnosis codes and billed procedure codes. Despite its limitations, the dataset provides a large sample for analysis of trends within a substantial portion of U.S. healthcare systems, offering important insights into practice changes following the 2015 guideline updates.
Our study found that following the updated recommendations stemming from the DAWN and DEFUSE-3 trials, the utilization of CT perfusion imaging for stroke diagnosis and subsequent mechanical thrombectomy has increased significantly across Epic-utilizing institutions. These findings underscore the widespread adoption of guideline-based practices and reflect a system-level shift toward more advanced, imaging-driven stroke care. To better optimize patient outcomes and ensure sustainability, health systems should work towards establishing benchmarks for appropriate CTP utilization relative to stroke incidence, linking imaging data with functional outcomes to assess whether expanded imaging improves recovery, and evaluating the cost-effectiveness of CTP in order to balance access with resource sustainability. In addition, the updated guidelines may have made stroke care more equitable based on our findings that the larger increases in utilization are seen among more vulnerable populations, but more research is needed to assess access to advanced imaging and interventions across socioeconomic and geographic groups.
Author Contributions
Conceptualization, X.V.N. and C.B.; methodology, X.V.N.; validation, X.V.N., C.B. and Y.R.; formal analysis, X.V.N.; resources, X.V.N.; data curation, Y.R. and C.B.; writing—original draft preparation, Y.R. and C.B.; writing—review and editing, Y.R., C.B., Z.A. and X.V.N.; visualization, Y.R. and C.B.; supervision, X.V.N.; project administration, Y.R. All authors have read and agreed to the published version of the manuscript.
Funding
This research received no external funding.
Institutional Review Board Statement
The study design was reviewed by the Office of Responsible Research Practices at Ohio State University and was deemed to be exempt under human subject research guidelines on 14 April 2016 (study # 2016E0244). The authors did not have access to data that could identify individual participants during or after data collection.
Informed Consent Statement
Not applicable.
Data Availability Statement
Data were obtained from Epic Systems and are available at https://userweb.epic.com (accessed on 22 August 2025) with the permission of Epic Systems.
Conflicts of Interest
The authors declare no conflicts of interest.
Abbreviations
The following abbreviations are used in this manuscript:
| AIS | Acute ischemic stroke |
| MT | Mechanical thrombectomy |
| LKW | Last known well |
| CTP | Computed tomography perfusion |
| CTA | Computed tomography angiography |
| SES | Socioeconomic status |
| FC | Financial class |
References
- Feske, S.K. Ischemic stroke. Am. J. Med. 2021, 134, 1457–1464. [Google Scholar] [CrossRef]
- Feigin, V.L.; Brainin, M.; Norrving, B.; Martins, S.; Sacco, R.L.; Hacke, W.; Fisher, M.; Pandian, J.; Lindsay, P. World Stroke Organization (WSO): Global Stroke Fact Sheet 2022. Int. J. Stroke 2022, 17, 18–29. [Google Scholar] [CrossRef]
- Wintermark, M.; Maeder, P.; Thiran, J.P.; Schnyder, P.; Meuli, R. Quantitative assessment of regional cerebral blood flows by perfusion CT studies at low injection rates: A critical review of the underlying theoretical models. Eur. Radiol. 2005, 15, 889–901. [Google Scholar] [CrossRef]
- Yeo, L.L.L.; Sharma, V.K.; Andersson, T.; Gopinathan, A.; Tan, B.Y.Q.; Teoh, H.L.; Lo, Y.L.; Seet, R.C.S.; Mokin, M. Mechanical thrombectomy in acute ischemic stroke: An updated systematic review and meta-analysis of randomized controlled trials. J. Stroke Cerebrovasc. Dis. 2023, 32, 107282. [Google Scholar] [CrossRef]
- Powers, W.J.; Derdeyn, C.P.; Biller, J.; Coffey, C.S.; Hoh, B.L.; Jauch, E.C.; Johnston, K.C.; Johnston, S.C.; Khalessi, A.A.; Kidwell, C.S.; et al. 2015 American Heart Association/American Stroke Association Focused Update of the 2013 Guidelines for the Early Management of Patients with Acute Ischemic Stroke Regarding Endovascular Treatment. Stroke 2015, 46, 3020–3035. [Google Scholar] [CrossRef] [PubMed]
- Nogueira, R.G.; Jadhav, A.P.; Haussen, D.C.; Bonafe, A.; Budzik, R.F.; Bhuva, P.; Yavagal, D.R.; Ribo, M.; Cognard, C.; Hanel, R.A.; et al. Thrombectomy 6 to 24 Hours after Stroke with a Mismatch between Deficit and Infarct. N. Engl. J. Med. 2018, 378, 11–21. [Google Scholar] [CrossRef]
- Albers, G.W.; Marks, M.P.; Kemp, S.; Christensen, S.; Tsai, J.P.; Ortega-Gutierrez, S.; McTaggart, R.A.; Torbey, M.T.; Kim-Tenser, M.; Leslie-Mazwi, T.; et al. Thrombectomy for Stroke at 6 to 16 Hours with Selection by Perfusion Imaging. N. Engl. J. Med. 2018, 378, 708–718. [Google Scholar] [CrossRef]
- Powers, W.J.; Rabinstein, A.A.; Ackerson, T.; Adeoye, O.M.; Bambakidis, N.C.; Becker, K.; Biller, J.; Brown, M.; Demaerschalk, B.M.; Hoh, B.; et al. Guidelines for the Early Management of Patients with Acute Ischemic Stroke: 2019 Update to the 2018 Guidelines for the Early Management of Acute Ischemic Stroke: A Guideline for Healthcare Professionals from the American Heart Association/American Stroke Association. Stroke 2019, 50, 210–211. [Google Scholar] [CrossRef]
- Han, J.Y.; Tan, I.Y.L. Retrospective single-centre experience on the effect of the DAWN trial on the utilization pattern, diagnostic yield and accuracy of CT perfusions performed for suspected acute stroke. J. Med. Imaging Radiat. Oncol. 2020, 64, 477–483. [Google Scholar] [CrossRef]
- Fernandez, M.; Farmer, C.; Egerton–Warburton, D.; Clark, J.; Paul, E.; Chong, W.; Goergen, S.K. Imaging triage of acute stroke patients for endovascular clot retrieval: Effect of increased therapeutic window on the utilization of CT perfusion. J. Med. Imaging Radiat. Oncol. 2021, 65, 152–159. [Google Scholar] [CrossRef]
- Wang, J.J.; Katz, J.M.; Boltyenkov, A.; Martinez, G.; O’Hara, J.; Gribko, M.; Pandya, A.; Rula, E.; Sanelli, P. Neuroimaging in acute ischemic stroke: Trends, disparities, and clinical impact. Eur. J. Radiol. 2022, 154, 110411. [Google Scholar] [CrossRef]
- Rai, A.T.; Link, P.S.; Domico, J.R. Updated estimates of large and medium vessel strokes, mechanical thrombectomy trends, and future projections indicate a relative flattening of the growth curve but highlight opportunities for expanding endovascular stroke care. J. Neurointerv. Surg. 2023, 15, e349–e355. [Google Scholar] [CrossRef]
- Wang, J.J.; Boltyenkov, A.; Katz, J.M.; O’Hara, J.; Gribko, M.; Sanelli, P.C. Striving for Socioeconomic Equity in Ischemic Stroke Care: Imaging and Acute Treatment Utilization from a Comprehensive Stroke Center. J. Am. Coll. Radiol. 2022, 19, 348–358. [Google Scholar] [CrossRef]
- Kim, Y.; Lee, S.; Abdelkhaleq, R.; Lopez-Rivera, V.; Navi, B.; Kamel, H.; Savitz, S.I.; Czap, A.L.; Grotta, J.C.; McCullough, L.D.; et al. Utilization and Availability of Advanced Imaging in Patients with Acute Ischemic Stroke. Circ. Cardiovasc. Qual. Outcomes 2021, 14, e006989. [Google Scholar] [CrossRef] [PubMed]
- MacKenzie, I.E.R.; Moeini-Naghani, I.; Sigounas, D. Trends in Endovascular Mechanical Thrombectomy in Treatment of Acute Ischemic Stroke in the United States. World Neurosurg. 2020, 138, e839–e846. [Google Scholar] [CrossRef] [PubMed]
- Kamel, H.; Parikh, N.S.; Chatterjee, A.; Kim, L.K.; Saver, J.L.; Schwamm, L.H.; Zachrison, K.S.; Nogueira, R.G.; Adeoye, O.; Díaz, I.; et al. Access to Mechanical Thrombectomy for Ischemic Stroke in the United States. Stroke 2021, 52, 2554–2561. [Google Scholar] [CrossRef] [PubMed]
- Martella, M.; Lenzi, J.; Gianino, M.M. Diagnostic Technology: Trends of Use and Availability in a 10-Year Period (2011–2020) among Sixteen OECD Countries. Healthcare 2023, 11, 2078. [Google Scholar] [CrossRef]
- Kuczynski, A.M.; Freeman, W.D.; Mooney, L.H.; Huang, J.F.; Demchuk, A.M.; Khosravani, H. The In-Hospital Code Stroke: A Look Back and the Road Ahead. Neurohospitalist 2024, 15, 124–132. [Google Scholar] [CrossRef]
- Elrod, J.K.; Fortenberry, J.L. The hub-and-spoke organization design: An avenue for serving patients well. BMC Health Serv. Res. 2017, 17, 457. [Google Scholar] [CrossRef]
- Higginbotham, J.K.; Segovia, L.M.; Rohm, K.L.; Anderson, C.M.; Breitenstein, S.M. Social Vulnerability Index and Health Outcomes in the United States: A systematic review. Fam. Community Health 2025, 48, 81–96. [Google Scholar] [CrossRef]
- Riegler, C.; Rücker, V.; von Rennenberg, R.; Bollweg, K.; Cheng, B.; Alegiani, A.C.; Flottmann, F.; Schnieder, M.; Ernst, M.; Pfeilschifter, W.; et al. Time trends in mechanical thrombectomy (2017-2021): Do real-world data reflect advances in evidence? Front. Neurol. 2025, 15, 1517276. [Google Scholar] [CrossRef] [PubMed]
- Fierce Healthcare. Epic Gaining More Ground: Hospital EHR Market Share Widens Its Lead over Oracle Health. 2025. Available online: https://www.fiercehealthcare.com/health-tech/epic-gaining-more-ground-hospital-ehr-market-share-widens-its-lead-over-oracle-health (accessed on 29 August 2025).
Disclaimer/Publisher’s Note: The statements, opinions and data contained in all publications are solely those of the individual author(s) and contributor(s) and not of MDPI and/or the editor(s). MDPI and/or the editor(s) disclaim responsibility for any injury to people or property resulting from any ideas, methods, instructions or products referred to in the content. |
© 2025 by the authors. Licensee MDPI, Basel, Switzerland. This article is an open access article distributed under the terms and conditions of the Creative Commons Attribution (CC BY) license (https://creativecommons.org/licenses/by/4.0/).