Abstract
Environmental noise is a growing public health issue, particularly in dense urban environments and areas adjacent to transport infrastructure. Passive acoustic barriers have been a widely adopted solution, although their functional and aesthetic limitations have driven the development of alternatives, such as Sonic Crystal Acoustic Barriers. These structures can incorporate resonant elements, such as Helmholtz cavities, with the aim of enhancing attenuation in particular frequency bands. However, determining the precise dimensions of these resonators is a persistent challenge, given that classical models are based on ideal geometries and do not incorporate interaction with the periodic structural environment. This study sets a new frequency-dependent correction factor, obtained both numerically and experimentally, which allows the classical Helmholtz resonance expression to be adjusted to the case of resonators embedded in a Sonic Crystal (SC). The proposed model is validated through simulations and experimental measurements, showing a significant improvement in the prediction of the resonance frequency. The results obtained in this study allow us to move towards a more efficient and realistic design of passive acoustic barriers that are lightweight and adaptable to the urban environment.
1. Introduction
In today’s social environment, excessive levels of environmental noise are frequently encountered, making it difficult to hold conversations without raising one’s voice. This places a strain on communication and creates difficulties in concentration, as well as causing fatigue generated by persistent background noise. Such challenges are everyday forms of acoustic nuisance. Although such challenges may seem anecdotal, they reveal sound’s role as environmental pollution [1]. The perception of discomfort associated with noise is not only related to its intensity level, but is also shaped by individual, collective and contextual factors, such as personal sensitivity or the perception of a lack of control over the sound stimulus [2]. This phenomenon can evolve from slight interference in daily activities to physiological stress responses or a significant deterioration in quality of life when exposure is continuous [3].
From a strictly medical perspective, prolonged exposure to noise is considered a risk factor for multiple conditions. Several recent studies have shown that noise not only affects the auditory system, but can also trigger cardiovascular, metabolic, cognitive, and emotional disorders. This phenomenon occurs as a result of the activation of the hypothalamic–pituitary–adrenal axis and the sympathetic nervous system [4]. This systemic stress response, mediated by the release of cortisol and catecholamines, promotes inflammatory processes, oxidative damage and endocrine dysfunction that, if sustained over time, can lead to chronic diseases.
The scale of the issue is well-documented in Europe. According to 2021 data reported in the 2022 Environmental Noise Directive (END) round, approximately 112 million people (over 20% of the population) are exposed to long-term noise from road, rail, and aircraft sources exceeding END thresholds. When considering stricter thresholds recommended by the World Health Organization (WHO), this number rises to about 150 million people (over 30% of the population) [5]. Road traffic is the main source of exposure, followed by rail and air traffic. Although the information comes from the European context, the phenomenon in question transcends geographical and cultural boundaries. Several recent studies conducted in various countries and regions worldwide, including China, Latin America, Iraq and Nigeria, have confirmed that environmental noise from traffic, urban concentration and poor noise planning has clinically significant effects on health and cognitive performance, especially in contexts where there are no adequate regulatory frameworks [6,7,8,9,10]. This phenomenon constitutes a structural and global challenge, associated with mobility and the densification of human habitats, which underscores the imperative for effective and scalable solutions.
In response to this situation, it is imperative to implement effective passive noise control strategies, especially in dense urban areas or areas adjacent to transport infrastructure. Noise barriers have emerged as one of the most widely implemented measures to mitigate exposure to environmental noise, particularly in the context of road, rail and industrial infrastructure [11]. The operating principle of these devices is based on interrupting the direct propagation of sound by using reflection and diffraction phenomena at the top of the barrier, with the aim of reducing the sound pressure levels reaching the receivers [12]. However, these structures have significant limitations in an urban context, as they create enclosure effects, interrupt natural ventilation, alter the microclimate by causing thermal gradients, and their widespread presence often detracts from the visual landscape, frequently becoming a target for graffiti or other undesirable impacts [13].
In response to these challenges, a line of research has been developed focusing on the use of periodic structures for passive noise management, commonly referred to as Sonic Crystal Acoustic Barriers. These devices incorporate regular arrays of scatterers (rigid and cylindrical, hollow or with resonant cavities) that operate by multiple scattering of the sound waves passing through them [14], generating attenuation bands (band gaps) in specific frequency ranges [15,16]. Unlike traditional barriers, these barriers offer notable benefits in terms of visual transparency, air circulation and aesthetic flexibility, which facilitates their architectural integration and reduces their impact on the landscape [17].
Several recent studies have shown that the implementation of barriers consisting of a few rows of scatterers can generate reductions of more than 15 to 20 dB in the frequency bands of interest, leading to optimised performance through the incorporation of Helmholtz-type resonant cavities in the structural elements that form the scatterers [18,19,20,21]. With the incorporation of these resonators, it is possible to enhance attenuation in particular frequency bands, extending the effective range of the barrier without increasing its volume or opacity. However, the actual acoustic behaviour of these resonators, when embedded in a periodic array, can deviate significantly from predictions based on classical models developed for isolated cavities in free space [22].
However, one of the main challenges in designing these advanced barriers lies in accurately determining the dimensions of the resonators embedded on the scatterers. Traditionally, the resonance frequency of a Helmholtz resonator has been estimated using simple analytical expressions based on its idealised geometry, introducing an empirical correction factor to the effective length of the neck to adapt it to the actual conditions of use. This correction, while advantageous, has traditionally been approached as a constant value or a narrow range, depending on the configuration of the neck contour [23], without considering the variability in frequency or the intricate interaction with the structural environment. However, several studies have shown that this approach is insufficient to accurately predict the behaviour of resonators embedded in periodic arrays, especially when seeking attenuation tailored to specific frequency bands [20,24,25]. In this work, we present a numerical and experimental study to improve the accuracy of the theoretical resonance frequency of SC-embedded Helmholtz resonators by adjusting the correction factor associated with the effective length of their neck.
2. Materials and Methods
This section presents the procedure used to improve the accuracy of the theoretical resonance frequency of SC-embedded Helmholtz resonators by adjusting the correction factor associated with the effective length of the neck.
The conceptual development of this work is structured according to the schematic representation presented in Figure 1, which summarises the phases addressed in both the numerical and experimental domains. The starting point for this study is the design of a Helmholtz resonator, conceived as a functional element within acoustic barriers based on Sonic Crystals. Based on established geometry, the theoretical resonance frequency is calculated by applying an adapted Helmholtz equation. Subsequently, a comparison is made between the frequency obtained by this procedure and the frequency resulting from the numerical simulation . If the discrepancy between the two is negligible (lower than 5%), the applied correction factor is validated. Otherwise, the value of is adjusted iteratively, recalculating until a satisfactory match is achieved . Once this match is achieved, the correction factor for the corresponding frequency is considered to be adjusted. On the other hand, the term appears on the right-hand side of Figure 1, referring to a series of experiments which are carried out to achieve experimental validation.
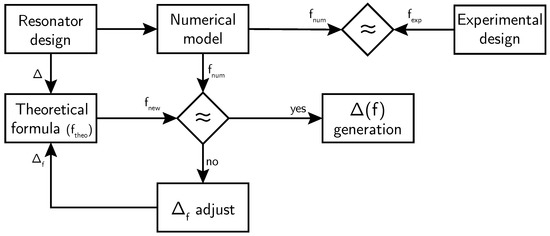
Figure 1.
Diagram of the methodological procedure followed to adjust and validate the correction factor in SC-embedded Helmholtz resonators.
The following subsections describe the equations and numerical tools used in the adjustment process, as well as the experimental procedure in an anechoic chamber used to validate the results of the numerical model, which is considered as the reference.
2.1. Resonance Prediction Equation Used
The resonator studied in this paper consists of a rectangular neck and a circular cavity in its cross-section. Both the neck and the cavity have a height equivalent to that of the entire acoustic scatterer. The basic geometry of this type of scatterer with an integrated resonator can be observed in Figure 2.
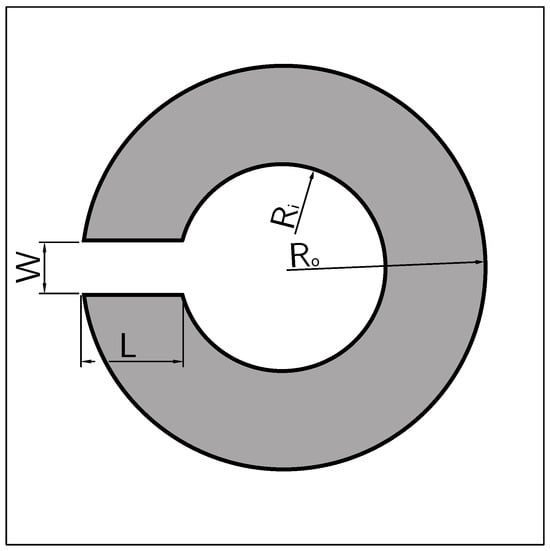
Figure 2.
Geometry of the SC-embedded Helmholtz resonator considered in this study. The main dimensions are indicated: (internal radius of the cavity), (external radius of the scatterer), W (width of the neck) and L (length of the neck).
The expression used to estimate the resonance frequency in cavities with internal volume and narrow neck is an adaptation of the classic Helmholtz resonator formula, modified to incorporate a geometric correction more closely aligned with the system configuration [26].
where is the theoretical resonance frequency (Hz), c is the speed of sound in air (m/s), W is the width of the neck inlet (m), L is the geometric length of the neck (m), S is the surface area of the resonant cavity () and is a dimensionless correction factor that adjusts the effective length of the neck based on its cross-sectional area.
The term represents the effective length of the neck, incorporating a correction for the edge effects that occur at the ends of the neck, where the sound wave is not completely confined.
This type of correction has been studied in pioneering works such as those of Lord Rayleigh [27], and is adapted according to geometry. In rectangular necks, typical values for ranging from 1.6 to 1.8 have been proposed [28]. However, it is important to note that these values are merely indicative and that their suitability for each specific configuration is precisely one of the primary adjustment objectives in the present study.
2.2. Numerical Model and Parameterisation
Our research group has developed various designs for cylindrical acoustic scatterers intended for Sonic Crystal Acoustic Barriers. In this type of configuration, the direct application of theoretical Equation (1) can introduce significant errors in the prediction of the resonance frequency. To address this discrepancy, a numerical prediction model based on the finite element method is implemented, using COMSOL Multiphysics® software [29].
Figure 3a shows the basic geometry of the numerical model and boundary conditions, and Figure 3b shows an example of the frequency-dependent sound pressure level in dB inside a certain SC-embedded resonator, obtained via FEM simulation.
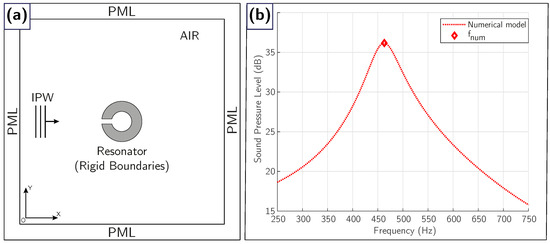
Figure 3.
(a) Representation of the numerical model implemented in COMSOL. (b) Sound pressure level in dB as a function of frequency inside the resonator. The peak identifies the resonance frequency obtained numerically .
The model is constructed using the acoustics module, considering a geometry as shown in Figure 3a. The simulation domain is defined as a square with sides of 50 cm, filled with air at 20 °C, and bounded on all four sides by perfectly matched layers (PMLs) [30] that prevent unwanted reflections at the boundaries. The resonator is modelled as a rigid boundary (Neumann condition: zero particle velocity), simulating a material with infinite impedance, which guarantees the occurrence of the resonance phenomenon.
Excitation is achieved by applying an incident plane wave (IPW) to the SC-embedded resonator, which propagates in the positive direction of the OX axis, with an amplitude of 1 Pa. The model is solved in the frequency domain in steady state, which allows the acoustic pressure distribution to be obtained for each frequency analysed within the domain, including the interior of the resonator.
The mesh has been designed with a minimum density of six elements per wavelength, and the frequency sweep ranges from 1 to 5000 Hz, in increments of 2 Hz. Each simulation involves approximately 10,000 degrees of freedom. Given that the model is evaluated for multiple geometric configurations, the total number of degrees of freedom solved will depend directly on the number of parameterisations performed.
In order to adapt the model to relevant configurations in real environments, the geometric parameters of the resonator are established in accordance with designs commonly used in acoustic barriers, which are intended to attenuate light vehicle traffic noise (with a mass under 3.5 tonnes). In this context, constant values are established for the outer radius of the resonator and for the width of the neck , while the inner radius and the length of the neck are parameterised in a controlled manner. This methodology enables assessment of the variation in resonance frequency as a geometrical function, within a broad frequency spectrum ranging from 100 to around 4000 Hz.
As a starting point, a resonator is designed with a neck 5 mm long (L = 0.005 m) and 2.5 mm wide (W = 0.0025 m), with an initial inner radius of 4 mm ( = 0.004 m). Based on this basic configuration, a controlled parameterisation of the inner radius, , is performed, gradually varying its value up to a maximum of 10 cm. This variation allows a wide spectrum of resonance frequencies to be covered, from approximately 100 Hz (for larger radii) to 4000 Hz (for smaller radii).
In order to reduce computational costs without compromising the resolution of the study, the variation step of parameter was optimised according to its value, using increments of 0.1 mm for radii less than 1 cm, steps of 0.5 mm between 1 cm and 5 cm, and an increment of 1 mm for radii greater than 5 cm. This allowed the total number of simulations to be reduced from 960 to 191 without loss of representativeness in the frequency range considered (see Table 1).

Table 1.
Strategy for discretising the parameter for optimising the numerical model number of solutions.
Thus, for a single value of , two resonance frequency values are obtained: on the one hand, the numerical result of the resonance frequency , and on the other hand, the theoretical frequency is calculated using Equation (1) (see Figure 4).
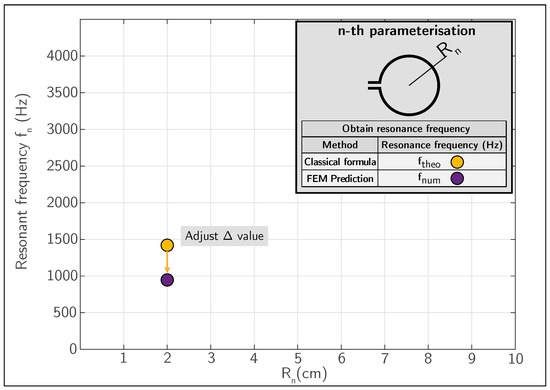
Figure 4.
Comparison between and and adjustment for a given resonator configuration.
Figure 4 shows a simplified comparison between two resonant frequencies obtained for the same resonator; the theoretical value (), represented by an orange dot, is compared against the numerical value ().
The comparison between both results allows the deviation between both estimates to be quantified for each geometric configuration. Based on this difference, the value of the factor is adjusted iteratively in order to achieve a match between both frequencies. This procedure is replicated for each of the parameterised geometric configurations, allowing an adjusted correction factor to be associated with each value of .
In the next phase of the process, the neck length (L) is parameterised, limiting it to a more restricted range in order to adhere to the geometric constraints of the scatterer established as the baseline element of the study.
In addition to the parameterisation of the inner radius, the influence of the neck length L on the resonance frequency was explored. Although the present study was carried out in a more restricted frequency spectrum, due to the geometric constraints imposed by the design of the resonator itself, its inclusion contributes to the robustness of the methodological approach. The variation of L was carried out within the physical limits of the cavity, without exceeding the maximum depth available for the neck. This second parameterisation allowed the consistency of the correction factor adjustment procedure to be verified.
2.3. Experimental Validation in an Anechoic Chamber
Until now, the proposed methodology has assumed as a starting hypothesis that the numerically obtained frequency represents the reference value. It also states that the theoretical frequency can be adjusted to its value by modifying . However, it is worth wondering whether this assumption is really valid. Therefore, the aim of this section is to provide experimental evidence to test this hypothesis and, if necessary, reinforce the robustness of the proposed approach.
Figure 5 depicts different views of the 3D-printed SC-embedded resonators that have been used for validation. Figure 5a shows the front view of the four resonators; in Figure 5b they are shown from the top. Figure 5c presents the 3D-printed lids designed to close the resonator and insert the measuring microphone.
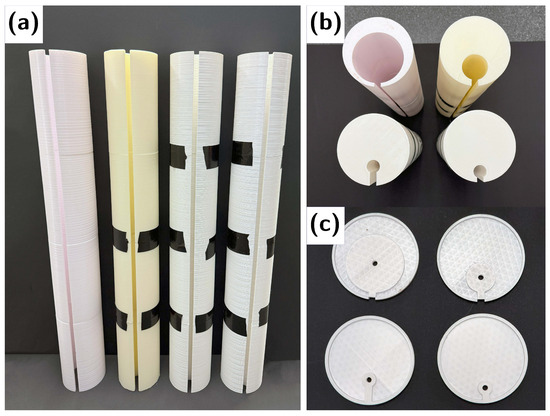
Figure 5.
Three-dimensionally printed resonators used in experimental validation: (a) front view of the four prototypes, (b) top view showing the necks and internal cavities, and (c) detail of the top covers designed to close the cavity and support the microphone.
As mentioned above, in order to experimentally verify the resonance value of the acoustic scatterers, constant values are established for the outer radius of the scatterer () and for the neck width (W). Subsequently, the values of the inner radius () and the neck length (L) are modified for the four study resonators. The resonators, shown in Figure 5, were manufactured using 3D printing technology. They have a height of 80 cm, an outer radius of 11 cm and a resonator opening W of 1 cm. The design characteristics of each of the resonators are shown in Table 2.

Table 2.
Values of the variable geometric parameters of the printed samples for experimental evaluation.
The material used to print the designs is PLA+ (PLA reinforced with calcium carbonate), a material dense enough to be considered completely rigid in air [31], with an acoustic velocity of around 2000 m/s and a density of 1260 , and therefore an acoustic impedance of 2.5 MRayls, 6000 times greater than that of air at 20 °C [32].
Due to the restrictions imposed by the printing device used, the resonator configuration is subdivided into four 20 cm high components, which are joined to achieve a total height of 80 cm. The printing parameters used are those shown in Table 3.

Table 3.
Printing characteristics of the resonators.
The test resonator resonance frequencies were measured in the anechoic chamber at the Centro de Tecnologías Físicas of the Universitat Politècnica de València, following the experimental setup shown in Figure 6.
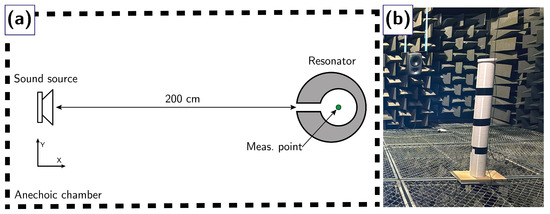
Figure 6.
(a) Diagram of the experimental setup showing the position of the resonator relative to the sound source. (b) Photograph of the resonator placed in the anechoic chamber in front of the sound source.
The diagram presented in Figure 6a shows a simplified measurement setup, where the 3D-printed resonator is placed inside the anechoic chamber in normal incidence of the sound source. Figure 6b shows a picture of one of the resonators inside the anechoic chamber.
The resonator is positioned so as to obtain normal incidence on its linear aperture, placing it at a distance of 2 m from the sound source. The device used to generate sound in this study is a studio loudspeaker (Genelec, 8040BPM, Iisalmi, Finland), which exhibits a frequency response of ±2 dB between 50 Hz and 20 kHz.
The base of the resonator rests on a flat wooden board, and its upper boundary is closed with a 3D-printed lid (see Figure 5c). The lid allows the microphone to be inserted and centred in the resonance chamber; it also closes the interior volume of the resonator, leaving it open only through its linear aperture.
A data acquisition system (Bruel & Kjær, PULSE Type 3560-C, Nærum, Denmark) is used both to control sound emission and to receive it using a Prepolarised array microphone (Bruel & Kjær, Type 4935, Nærum, Denmark), which is small enough to be inserted inside the resonators (Figure 7b).
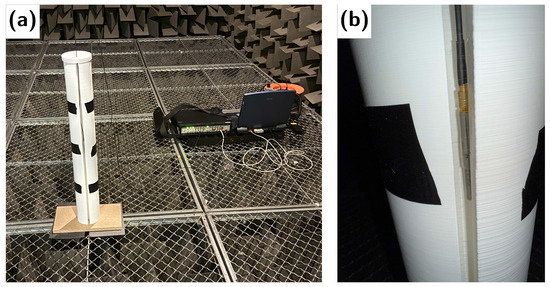
Figure 7.
(a) Photograph of the resonator mounted on the camera and PULSE measurement system. (b) Detail of the microphone placed inside a resonator.
In Figure 7a, the resonator and the measuring equipment can be observed in their respective positions in the anechoic chamber. Figure 7b shows the microphone inserted inside the resonator in a measurement position.
To carry out the measurements, continuous white noise is emitted from the sound source and the sound pressure level inside the resonator is measured. Subsequently, three measurements are taken in each resonator at different heights within the resonance chamber: one at the top, one at the bottom and one in the middle.
The PULSE system performs a fast Fourier transform of the microphone signal in the frequency range between 1 and 5000 Hz, performing more than 1000 logarithmic averages for each measurement carried out in order to guarantee the acquisition of steady-state results. Measurements obtained are processed using MATLAB® 24.1 software to obtain the results presented in the following section.
3. Results and Discussion
This section is organised into two subsections. First, a study based on four experimental resonators is presented, the purpose of which is to verify the hypothesis that considers numerical prediction as a reference value. In the second case, the methodology described in Section 2.2 is implemented and the results obtained are presented, including an abacus that facilitates the selection of the most appropriate correction factor based on the target resonance frequency of the resonator.
3.1. Relationship Between , and the Experimental Result
As already explained, the proposed procedure consists of adjusting the resonance frequency obtained using the Helmholtz equation () by modifying the value of the correction factor in a resonator with a full-height rectangular cross-section neck and circular cross-section cavity. The objective is for this frequency to closely match the one that is obtained by numerical modelling using the finite element method (). This approach takes the value of () as a reference, assuming that it reproduces the actual acoustic resonance response of the system more accurately.
In order to evaluate the validity of the proposed hypothesis, the results obtained from comparing the experimental measurement of the resonance frequency of four SC-embedded resonators (acoustic scatterers with integrated resonators) with the predictions obtained through theoretical calculation () and numerical modelling () are presented below.
Figure 8 presents the results for all four resonators. The experimental measurements obtained in the anechoic chamber are shown as solid black curves (), while the numerical model predictions are represented in red with dashed lines (). Each subfigure also includes a marker indicating the theoretical resonance frequency derived from Helmholtz’s formula (). Subfigures (a) through (d) correspond to resonators No. 1 to No. 4, respectively. Overall, there is a strong agreement between the experimental data and the numerical predictions, whereas the theoretical estimates show notable deviations. Table 4 summarizes the percentage deviations between each approximation and the experimentally measured values.
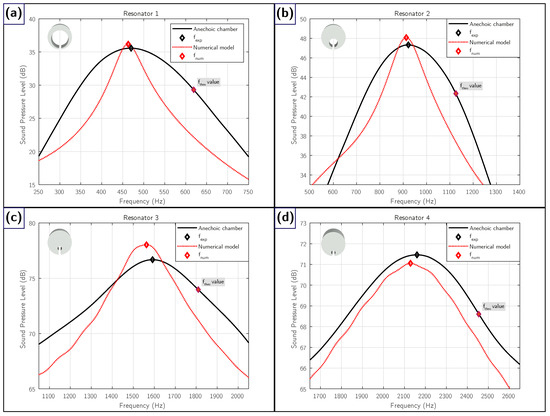
Figure 8.
Results of the experimental measurement of resonance inside the chamber for the four resonators. The experimental values (solid black curve) are compared with the theoretical prediction () and numerical modelling (): (a) Resonator 1. (b) Resonator 2. (c) Resonator 3. (d) Resonator 4.

Table 4.
Resonance frequencies obtained experimentally () for the four resonators and percentage deviations from the predictions of the theoretical model ( (%)) and the numerical model ( (%)) against experimental data.
Experimental results provide tangible evidence that the numerical prediction () represents an accurate and realistic estimate of the resonance frequency. However, although theoretical formulation can be adjusted by a constant correction factor, usually scoring between 1.6 and 1.8, the data obtained shows that this approximation is insufficient to accurately cover the entire range of design frequencies. This limitation justifies the need to analyse in depth the dependence of the correction factor and frequency, an aspect that is addressed in the following section.
3.2. Dependency of the Correction Factor and Design Frequency
The most significant finding emerging from this research is the observation that the use of a single value for the correction factor applied to the effective length of the resonator neck, even within a limited range as a common practice (1.6–1.8), is not an appropriate practice. The data obtained shows a significant correlation between the factor in question and the resonator design frequency, as illustrated in Figure 9.
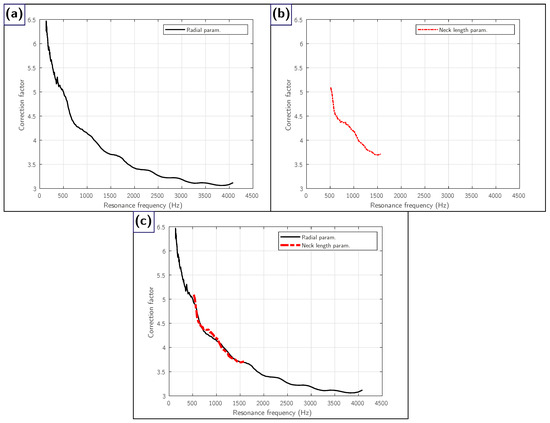
Figure 9.
(a) Correction factor obtained by parameterising the internal radius ; (b) by parameterising the neck length L and (c) comparison of both parameterisations in their overlapping range.
Figure 9 shows the evolution of the correction factor as a function of resonance frequency, obtained from two parametric studies on the geometry of the SC-embedded resonator. Figure 9a shows the curve corresponding to the variation in the internal radius of the cavity, keeping the dimensions of the neck constant. This configuration allows a wide range of resonance frequencies to be explored, from approximately 100 to 4000 Hz. Figure 9b analyses the influence of neck length L, keeping the volume of the cavity constant. In this case, the frequency range is more limited, between 500 and 1500 Hz, due to the geometric restrictions imposed by the volume and size of the scatterer. Figure 9c shows a significant coincidence between both parameterisations in the shared frequency range, which lends solidity and coherence to the proposed methodology.
Based on the data obtained through numerical simulation, a chart was generated (see Figure 10) that allows the correction factor value to be determined based on the resonance frequency. The curve fit obtained exhibits an exceptionally high degree of correlation (R2 = 0.999), ensuring outstanding accuracy in its application. As evidenced in the analysis performed, applying the value derived from the abacus yields a match with the numerical prediction with a margin of error of less than 5%.
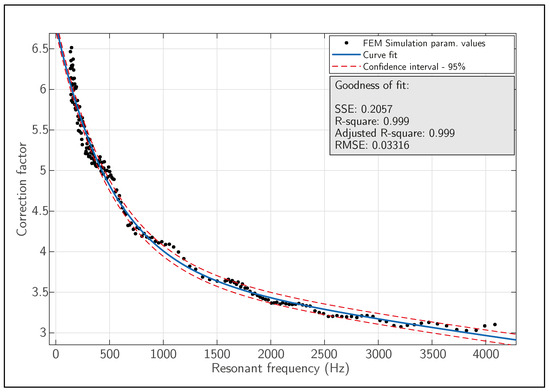
Figure 10.
Abacus developed for selecting the correction factor based on the target resonance frequency for SC-embedded Helmholtz resonators.
Figure 10 shows the curve fit of the numerical parameterisation to a continuous function, along with the goodness of fit.
Based on adjustment of numerical data, an empirical expression has been obtained that allows the value of the correction factor to be calculated as a function of the design frequency. This formulation is a direct alternative to the use of the abacus and allows the correction factor to be incorporated into automated calculations or iterative design processes.
where f is the design frequency and is the proposed correction factor for the adjustment correlated with the numerical prediction.
Based on data obtained using the proposed empirical expression (Equation (2)) or through the use of the abacus (Figure 10), the experimental cases described above have been re-analysed. A comparison has been made between the resonance frequency predicted by the Helmholtz formula using a constant correction factor and that obtained with the proposed variable factor. The results obtained show a notable improvement in accuracy, which is reflected in a significant reduction in the percentage deviation in all the cases analysed. In particular, for low- and medium-frequency resonators, the error is reduced by up to an order of magnitude. For a detailed comparison, see Table 5.

Table 5.
Comparative resonance frequency results for the four experimental cases, including values obtained through numerical simulation, experimental measurement, and theoretical modelling, both with a constant correction factor and with a variable factor depending on frequency. The percentage deviations from and are shown.
Table 5, which is split in two sections, shows four cases of resonators studied theoretically, numerically and experimentally. The top section shows a schematic diagram of the resonator seen in cross-section on the first column. The second column shows resonance frequencies obtained by the different methods studied in this research (). On the lower section of Table 5, percentage deviations of the theoretical frequency () with respect to the numerical frequency () are calculated, assuming the latter as a reference for comparison. The value of is compared to this same reference. In addition, the same comparisons are made, establishing as a reference the frequency measured in the anechoic chamber ().
As a practical example, we will analyse the values shown in Table 5 corresponding to resonator No. 1. The numerical resonance frequency is 463 Hz, the experimental one is 470 Hz, the resonance frequency predicted by Equation (1) is 638 Hz, and finally the frequency obtained by applying the improved correction factor is 447 Hz. As for the percentage variations, taking the numerical frequency as a reference, the variation in the classical formula (Equation (1)) is 37.8%. If the correction factors shown in the abacus are taken into account, the percentage variation drops to 3.5%. Considering the experimental results, the variations have been 35.7% and 4.9% respectively. Hence, we observe that the new method has reduced the error substantially.
In the last case studied, corresponding to resonator No. 4, the dimensions of the neck decrease and approach those of the resonant cavity, and the predictive accuracy deteriorates, indicating that the resonator is undergoing degeneration and no longer exhibits the characteristic behaviour of a Helmholtz resonator.
The use of the proposed correction factor substantially minimises the prediction error of the resonance frequency. In the most unfavourable scenario, corresponding to high frequency, the percentage discrepancy is reduced nearly by half. At low and medium frequencies, this improvement is even more significant, with reductions reaching up to an order of magnitude compared to the use of a constant factor.
In order to provide general validation of the proposed model for selecting correction factor values, the comparative study was expanded to include a broader set of cases generated by numerical simulation.
Figure 11 shows the relationship between the frequencies predicted by the two theoretical approaches, the classical approach with a constant factor () and the new approach with the proposed variable factor () compared to the reference values obtained by numerical modelling (). The proximity of the points corresponding to to the y = 0 line demonstrates the substantial improvement in the accuracy of the proposed model.
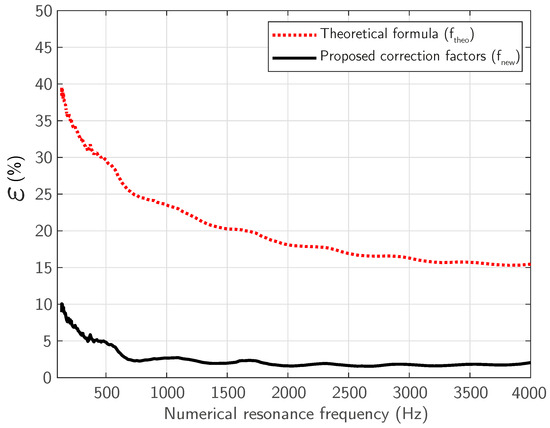
Figure 11.
Percentage difference between the numerical model resonant frequency () and both the classical formula resonant frequencies () and the resonant frequencies applying the proposed correction factor curve ().
The results obtained confirm that the proposed methodology used to calculate the effective length of the resonator neck, based on a variable correction factor dependent on frequency, allows for very high precision in estimating the resonance frequency. In contrast, the use of a constant value for this factor tends to systematically overestimate the predicted frequency, with a higher error percentage at low to medium frequencies. The authors have also ensured that this methodology is also applicable to scatterers in a periodic lattice configuration.
In summary, the findings of this research validate the proposed approach and facilitate the availability of a more accurate and adaptable predictive tool, particularly beneficial for the design of SC-embedded scatterers integrated into acoustic barriers based on Sonic Crystal technology, within a wide spectrum of operating frequencies.
4. Conclusions
This study addresses a fundamental limitation in the design of Helmholtz resonators intended for application in Sonic Crystal-based noise barriers. In such configurations, the accuracy of predicting the resonance frequency commonly calculated by the classical models is critically important. Although the traditional expression for resonance calculation has been widely used for its simplicity, its direct application is inadequate even for the case of isolated resonators, especially when complex geometries are introduced or precise control of the design frequency is sought.
In response to this limitation, a new frequency-dependent correction factor has been formulated to adjust the classical Helmholtz resonance expression to more realistic conditions of use. This factor has been determined from a combination of numerical simulations and experimental validation, demonstrating a significant improvement in the predictive accuracy of the model, even before considering its integration into periodic configurations.
In the field of acoustics research, an abacus of correction factor values has been developed as a practical tool for the sizing of tuned, SC-embeddable resonators. This development facilitates its subsequent application to more complex acoustic structures, such as Sonic Crystals, thereby contributing significantly to the advancement of knowledge in the field. This is a necessary first step towards the optimised design of passive solutions capable of attenuating sound in specific frequency bands with greater precision and efficiency.
Numerical results have confirmed that, in array configurations, the resonance frequency is accurately predicted. Future work will focus on validating these findings through in situ experimental measurements.
In summary, acoustic challenges in urban environments that cannot be effectively addressed using traditional noise barriers (due to their limited capacity to attenuate low-frequency noise, such as that produced by heavy machinery, dense traffic or industrial systems) can be tackled more efficiently through the use of Sonic Crystal-based barriers incorporating Helmholtz resonators tuned according to the methodology proposed in this work.
Author Contributions
Conceptualization: L.O.-F., J.M.B.P.-S., J.V.S.-P. and S.C.-I.; methodology: L.O.-F., J.M.B.P.-S., J.V.S.-P. and S.C.-I.; software: L.O.-F., J.M.B.P.-S. and S.C.-I.; validation: L.O.-F., J.M.B.P.-S., J.V.S.-P. and S.C.-I.; formal analysis: L.O.-F., J.M.B.P.-S. and S.C.-I.; investigation: L.O.-F., J.M.B.P.-S., J.V.S.-P. and S.C.-I.; resources: J.M.B.P.-S.; data curation: L.O.-F., J.M.B.P.-S. and S.C.-I.; writing—original draft preparation: L.O.-F., J.M.B.P.-S., J.V.S.-P. and S.C.-I.; writing—review and editing: L.O.-F.; visualization: L.O.-F., J.M.B.P.-S., J.V.S.-P. and S.C.-I.; supervision: J.M.B.P.-S. and S.C.-I.; project administration: S.C.-I.; funding acquisition: J.M.B.P.-S. All authors have read and agreed to the published version of the manuscript.
Funding
This research was funded by Conselleria de Educación, Cultura, Universidades y Empleo de la Generalitat Valenciana, grant number CIAPOT/2023/003.
Institutional Review Board Statement
Not applicable.
Informed Consent Statement
Not applicable.
Data Availability Statement
Data is available from the authors upon request.
Conflicts of Interest
The funders had no role in the design of the study; in the collection, analyses, or interpretation of data; in the writing of the manuscript; or in the decision to publish the results.
References
- Chen, J.; Ma, H. An impact study of acoustic environment on users in large interior spaces. Build. Acoust. 2019, 26, 139–153. [Google Scholar] [CrossRef]
- Leventhall, H.G. Low frequency noise and annoyance. Noise Health 2004, 6, 59–72. [Google Scholar] [PubMed]
- Song, C.; Li, H.; Ma, H.; Han, T.; Wu, J. Effects of Noise Type and Noise Sensitivity on Working Memory and Noise Annoyance. Noise Health 2022, 24, 173–181. [Google Scholar] [CrossRef] [PubMed]
- Yang, L.; Gutierrez, D.E.; Guthrie, O.W. Systemic health effects of noise exposure. J. Toxicol. Environ. Health Part B 2023, 27, 21–54. [Google Scholar] [CrossRef]
- European Environment Agency. Environmental Noise in Europe—2025; Publications Office: Luxembourg, 2025. [Google Scholar] [CrossRef]
- Zhou, H.; Molesworth, B.R.C.; Burgess, M.; Hatfield, J. The effect of moderate broadband noise on cognitive performance: A systematic review. Cogn. Technol. Work 2023, 26, 1–36. [Google Scholar] [CrossRef]
- Rojas-Sánchez, O.A.; Ochoa-Villegas, J.; Marín, D.; Piñeros-Jiménez, J.G.; Rodriguez-Villamizar, L.A. Asociación entre la exposición a ruido ambiental y la calidad del sueño de adultos residentes en Medellín, Colombia, 2022: Un estudio exploratorio. Cad. Saúde Pública 2025, 41, e00233423. [Google Scholar] [CrossRef]
- Ameen, M.H.; Jumaah, H.J.; Kalantar, B.; Ueda, N.; Halin, A.A.; Tais, A.S.; Jumaah, S.J. Evaluation of PM2.5 Particulate Matter and Noise Pollution in Tikrit University Based on GIS and Statistical Modeling. Sustainability 2021, 13, 9571. [Google Scholar] [CrossRef]
- Chijioke, A.M.; Mathias, U.U.; Ifeanyi, N.V.; George, I.C. Noise in a Nigerian University. J. Environ. Pollut. Hum. Health 2019, 7, 56–61. [Google Scholar]
- Quader, M.A.; Rahman, M.M.; Chisty, M.A.; Saeed Al Hattawi, K.; Alam, E.; Islam, M.K. Evaluation of noise pollution impact on health in Dhaka city, Bangladesh. Front. Public Health 2024, 12, 1477684. [Google Scholar] [CrossRef]
- Ekici, I.; Bougdah, H. A Review of Research on Environmental Noise Barriers. Build. Acoust. 2003, 10, 289–323. [Google Scholar] [CrossRef]
- Laxmi, V.; Thakre, C.; Vijay, R. Evaluation of noise barriers based on geometries and materials: A review. Environ. Sci. Pollut. Res. 2021, 29, 1729–1745. [Google Scholar] [CrossRef] [PubMed]
- Lokhande, S.; Sakhare, D.S.; Dange, S.S.; Jain, M.C. A Short Review of Road Noise Barriers Focusing on Ecological Approaches. Int. J. Eng. Technol. Sci. 2021, 2021, 1–17. [Google Scholar]
- Tourin, A.; Fink, M.; Derode, A. Multiple scattering of sound. Waves Random Media 2000, 10, R31–R60. [Google Scholar] [CrossRef]
- Martínez-Sala, R.; Sancho, J.; Sánchez-Pérez, J.V.; Gómez, V.; Llinares, J.; Meseguer, F. Sound attenuation by sculpture. Nature 1995, 378, 241. [Google Scholar] [CrossRef]
- Sanchez-Perez, J.V.; Rubio, C.; Martinez-Sala, R.; Sanchez-Grandia, R.; Gomez, V. Acoustic barriers based on periodic arrays of scatterers. Appl. Phys. Lett. 2002, 81, 5240–5242. [Google Scholar] [CrossRef]
- Ferdyan, E.; Handayani, D.; As’ad, S.; Ubaidillah, U.; Yahya, I. Use of sound attenuation with sonic crystal structures in residential areas due to highways. J. Appl. Eng. Sci. 2023, 21, 785–794. [Google Scholar] [CrossRef]
- Hu, X.; Chan, C.T.; Zi, J. Two-dimensional sonic crystals with Helmholtz resonators. Phys. Rev. E 2005, 71, 055601. [Google Scholar] [CrossRef]
- Castiñeira-Ibáñez, S.; Rubio, C.; Romero-García, V.; Sánchez-Pérez, J.V.; García-Raffi, L.M. Design, Manufacture and Characterization of an Acoustic Barrier Made of Multi-Phenomena Cylindrical Scatterers Arranged in a Fractal-Based Geometry. Arch. Acoust. 2012, 37, 455–462. [Google Scholar] [CrossRef]
- Romero-García, V.; Krynkin, A.; Garcia-Raffi, L.M.; Umnova, O.; Sánchez-Pérez, J.V. Multi-resonant scatterers in sonic crystals: Locally multi-resonant acoustic metamaterial. J. Sound Vib. 2013, 332, 184–198. [Google Scholar] [CrossRef]
- Panda, D.; Mohanty, A.R. The Influence of Cladded Resonators on Gradient-Based Sonic Crystals over the Traditional Sonic Crystals. J. Vib. Eng. Technol. 2022, 11, 1077–1090. [Google Scholar] [CrossRef]
- Ahmed, R.; Ahmed, H. Understanding the Influence of Resonators on Frequency Band Gaps in Sonic Crystal Metamaterials. In Proceedings of the ASME 2021 Conference on Smart Materials, Adaptive Structures and Intelligent Systems, Virtual, 14–15 September 2021; SMASIS2021. American Society of Mechanical Engineers: New York, NY, USA, 2021. [Google Scholar] [CrossRef]
- Dosch, H.G.; Hauck, M. The Helmholtz resonator revisited. Eur. J. Phys. 2018, 39, 055801. [Google Scholar] [CrossRef]
- Elford, D.P.; Chalmers, L.; Kusmartsev, F.V.; Swallowe, G.M. Matryoshka locally resonant sonic crystal. J. Acoust. Soc. Am. 2011, 130, 2746–2755. [Google Scholar] [CrossRef]
- Radosz, J. Acoustic performance of noise barrier based on sonic crystals with resonant elements. Appl. Acoust. 2019, 155, 492–499. [Google Scholar] [CrossRef]
- Everest, F.A. Master Handbook of Acoustics, 7th ed.; McGraw-Hill Education: New York, NY, USA, 2022. [Google Scholar]
- Strutt, J.W. On the theory of resonance. Philos. Trans. R. Soc. Lond. 1871, 161, 77–118. [Google Scholar] [CrossRef]
- Vigran, T.E. Building Acoustics; CRC Press: Boca Raton, FL, USA, 2014. [Google Scholar] [CrossRef]
- COMSOL Multiphysics®; Version 6.3; COMSOL AB: Stockholm, Sweden, 2024.
- Berenger, J.P. A perfectly matched layer for the absorption of electromagnetic waves. J. Comput. Phys. 1994, 114, 185–200. [Google Scholar] [CrossRef]
- Antoniou, A.; Evripidou, N.; Giannakou, M.; Constantinides, G.; Damianou, C. Acoustical properties of 3D printed thermoplastics. J. Acoust. Soc. Am. 2021, 149, 2854–2864. [Google Scholar] [CrossRef]
- Kinsler, L.E.; Frey, A.R.; Coppens, A.B.; Sanders, J.V. Fundamentals of Acoustics, 4th ed.; Wiley: New York, NY, USA, 2000. [Google Scholar]
Disclaimer/Publisher’s Note: The statements, opinions and data contained in all publications are solely those of the individual author(s) and contributor(s) and not of MDPI and/or the editor(s). MDPI and/or the editor(s) disclaim responsibility for any injury to people or property resulting from any ideas, methods, instructions or products referred to in the content. |
© 2025 by the authors. Licensee MDPI, Basel, Switzerland. This article is an open access article distributed under the terms and conditions of the Creative Commons Attribution (CC BY) license (https://creativecommons.org/licenses/by/4.0/).


