1. Introduction
Determining and understanding the distribution of temperature fields within the crust, changes in heat flow values, and variations in the geothermal gradient in geothermal research are not only important for the study of geothermal genesis mechanisms, but also for the development and utilization of geothermal energy. In the exploration and development of geothermal resources, thermal reservoir temperature values are also an indispensable parameter for classifying the genesis types of geothermal resource classification, evaluating resource potential, and assessing geothermal development and utilization conditions [
1]. Furthermore, accurately predicting deep temperature is an important factor in evaluating geothermal potential [
2].
There are two main ways to obtain the temperature of the Earth’s interior: direct measurement and indirect prediction. Direct measurements are mainly obtained through borehole thermometry, which uses a large number of well temperatures to calculate heat flow and temperature–depth relationships to identify potential geothermal active zones [
3]. Indirect geothermometry, which relies on the relationship between rock–fluid conditions and formation temperatures, is an important component of geochemical analysis and geophysics [
4]. While indirect geothermometers can only provide a rough estimate of thermal storage temperature ranges, they are unable to match predicted temperatures to depth, let alone map out regional temperature field distributions. Temperature modelling methods based on geophysical detection include converting geophysical parameters into temperature fields using empirical formulas, calculating simulated subsurface temperature fields based on deep learning algorithms, estimating subsurface temperature fields through heat transfer models, and making corrections based on optimal temperature coefficients [
5]. However, temperature fields in unknown geological settings and depths using empirical formula parameters can lead on significant errors. Artificial neural network algorithm requires a sufficiently large number of samples. Heat conduction model demands precise prior information, and optimal temperature coefficient correction requires a sufficient number of boreholes for calibration.
The main factors influencing the conductivity of rocks deep in the crust are temperature and pressure, with conductivity increasing exponentially and predictably as temperature rises. High-temperature and high-pressure experiments have revealed that when rocks approach their melting point, their conductivity becomes several orders of magnitude higher than at room temperature, which in turn enhances the conductivity of dry rocks in the crust and upper mantle. Thus, their electrical structural characteristics mainly depend on the subsurface thermal state [
6].
The difference between hot dry rock mass and surrounding rock is mainly in temperature, and the temperature of the rock mass will affect its resistivity. Therefore, the geomagnetic method constructs a model of the conductivity structure from the shallow surface to the crust–mantle boundary by measuring the resistivity characteristics of the subsurface geological formations. This model further evaluates the geothermal system in the Gonghe region through the temperature field constraints imposed by the Curie surface [
7]. Meanwhile, geological structure, thermal properties of rocks, and the boundary conditions are crucial for establishing accurate thermal models [
8]. In the process of solving the heat conduction equation, the required thermal conductivity of rocks and heat generation rate parameters of rock layers can be measured using rock samples from wells. Additionally, the heat generation rate of radioactive elements in upper crustal rock layers can be deduced from radioactive element measurements. Consequently, known temperature boundary conditions can be used to determine the distribution of the geothermal temperature field with higher accuracy.
Zhang [
9] utilized continuous temperature measurement logs from multiple boreholes, along with extensive test data on thermal conductivity and heat generation rates from core samples, forming the data foundation for calculating the temperature distributions in the deep crust. Employing finite element numerical simulation methods and steady-state heat conduction theory, they analyzed the temperature-depth profiles of strata below the depths reached by boreholes. Wang et al. [
10] examined geothermal heat flow distribution in the Gonghe Basin and surrounding regions using gravity and magnetic data. They simulated temperature fields and heat flow distributions based on different models considering factors such as radiogenic heat generation, basement depth, and heat sources. Zhang et al. [
5] performed fitting calculations of the basin’s deep temperature field based on acquired stratigraphic structures and borehole temperature measurement data.
In this study, the interface inversion using regional aeromagnetic data was carried out to delineate the regional Curie isothermal surface. Leveraging magnetotelluric sounding data, a three-dimensional inversion of the entire Gonghe Basin was carried out to establish the correlation between resistivity and temperature. The integrated Curie isothermal surface and certain resistivity anomalies were used as boundary conditions. A three-dimensional model was constructed by integrating the sedimentary cover information obtained from geothermal geological and regional geophysical surveys. Thermal parameters include the thermal conductivity of sedimentary layers and Middle–Late Triassic granite. A three-dimensional temperature field model was constructed based on the integrated geophysical–geothermal parameters and covered the entire Gonghe Basin at a depth of 0–25 km. This model was constructed using the adaptive finite-element method [
11], with temperature data from known wells as constraints, thereby providing a theoretical foundation for regional geothermal exploration.
2. Regional Geological Background
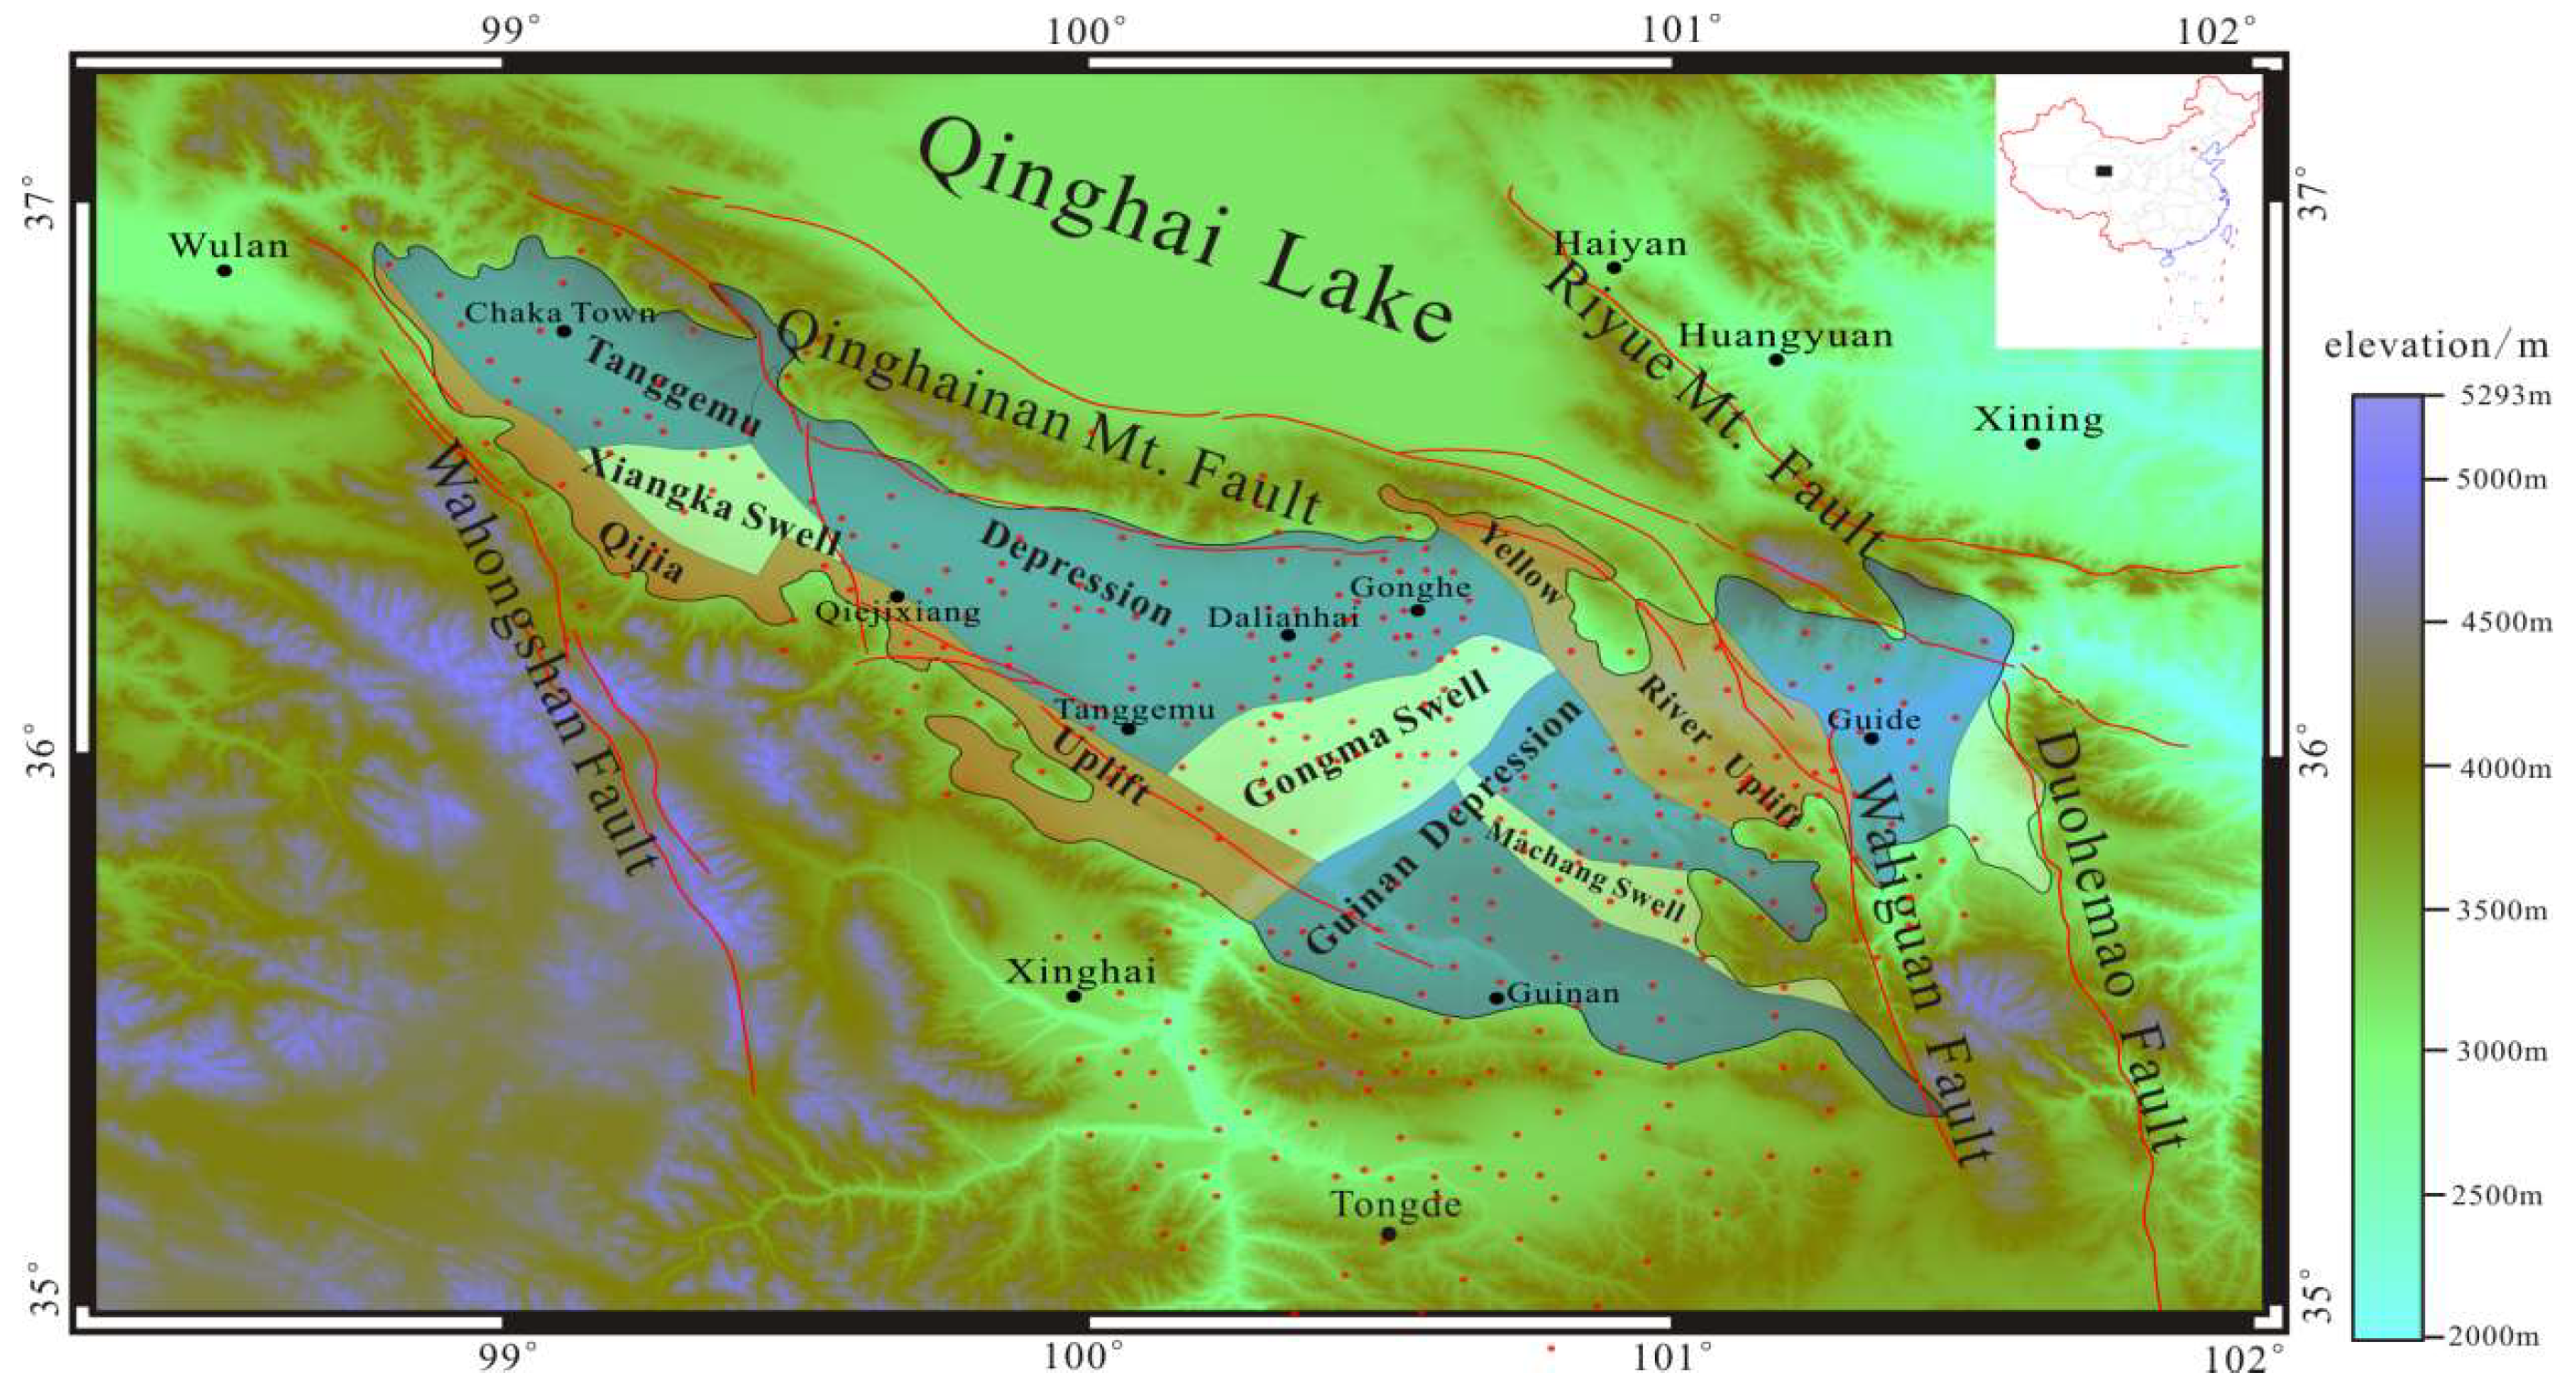
The Gonghe Basin is located in the western extremity of the West Qinling Orogenic Belt, northeast of Qinghai Province. It lies north of the Qinghai Lake and south of the Yellow River Longyangxia Reservoir, with geographic coordinates spanning from 99° to 101.5° east longitude and 35.5° to 37.2° north latitude. As the third-largest basin in Qinghai Province, the Yellow River traverses it along its short axis, flowing from southwest to northeast [
12]. The boundaries of its geological and geomorphological units are mainly defined by faults trending NW, NWW and near SN (
Figure 1).
The Gonghe Basin is located in the important junction position where several tectonic zones meet and transform. It is encircled by folded and uplifted mountains, including the Zongwulong-Qinghai South Mountain to the north, Guinan South Mountain to the south, and Hot Spring-Wahong Mountain to the west. The northern and southern boundaries are, respectively, delineated by the NWW oriented Zongwulong Mountain-Qinghai South Mountain and Guinan South Mountain pre-mountain retrograde and right-lateral slip faults. Meanwhile, the eastern and western boundaries are marked by the NNW oriented Duohemao and Wahong Mountain-Hot Springs right-lateral slip faults, giving the basin a rhombus-shaped planar geometry.
Based on available geophysical and drilling data from the Gonghe Basin, the Jurassic and Cretaceous strata are generally absent within the basin. Since the Late Pleistocene, the basin has experienced intense tectonic activity, characterized by mountain uplift and significant basin subsidence. This has led to the deposition of thick Tertiary and Quaternary sediments, as well as the exposure of Paleo-Neoproterozoic Xining Formation, Linxia Formation, Xianshuihe Formation, and the Quaternary sedimentary strata, which are widely distributed in the area. These sedimentary layers can reach a maximum thickness of 6000 to 7000 m. The basement of the Gonghe Basin primarily consists of shallow metamorphic strata from the Pre-Triassic Period and neutral acidic rocks from the Indo-Yanshan Period, which are extensively exposed at the highest elevations of the surrounding mountains.
3. Geophysical Data Inversion and Imaging
3.1. Curie Isothermal Surface Inversion
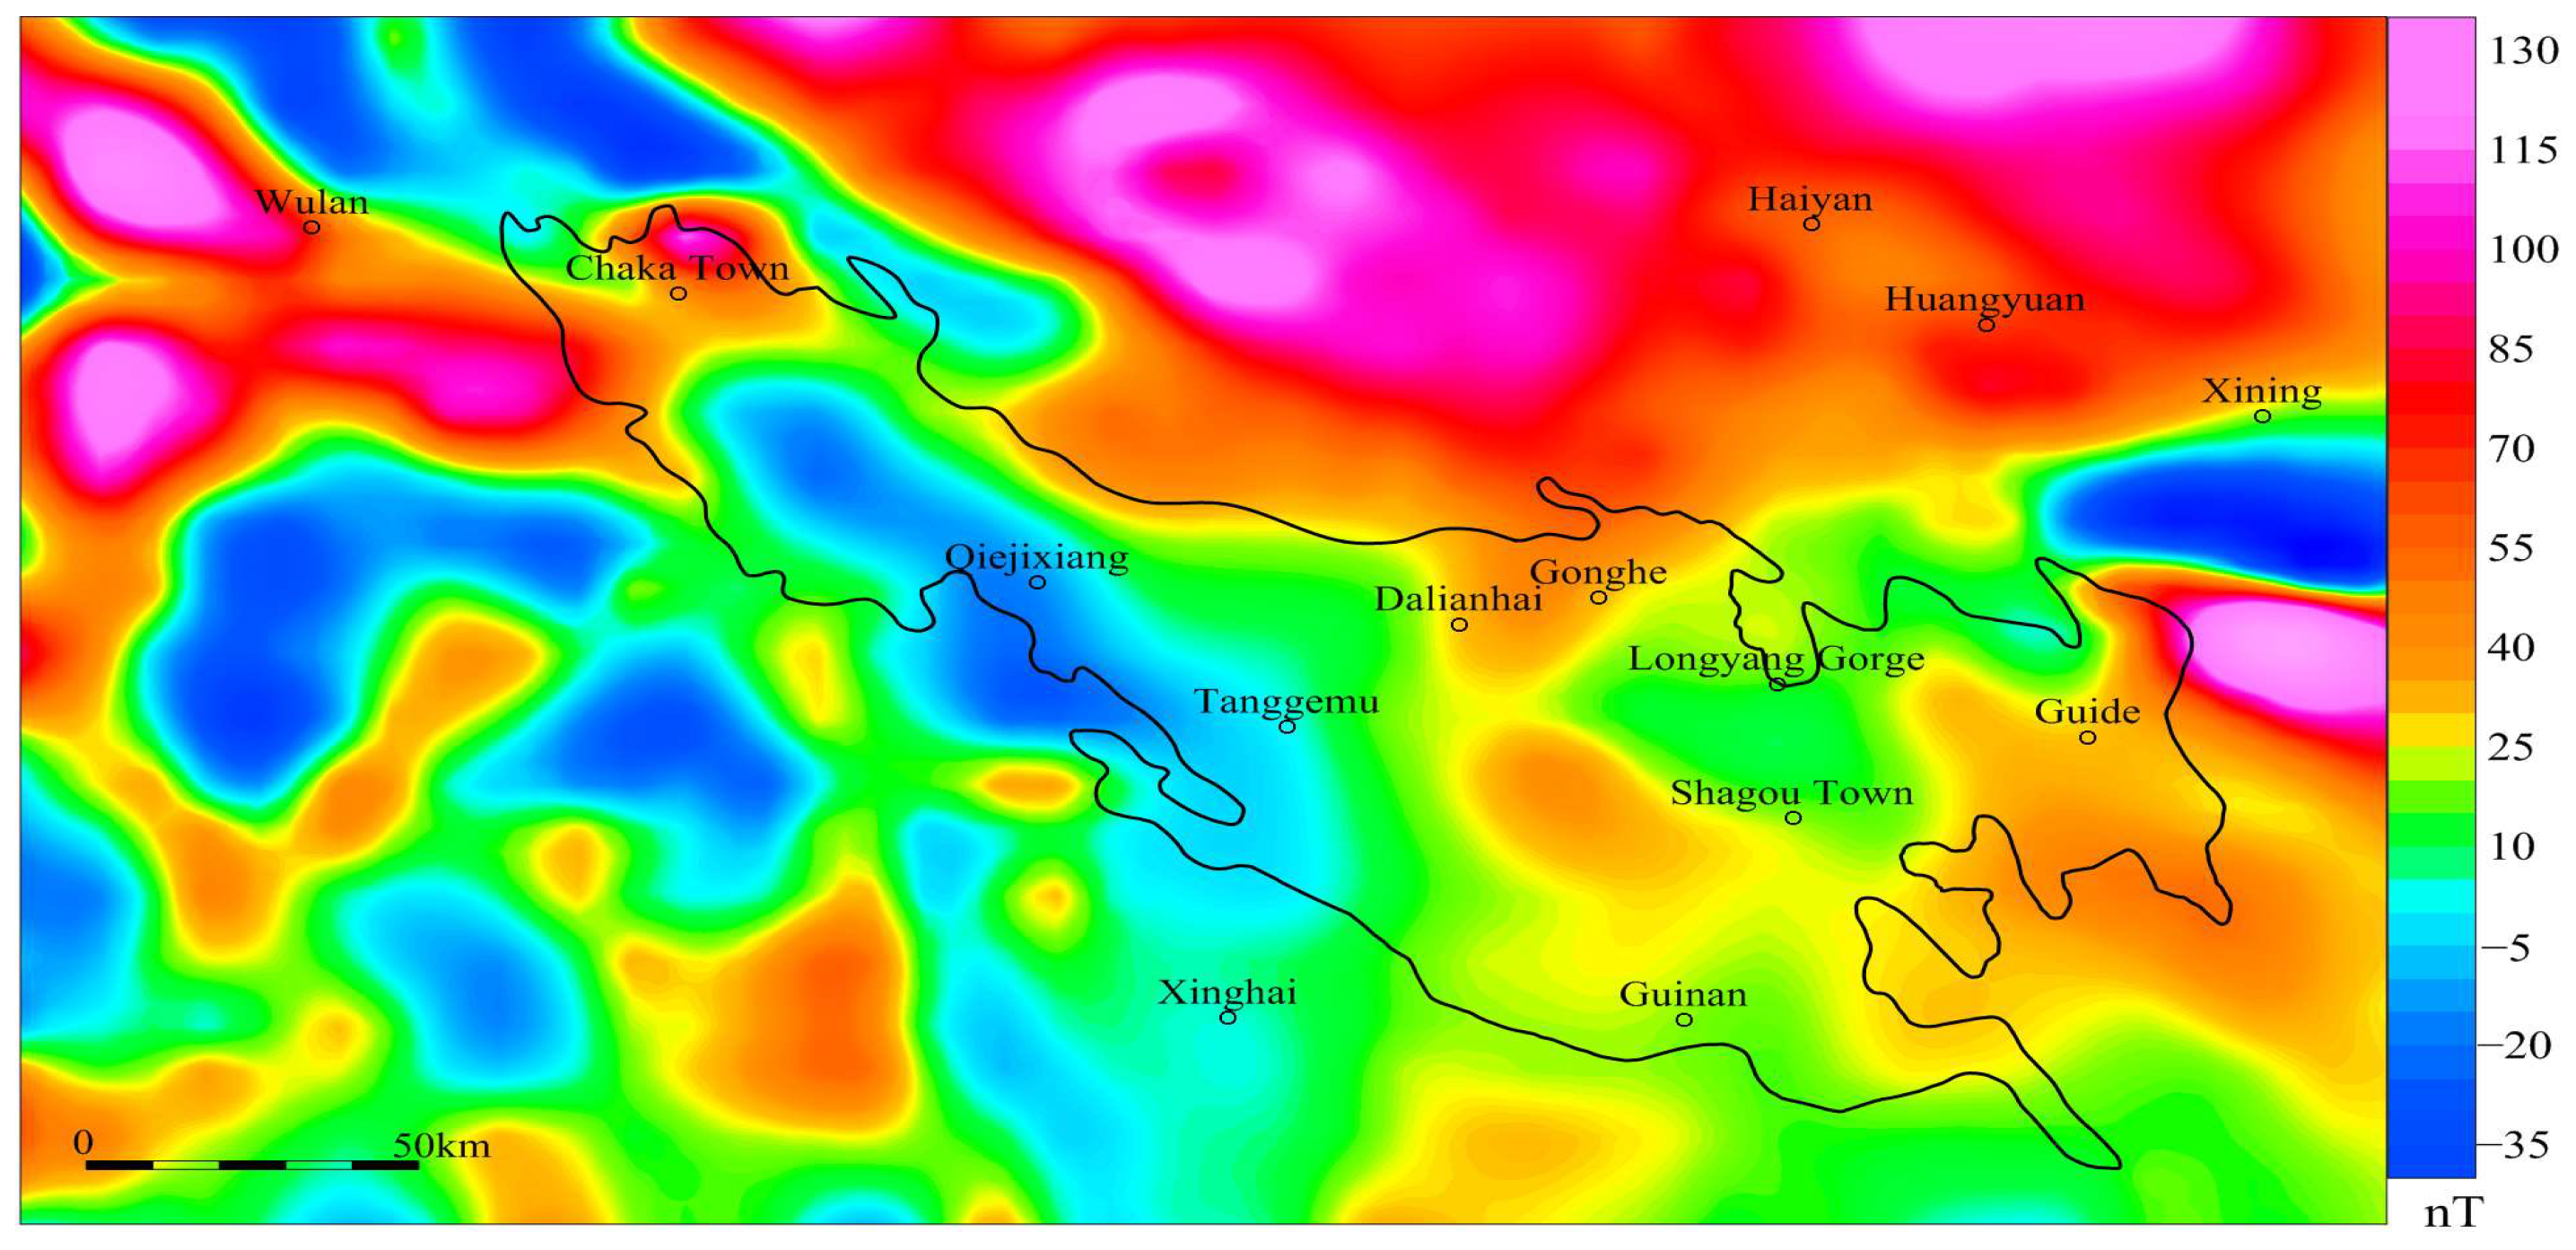
The aeromagnetic anomaly for the Gonghe Basin is based on 10 km × 10 km grid data, revealing relatively smooth magnetic anomaly morphology (
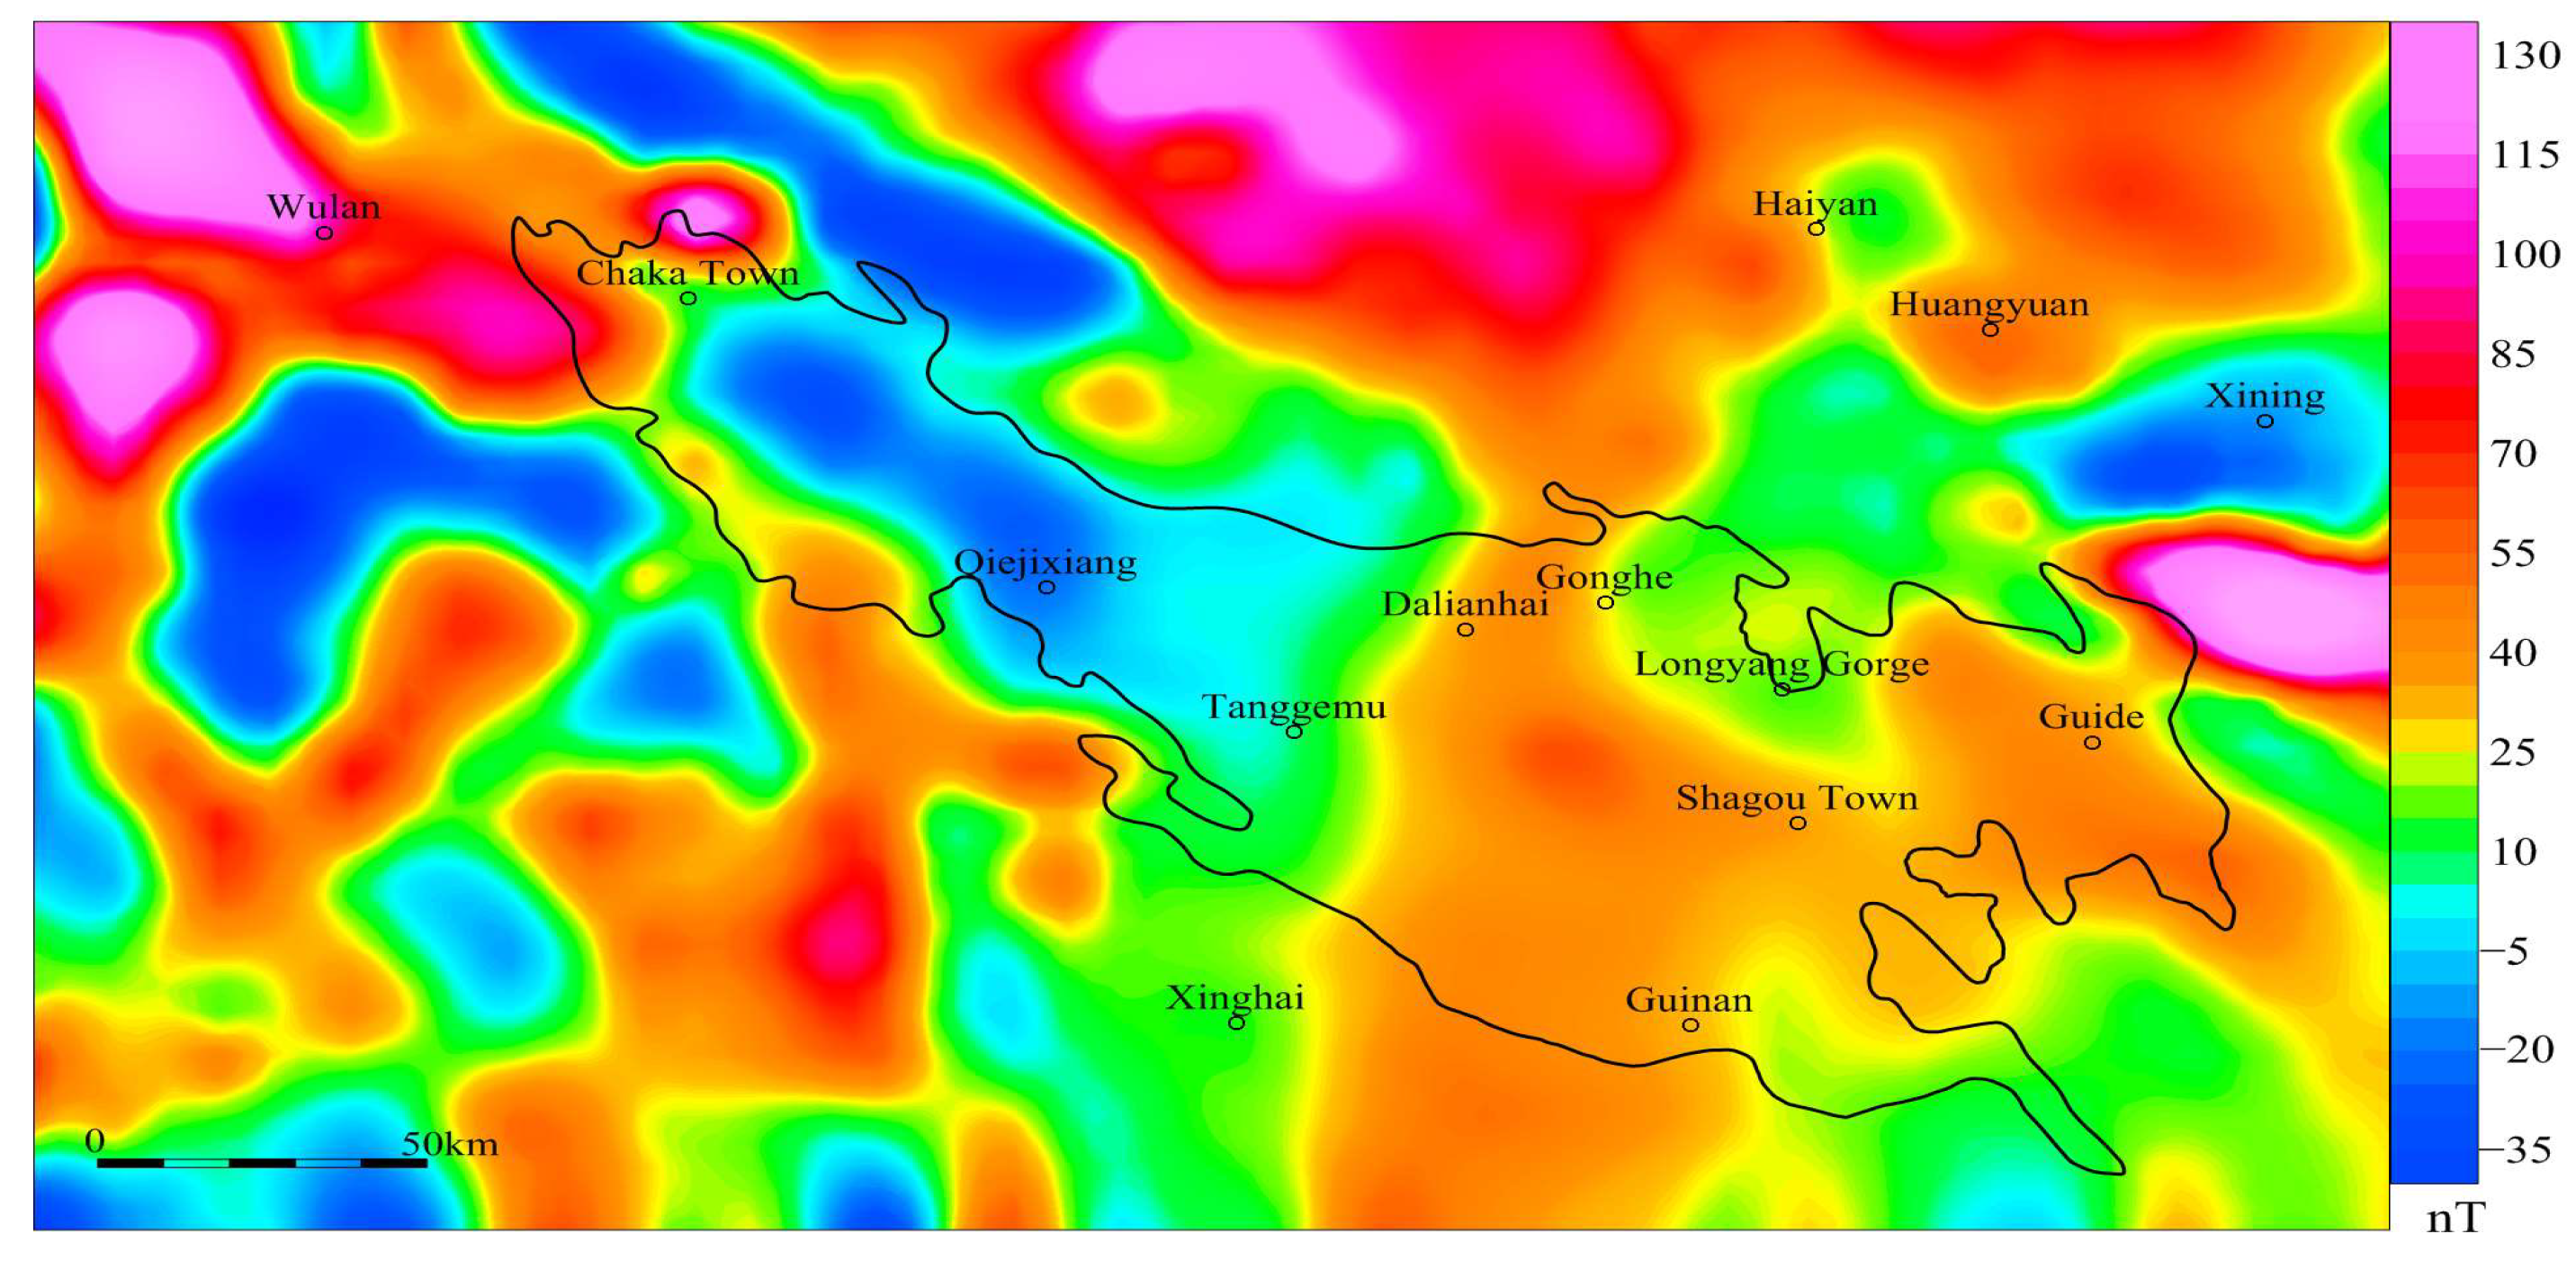
Figure 2). The anomalies range from −25 to 110 nT, exhibiting minimal variation. The high-value region is concentrated in the northwestern part of the basin, particularly around Chaka and the Gonghe-Dalian Hai area. The orientation of the aeromagnetic anomalies is mainly NW, aligning with the main tectonic trend of the Gonghe Basin. Anomalous contours are generated by mitigating the effects of oblique magnetization through magnetic polarization techniques (
Figure 3). The overall distribution of the magnetic anomaly after polarization shows lower values in the west and higher values in the east, with the Gonghe-Guinan region displaying notably higher magnetic anomalies compared to other areas.
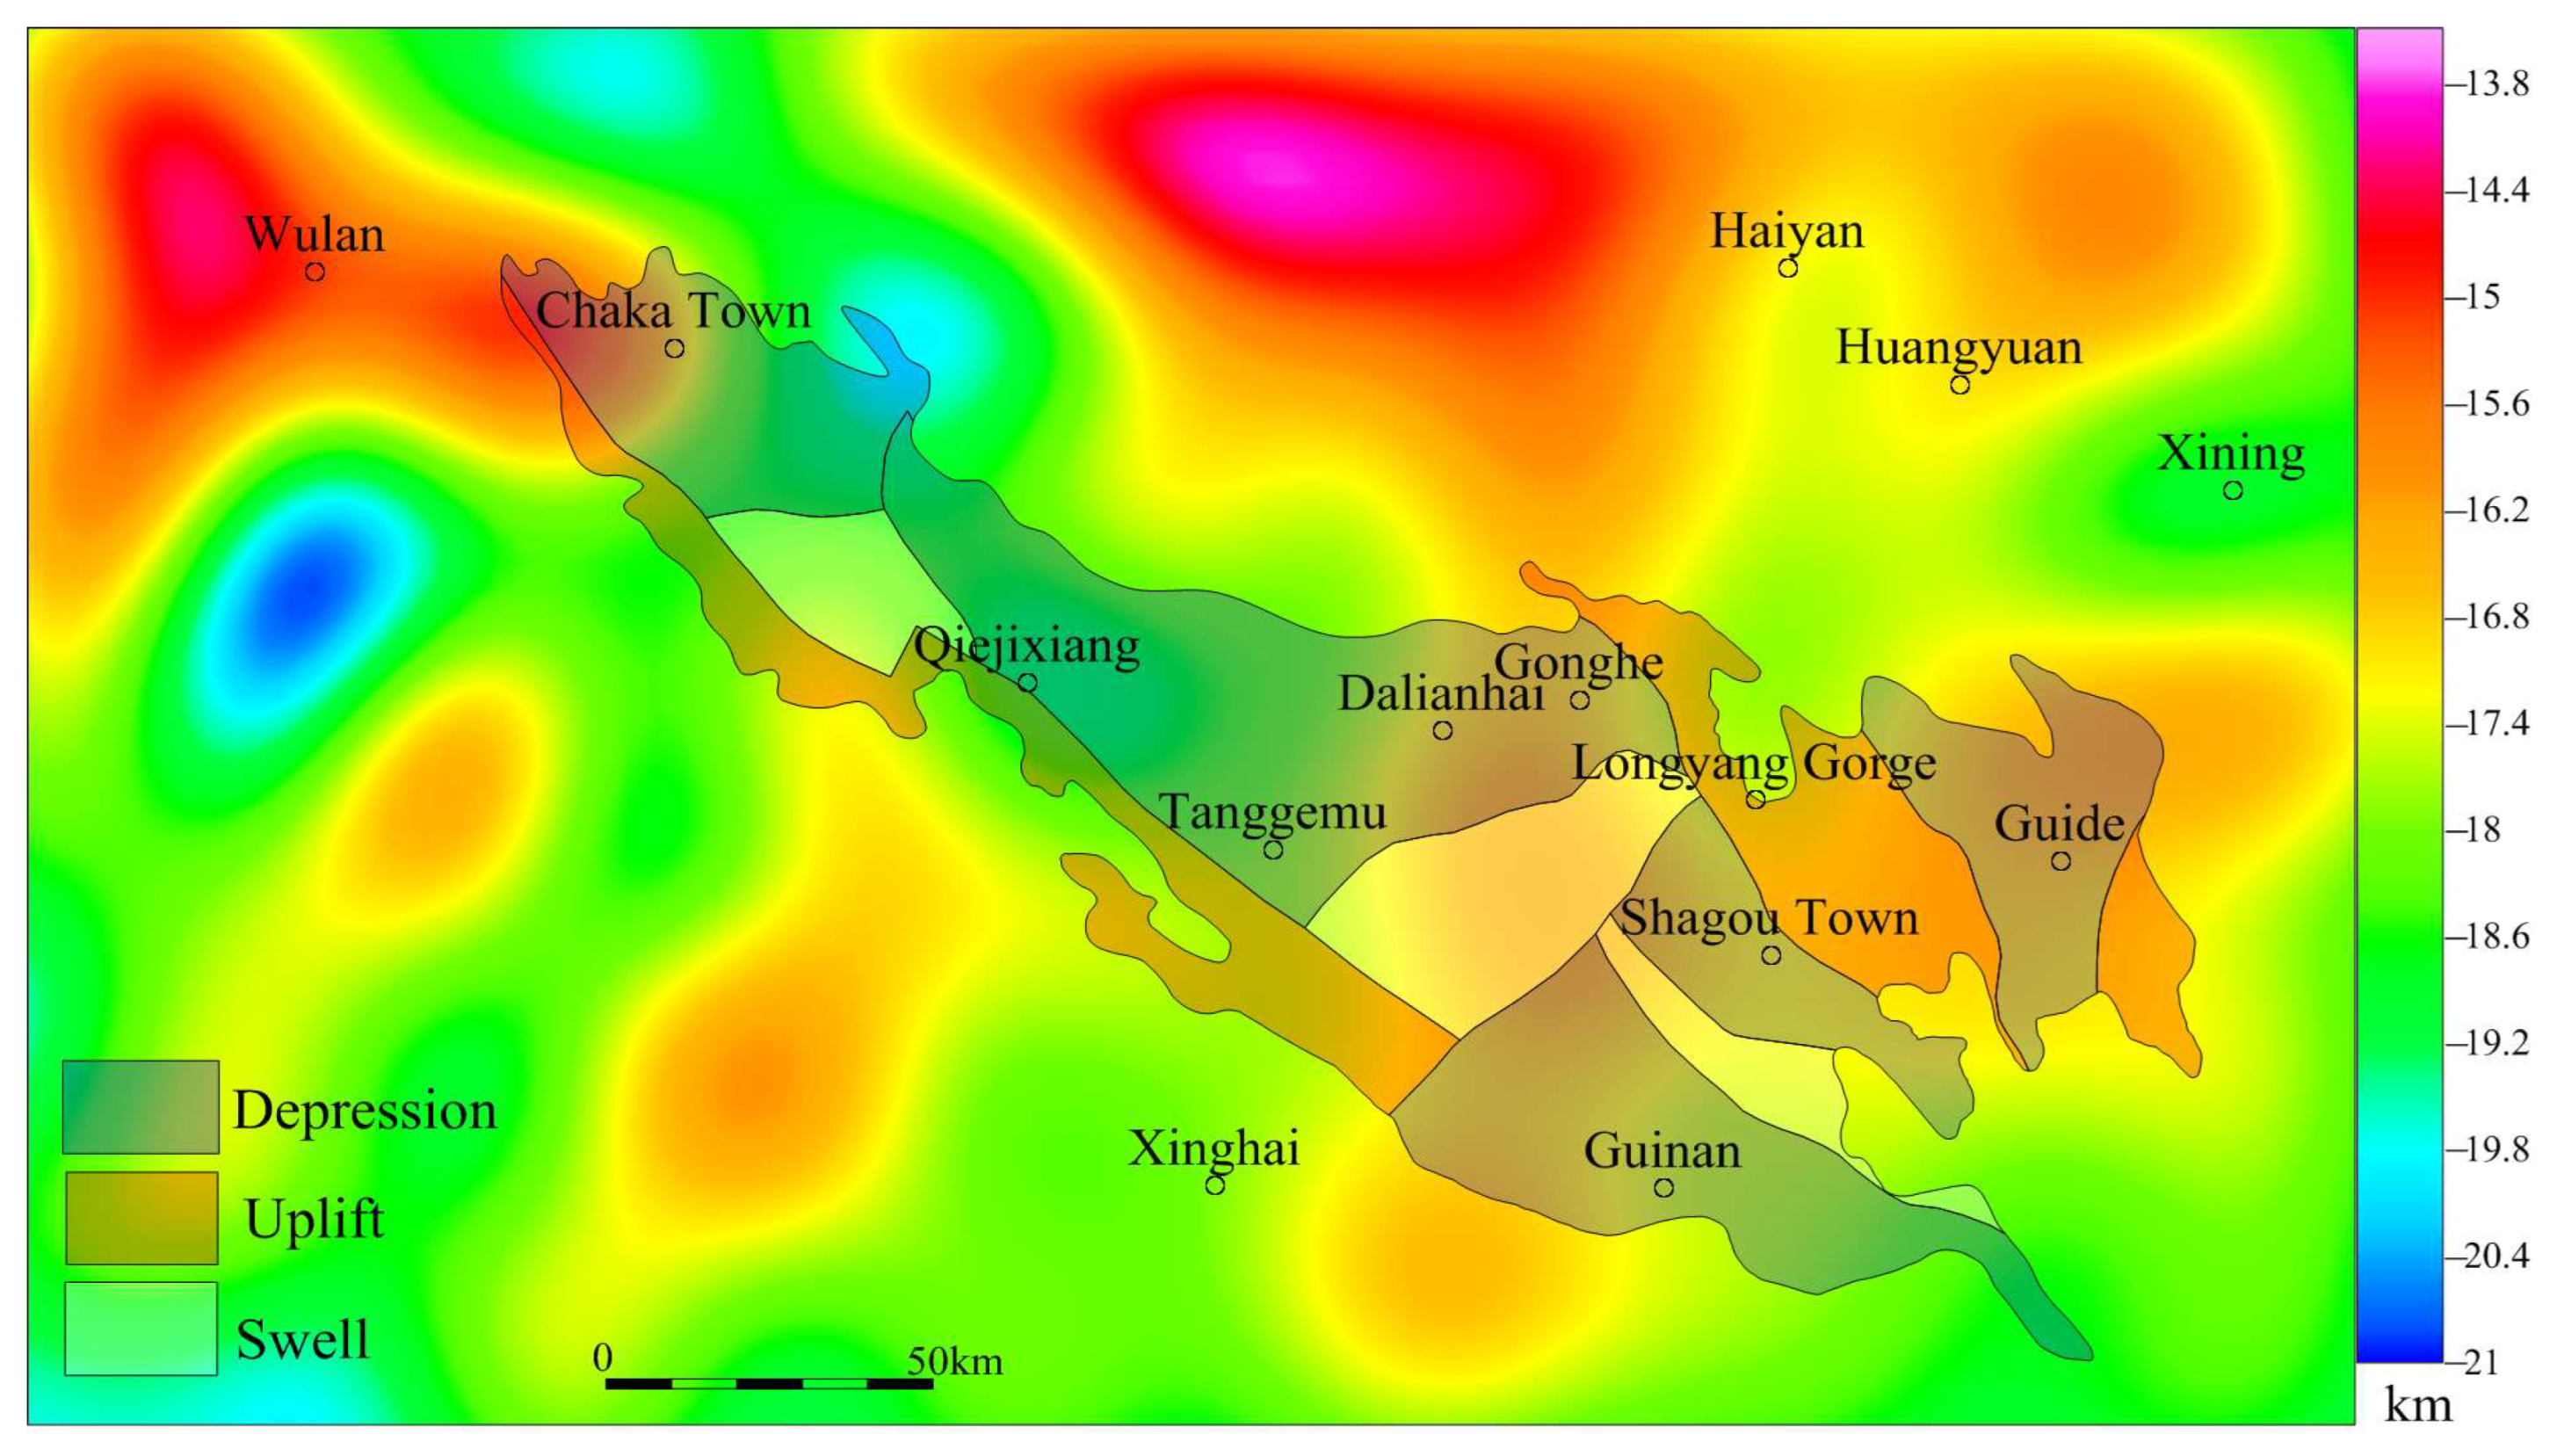
Based on the Park-Oldenburg method, aeromagnetic data can be utilized to determine the depth of the Curie isothermal surface. The distribution of its characteristics is similar to that of the aeromagnetic anomaly, as illustrated in
Figure 4. The results reveal that the depth of the Curie isothermal surface in the Gonghe Basin varies from 13.8 km to 20.8 km, displaying a distinct strip-like or block-like structure characterized by alternating uplifts and depressions. Variations in the depth of the Curie isothermal surface generally mirror the geotectonic features of the Gonghe Basin. Specifically, the area surrounding Chaka-Qieji represents a Curie isothermal surface depression zone, corresponding to the Tanggemu depression, whereas the region around Gonghe -Dalianhai-Guinan is an uplift zone, aligning with the Gongma and Qijia uplift. The Curie isothermal surface depression zone exhibits lower heat flow values, reduced tectonic activity, and represents a stable landmass. Conversely, the uplift zone displays higher heat flow values, indicating a regional geothermal anomaly zone with enhanced tectonic activity [
13].
3.2. Magnetotelluric 3D Inversion
Previous magnetotelluric sounding data within the Gonghe Basin were collected, sorted, and comprehensively analysed. Based on this systematic data curation, 298 magnetotelluric sounding data points were selected to perform three-dimensional data inversion.
This inversion employed the ModEM electromagnetic inversion program developed based on the nonlinear conjugate gradient (NLCG) algorithm [
14], The computation was performed on the “Tianhe” supercomputing platform. The regional resistivity model is discretized into an 88 × 96 grid in the horizontal plane, featuring a grid spacing of ~2–4 km. Vertically, the grid is structured with exponentially increasing intervals, ranging from 1.05 to 1.2 times the previous interval, tailored to varying depth ranges and critical survey depths. Specifically, the shallow section employs 0.1 km grid spacing, with 77 vertical layers extending to a maximum depth of 80 km. An initial uniform half-space model with a resistivity of 100 Ωm is utilized.
The inversion calculation process proceeds as follows:
- (1)
Select the initial model and observation data, then perform forward modeling to calculate residuals.
- (2)
Compute the objective function and its derivatives to obtain the preprocessing matrix, then calculate the conjugate gradient direction and step size to update model parameters.
- (3)
Repeat the above process iteratively. At each iteration, recalculate the forward modeling results, residuals, objective functions, and their derivatives based on the updated model parameters. Gradually adjust the model to optimize the objective function value related to the regularized mean squared error until the convergence criteria are satisfied, and then output the final inversion model.
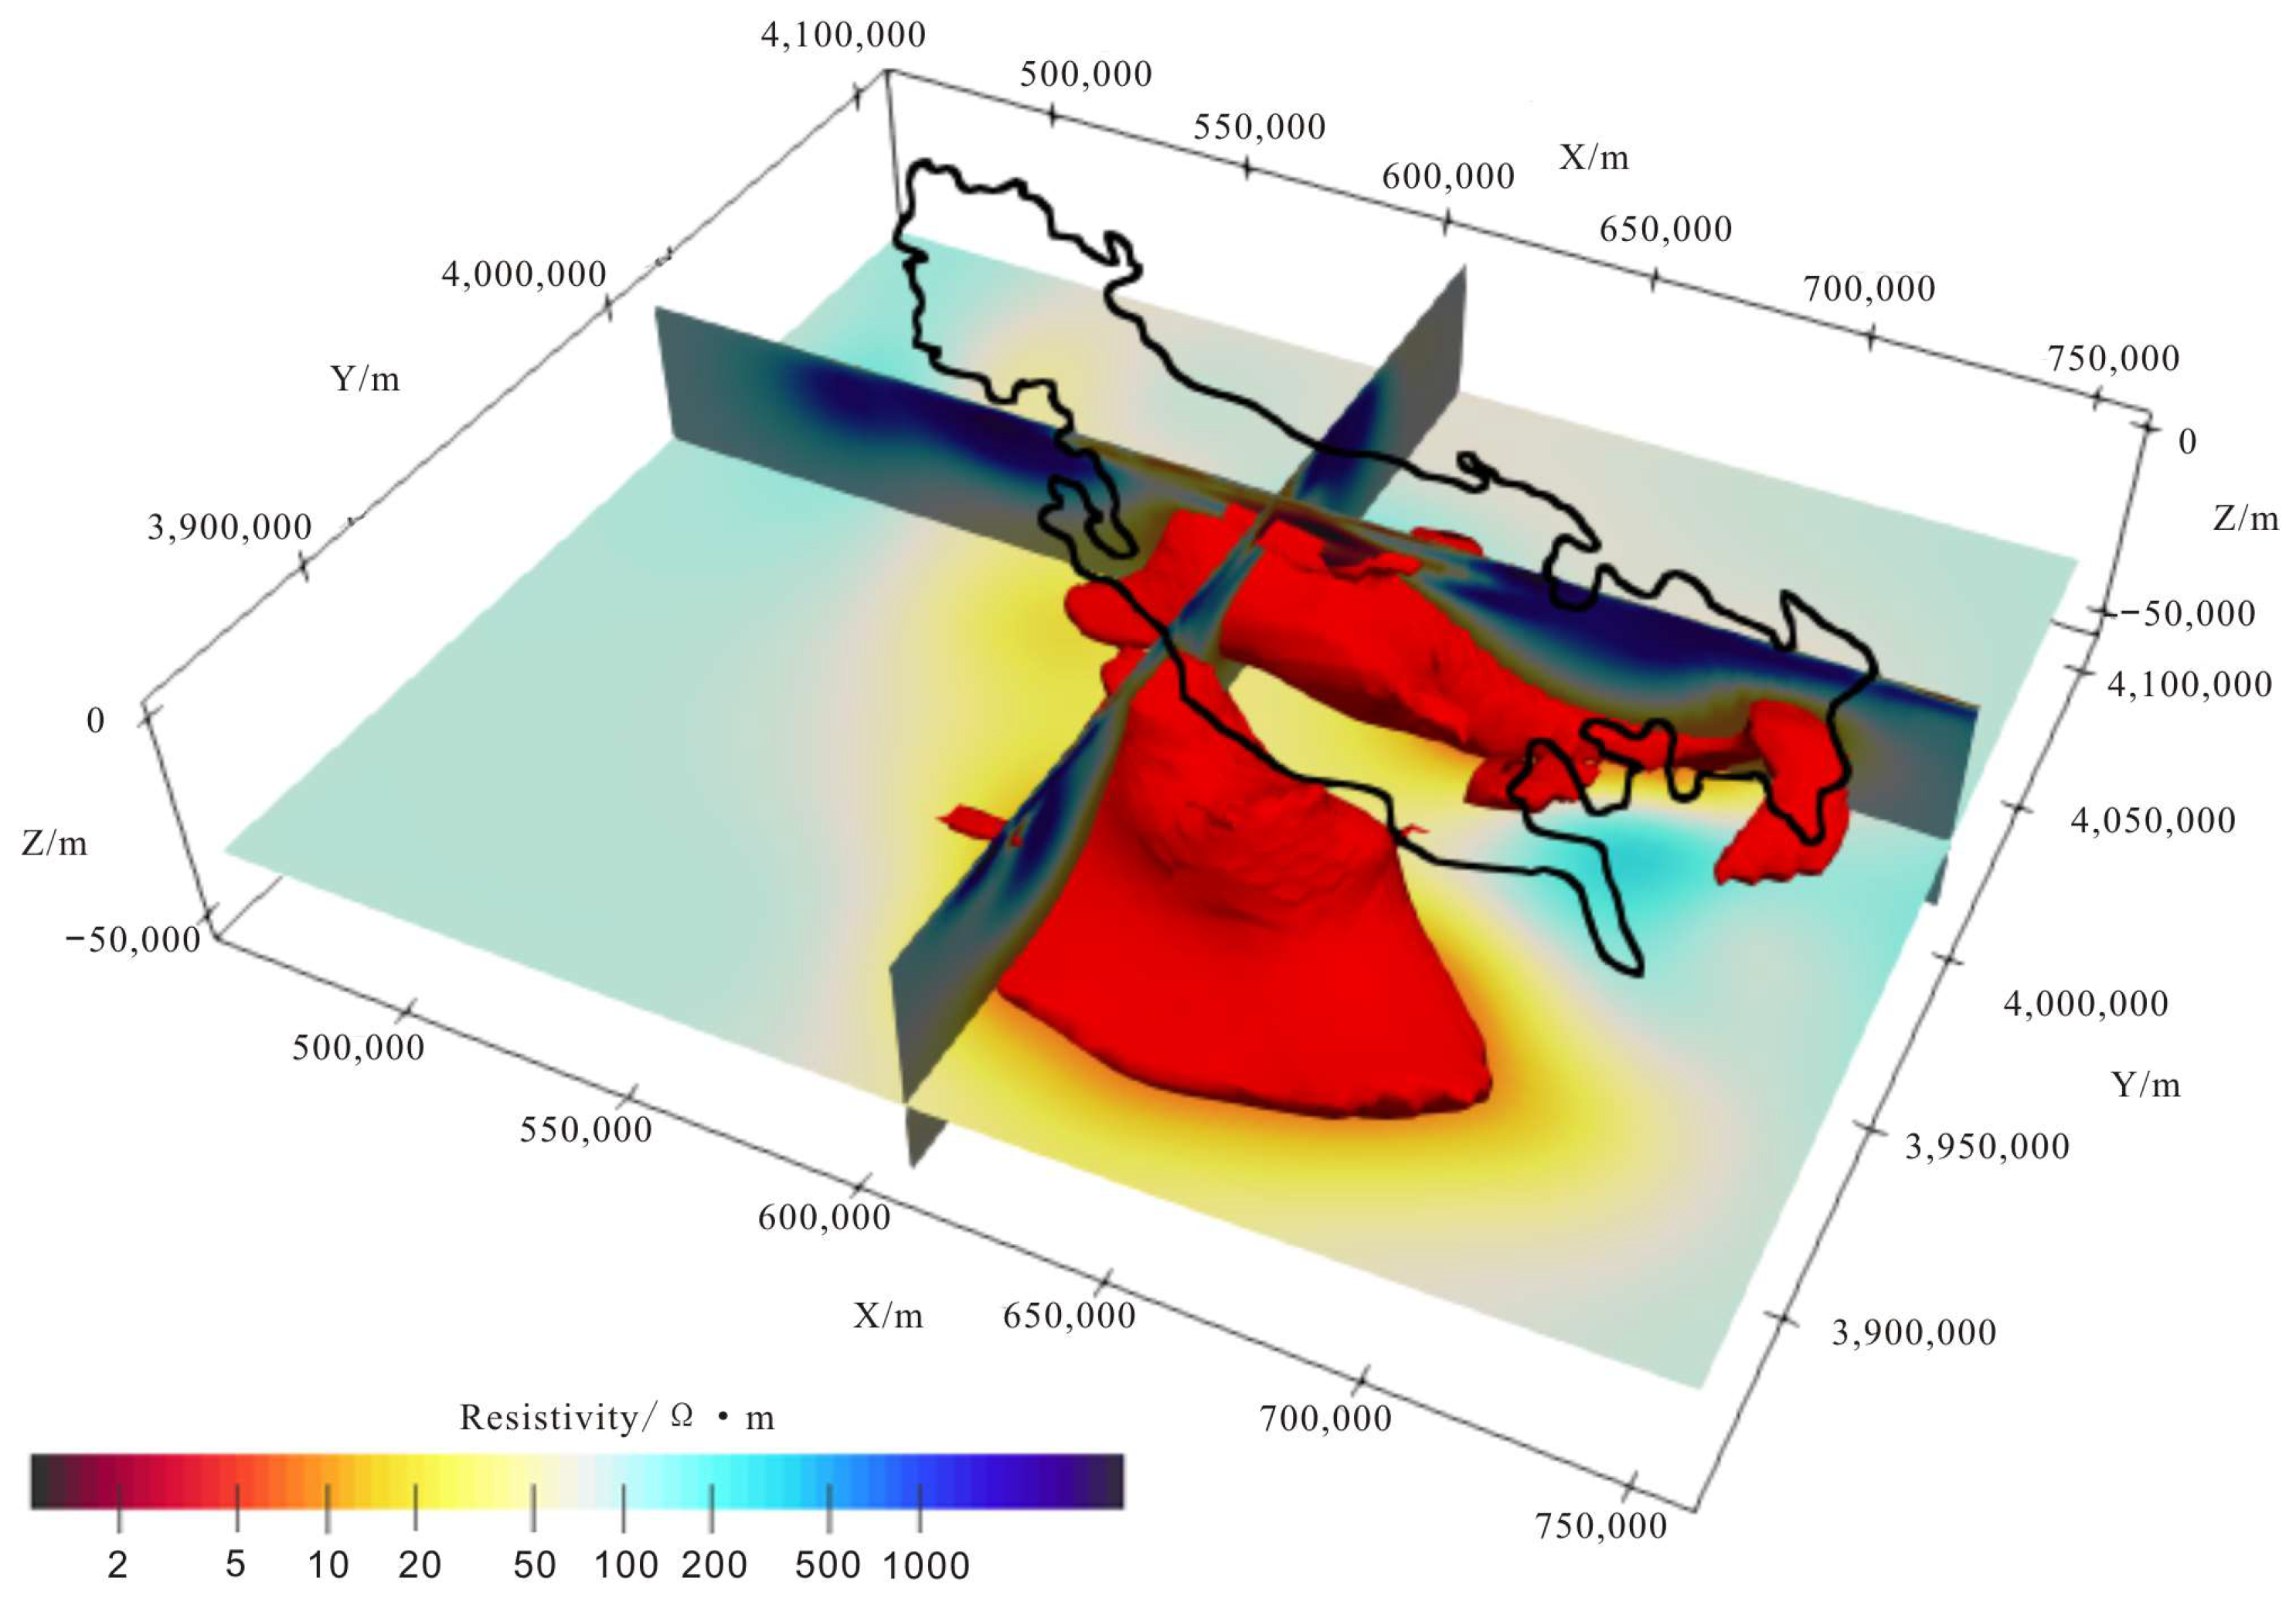
Following 103 iterations, the regularized root mean square error converges to 2.14%, yielding the reconstructed 3D resistivity model of the Gonghe Basin (
Figure 5).
3.2.1. Resistivity Plane Interpretation
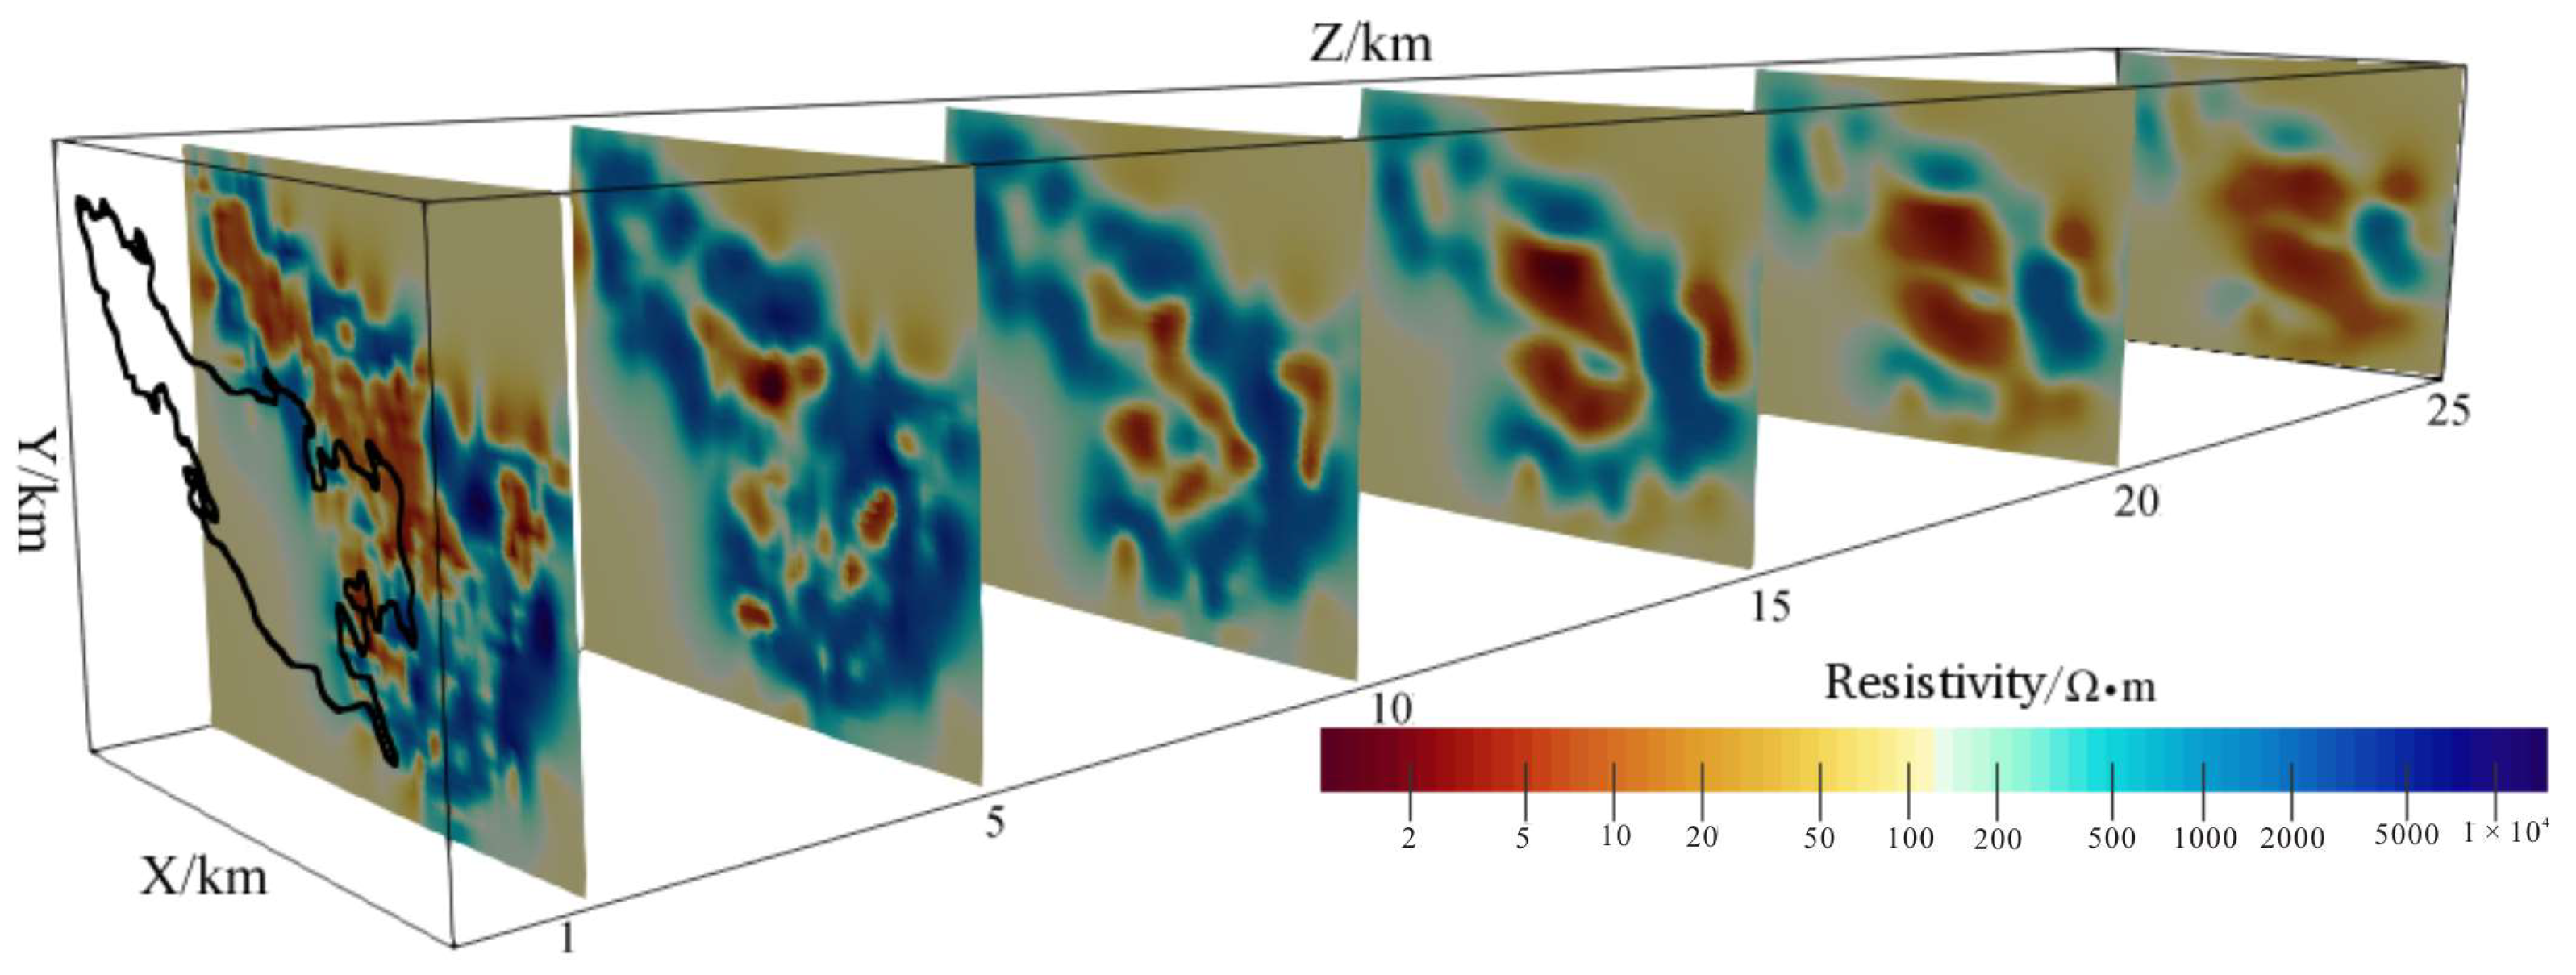
By slicing the resistivity at varying depths, the resultant maps reveal a broadly distributed low-resistance layer within the ~1–3 km depth range, accompanied by a high-resistivity layer in the ~5–10 km depth interval. Scattered clusters of high-resistivity bodies surround the low-resistivity layer, while two large low-resistivity anomalies are identified at approximately ~15–25 km depth (
Figure 6).
From the 3D resistivity map derived from inversion (
Figure 5), it can be seen intuitively that there are two main distributions of low-resistivity anomaly zones in the Gonghe Basin at a depth of 8 km (with a resistivity value of 9.2 Ωm). The first anomaly zone is located in the Gonghe-Guide region, with its uplift centered east of Qiabuqia and Guide, coalescing into a unified structure at approximately 15 km depth. The second anomaly is situated in the Guinan-Tongde area, with its uplift predominantly in the southwestern part of Guinan. Both low-resistivity cirque-shaped anomalies exhibit extensive low-resistivity zones between 15~35 km depth, showing a penetrating trend with the surface low-resistance layer. These features are inferred to represent a hot, dry rock heat source region associated with a partially molten layer.
3.2.2. Resistivity Profile Interpretation
To investigate the spatial distribution of the high-conductivity anomalies, one east–west and one north–south vertical resistivity profile were extracted across the Dalianhai area. Then the two vertical resistivity profiles were analyzed and interpreted to determine the spatial distribution characteristics of the top and bottom boundaries of the high-conductivity anomalies at their respective locations.
The layout of the profile lines is depicted in
Figure 5.
Figure 7 presents the inversion results for the resistivity profiles obtained along the east–west survey lines, while
Figure 8 displays those for the north-south survey lines. A low-resistivity layer is identified within the depth range of 1 to 3 km, which is likely a sedimentary stratum, aquifer, or thermal reservoir for shallow geothermal water. The crustal interval from 15 to 35 km depth exhibits a low-resistivity zone with several low-resistivity channels, which are inferred to be heat conduction channels. The Dalianhai area is situated within a raised low-resistivity anomaly region, where the 10 Ωm resistivity trap can extend to depths as shallow as 10 km.
4. Geophysical and Geothermal Field Modelling
The unstructured finite element method is used to solve the steady-state thermal control equations, and the thermal parameter information is estimated using the minimum inversion approach with regularization constraints [
11]. The specific steps are as follows:
Gather aeromagnetic data, magnetotelluric data, and well temperature measurement data for the study area.
- (2)
Confirm boundary conditions
At the surface of the temperature field (top of the model), a predefined temperature value or temperature function is applied to simulate the normal continental temperature response. On both lateral sides of the model, it is assumed that the heat flow density is zero; that is, the left and right boundaries are set as adiabatic conditions to represent the ductile region of the surrounding strata. In this study, the depth of the Curie isothermal surface derived from the inversion of aeromagnetic data is integrated with the partially molten zone identified through three-dimensional magnetotelluric inversion. The shallower depth value is adopted as the bottom boundary condition (approximately 580 °C).
- (3)
Forward of the temperature field
The following partial differential equations are used to represent the conduction-type temperature evolution in a non-homogeneous space for a given thermal conductivity and boundary conditions:
where
represents temperature (°C),
denotes thermal conductivity (W/(mK)),
signifies any external heat source term (mW/m
3),
denotes the divergence of the vector field, and
is the gradient operator applied to the scalar field.
- (4)
Geothermal parameter inversion and extraction
Unknown parameters (e.g., thermal conductivity) are determined through regularization inversion by the objective function based on the minimization problem:
where
represents the borehole temperature measurement data,
denotes the forward simulation of the temperature field, R is the diagonal covariance matrix of measurement errors, s is the estimated parameters for the forward simulation,
is a constant vector, and
is the mean parameter value of the forward simulation.
is the spatial covariance matrix of the simulation parameters.
As several deterministic algorithms for inverse problems, statistical methods based on linear computational processes are employed to obtain the latest estimates for the parameters
of the forward problem:
Here, k denotes the number of iterations, and
represents the latest estimated Jacobian matrix
. The optimal parameter set is determined through iterative refinement:
The parameters
and
are determined by solving the linear matrix equation, yielding the optimal parameter estimates
:
During the inversion calculation process, accurately determining the direction of decrease for the objective function requires computing the sensitivity matrix, which represents the partial derivatives of each data point with respect to the model parameters (of dimension n × m):
h(s) denotes the data vector computed for a given model parameter vector s.
The algorithm iteratively checks whether the preset convergence criterion is satisfied, applies known constraints during each iteration, and continues until the optimal objective function value is achieved.
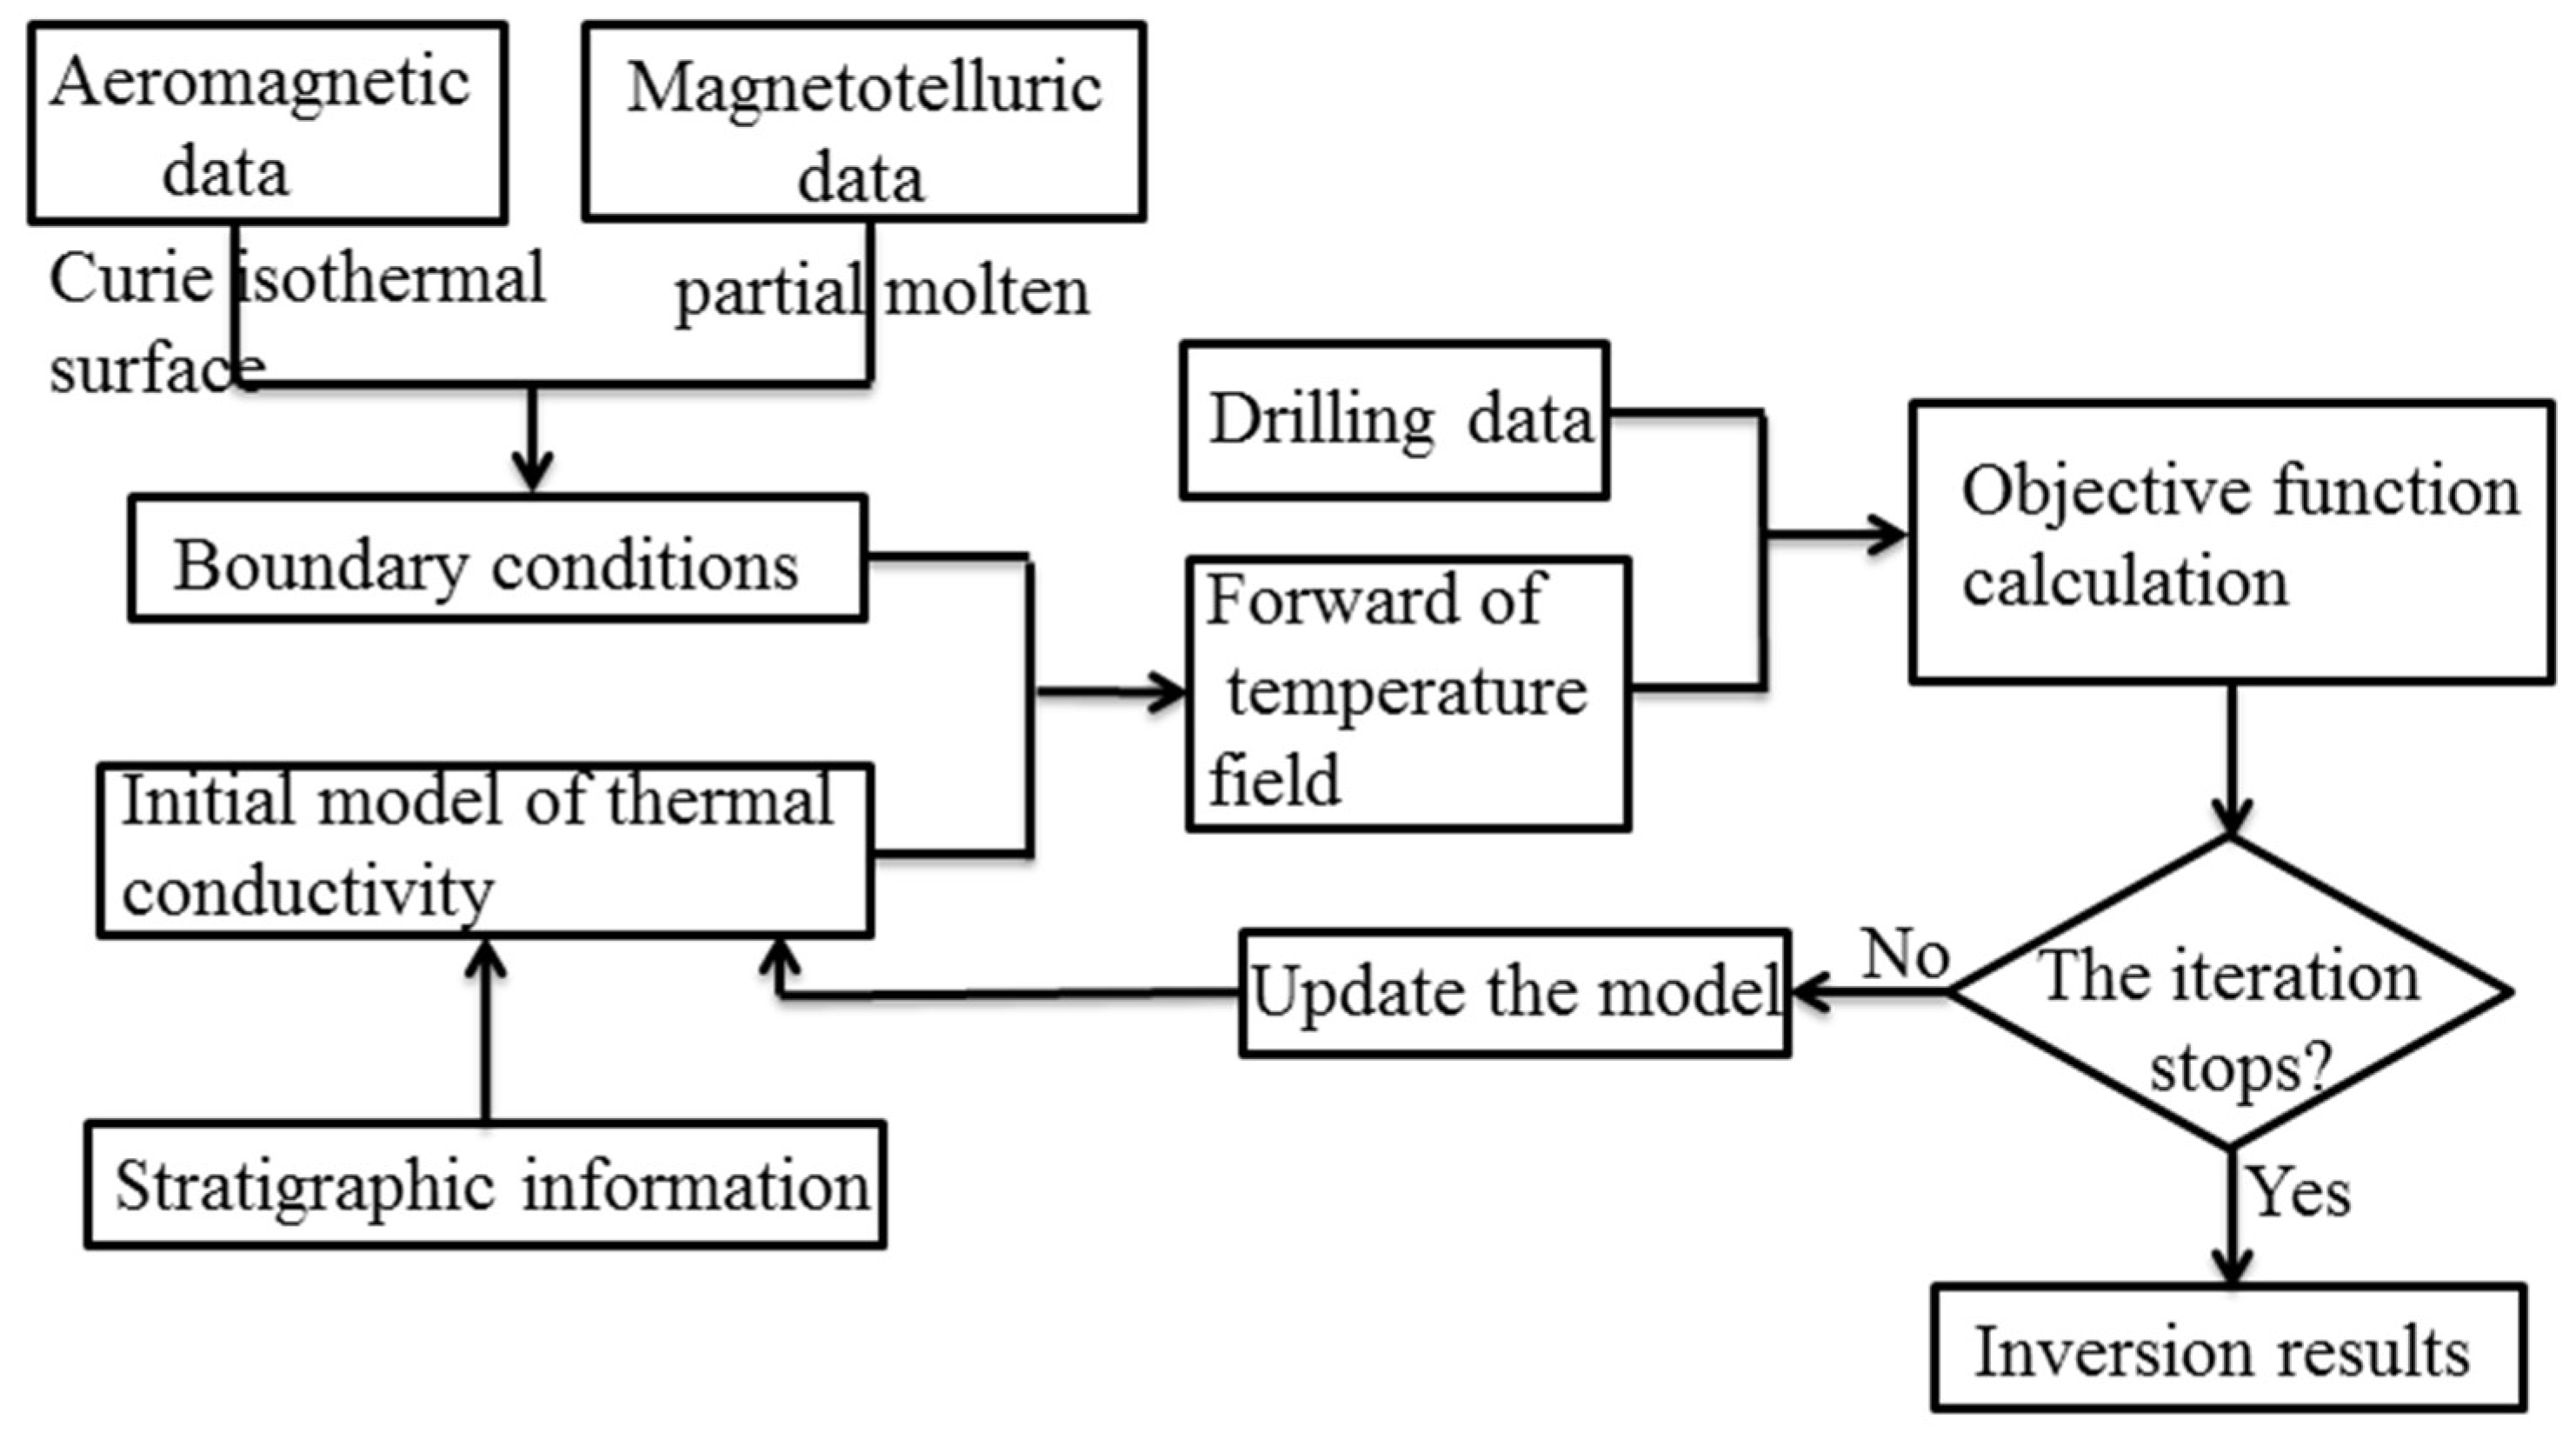
The computational workflow for thermal parameter inversion is illustrated in
Figure 9:
5. Geophysical–Geothermal Parameter Modelling and Temperature Field Inversion
Analogising the finite element method for inscribing the temperature field to the steady-state heat conduction problem, in addition to the heat conduction equation, the calculation of the temperature distribution inside the object requires the specification of initial and boundary conditions. Analysing the steady-state heat conduction problem, there is no need to consider the effect of the initial temperature distribution of the object on the final steady-state temperature field. Therefore, it is not necessary to consider the initial conditions, but only the heat transfer boundary conditions. Non-uniform triangular meshing and discretization of the model by Gmsh integrated the Curie isothermal surface and high-temperature anomaly areas of partially molten bodies. The boundary conditions were set by taking the smaller value of the depth, with the temperature of 585 °C. The left and right sides were defined as adiabatic boundaries so as to establish the initial temperature field model and carry out the inversion of the thermal parameters for Gonghe Basin by using the adaptive finite element temperature conduction control equation.
5.1. Geophysical–Geothermal Parameter Modelling
The inversion data integrate Curie isothermal surface depth data from aeromagnetic inversion with resistivity-depth data obtained by magnetotelluric inversion at a depth of less than 25 km. Firstly, the aeromagnetic Curie isothermal surface data in the 3D magnetotelluric dataset are assigned a temperature value of 585 °C for the relative depth of the corresponding plane coordinates. Then, the 9.2 Ωm low-resistivity surface in the dataset is assigned a temperature of 585 °C. For each location, the depth of burial is determined by comparing the depth of the Curie isothermal surface and selecting the smaller value. The newly defined 585 °C isothermal surface, along with the ground surface, serves as the starting conditions, with the surface temperature set at 20 °C. The spatial area within the extracted data body shallower than 8 km and less than 80 Ωm is assigned as sedimentary rock cover (
Figure 10), while the remaining area is identified as a granite reservoir.
The obtained 585 °C undulating surface depth and ground surface were utilized as the first type of boundary conditions. Based on this, the distribution data of the sedimentary cover was obtained from geothermal, geological, and regional geophysical exploration surveys. The average thermal conductivity of the sedimentary layer was set at 1.69 W/(mK), while the average thermal conductivity of Middle and Late Triassic granite was established at 2.7929 W/(mK) [
15]. These values served as a priori information for performing thermal parameter inversion using adaptive finite element temperature conduction equations. The ground temperature gradient obtained through orthogonal calculations using known drilling temperature measurement data was employed as a constraint. The model results were extended down to a depth of 25 km, utilizing the acquired deep ground temperature gradient data to obtain a temperature field model for the entire Gonghe Basin from 0 to 25 km.
5.2. Analysis of Temperature Field Inversion Methods
5.2.1. Temperature Profile Inversion
In order to interpret the spatial distribution of high-temperature anomalies, vertical temperature profiles were extracted in both east–west and north–south directions across the Dalianhai region (
Figure 5). Then, the two temperature-depth profiles were analyzed and interpreted to delineate the spatial distribution characteristics of the top and bottom interfaces of the high-temperature anomalies at the location of the profiles (
Figure 11 and
Figure 12). As evident from the figures, it can be seen that there are two prominent high-temperature uplift zones in the central part of the basin, which largely coincide with the low-resistivity anomaly zones identified through magnetotelluric resistivity profiling. This demonstrates a strong correlation between low-resistivity anomalies and high-temperature anomalies, further confirming the extent and location of the deep-seated molten body’s development and uplift. In the Dalianhai area, a partially molten body is detected at a depth of approximately 10 km.
5.2.2. Temperature Plane Interpretation
Figure 13 displays temperature slices at depths of 1 km, 3 km, 4 km, 6 km, 10 km, and 15 km. From these slices, it can be seen that areas with temperature exceeding 100 °C in the depth range of ~1–2 km are distributed in strip and block patterns, likely linked to the development of deep fracture tectonics. In the ~4–6 km depth range, high-temperature areas are primarily located in the southern part of Gonghe, the eastern part of Guide, and the southwestern part of Guinan, coinciding with regions showing low-resistance anomalies. It is suggested that the deep melt serves as a significant heat source at these depths. High-temperature anomalies at depths of ~10–15 km and in the middle and shallow regions have always existed, indicating that molten bodies are widespread at least down to 15 km, though no complete merging of these bodies occurs at this depth. The temperature slices clearly show that the temperature distribution at depths greater than 3 km is strongly influenced by the deep temperature field, highlighting the control exerted by low-velocity and high-conductivity melt on the deep thermal environment.
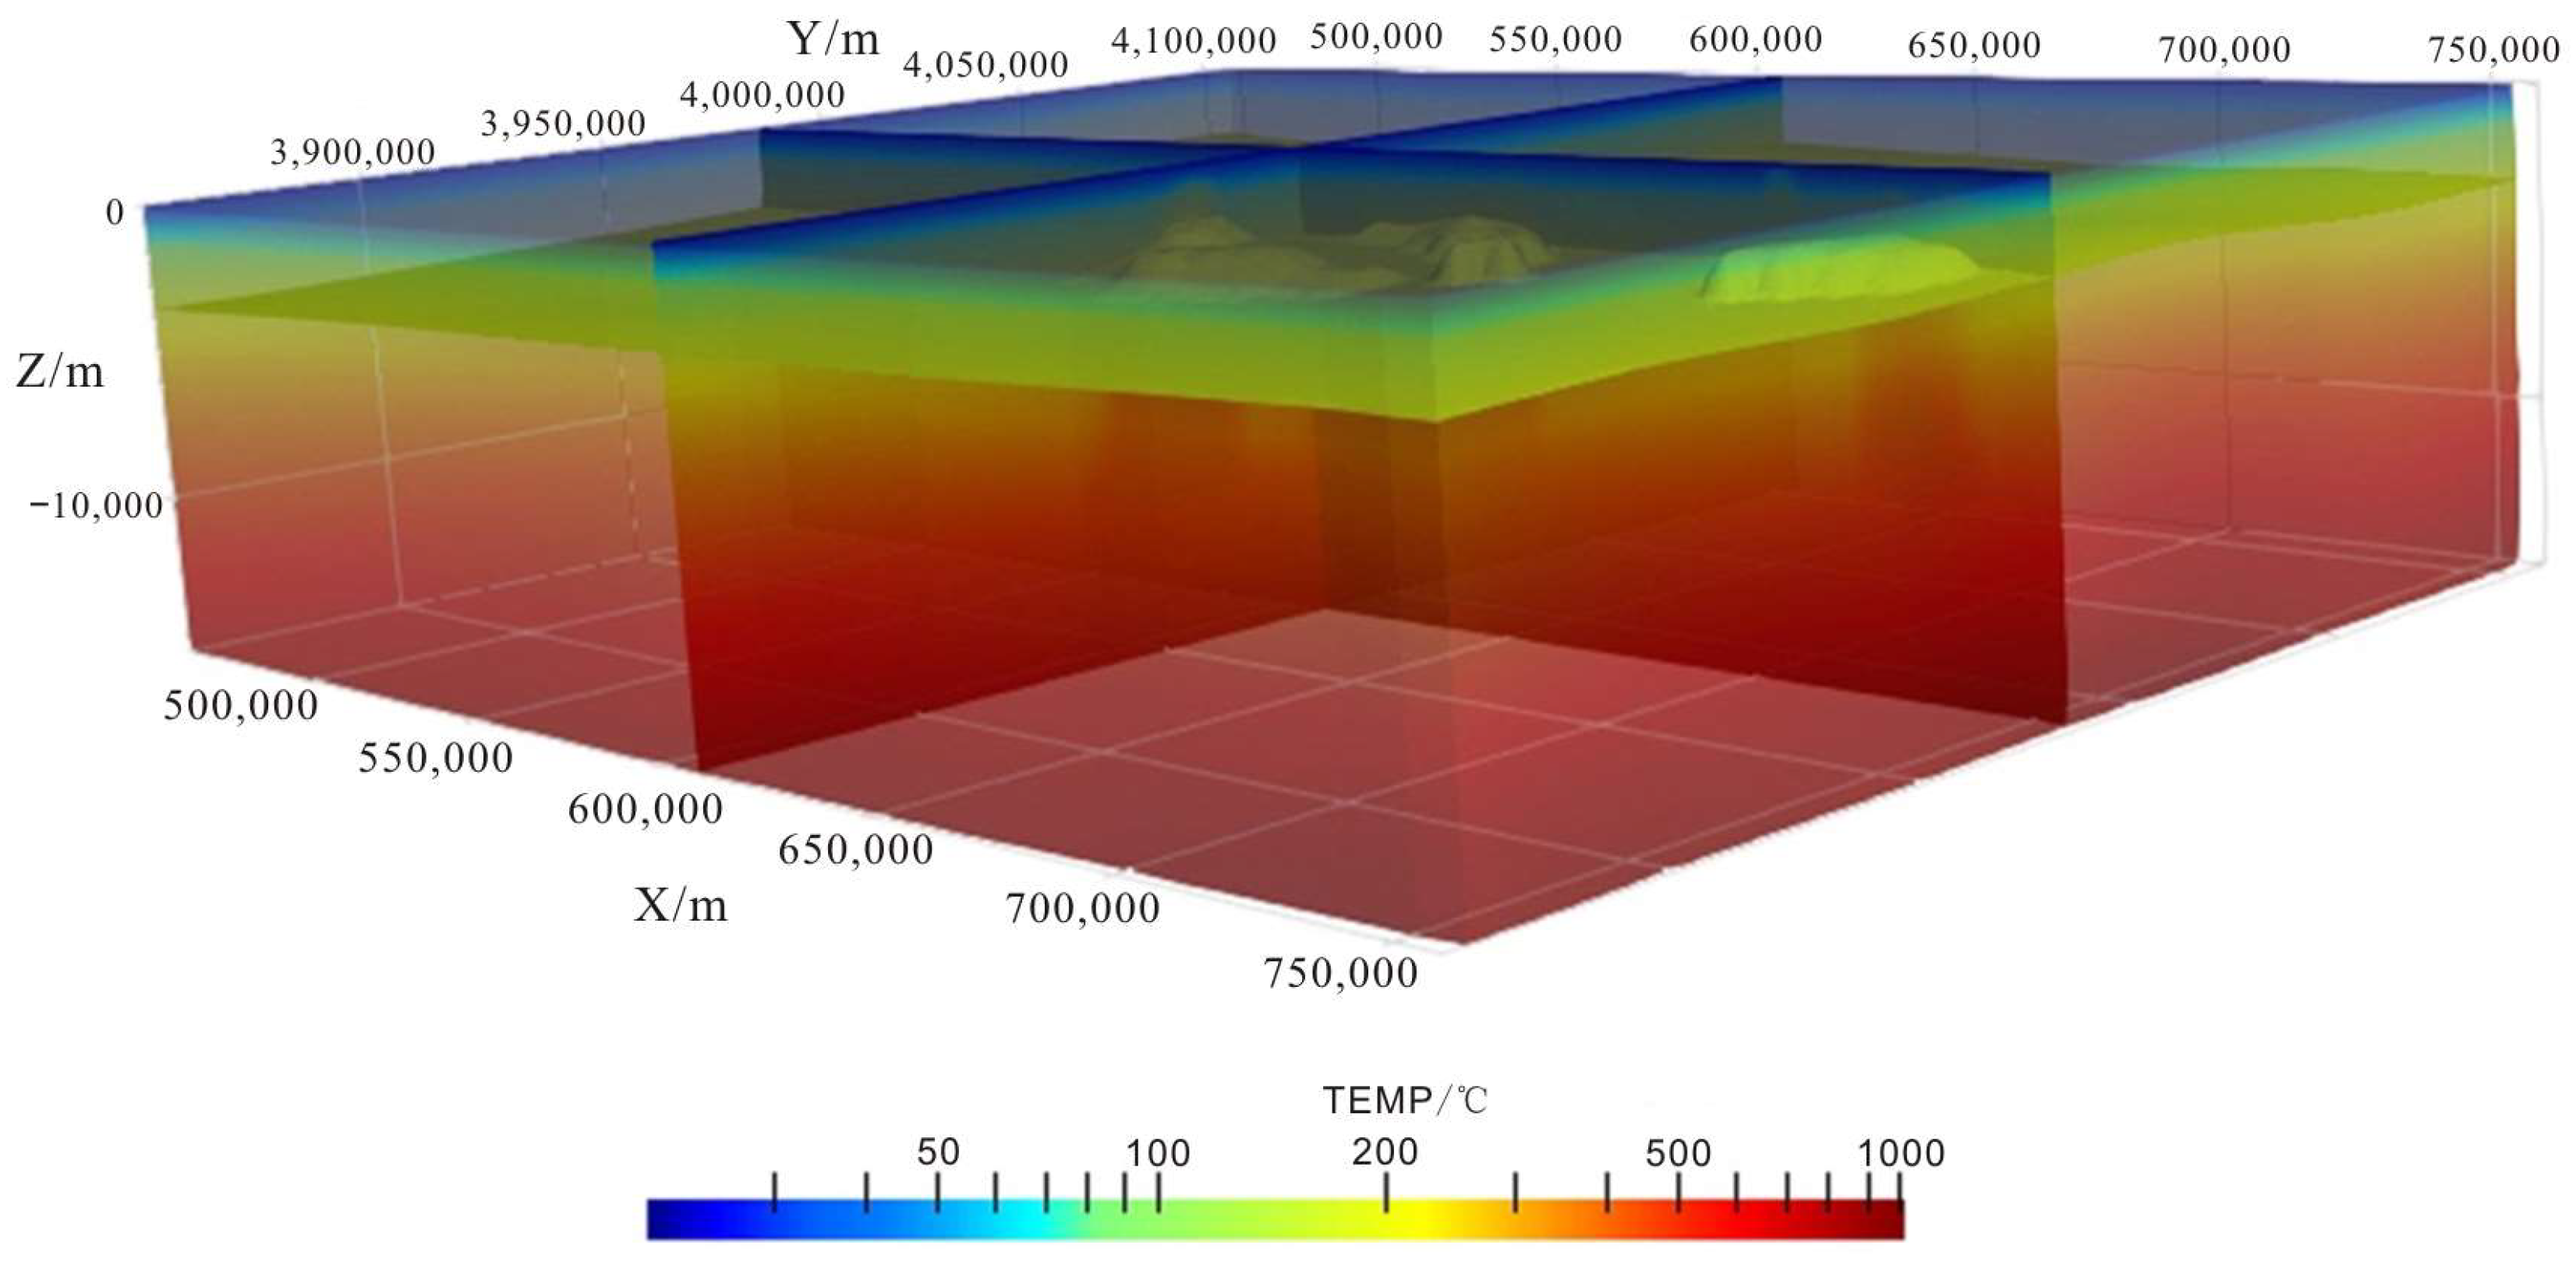
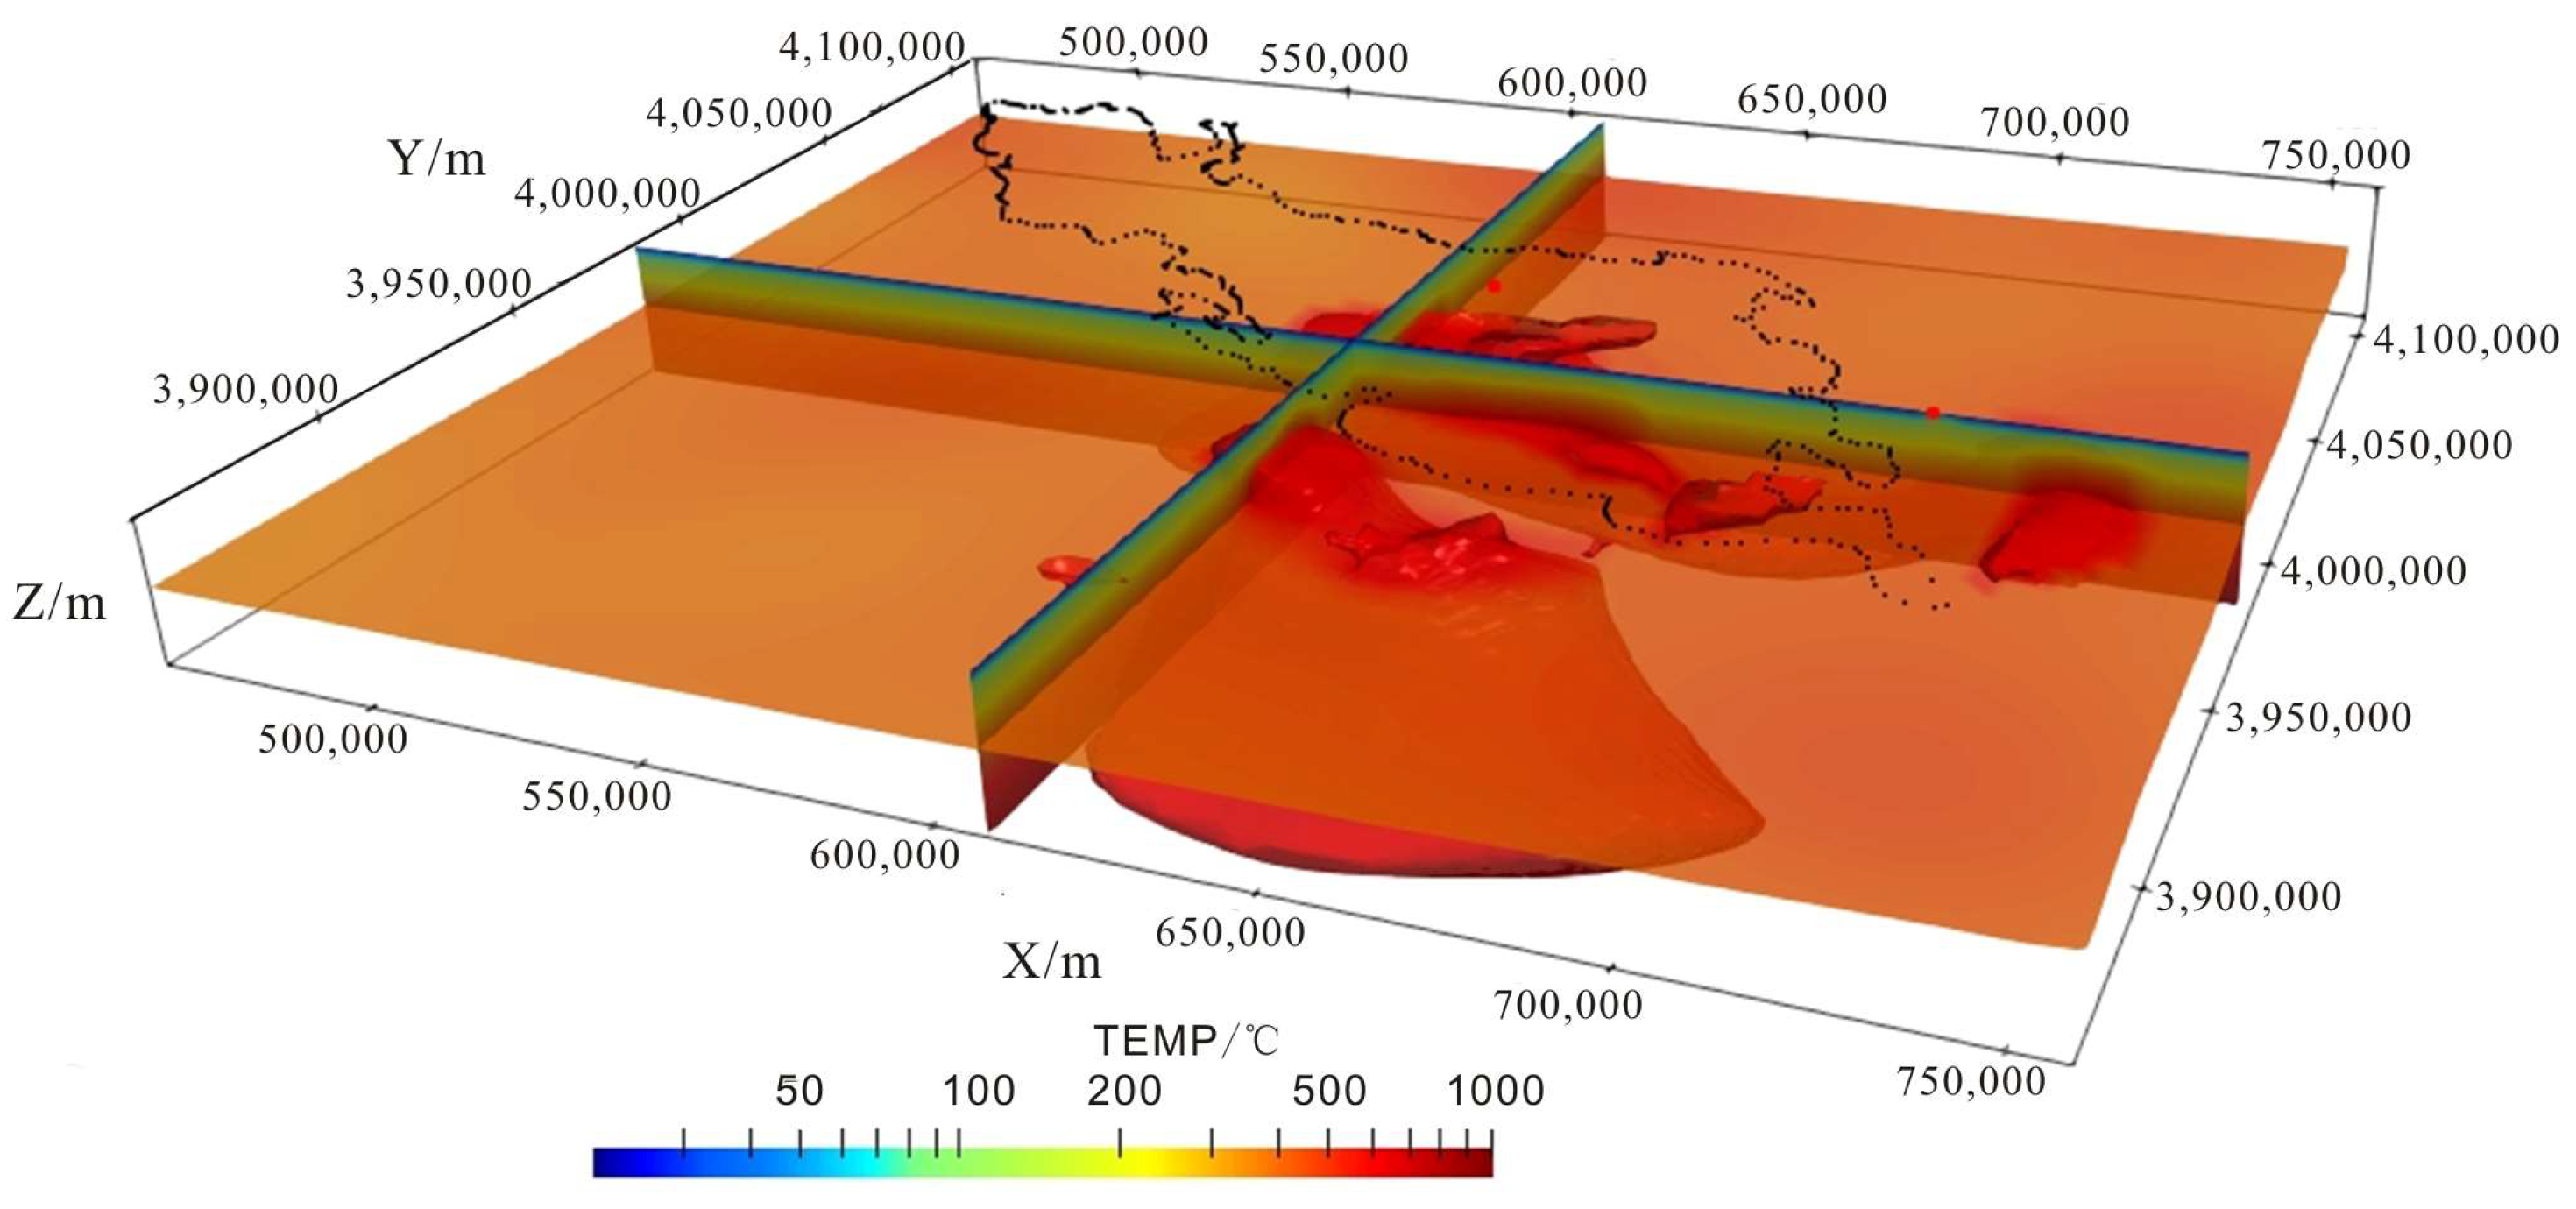
The three-dimensional temperature maps (
Figure 14 and
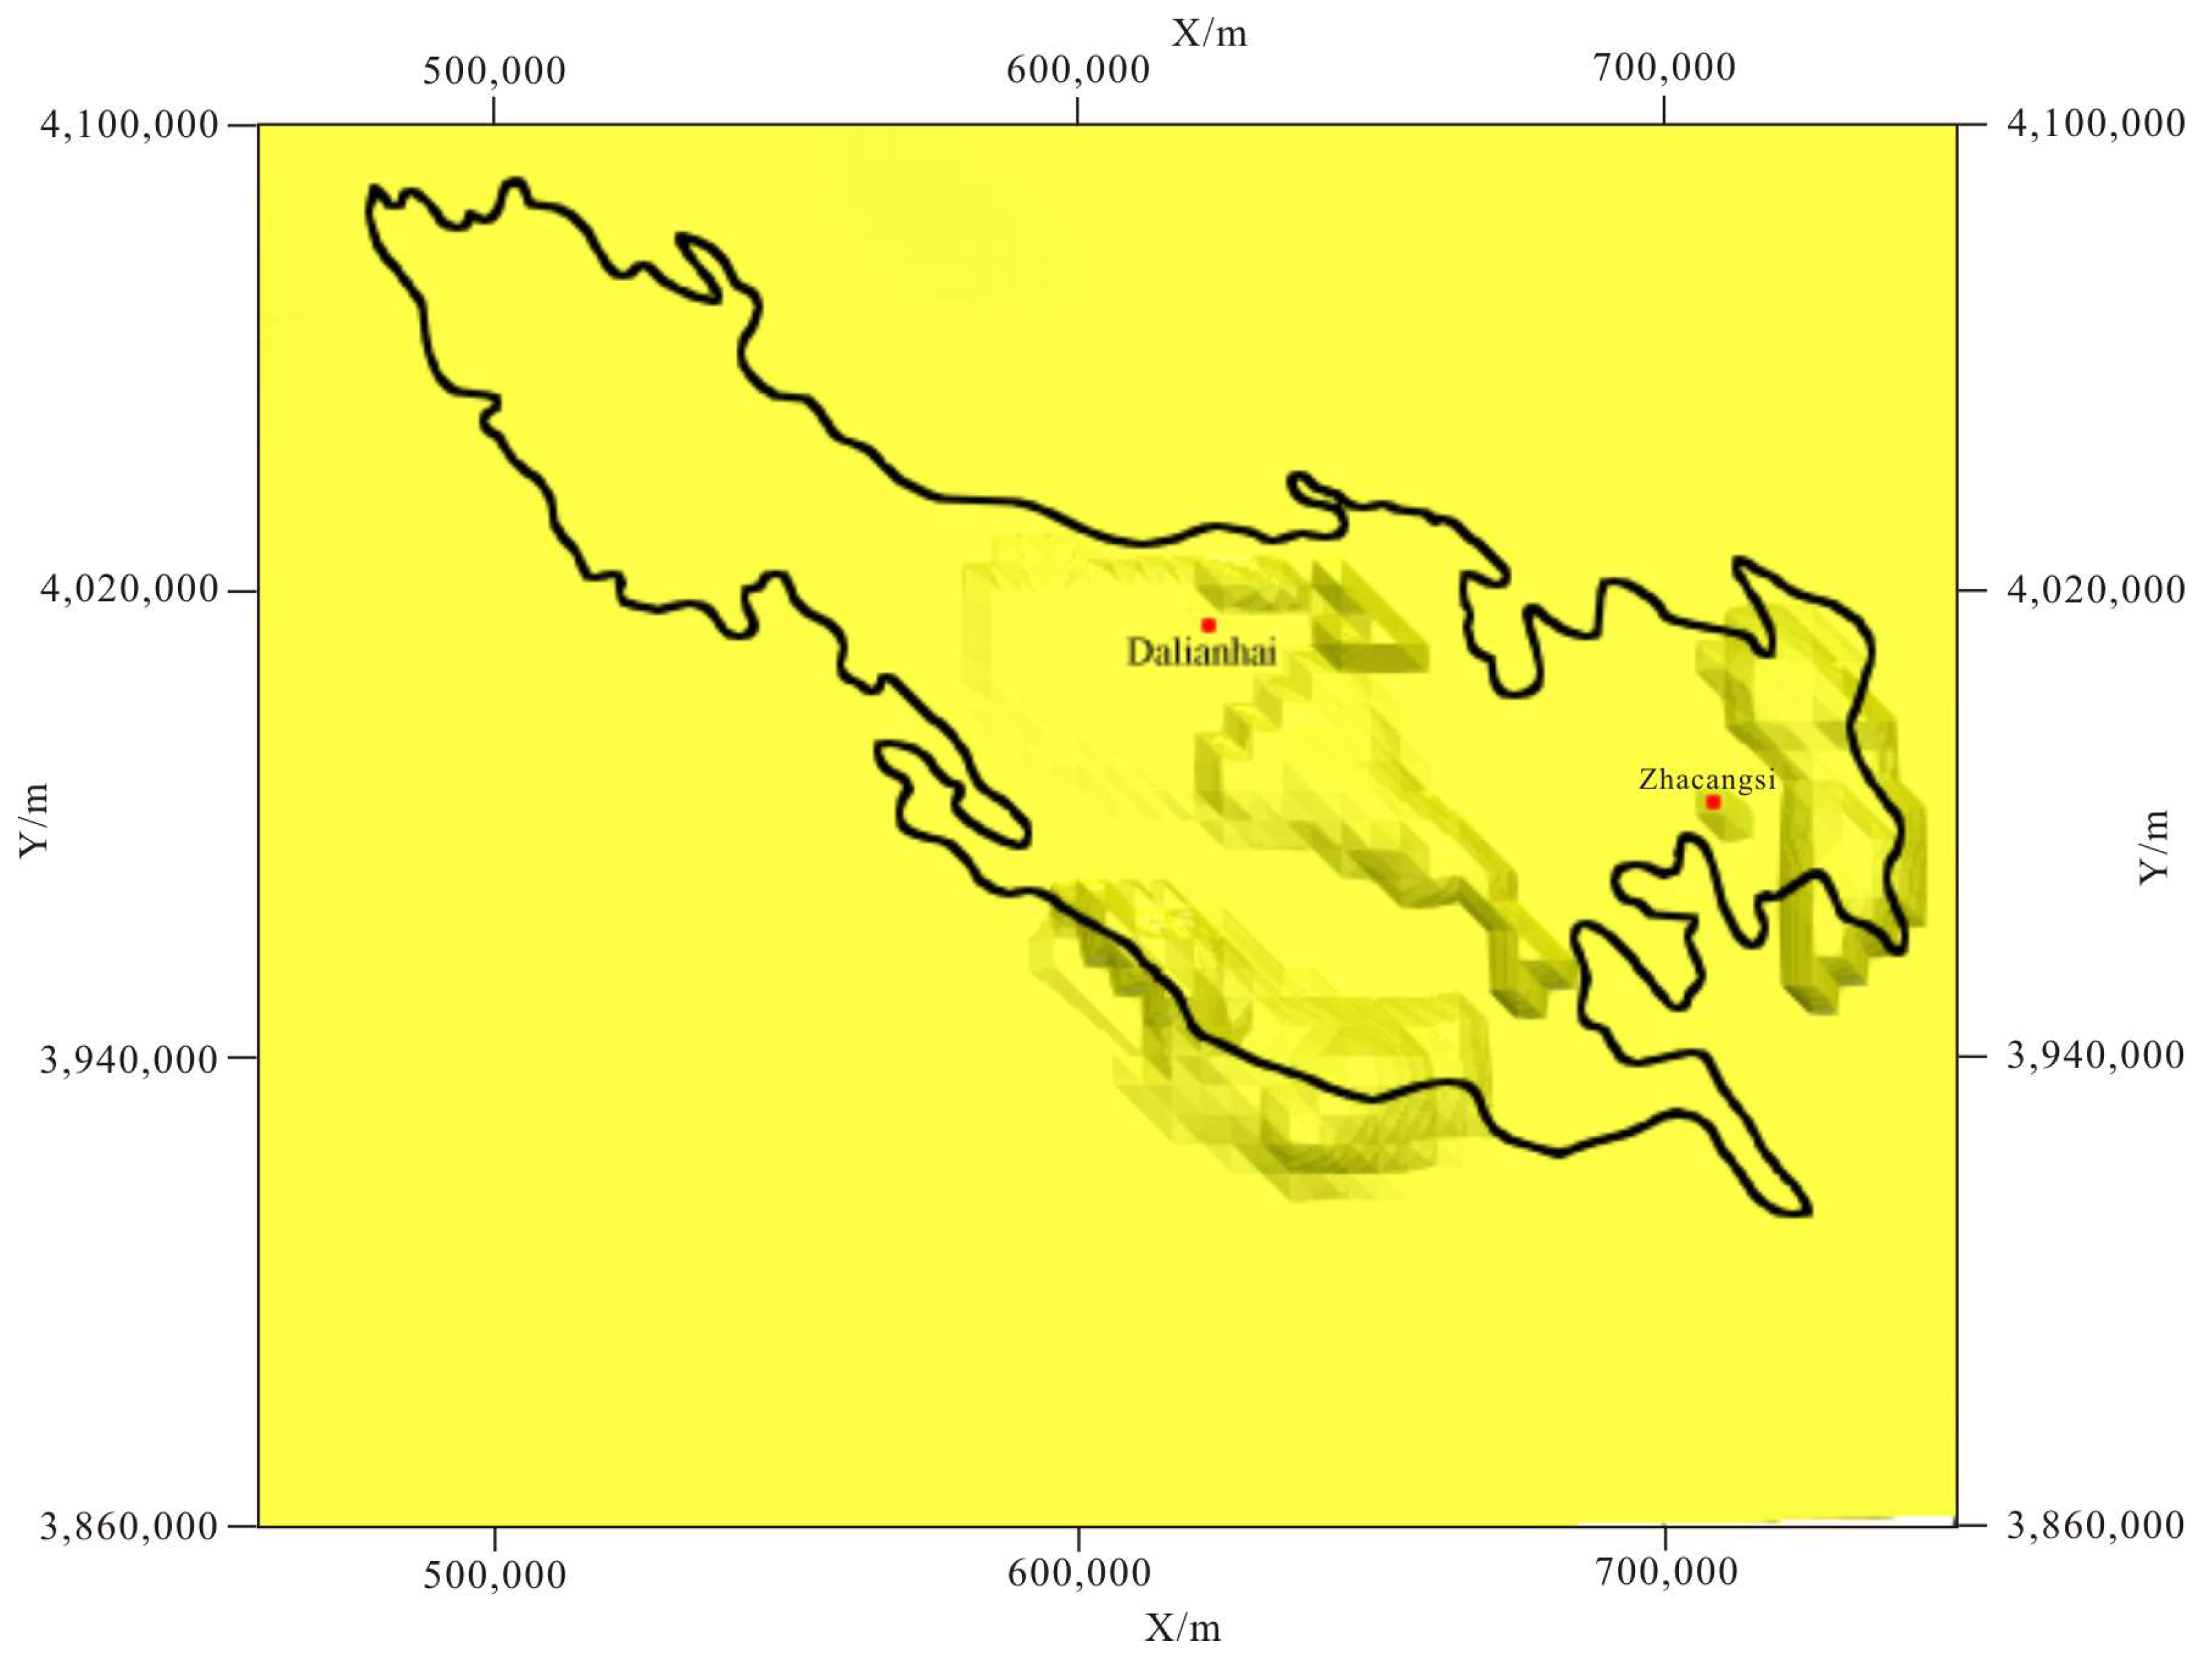
Figure 15) constructed using the 180 °C isobath (
Figure 16) can visualize the primary distribution area of the 180 °C uplift zone within the Gonghe Basin, as well as the correspondence between high temperature anomalies and low resistance anomaly areas. The high-temperature anomaly regions are largely consistent with those showing low resistance, suggesting that molten bodies, serving as the primary heat source for the hot dry rock mass, play a dominant role in controlling temperatures within the geothermal system of Gonghe Basin.
5.3. Comparative Analysis of Temperature Inversion Results and Actual Measurements
This time, temperature data were collected from 13 geothermal wells, with the majority representing bottom-hole temperatures. Temperature inversion was conducted at identical locations and depths, and the resulting error statistics are presented in
Table 1. The findings indicate that the error rates predominantly remain within 10%.
6. Discussion
Numerous studies have explored the heat sources in the Gonghe Basin, focusing on factors such as heat generation from radioactive elements [
5], the conduction of mantle heat via deep and extensive fractures [
16], crustal heat resulting from localized melting [
17,
18], and the combined effects of these factors [
19]. Helium isotope analyses of gases separated from hot springs in the Gonghe Basin reveal that mantle-derived heat contributes minimally, with no evidence of mantle heat conduction through deep fractures. Thus, mantle-derived heat plays a minor role in the geothermal anomalies observed in the Basin. The average radiogenic heat generation rate of granite in the hot dry rock reservoirs of the Gonghe area is comparable to global averages [
20], suggesting that radioactive heat generation is unlikely to be the primary heat source. Magnetotelluric sounding and wave velocity inversion from dense natural stations indicate the presence of significant low-velocity and high-conductivity bodies at depths of 15–35 km in the crust. Based on geological evidence of deep melts [
21,
22], numerical models [
23,
24], magnetotelluric, and seismic data [
25], the crustal channel flow model proposes that the low-velocity and high-conductivity zone represents a partially molten layer [
26], which serves as the main heat source and significantly contributes to the geothermal resources of hot dry rock [
15,
16].
The continuous well comparison profile from west to east across the Gonghe Basin reveals a notable uplift [
27] in both stratigraphy and temperature isosurfaces (
Figure 17a). Resistivity measurements along this profile (
Figure 17b) indicate the presence of a continuous low-resistivity body extending from the central basin (Gonghe) eastward to Guide at depths of 15–35 km, with an overall shallow western and deep eastern morphology. This low-resistivity zone is identified as the primary heat source in the Gonghe basin.
The results of the Curie isothermal surface analysis (
Figure 17c) indicate that the depth from GC1 to GH1 has been increasing, and the depth from GH1 to ZR2 first decreased and then increased again. The GH1 well is situated in the uplift zone of the Curie isothermal surface, which corresponds to a deep magma chamber or partially molten granite [
17]. The upward intrusion of molten material or magma has created a high temperature anomaly near the GH1 well. The low-resistivity anomaly observed beneath GH1 aligns well with the Curie isothermal surface, suggesting that the stratigraphy in this area is stable. In contrast, the presence of a high resistivity body with a shallow Curie isothermal surface beneath ZR2, which differs from the deeper part of the GH1 well, indicates that the GH1 and ZR2 areas belong to different geothermal types. This difference is primarily due to varying burial depths of the molten material; in the eastern part, the burial depth is greater, and simple conduction alone cannot form a shallow geothermal anomaly. Instead, fractures are required as heat transfer channels. Therefore, the heat source in the Gonghe Basin is mainly crustal heat generated by local melts. However, the geothermal anomaly in the east is primarily a convective geothermal system that uses faults as transmission channels, while the central area of the basin is dominated by conductive geothermal processes. The shallow western and deep eastern depths of the deep melts are the main reasons for the different heat transfer mechanisms in the Gonghe Basin.
7. Conclusions
The application of comprehensive geophysical methods for the construction of three-dimensional temperature fields demonstrates superior effectiveness and promising development prospects. By employing the aeromagnetic method and magnetotelluric sounding method, a deep steady-state temperature field can be established. This is based on factors such as the depth of the Curie isothermal surface, the location and scale of partially molten bodies, the degree of melting, and the initial melting temperature. Furthermore, by establishing a corresponding conceptual model, we can derive a spatial three-dimensional temperature field model using the steady-state heat conduction method. This approach offers stronger theoretical and data support compared to conventional methods, such as estimating geothermal flow values.
The aeromagnetic study results reveal that in the central region of the Gonghe Basin, the Gonghe-Guinan line exhibits a relatively shallow depth of approximately 15 km. Consequently, higher temperatures can be reached through shallower drilling in corresponding areas, making them potential target zones for future hot dry rock exploration. The magnetotelluric sounding study indicates that shallow low-resistivity anomalies in the Gonghe-Guide region converge at a depth of about 25 km, suggesting that Gonghe and Guide share the same primary heat source. In contrast, the low-resistivity anomalies in Guinan develop independently and are more extensive than those in the Gonghe-Guide region.
Author Contributions
Conceptualization, Y.M., Z.Z. and P.T.; software, P.T. and Z.C.; validation, Y.M., F.L., Q.L. and S.G.; data curation, Z.C., L.Z. and X.N.; writing—original draft preparation, Y.M. and P.T.; writing—review and editing, Y.M., Z.Z. and P.T.; visualization, F.L., X.N. and S.G.; supervision, P.T.; funding acquisition, L.Z. and F.L. All authors have read and agreed to the published version of the manuscript.
Funding
This research was funded by National Key Research and Development Program of China (Grant No. 2021YFB1507404), Project of China Geological Survey (Grant No. DD20230018, DD20240501206).
Data Availability Statement
The original contributions presented in this study are included in the article. Further inquiries can be directed to the corresponding author.
Conflicts of Interest
The authors declare no conflicts of interest.
References
- Ding, Z.L. Solid Earth Science Research Methods; Science Press: Beijing, China, 2013. [Google Scholar]
- Koltzer, N.; Bott, J.; Bär, K.; Magdalena, S. How Temperatures Derived from Fluid Flow and Heat Transport Models Impact Predictions of Deep Geothermal Potentials: The “Heat in Place” Method Applied to Hesse (Germany). Geotherm. Energy 2023, 11, 2. [Google Scholar] [CrossRef]
- Shahdi, A.; Lee, S.; Karpatne, A.; Bahareh, N. Exploratory Analysis of Machine Learning Methods in Predicting Subsurface Temperature and Geothermal Gradient of Northeastern United States. Geotherm. Energy 2021, 9, 18. [Google Scholar] [CrossRef]
- Maryadi, M.; Mizunaga, H. Estimation of Static Temperature Distribution by Means of Audio-Magnetotelluric Data. In Proceedings of the 43rd Workshop on Geothermal Reservoir Engineering, Stanford, CA, USA, 12–14 February 2018. [Google Scholar]
- Zhang, L.Y.; Li, X.F.; Zhu, G.L.; Zhang, S.S.; Zhang, C.; Wang, H.; Feng, Q.D.; Xu, W.H.; Niu, Z.X.; Deng, Z.H. Geothermal geological characteristics, genetic model and resource potential of Hot Dry Rocks in Gonghe Basin, Qinghai Province. Geol. China 2025, 52, 399–415. [Google Scholar]
- Wei, W.B.; Jin, S.; Ye, G.F. Methods to study electrical conductivity of continental lithosphere. Earth Sci. Front. 2003, 10, 15–22. [Google Scholar]
- Maryadi, M.; Bramanthyo, P.; Zarkasyi, A.; Mizunaga, H. Estimation of Near-Surface Temperature in Suwawa Geothermal Prospect, Gorontalo, Sulawesi, Indonesia, Based on Magnetotelluric and Artificial Neural Network. In IOP Conference Series: Earth and Environmental Science; IOP Publishing: Bristol, UK, 2021; Volume 851, pp. 12–18. [Google Scholar]
- Sven, F.; Niels, B. Improving the Temperature Predictions of Subsurface Thermal Models by Using High-Quality Input Data. Part 2: A Case Study from the Danish-German Border Region. Geothermics 2016, 64, 42–54. [Google Scholar]
- Zhang, C. Geothermal Characteristics and Genesis Mechanism of Hot Dry Rock Geothermal Resources of Gonghe Basin, Northeastern Tibetan Plateau. Ph.D. Thesis, University of Chinese Academy of Sciences, Beijing, China, 2019. [Google Scholar]
- Wang, Z.; Zeng, Z.; Liu, Z.; Zhao, X.; Li, J.; Bai, L.; Zhang, L. Heat Flow Distribution and Thermal Mechanism Analysis of the Gonghe Basin based on Gravity and Magnetic Methods. Acta Geol. Sin. 2021, 95, 1892–1901. [Google Scholar] [CrossRef]
- Ahmed, A.S.; Jardani, A.; Revil, A.; Dupont, J. HT2DINV: A 2D Forward and Inverse Code for Steady-State and Transient Hydraulic Tomography Problems. Comput. Geosci. 2015, 85, 36–44. [Google Scholar] [CrossRef]
- Zhang, E.Y.; Wen, D.G.; Wang, G.L.; Yan, W.D.; Wang, W.S.; Ye, C.M.; Li, X.-F.; Wang, H.; Tang, X.-C.; Luo, H.-B.; et al. The first power generation test of hot dry rock resources exploration and production demonstration project in the Gonghe Basin, Qinghai Province, China. Geol. China 2022, 5, 372–382. [Google Scholar] [CrossRef]
- Yang, H. Characteristics of Chinese Continental Curie Point Isotherm. Ph.D. Thesis, Chengdu University of Technology, Chengdu, China, 2015. [Google Scholar]
- Egbert, G.D.; Kelbert, A. Computational recipes for electromagnetic inverse problems. Geophys. J. Int. 2012, 189, 251–267. [Google Scholar] [CrossRef]
- Zhang, C.; Hu, S.B.; Song, R.C. Genesis of the hot dry rock geothermal resources in the Gonghe basin: Constraints from the radiogenic heat production rate of rocks. Chin. J. Geophys. 2020, 63, 2697–2709. [Google Scholar]
- Zhang, S.Q.; Yan, W.D.; Li, D.P.; Jia, X.F.; Zhang, S.S.; Li, S.T.; Fu, L.; Wu, L.; Zeng, Z.F.; Li, Z.W. Characteristics of geothermal geology of the Qiabuqia HDR in Gonghe Basin, Qinghai Province. Geol. China 2018, 45, 1087–1102. [Google Scholar]
- Wang, G.L.; Lin, W.J. The thermal status of China’s land areas and heat-control factors. Earth Sci. Front. 2024, 31, 001–018. [Google Scholar]
- Gao, J.; Zhang, H.J.; Zhang, S.Q.; Chen, X.B.; Cheng, Z.P.; Jia, X.F.; Li, S.T.; Fu, L.; Gao, L.; Xin, H.L. Three-dimensional magnetotelluric imaging of the geothermal system beneath the Gonghe Basin, Northeast Tibetan Plateau. Geothermics 2018, 76, 15–25. [Google Scholar] [CrossRef]
- Zhang, E.Y.; Wen, D.G.; Wang, G.L.; Jin, X.P.; Zhang, L.Y.; Wu, H.D.; Wang, W.-S.; Ye, C.-M.; Weng, W.; Li, K.; et al. Two stages power generation test of the hot dry rock exploration and production demonstration project in the Gonghe Basin, northeastern Qinghai-Xizang plateau, China. Geol. China 2024, 7, 409–421. [Google Scholar] [CrossRef]
- Tang, X.C.; Wang, G.L.; Ma, Y.; Zhang, D.L.; Liu, Z.; Zhao, X.; Cheng, T.J. Geological model of heat source and accumulation for geothermal anomalies in the Gonghe basin, northeastern Tibetan Plateau. Acta Geol. Sin. 2020, 94, 2052–2065. [Google Scholar]
- Grujic, D.; Casey, M.; Davidson, C.; Hollister, L.S.; Kündig, R.; Pavlis, T.; Schmid, S. Ductile extrusion of the higher Himalayan crystalline in Bhutan: Evidence from quartz microfabrics. Tectonophysics 1996, 260, 21–43. [Google Scholar] [CrossRef]
- Godin, L.; Law, R.D.; Searle, M.P.; Jessup, M.J. Channel Flow, Ductile Extrusion and Exhumation in Continental Collision Zones; The Geological Society: London, UK, 2006; pp. 355–378. [Google Scholar]
- Beaumont, C.; Jamieson, R.A.; Nguyen, M.H.; Lee, B. Himalayan tectonics explained by extrusion of a low–viscosity crustal channel coupled to focused surface denudation. Nature 2001, 414, 738–742. [Google Scholar] [CrossRef] [PubMed]
- Jamieson, R.A.; Unsworth, M.J.; Harris, N.B.W.; Rosenberg, C.; Schulmann, K. Crustal melting and the flow of mountains. Elements 2011, 7, 253–260. [Google Scholar] [CrossRef]
- Yang, Y.; Ritzwoller, M.H.; Zheng, Y.; Shen, W.; Levshin, A.L.; Xie, Z. A synoptic view of the distribution and connectivity of the midcrustal low velocity zone beneath Tibet. J. Geophys. Res. 2012, 117, 1–12. [Google Scholar]
- Wang, Q.; Hawkesworth, C.J.; Wyman, D.; Chung, S.L.; Wu, F.Y.; Li, X.H.; Li, Z.-X.; Gou, G.-N.; Zhang, X.-Z.; Tang, G.J.; et al. Pliocene-quaternary crustal melting in central and northern Tibet and insights into crustal flow. Nat. Commun. 2016, 7, 11888. [Google Scholar] [CrossRef]
- Tang, X.C.; Wang, G.L.; Zhang, D.L.; Ma, Y. Coupling Mechanism of Geothermal Accumulation and the Cenozoic Active Tectonics Evolution in Gonghe Basin, Northeastern Margin of the Tibetan Plateau. Acta Geosci. Sin. 2023, 44, 7–20. [Google Scholar]
Figure 1.
Location of the Gonghe Basin. The red dots represent MT points and the red lines represent faults.
Figure 1.
Location of the Gonghe Basin. The red dots represent MT points and the red lines represent faults.
Figure 2.
Magnetic anomalies.
Figure 2.
Magnetic anomalies.
Figure 3.
Reduced to the pole magnetic anomaly.
Figure 3.
Reduced to the pole magnetic anomaly.
Figure 4.
Depth contour map of the Curie isothermal surface.
Figure 4.
Depth contour map of the Curie isothermal surface.
Figure 5.
3D resistivity structure model of Gonghe Basin.
Figure 5.
3D resistivity structure model of Gonghe Basin.
Figure 6.
Resistivity planes at depths of 1 km, 5 km, 10 km, 15 km, 20 km, and 25 km in the Gonghe Basin.
Figure 6.
Resistivity planes at depths of 1 km, 5 km, 10 km, 15 km, 20 km, and 25 km in the Gonghe Basin.
Figure 7.
Resistivity profile of the east–west survey line across the Dalianhai.
Figure 7.
Resistivity profile of the east–west survey line across the Dalianhai.
Figure 8.
Resistivity profile of the north-south survey line across the Dalianhai.
Figure 8.
Resistivity profile of the north-south survey line across the Dalianhai.
Figure 9.
Flow chart of inversion calculation of parameters of thermal conduction equation.
Figure 9.
Flow chart of inversion calculation of parameters of thermal conduction equation.
Figure 10.
Characteristics of spatial distribution of sedimentary layers in the Gonghe Basin.
Figure 10.
Characteristics of spatial distribution of sedimentary layers in the Gonghe Basin.
Figure 11.
East–west temperature-depth profiles across the Dalianhai.
Figure 11.
East–west temperature-depth profiles across the Dalianhai.
Figure 12.
North–south Temperature-depth profiles across the Dalianhai.
Figure 12.
North–south Temperature-depth profiles across the Dalianhai.
Figure 13.
Temperature planes at 1 km, 3 km, 4 km, 6 km, 10 km, and 15 km depths in the Gonghe Basin.
Figure 13.
Temperature planes at 1 km, 3 km, 4 km, 6 km, 10 km, and 15 km depths in the Gonghe Basin.
Figure 14.
Three-dimensional temperature distribution in the Gonghe Basin.
Figure 14.
Three-dimensional temperature distribution in the Gonghe Basin.
Figure 15.
3D temperature model overlaid with 9.2 Ωm low-resistance anomaly.
Figure 15.
3D temperature model overlaid with 9.2 Ωm low-resistance anomaly.
Figure 16.
Depth slice at 180 °C of the Gonghe Basin.
Figure 16.
Depth slice at 180 °C of the Gonghe Basin.
Figure 17.
Comparison of drilling with resistivity and Curie isothermal surface. (a) The continuous well comparison profile; (b) Resistivity measurements along this profile; (c) Curie isothermal surface along this profile.
Figure 17.
Comparison of drilling with resistivity and Curie isothermal surface. (a) The continuous well comparison profile; (b) Resistivity measurements along this profile; (c) Curie isothermal surface along this profile.
Table 1.
Statistics table of error between inverted temperature and measured temperature from geothermal wells.
Table 1.
Statistics table of error between inverted temperature and measured temperature from geothermal wells.
| Serial Number | Drilled Hole | Wellbore Temperature/°C | Inversion Temperature/°C | Error | Error Rate |
|---|
| 1 | Gongcan 1 well | 167 | 156 | 11 | 0.065868 |
| 2 | R3 | 103 | 115 | 12 | 0.116505 |
| 3 | DR2 | 98 | 99 | 1 | 0.010204 |
| 4 | DR1 | 87 | 69 | 18 | 0.206897 |
| 5 | ZR1 | 205 | 192 | 13 | 0.063415 |
| 6 | R2 | 97 | 99 | 2 | 0.020619 |
| 7 | DR5 | 86 | 78 | 8 | 0.093023 |
| 8 | DR3 | 181 | 171 | 10 | 0.055249 |
| 9 | GR1 | 236 | 218 | 18 | 0.076271 |
| 10 | GR2 | 186 | 190 | 4 | 0.021505 |
| Disclaimer/Publisher’s Note: The statements, opinions and data contained in all publications are solely those of the individual author(s) and contributor(s) and not of MDPI and/or the editor(s). MDPI and/or the editor(s) disclaim responsibility for any injury to people or property resulting from any ideas, methods, instructions or products referred to in the content. |
© 2025 by the authors. Licensee MDPI, Basel, Switzerland. This article is an open access article distributed under the terms and conditions of the Creative Commons Attribution (CC BY) license (https://creativecommons.org/licenses/by/4.0/).
